
Submitted:
20 February 2024
Posted:
20 February 2024
You are already at the latest version
Abstract
Deep learning (DL) algorithms used for DOTATATE PET lesion detection typically require large, well-annotated training datasets. These are difficult to obtain due to low incidence of gastroenteopancreatic neuroendocrine tumors (GEP-NETs), and the high cost of manual annotation. Furthermore, networks trained and tested with data acquired from site specific PET/CT instrumentation, acquisition and processing protocols have reduced performance when tested with offsite data. This lack of generalizability requires even larger, more diverse training datasets. The objective of this study is to investigate the feasibility of improving DL algorithm performance by better matching the background noise in training datasets to higher noise, out-of-domain testing datasets. 68Ga-DOTATATE PET/CT datasets were obtained from two scanners: Scanner1, a state-of-the-art digital PET/CT (GE DMI PET/CT; n=83 subjects), and Scanner2, an older-generation analog PET/CT (GE STE; n=123 subjects). Set1, the data set from Scanner1 was reconstructed with standard clinical parameters (5 minutes; Q.Clear) and list-mode reconstructions (VPFXS 2, 3, 4, and 5-minutes). Set2, data from Scanner2, representing out-of-domain clinical scans, used standard iterative reconstruction (5 minutes; OSEM). Reconstructed datasets were divided into training, validation, and testing datasets in a 60%, 20%, 20% proportion, and a deep neural network was trained with each: Network1 for Scanner1 and Network2 for Scanner2. DL performance (Network1) was tested with out-of-domain test data (Set2). To evaluate the effect of training sample size, we tested DL model performance using a fraction (25%, 50%, and 75%) of Set1 for training. Scanner1, list-mode 2-minute reconstructed data demonstrated the most similar noise level compared that of Set2, resulting in the best performance (F1=0.713). This was not significantly different compared to the highest performance, upper-bound limit using in-domain training for Network2 (F1=0.755; p-value=0.103). Regarding sample size, the F1 score significantly increased from 25% training data (F1=0.478) to 100% training data (F1=0.713; p<0.001). List-mode data from modern PET scanners can be reconstructed to better match the noise properties of older scanners. Using existing data and their associated annotations dramatically reduces the cost and effort in generating these datasets, and significantly improves the performance of existing DL algorithms. List-mode reconstructions can provide an efficient, low-cost method to improve DL algorithm generalizability.
Keywords:
Deep learning
; Convolutional neural network
; Gastroenteropancreatic neuroendocrine tumor
; GEP-NET
; DOTATATE
; Positron emission tomography
; PET
; Liver tumor.
1. Introduction
Gastroenteropancreatic neuroendocrine tumors (GEP-NETs) are most accurately imaged with 68Ga- and 64Cu-DOTATATE positron emission tomography / computed tomography (DOTATATE PET/CT), which are standard-of-care imaging modalities for tumor detection and staging [1,2,3]. Many computerized methods have been applied to automatic lesion detection and/or quantification in PET images [4], leading to improved objectivity and efficiency compared with manual tumor identification.
In recent years, the use of Deep Learning (DL) methods to identify and quantify lesions in PET/CT images has become a growing area of research. Deep neural networks have recently shown excellent performance [4,5] in quantifying uptake from a variety of radiopharmaceuticals including 18F-FDG [6,7,8], 18F-PSMA [9,10], 68Ga-PSMA [11], and 68Ga- and 64Cu-DOTATATE [12]. Previous studies have shown impressive results when the training data and the test data are from the same domain, which means they have the same or similar data distribution. However, training the networks usually requires a large amount of well-annotated data. In real-world clinical practice, it is difficult to collect and annotate enough data for model training because GEP-NETs are rare tumors, and lesion annotation in PET images is costly and challenging. When training a model based on a well-annotated dataset from a different site/scanner, the model usually typically shows degradation in performance when tested on a different unseen target dataset. This is because datasets from different sites/scanners usually exhibit different data distributions, i.e., domain shift. This domain shift is derived from several image parameters, such as differences in spatial resolution, image noise, and image processing [13]. In PET images, it has been shown that background activity and noise have a significant impact on the detectability of lesions [14]. Collecting and annotating another large dataset with similar properties to the out-of-domain target dataset is extremely time and resource consuming, making this effectively infeasible.
List-mode reconstructions allow existing data and their associated annotations to be retrospectively reconstructed with numerous variations to better match differences in other unseen datasets properties. Changing the reconstruction parameters can simulate different out-of-domain properties [15,16,17]. Thus, using existing datasets and their associated annotations with list-mode reconstructions may dramatically reduce the cost and effort to generate these better matching datasets. The purpose of this study is to investigate the feasibility of using list-mode reconstructions to better match image noise between training and out-of-domain testing datasets to improve the performance of lesion detection using deep neural networks in DOTATATE PET. In this study, we generated a set of list-mode reconstructed datasets with different acquisition times based on the same dataset, such that only the noise level is different between these reconstructed datasets. In addition, we also investigated the effect of training sample size on the cross-domain performance of deep neural networks. Based on the findings in this manuscript, reconstructing the existing PET data helps to significantly improve the performance of DL algorithms, in a low-cost and efficient manner. In this article, we introduce materials and methods in Section 2. The results are in Section 3, followed by our discussion in Section 4, and our conclusion in Section 5.
2. Materials and Methods
Image Acquisition and Datasets
This study was approved and performed under a waiver of informed consent from the Institutional Review Board at the University of Colorado Anschutz Medical Campus. All consecutive DOTATATE studies from our institution were de-identified using a three-digit numerical ID. The standard clinical acquisition and processing protocols were used as previously described [12]. Briefly, subjects with normal liver uptake, and those with 10 or fewer non-confluent hepatic lesions were included. Two separate 68Ga-DOTATATE PET image datasets from two different PET/CT scanners were included. The first dataset (Set1) was comprised of 83 subjects, of which 42 were normal, and 41 were abnormal scans with 134 hepatic lesions acquired from Scanner1: a modern digital PET/CT scanner (GE Discovery MI PET/CT, GE HealthCare, Waukesha, WI). This scanner has time-of-flight (TOF) temporal resolution of approximately 380 ps. The second dataset (Set2) was comprised of 123 68Ga-DOTATATE PET/CTs with 233 hepatic lesions acquired from Scanner2: an older generation, photomultiplier tube-based PET/CT scanner (GE Discovery STE, GE HealthCare, Waukesha, WI) [12]. Set2 included 56 abnormal cases and 67 normal subjects. Following previous reports [12,18], we randomly split each dataset into 60%, 20% and 20% for training, validation, and testing, respectively.
For Set1, images were reconstructed with the full 5 minutes of data using block sequential regularized expectation-maximization penalized-likelihood TOF reconstruction (BSREM, aka Q.Clear, GE HealthCare, Waukesha, WI) with a Beta value of 400, a 256 × 256 matrix, and a 70 cm reconstructed diameter resulting in voxels with dimensions of 2.73 mm × 2.73 mm × 2.79 mm. CT based attenuation correction was applied along with time-of-flight correction, point spread function recovery, and scatter and decay corrections. Following the clinical reconstruction, list-mode data were utilized to generate additional TOF reconstructions with data-acquisition times of 2, 3, 4 and 5 minutes using conventional iterative reconstruction (TOFOSEM-PSF, aka VPFXS, GE HealthCare, Waukesha, WI) with 3 iterations/16 subsets, a 192 × 192 matrix, and 70 cm reconstructed diameter resulting in voxels of 3.64 mm × 3.64 mm × 2.79 mm. Again, CT based attenuation correction was applied along with point spread function recovery, and scatter and decay corrections. Additionally, these reconstructions were smoothed with a 5 mm Gaussian post-reconstruction filter. From Set1, we have 5 different sets of reconstructions: VPFXS 2 min, VPFXS 3 min, VPFXS 4 min, VPFXS 5 min, and Q.Clear.
For Set2, PET images from clinical 68Ga DOTATATE PET/CT were also acquired with 5 minutes of acquisition time per bed position. These images were reconstructed using the full 5 minutes of data using ordered subset expectation maximization reconstruction (OSEM) with 3 iterations/16 subsets, a 128 × 128 matrix, and 60 cm reconstructed diameter resulting in voxels of 4.69 mm × 4.69 × 3.27 mm. Again, CT-based attenuation correction was applied along with scatter and decay corrections followed by a 5 mm Gaussian post-reconstruction filter. Point spread function recovery was not used as it was not available on this older scanner model.
Image Segmentation and Lesion Contours
Lesion segmentation was performed on all clinical reconstructions using a semiautomated MIM workflow (MIM version 7.03) as previously described [12]. This tool utilizes a modified PERCIST threshold based on regions of interest (ROI) placed in normal liver background which provides SUVmeanand standard deviation of 68Ga DOTATATE activity. Lesions were identified using this threshold, defined as 1.5 times SUVmeanplus 2 standard deviations of normal liver background. Once lesions were detected and visually confirmed, contours were refined using a commercially available gradient edge detection tool (PET Edge plus; MIM software 7.0.3). For the training and validation sets of reconstructions, contours generated using the high quality Q.Clear reconstruction were transferred to each of the VPFXS reconstructions.
Quantification of Image Noise
To quantify the difference in image noise, SUV measurements from the background ROIs from each reconstruction were used. The same number of subject samples (n=25) was used to calculate the background noise characteristics from reconstructions of Set1 and Set2. The SUVmeanand standard deviation in normal liver background were recorded for each reconstruction and the coefficient of variation (COV) was calculated as the standard deviation of the ROI divided by SUVmean. The average and standard deviation of the COV across all subjects within each reconstruction type was also calculated. To determine if differences in COV between reconstructions were statistically significant, a series of paired t-tests was performed, comparing COV for each subject’s reconstructions between each combination of two reconstruction approaches.
Network Architecture
The lesion detection network in this study was built on a modified U-Net architecture [12], which has shown impressive performance for lesion identification in PET images (Supplementary Figure S1). It consists of four residual learning blocks [19] in the downsampling path and the upsampling path, respectively. It also has two transposed convolutional layers [20] in the upsampling path for contextual information aggregation [21]. We optimized this network using a linear combination of a binary cross-entropy loss and a Dice loss [22], which helped handle the imbalance of the input data in our problem.
Statistical Analysis
To investigate the effect of training set noise, we used each of the list-mode sets of reconstructions for Set1 to train lesion-detection models using 5 separate runs with different random seeds. Then we evaluated their performance on the testing set of Network2. For the effect of training sample size, we trained lesion detection models based on 25%, 50%, 75%, and 100% of each acquisition in Set1. For the 5 runs on each training dataset, we used the same Set1 validation set and Set2 test set for validation and out-of-domain evaluation, respectively. In the testing stage, we directly applied each Network1-trained model on the Set2 testing set to produce a prediction map for each input image, and used a threshold (i.e., 0) to binarize the map to identify lesions. Then we applied a noise filter of 20 pixels and excluded predictions below that threshold. We used positive predictive value, sensitivity and F1 score as model evaluation metrics [12,18]. With a connected component analysis, we used the Hungarian algorithm [23] to match gold-standard annotations with automated predictions to handle potentially multiple lesions per subject. A detected lesion was considered true positive (TP) if the intersection over union (IoU) between this lesion and a gold-standard lesion annotation was greater than zero [12,18]; otherwise, the detected lesion was viewed as false positive (FP). Any gold-standard lesion with no matched detection is defined as false negative (FN). With these definitions, we calculated positive predictive value PPV = TP/(TP +FP), sensitivity = TP/(TP +FN), and F1 score F1 = (2 × PPV × sensitivity)/(PPV + sensitivity), for the test set.
3. Results
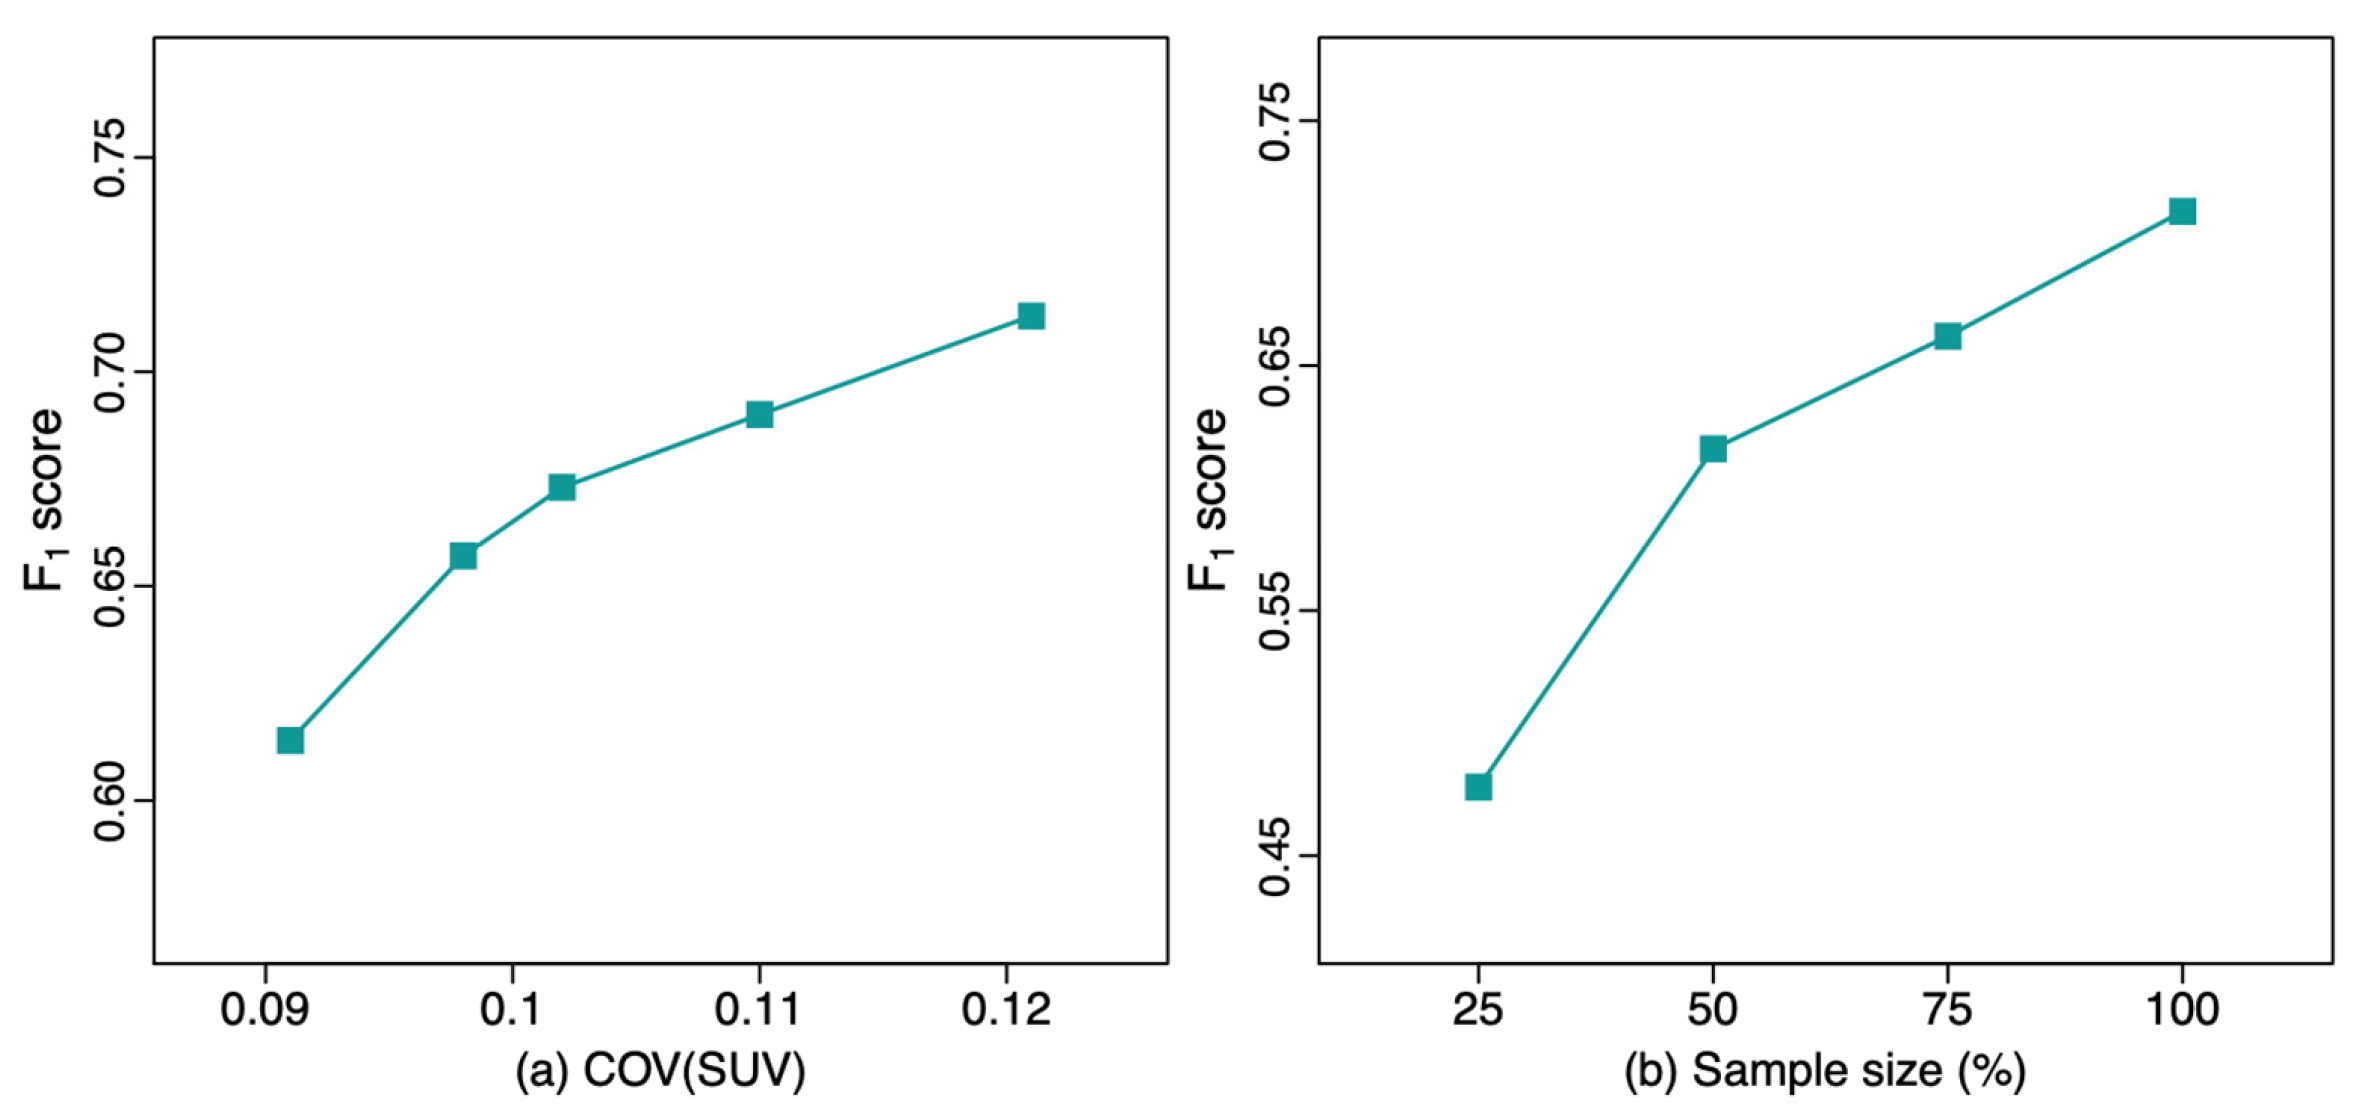
The patient demographics for Set1 are shown in Table 1, and those for the Set2 have been previously reported [12]. When evaluating Network1-trained DL models with the Set2 testing dataset (Table 2 and Figure 2), the F1 score progressively improved with decreasing acquisition time, i.e., higher noise level images showed improved performance, with F1 score increasing from 0.657 at 5-min acquisition to 0.713 at 2-min acquisition. This demonstrates an improved F1 score approaching the upper-bound limit model (F1 = 0.755) of performance. This upper bound limit, indicating best possible performance, uses training data from Set2 and tests the model with the in-domain Set2 testing dataset. Similarly, PPV increased with decreasing acquisition time, while sensitivity only slightly decreased. The F1 score of the DL model trained with the original clinical reconstruction from Set1 (Q.Clear; F1 = 0.614) was significantly worse compared to the model trained with Set1’s 2-min reconstructed dataset (VPFXS 2 min; F1 = 0.713; p-value = 0.006). In addition, as the F1 score of the noisier images was better on the out-of-domain test data, the highest noise 2-min VPFXS images showed performance comparable to and not significantly different than the upper-bound model, with (F1 = 0.713 vs 0.755; p-value = 0.103). Similarly, there was no significant difference between the upper-bound model and model trained with the VPFXS 3 min (p-value = 0.087); whereas the F1 score of VPFXS 4 min model, that of VPFXS 5 min model, and that of Q.Clear model were all significantly smaller than that of upper-bound model (p-value = 0.013, 0.026, 0.006, respectively).
The results of the DL models with different training sample sizes are shown in Table 3. The F1 score progressively increased from 0.478 (25% training set) to 0.713 (100% training set). The F1 score of the model trained with 100% VPFXS 2-min dataset was significantly higher than that trained with 25% VPFXS 2-min dataset (p-value ≤ 0.001). Additionally, the F1 score increased as the sample size increased, with p-value=0.012 between 25% and 50%, p-value = 0.046 between 50% and 75%, and p-value = 0.049 between 75% and 100%.
Several examples are shown in Figure 1. In the qualitative prediction results of the VPFXS 2-min model (Figure 1), the “True Positive” columns from Subjects A & B are examples of which the prediction (Row 2) agree with the corresponding gold standard (Row 3). Similarly, the “False Negative” and “False Positive” examples in Subjects B & C are also presented.
Figure 1.
Examples of DL lesion detection in transaxial 68Ga DOTATATE PET. Lesion predictions and gold-standard annotations are marked in red. (Top row) Original images, (middle row) DL prediction, and (bottom row) Gold standard. (A-C) Three different patient examples: (A) true positive and false negative, (B) true positive and false positive, and (C) false positive.
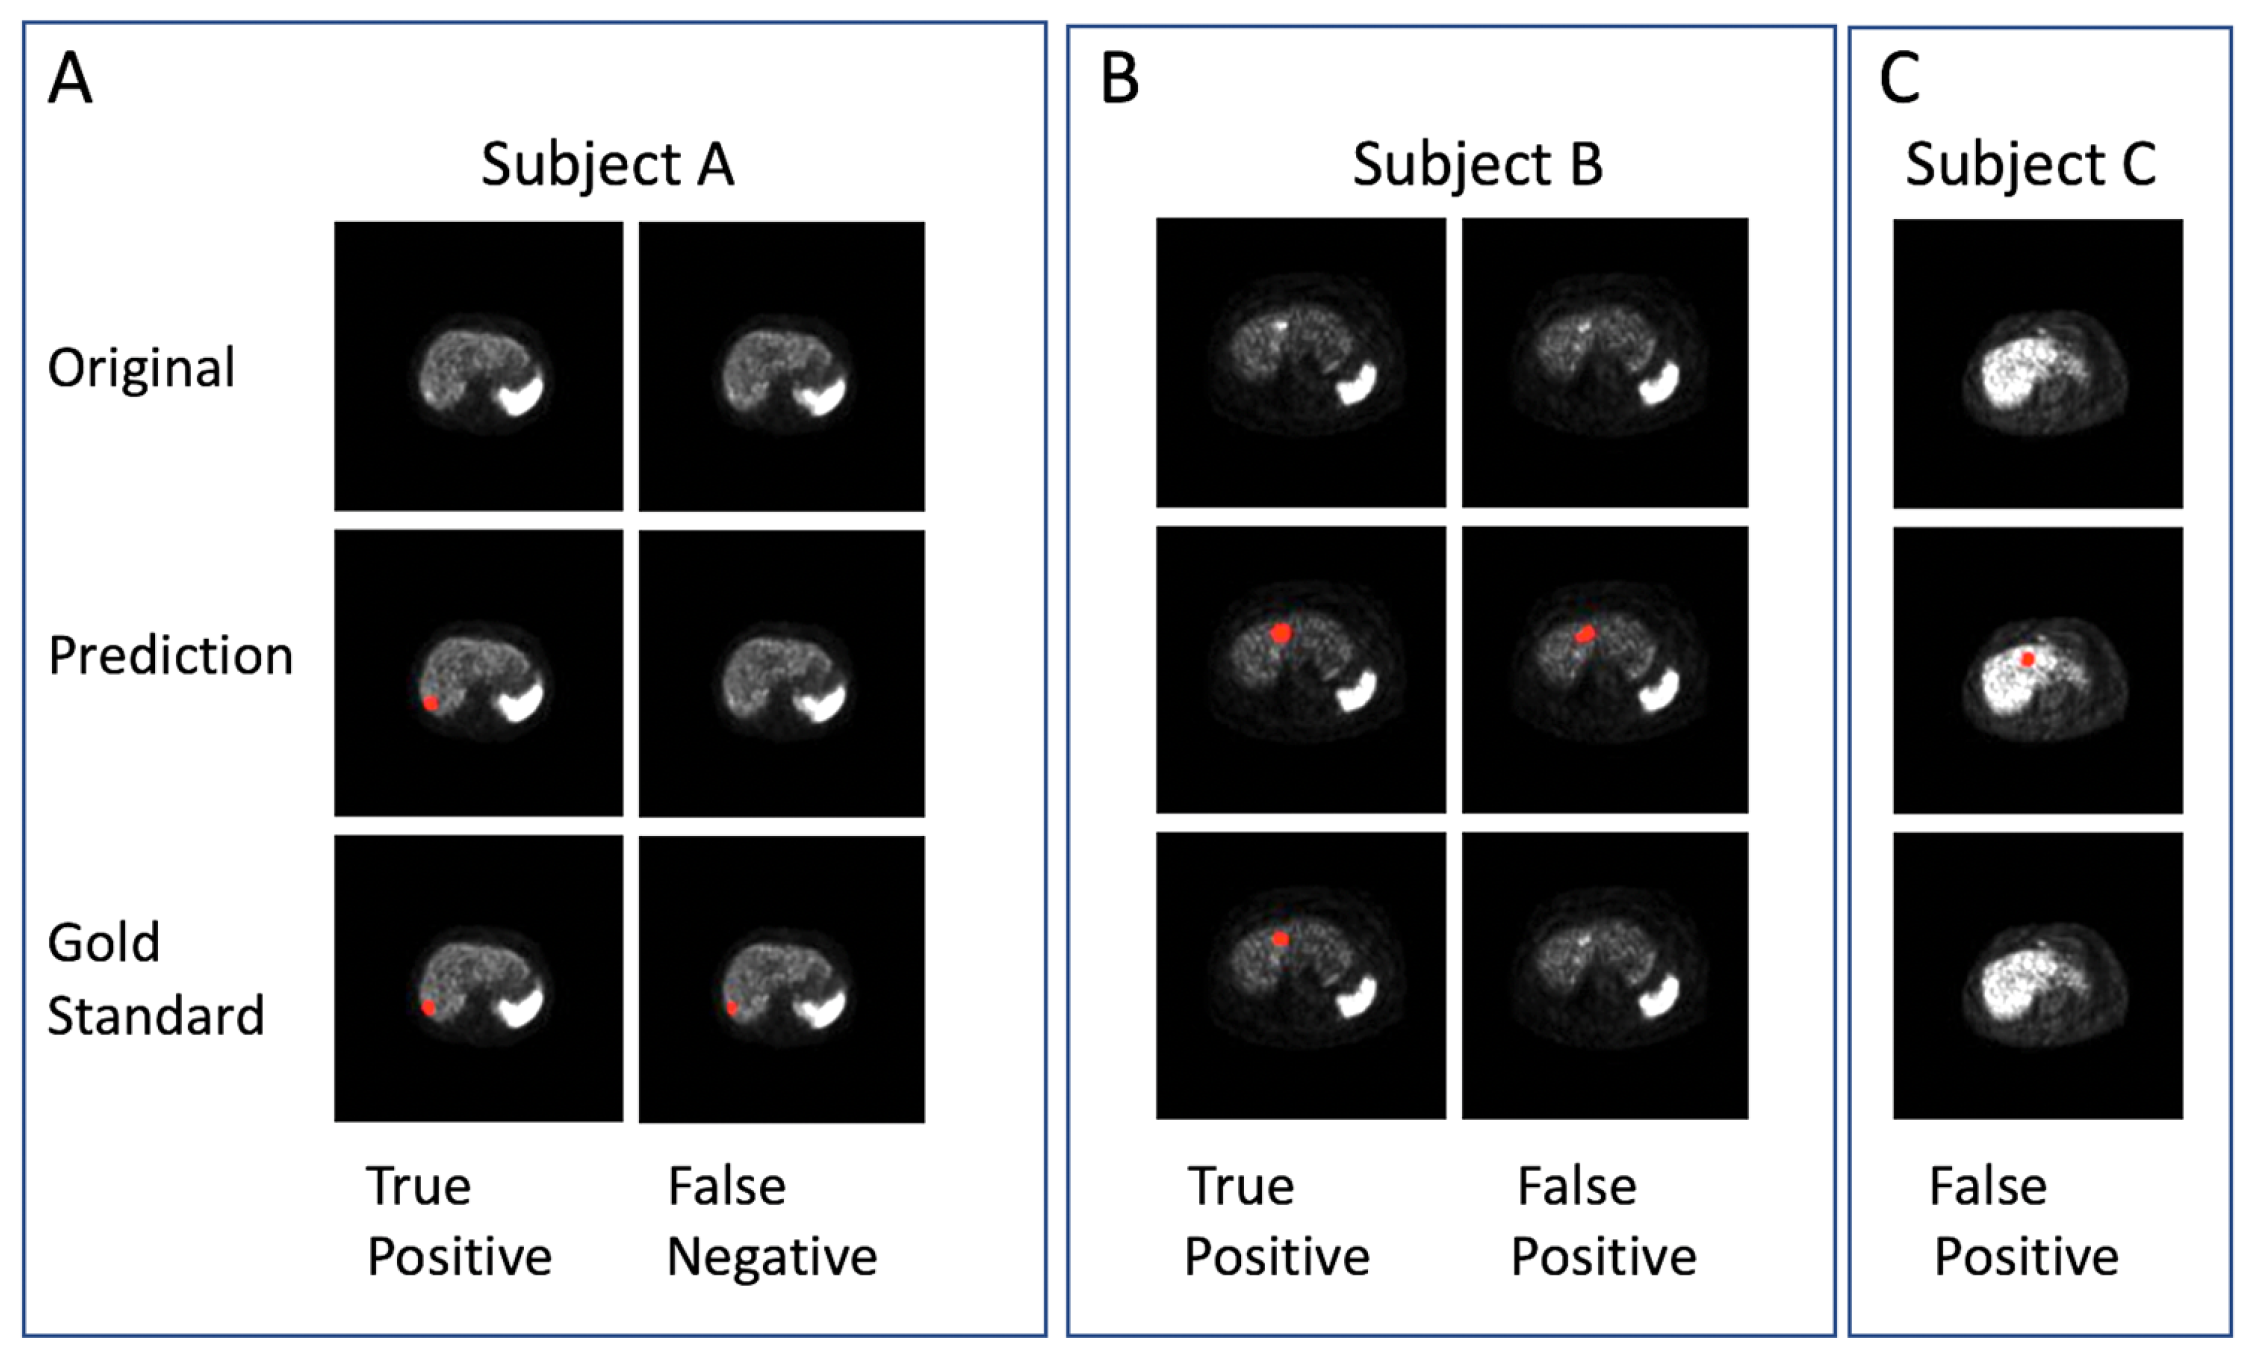
Figure 2.
The F1 score of the lesion detection model with different values of (left) COV(SUV), and (right) sample size.
Figure 2.
The F1 score of the lesion detection model with different values of (left) COV(SUV), and (right) sample size.
4. Discussion
This study demonstrates the feasibility of addressing domain shift by better noise matching. In this study, the out-of-domain PET images from the Set2 are much noisier compared to those from the original Set1. The level of domain shift between the original clinical Set1 Q.Clear dataset (F1 = 0.614) and Set2 (F1 = 0.755) was significant (p-value=0.006). With list-mode reconstruction, we generated PET images with higher levels of noise by choosing shorter acquisition times. List-mode reconstructions of Set1 with different shorter acquisition times demonstrated significantly improved F1 score on unseen reconstructions from Set2 from 5 minutes (0.614) to 2 minutes (0.713). Finally, the performance of this 2-minute acquisition (F1 = 0.713) improved to a level that was not significantly different compared to the performance of the upper-bound limit (Set2, F1 = 0.755; p-value = 0.103). This demonstrates the potential of eliminating the domain shift by better matching noise properties.
This deep lesion detection network for 68Ga-DOTATATE PET dataset requires a relatively large dataset to achieve better performance. In the experiments of training networks with different percentages of the full training set, there is consecutively significant increase in F1 score as the training sample size increases, with F1 from 0.478 to 0.616 (p-value= 0.012) between 25% and 50%, F1 from 0.616 to 0.662 (p-value = 0.046) between 50% and 75%, and F1 from 0.662 to 0.713 (p-value = 0.049) between 75% and 100%. The improvement with larger dataset sizes emphasizes the potential for larger training datasets to improve DL algorithm performance. Although an even larger dataset could further improve the performance in our study, we attained a high level not significantly different compared to the upper bound limit.
Another minor difference between standard clinical reconstructions and our list-mode reconstructions was in the choice of reconstruction algorithm. A noisier reconstruction (VPFXS) was chosen compared to the more contemporary and lower noise reconstruction (Q.Clear) used in clinical scanning protocols. This demonstrates the ability to further alter the noise properties by using specific reconstruction techniques. This feasibility study did not optimize other reconstruction parameters (post-reconstruction filtering, depth dependent resolution recovery, time-of-flight, or other factors.) which could be tested to further improve the matching of properties in the different datasets.
To our knowledge, this is the first report of using list-mode reconstructions to better match training datasets to out of domain target datasets, which subsequently demonstrate improved DL performance. Although this report is novel with respect to the use of list-mode data to improve PET lesion detection, other reports have shown that image pre-processing can significantly improve convolutional neural network performance in FDG PET lesion segmentation [29], and MRI lesion characterization [30].
The ability to retrospectively reconstruct PET list-mode data with different imaging characteristics may allow a much broader diversification of PET imaging properties in the training data. Specific imaging properties could be applied to reconstruct PET images with varying levels of image noise, image spatial resolution, and specific corrections such as scatter correction, time-of-flight (TOF) corrections, depth dependent resolution recovery corrections, and post- reconstruction filtering. Matching these properties to a target dataset may potentially further improve PET lesion detection performance.
This work complements our prior work which demonstrated significantly improved PET lesion detection performance with advanced DL techniques including domain adaptation, single domain generalization, and 3-dimensional lesion detection [31,32,33]. These techniques were also combined with previously established techniques such as region-guided generative adversarial network (RG-GAN) for lesion-preserved image-to-image translation, and data augmentation [31]. Taken together, both our data preprocessing techniques and our advanced DL techniques show great potential for improvements in DL performance when testing datasets from outside institutions with differing PET instrumentation, acquisition and processing protocols.
5. Conclusions
List-mode data from modern PET scanners can be reconstructed to better match the higher noise properties of reconstructions from an older-generation PET scanner. Reuse of the existing data and their associated annotations can dramatically reduce the cost and effort to generate these better matching datasets. These reconstructed datasets can significantly improve the performance of existing DL algorithms, and thus, provide an efficient, low-cost method to rapidly improve DL algorithm generalizability.
Supplementary Materials
The following supporting information can be downloaded at the website of this paper posted on Preprints.org. Figure S1: Model Training for Lesion Detection - Network architecture
Author Contributions
All authors contributed to the study conception and methodology. Contributions also included: XY, FX, JW software, validation, and formal analysis; all authors for investigation; BBC, DG, and FY for resources; XY, MS, JW, BBC, DL, MN data curation; XY, BBC, FX, MS writing—original draft preparation; all authors writing—review and editing; all authors visualization; BBC, FX, SDM, DG supervision, BBC and FX project administration; BBC and FX funding acquisition. All authors have read and agreed to the published version of the manuscript. **XY and MS contributed equally as first authors. *FX and BBC contributed equally. Material preparation, data collection and analysis were performed by XY, MS, JW, FX, MN, and BBC.
Funding
This research was funded by the University of Colorado Department of Radiology (BBC), University of Colorado SPARK grant (BBC), NIH 1 R21 CA274487-01A1 (BBC and FX).
Institutional Review Board Statement
The study was performed in accordance with the ethical standards as laid down in the 1964 Declaration of Helsinki and its later amendments or comparable ethical standards. The Colorado Multiple Institutional Review Board (COMIRB) approved use of deidentified data in this study (COMIRB Protocol #19-0906).
Informed Consent Statement
Not applicable.
Data Availability Statement
The datasets presented in this article are not readily available because they are under the auspices of the institutional data privacy statement. Requests to access the datasets should be directed to the corresponding author.
Acknowledgments
None outside those listed above.
Conflicts of Interest
The authors declare no conflicts of interest. The funders had no role in the design of the study; in the collection, analyses, or interpretation of data; in the writing of the manuscript; or in the decision to publish the results.
References
- Sanli, Y., Garg, I., Kandathil, A., Kendi, T., Zanetti, M.J.B., Kuyumcu, S., Subramaniam, R.M.: Neuroendocrine tumor diagnosis and management: 68Ga-DOTATATE PET/CT. American Journal of Roentgenology 211(2), 267–277 (2018). [CrossRef]
- Kayani, I., Conry, B.G., Groves, A.M., Win, T., Dickson, J., Caplin, M., Bomanji, J.B.: A comparison of 68Ga-DOTATATE and 18F-FDG PET/CT in pulmonary neuroendocrine tumors. Journal of Nuclear Medicine 50(12), 1927–1932 (2009).
- Sadowski, S.M., Neychev, V., Millo, C., Shih, J., Nilubol, N., Herscovitch, P., Pacak, K., Marx, S.J., Kebebew, E.: Prospective study of 68Ga-DOTATATE positron emission tomography/computed tomography for detecting gastro-entero-pancreatic neuroendocrine tumors and unknown primary sites. Journal of Clinical Oncology 34(6), 588 (2016). [CrossRef]
- Hatt, M., Lee, J.A., Schmidtlein, C.R., Naqa, I.E., Caldwell, C., De Bernardi, E., Lu, W., Das, S., Geets, X., Gregoire, V., et al.: Classification and evaluation strategies of auto-segmentation approaches for PET: Report of AAPM task group no. 211. Medical physics 44(6), 1–42 (2017).
- Hatt, M., Laurent, B., Ouahabi, A., Fayad, H., Tan, S., Li, L., Lu, W., Jaouen, V., Tauber, C., Czakon, J., et al.: The first MICCAI challenge on pet tumor segmentation. Medical image analysis 44, 177–195 (2018).
- Sibille, L., Seifert, R., Avramovic, N., Vehren, T., Spottiswoode, B., Zuehlsdorff, S., Sch¨afers, M.: 18F-FDG PET/CT uptake classification in lymphoma and lung cancer by using deep convolutional neural networks. Radiology 294(2), 445–452 (2020).
- Weisman, A.J., Kim, J., Lee, I., McCarten, K.M., Kessel, S., Schwartz, C.L., Kelly, K.M., Jeraj, R., Cho, S.Y., Bradshaw, T.J.: Automated quantification of baseline imaging pet metrics on FDG PET/CT images of pediatric Hodgkin lymphoma patients. EJNMMI physics 7, 1–12 (2020). [CrossRef]
- Leung, K.H., Rowe, S.P., Leal, J.P., Ashrafinia, S., Sadaghiani, M.S., Chung, H.W., Dalaie, P., Tulbah, R., Yin, Y., VanDenBerg, R., et al.: Deep learning and radiomics framework for psma-rads classification of prostate cancer on PSMA PET. EJNMMI research 12(1), 1–15 (2022).
- Nickols, N., Anand, A., Johnsson, K., Brynolfsson, J., Borreli, P., Parikh, N., Juarez, J., Jafari, L., Eiber, M., Rettig, M.: apromise: a novel automated promise platform to standardize evaluation of tumor burden in 18F-DCFPyL images of veterans with prostate cancer. Journal of Nuclear Medicine 63(2), 233–239 (2022).
- Johnsson, K., Brynolfsson, J., Sahlstedt, H., Nickols, N.G., Rettig, M., Probst, S., Morris, M.J., Bjartell, A., Eiber, M., Anand, A.: Analytical performance of aPROMISE: automated anatomic contextualization, detection, and quantification of [18f] DCFPyL(PSMA) imaging for standardized reporting. European Journal of Nuclear Medicine and Molecular Imaging 49(3), 1041–1051 (2022). [CrossRef]
- Zhao, Y., Gafita, A., Vollnberg, B., Tetteh, G., Haupt, F., Afshar-Oromieh, A., Menze, B., Eiber, M., Rominger, A., Shi, K.: Deep neural network for automatic characterization of lesions on 68 Ga-PSMA-11 PET/CT. European Journal of Nuclear Medicine and Molecular Imaging 47, 603–613 (2020). [CrossRef]
- Wehrend, J., Silosky, M., Xing, F., Chin, B.B.: Automated liver lesion detection in 68Ga DOTATATE PET/CT using a deep fully convolutional neural network. EJNMMI research 11(1), 1–11 (2021).
- Saha, G.B., Saha, G.B.: Performance characteristics of pet scanners. Basics of PET imaging: physics, chemistry, and regulations, 97–116 (2010).
- Silosky, M., Xing, F., Wehrend, J., Litwiller, D.V., Metzler, S.D., Chin, B.B.: Modeling contrast-to-noise ratio from list-mode reconstructions of 68Ga DOTATATE PET/CT: Predicting detectability of hepatic metastases in shorter acquisition PET reconstructions. American Journal of Nuclear Medicine and Molecular Imaging 13(1), 33 (2023).
- Zhang, Z., Rose, S., Ye, J., Perkins, A.E., Chen, B., Kao, C.-M., Sidky, E.Y., Tung, C.-H., Pan, X.: Optimization-based image reconstruction from low-count, list-mode TOF-PET data. IEEE Transactions on Biomedical Engineering 65(4), 936–946 (2018).
- Wielaard, J., Habraken, J., Brinks, P., Lavalaye, J., Boellaard, R.: Optimization of injected 68 Ga-PSMA activity based on list-mode phantom data and clinical validation. EJNMMI physics 7, 1–12 (2020).
- Leung, K.H., Marashdeh, W., Wray, R., Ashrafinia, S., Pomper, M.G., Rahmim, A., Jha, A.K.: A physics-guided modular deep-learning based automated framework for tumor segmentation in PET. Physics in Medicine & Biology 65(24), 245032 (2020).
- Zhao, Y., Gafita, A., Vollnberg, B., Tetteh, G., Haupt, F., Afshar-Oromieh, A., Menze, B., Eiber, M., Rominger, A., Shi, K.: Deep neural network for automatic characterization of lesions on 68 Ga-PSMA-11 PET/CT. European Journal of Nuclear Medicine and Molecular Imaging 47, 603–613 (2020).
- He, K., Zhang, X., Ren, S., Sun, J.: Deep residual learning for image recognition. In: Proceedings of the IEEE Conference on Computer Vision and Pattern Recognition, pp. 770–778 (2016).
- Dumoulin, V., Visin, F.: A guide to convolution arithmetic for deep learning. arXiv preprint arXiv:1603.07285 (2016).
- Chen, H., Qi, X., Yu, L., Heng, P.-A.: Dcan: deep contour-aware networks for accurate gland segmentation. In: Proceedings of the IEEE Conference on Computer Vision and Pattern Recognition, pp. 2487–2496 (2016).
- Taghanaki, S.A., Zheng, Y., Zhou, S.K., Georgescu, B., Sharma, P., Xu, D., Comaniciu, D., Hamarneh, G.: Combo loss: Handling input and output imbalance in multi-organ segmentation. Computerized Medical Imaging and Graphics 75, 24–33 (2019).
- Kuhn, H.W.: The hungarian method for the assignment problem. Naval research logistics quarterly 2(1-2), 83–97 (1955).
- J. Wehrend et al., “Automated liver lesion detection in 68ga dotatate pet/ct using a deep fully convolutional neural network,” EJNMMI Research, vol. 11, no. 1, pp. 1–11, 2021.
- K. He et al., “Deep residual learning for image recognition,” in Proceedings of the IEEE Conference on Computer Vision and Pattern Recognition, 2016, pp. 770–778.
- V. Dumoulin and F. Visin, “A guide to convolution arithmetic for deep learning,” arXiv:1603.07285 [stat.ML], pp. 1–31, 2016.
- H. Chen et al., “Dcan: Deep contour-aware networks for accurate gland segmentation,” in Proceedings of the IEEE Conference on Computer Vision and Pattern Recognition, 2016, pp. 2487–2496.
- S. A. Taghanaki et al., “Combo loss: Handling input and output imbalance in multi-organ segmentation,” Computerized Medical Imaging and Graphics, vol. 75, pp. 24–33, 2019.
- Heydarheydari, S., M. J. T. Birgani, and S. M. Rezaeijo. "Auto-Segmentation of Head and Neck Tumors in Positron Emission Tomography Images Using Non-Local Means and Morphological Frameworks," Pol J Radiol 88 (2023): e365-e70.
- Khanfari, H., S. Mehranfar, M. Cheki, M. Mohammadi Sadr, S. Moniri, S. Heydarheydari, and S. M. Rezaeijo. "Exploring the Efficacy of Multi-Flavored Feature Extraction with Radiomics and Deep Features for Prostate Cancer Grading on Mpmri." BMC Med Imaging 23, no. 1 (Nov 22 2023): 195.
- Yang, X., B. B. Chin, M. Silosky, J. Wehrend, D. V. Litwiller, D. Ghosh, and F. Xing. "Learning without Real Data Annotations to Detect Hepatic Lesions in Pet Images." IEEE Trans Biomed Eng 71, no. 2 (Feb 2024): 679-88.
- Xing, F., M. Silosky, D. Ghosh, and B. B. Chin. "Location-Aware Encoding for Lesion Detection in (68)Ga-Dotatate Positron Emission Tomography Images." [In eng]. IEEE Trans Biomed Eng 71, no. 1 (Jan 2024): 247-57.
- Yang X, Chin BB, Silosky M, Wehrend J, Litwiller D, Ghosh D, Xing F. "Learning with Synthesized Data for Generalizable Lesion Detection in Real Pet Images." IEEE Medical Image Computing and Computer Assisted Interventions (2023): 116-26.

Table 1.
Patient demographics and baseline characteristics. Value for mean age is mean (standard deviation). Values for other parameters are number (percentage).
Table 1.
Patient demographics and baseline characteristics. Value for mean age is mean (standard deviation). Values for other parameters are number (percentage).
| Parameter | Value |
|---|---|
| Mean age (years) | 61.4 (14.09) |
| Women | 61.4 |
| Men | 61.2 |
| Sex (no. of patients) | |
| Women | 40 (48%) |
| Men | 43 (52%) |
| Tumor present in liver | |
| Yes | 41 (49%) |
| No | 42 (51%) |
| Primary tumor site | |
| Small bowel | 32 (38%) |
| Pancreas | 25 (30%) |
| Stomach | 5 (6.5%) |
| Lung | 5 (6.5%) |
| Head and neck | 5 (6.5%) |
| Large bowel | 2 (2%) |
| Adrenal | 3 (3%) |
| None (normal scan) | 6 (7.5%) |
| Ki-67 index | |
| Low/intermediate grade (20%) | 51 (62%) |
| High grade (>20%) | 1 (1%) |
| No pathology report | 31 (37%) |
Table 2.
Lesion detection evaluation on the unseen Set2: effect of noise levels. Each method was run 5 times, and the mean and standard deviation (SD) of each metric are reported: mean (SD). We also present the noise level of each dataset in terms of COV of SUV: mean (SD). “*” means significant difference compared with Scanner2 F1 score.
| Training set | COV | F1 | PPV | Sensitivity |
|---|---|---|---|---|
| Set1 Q.Clear | 0.091 (0.027) | 0.614* (0.052) | 0.706 (0.119) | 0.565 (0.111) |
| Set1 VPFXS 5 min | 0.098 (0.027) | 0.657* (0.033) | 0.637 (0.105) | 0.695 (0.059) |
| Set1 VPFXS 4 min | 0.102 (0.027) | 0.673* (0.027) | 0.663 (0.087) | 0.694 (0.048) |
| Set1 VPFXS 3 min | 0.110 (0.029) | 0.690 (0.034) | 0.707 (0.087) | 0.681 (0.025) |
| Set1 VPFXS 2 min | 0.121 (0.030) | 0.713 (0.028) | 0.758 (0.087) | 0.680 (0.039) |
| Set2 | 0.198 (0.040) | 0.755 (0.043) | 0.817 (0.036) | 0.706 (0.070) |
Table 3.
Lesion detection evaluation on the unseen test dataset: effect of training sample size. Each method was run 5 times, and the mean and standard deviation (SD) of each metric are reported: mean (SD). “*” means significant difference compared with 100% Scanner1 F1score.
Table 3.
Lesion detection evaluation on the unseen test dataset: effect of training sample size. Each method was run 5 times, and the mean and standard deviation (SD) of each metric are reported: mean (SD). “*” means significant difference compared with 100% Scanner1 F1score.
| Training sample size | F1 | PPV | Sensitivity |
|---|---|---|---|
| 25% Set1 VPFXS 2 min | 0.478* (0.044) | 0.620 (0.049) | 0.392 (0.055) |
| 50% Set1 VPFXS 2 min | 0.616* (0.046) | 0.882 (0.028) | 0.475 (0.054) |
| 75% Set1 VPFXS 2 min | 0.662* (0.019) | 0.745 (0.051) | 0.598 (0.031) |
| 100% Set1 VPFXS 2 min | 0.713 (0.028) | 0.758 (0.087) | 0.680 (0.039) |
Disclaimer/Publisher’s Note: The statements, opinions and data contained in all publications are solely those of the individual author(s) and contributor(s) and not of MDPI and/or the editor(s). MDPI and/or the editor(s) disclaim responsibility for any injury to people or property resulting from any ideas, methods, instructions or products referred to in the content. |
© 2024 by the authors. Licensee MDPI, Basel, Switzerland. This article is an open access article distributed under the terms and conditions of the Creative Commons Attribution (CC BY) license (http://creativecommons.org/licenses/by/4.0/).
Copyright: This open access article is published under a Creative Commons CC BY 4.0 license, which permit the free download, distribution, and reuse, provided that the author and preprint are cited in any reuse.


