
Submitted:
20 February 2024
Posted:
21 February 2024
You are already at the latest version
Abstract
This study aims to categorize the morphological changes during cabbage (B. oleracea ssp. capitata) development: seedling, rosette, folding, and heading and to elucidate the cellular mechanisms of leaf curvature, essential for the formation of the leafy head. We followed the growth of two cabbage morphotypes with distinct head shapes (round and pointed); we phenotyped the size and volume of the whole-plant as well as the size, shape, and curvature of the leaves during growth. By integrating these phenotypic data, we determined the four vegetative stages for both cabbages. Cytological phenotypes of microtome sections from five distinct leaf positions of the rosette, folding, and heading leaves at two timepoints during leaf growth were quantified and revealed variations in cellular parameters among leaf types, between leaf positions, and between the adaxial and abaxial sides. We identified two synergistic cellular mechanisms contributing to the curvature of heading leaves: differential growth across the leaf blade, with increased growth at the leaf's centre relative to the margins; and increased expansion of the spongy parenchyma layer compared to the palisade parenchyma layer, resulting in the direction of the curvature, which is inwards. These two processes together contribute to the typical leafy heads of cabbages.
Keywords:
Brassica oleracea
; cabbage
; leafy head
; developmental stages
; rosette leaves
; heading leaves
; palisade parenchyma
; spongy parenchyma
; leaf curvature
; abaxial/adaxial differential growth
1. Introduction
Cabbage (Brassica oleracea L. var. capitata) is an important leafy vegetable consumed worldwide, with a global production of 71 million tons in 2021 (fao.org/faostat). The economically important part of cabbages is the leafy head, a healthy source of fibre, minerals, and vitamins [1]. The leafy head is an important agronomic trait that facilitates transport and storage. This trait has also been selected in other crops, such as Chinese cabbage (Brassica rapa L. ssp. pekinensis), radicchio (Cichorium intybus), and lettuce (Lactuca sativa). To date, little is known about the leafy head trait in cabbage. Most research on the leafy head formation in Brassicas has been done on Chinese cabbage [2,3,4,5]. Despite the different head shapes and leaf architecture (more pronounced large flat midribs in Chinese cabbage compared to cabbage), cabbage and Chinese cabbage have a similar overall development and go through four vegetative stages to form the leafy head: seedling, rosette, folding and heading stage. These stages have not been precisely defined yet in cabbage, unlike in Chinese cabbage [4,6,7,8]. In cabbage, Alemán-Báez et al. [7] provided an overall characterization of the rosette and heading stages, while Zhang et al. [8] identified a transition stage occurring between these stages in both cabbage and Chinese cabbage. In Chinese cabbage, Wang et al. [6] and Sun et al. [4] determined the four vegetative stages by characterizing the size, shape, and curvature of the leaves that the plants produce. At the seedling stage, Chinese cabbage plants produce small round leaves with flat or downward curved blades. These seedling leaves have a long and thin petiole. At the rosette stage, the plant produces large round leaves with flat blades. These leaves are organized around the stem to form a rosette. At the folding stage, the plant produces leaves with upward-curved blades and wider petioles. At the heading stage, the plant produces extremely inward curved leaves without petiole but a wide midvein that starts overlapping and wrapping around the shoot apical meristem (SAM) to form the leafy head [4]. The outer heading leaves constrain the inner heading leaves to fill the head. Seedling, rosette, folding and the outer heading leaves are involved in photosynthesis, whereas inner heading leaves do not photosynthesize. Instead, they serve as nutrient storage organs [4,6]. A recent study has indicated that leaf veins play a critical role as a structural framework in Chinese cabbage leafy head formation, and the distribution of auxin in specific areas of leaf veins is a key factor in leaf curvature and, thus, head formation [9].
To study leafy head development and thus to understand leaf curvature, we need to understand the leaf cellular structure, as cell sizes and shapes define organ size and shapes. The leaf cells are arranged as a sandwich, with two outer epidermal layers surrounding the internal mesophyll tissue [10]. The upper epidermal layer is covered with a waxy layer that protects the leaf against biotic and abiotic stresses, while the lower epidermis layer contains most of the stomata involved in gas and water exchange [10]. Meanwhile, the mesophyll tissue represents the main site of photosynthesis of the leaves. For most plants, the mesophyll tissue is divided into two tissue types: the palisade parenchyma, located beneath the upper epidermis layer and the spongy parenchyma, above the lower epidermis layer. The palisade parenchyma consists of long cylindrical cells tightly arranged in a vertical orientation that facilitate the absorbance of photons by the many chloroplasts for photosynthesis [10]. Meanwhile, the spongy parenchyma consists of cells with irregular shapes arranged in a loose way. The large intracellular space facilitates gas exchange (O2, CO2) during both respiration and photosynthesis processes and water evaporation. Moreover, within the spongy parenchyma the vessels are located with xylem transporting water and minerals to the leaves, and phloem distributing the photosynthetic products to other parts of the plant [10].
In both cabbage and Chinese cabbage, seedling and rosette leaves are flat, while folding and heading leaves are curving upwards and inwards [4,7]. Mathematical and biophysical models of the CINCINNATA (CIN) mutant of Antirrhinum majus have provided evidence that the curvature of the leaf blades results from differential cell growth rates between the leaf central region and the margins [11]. Moreover, CIN encodes a TEOSINTE BRANCHED/CYCLOIDEA/PCF (TCP) protein, an orthologue of which was identified to regulate the leafy head shape in Chinese cabbage, also through differential growth between the central and marginal leaf regions [5]. A relatively high expression of BrpTCP4 genes in the marginal regions arrest cell division while a low expression in the central regions enhances cell division necessary for the overall incurvature of the head leaves. In 2016, Cheng et al. [12] studied the genomic differences between heading and non-heading morphotypes in both B. oleracea and B. rapa. They identified selective sweeps associated to the leafy head formation. Inside these regions, several candidate genes related to leaf polarity determination, including ARF3/4, KANADIs, and a member of the HD-ZIP III gene family were identified. Moreover, Liang et al., [13] provided further genetic evidence that the allelic variation of these genes was associated to head traits in Chinese cabbage. They also identified that the RDR6 gene, which is involved in trans-acting short interfering RNAs (tasiRNAs) biogenesis regulating ARF3/4 transcript abundance, plays a role in the formation of the leafy head [14]. Ren et al. [15] identified that the BcpLH (Brassica rapa ssp. pekinensis LEAFY HEADS) gene, a close homologue of HYL1 (HYPONASTIC LEAVES 1) in A. thaliana, was involved in the leafy head formation in Chinese cabbage. HYL1 is involved in the biogenesis of micro-RNAS (miRNAs) [16], which corroborates with the many genes involved in leafy head formation that are regulated by small RNAs. These studies suggest that genetic elements involved in adaxial, and abaxial leaf polarity determination and regulation of growth (cell division and cell expansion) have a participation in leaf curvature and leafy head formation.
For further genetic studies of the leaf curvature and leafy head formation in cabbage, a detailed description of its development is essential. This will help define the different developmental stages and the growth patterns of corresponding leaves. This study aims to determine the developmental stages of cabbage and identify the phenotypic differences between leaves produced at these stages both at the whole plant/whole leaf level and the cellular level. To determine the cabbage vegetative stages, we followed the vegetative growth of two heading cabbages with contrasting head shape (round and pointed) and compared it with the vegetative growth of a non-heading collard green (B. oleracea var. acephala). From both cabbages, we scored the leaf size, shape, and curvature at different time points within the vegetative stages. Moreover, we selected a set of leaves to follow their development in-planta. Using microtome dissection, we identified variations in cellular structure between different leaf positions and between adaxial and abaxial sides. We hypothesize that differential growth between the central and marginal regions, as well as between the adaxial and abaxial sides of the leaves, causes the typical leaf curvature seen in the leafy head.
2. Materials and Methods
2.1. Plant materials and growing conditions
Three B. oleracea hybrid cultivars were utilized in this study: a round heading cabbage (cv Excalibur, Bejo Zaden, Warmenhuizen, The Netherlands), a pointed heading cabbage (cv Sonsma, Rijk Zwaan Zaadteelt en Zaadhandel B.V., De Lier, The Netherlands) and a non-heading collard green (cv Teddy, Chiltern Seeds, Wallingford, England). The two cabbage morphotypes were selected for their contrasting leafy head shape and the collard morphotype for its close phylogenetic relationship with the heading cabbages [17]. Seeds from these cultivars were sown in germination trays with sandy soil in the Unifarm greenhouse at Wageningen University & Research (51◦59′11′′N latitude, 05◦39′52′′E longitude) at two timepoints: at the last week of March 2020 and at the last week of August 2020. The seedlings used in both experiments were cultivated in the same greenhouse compartment with a 16-hour day and 8-hour night cycle. However, there were clear variations in weather conditions between the two experiments. In March, the average temperature was 18.5°C and the relative humidity 70%, while in August the average temperature was 23.1°C and the relative humidity 60%. Two weeks after sowing (for both experiments), the seedlings were transplanted into 2-liter pots with potting compost (Lentse potgrond No. 2) and placed within the same greenhouse following a Randomized Complete Block Design (RCBD) with three blocks. Each of these blocks served as a biological replicate.
2.2. Cabbage plants, and leaf development in planta and histology studies.
This experiment started in March 2020 and included in total eighteen plants, nine for round cabbage and nine for pointed cabbage (Table 1). From each of these morphotypes, three plants were placed in each of three blocks. At 30 DAS, the two most similar plants per plot from each morphotype were selected to conduct two non-destructive experiments: one plant was utilized to follow both leaf and whole plant development from seedling to leafy head formation in planta, while the other plant was utilized to perform histology studies of leaf tissue samples (Table 1).
For the whole plant development experiment, the aerial part of round and pointed cabbages was photographed from top and side views at weekly intervals from 30 DAS to 126 DAS. For the leaf shape development in-planta experiment, we phenotyped selected leaves by drawing their circumference on a sheet of paper to calculate the leaf blade area, leaf index and leaf shape index (Figure 1A). To ensure uniformity in leaf size comparisons between round- and pointed cabbage, we selected the 4th (seedling) and 15th (rosette) leaf in round cabbage and the 5th (seedling) and 15th (folding) leaf in pointed cabbage at different time points (Table 1). For the leaf cell histology experiment, we collected leaf tissue from around the 15th and 21st leaves at five defined positions along the leaf blade (Figure 1B) at two time points (T1 and T2) (Table 1). The T2 sample was collected from a position that is axially symmetrical to the location of the T1 sample. Each tissue sample (4-8 mm2) was carefully excised using a scalpel to inlcude the complete tranverse section including both epidermal layers and the mesophyll tissue. The excised tissue samples were immediately fixed in 5% glutaraldehyde in 0.1M phosphate buffer, at pH 7.2, and left overnight at 4°C. The samples were washed four times for 15 min in 0.1mM phosphate buffer and two times for 15 min in Milli-Q water. The samples were then dehydrated through a series of increasing ethanol concentrations (10, 30, 50, 70, 96 and 100%) for 20 min at each step. Following dehydration, the samples were infiltrated and embedded using the Technovit Glycol Methacrylate Kit 7100 (Heraeus Kulzer). Embedded samples were sliced into 7um transverse sections and stained with toluidine blue. These stained sections were then photographed using a camera mounted on a microscope (ZEISS AxioCam ICc5). These photographs were utilized to measure the cell number, cell size, and cell density of both palisade and spongy parenchyma (Figure 1C) using ImageJ v1.52p software [18]. The cell number is determined by counting the cells within a specified area of 125,600 μm² (to include approximately 50 cells), as indicated by the rectangular dashed frame in Figure 1C. In this frame, cells are included in the count if more than half of their area is within the frame. The cell area is calculated as the average area of all complete cells within this area. Cell density refers to the proportion of tissue occupied by cells, with the intercellular space accounting for the remaining portion of the tissue within the frame (Figure 1C). In addition, we measured thickness of palisade- and spongy mesophyll layers and calculated the ratio of palisade-to-spongy parenchyma (P/S) for the tissue thickness, cell area and cell density at both T1 and T2. We also calculated the ratio of the change in palisade to the change in spongy parenchyma parameters between T1 to T2 (∆P/∆S = (PT2-PT1)/(ST2-ST1)).
2.3. Leaf morphology studies
This experiment started in August 2020 and included in total 90 plants, 30 for each morphotype: round cabbage, pointed cabbage and collard green. From each of these morphotypes, 10 plants were placed in each of the three blocks. At weekly intervals from 28 to 77 DAS (Table 1), one plant per block of each morphotype was randomly selected to score the complete number of leaves and calculate the area of each single leaf. The total number of leaves included the number of scars on the stem produced by leaves that senesced. To calculate the leaf area, the complete set of leaves was detached from the stem, positioned from oldest to youngest, and photographed. The youngest leaf we phenotyped was 4 cm in length. The leaf area (Figure 2A) was extracted from these photographs using ImageJ v1.52p software. When the cabbage plants (round and pointed) showed a leafy head, the position (from oldest to youngest) of the first heading leaf was scored. The first heading leaf is defined as the oldest (outermost) leaf that was part of the leafy head (Figure 2B). Additionally, the degree of leaf curvature in two axis (proximo-distal and lateral) was assessed for the complete set of leaves of both round and pointed cabbages at 70 DAS, a stage when both cabbage types showed a leafy head. For this, a leaf curvature ratio was calculated for each axis dividing the shortest distance between the two opposing leaf edges (straight line) by the distance following the curvature of the leaf (dotted line) (Figure 2C).
3. Results
3.1. Whole plant development
At weekly intervals from 30 to 126 days after sowing (DAS), plants from the three B. oleracea morphotypes (round cabbage, pointed cabbage, and collard green) were photographed from both top and side view. In addition, leaves were removed and photographed (see Materials and Methods 2.2 and 2.3). This provided information about whole plant growth, including leaf number (Table S1) as well as leaf shape and size (Table S2). Based on both the whole plant phenotype (Figure 3A) and their detached leaves (Figure 3B), we determined four vegetative stages for both round- and pointed cabbages: seedling, rosette, folding and heading. At the seedling stage, when both cabbage plants were small (Figure 3A), the internodes between the seedling leaves were relatively large. Both round and pointed cabbage seedling leaves were small and round. These leaves are flat or downward curved with a petiole. However, in pointed cabbage, the petioles of younger seedling leaves were reduced compared to seedling leaves of round cabbage (Figure 3B). The seedling stage in the round cabbage (till 36 DAS) lasted longer than in the pointed cabbage (till 30 DAS) (Figure 3A,B). At the rosette stage, the cabbage plants’ growth was evident, generating new leaves and expanding their leaves. The internodes between leaves decreased to establish a rosette structure. In round cabbage, the rosette stage was from ~ 43 to 65 DAS, and the rosette leaves had a “broad ovate” shape with a reduced petiole (Figure 3A,B). In pointed cabbage, the rosette stage was earlier and shorter, from ~ 36 to 43 DAS, and the rosette leaves show an “obovate” shape without petiole (Figure 3A,B). During the folding stage, the increase of volume of both round and pointed cabbage plants decelerated. Plants from cabbages (round and pointed) produced upward curved leaves without petioles (Figure 3A,B). In round cabbage plants, the folding stage was from ~ 72 to 78 DAS, while in pointed cabbage plants from ~ 51 to 65 DAS (Figure 3A,B). At the heading stage, the cabbage plants produced leaves with an extreme inward curvature that caused their overlapping around the shoot apical meristem (Figure 3A). The outer heading leaves constrained the inner heading leaves, forcing them to fill the leafy head, however these leaves also still expanded. The heading stage in round cabbages started at 70 DAS, while in pointed cabbage, it started at 56 DAS (Figure 3A,B). At the heading stage, the seedling leaves had senesced, while the rosette leaves all stayed green. For collard plants, only two distinct developmental stages were identified: the seedling stage and the rosette stage (Figure 3A). Once the rosette stage is reached, the morphology of both the plants and their leaves remained consistent. The leaves are elliptic and exhibit characteristic wavy blades and possess elongated petioles.
3.2. Changes in leaf morphology during plant development
To identify changes in leaf morphology during the four vegetative developmental stages (seedling, rosette, folding and heading), we followed the development of cabbage plants from 28 to 77 DAS. At weekly intervals, we scored the total leaf number and conducted analyses of their size, curvature, and shape (see Materials and Methods 2.3). This provided information concerning the time intervals between the formation of each leaf, their growth speed, and final shape and curvature (Tables S1–S3). Based on these combined data, we described the seedling, rosette, folding, and heading leaves for both cabbages. Seedling leaves in round cabbages include the first seven leaves, and in pointed cabbage, the first six leaves (Figure 3B and Figure 4A,B). In both cabbages, each successive seedling leaf reached a larger final size, and their growth ceased after 49 DAS (Figure 4A). Moreover, in both round- and pointed cabbage, the older seedling leaves curved downward (curvature ratio < 1), while the younger ones were flatter (curvature ratio ≈ 1) (Figure 4B). Rosette leaves in round cabbage plants included leaves 8 to 16, and in pointed cabbage leaves 7 to 16 (Figure 3B and Figure 4A,B). These rosette leaves represent the largest leaves of both cabbage plants and cease growth at 70 DAS for round cabbage plants and 63 DAS for pointed cabbages (Figure 3B and Figure 4A). In both cabbage varieties, the older rosette leaves curve slightly downward, the middle rosette leaves are flat, while the youngest rosette leaves curve slightly upward (Figure 4B). Folding leaves in plants of both cabbage varieties start at leaf 17 till the first heading leaf (Figure 3B and Figure 4A,B). Although the folding leaves clearly show an upward curvature (curvature ratio > 1) (Figure 4B), they do not yet overlap to form a mould for the leafy head. The first heading leaf for round cabbages was leaf 24, while it was leaf 18 for pointed cabbage. These heading leaves show inward curvature, which is stronger in round cabbage plants compared to pointed cabbage plants (Figure 4B).
To investigate more accurately the dynamic changes in leaf shape during leaf growth, two leaves for each of three cabbage plants of both varieties (round and pointed) were selected to phenotype at weekly intervals while they remained attached to the plant (see Materials and Methods 2.2). For round cabbage, we selected a seedling and a rosette leaf, while for the pointed cabbage, a seedling and a folding leaf were selected. For these leaves, we calculated both leaf index and leaf shape index (Table S4) (see Materials and Methods 2.2, Figure 1A) as indicators of their shape (Figure 5A,B). Both round and pointed seedling leaves have an elliptical shape (leaf length/width >1), with the widest part at the proximal base (broad-ovate shape) (Figure 5C). In round cabbage seedling leaves, the proximal base was wider than in pointed cabbages. The rosette leaves of round cabbages are circular (leaf length/width =1), with the widest part at the distal end (obovate shape) (Figure 5C). The folding leaves of pointed cabbages are elliptical like their seedling leaves (length/width>1), and the widest part of the leaf transitions from the proximal base (broad ovate shape) in younger leaves to the distal end (obovate shape) in older leaves (Figure 5C).
3.3. Defining the developmental stages of cabbage.
To define the start and the duration of each developmental stage (seedling, rosette, folding and heading) in both round and pointed cabbage, we integrated data of whole plant development (Figure 3), leaf size (Figure 4A) and leaf curvature (Figure 4B). For both round and pointed cabbages, the heading stage, which extends to head maturity, is the longest, while the folding stage is the shortest (Table 2). For the early-maturing pointed cabbage variety, each stage is shorter than that of round cabbage, and this is especially the case for the folding stage, with fewer folding leaves. The number of the first heading leaf and, thus, the onset of the heading stage differs between plants from the same variety in the same greenhouse (Table S5), showing that leafy head formation is affected by small environmental fluctuations.
3.4. Histology of leaf development
3.4.1. Difference among leaf positions
To investigate the morphological changes occurring at the cellular level during leaf development in both round and pointed cabbage leaves, we phenotyped the rosette leaf of round cabbage and the folding leaf of pointed cabbage (previously used for assessing the leaf shape, see Results 3.2) and heading leaves from both cabbages. From these leaves, we sampled tissue from five positions (tip, mid, base, mid-lateral, and lateral) at two time points: T1 and T2, with a 4-week interval between them (see Materials and Methods 2.2) to assess cell number, cell area, cell density and tissue thickness (Table S6). Overall, leaf thickness increased from T1 to T2 for all leaf positions in both round and pointed cabbages (Figure 6). This increase was largest in rosette leaves of round cabbage; these leaves also showed the largest increase in size. The increase in thickness was only marginal between T1 and T2 in all other leaves (heading round, folding, and heading pointed), and these leaves also showed lesser growth. We also identified differences in thickness between positions within a leaf. At T1, the rosette leaves had comparable thickness across positions in round cabbage, while in both folding and heading leaves, the thickness varied across their leaf blades. At T2, the thickness across the leaf blade in flat rosette leaves of round cabbage remained comparable, while in all other stages (folding and heading), thickness varied strongly across the leaf blade. In pointed cabbage, the base position in both folding and heading leaves was thickest, which was already the case at T1. Interestingly, in round cabbage, the mid position of heading leaves was thicker in both T1 and T2. The position of the thickest tissue coincided with the curvature of the leaves, which was in the middle for round cabbage leaves where bending is most extreme and at the base of pointed cabbage folding and heading leaves, again where leaf bending is most obvious.
Although variation in thickness across the leaf blade was less evident in rosette leaves, the tip, mid and mid-lateral positions are the thickest, while the base and lateral positions are the thinnest (Figure 7). The thicker mid position of the heading leaves of round cabbage was characterized by a relatively low number of cells with large size (large cell area). Cell area and cell number were inversely correlated, so when cells were large, their numbers were low and vice versa. In contrast to these very large mid position cells, cells at the base and mid-lateral position were intermediate, while at the tip and lateral positions, cells were smaller. Similar to the heading leaves in round cabbages, the thickest base position of the heading leaves of pointed cabbage was characterized by the largest cells, while the thinner part of the leaf (the lateral position) had the highest number of cells with the smallest area. Again, cell size and numbers were inversely correlated.
3.4.2. Difference between adaxial and abaxial sides
As we hypothesized that leaf curvature can be caused by both differential growth along the leaf blade and differential growth between palisade and spongy parenchyma cells (ad and ab axial sides), we set out to compare cellular parameters between palisade and spongy parenchyma. The relationship of cellular parameters between palisade and spongy parenchyma varied between the rosette and heading leaves (Figure 7, mean values across the leaf blade). In the heading leaves of both round and pointed cabbages, the spongy parenchyma comprised a larger proportion of the mesophyll in terms of tissue thickness and cell area compared to rosette leaves (Figure 7). To investigate the relationship between the difference in palisade (P) and spongy (S) parenchyma tissue and leaf curving, we calculated the palisade-to-spongy parenchyma (P/S) ratio for the cellular parameters Tissue Thickness, Single Cell Area and Cell Density at both timepoints (T1 and T2) to monitor changes during growth. We also calculated the ratio of change between palisade and in spongy parenchyma from T1 to T2 (∆P/∆S = (PT2-PT1)/(ST2-ST1)) to evaluate growth differences between the palisade and spongy parenchyma tissues (adaxial and abaxial sides) (Table 3). Table 3 shows the P/S and ∆P/∆S ratios averaged across the five leaf positions, while the specific ratio values (P/S and ∆P/∆S) for each position (tip, mid, base, mid-lateral, and lateral) are provided in Table S8. The average P/S and ∆P/∆S ratios calculated across the five leaf positions in rosette leaves of round cabbage are around 1.0, indicating a flat leaf shape. Conversely, these ratios for the heading leaves of both round and pointed cabbages are below 1.0, reminiscent of a curved leaf shape.
3.4.2.1. Tissue Thickness
Leaves grow along the three axes, the proximo-distal, medio-lateral, and adaxial–abaxial axes. Measuring leaf thickness in transverse sections reflects the growth of mesophyll and can be quantified to define growth differences between palisade- and sponge tissue. In rosette leaves, the P/S of tissue thickness is approximately 1.0 both at T1 and T2, while the ∆P/∆S is also close to 1.0, indicating that the growth rates of palisade and spongy parenchyma are similar. This similarity in growth rates of palisade and spongy tissue contributes to the maintenance of the flat shape of rosette leaves during leaf development. However, in heading leaves of both round and pointed cabbages, the P/S and ∆P/∆S of tissue thickness are all less than 1.0. This result suggests that the growth rate of palisade is slower than that of spongy parenchyma, leading to the development of inwardly curved leaves.
3.4.2.2. Average Single Cell Area and Cell Density
The increase in tissue thickness results from the expansion of mesophyll cells and the enlargement of intercellular spaces, characterized by increased cell area and decreased cell density. In rosette leaves, both the P/S and ∆P/∆S ratios of single cell area were greater than 1.0, indicating a faster cell expansion rate in palisade parenchyma compared to spongy parenchyma (Table 3). Moreover, the P/S ratio of cell density at both T1 and T2 is also greater than 1.0, illustrating the lower cell density in the more loosely organized spongy parenchyma tissue. Interestingly, the ∆P/∆S of cell density is less than 0, suggesting a faster increase in cell density in palisade parenchyma and / or a faster decrease in spongy parenchyma from T1 to T2. These trends are visually represented in Figure 7, where palisade parenchyma cells are larger with less intercellular space compared to spongy parenchyma. These results indicate that an increase in intercellular space compensates for the lower cell expansion in spongy parenchyma relative to palisade parenchyma, resulting in comparable growth between the two tissue types. In heading leaves of both round and pointed cabbages, the P/S ratio at T2 and ∆P/∆S of cell area were all larger than 1.0, but they were less than that of rosette leaves (1.2 and 1.3 for heading leaves of round and pointed cabbage compared to 1.5 for rosette round leaves). This means that the spongy parenchyma cells expanded more in heading leaves compared to rosette leaves. The P/S ratio of cell density at both T1 and T2 in heading leaves was similar to that of rosette leaves. In conclusion, higher cell expansion rate and rate of increase in intercellular space of spongy parenchyma compared to palisade parenchyma results in increased growth of the spongy tissue compared to palisade tissue in heading leaves, causing inward leaf curvature.
3.4.3. Shoot apical meristem
As leaves develop from the shoot apical meristem (SAM), we assessed the SAM morphology. The SAM differed between the rosette and heading stages of round cabbage but also between round and pointed cabbages. In round cabbages, the SAM exhibits a dome-shaped morphology, transitioning more flattened in the heading stage. Conversely, in pointed cabbages, the SAM is a triangular shape at the rosette stage and becomes slightly rounded in the heading stage. A notable distinction between the SAM structures of round and pointed cabbage plants is the smaller angle of the developing vascular strands observed in the pointed cabbage (Figure 8).
4. Discussion
Cabbages display a wide array of agronomic traits, which is reflected in different cabbage types (round, red, savoy, and pointed), in the range of ecotypes (summer, autumn, winter cabbages), in geographical locations where cabbage can be grown and in the different market segments (fresh market, industry, and storage). The different varieties require different time periods to initiate the head formation (heading stage) and to develop tight, compact, leafy heads (head maturity). As they progress towards the heading stage, notable changes occur in the overall shape of both the cabbage plant and the size and shape of the developing leaves. This study is dedicated to studying these morphological transitions, with a special focus on the timing of each developmental stage. In addition, this study tests the hypothesis that leaf curvature, an essential step in the leafy head formation, is the result of differential growth across the leaf blade and between the mesophyll cell layers. We have generated detailed phenotypes at the whole-plant level, monitoring plant shape and volume, and at the leaf level, assessing leaf size, shape, curvature, and cellular structure over time. By integrating observations of both whole-plant and leaf development, we defined the seedling, rosette, folding, and heading stages in a round and pointed cabbage. The criteria used to define these developmental stages for these two types of cabbage are likely to be universally applicable to other varieties as well.
4.1. Characterization and timing of developmental stages
The final size and curvature of the leaves produced by both cabbages (round and pointed) change across the different developmental stages (seedling, rosette, folding and heading). In both cabbages, the rosette leaves are the largest with a mostly flat leaf blade, while the folding leaves curve upward. Our histological study revealed that in both cabbages, the growth of rosette leaves results from both cell division and cell expansion, whereas the growth of the folding leaves, which remain smaller than rosette leaves, is mainly by cell expansion. This suggests that both cell division and expansion in cabbage leaves are co-regulated by the developmental stage. This finding is consistent with previous research, such as the study by Alemán-Báez et al. [19], which reported that miR396b and its interacting GRF gene, both involved in cell division during leaf development, were differentially expressed between the young rosette and heading leaves in cabbage. Similarly, Mao et al. [5] showed that the miR319-TCP4 interaction, also regulating cell division and expansion across the leaf blade, influences both rosette leaf growth and the head shape of Chinese cabbage [5].
As cabbage plants develop from the rosette to the heading stage, there is a noticeable decrease in leaf size coupled with an increase in leaf curvature. Folding leaves represent a transition stage, showing size and curvature that are intermediate between those of rosette and heading leaves. Interestingly, Zhang et al. [8] identified a transition stage between rosette and heading stages by tracking gene expression changes during the development of both cabbage and Chinese cabbage. This transition stage was characterized by massive gene expression changes, with clear upregulation of genes involved in phytohormone signalling pathways, particularly the ethylene pathway for Chinese cabbage, as well as genes predicted to regulate growth. Moreover, this transition stage was sensitive to ambient temperatures, with higher temperatures delaying the heading stage. Notably, this temperature-induced delay did not affect the expression levels of SQUAMOSA-promoter binding protein-like (SPL) genes, crucial for plant growth and development, indicating that the pathways regulating age and leafy head formation are distinct.
Moreover, we analyzed the variations between round and pointed cabbage varieties and found that the shape of rosette leaves was indicative of the head shape; circular rosette leaves (leaf length/leaf width ≈ 1) correlated with round heads, while elliptical rosette leaves (leaf length/leaf width > 1) were associated with pointed heads. Complementary to our findings, Mao et al. [5] found in Chinese cabbage that the curvature and shape of rosette leaves were indicative of the final head shape: flat rosette leaves corresponded with round heads, inward-curving leaves with cone-like heads, and wavy leaves with cylindrical heads. Moreover, Alemán-Báez et al. [7], across 308 cabbage accessions, and Sun et al. [20], in 152 Chinese cabbage accessions, identified significant correlations between rosette leaf and head traits. Both studies also discovered QTLs associated with both traits.
4.2. Differential growth across the leaf blade and between the mesophyll cell layers are associated with leaf curvature
Figure 9 visualizes our hypothesis that differential cell division and expansion across both the leaf blade and between leaf ad/abaxial sides results in leaf curving, which is indispensable for leafy head formation. To validate this hypothesis, we examined the cellular structure of leaf blade tissue across the leaf blade at five distinct positions (tip, mid, base, mid-lateral, and lateral) to identify variations in tissue thickness and cell size across these areas. In the heading leaves of both cabbages, the position of the thickest leaf tissues with largest cell sizes corresponded with the curvature’s location. In round cabbages, the mid position of the heading leaf was the thickest, while the tip and lateral were thinnest, allowing the leaf to curve at this point into a bowl shape. Conversely, in pointed cabbages, the base was the thickest, and the laterals were the thinnest, which facilitated bending along the sides.
To further test our hypothesis, we compared changes in both palisade and spongy parenchyma layers during leaf growth in both round and pointed cabbage morphotypes.
We determined the ratio of the change in palisade parenchyma to the change in spongy parenchyma by analysing tissue thickness and cell size at two distinct time points. Subsequently, we compared these ratios between the rosette and heading leaves. The ratios observed in heading leaves were consistently smaller than those in rosette leaves. This observation suggests that, within the entire mesophyll, spongy parenchyma cells exhibited greater expansion, and the spongy tissue thickness increased more significantly in heading leaves that curve compared to the flat rosette leaves. This aligns with research conducted on Arabidopsis, demonstrating that the upwardly curved leaf morphology observed in the hyl1 mutant is associated with abaxial epidermal cell overgrowth through cell expansion [21]. This is in agreement with a study of Yu et al. [21] in Arabidopsis, in which the expression level of the adaxial identity gene REV increased, as the miR165 expression was reduced due to the absence of HYL1 in the hyl1 mutant.
In our study, we did not quantify epidermal cellular growth, but the differences in growth between the two palisade layers suggests that also epidermal growth differs between ad and ab axial sides. In Chinese cabbage, the epidermal cells of heading leaf veins show an asymmetrical growth pattern, with cells on the abaxial side dividing much more rapidly than those on the adaxial side [9]. Disruption of auxin transport also induced asymmetrical growth of the abaxial and adaxial epidermal cells in leaf veins, leading to the upward curvature of seedling leaves [9]. Studies on cabbage and Chinese cabbage have shown that genes responsible for establishing abaxial/adaxial leaf polarity [12,13,22,23], as well as those involved in cell division and expansion [5,7] during leaf development, are crucial for the formation of the leafy head. Additionally, microRNAs that regulate these leaf development genes also play a significant role in this process [5,19,22].
In conclusion, our findings indicate that two synergistic cellular pathways regulate the formation of inward-curving leaves during cabbage head formation (Figure 9). We clearly demonstrated that increased growth at the mid or base positions, in contrast to lateral positions, leads to the formation of a bowl-like shape of heading leaves in round cabbages and at heading leaves bent at the leaf base for pointed cabbages. The second pathway concerns the different rates of parenchyma (palisade/spongy) cell division and expansion, resulting in increased growth of the leaf’s abaxial side compared to the adaxial, leading to an inward curvature.
Supplementary Materials
The following supporting information can be downloaded at the website of this paper posted on Preprints.org.
Author Contributions
Conceptualization, Z.L., J.A.B. and G.B.; methodology, Z.L. and J.A.B.; experiments performance, Z.L., data analysis, Z.L. and J.A.B.; writing – original draft preparation, Z.L. and J.A.B.; writing – review & editing, Z.L., J.A.B. and G.B.; visualization, Z.L., J.A.B. and G.B.; supervision, R.G.F.V. and G.B. All authors have read and agreed to the published version of the manuscript.
Funding
This research was funded by the China Scholarship Council (No. 201807720030) for Zihan Liu and by the Mexican government through the Consejo Nacional de Ciencia y Tecnología (CONACYT), C.V. 761325 for Jorge Alemán-Báez.
Data Availability Statement
Data is contained within the article or supplementary material.
Acknowledgments
We are grateful for the guidance from Isolde Bertram for the tissue embedding and microtome section. We like to thank Johan Bucher for the assistance with experiments, Jiayu Li for the pre-experiment data collection and analysis and staff of Unifarm for taking care of the greenhouse experiments.
Conflicts of Interest
All the authors have no conflict of interest.
References
- Nawaz, H., M.A. Shad, and A. Rauf, Optimization of extraction yield and antioxidant properties of Brassica oleracea Convar Capitata Var L. leaf extracts. Food chemistry, 2018. 242: p. 182-187.
- Guo, X., et al., Series-Spatial Transcriptome Profiling of Leafy Head Reveals the Key Transition Leaves for Head Formation in Chinese Cabbage. Front Plant Sci, 2021. 12: p. 787826.
- He, Y.K., et al., Leafy head formation of the progenies of transgenic plants of Chinese cabbage with exogenous auxin genes. Cell research, 2000. 10(2): p. 151-160.
- Sun, X., et al., Genome-wide transcriptome analysis reveals molecular pathways involved in leafy head formation of Chinese cabbage (Brassica rapa). Horticulture research, 2019. 6.
- Mao, Y., et al., MicroRNA319a-targeted Brassica rapa ssp. pekinensis TCP genes modulate head shape in chinese cabbage by differential cell division arrest in leaf regions. Plant physiology, 2014. 164(2): p. 710-720.
- Wang, Y., et al., BrpSPL9 (Brassica rapa ssp. pekinensis SPL9) controls the earliness of heading time in Chinese cabbage. Plant Biotechnol J, 2014. 12(3): p. 312-21.
- Alemán-Báez, J., et al., Genetic dissection of morphological variation in rosette leaves and leafy heads in cabbage (Brassica oleracea var. capitata). Theoretical and Applied Genetics, 2022. 135(10): p. 3611-3628.
- Zhang, K., et al., A cluster of transcripts identifies a transition stage initiating leafy head growth in heading morphotypes of Brassica. The Plant Journal, 2022. 110(3): p. 688-706.
- Yue, X., et al., The Adaxial/Abaxial Patterning of Auxin and Auxin Gene in Leaf Veins Functions in Leafy Head Formation of Chinese Cabbage. Frontiers in Plant Science, 2022. 13: p. 918112.
- Oguchi, R., et al., Leaf anatomy and function. The leaf: a platform for performing photosynthesis, 2018: p. 97-139.
- Nath, U., et al., Genetic control of surface curvature. Science, 2003. 299(5611): p. 1404-1407.
- Cheng, F., et al., Subgenome parallel selection is associated with morphotype diversification and convergent crop domestication in Brassica rapa and Brassica oleracea. Nature genetics, 2016. 48(10): p. 1218-1224.
- Liang, J., et al., Genetic variation and divergence of genes involved in leaf adaxial-abaxial polarity establishment in Brassica rapa. Frontiers in Plant Science, 2016. 7: p. 94.
- Moon, J. and S. Hake, How a leaf gets its shape. Current opinion in plant biology, 2011. 14(1): p. 24-30.
- Ren, W., et al., BcpLH organizes a specific subset of microRNAs to form a leafy head in Chinese cabbage (Brassica rapa ssp. pekinensis). Horticulture research, 2020. 7.
- Han, M.-H., et al., The Arabidopsis double-stranded RNA-binding protein HYL1 plays a role in microRNA-mediated gene regulation. Proceedings of the National Academy of Sciences, 2004. 101(4): p. 1093-1098.
- Cai, C., et al., Evidence for two domestication lineages supporting a middle-eastern origin for Brassica oleracea crops from diversified kale populations. Horticulture research, 2022. 9.
- Schneider, C.A., W.S. Rasband, and K.W. Eliceiri, NIH Image to ImageJ: 25 years of image analysis. Nature methods, 2012. 9(7): p. 671-675.
- Jorge Alemán-Báez, J.F.A.-Z., Johan Bucher, Chengcheng Cai, Roeland E. Voorrips and Guusje Bonnema. Expression changes of miRNA-regulated genes associated with the formation of the leafy head in cabbage (Brassica oleracea var. capitata). Horticultural Plant Journal 2024 (Accepted).
- Sun, X., et al., Genetic analysis of Chinese cabbage reveals correlation between rosette leaf and leafy head variation. Frontiers in Plant Science, 2018. 9: p. 1455.
- Yu, L., et al., HYL1 gene maintains venation and polarity of leaves. Planta, 2005. 221: p. 231-242.
- Ren, W., et al., Association of microRNAs with types of leaf curvature in Brassica rapa. Frontiers in Plant Science, 2018. 9: p. 73.
- Li, X., et al., Large-scale gene expression alterations introduced by structural variation drive morphotype diversification in Brassica oleracea. Nature Genetics, 2024.
Figure 1.
Description of leaf development traits generated in planta and histology traits. (A) The definition of leaf index and leaf shape index jointly define the leaf shape (B) Illustration of the sampling position for the histological study. (C) Data extraction strategy for tissue thickness and cell density. The red line is drawn manually to separate palisade tissue and sponge tissue according to the shape of the cells. The palisade tissue thickness is the distance from the upper epidermis to the red line. The spongy tissue thickness is the distance from the lower epidermis to the red line. The rectangular dashed frame is the area of 125,600μm2. The formula of cell density for palisade tissue is depicted in the figure and is similar for cell density of spongy tissue.
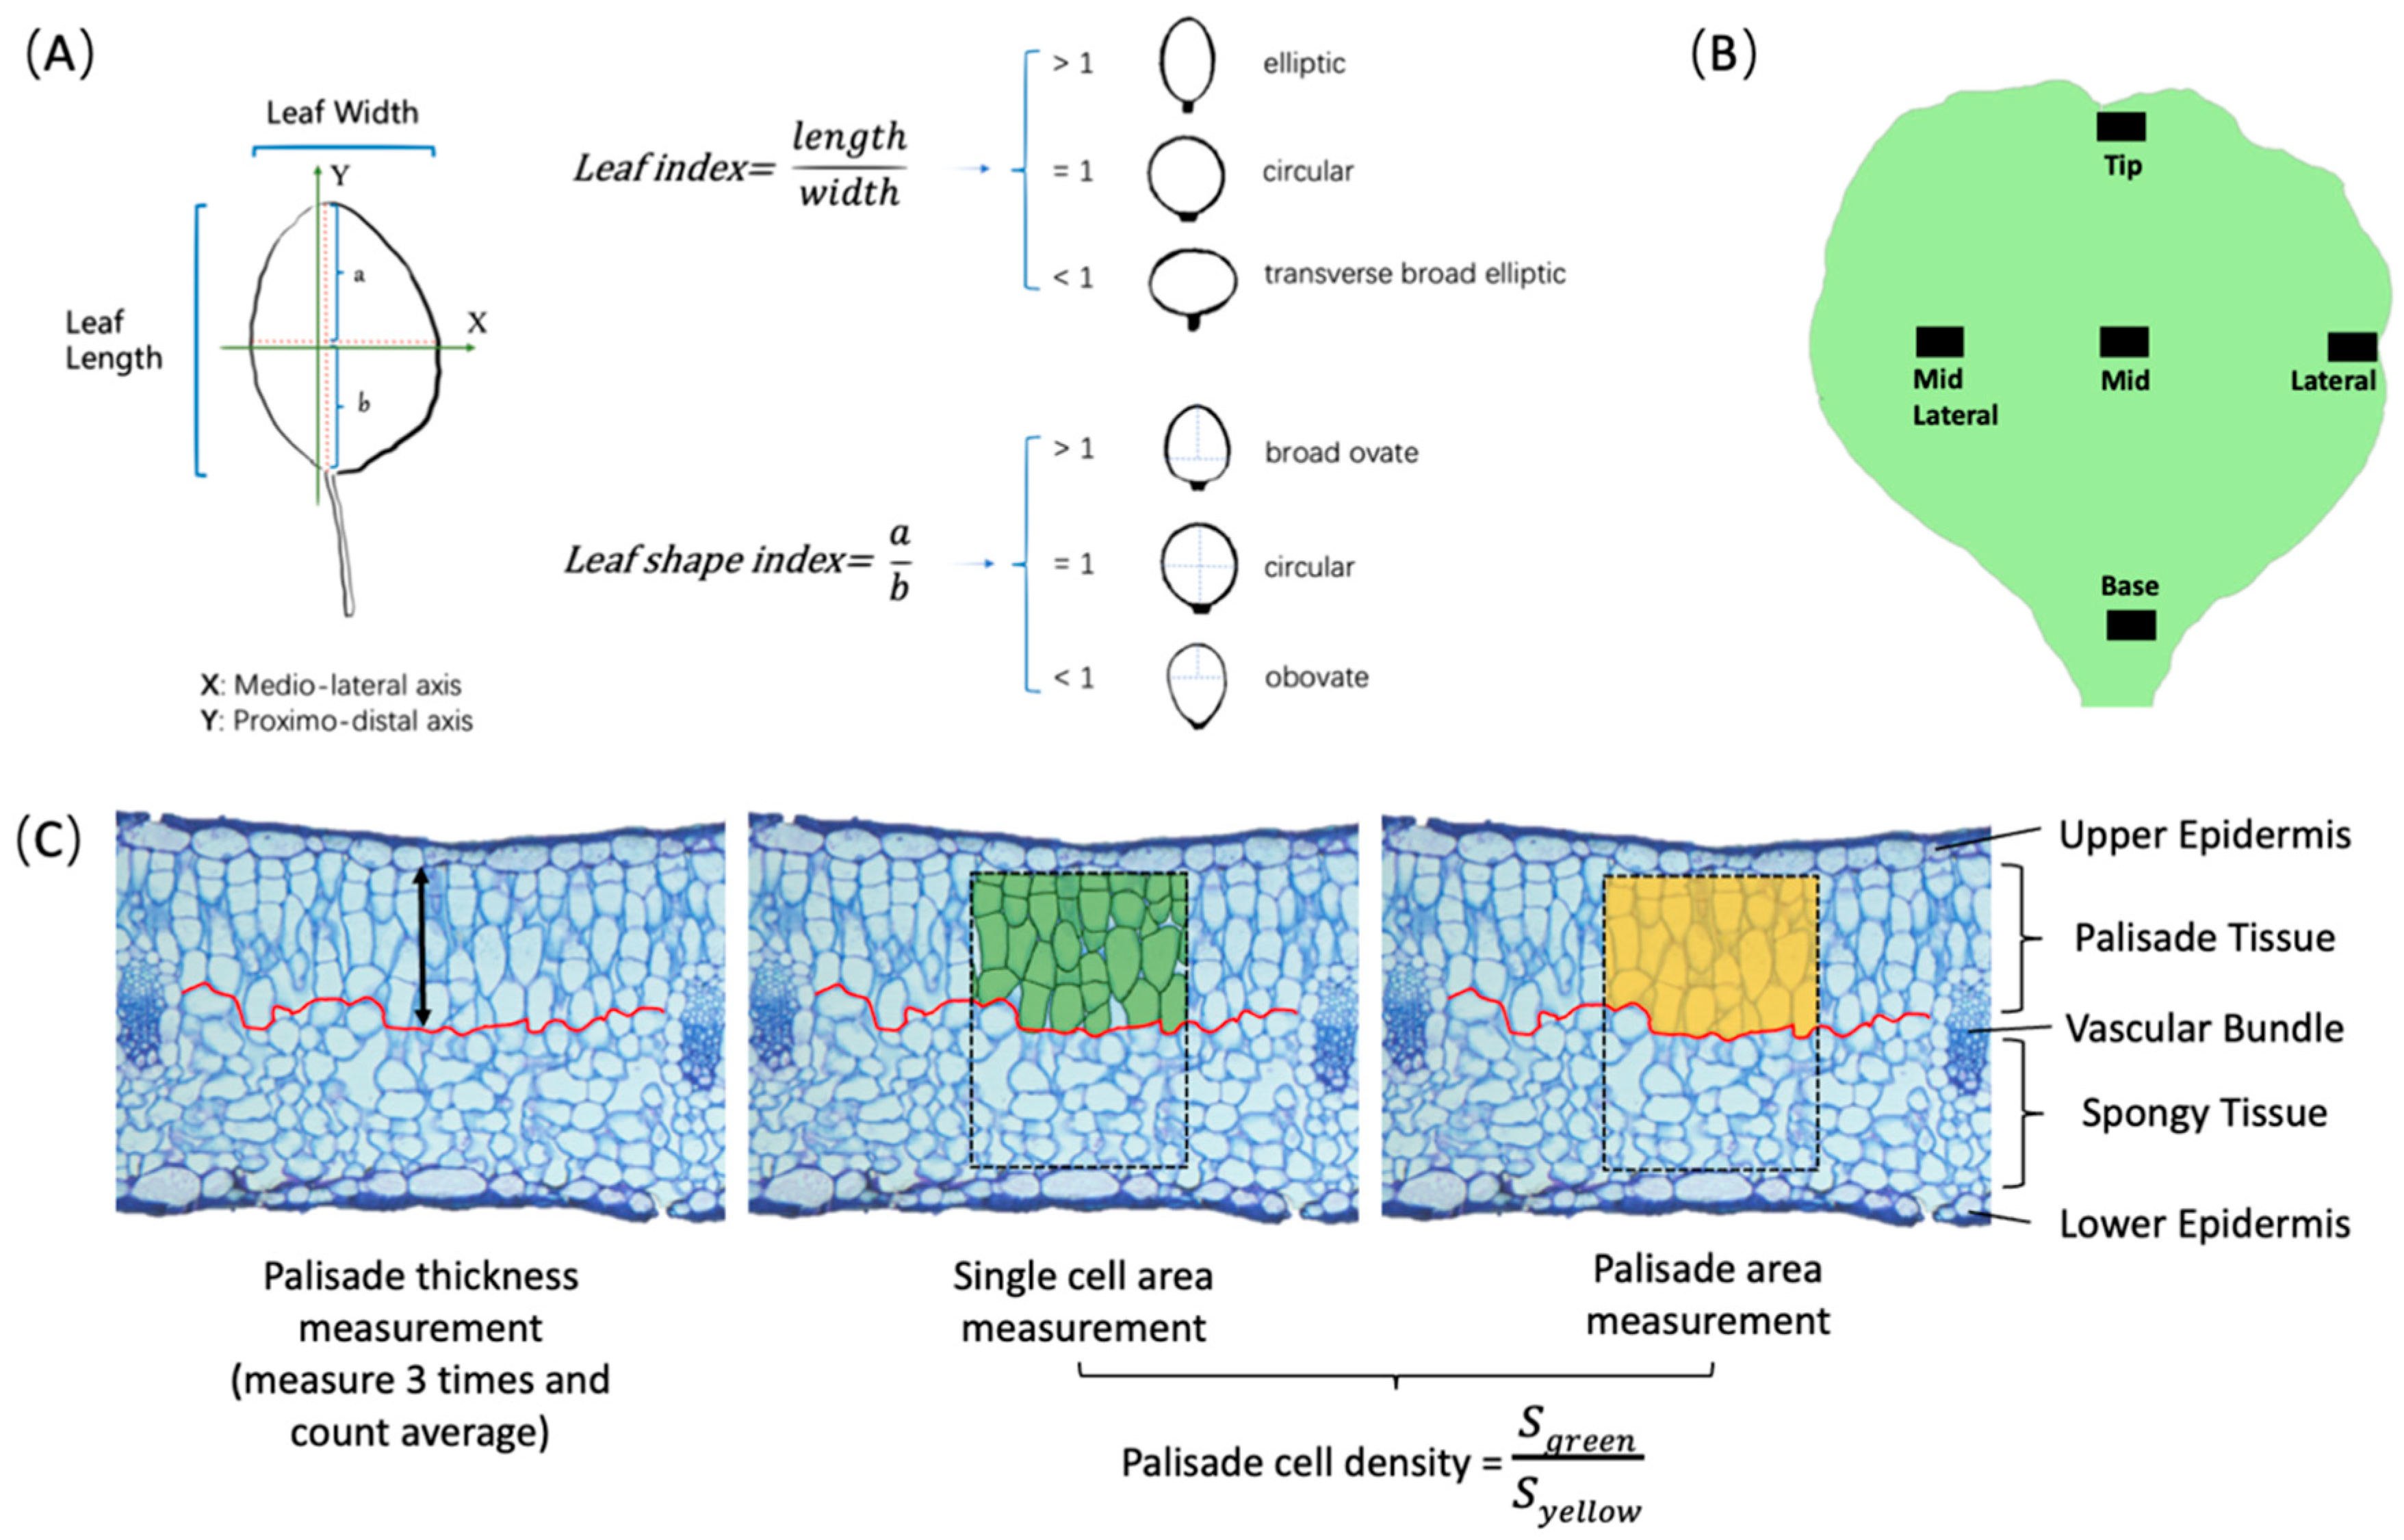
Figure 2.
Cabbage traits scored in the cabbage leaf morphology studies. A) Visualization of the leaf area on a rosette leaf in a pointed cabbage. B) Visualization of the first heading leaf (in red) in a pointed cabbage. C) Visualization of the methodology utilized to calculate the leaf curvature ratio. The straight red line indicates the closest distance between the proximal and distal edges, while the blue line between the lateral edges. The dotted red line follows the proximal-distal curvature, and the blue line the lateral curvature.
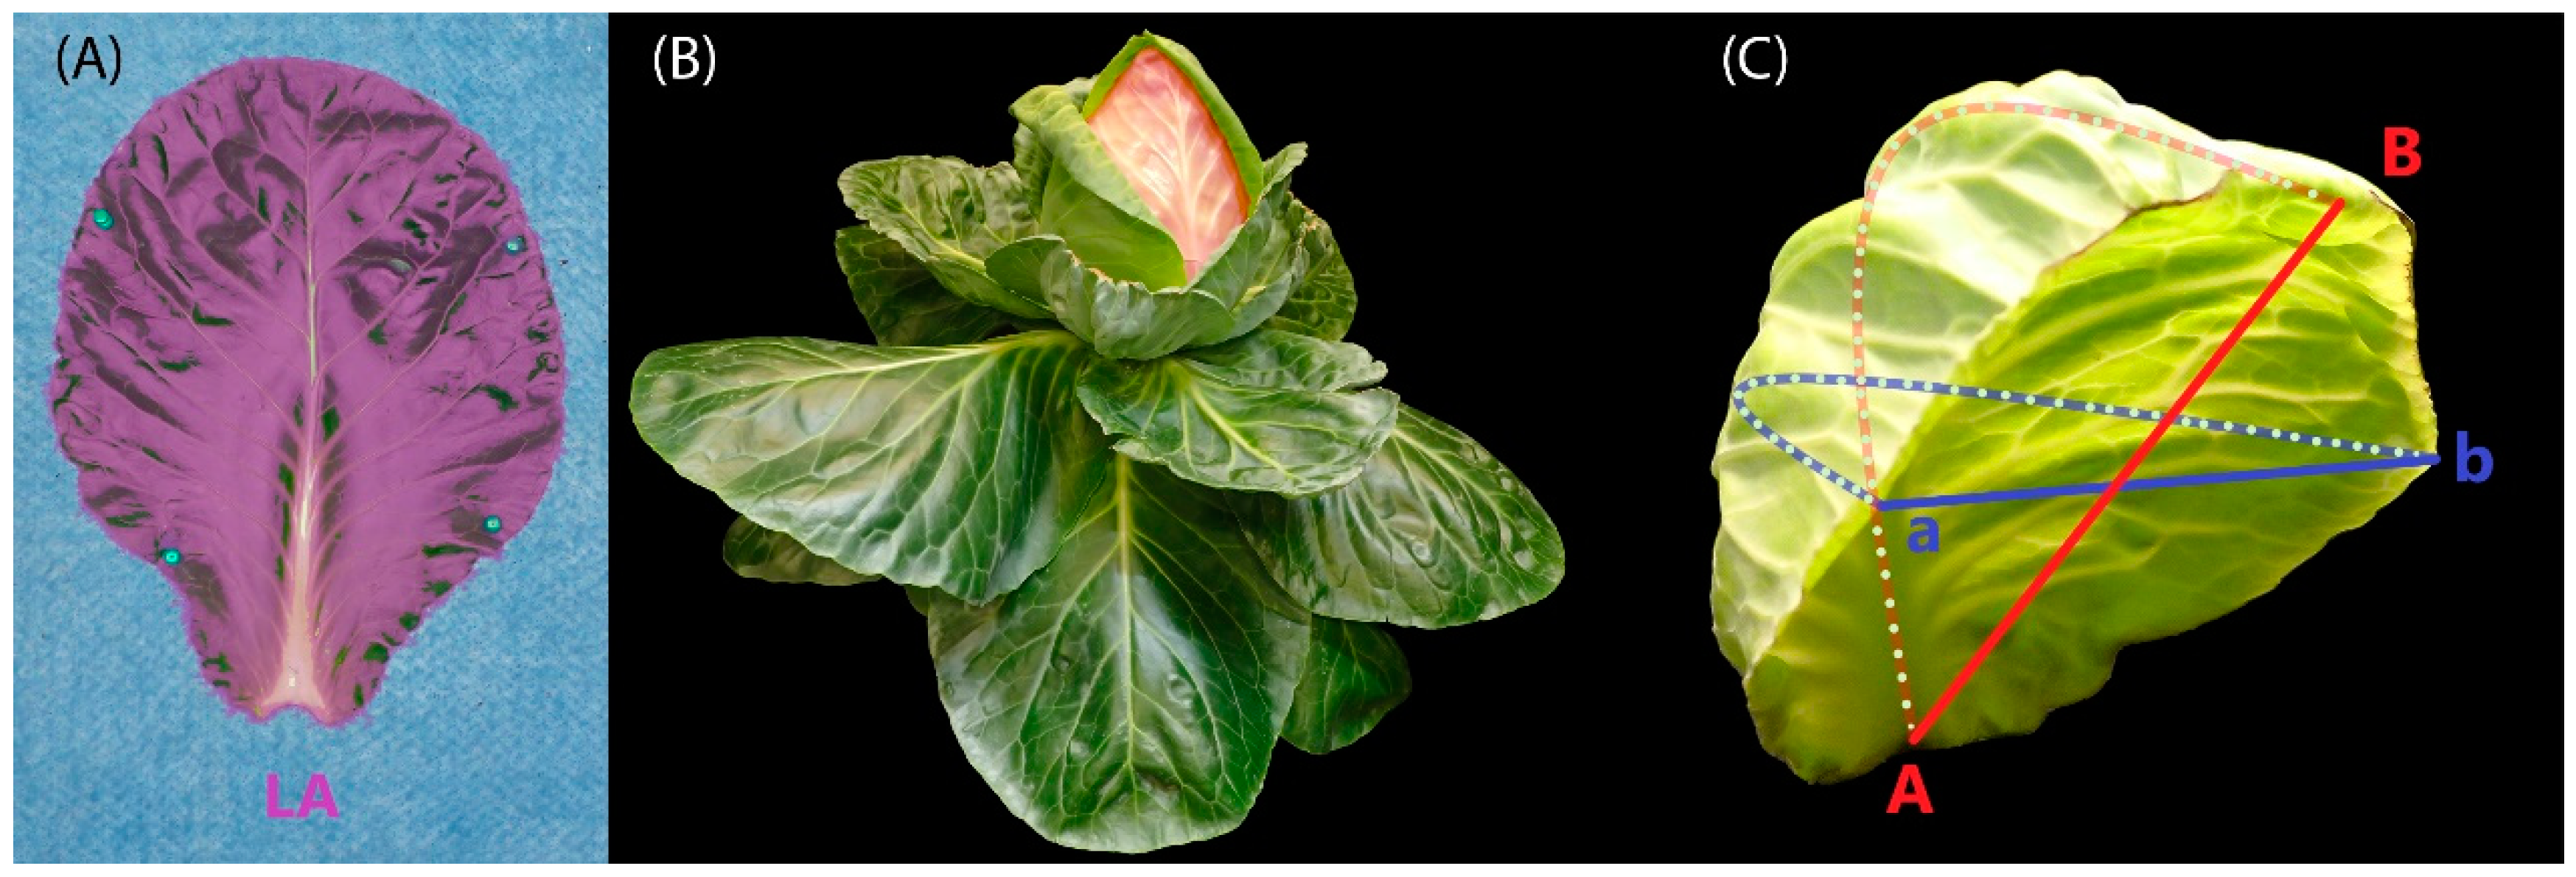
Figure 3.
Plants and leaves of both round- and pointed cabbage and collard green at four developmental stages. (A) Overview of round and pointed cabbage development process from the top and side view. Collard green was recorded as control only from the side view. Photos were taken once a week. Leaf numbers of the plants at each time point were put under the side-view photos. The separation of different developmental stages is indicated by the grey blocks: seedling, rosette, folding and heading stages. DAS=Days After Sowing. Scale bars represent 11cm. (B) All leaves from round cabbage, pointed cabbage and collard green plants were harvested 77 DAS. The leaf numbers are under the photos. The lines under the leaf numbers represent leaves of different developmental stages: red (seedling stage), blue (rosette stage), yellow (folding stage) and green (heading stage).
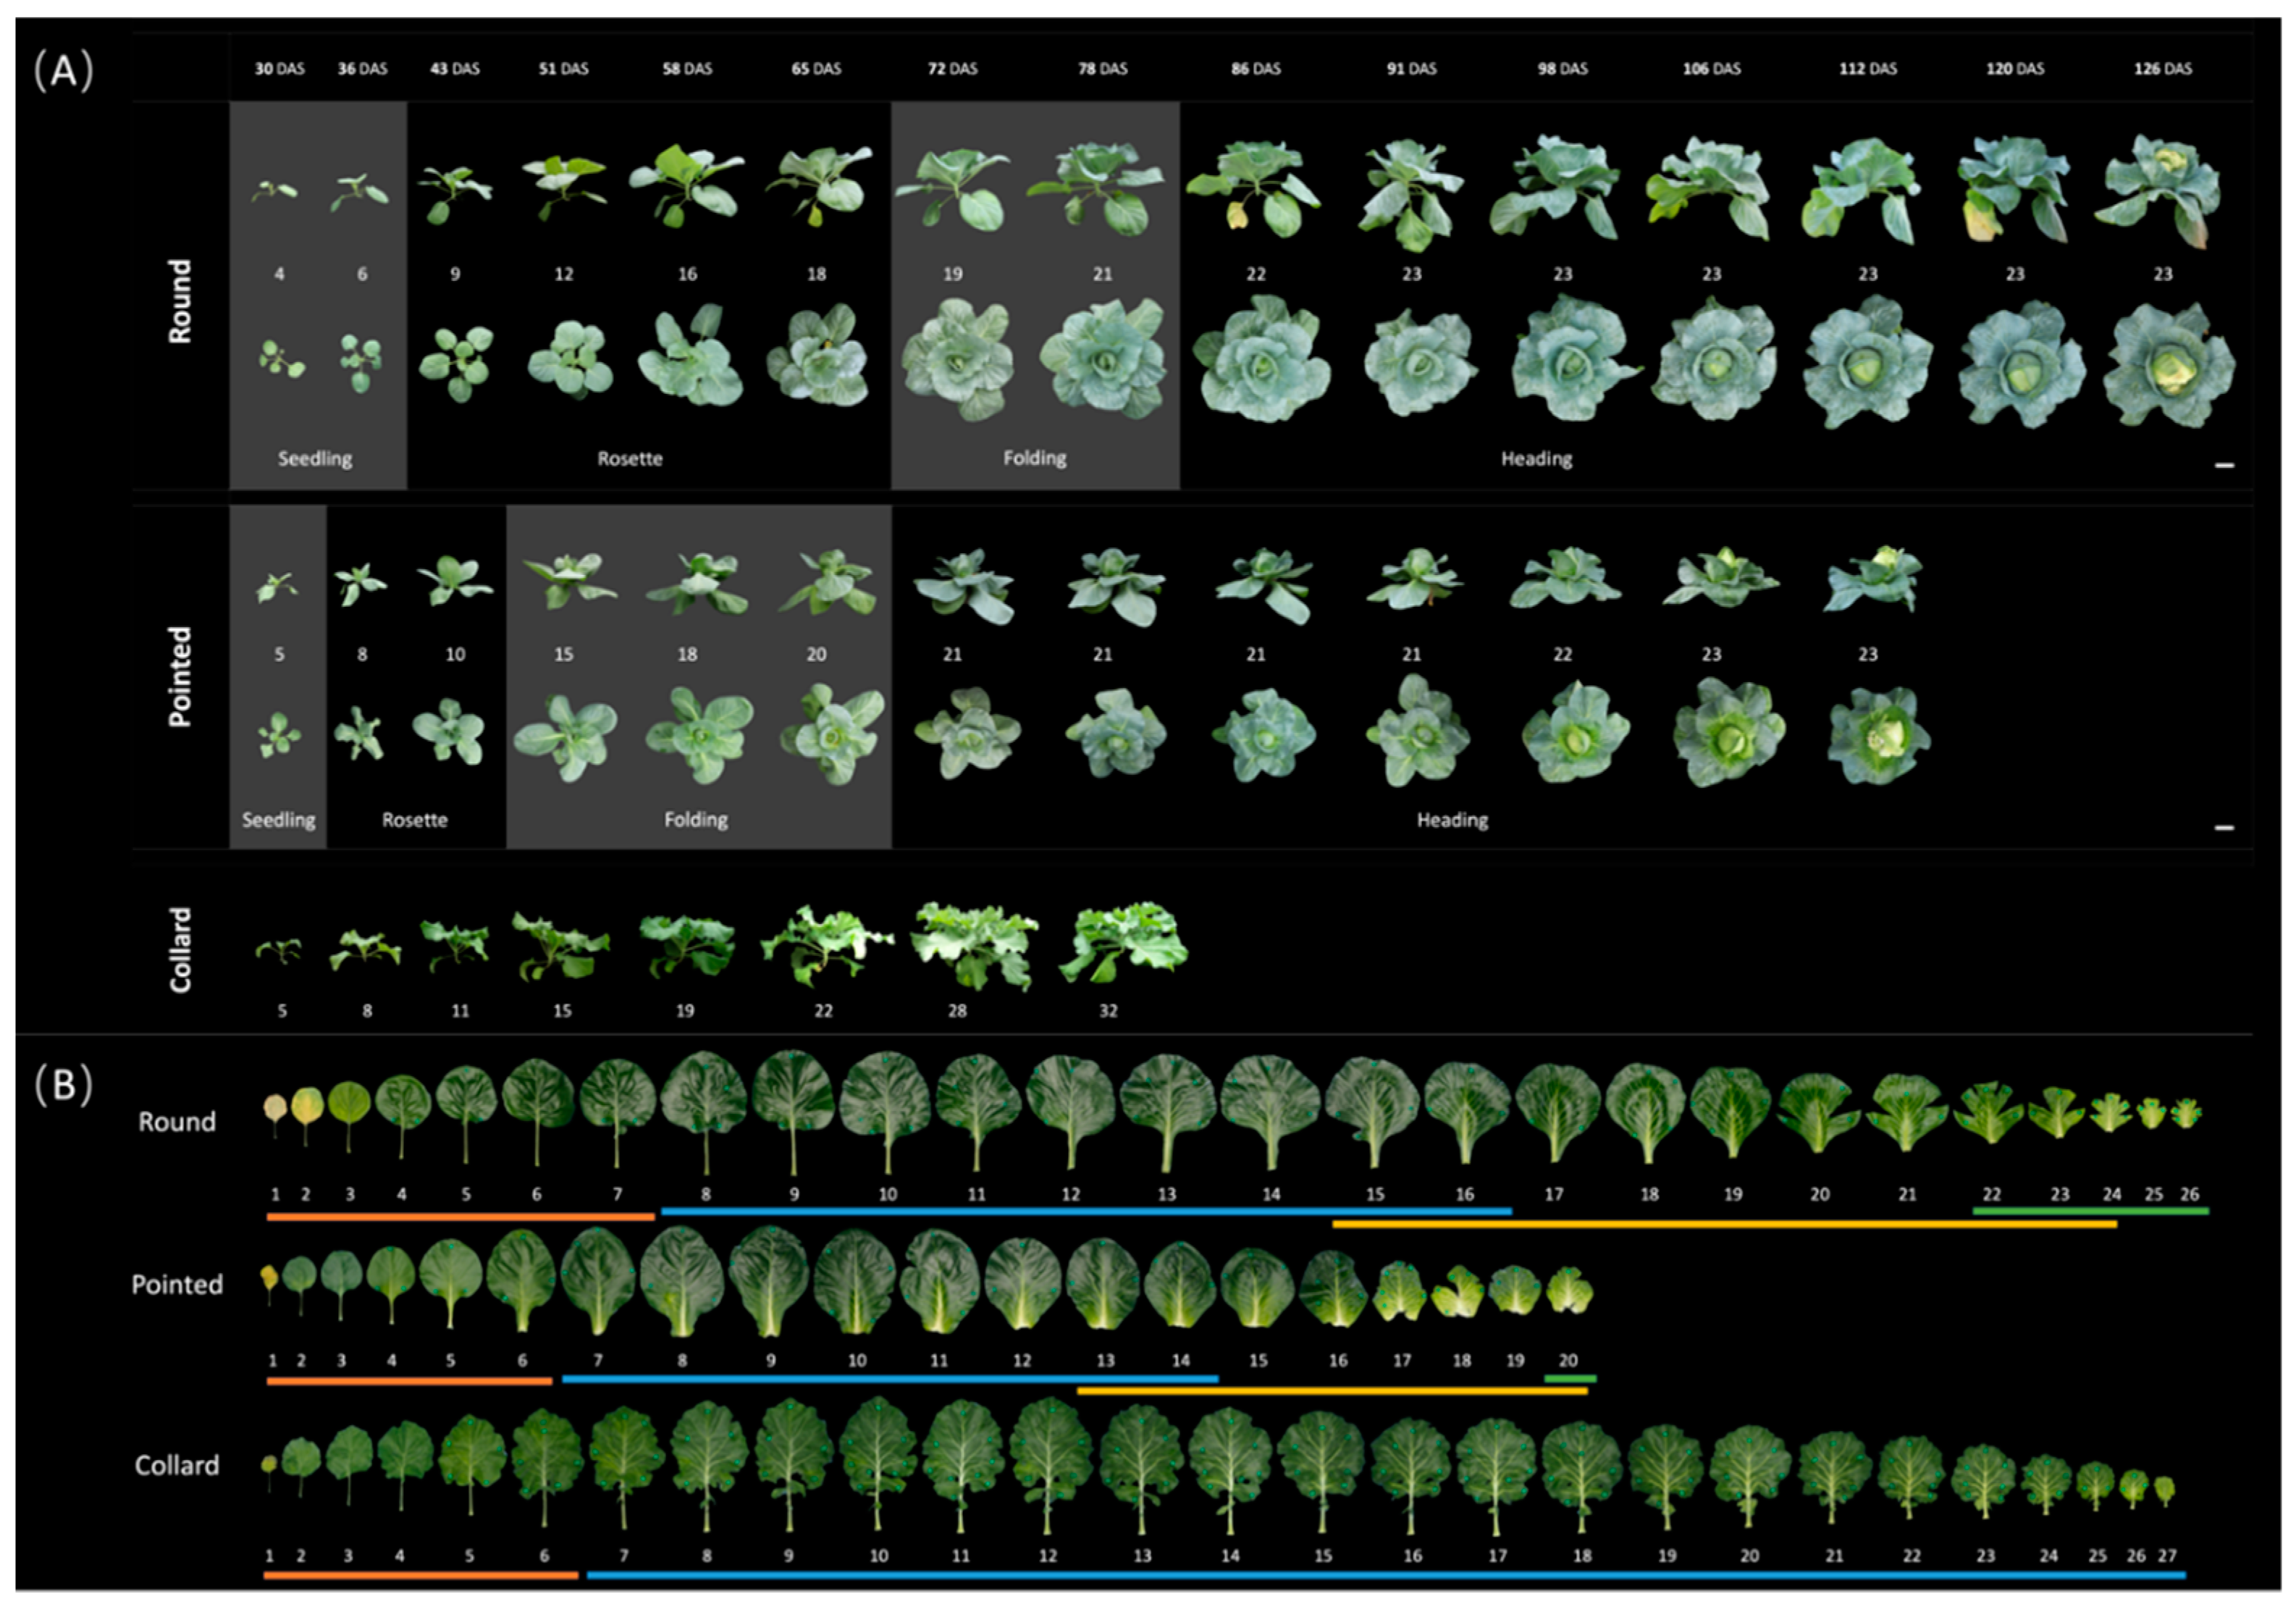
Figure 4.
Description of leaf area and leaf curvature. (A) Leaf area from round cabbage, pointed cabbage and collard green plants at different DAS. The stars indicate the number of the sampled leaves for leaf shape analysis. The bars under each figure represent developmental stages: red (seedling stage), blue (rosette stage), yellow (folding stage) and green (heading stage). (B) Assessment of the curvature of leaves from round and pointed cabbage plants at 70 DAS. The red dashed line represents the ratio mean equal to 1.0, which means the leaf is flat. The stars indicate the number of sampled leaves for the histological study.
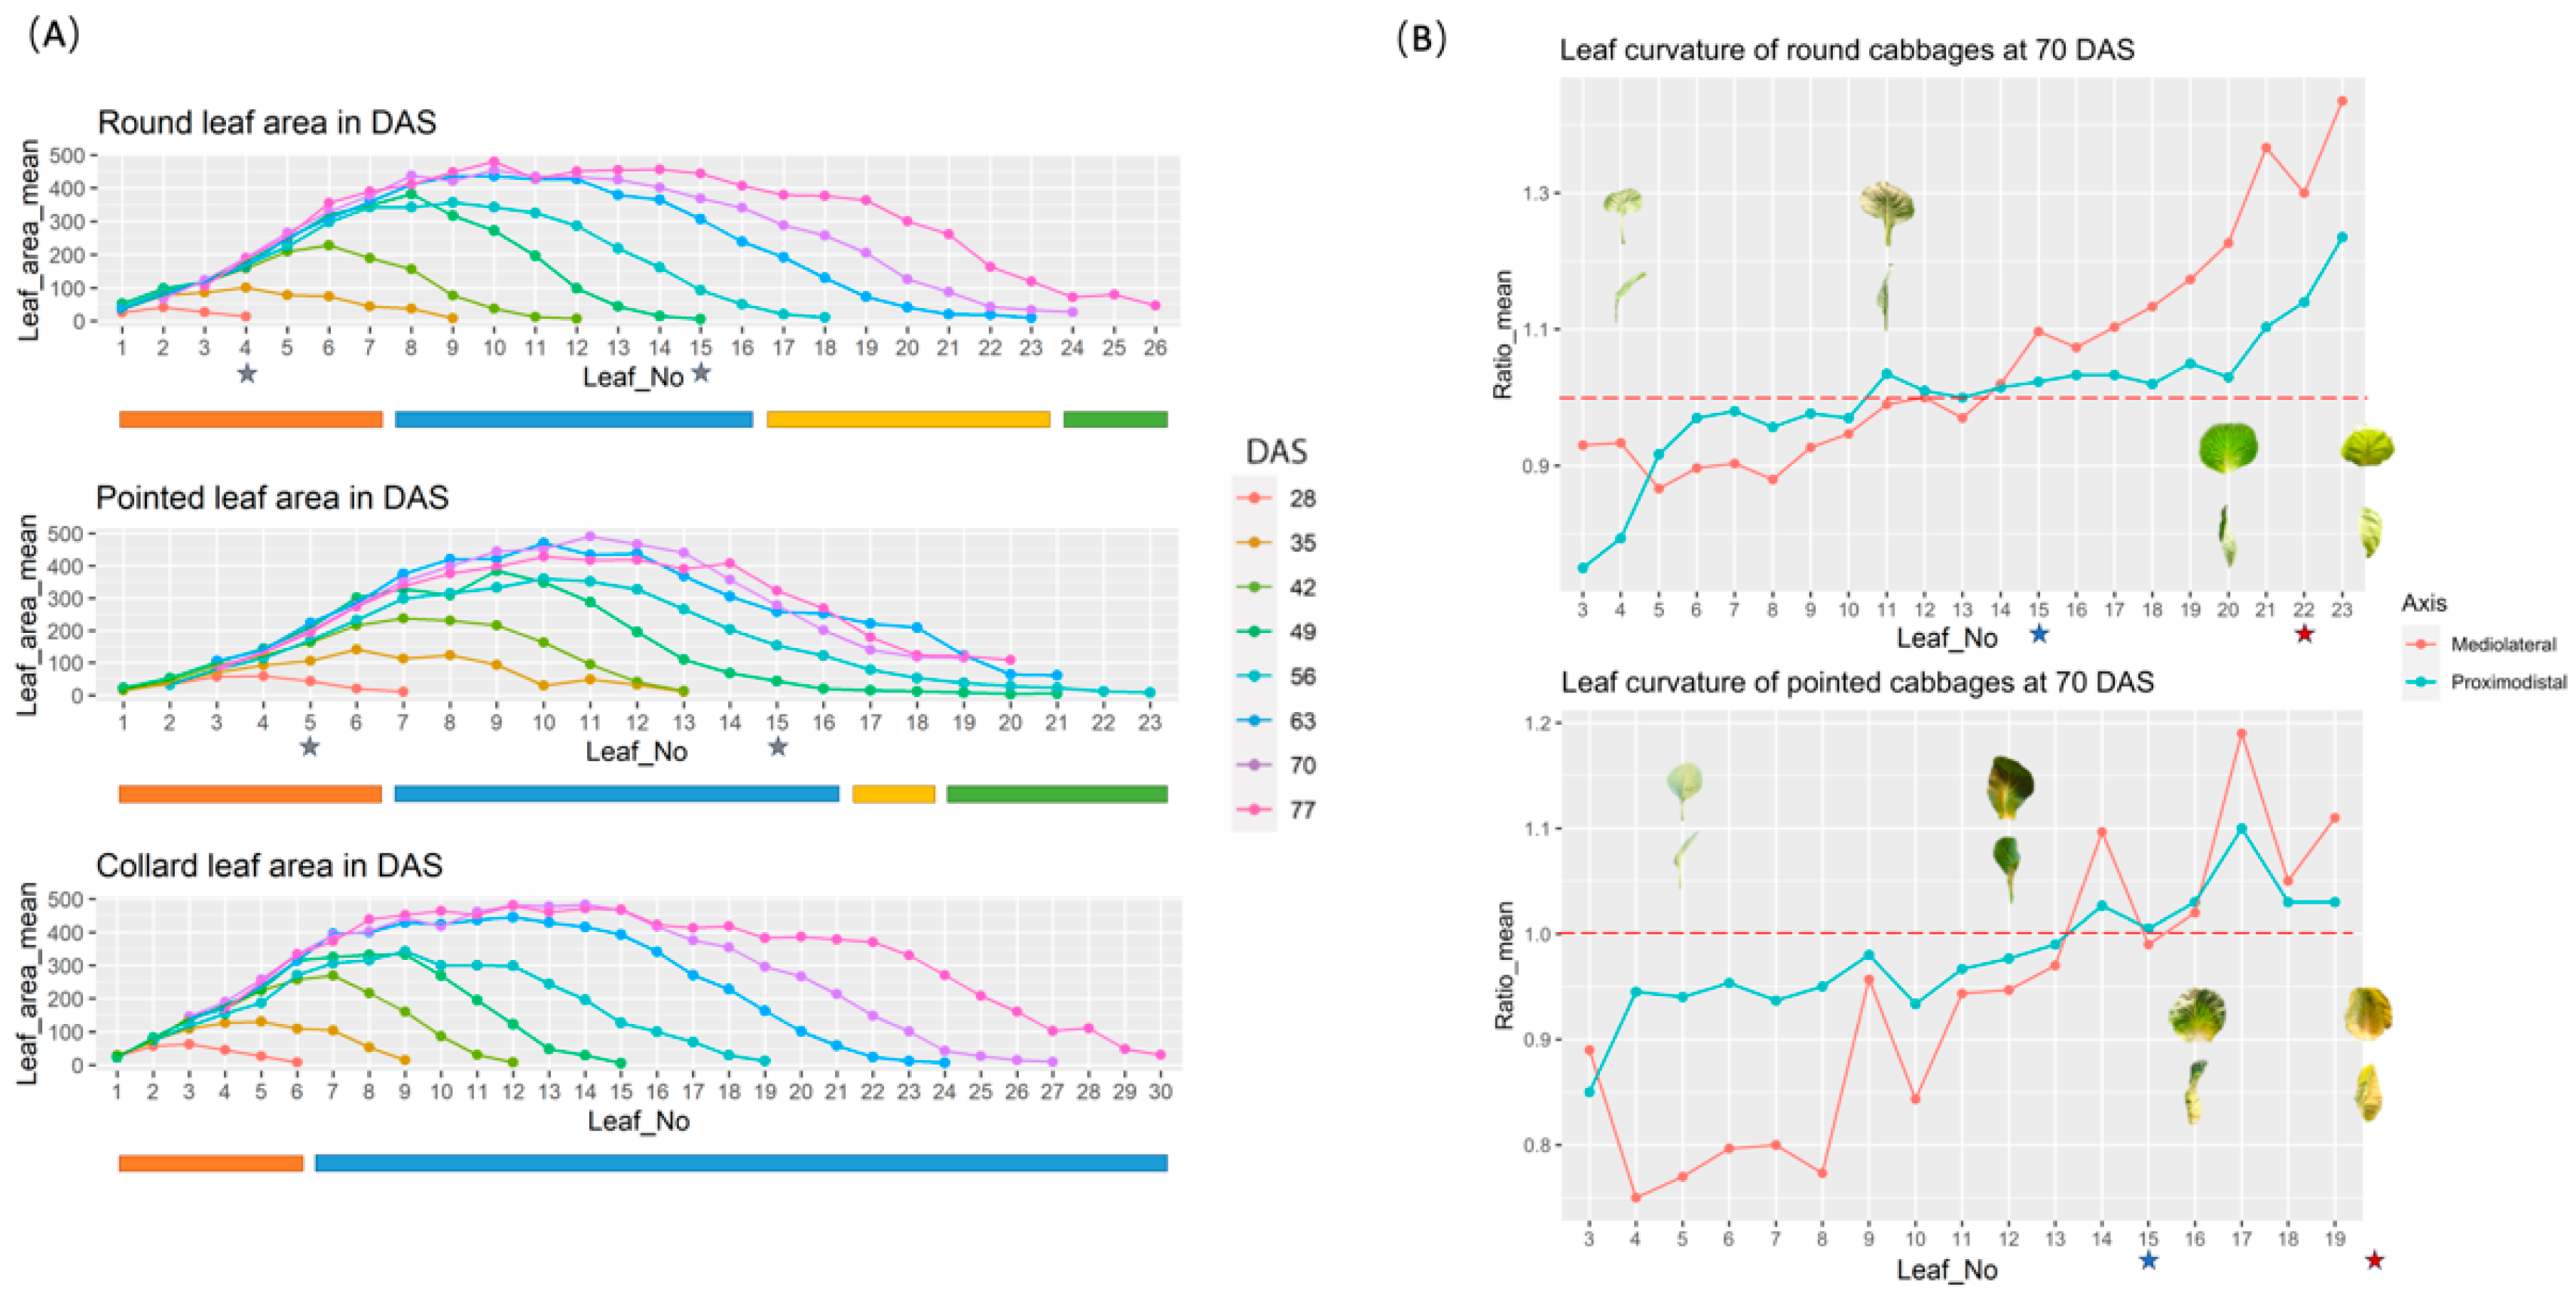
Figure 5.
Description of leaf shape of round and pointed cabbages. (A) Changes in leaf index of the seedling, rosette, and folding leaves over time. (B) Changes in leaf shape index of the seedling, rosette, and folding leaves over time. (C) Leaf shape simulation diagram based on the values from (A) and (B). The red lines indicate the position of the medio-lateral axis at the middle of the proximo-distal axis (leaf shape index=1.0). The red number means the leaf shape index is larger than 1.0, while the blue number means it is smaller than 1.0.
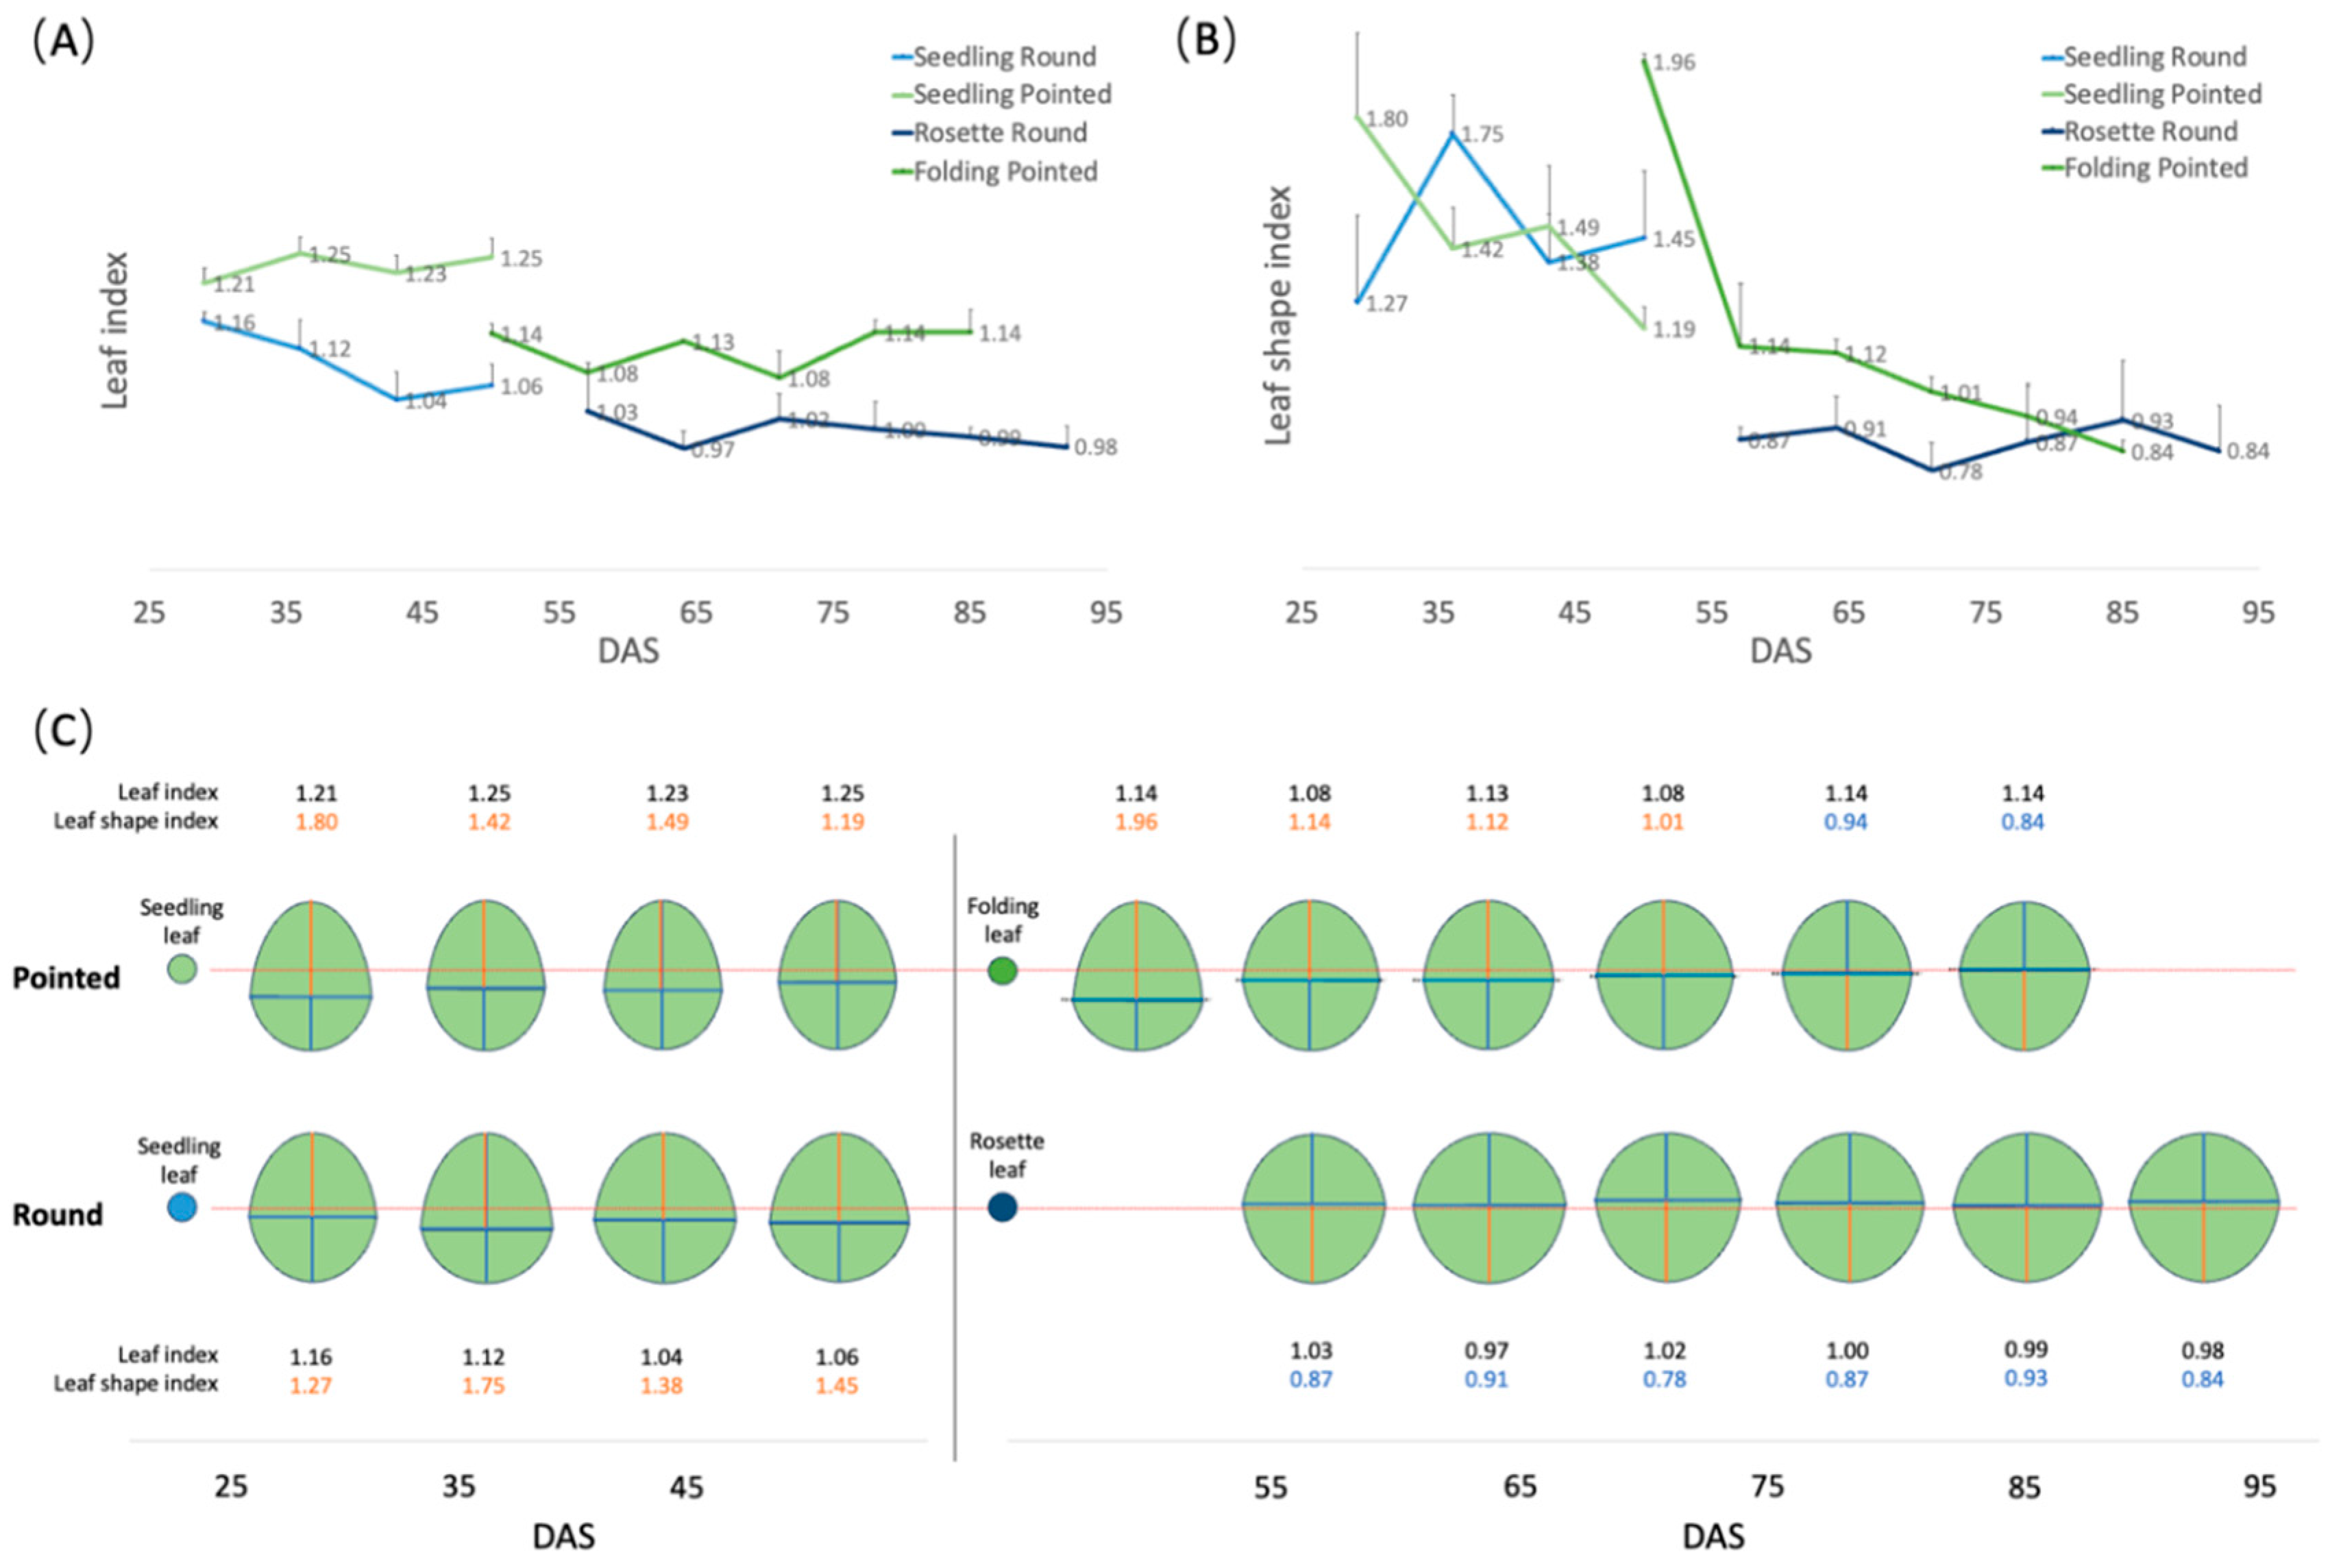
Figure 6.
Leaf transverse sections of round and pointed cabbages. Leaf tissue from the rosette and heading leaves of round cabbage and the folding and heading leaves of pointed were collected from five positions: tip, mid, base, mid-lateral and lateral. Leaf tissue was collected at two time points (T1 and T2), separated by four weeks. The green leaves represent the size of the leaf at the corresponding time point. The scale bar for leaf size represents 5cm, and for leaf transverse sections represents 200μm.
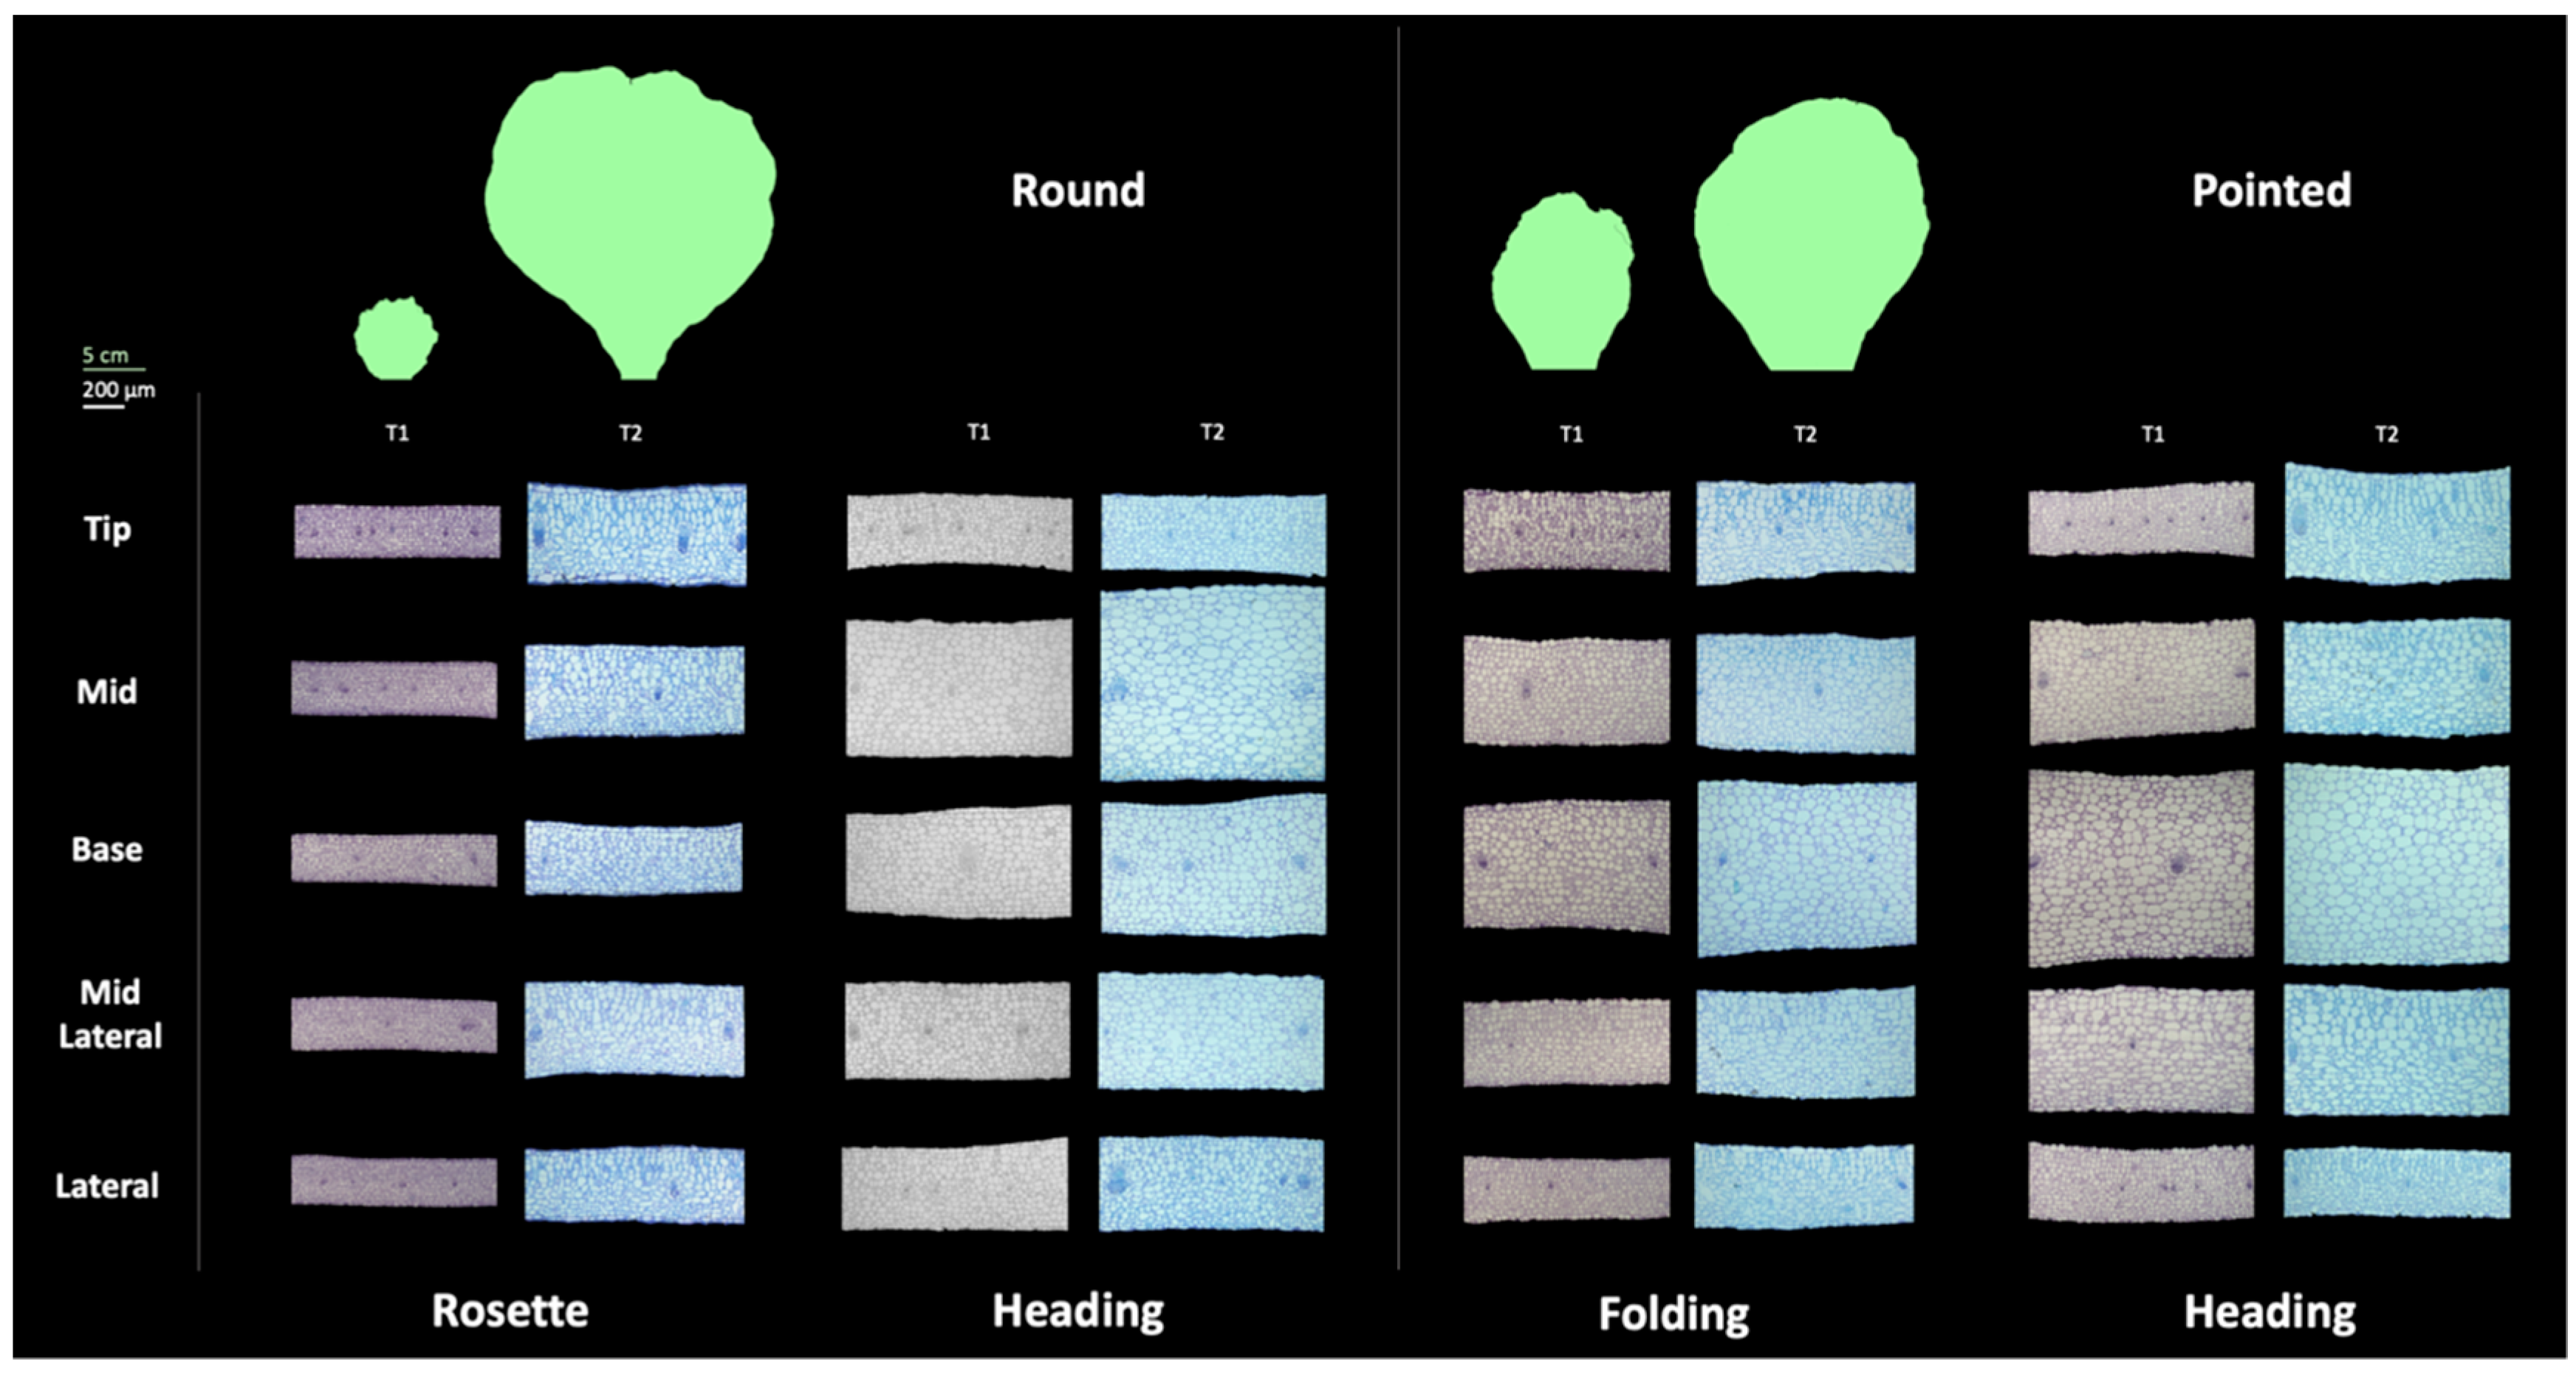
Figure 7.
Stacked bar charts of leaf histological traits for round cabbage rosette, heading leaves, and pointed cabbage heading leaf at T2. In each group of the four bars, the bars represent tissue thickness, average single cell area, cell number per 125600μm2, and cell density from left to right, respectively. The orange bar chart on the left represents the mean of the five leaf positions. The green bar charts represent the data corresponding to the five leaf positions. The top layer of the bars represents the data of palisade tissue, while the lower layer represents the data of spongy tissue. The letters under the green bars represent the groups of Least Significance Difference (LSD) with one-way ANOVA comparing specific traits across positions, with the upper letter for the data of palisade tissue, and the lower letter the data of spongy tissue. The scale bars represent 200μm.
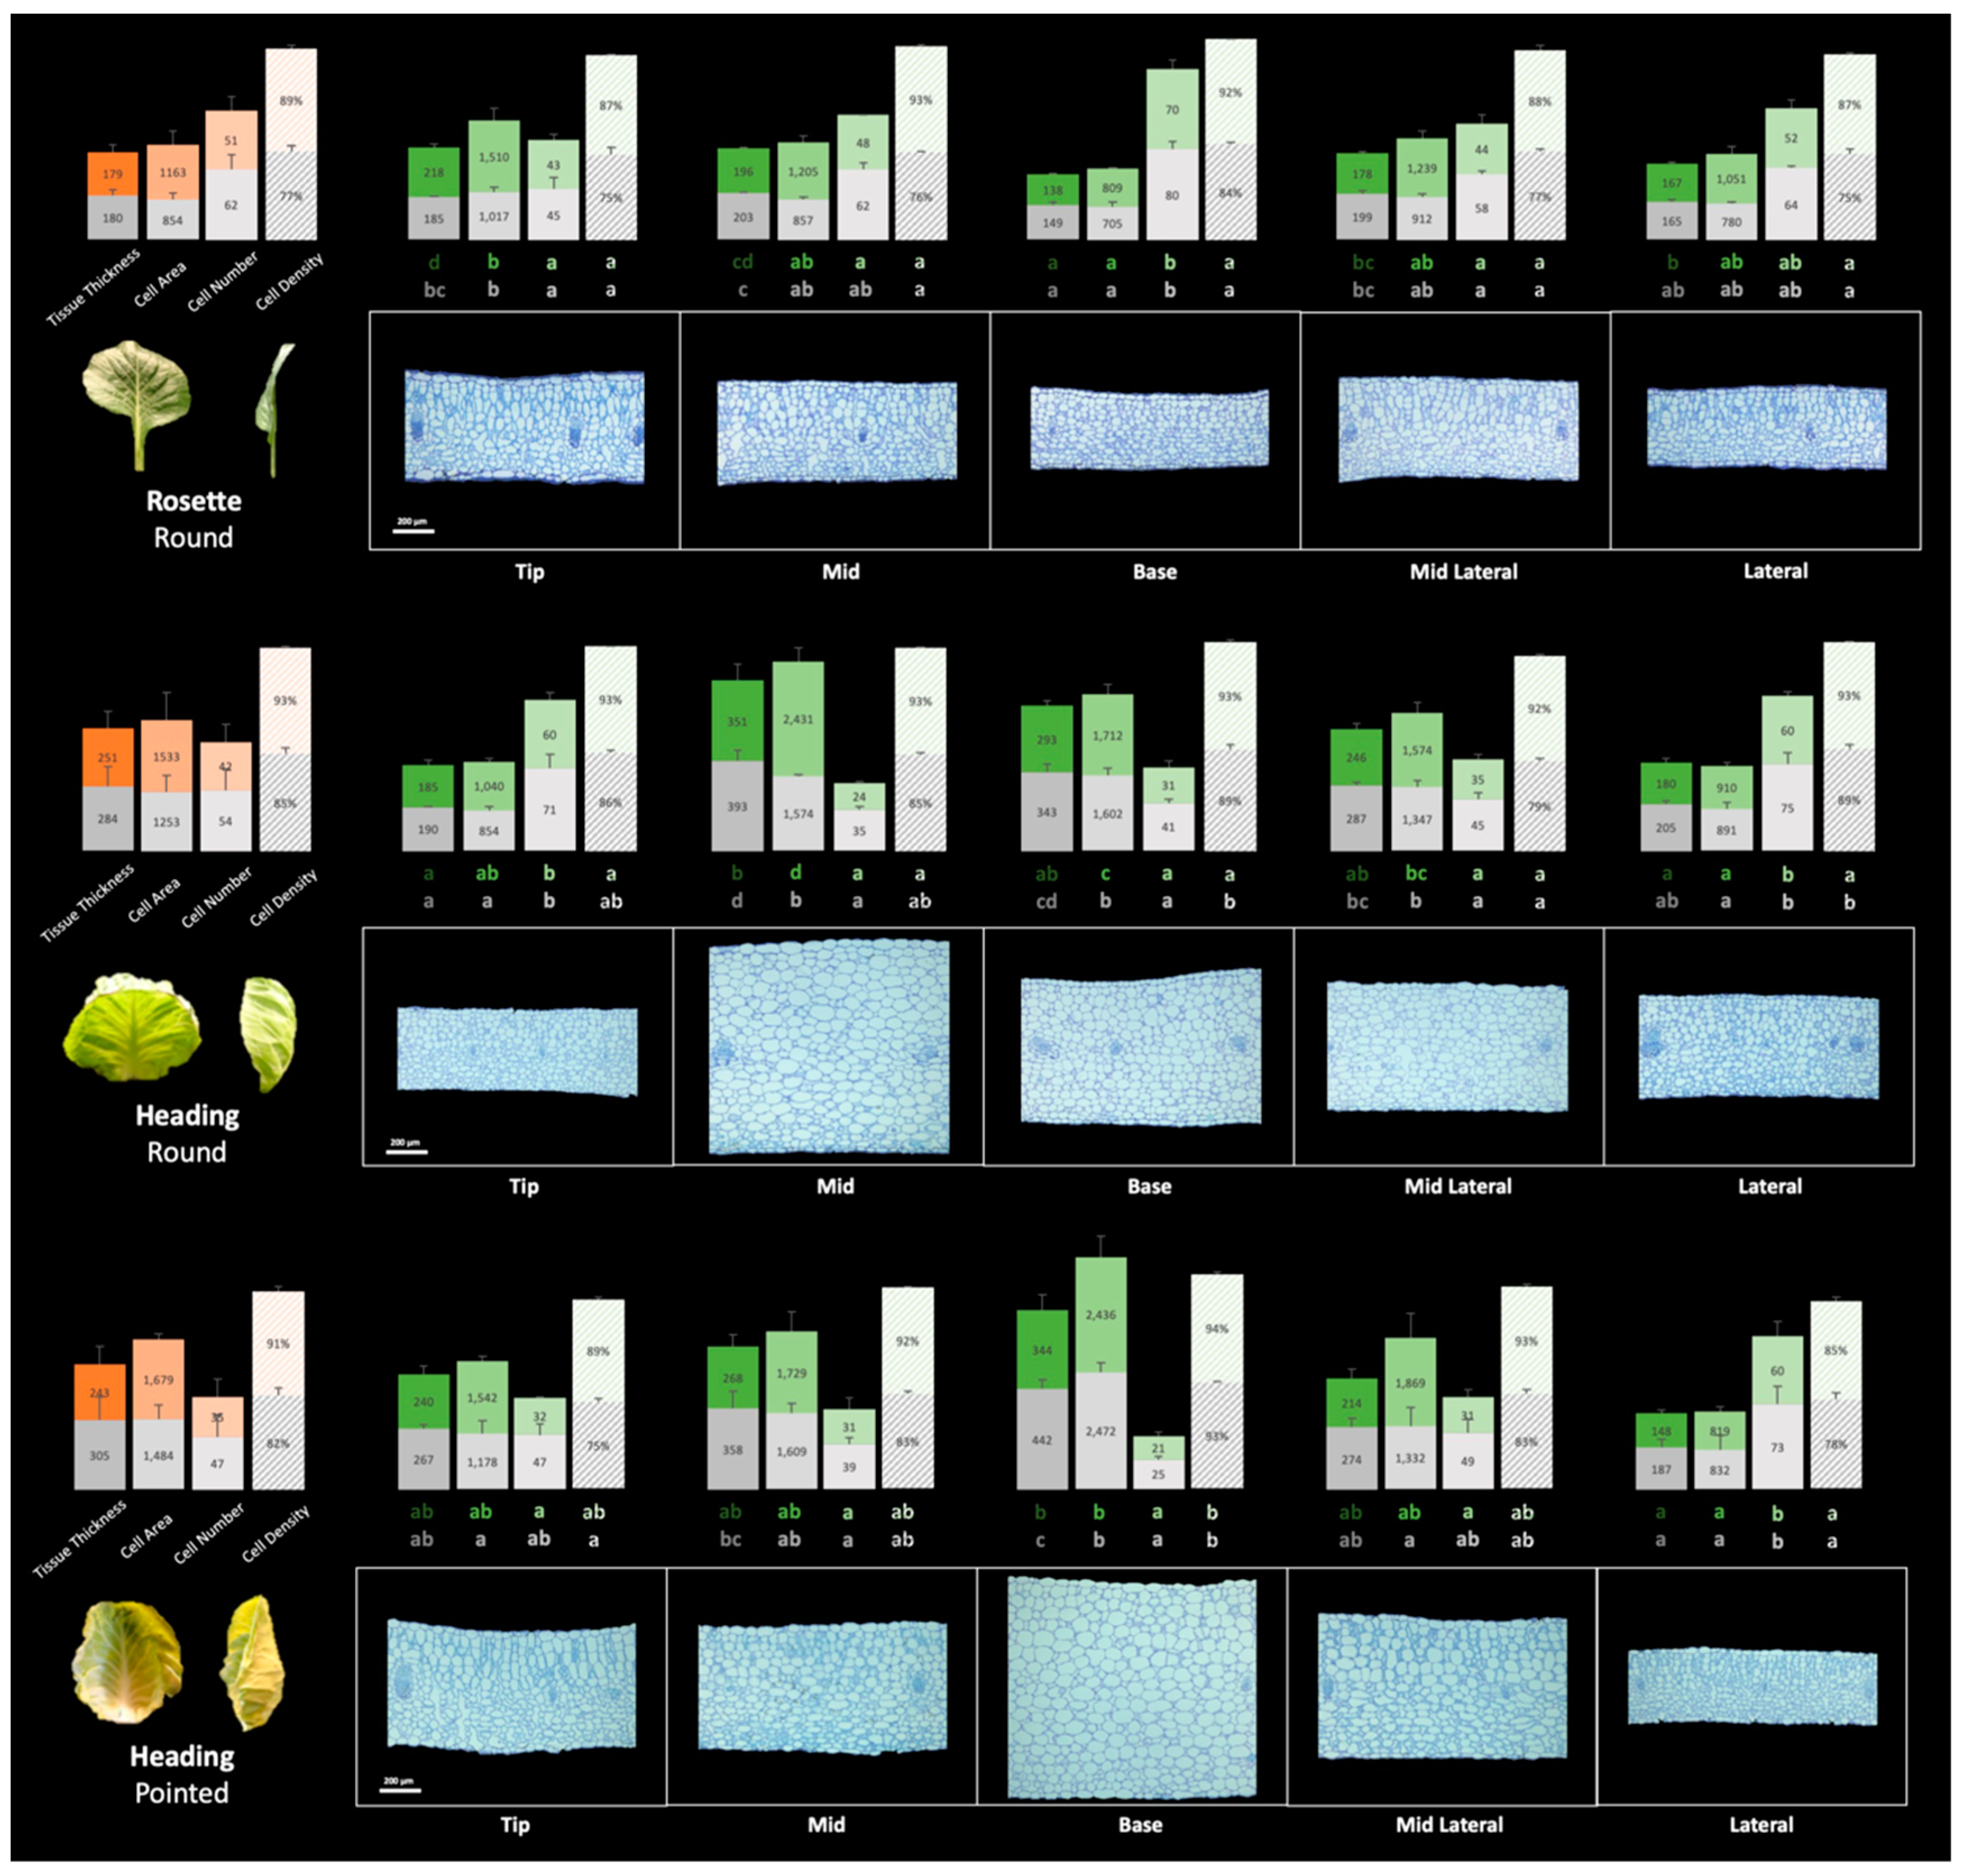
Figure 8.
Shoot apical meristem (SAM) transverse sections of round and pointed cabbages at rosette and heading stages. At the rosette stage, SAMs were harvested at 57 DAS (round cabbage) and 43 DAS (pointed cabbage). At the heading stage, SAMs were harvested at 127 DAS (round cabbage) and 99 DAS (pointed cabbage). The angle of the developing vascular strands of the SAM is illustrated on the right side of the figure.
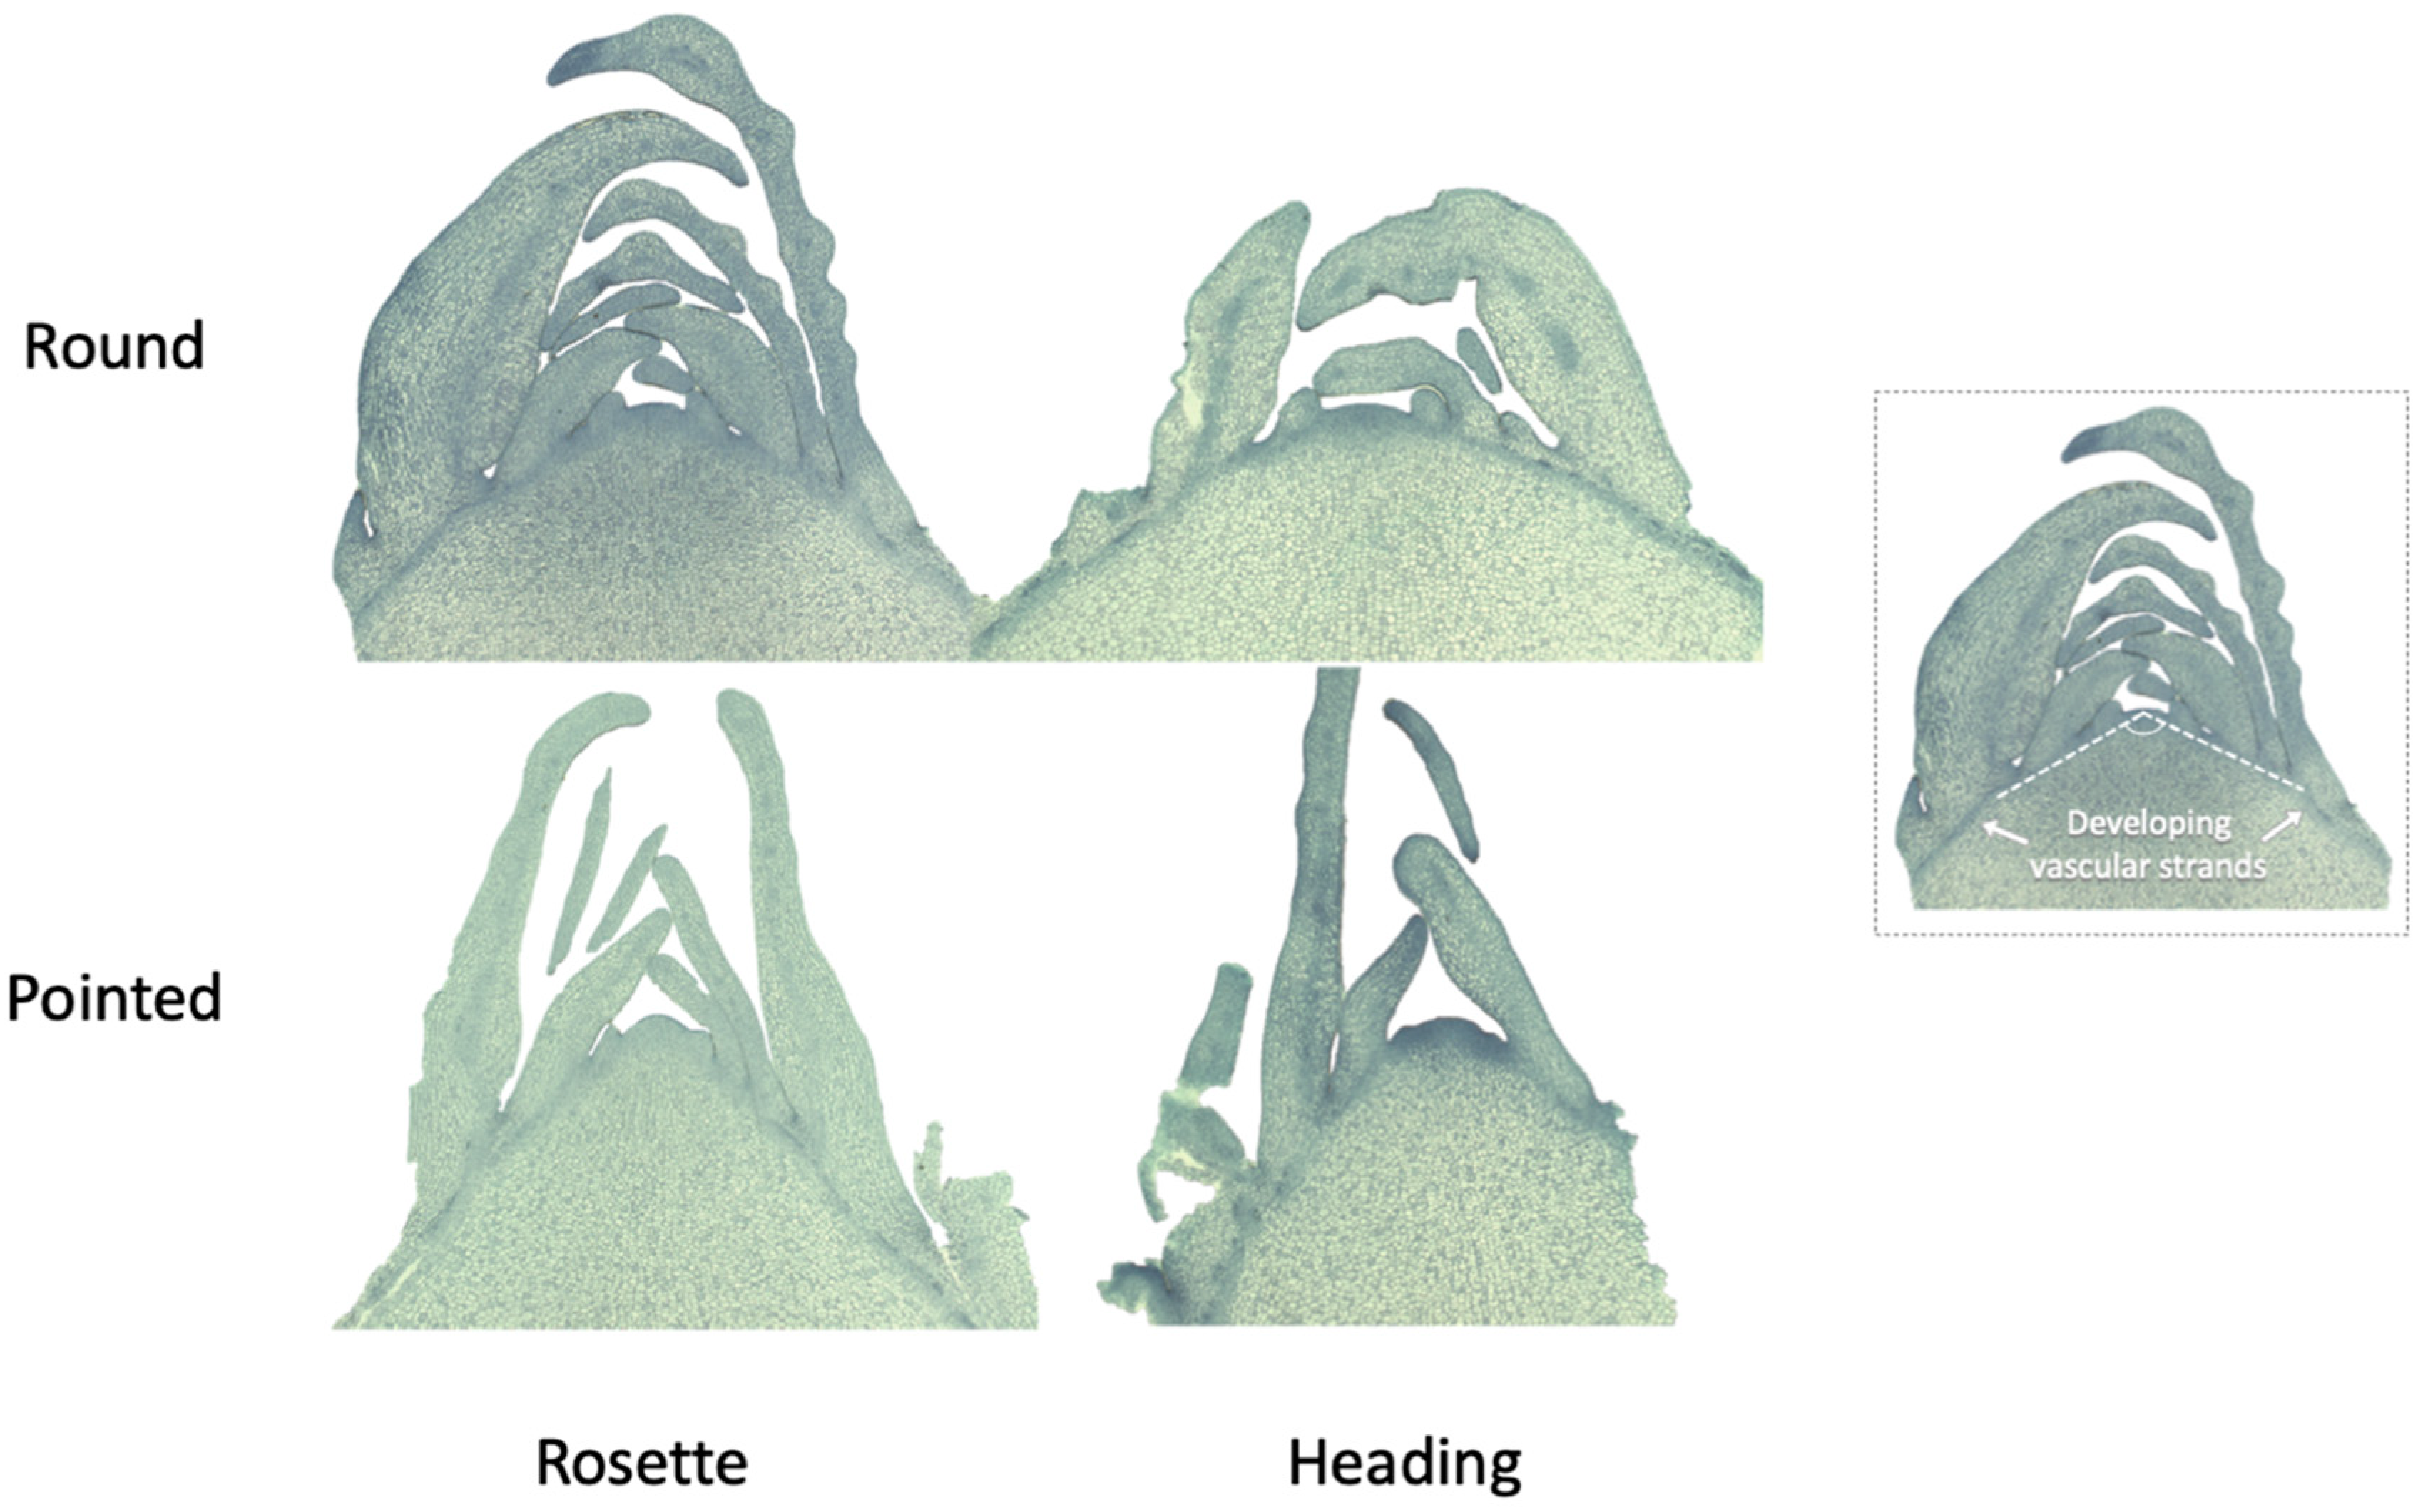
Figure 9.
Cellular pathways regulate the formation of inward-curving leaves.
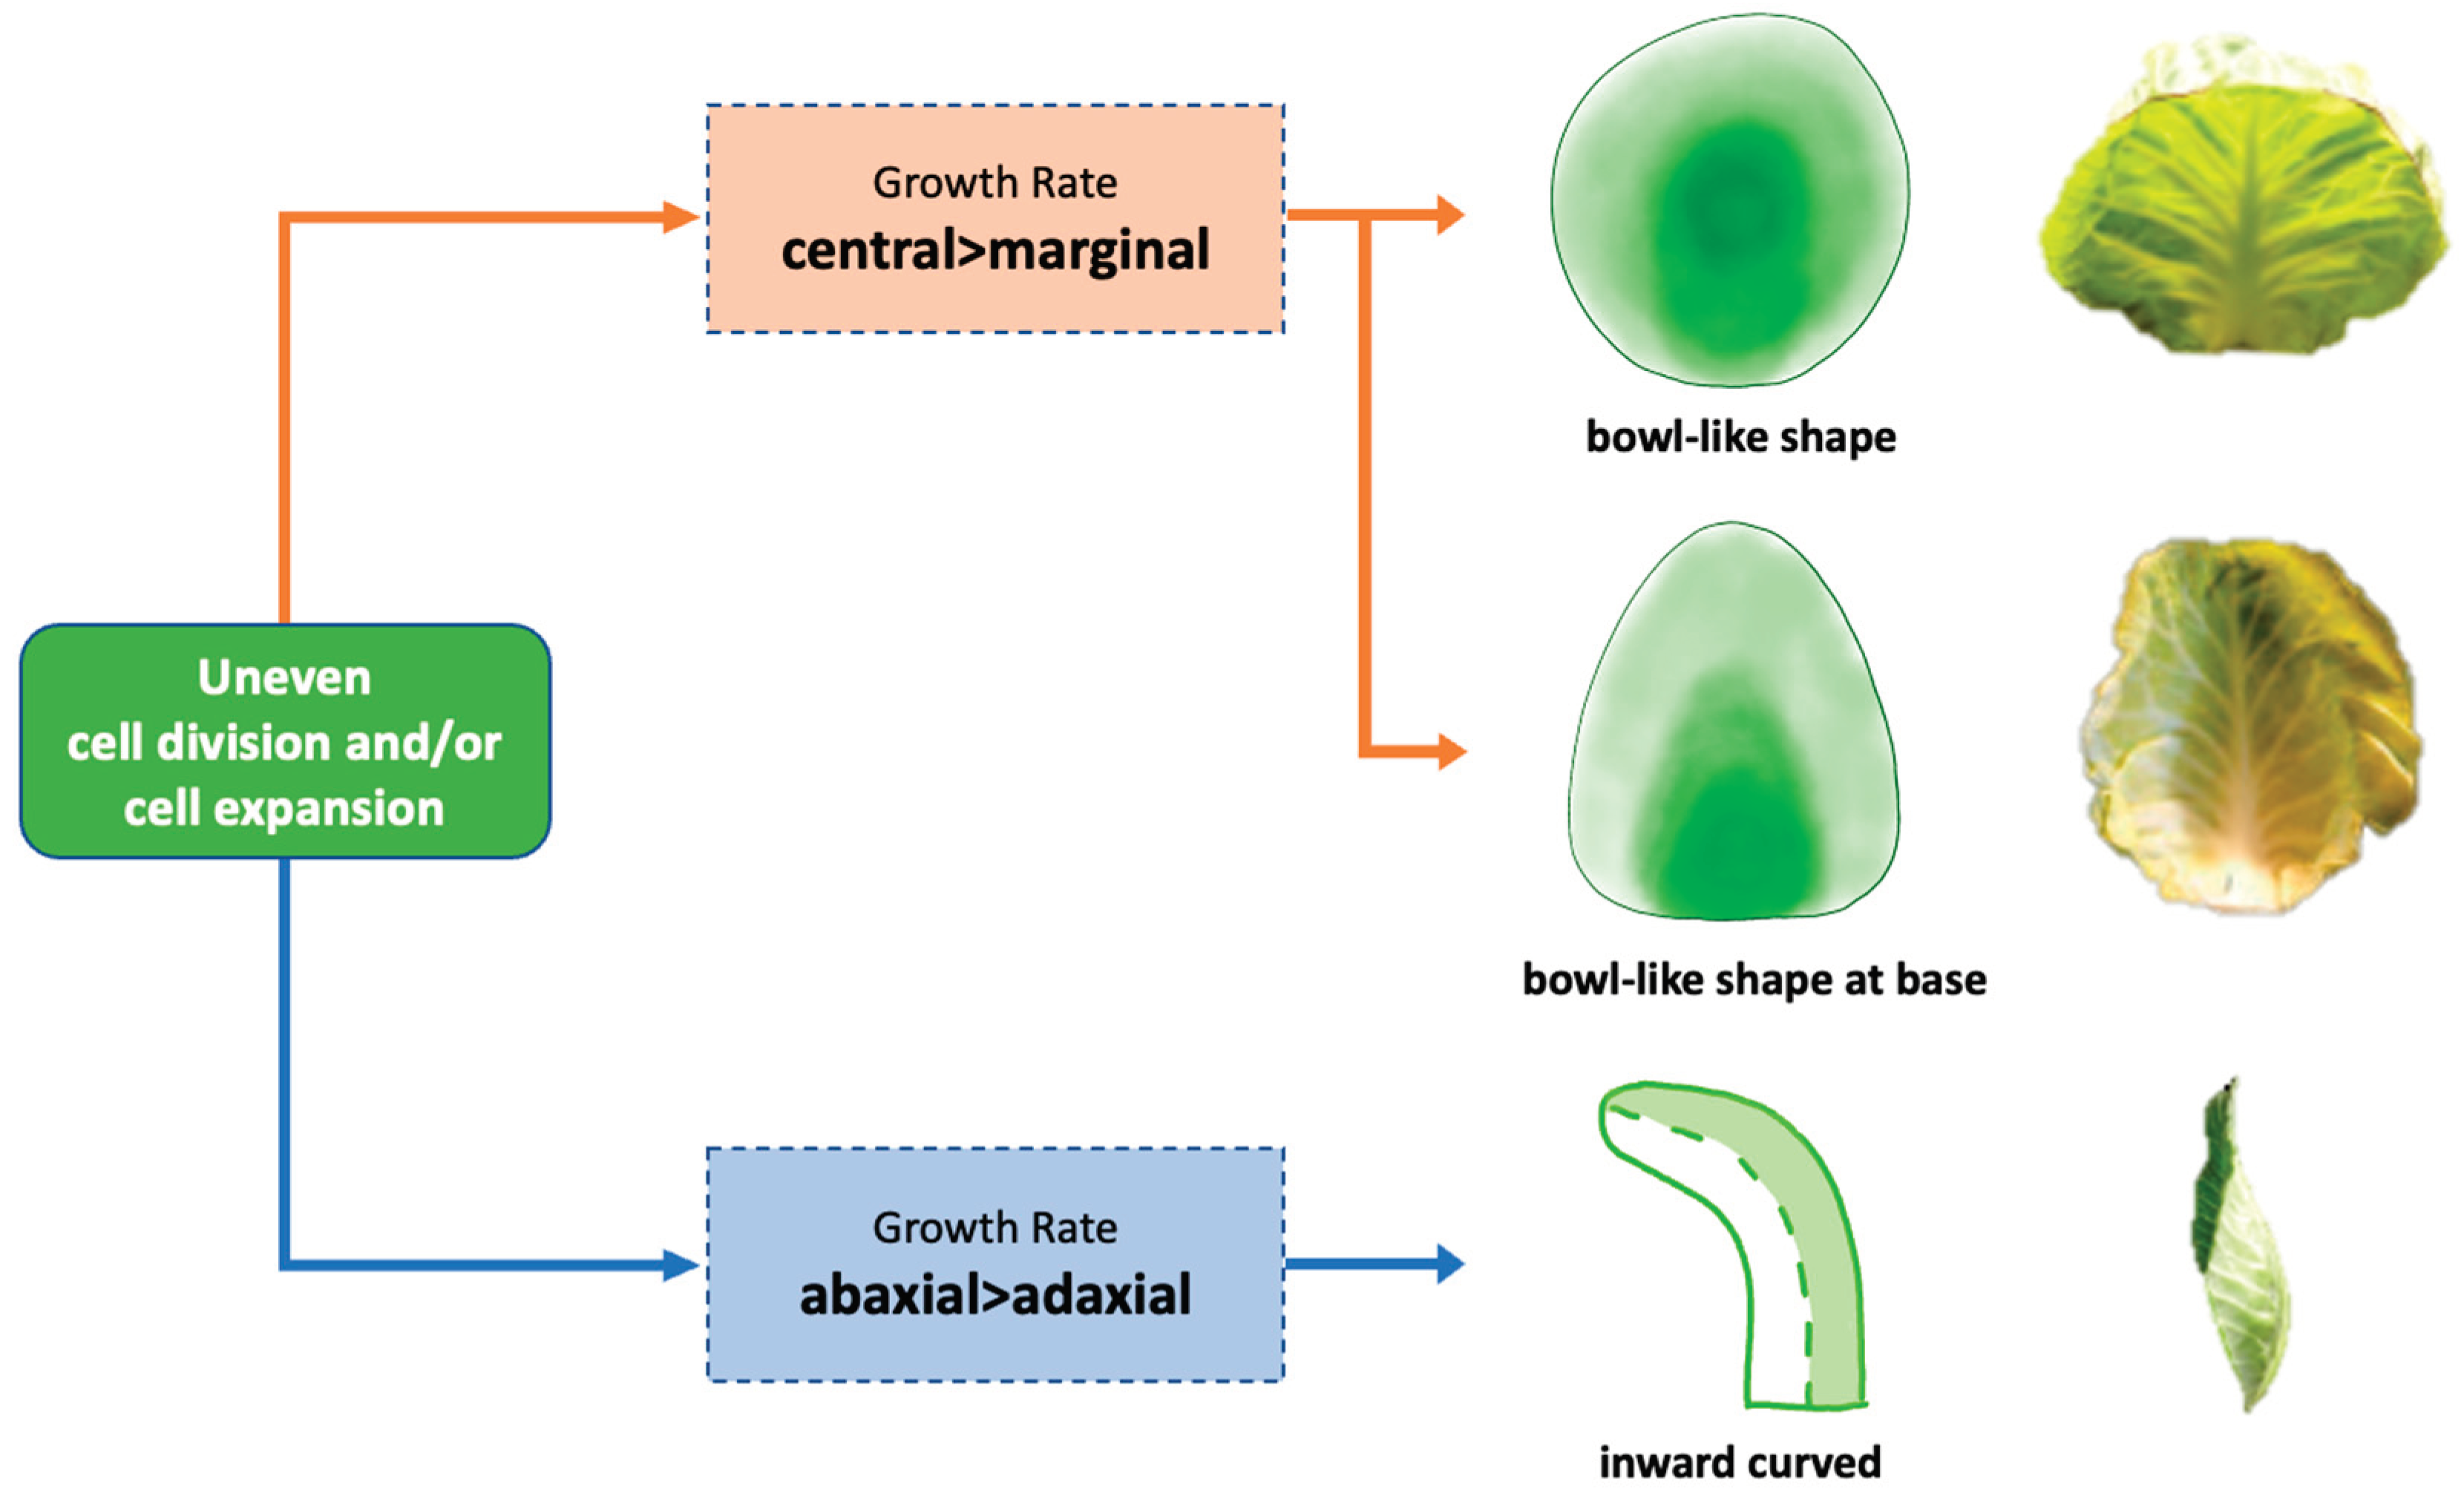

Table 1.
Description of the experiments conducted. DAS = Days after sowing.
| Sowing date | Plants in total | Plants utilized in the experiment | Type of experiment | Experiment | Morphotypes | Material scored | Scoring timepoints (DAS) | Traits scored |
|---|---|---|---|---|---|---|---|---|
| March | 18 (2 cabbage morphotypes * 3 blocks * 3 plants) | 3 plants per morphotype (1 per block) | Non-destructive | Whole plant development | Round- and pointed cabbage | Aerial part of cabbage plants | 30, 36, 43 51, 58, 65, 72, 78, 86, 91, 98, 106, 112, 120 and 126 | Plant growth |
| Leaf development in planta | 4th leaf for round cabbage, 5th leaf for pointed cabbage | 29, 36, 43 and 50 | Leaf blade area, leaf index and leaf shape | |||||
| 15th leaf for round- and pointed cabbage | 50, 57, 64, 71, 78, 85 and 92 | |||||||
| 3 plants per morphotype (1 per block) | Histology of leaves | Round cabbage | Leaves 15th, 15th, 15th | T1 = 57 and T2 = 85 | Leaf tissue from 5 positions (tip, mid, base, mid-lateral, and lateral) | |||
| Leaves 22nd, 22nd, 24th | T1 = 98 and T2 = 126 | |||||||
| Pointed cabbage | Leaves 15th, 15th, 17th | T1 = 57 and T2 = 85 | ||||||
| Leaves 17th, 21st, 22nd | T1 = 71 and T2 = 99 | |||||||
| August | 90 (3 morphotypes * 3 blocks * 10 plants) | 3 plants per timepoint per morphotype (1 per block) | Destructive | Leaf morphology and development | Round- and pointed cabbage and collard | Leaves | 28, 35, 42, 49, 56, 63, 70, and 77 | Total number of leaves and their leaf area |
| Round- and pointed cabbage | Leaf blade | 70 | Leaf curvature | |||||
| Leafy head | - | First heading leaf |
Table 2.
Duration and leaf numbers of the four developmental stages of round and pointed cabbages.
| Round (Excalibur hybrid variety) | Stages | Seedling | Rosette | Folding | Heading |
| DAS | ~10 to ~38 | ~38 to ~60 | ~60 to ~70 (latest 84) | ~70 to cracking | |
| Duration (days) | ~28 | ~22 | ~10 | > 56 | |
| Leaf number | 1st to 7th | 8th to ~15th | ~16th to ~23rd (latest 24th) | ~24th to … | |
| Pointed (Sonsma hybrid variety) | DAS | ~8 to ~33 | ~33 to ~48 | ~48 to ~56 (latest 84) | ~56 to cracking |
| Duration (days) | ~25 | ~15 | ~8 | > 56 | |
| Leaf number | 1st to 6th | 7th to ~14th | ~15th to ~17th (latest 21st) | ~18th to … |
Table 3.
The difference between heading and rosette leaves in the ratio of palisade-to-spongy parenchyma (P/S) for the cellular parameters at both T1 and T2, and the ratio of the change in palisade to the change in spongy parenchyma from T1 to T2 (∆P/∆S = (PT2-PT1)/(ST2-ST1)). The original data for each biological replicate are provided in Table S7.
 Rosette Round |
P/S (T1) | P/S (T2) | ∆P/∆S | |
| Tissue Thickness | 1.00 | 1.00 | 1.00 | |
| Single Cell Area | 1.02 | 1.36 | 1.48 | |
| Cell Density | 1.02 | 1.15 | -0.24 | |
 Heading Round |
P/S (T1) | P/S (T2) | ∆P/∆S | |
| Tissue Thickness | 0.88 | 0.86 | 0.79 | |
| Single Cell Area | 1.23 | 1.21 | 1.17 | |
| Cell Density | 1.05 | 1.08 | 0.46 | |
 Heading Pointed |
P/S (T1) | P/S (T2) | ∆P/∆S | |
| Tissue Thickness | 0.79 | 0.79 | 0.74 | |
| Single Cell Area | 1.03 | 1.13 | 1.41 | |
| Cell Density | 1.06 | 1.10 | 0.50 |
Disclaimer/Publisher’s Note: The statements, opinions and data contained in all publications are solely those of the individual author(s) and contributor(s) and not of MDPI and/or the editor(s). MDPI and/or the editor(s) disclaim responsibility for any injury to people or property resulting from any ideas, methods, instructions or products referred to in the content. |
© 2024 by the authors. Licensee MDPI, Basel, Switzerland. This article is an open access article distributed under the terms and conditions of the Creative Commons Attribution (CC BY) license (http://creativecommons.org/licenses/by/4.0/).
Copyright: This open access article is published under a Creative Commons CC BY 4.0 license, which permit the free download, distribution, and reuse, provided that the author and preprint are cited in any reuse.


