1. Introduction
The urgency to meet the reduction goals set by the Paris Accord is driving a global energy transition towards renewable and decentralized systems. This shift demands reevaluating energy system architecture, moving from centralized and continuous energy production to decentralized and intermittent energy conversion sites. Such a transition necessitates embracing large-scale intermittent renewable energy sources, fundamentally altering traditional energy system designs.
Energy systems vary nationally, reflecting geography, meteorology, demography, anthropology, and economic differences. These variations influence region-specific demands and renewable energy potentials, necessitating tailored approaches to energy system planning. Planning must account for regional disparities, strategically placing and operating specific technologies. Within this context, integrating decentralized prosumers with centralized energy systems becomes crucial.
Developing models that accurately capture the complexities of these varied energy systems presents a challenge—traditional modeling approaches, whether centralized or decentralized, have led to divergent outcomes. Centralized models, as highlighted by Schnidrig (2023) [
1], often prioritize wind and Photovoltaic (PV) technologies, utilizing a limited portion of the available solar potential. Conversely, decentralized models, like those proposed by Middelhauve (2022) [
2], advocate for a PV-dominant energy system that fully exploits solar potential. This discrepancy stems from differences in self-consumption patterns, the valuation of energy flows, and the scale of production and consumption units. Accurately reflecting these factors in models is essential for a realistic representation of energy systems and the successful implementation of energy transition strategies.
Moreover, existing models frequently overlook the connection between microstructural elements and macroscopic strategies, hindering a complete understanding of the energy system’s dynamics. A thorough exploration of self-consumption, local production capabilities, and the role of centralized systems is necessary to comprehend the impacts of various energy system actors.
In discussing energy system planning, this paper differentiates between the strategic implications of adopting centralized versus decentralized energy production and distribution approaches. The analysis explores how these approaches, as part of a comprehensive energy planning strategy, can complement each other to enhance the resilience and sustainability of the energy system rather than suggesting modifications to the models themselves. By emphasizing self-consumption, evaluating energy flow market values, considering the scale of production and consumption units, and recognizing the roles of different stakeholders, this research aims to offer insights into optimizing energy system planning. The goal is to develop a comprehensive framework that bridges micro-level details with overarching strategies, facilitating a nuanced understanding of energy systems conducive to achieving transition objectives.
2. State of the Art
2.1. Literature Review
Energy system modeling has evolved from primarily centralized approaches to increasingly incorporating the specifics of diverse regions. The significance of regional differentiation was underscored starting in the 1990s with meteorological distinctions [
3] and further advanced by the MERGE model, which considered the world in distinct regions for energy planning [
4].
Advancements in computational capabilities have enabled models to achieve greater granularity, moving from national and continental scales to detailed city and district levels. This detail is crucial for accurately capturing regional demand and resource availability, as demonstrated by Stadler et al. [
5], Clack et al. [
6], and Jensen et al. [
7].
The dynamics of interregional energy exchanges, especially concerning electricity and the integration of diverse energy sources, are pivotal. Studies by Dujardin et al. [
8] and Heide et al. [
9], along with investigations into hydrogen storage [
10], highlight the complexity of these energy flows.
On-site energy conversion systems, such as PV, can influence grid dynamics by reducing or increasing grid dependency. Luthander et al.’s review [
11] explores this balance, examining the integration of PV systems within building and district energy models.
The transition towards decentralized energy systems, characterized by enhanced resilience and efficiency, is gaining momentum. Research by Harb et al. [
12] and Schütz et al. [
13] supports the decentralization of heating systems and energy conversion within microgrids, respectively. Middelhauve et al. [
2] further discuss the optimization of community-level renewable energy hubs.
Current models often struggle to integrate micro-level elements with macroscopic strategies effectively. Bastholm et al. [
14] and Li et al. [
15] emphasize the importance of considering local consumer behaviors and community dynamics within broader energy models. This integration is essential for successfully adopting renewable technologies and developing effective transition strategies that are socially and ethically acceptable.
A selection of national and international energy system model selection of subsystem integration overview is represented in
Table 1, summarizing the specificities of the current energy system models. This paper aims to create a model, using decomposition methods, integrating uncertainty assessment by optimizing a national energy system model with district-scale sub regions, applied to the Swiss case study.
2.2. Resulting Gap and Contribution
Despite advancements in energy system modeling towards decentralized systems, critical research gaps impede the optimal integration of such systems within a comprehensive national framework. This section outlines these gaps and delineates the contributions of the current study to bridge them:
Existing models struggle with the computational burden of accurately representing each local energy system’s unique characteristics within a national framework. Objective: Develop a methodology to integrate decentralized prosumers into the national energy system efficiently, overcoming computational challenges.
There is a lack of frameworks that effectively harmonize local (micro) energy system elements with the broader (macro) national energy system dynamics. Objective: Create a comprehensive regional framework that bridges local energy systems with national energy strategies, addressing the intermittency of renewable energy sources.
The energy modeling field lacks insight into the optimal degree of centralization versus decentralization for achieving thermo-economic efficiency in energy systems. Objective: Explore the impacts of varying degrees of system centralization and decentralization on efficiency, resilience, and cost-effectiveness.
The interplay between increased self-consumption rates and energy demand in renovated infrastructures is underexplored. Objective: Investigate how enhanced self-consumption, particularly in renovated buildings, affects energy system configurations and resilience.
This study addresses structural methodological gaps in current energy system models and strategic planning questions for energy system development. The research offers novel insights into creating resilient, efficient, and sustainable energy systems by synergizing detailed district-level modeling with a broader national energy modeling framework. The study’s methodology and findings aim to inform strategic energy planning, focusing on optimal integrating decentralized energy resources within a national framework, maximizing renewable energy use, and identifying cost-effective, resilient system configurations.
3. Materials and Methods
3.1. The Prosumer within the Energy System
The methodology delineates the approach to analyzing energy planning strategies by representing decentralized energy producers (
) within the larger national energy
. This representation is aimed at strategically evaluating decentralized energy contributions to national energy goals rather than enhancing the models’ internal structures, as visible in
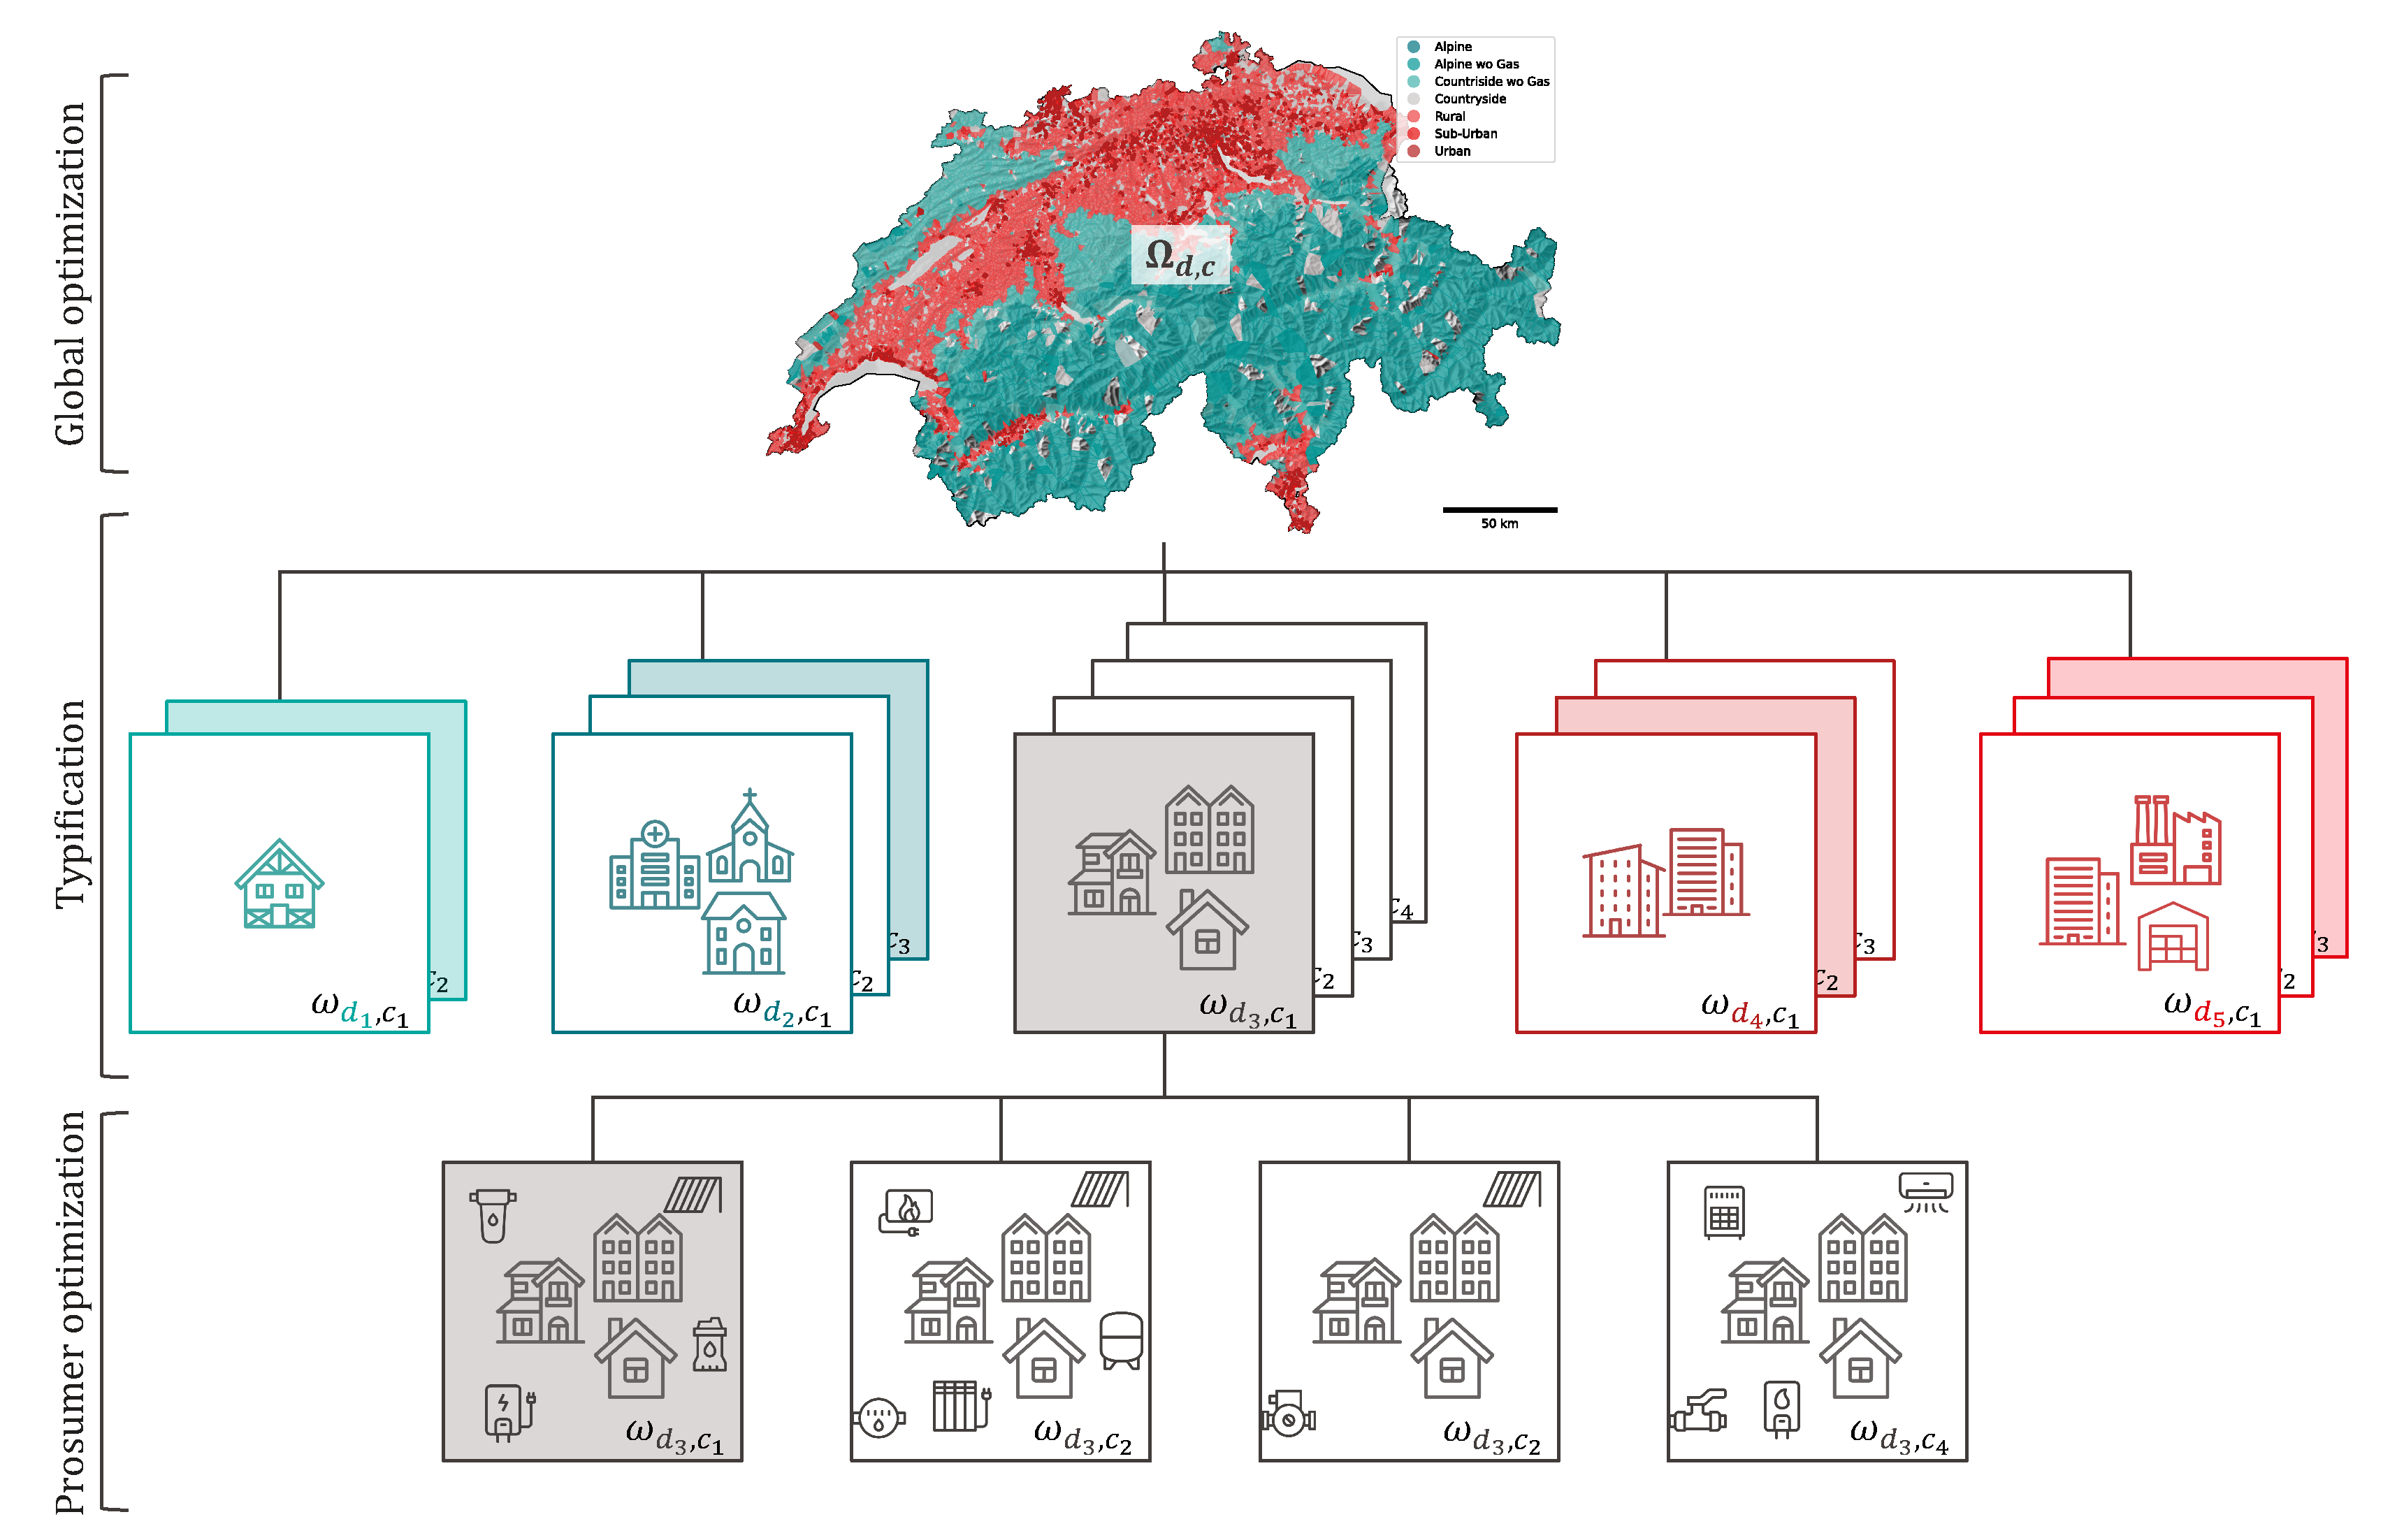
Figure 1. Prosumers serve as energy consumers and producers, notably via decentralized PV systems. They are conceptualized as energy hubs within clustered districts, each defined by buildings linked within an LV grid to the same LV/MV transformer. This process involves three key phases: (1) Characterizing the Swiss building stock and distinguishing districts based on district-specific characteristics; (2) using this characterization to identify and optimize renewable energy hub configurations within each district, focusing on assessing decentralized energy production capabilities; (3) integrating these optimized configurations into the macroscopic energy system (EnergyScope
) framework, applying them as representative models for broader system analysis and planning.
3.1.1. Swiss Building Stock Typification
A strategic approach to model local energy systems to address the identified computational challenges is applied by typifying the Swiss building stock into representative districts and optimizing renewable energy hub configurations within these districts, thus effectively reducing the problem’s complexity. This approach allows for a comprehensive yet computationally efficient integration of decentralized prosumers into the macroscopic energy system framework. In this sense, clustering methods are applied to find a trade-off between computational complexity and information loss.
The methodology begins with characterizing each building and district in the country as outlined by Girardin et al. [
41]. This process classifies the building stock based on specific characteristics, including construction year, energy consumption, and architectural features. Districts are categorized based on a comprehensive set of characteristics and divided into three main categories: climate conditions, energy infrastructure availability, and building typology. Climate conditions include factors such as average temperature, solar irradiation, and precipitation, reflecting the environmental context of each district. Energy infrastructure encompasses the existing setup of electric and natural gas grids, highlighting the capacity and distribution network relevant to energy supply and consumption. Building typology refers to buildings’ architectural features, construction year, and energy consumption patterns, offering insights into the built environment’s diversity and energy needs. Each category is detailed below to provide a more nuanced understanding of how districts are distinguished based on their unique urban and meteorological characteristics."
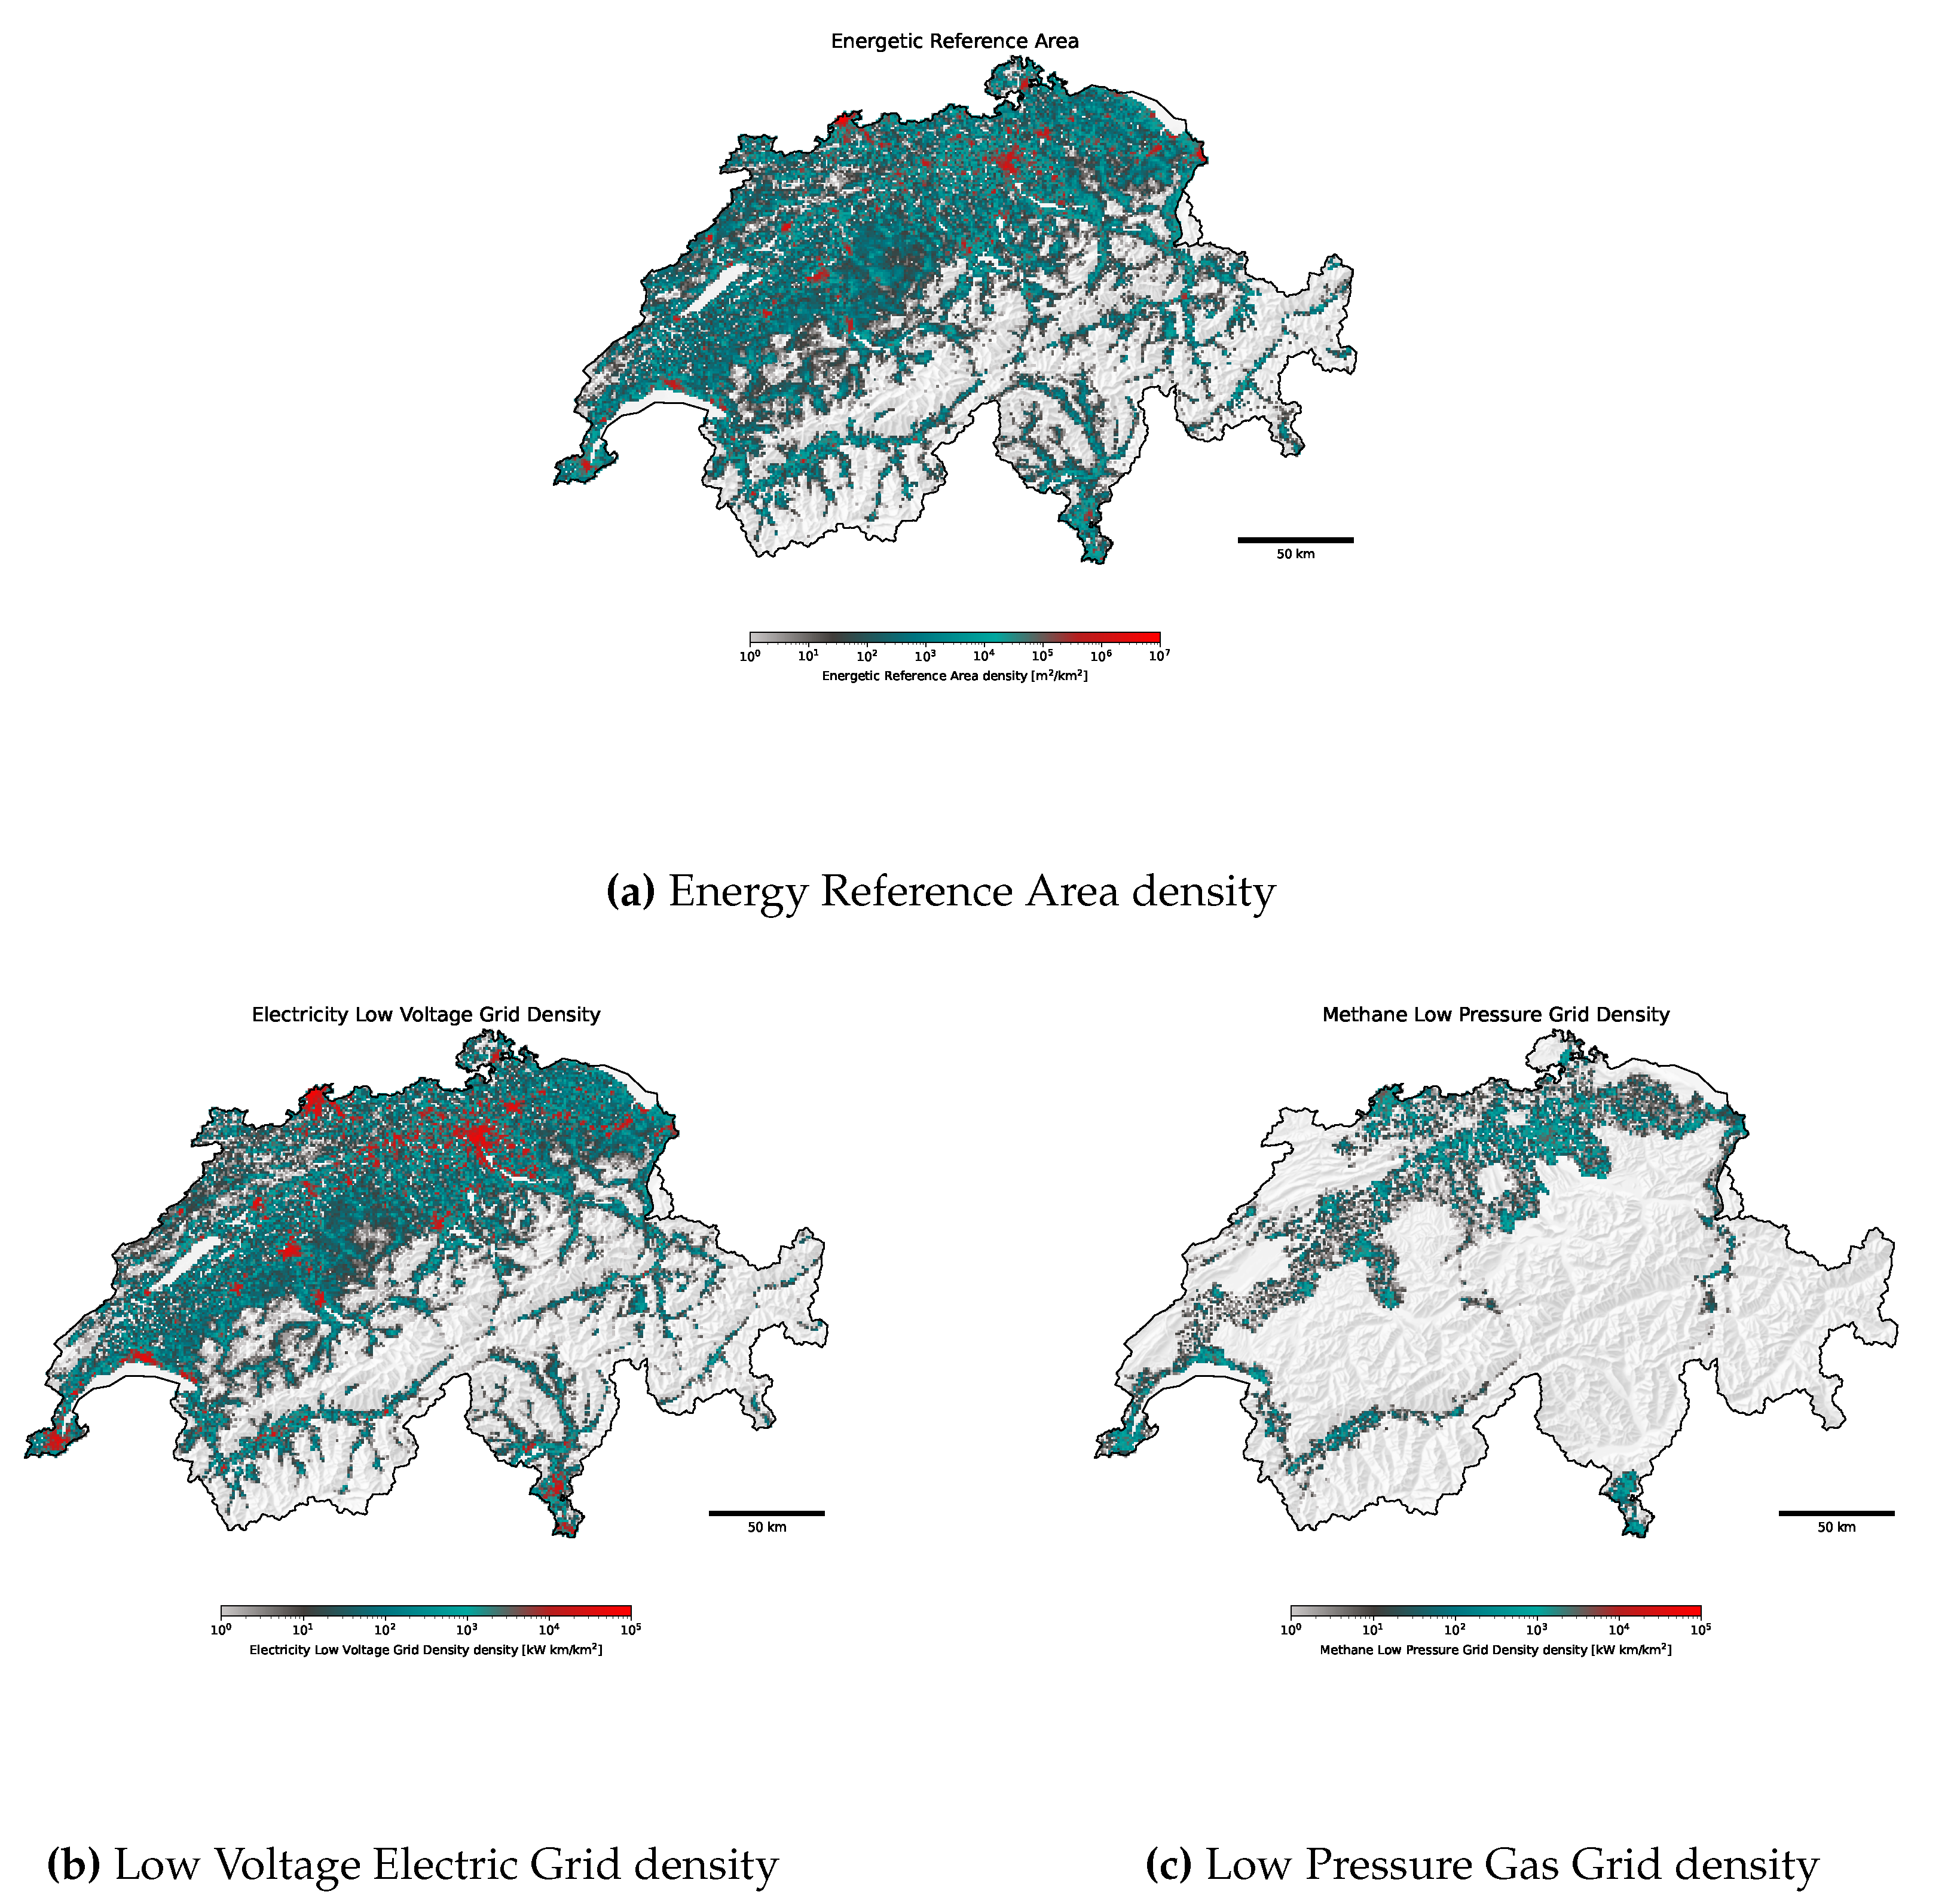
Once the buildings and districts are typefied, a clustering algorithm is applied to the dataset. The specificity considered are the heated surfaces, the district’s share of residential, industrial, and service buildings, the annual average temperature and solar irradiation, and the density of electric and natural gas grids (
Appendix B). Each feature is evaluated at the district scale to follow the Swiss energy system down to the low voltage level, as connected to the same Low Voltage (LV)-Medium Voltage (MV) transformer, forming thus the decentralized energy hubs [
1,
42]. The k-medoid algorithm is applied and runs over 50 iterations between 6 and 10 clusters as advised by Terrier et al. [
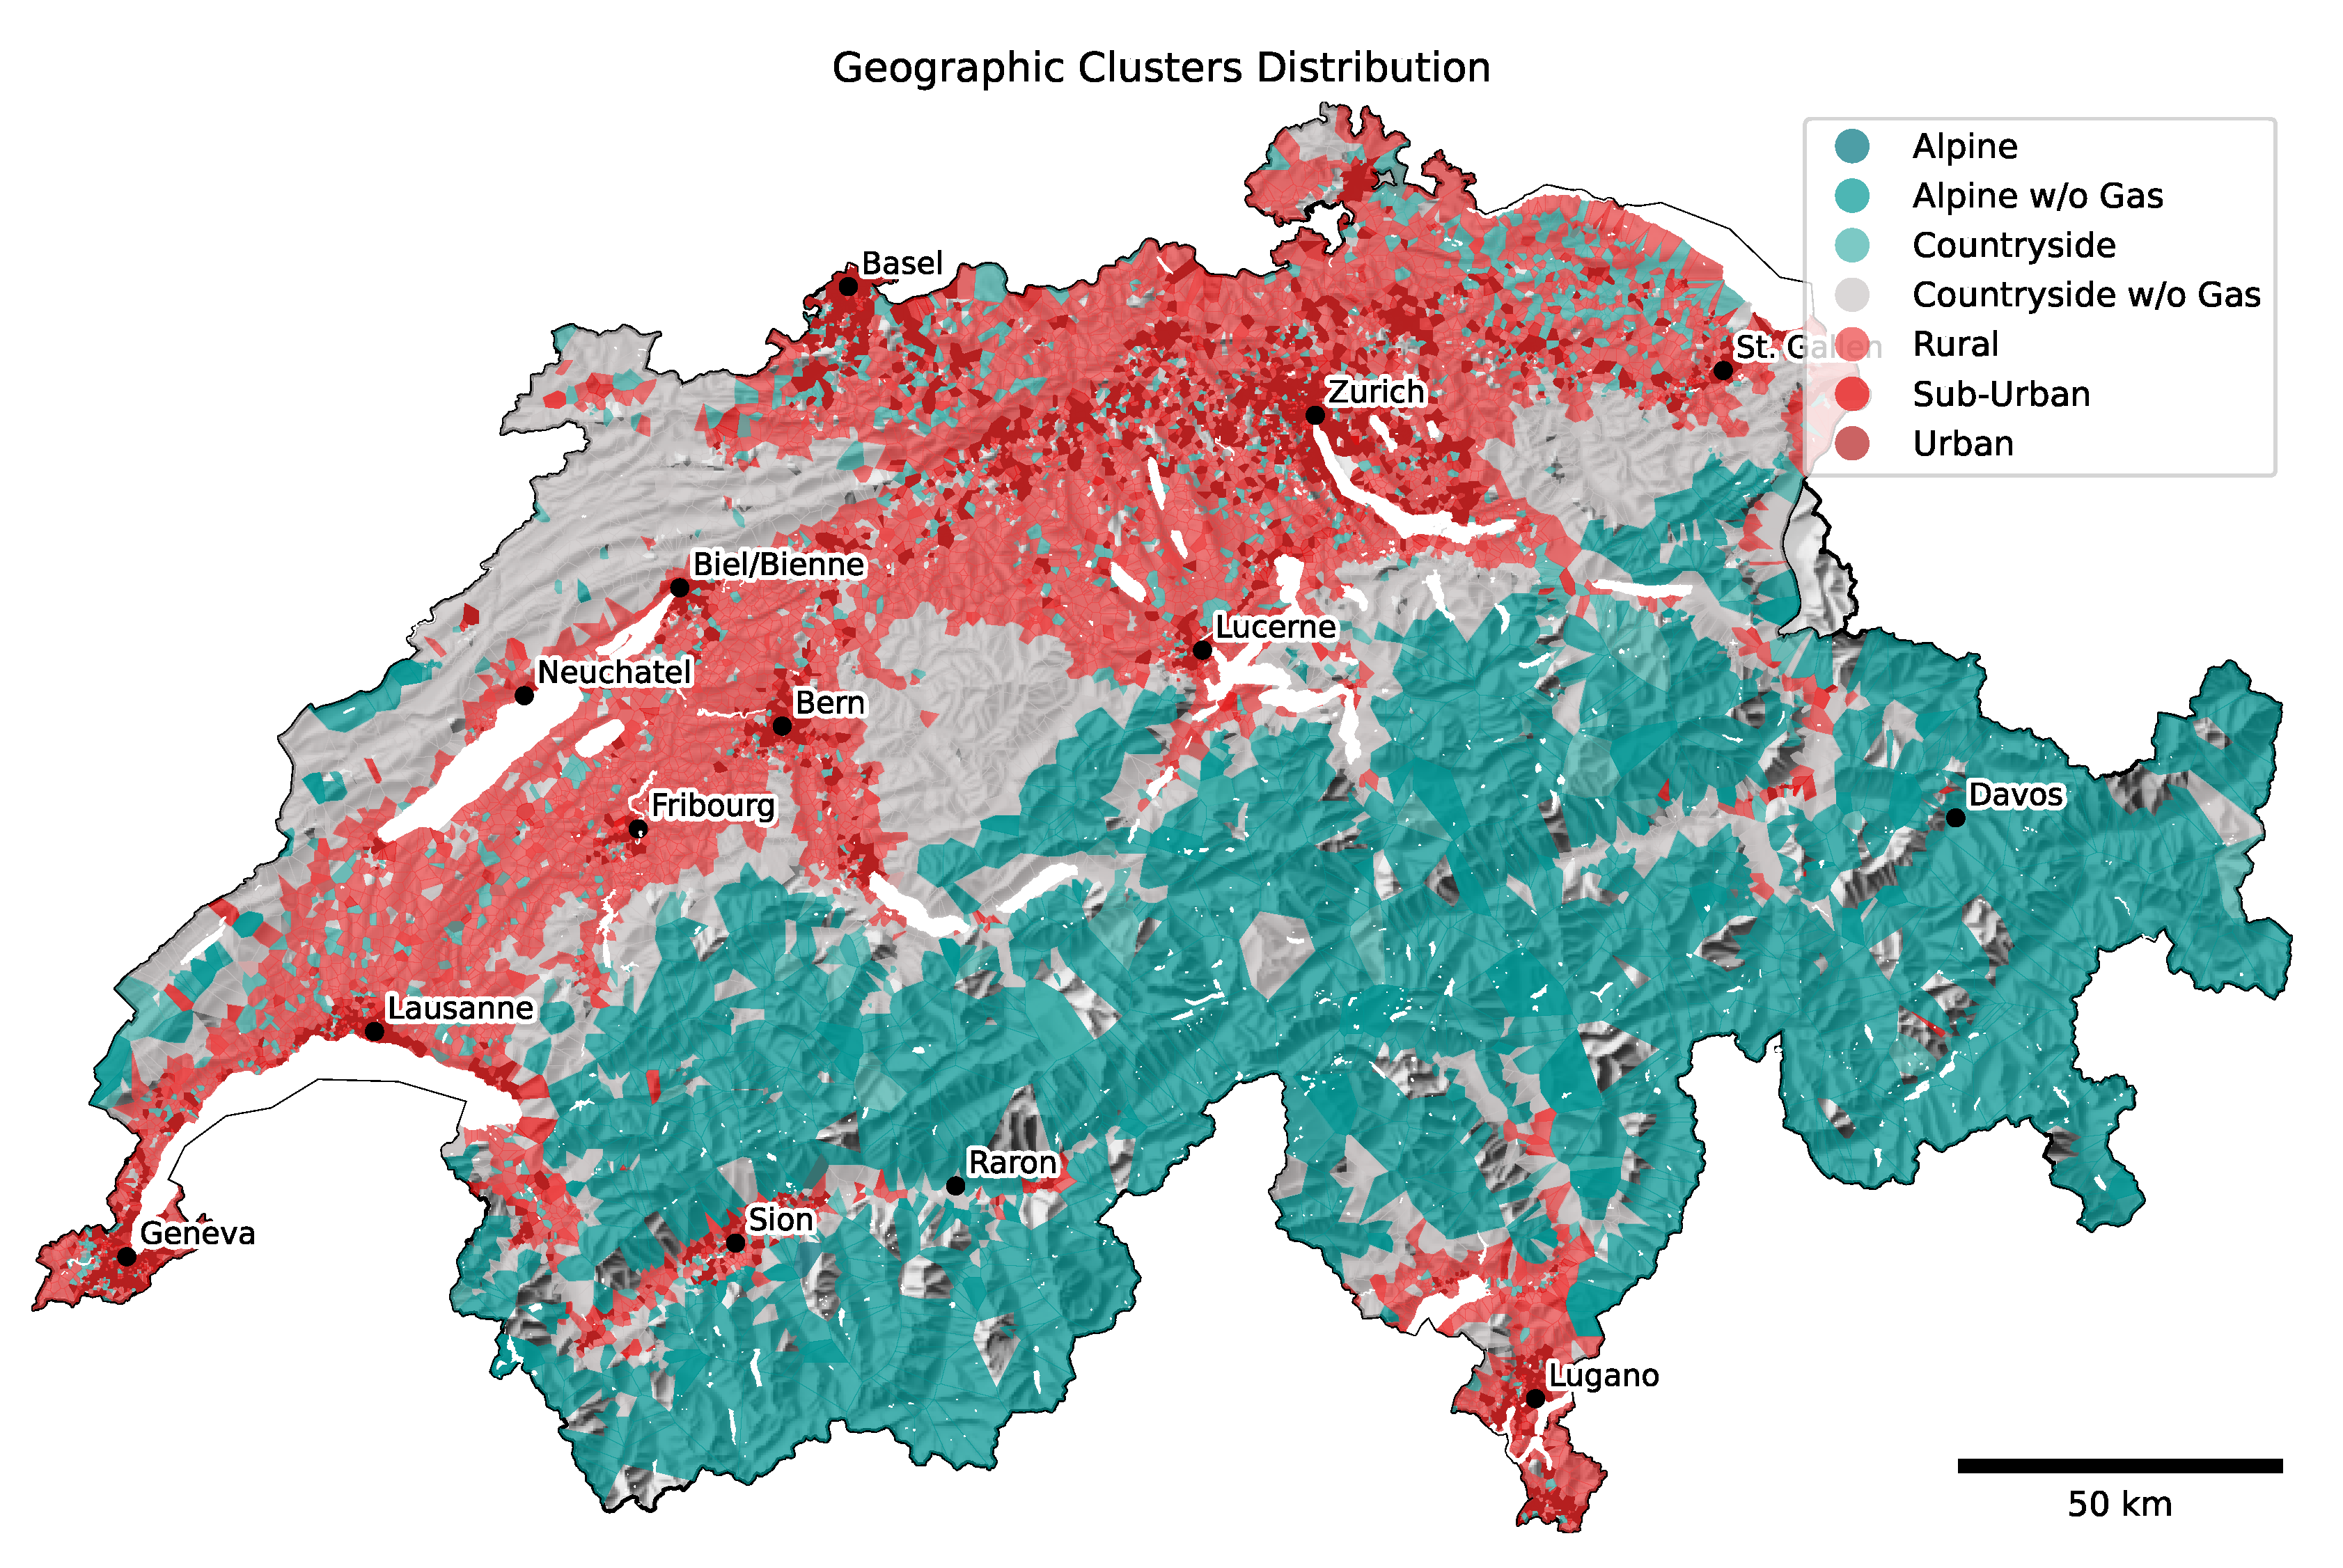
43]. A qualitative analysis selects the optimal district typification from the clustering results. The aim is to contextualize the results of the Swiss building stock and ensure a suitable representation of urban, suburban, and rural areas incorporating the different climatic zones. Based on this analysis, seven typical districts are identified to represent the regionalized energy systems in Switzerland.
Figure 2 shows their distribution throughout the country. The typical districts differentiate well-urban centers from rural areas. Moreover, alpine and countryside regions are subdivided into two categories based on the district’s connection to a gas infrastructure. More details on the clustering algorithm are provided here [
44].
3.1.2. Characterization and Optimization of Renewable Energy Hubs Configurations within Each District
The development of the energy system model introduces a novel structure that integrates decentralized renewable energy hubs with the overarching centralized national energy system. This approach involves identifying optimal configurations for decentralized system elements within each typified Swiss district, exploring their interactions with one another, and centralized energy supply and storage infrastructures.
The model optimizes energy exchanges between typical districts and central installations, enabling comprehensive analysis of micro- and macro-level energy flows within the national framework. This integration allows for assessing localized energy production and consumption’s potential to complement and enhance the national energy system’s efficiency and resilience.
The model structure encapsulates localized optimization by identifying and optimizing renewable energy hub configurations within each district based on specific characteristics such as climate, energy demand, and available resources. It also includes modeling the potential for energy exchanges between districts, facilitating a more distributed energy management and resilience approach. Additionally, it assesses how these decentralized hubs can be effectively integrated with central energy supply and storage infrastructures, optimizing the overall energy system for efficiency, sustainability, and security.
This approach marks a significant advancement in energy system modeling, moving beyond traditional centralized-only frameworks to include detailed representations of decentralized energy potentials and their systemic implications. The configuration that mixes typical districts with central installations is pivotal, enabling a holistic view of the national energy landscape that incorporates both granular, localized insights and broad, systemic perspectives. The interplay between localized renewable energy hubs and centralized infrastructures is central to the analysis, aiming to reveal new insights into optimizing the national energy system’s design and operation for enhanced sustainability and resilience.
Integrating decentralized renewable energy hubs with centralized national energy systems is complemented by a systematic approach that reflects local decision-making while managing computational costs. This method involves a precise application of a two-stage Global Sensitivity
Analysis (GSA), as outlined by Chuat et al. (2023) [
45], tailored to efficiently navigate the solution space of the district energy system model. Initially, the GSA method identifies the most influential parameters to streamline the computational process. This identification is facilitated by the Morris method [
46], enabling a qualitative assessment of parameter sensitivity with minimal model evaluations. Subsequent exploration of the model’s solution space involves adjusting these key parameters, employing Sobol’s sequence [
47] to effectively sample their variation, thereby generating diverse energy system configurations.
A critical step in this process is the application of a clustering algorithm to simplify the solution space. This simplification allows for the economic and technical dimensions—captured through capital
expenditure (CAPEX), operational expenditure (OPEX), the installed capacity of energy conversion technologies, and peak energy exchanges—to be efficiently analyzed. A density-based algorithm, specifically density-based spatial clustering of applications with noise (DBSCAN), is necessitated by the district energy system model’s Mixed Integer Linear Programming (MILP) nature, facilitating the aggregation of solution performance indicators to represent typical configurations. Moreover, the proportion of photovoltaic production consumed within the district highlights self-consumption, which is crucial for understanding local energy dynamics.
Associating each Swiss district with one of the seven archetypes (typical Swiss districts as shown in
Figure 2) is a direct application of this method, where the GSA serves not merely as a conceptual framework but as a concrete analytical tool. This distinction underscores the GSA’s role in systematically evaluating and optimizing the interactions between localized energy hubs and the centralized energy system. Through this analytical process, the model captures the essence of district-specific energy dynamics and aligns these local configurations with the broader national energy strategy, ensuring a comprehensive and nuanced understanding of the energy landscape.
3.1.3. Soft-Linking of Macroscopic and Microscopic Modeling
Decentralized prosumers are integrated into the MILP global energy system framework
EnergyScope based on the typical renewable energy hub configurations identified (
Figure 1). In the following, the global decision-making scale is represented by
and the local scale by
. The
EnergyScope model has been developed by Moret et al. [
48] and continuously improved by Li et al. [
49] and Schnidrig et al. [
1].
Each decentralized energy system configuration
is represented by an installation of energy units
and associated energy flows with the grid
for each period
t and configuration
c of each district
d. The linking constraints between the two scales of decision-making are the resource balances for each energy carrier
l (Equation
1) and the capacity constraints of the grids (Equation
2). A linear combination of the configurations
is performed to model the integration of prosumers. The decision variable
is the weight attributed to each configuration. To summarize,
decides for the configurations
to activate, therefore inducing local investments and associated energy flows
with the global system. This variable defines the optimal share of prosumers in the
-system (Equation 4).
The optimization problem can be formulated as a total cost minimization, optimizing the decision variables of installed size of units
, their operation
and
(Equation
3). The optimization is subject to the mass and energy balance (Equation 5), where the end uses (
) are satisfied by the operation of technologies and resources (
), considering layer conversion efficiency
, storage (
), and districts exchanges (
).
Similarly to energy flows and installed units size, the total cost
are decomposed in the centralized
and the decentralized
system total cost (Equation 6). While the centralized system cost has been taken from Schnidrig et al. [
1] (Equation 7), the decentralized one is composed of the sum of all district investment
and maintenance
costs, as defined by the decision variable
(Equation 8).
Based on the configuration selected
, the local grid strain is calculated by observing the absolute peak power value for the selected configuration
c in the decentralized model
(Equation
2). This strain is translated in a potential grid reinforcement need, which is linked to the grid
g and the layer
l through the difference of the peak power demand and the existing grid infrastructure capacity (Equation 7).
3.2. Uncertainty Analysis
To assess the uncertainties integrating the prosumer in the energy system, the approach uses a quasi-Monte-Carlo simulation, as per Morokoff’s method [
50], to evaluate the variations of the solution space of configurations, denoted as
. This is represented by the equation (Equation
9), where the solution space
is estimated by sampling
N times and
i corresponds to one specific sample:
Here, each solution
of the sample
i, is computed based on an economic optimization problem (Equation 10-13). The values of
are selected using a Sobol sequence
, following Sobol’s method [
47]. The MILP problem focuses on minimizing the objective function
, which depends on decision variables
and cost parameters
(Equation
10). The model adheres to mass and energy balance constraints expressed in a matrix normal form
, relevant to the unit characterization
(Equation 11). The parameters are distributed around their median values
as per distribution
(Equation 12-13).
4. Results
The outcomes of a comparative analysis between a novel model incorporating prosumer dynamics at the district level and the traditional centralized model are presented. The analysis is structured into two distinct yet interconnected segments. Initially, the focus is on evaluating the resilience of both models under uncertainty. Subsequently, the investigation shifts to a parametric analysis of PV penetration, contrasting the centralized and decentralized approaches to highlight the differential impacts on energy system dynamics, thereby elucidating their inherent strengths and limitations in managing uncertainties. This sets the stage for an in-depth exploration of self-consumption within the decentralized framework, examining its influence on system configuration, efficiency, and resilience.
4.1. The Swiss Building Stock
The typification of the Swiss building stock has revealed detailed insights into the country’s urban and energy infrastructure characteristics, differentiating regions based on their energy demands and renewable potentials (
Figure A1). While region-specific attributes influence the magnitude of local investments in energy units, the most influential parameters resulting from the Morris method are the energy carrier costs (supply and demand), closely followed by the investment costs of PV. These parameters are conditioning the selection of energy units and are therefore used to explore the solution space of each typical district energy system using a Sobol sampling.
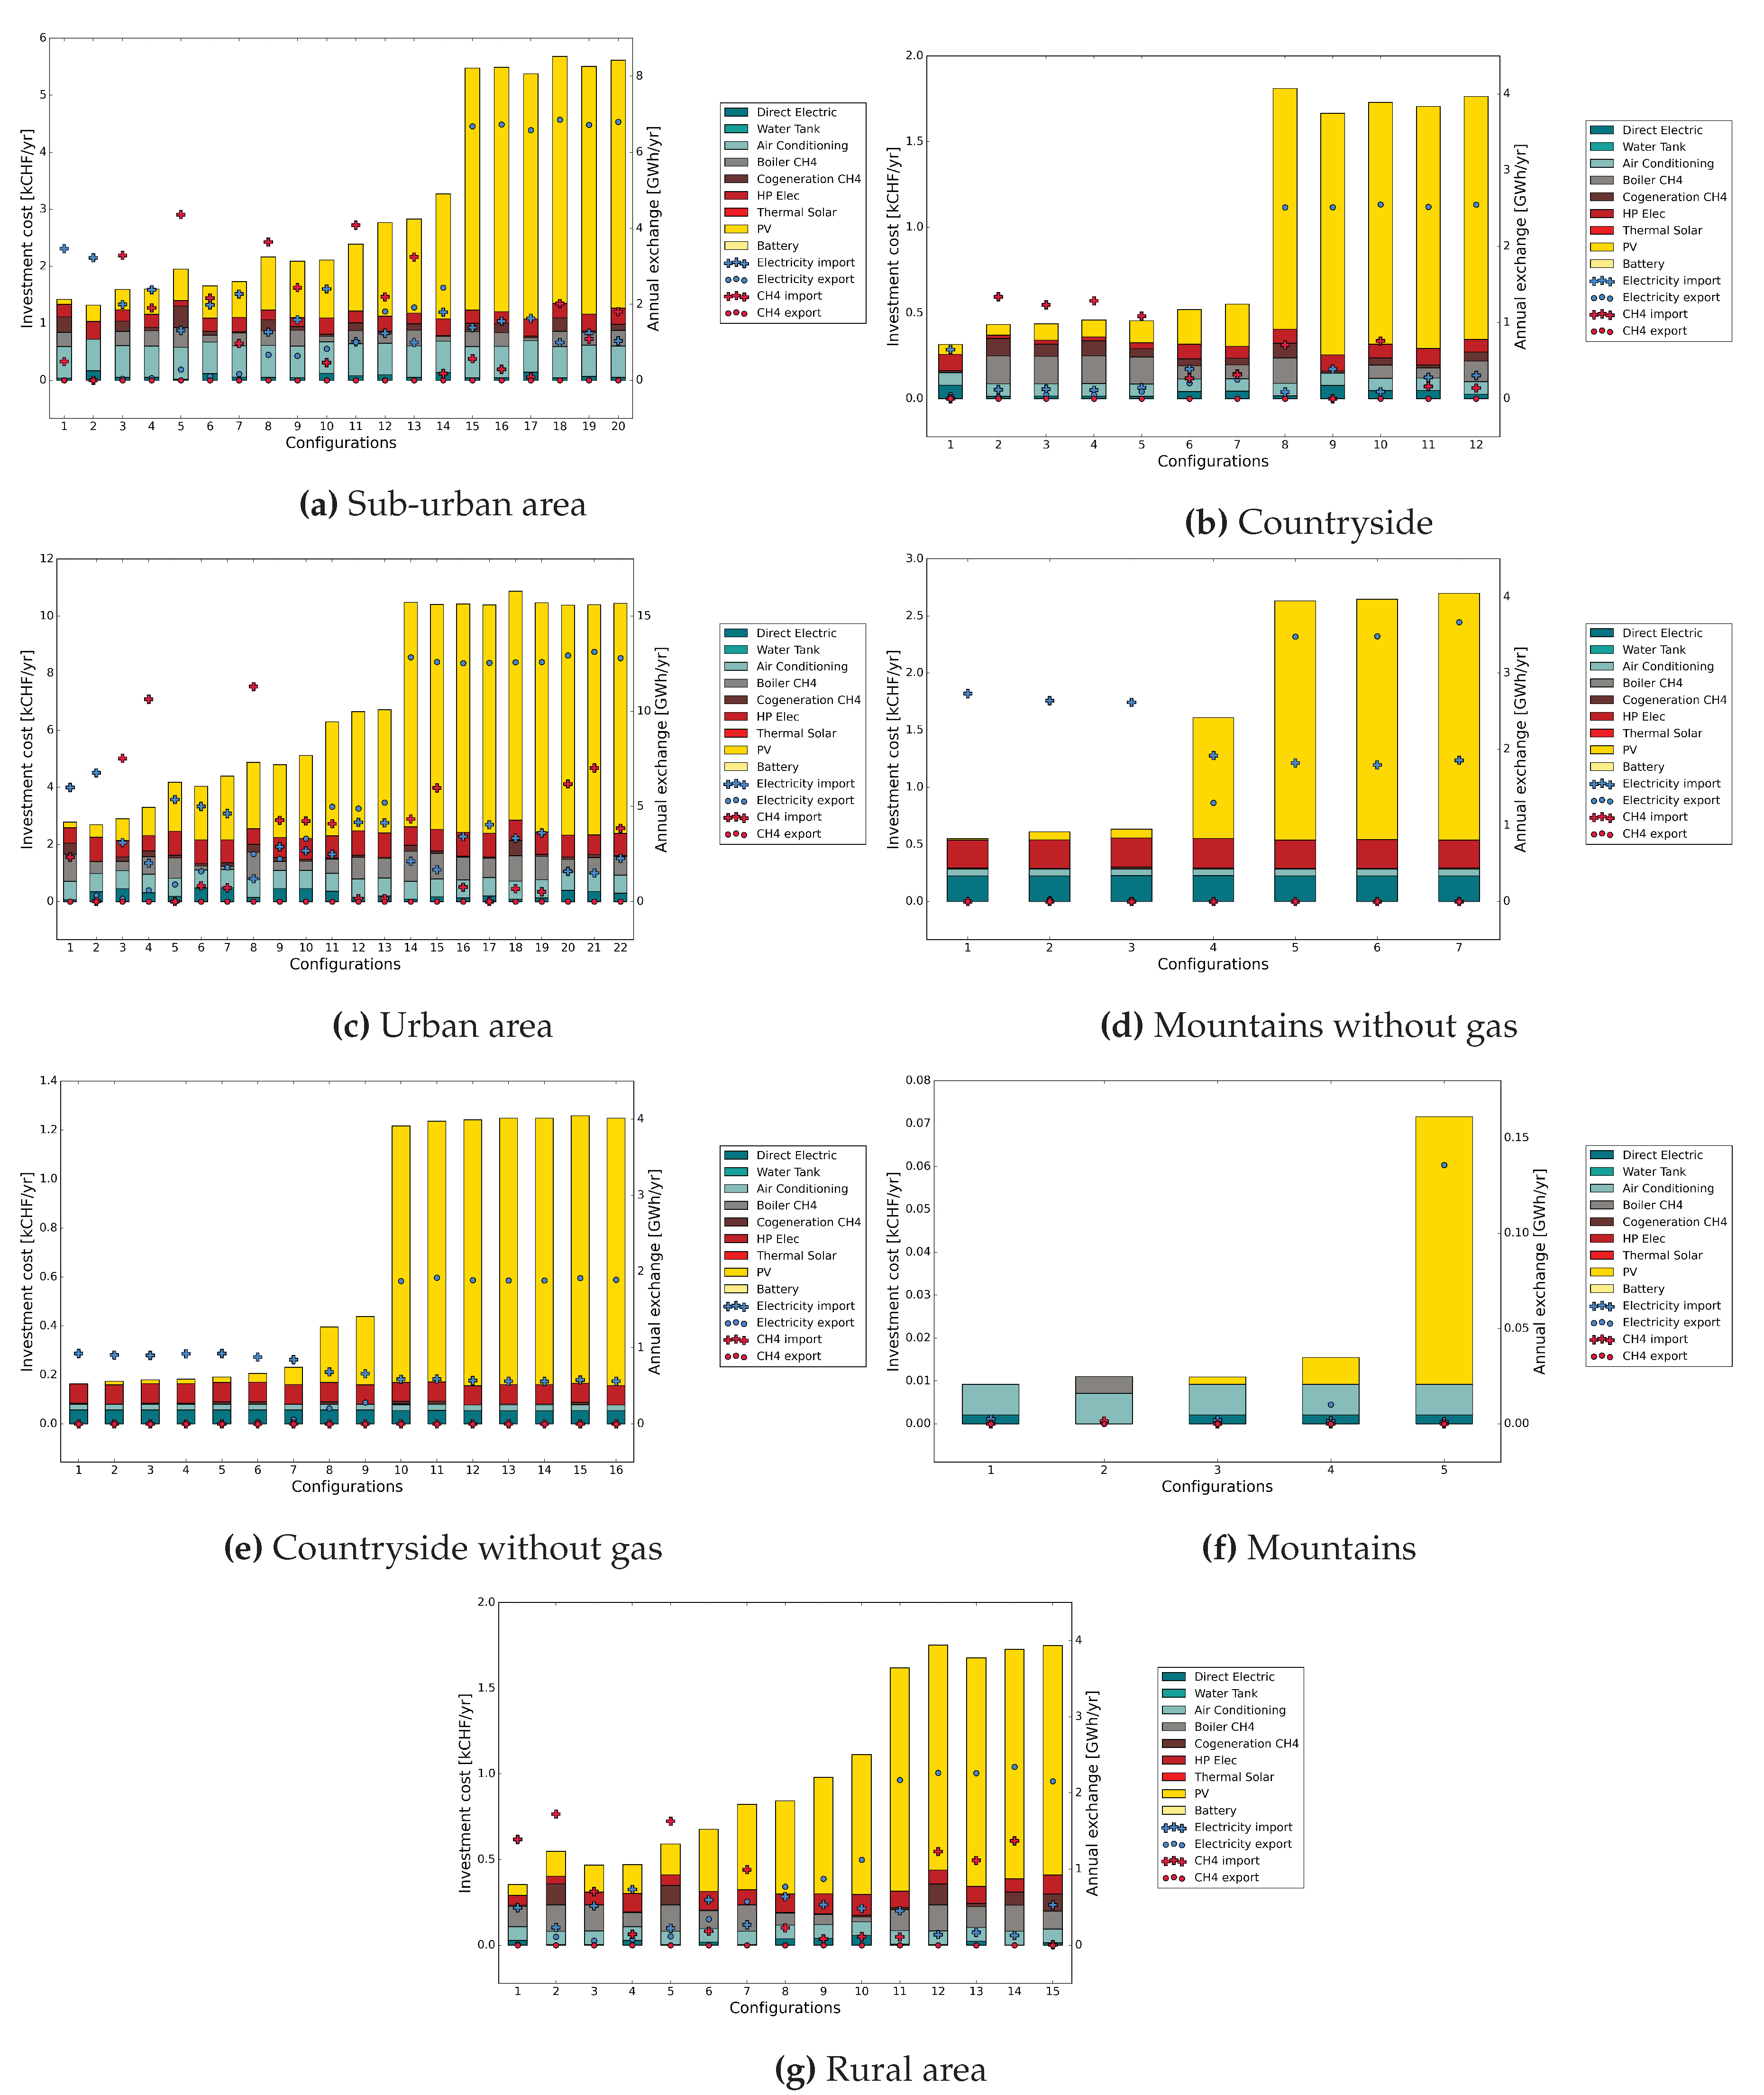
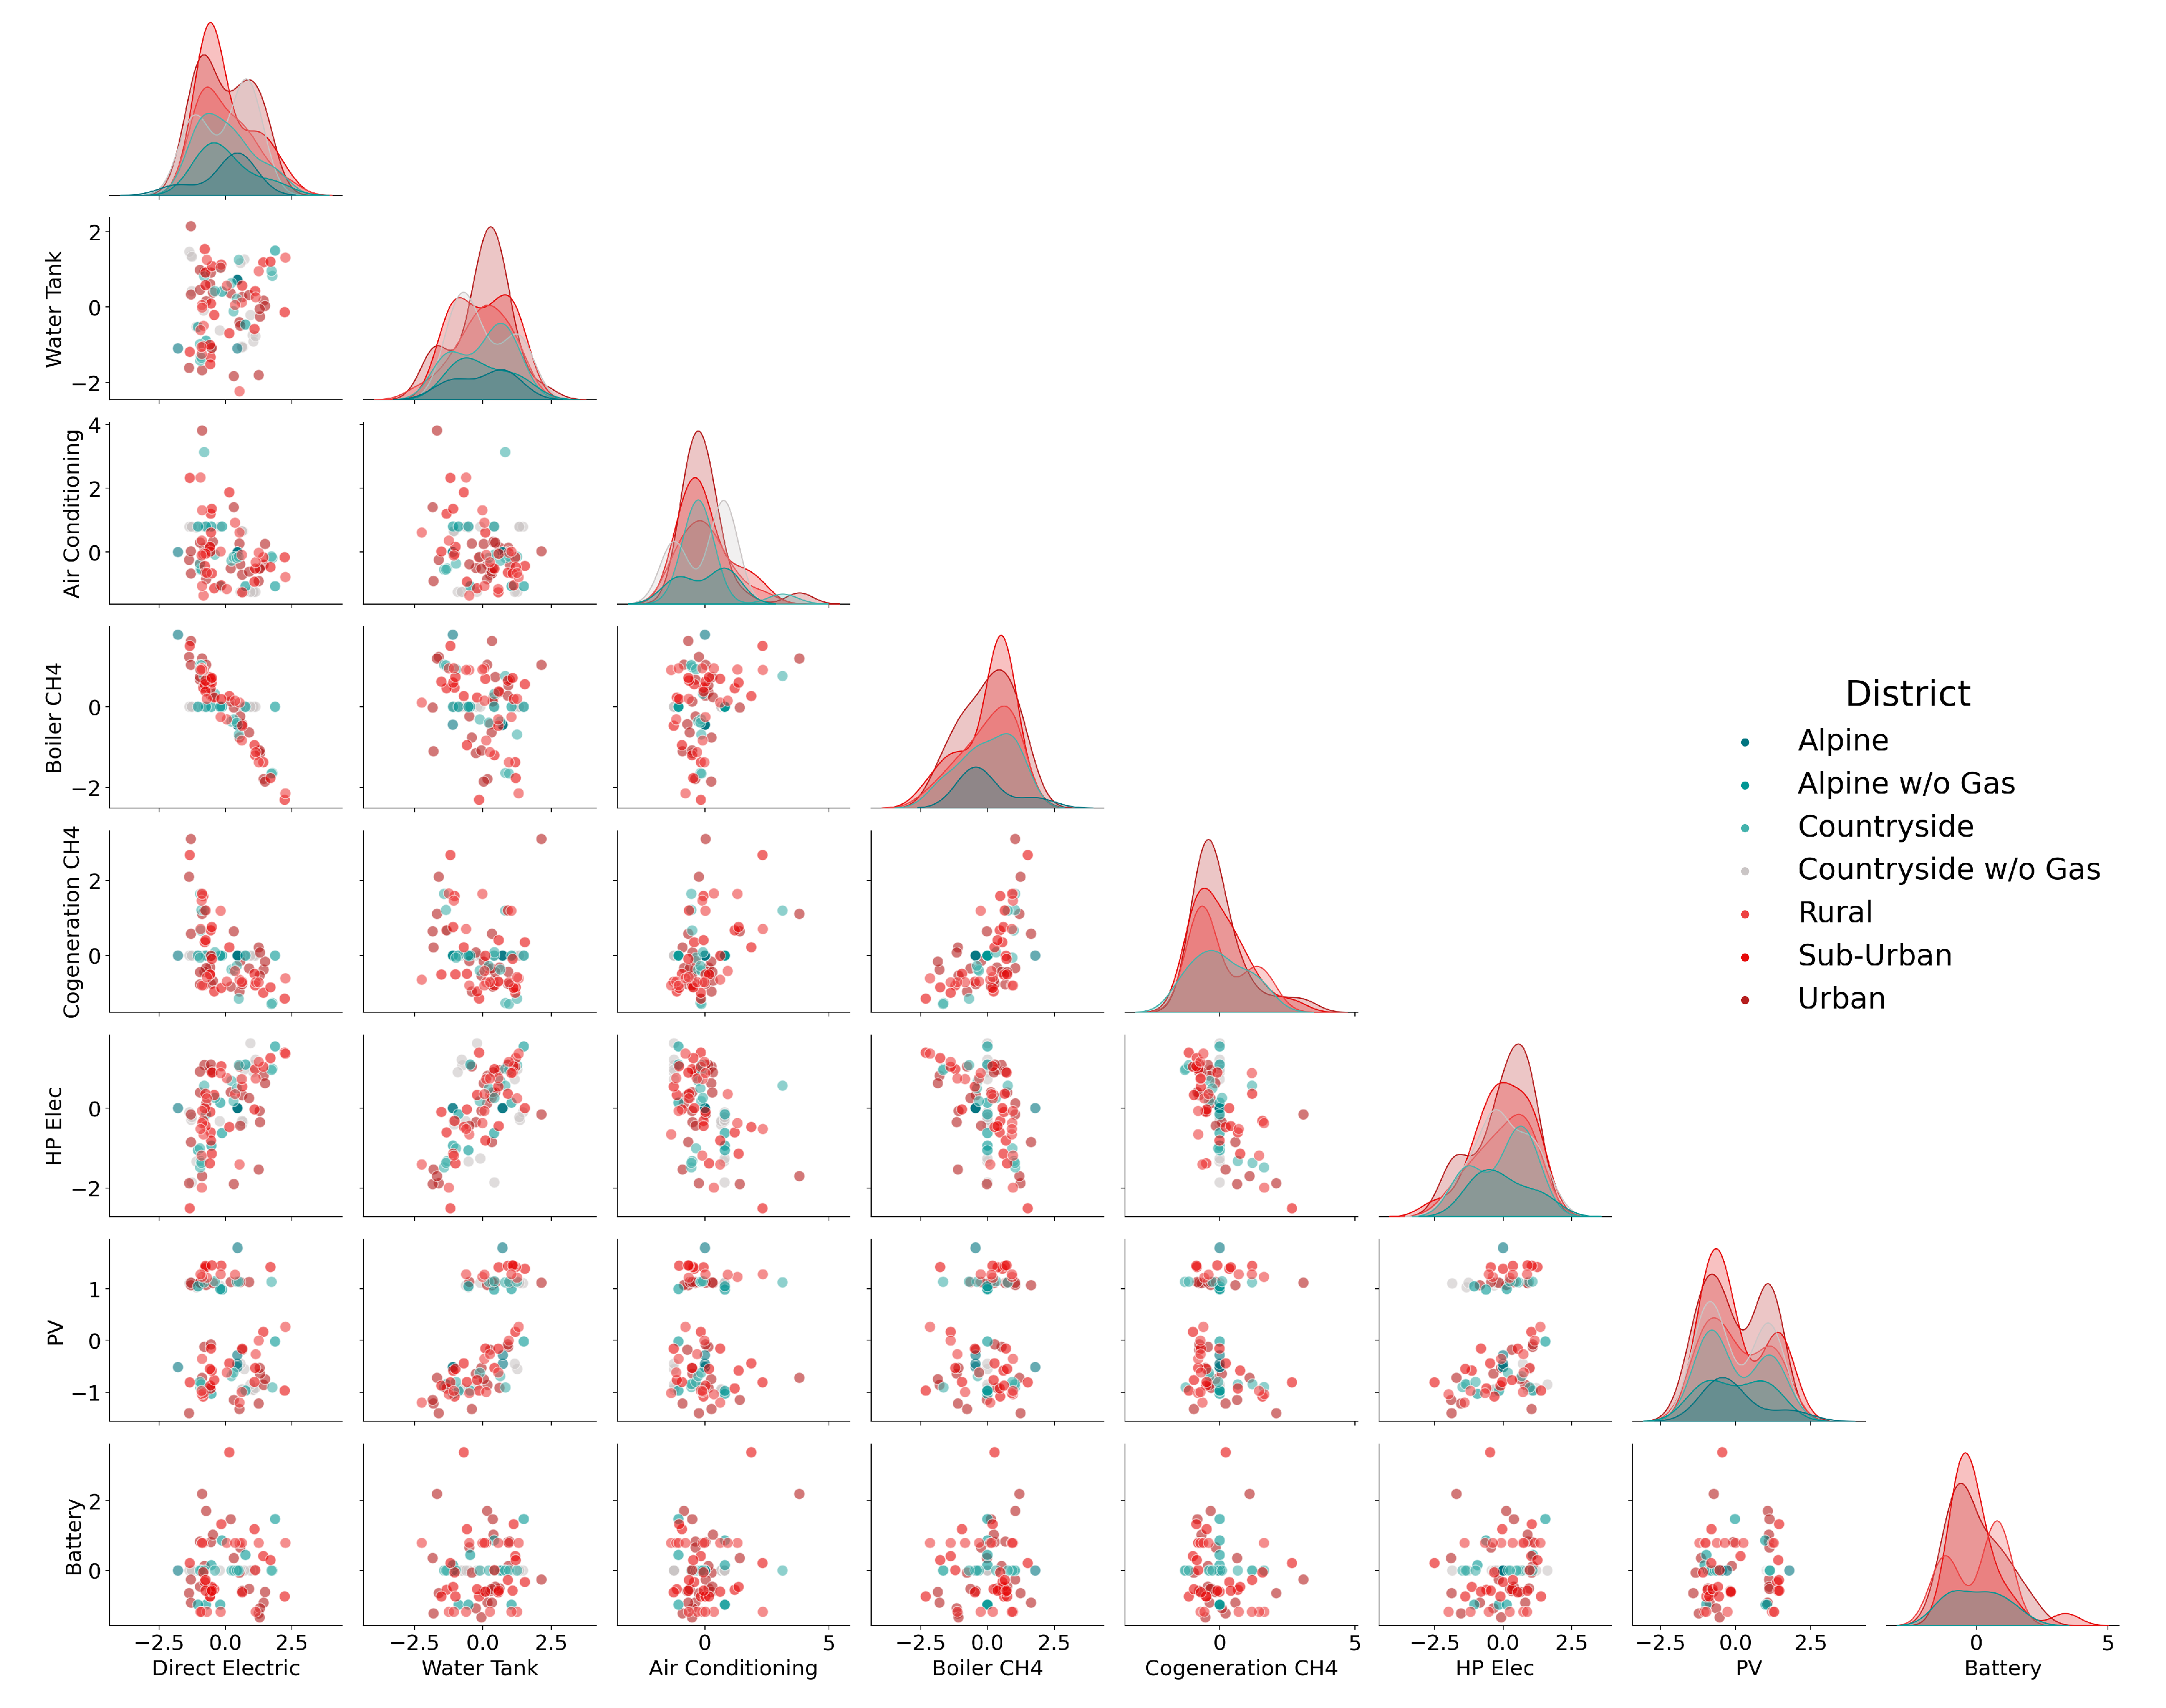
Figure 3 illustrates the distribution of the investments for each technology within each district. Substantial differences exist throughout districts, highlighting the need to consider region-specific solutions.
The negative correlation between methane (CH4) boilers and direct electric heaters or heat pumps highlights the polarity of the energy system regarding energy resource consumption. Cogeneration units and boilers correlate positively, while heat pumps are usually combined with water tanks and PV panels. The PV capacity distribution shows two peaks for most districts. It demonstrates two different energy strategies: improving the self-sufficiency of the districts or increasing the profit by reselling electricity to the grid. While the former strategy involves lower investment in PV panels, the latter encourages prosumers to shift from self-sufficient microgrids to renewable electricity producers for the grid. These local strategies have various consequences for the global energy system. Therefore, it highlights the need to identify a complete solution space at the built environment level to describe prosumers’ decision-making trends fully.
While Sobol sampling allows reaching a high level of solution space screening, it also identifies many solutions. The typical configurations are detailed in
Appendix C and are clustered based on the installed capacity of the energy conversion units, network exchanges, and economic indicators. The configurations primarily differentiate themselves by the type of energy carrier they are relying on, either electricity or CH
4. Then, the distinction comes from the level of PV penetration. The latter depends on the resale cost of electricity and the investment cost of PV panels, both parameters used in the Sobol sampling. While the investment portfolios of some configurations are similar, they are differentiated by their operational strategy, thus their annual energy exchanges with the grids. The latter highlights the diversity of prosumers, ranging from a high dependence on grids imports to the ones reducing their total expenditure (TOTEX) by selling excess PV electricity to the community.
4.2. Dynamics of Uncertainty: A Model Comparison
This section delineates the comparative performance of the traditional Energyscope model versus a regionalized adaptation under identical case study conditions: identifying economically optimal configurations for a neutral and independent Swiss energy system in 2050, as determined by a centralized decision-maker perspective. While both models simulate centralized decision-making processes, the regionalized version introduces an evaluation of local and decentralized optima, allowing for the selection of specific configurations tailored to prosumer characteristics. This adaptation potentially deviates from the system’s absolute optimum but provides insights into customized solutions reflective of prosumer dynamics.
Utilizing Sobol’s method [
47], the resilience and adaptability of both models are critically assessed amid variations in energy demand, supply uncertainties, and technological shifts. The objective is to determine each model’s robustness in managing diverse energy scenarios.
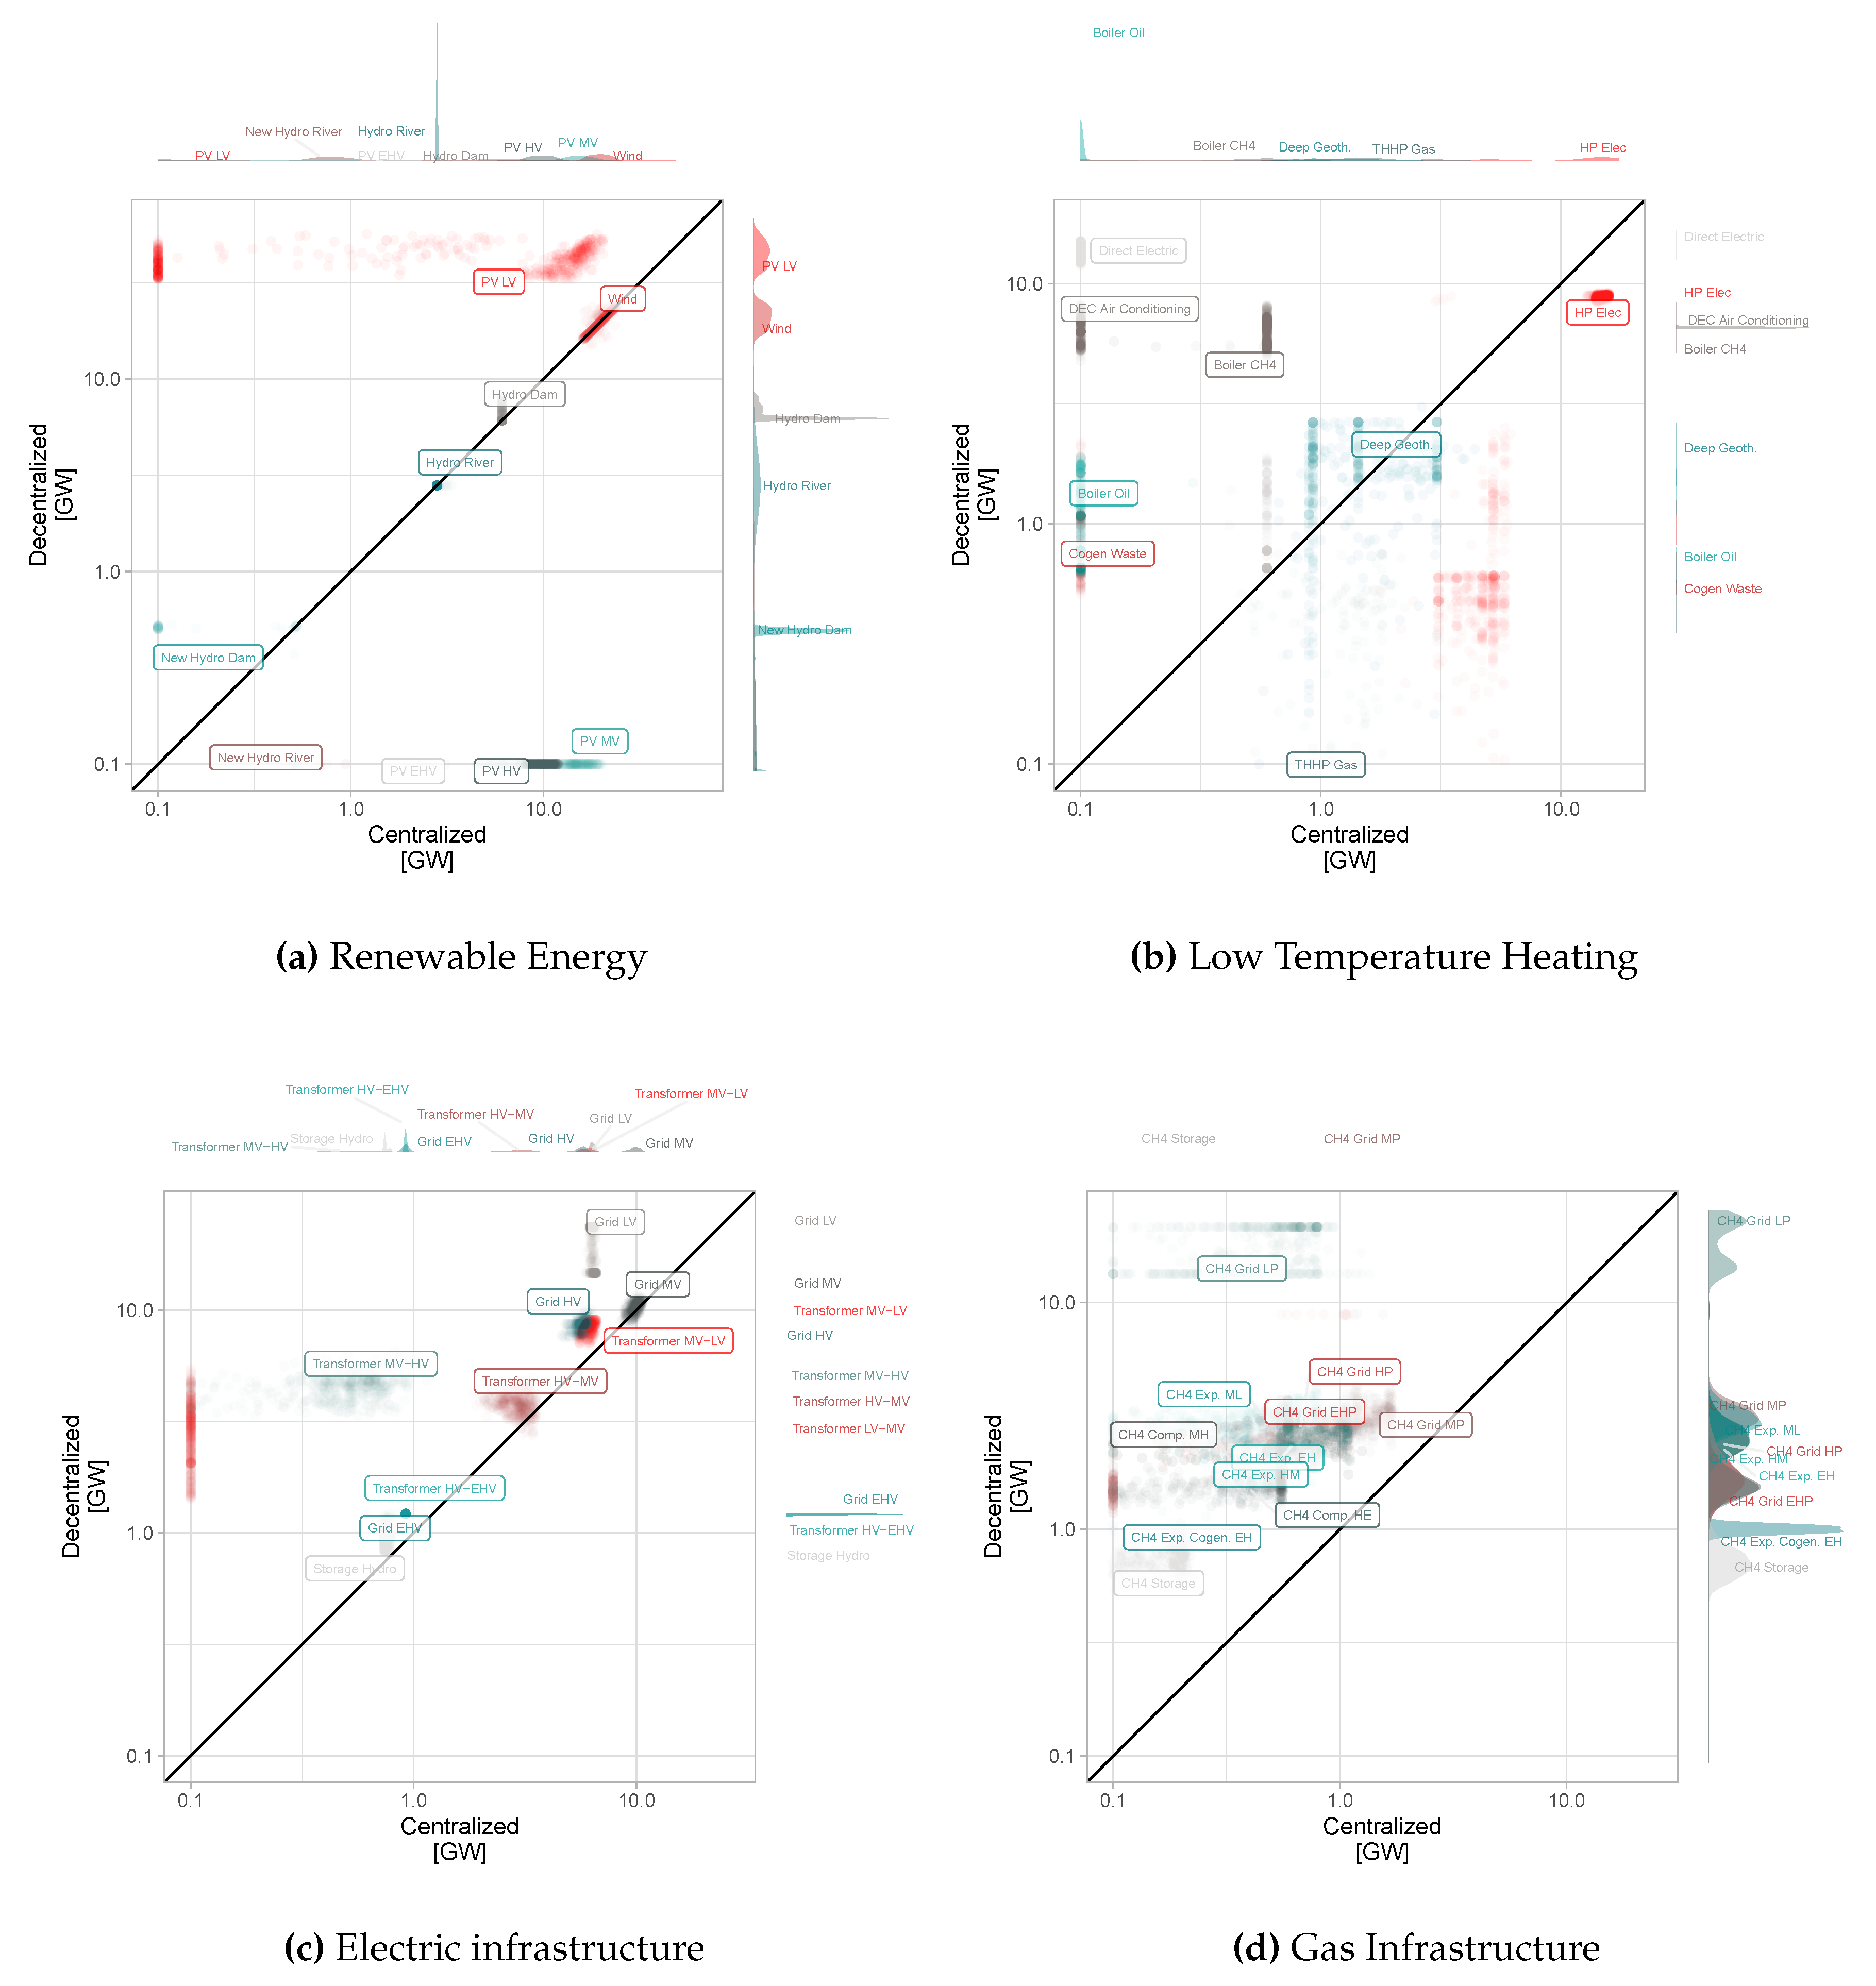
Figure 4 offers a parity plot comparison of the centralized and decentralized model solutions, employing the same Sobol sequence for uncertainty analysis. The plot annotates each installed unit size’s frequency, showcasing the distribution density for both models.
Analysis of renewable energy technology capacities, as depicted in
Figure 4a, reveals consistent maximization of wind energy potential at 20 GW across both models. The regionalized model distinguishes itself by incorporating an additional
GW in new hydro dam plants, enhancing hydro storage for production and consumption balance in 93 % of scenarios. This model also projects 30 GW of decentralized PV installations. In contrast, the traditional model maintains a fixed combination of wind and PV systems, with variability in PV technology deployment influenced by economic and other uncertainties.
The preference for heat pump utilization in low-temperature heating scenarios is evident in both models (
Figure 4b). Divergences are noted in ancillary technology preferences: the regionalized model favors direct electric heating technologies with a capacity of 15 GW, ensuring demand satisfaction during extreme weather periods as per the REHO framework. In comparison, the traditional model primarily utilizes deep geothermal plants in the residential sector, indicating differing approaches to heating technology integration.
In the decentralized model, the electric grid infrastructure’s resilience (
Figure 4c) shows minimal reinforcement required. This suggests a slightly higher burden on the electric grid than the centralized model. The decentralized model necessitates the installation of LV-MV & MV-High Voltage (HV) transformers (ranging from 1 GW to 10 GW), less prominent in the centralized model. This difference is attributed to the decentralized model’s overproduction of electricity in summer and the subsequent need for seasonal storage.
The gas infrastructure (
Figure 4d) exhibits more significant variability in the decentralized model, reflecting the fluctuating methane demand in gas boilers without requiring substantial infrastructure reinforcement. Both models impose similar strains on energy grid infrastructures, with their primary role being to store seasonal disparities between production and consumption, prioritizing electric and then methane storage.
Figure 4 illustrates the strengths and limitations of the models in managing uncertainty through the distribution of installed sizes across different energy sectors. The decentralized model demonstrated a notable consistency in its configurations, with less variation between different setups than the centralized one. This is evidenced by a narrower distribution range in the installed capacities of renewable energy technologies, where, for instance, wind energy consistently reached capacities close to 20 GW in 85 % of the scenarios. Similarly, the adoption of direct electric heating technologies in complement to heat pumps taking the base load in the decentralized model maintained a steady capacity around 15 GW in 90 % of the cases, underscoring its reliability in extreme weather conditions.
In contrast, the centralized model exhibited more significant variability in its configurations, as seen in the broader distributions of technology capacities. This model’s approach to managing uncertainties was reflected in the fluctuating allocations to primary energy consumption, with wind energy capacities varying between 18 GW to 22 GW in 98 % of the scenarios, and deep geothermal plants in the residential sector showing a capacity range of 0.8 to 3 GW in 70 % of the modeled situations. These variations indicate a more dynamic response to changing market conditions and efficiency parameters, as per the Sobol screening.
The decentralized model’s strength lies in its ability to provide stable and predictable outputs, making it particularly effective when consistency and reliability are paramount. However, this comes at the cost of potential overproduction in certain areas, such as summer electricity generation. Conversely, the centralized model’s flexibility allows for a more responsive adaptation to varying conditions, though it may lead to less predictability in energy outputs. This analysis underscores the need for a balanced approach in energy system planning, considering both the predictability of decentralized solutions and the adaptability of centralized systems in the face of uncertainties.
4.3. PV Integration Strategies: Centralized and Decentralized Models Analyzed
PV technologies compete themselves, thus directly influencing the remaining energy system. This section focuses on the priority of the PV technologies and their effect on the energy system, parametrizing the penetration of PV installations from the currently deployed size to its maximum potential. By altering the penetration of PV, the analysis seeks to identify the operational, economic, and efficiency impacts.
The parametric analysis of PV (
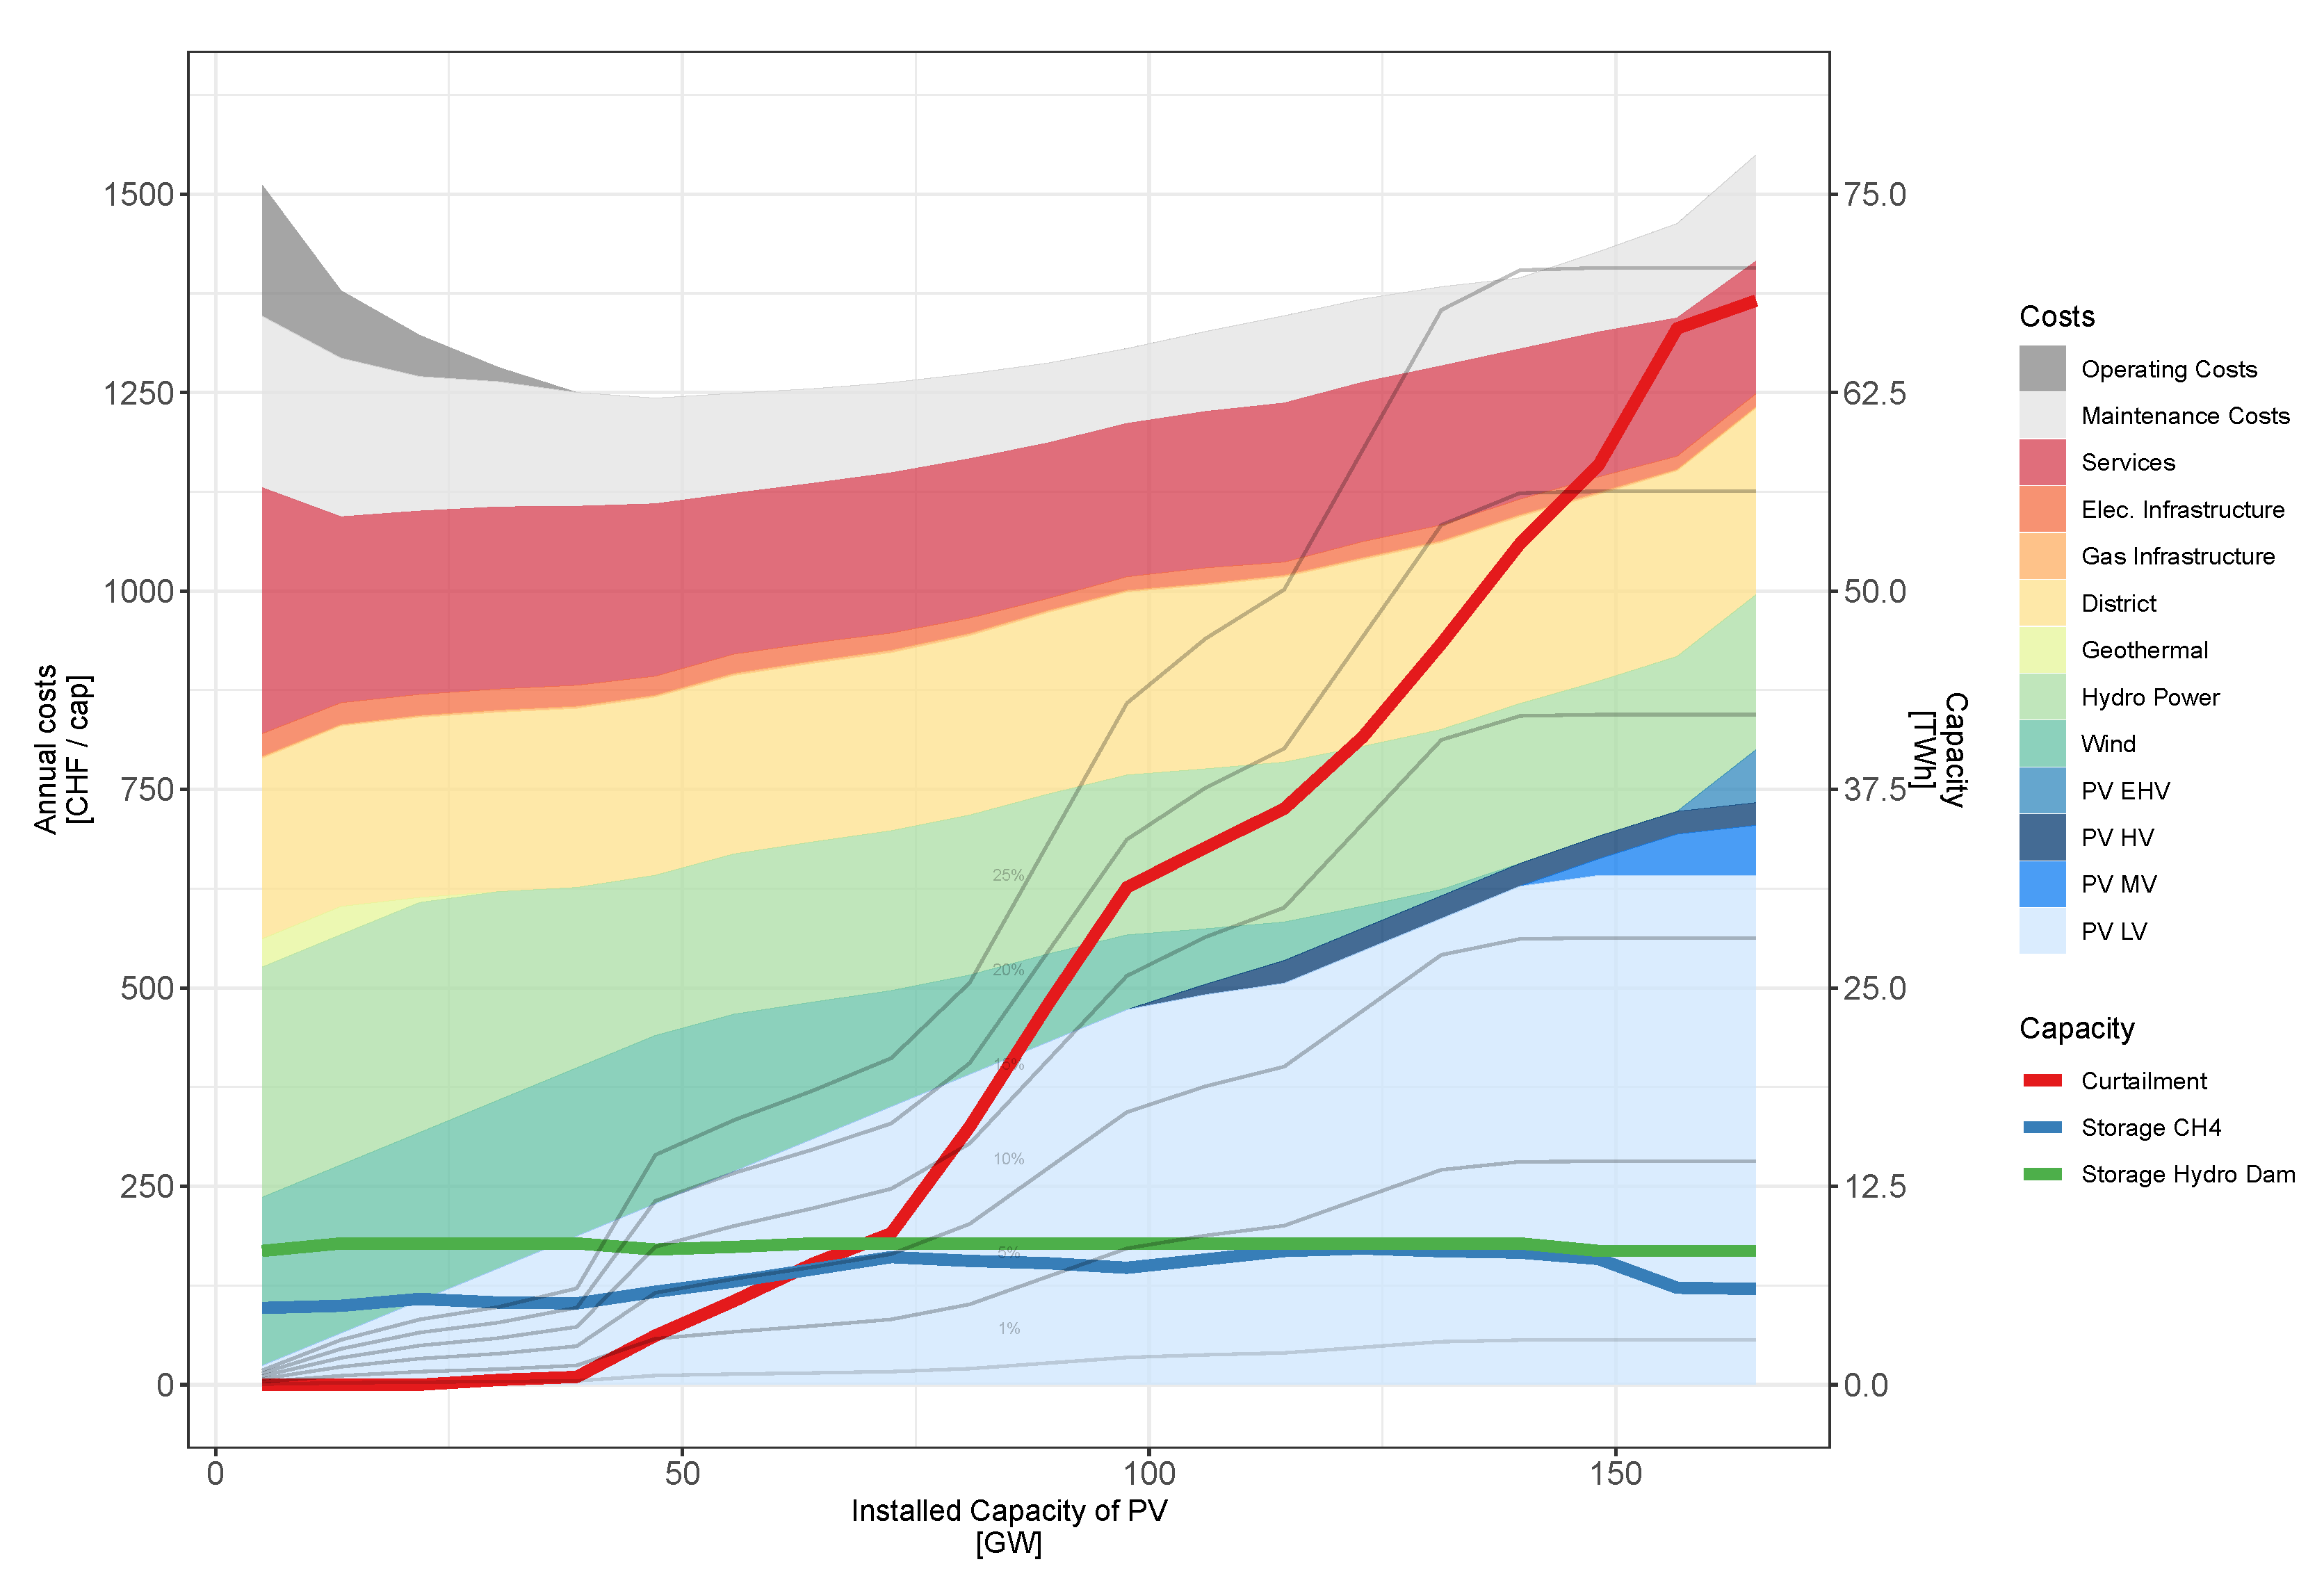
Figure 5) integration strategies highlights substantial trade-offs in energy system dynamics. From 0 to 25 GW of PV deployment, biomass plays a critical role and is used until the onset of 25 GW of PV, where it gradually phases out. During this phase, LV PV linearly increases from an existing 4 to 21 GW. Wind energy, initially utilized to its 20 GW maximum, linearly decreases to 0 GW as PV installations soar to 125 GW, with the order of appearance of HV, MV and finally Extra High Voltage (EHV) PV after each reaches its maximum, indicating a shift from diverse renewable sources to predominantly solar. This transition is not without economic implications as the energy system’s total cost inflates by 20% due to reliance on biomass and geothermal energy with higher service costs.
The comparative analysis emphasizes the necessity of a mixed approach, combining centralized and decentralized resources for an ideal system. Centralization benefits from utilizing other resources, such as biomass, which is transformed at centralized units for a traditional distribution system, thus reducing the system’s efficiency and increasing costs.
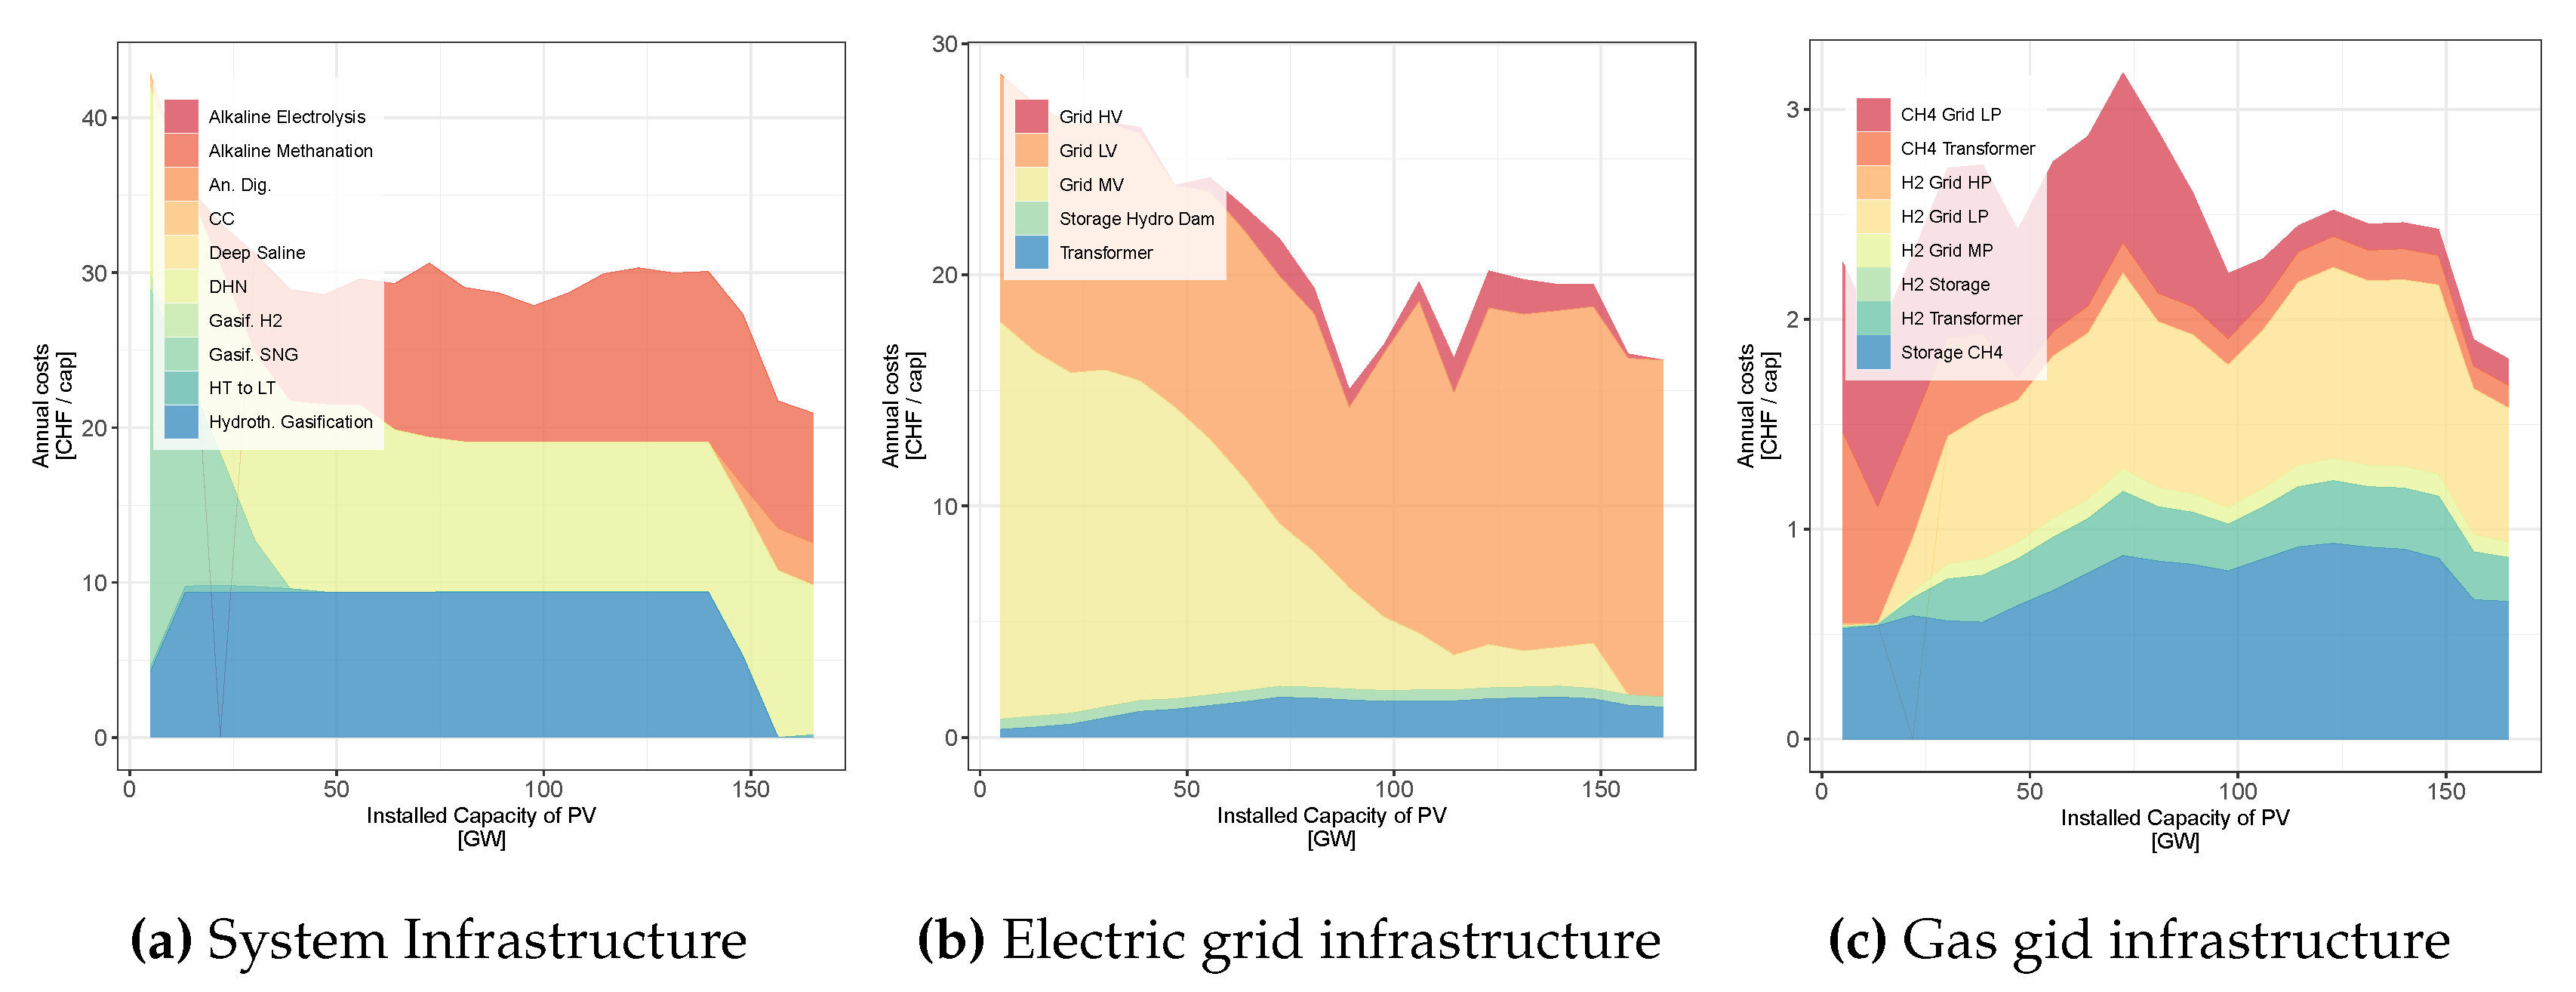
Focusing on electric (
Figure 6b) and gas (
Figure 6c) grids, the study reveals significant shifts in infrastructure needs with varying PV levels. At lower PV installations (0 GW- 25 GW), the primary energy shortfall is counterbalanced by extensive gasification of biomass and maximum wind utilization. This requires hefty investments in MV electric grids for wind electricity distribution infrastructure and methane infrastructure such as compressors and storage technologies for biogenic gas. However, as PV reaches optimal levels (25 GW- 35 GW), electricity becomes the primary energy carrier, reducing the need for gas and thus minimizing investments in associated infrastructure.
As PV share increases further, the electric grid’s configuration evolves. The reduction in wind use diminishes the need for MV grid reinforcement but increases the reinforcement needed for the LV grid due to decentralized PV. Excess electricity is then stored via the Low Pressure (LP) grid thanks to electrolysis and methanation, necessitating methane storage infrastructure of up to TWh, doubling the existing seasonal storage capacity. When wind is phased out completely, the electricity produced in winter suffices, leading to a significant summer curtailment and consequent reduction in the need for gas infrastructure.
Curtailment emerges as a significant issue at higher levels of PV deployment, primarily due to the cost and limitations of transforming and storing excess electricity.
Figure 5 represents the curtailment as the blue line, complemented by iso-curves, corresponding to the share of the LV PV production. Curtailment remains negligible until 30 GW of installed PV but begins escalating beyond this point, reaching 5% of total decentralized PV production at 50 GW. The reduction in wind usage exacerbates seasonal disparities between winter consumption and production, leading to 15% of LV PV electricity curtailment at 80 GW of installed capacity. As MV and HV PV installations are deployed, the situation intensifies, culminating in 23% of curtailment once the full PV potential is exploited. This indicates the growing challenge of managing overproduction as reliance on solar increases, stressing the importance of innovative storage solutions and more flexible grid management to accommodate the fluctuations inherent in a predominantly solar-based energy system.
4.4. Self-Consumption in Focus: Decentralized Model’s Perspective
Following the decentralization analysis, self-consumption within the new model plays a pivotal role. This section examines how the integration of prosumer behavior, characterized by simultaneous energy production and consumption, influences the design and efficiency of decentralized energy systems. This analysis aims to reveal how self-consumption shapes the deployment and optimization of renewable energy resources, especially PV, within the decentralized model, offering insights into its impact on the system’s overall sustainability, economic feasibility, and adaptability.
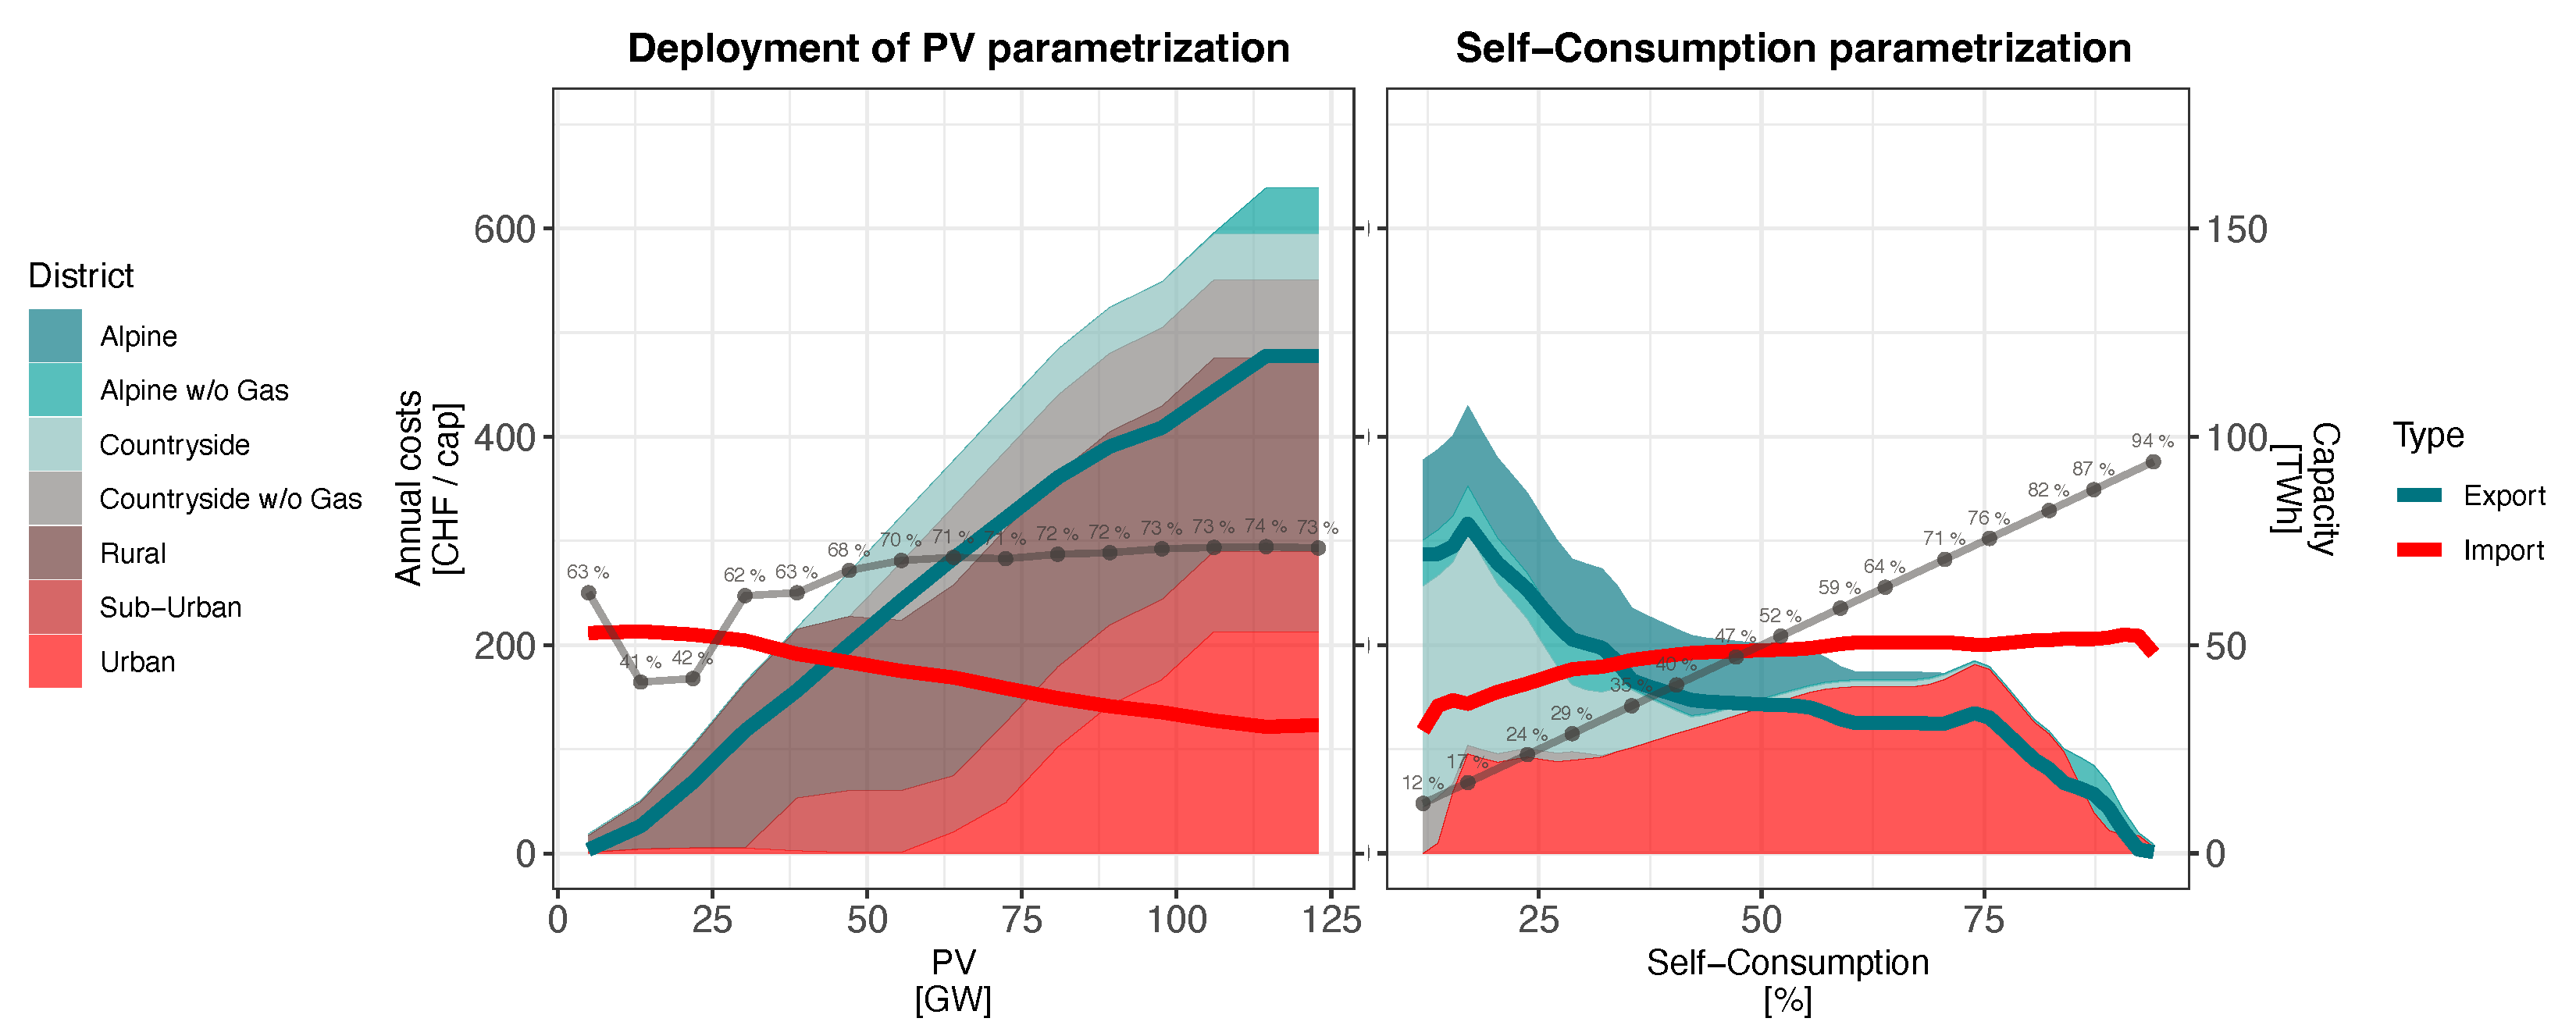
The relationship between self-consumption and PV deployment is intricately detailed in
Figure 7. As the share of self-consumption increases, the total PV installations decrease, with the most profound reduction occurring at the economic optimum of 75% self-consumption. At this optimum, the decentralized PV investments are reduced to CHF 200/cap, significantly lower than the CHF 600/cap per year at maximum PV deployment. While optimizing for the total cost at ideal self-consumption, this reduction in PV capacity aligns with a total systemic cost reduction of 10%. The systemic cost at this optimization point stands at CHF 1230/cap, compared to the CHF 1400/cap/year with full PV deployment. By prioritizing self-consumption, the system effectively halves the capacity of PV installations to 100 GW, indicating a strategic underutilization of PV to leverage the economic benefits of self-consumption. This nuanced approach exemplifies the complex balancing act between maximizing renewable energy capacity and achieving economic efficiency and sustainability in the decentralized energy system.
The strategic placement of PV installations in sunny areas underscores the importance of optimizing geographic potentials for increased yield and efficiency. While self-consumption is prioritized in sunny, urban areas, the prioritization is maximized in the systemic approach to overinstall PV to export to less PV-optimal places. The decision to focus PV installations in sunny areas before considering energy exports is a testament to the delicate balance between maximizing local energy production and managing the broader energy network. Exporting energy, especially from high-yield sunny areas, involves additional considerations, particularly the cost of reinforcing the grid infrastructure. This reinforcement can amount to CHF 60/cap at high levels of self-consumption, accounting for 15 % of the configuration with decentralized PV. While necessary for managing exports, this cost reflects the broader economic implications of geographic optimization. The system’s reliance on sunny areas for self-consumption and subsequent energy export exemplifies the strategic interplay between local resource utilization and broader energy system integration.
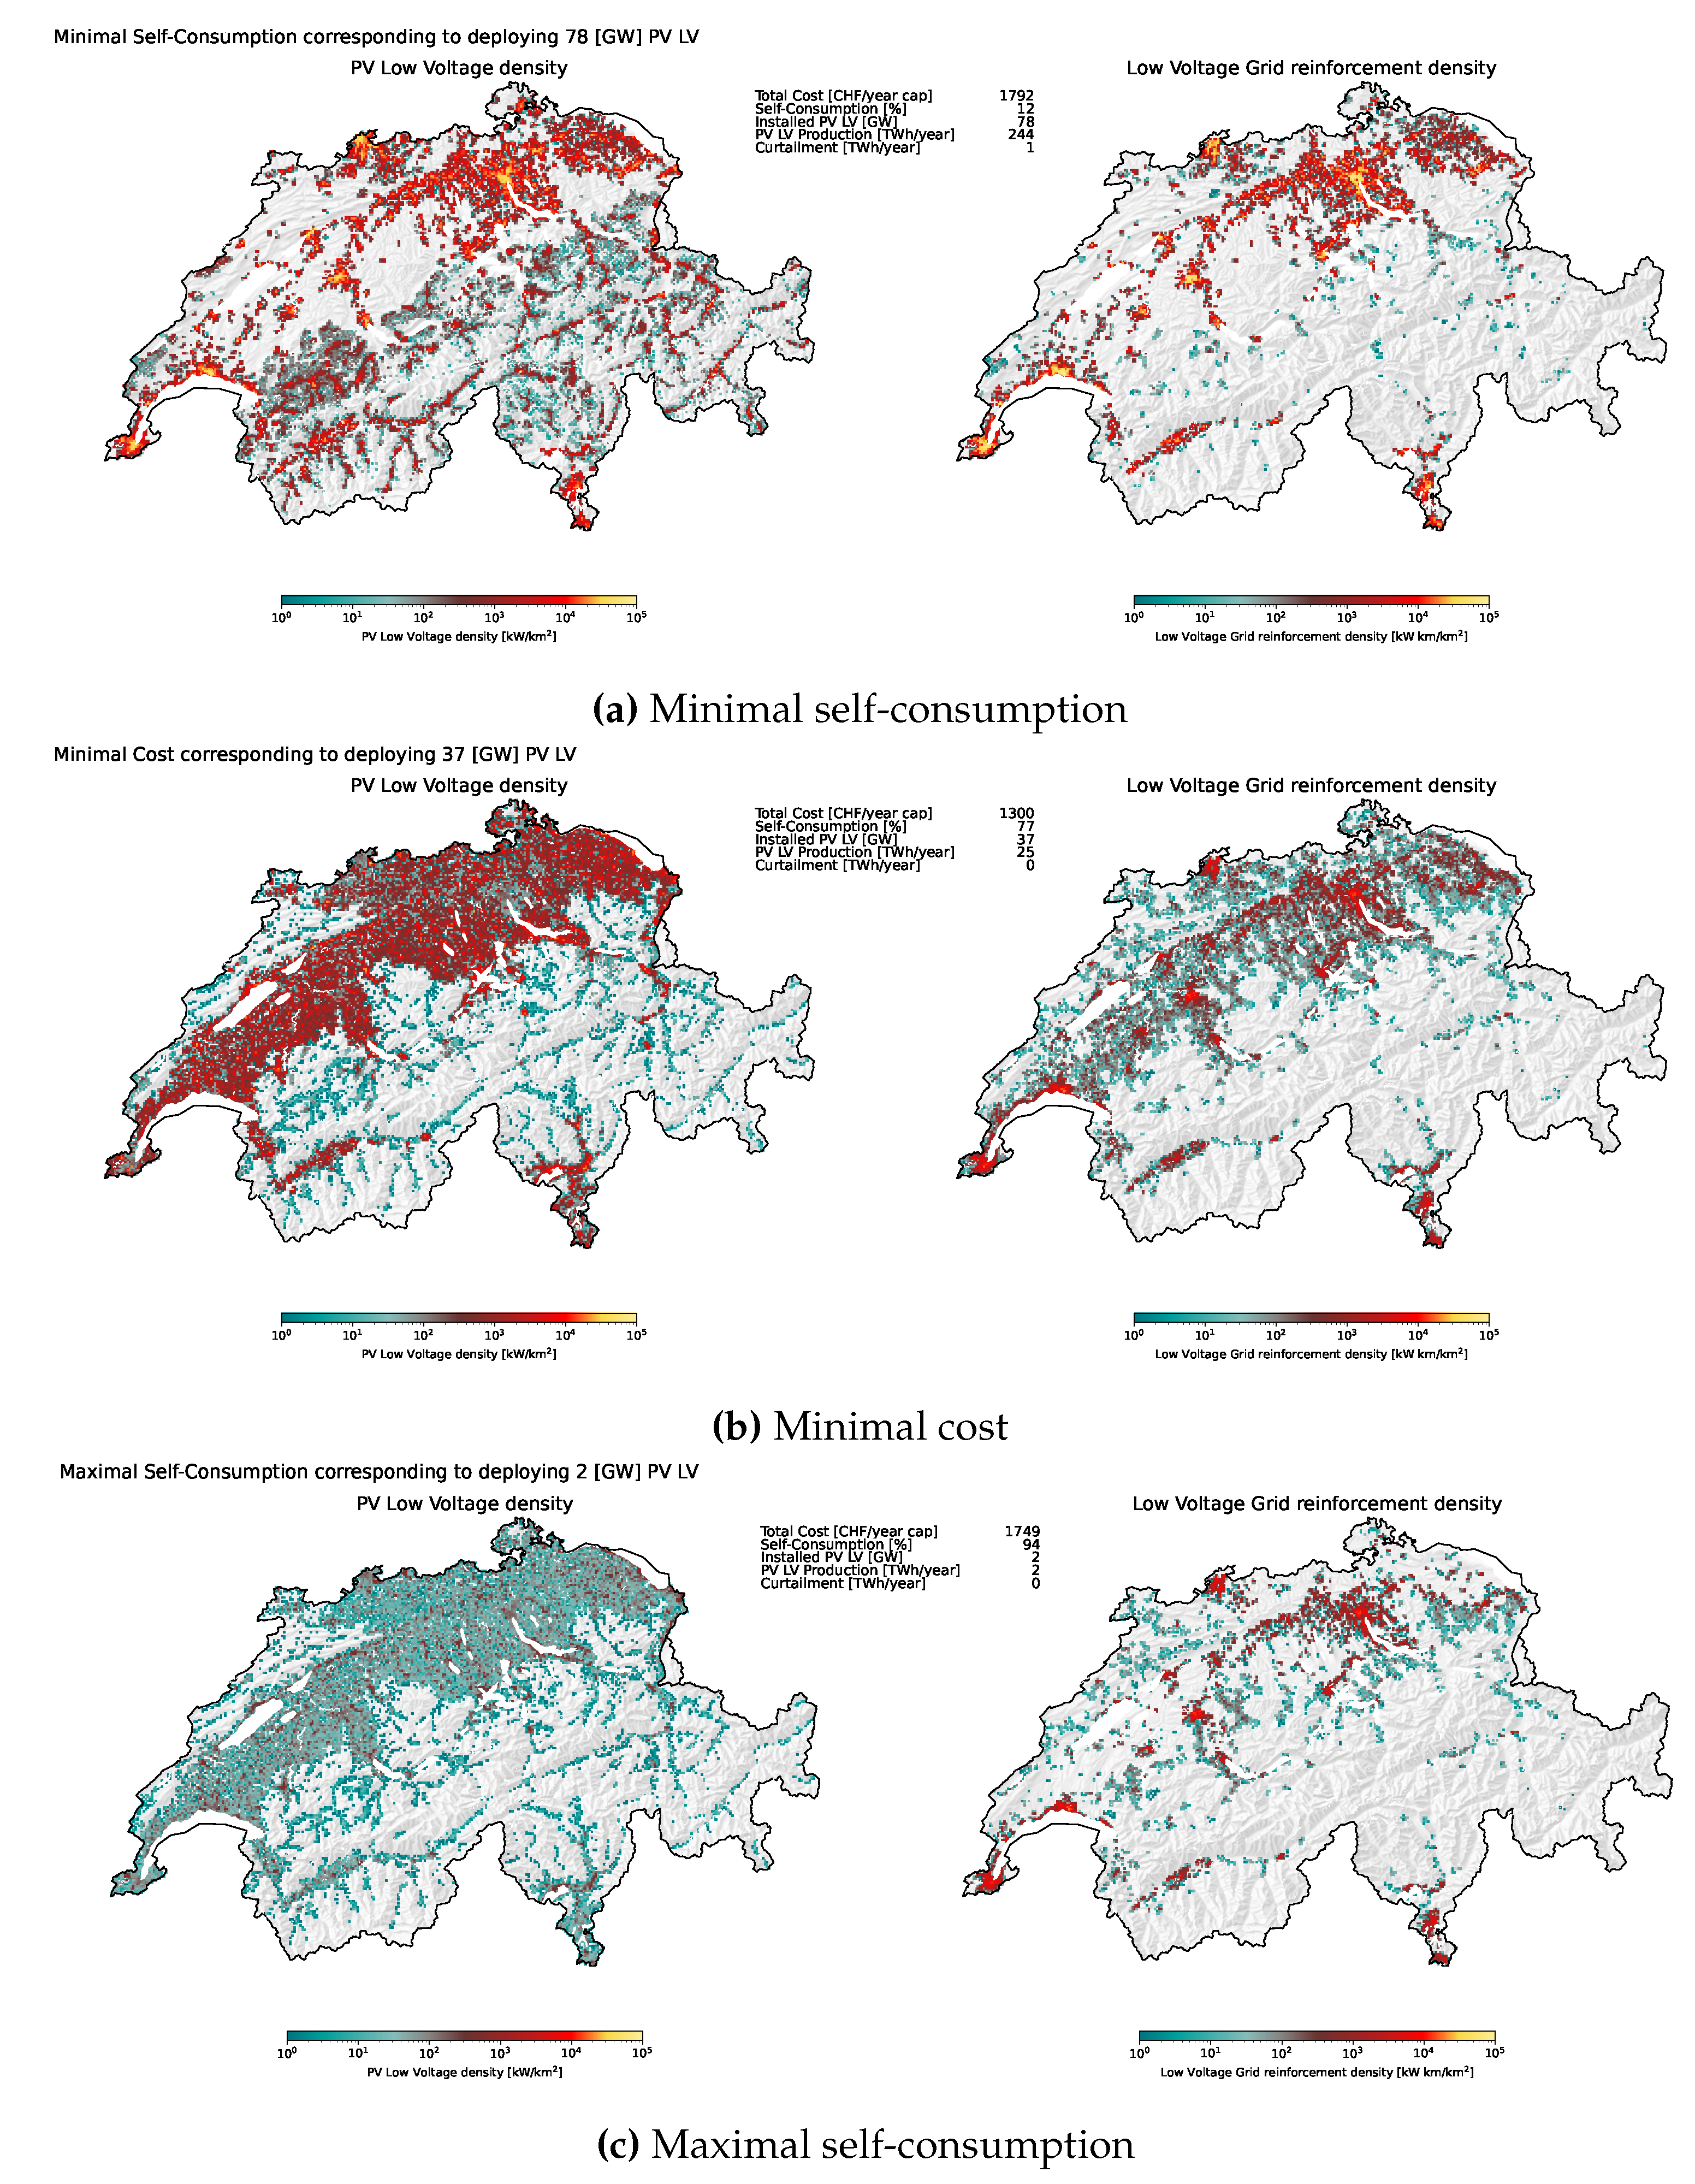
The transition to increased self-sufficiency in the decentralized model is marked by a significant reduction in grid strain, as illustrated by
Figure 8 (right column). This figure shows a clear shift from intensive grid reinforcement needs in centralized urban centers to more dispersed reinforcement across residential areas, particularly as self-consumption reaches higher percentages. At maximum self-consumption, the reinforcement is concentrated in semi-urban and urban centers, with higher demand for imported energy due to the electrification of the heating sector (
Figure 8c). This reduces the overall reinforcement need to approximately 100 kW km/km2. This strategic reduction in grid strain is achieved by integrating centralized storage options. Hydro dams are utilized to their total
TWh capacity, acting as a primary source of seasonal energy storage, while varying methane storage needs prompt additional infrastructure reinforcement, incurring annual costs between CHF 18-25/cap. The cost of accommodating alkaline methanation units, which convert excess electricity into methane, peaks at an additional annual CHF 20/cap. This multifaceted approach, leveraging both centralized storage options and infrastructural adaptations, underscores the pivotal role of self-sufficiency in reducing reliance on centralized systems, enhancing system efficiency, and promoting sustainable energy practices in the decentralized model.
5. Discussion
The development of a regionalized energy system model, as presented in this study, addresses the critical need for understanding the intricacies of transitioning towards renewable and decentralized systems. This model’s significance lies in its capacity to capture the diverse and region-specific energy demand characteristics, renewable energy potential, and infrastructure capabilities. By integrating decentralized energy models within a national-scale framework through soft-linking, the study evaluates the interaction between local production and consumption, highlighting the role of photovoltaic (PV) systems and self-consumption in Swiss energy planning [
1]. This approach enhances the model’s utility for energy planners and modelers and provides a foundation for strategic planning sensitive to regional disparities.
The comparative analysis between centralized and decentralized strategies & models reveals distinct energy transition management approaches. The centralized model, with its broad control scale, is essential for managing large-scale energy storage and distribution, ensuring a stable energy supply. Conversely, the decentralized model emphasizes local optimization and adaptability, demonstrating significant potential in enhancing system resilience and energy independence. This study’s findings indicate that while the decentralized model underutilizes PV capacity to favor local consumption, it strategically reduces system costs by 10% to CHF 1230 CHF per capita and PV installation requirements to 35 GW, about 23% of the potential capacity [
1]. Such adaptability is crucial in an era of rapid technological advancements and evolving energy demands, suggesting that a balanced integration of centralized and decentralized strategies could offer a more resilient and efficient energy system.
The integration strategies of PV installations underscore significant trade-offs between maximizing renewable energy capacity and achieving economic efficiency. The analysis reveals that encouraging self-consumption reduces grid strain and promotes energy independence. Specifically, the study identifies a reduced need for grid reinforcement and leverages economic benefits by strategically underutilizing PV capacity in favor of local consumption, minimizing the need for extensive grid infrastructure investments. Furthermore, the decentralized model’s preference for direct electric heating technologies and localized PV systems reflects a shift towards more flexible, consumer-oriented energy solutions. This approach not only addresses the demands of a transitioning energy system but also highlights the need for innovative storage solutions and flexible grid management to accommodate high levels of self-consumption and intermittent renewable energy sources.
The insights derived from this comparative analysis between centralized and decentralized energy models illuminate the path for future research, particularly in energy storage solutions, grid management, and the integration of decentralized entities. The nuanced understanding of PV integration strategies and the pivotal role of self-consumption within decentralized models underscore the complexity of achieving a resilient and sustainable energy future. Further investigation into sector coupling and the adaptation of district configurations across various sectors could enhance the efficiency and sustainability of the energy system. Additionally, exploring the dynamic transition model that accounts for evolving climatic conditions and technological advancements will be crucial in guiding incremental changes and investments over time, ultimately facilitating the achievement of the Paris Agreement targets.
6. Conclusions
This research investigated the dynamics between centralized and decentralized energy planning strategies in the Swiss energy system, focusing on PV system integration and district-level self-consumption. A regionalized model was developed to understand local and national energy system interactions, aiming to optimize energy planning for a carbon-neutral and independent Swiss energy system. This model assessed the impacts of system centralization and decentralization on efficiency, resilience, and cost-effectiveness.
Regionalized modeling is crucial for developing energy solutions that match regional demand and resource variations, improving system efficiency and effectiveness. The novel clustering approach for identifying typical districts allows for integrating localized energy production and consumption within a national framework. This method addresses computational challenges and improves system sustainability and efficiency. Identifying typical districts enables accurate and efficient energy system modeling, emphasizing the importance of region-specific strategies for achieving a sustainable energy future.
The study compared a new regionalized model with traditional models lacking regionalization, focusing on the ability of the regionalized model to identify optimal infrastructure development strategies. This comparison revealed trade-offs related to efficiency, resilience, and cost-effectiveness, highlighting the integration challenges and benefits of localized energy solutions within a national framework.
The findings highlight the need for further research into energy storage and grid management solutions to integrate intermittent renewable energy sources effectively. Additionally, the results support policy development that promotes decentralized energy production and local renewable source integration.
7. Outlook
As the world navigates the transition to sustainable and autonomous energy systems, the insights from this study pave the way for future research and innovation. The following points outline critical areas for further exploration:
The model’s application in understanding the impacts of climate change on building demands and resource availability is crucial. As climate conditions evolve, the optimal configurations for decentralized systems must adapt. Developing a dynamic transition model will provide a roadmap for achieving the Paris Agreement targets while considering the evolving climatic conditions. This will guide incremental changes and investments over time.
In the context of energy systems, the integration of decentralized entities (prosumers) with centralized systems is crucial. This approach recognizes that market-driven mechanisms may not suffice for optimal system performance. Thus, it advocates for a more sophisticated model where direct optimization strategies are employed from the centralized system’s perspective. This involves leveraging market forces and implementing additional regulatory and technological interventions. These interventions aim to enhance system efficiency and reliability by effectively harmonizing the contributions of decentralized actors within the broader centralized infrastructure.
Another crucial area is expanding sector coupling and district configuration adaptation in the industry, services, and agriculture sectors. Applying the same methodology to analyze different industrial configurations can provide various services, enhancing the efficiency and sustainability of both sectors via sector coupling.
By addressing these areas, future research can build on the findings of this study to further enhance the resilience, efficiency, and sustainability of energy systems. The journey towards a carbon-neutral and energy-independent future is complex and multifaceted, but it is increasingly achievable with continued research, innovation, and policy support.
Author Contributions
Conceptualization, J.S, F.M and M.M.; methodology, J.S and A.C.; software, J.S., A.C. and C.T.; validation, J.S., A.C. and C.T.; formal analysis, J.S., A.C. and C.T.; investigation, J.S., A.C. and C.T.; resources, J.S., A.C. and C.T.; data curation, J.S. and A.C.; writing—original draft preparation, J.S., A.C. and C.T.; writing—review and editing, J.S., A.C. and C.T.; visualization, J.S., A.C. and C.T.; supervision, M.M. and F.M.; project administration, M.M; funding acquisition, M.M. All authors have read and agreed to the published version of the manuscript.
Funding
The authors would like to acknowledge the support of the Flagship Initiative under the project “Flagship PFFS-21-03” Blue City and the support of the Swiss Federal Office of Energy SFOE as part of the SWEET consortium
SWICE.
Institutional Review Board Statement
Not applicable.
Informed Consent Statement
Not applicable.
Data Availability Statement
Conflicts of Interest
The authors declare no conflicts of interest.
Abbreviations
Nomenclature
The following convention in nomenclature is applied
Modeling variables:
Modeling parameters:
Modeling sets:
General parameters not included in the model:
|
specific cost |
|
|
Existing capacity |
|
|
number |
|
|
time |
|
|
Efficiency |
|
|
Annualisation factor |
|
|
Cost |
|
|
Installation size |
|
|
Installation use |
|
|
Configuration selection |
|
|
Cost |
Investment, Operation and Maintenance |
|
Indicators |
|
|
Periods |
|
|
Technologies |
|
|
Construction |
|
Investment |
|
Maintenance |
|
Objective |
| t |
Period |
|
Total |
Appendix A Terminology
This paper carefully distinguishes between strategic considerations in energy system development (e.g., centralized vs. decentralized approaches) and the technical aspects of energy models (e.g., top-down vs. bottom-up structures). Additionally, it highlights the importance of regionalization in model design to accurately capture the complex realities of national and sub-national energy systems.
Energy Planning Strategies: Refers to the overarching approaches and methods adopted for the development, management, and optimization of energy systems at various scales. These strategies may include policy decisions, infrastructure investments, and operational practices to achieve specific energy systems goals, such as sustainability, resilience, or independence.
Model Structures and Capabilities: Pertains to the technical and computational frameworks used to simulate and analyze energy systems. This includes the internal algorithms, data handling methods, and analytical processes that determine a model’s ability to represent energy dynamics accurately. Model structures and capabilities are distinct from the strategic applications of model outputs in energy planning.
Centralized (Top-Down) Models are defined as those that approach energy system planning from a national or global perspective, often emphasizing large-scale infrastructure and energy flows managed by a central authority. The term "centralized" may also refer to energy planning strategies that rely on large, centralized energy production facilities and infrastructure.
Decentralized (Bottom-Up) Models refer to approaches that focus on local energy generation, distribution, and consumption, highlighting the role of individual or community-level actors, such as prosumers. In strategic terms, "decentralization" refers to the shift towards local autonomy and energy production, promoting smaller-scale, distributed energy resources.
Regionalization in Modeling: Addresses the need to incorporate geographic and regional specificities into energy models, recognizing the diversity of energy demands, resource availability, and infrastructure conditions across different areas. Regionalization enhances the model’s accuracy in representing the spatial dimensions of energy systems.
Strategy vs. Model Clarification: Throughout this paper, when discussing "strategies," the focus is on energy planning and policy implications derived from model analyses. In contrast, discussions on "models" pertain to their structural and computational aspects, including their design to simulate energy system dynamics effectively.
Appendix B Swiss Energy System Typification
Figure A1.
Clustering input parameter density representation based on the Swiss Building Stock Distribution.
Figure A1.
Clustering input parameter density representation based on the Swiss Building Stock Distribution.
Appendix C District Energy System Configurations
Figure A2.
Identified configuration of the districts.
Figure A2.
Identified configuration of the districts.
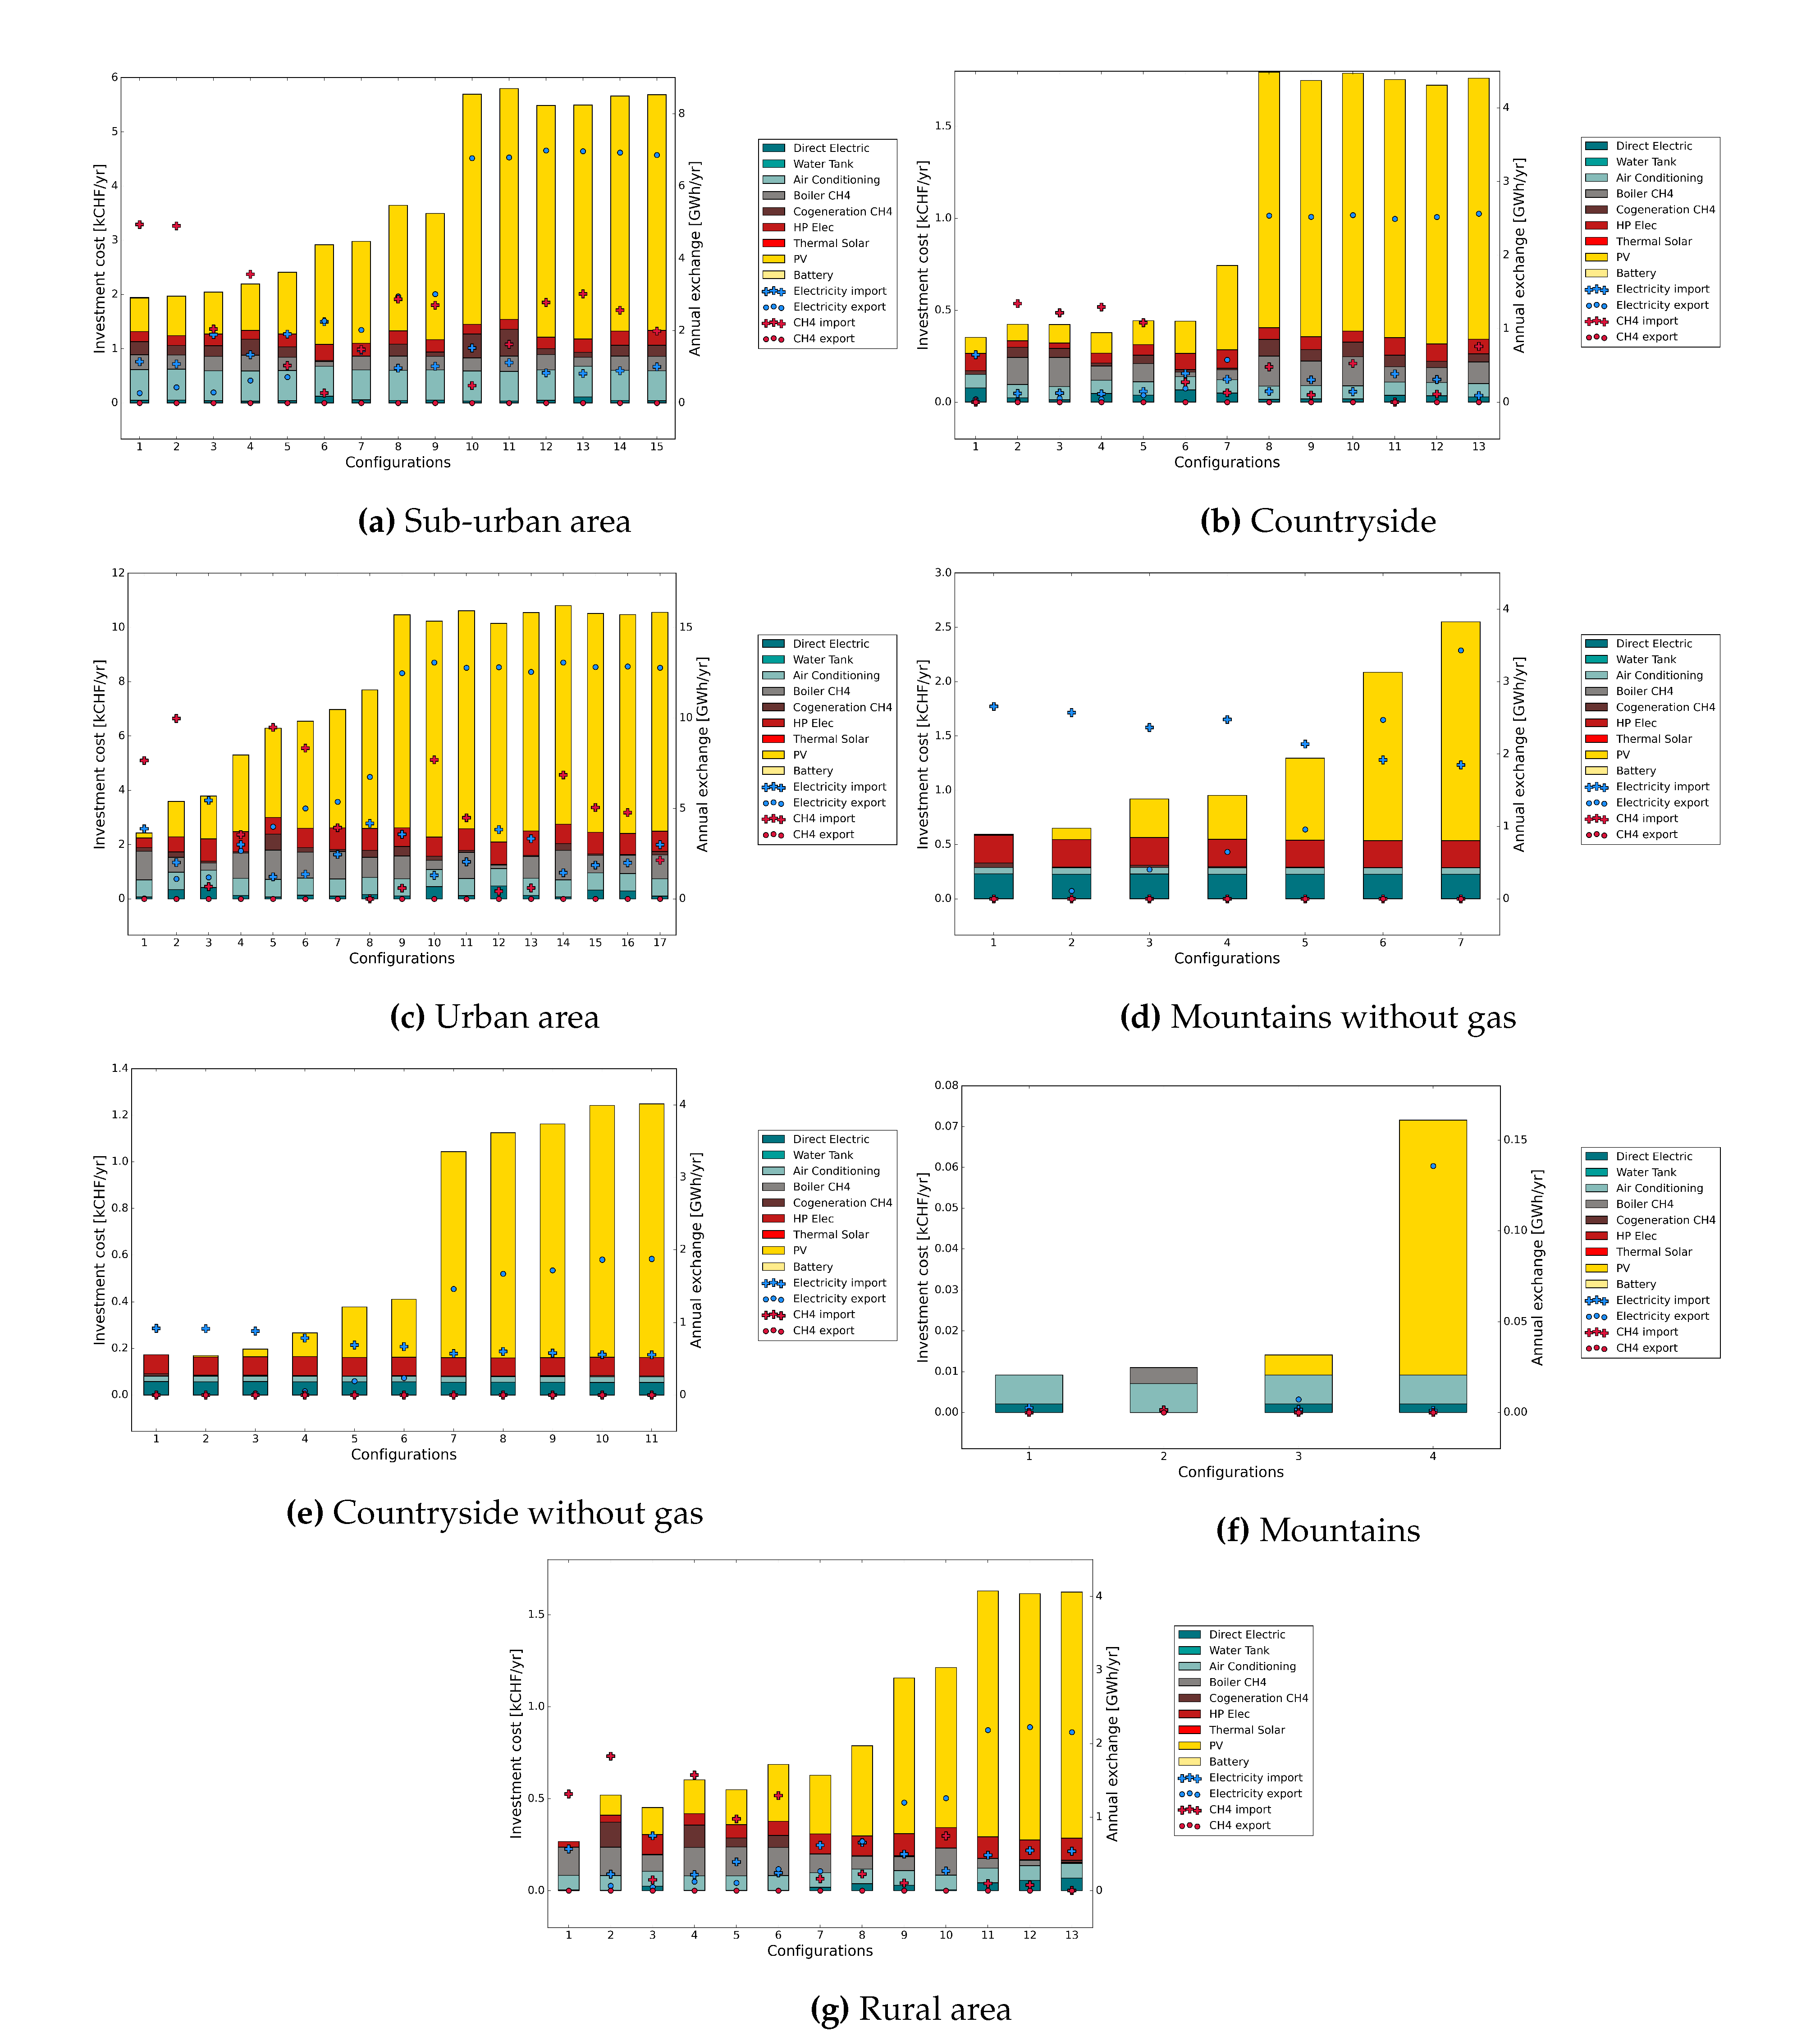
Figure A3.
Identified configuration of the districts with renovated buildings.
Figure A3.
Identified configuration of the districts with renovated buildings.
References
- Schnidrig, J.; Cherkaoui, R.; Calisesi, Y.; Margni, M.; Maréchal, F. On the role of energy infrastructure in the energy transition. Case study of an energy independent and CO2 neutral energy system for Switzerland. Frontiers in Energy Research 2023, 11. [Google Scholar] [CrossRef]
- Middelhauve, L.; Terrier, C.; Maréchal, F. Decomposition Strategy for Districts as Renewable Energy Hubs. IEEE Open Access Journal of Power and Energy 2022, 9, 287–297, Conference Name: IEEE Open Access Journal
of Power and Energy,. [Google Scholar] [CrossRef]
- Alcamo, J.; Shaw, R.; Hordijk, L., Eds. The RAINS Model of Acidification: Science and Strategies in Europe;
Springer Netherlands, 1990. ZSCC: 0000002.
- Manne, A.; Mendelsohn, R.; Richels, R. MERGE: A model for evaluating regional and global effects of GHG
reduction policies. Energy Policy 1995, 23, 17–34. ZSCC: 0001081,. [CrossRef]
- Stadler, P.; Maréchal, F. The integrative role of natural gas in the energy transition of Switzerland. Technical report, Gaznat, Lausanne, Switzerland, 2020.
- Clack, C.T.M.; Qvist, S.A.; Apt, J.; Bazilian, M.; Brandt, A.R.; Caldeira, K.; Davis, S.J.; Diakov, V.; Handschy, M.A.; Hines, P.D.H.; et al. Evaluation of a proposal for reliable low-cost grid power with 100% wind, water, and solar. Proceedings of the National Academy of Sciences 2017, 114, 6722–6727. [Google Scholar] [CrossRef]
- Jensen, I.G.; Wiese, F.; Bramstoft, R.; Münster, M. Potential role of renewable gas in the transition of electricity and district heating systems. Energy Strategy Reviews 2020, 27, 100446, ZSCC: 0000013,. [Google Scholar] [CrossRef]
- Dujardin, J.; Kahl, A.; Kruyt, B.; Bartlett, S.; Lehning, M. Interplay between photovoltaic, wind energy and storage hydropower in a fully renewable Switzerland. Energy 2017, 135, 513–525, ZSCC: 0000054,. [Google Scholar] [CrossRef]
- Heide, D.; von Bremen, L.; Greiner, M.; Hoffmann, C.; Speckmann, M.; Bofinger, S. Seasonal optimal mix of wind and solar power in a future, highly renewable Europe. Renewable Energy 2010, 35, 2483–2489, ZSCC:
0000423,. [Google Scholar] [CrossRef]
- Rasmussen, M.G.; Andresen, G.B.; Greiner, M. Storage and balancing synergies in a fully or highly renewable pan-European power system. Energy Policy 2012, 51, 642–651, ZSCC: 0000224,. [Google Scholar] [CrossRef]
- Luthander, R.; Widén, J.; Nilsson, D.; Palm, J. Photovoltaic self-consumption in buildings: A review. Applied Energy 2015, 142, 80–94. [Google Scholar] [CrossRef]
- Harb, H.; Paprott, J.N.; Matthes, P.; Schütz, T.; Streblow, R.; Müller, D. Decentralized scheduling strategy of heating systems for balancing the residual load. Building and Environment 2015, 86, 132–140. [Google Scholar] [CrossRef]
- Schütz, T.; Hu, X.; Fuchs, M.; Müller, D. Optimal design of decentralized energy conversion systems for smart microgrids using decomposition methods. Energy 2018, 156, 250–263. [Google Scholar] [CrossRef]
- Bastholm, C.; Henning, A. The use of three perspectives to make energy implementation studies more culturally informed. Energy, Sustainability and Society 2014, 4, 3. [Google Scholar] [CrossRef]
- Li, F.G.; Trutnevyte, E.; Strachan, N. A review of socio-technical energy transition (STET) models. Technological Forecasting and Social Change 2015, 100, 290–305. [Google Scholar] [CrossRef]
- IAEA. Wien Automatic System Planning (WASP) Package A Computer Code for Power Generating System Expansion Planning Version WASP-IV. Text VI, IAEA, Vienna, 2019. ZSCC: NoCitationData[s0] Publisher: IAEA.
- Capros, P.; E3MLab, ICCS, NTUA. General Equilibrium Model for Economy – Energy – Environment. Model description 1, National Technical University of Athens, Athens, 2012. ZSCC: NoCitationData[s0].
- Havlìk, P. Methodology underlying the CAPRI model. Technical report, IIASA, Laxenburg, Austria, 2012. ZSCC: NoCitationData[s0].
- Leuthold, F.U.; Weigt, H.; von Hirschhausen, C. A Large-Scale Spatial Optimization Model of the European Electricity Market. Networks and Spatial Economics 2012, 12, 75–107, ZSCC: 0000211,. [Google Scholar] [CrossRef]
- Becker, H.; Spinato, G.; Maréchal, F. A Multi-Objective Optimization Method to integrate Heat Pumps in Industrial Processes. In Computer Aided Chemical Engineering; Pistikopoulos, E.N.; Georgiadis, M.C.; Kokossis, A.C., Eds.; Elsevier, 2011; Vol. 29, 21 European Symposium on Computer Aided Process Engineering, pp. 1673–1677. [CrossRef]
- Jacobson, M.Z. Article 100% Clean and Renewable Wind, Water, and Sunlight All-Sector Energy Roadmaps for 139 Countries of the World. Proceedings of the National Academy of Sciences 2018. ZSCC: 0000000 Accepted: 2020-03-02T12:36:59Z. [CrossRef]
- Schlecht, I.; Weigt, H. Swissmod - A Model of the Swiss Electricity Market. SSRN Electronic Journal 2014. ZSCC: 0000044. [CrossRef]
- Morvaj, B.; Evins, R.; Carmeliet, J. Optimising urban energy systems: Simultaneous system sizing, operation and district heating network layout. Energy 2016, 116, 619–636, ZSCC: 0000125,. [Google Scholar] [CrossRef]
- Bartlett, S.; Dujardin, J.; Kahl, A.; Kruyt, B.; Manso, P.; Lehning, M. Charting the course: A possible route to a fully renewable Swiss power system. Energy 2018, 163, 942–955, ZSCC: 0000003,. [Google Scholar] [CrossRef]
- Abrell, J.; Eser, P.; Garrison, J.B.; Savelsberg, J.; Weigt, H. Integrating economic and engineering models for future electricity market evaluation: A Swiss case study. Energy Strategy Reviews 2019, 25, 86–106, ZSCC:
0000010,. [Google Scholar] [CrossRef]
- Gholizadeh, N.; Vahid-Pakdel, M.J.; Mohammadi-ivatloo, B. Enhancement of demand supply’s security using power to gas technology in networked energy hubs. International Journal of Electrical Power & Energy Systems 2019, 109, 83–94, ZSCC: NoCitationData[s0],. [Google Scholar] [CrossRef]
- Antenucci, A.; Crespo del Granado, P.; Gjorgiev, B.; Sansavini, G. Can models for long-term decarbonization policies guarantee security of power supply? A perspective from gas and power sector coupling. Energy Strategy Reviews 2019, 26, 100410, ZSCC: 0000003,. [Google Scholar] [CrossRef]
- Siala, K.; Mahfouz, M.Y. Impact of the choice of regions on energy system models. Energy Strategy Reviews 2019, 25, 75–85, ZSCC: 0000019,. [Google Scholar] [CrossRef]
- Tröndle, T.; Pfenninger, S.; Lilliestam, J. Home-made or imported: On the possibility for renewable electricity autarky on all scales in Europe. Energy Strategy Reviews 2019, 26, 100388, ZSCC: 0000028,. [Google Scholar] [CrossRef]
- Ruiz, P.; Nijs, W.; Tarvydas, D.; Sgobbi, A.; Zucker, A.; Pilli, R.; Jonsson, R.; Camia, A.; Thiel, C.; Hoyer-Klick, C.; et al. ENSPRESO - an open, EU-28 wide, transparent and coherent database of wind, solar and biomass energy potentials. Energy Strategy Reviews 2019, 26, 100379, ZSCC: 0000031,. [Google Scholar] [CrossRef]
- Bachner, G.; Mayer, J.; Steininger, K.W. Costs or benefits? Assessing the economy-wide effects of the electricity sector’s low carbon transition – The role of capital costs, divergent risk perceptions and premiums. Energy Strategy Reviews 2019, 26, 100373, ZSCC: 0000011,. [Google Scholar] [CrossRef]
- Siala, K.; de la Rúa, C.; Lechón, Y.; Hamacher, T. Towards a sustainable European energy system: Linking optimization models with multi-regional input-output analysis. Energy Strategy Reviews 2019, 26, 100391, ZSCC: 0000011,. [Google Scholar] [CrossRef]
- Pang, X.; Trubins, R.; Lekavicius, V.; Galinis, A.; Mozgeris, G.; Kulbokas, G.; Mörtberg, U. Forest bioenergy feedstock in Lithuania – Renewable energy goals and the use of forest resources. Energy Strategy Reviews 2019, 24, 244–253. [Google Scholar] [CrossRef]
- Dias, L.P.; Simões, S.; Gouveia, J.P.; Seixas, J. City energy modelling - Optimising local low carbon transitions with household budget constraints. Energy Strategy Reviews 2019, 26, 100387. [Google Scholar] [CrossRef]
- Bernath, C.; Deac, G.; Sensfuß, F. Influence of heat pumps on renewable electricity integration: Germany in a European context. Energy Strategy Reviews 2019, 26, 100389, ZSCC: 0000002,. [Google Scholar] [CrossRef]
- Stadler, P.; Girardin, L.; Maréchal, F. The swiss potential of model predictive control for building energy systems. In Proceedings of the 2017 IEEE PES Innovative Smart Grid Technologies Conference Europe (ISGT-Europe). September 2017, pp. 1–6.. [CrossRef]
- Gu, B.; Meng, H.; Ge, M.; Zhang, H.; Liu, X. Cooperative multiagent optimization method for wind farm power delivery maximization. Energy 2021, 233, 121076, ZSCC: 0000000,. [Google Scholar] [CrossRef]
- Witek, M.; Uilhoorn, F.E. Influence of gas transmission network failure on security of supply. Journal of Natural Gas Science and Engineering 2021, 90, 103877, ZSCC: 0000001,. [Google Scholar] [CrossRef]
- Holweger, J.; Bloch, L.; Ballif, C.; Wyrsch, N. Mitigating the impact of distributed PV in a low-voltage grid using electricity tariffs. Electric Power Systems Research 2020, 189, 106763. [Google Scholar] [CrossRef]
- Wakui, T.; Hashiguchi, M.; Yokoyama, R. Structural design of distributed energy networks by a hierarchical combination of variable- and constraint-based decomposition methods. Energy 2021, 224, 120099. [Google Scholar] [CrossRef]
- Girardin, L. A GIS-based Methodology for the Evaluation of Integrated Energy Systems in Urban Area. PhD thesis, EPFL, Lausanne, 2012. [CrossRef]
- Gupta, R.; Sossan, F.; Paolone, M. Countrywide PV hosting capacity and energy storage requirements for distribution networks: The case of Switzerland. Applied Energy 2021, 281, 116010, ZSCC: 0000005,. [Google Scholar] [CrossRef]
- Terrier, C.; Loustau, J.; Maréchal, F. From Local Energy Communities Towards National Energy System: A Grid-Aware Techno-Economic Analysis. In Proceedings of the 36th International Conference on Efficiency,
Cost, Optimization, Simulation and Environmental Impact of Energy Systems (ECOS 2023), Las Palmas De
Gran Canaria, Spain, 2023; pp. 3397–3408. [Google Scholar] [CrossRef]
- Terrier, C.; Loustau, J.R.H.; Lepour, D.; Maréchal, F. From Local Energy Communities towards National Energy System: A Grid-Aware Techno-Economic Analysis. Energies 2024, 17, 910. [Google Scholar] [CrossRef]
- Chuat, A.; Schnidrig, J.; Terrier, C.; Marechal, F. Identification of Typical District Configurations: A Two-Step
Global Sensitivity Analysis Framework. In Proceedings of the 36th International Conference on Efficiency,
Cost, Optimization, Simulation and Environmental Impact of Energy Systems (ECOS 2023), Las Palmas De
Gran Canaria, Spain, 2023; pp. 2532–2543. [CrossRef]
- Morris, M.D. Factorial Sampling Plans for Preliminary Computational Experiments. Technometrics 1991,
33, 161–174. ZSCC: 0003974 Publisher: [Taylor & Francis, Ltd., American Statistical Association, American
Society for Quality],. [CrossRef]
- Sobol, I.M. On the distribution of points in a cube and the approximate evaluation of integrals. U.S.S.R. Computational Mathematics and Mathematical Physics 1969, 7, 86–112. [Google Scholar] [CrossRef]
- Moret, S.; Codina Girones, V.; Bierlaire, M.; Maréchal, F. Characterization of input uncertainties in strategic energy planning models. Applied Energy 2017, 202, 597–617. [Google Scholar] [CrossRef]
- Li, X.; Damartzis, T.; Stadler, Z.; Moret, S.; Meier, B.; Friedl, M.; Maréchal, F. Decarbonization in Complex Energy Systems: A Study on the Feasibility of Carbon Neutrality for Switzerland in 2050. Frontiers in Energy Research 2020, 8, 549615, ZSCC: 0000000,. [Google Scholar] [CrossRef]
- Morokoff, W.J.; Caflisch, R.E. Quasi-Monte Carlo Integration. Journal of Computational Physics 1995, 122, 218–230. [Google Scholar] [CrossRef]
|
Disclaimer/Publisher’s Note: The statements, opinions and data contained in all publications are solely those of the individual author(s) and contributor(s) and not of MDPI and/or the editor(s). MDPI and/or the editor(s) disclaim responsibility for any injury to people or property resulting from any ideas, methods, instructions or products referred to in the content. |
© 2024 by the authors. Licensee MDPI, Basel, Switzerland. This article is an open access article distributed under the terms and conditions of the Creative Commons Attribution (CC BY) license (http://creativecommons.org/licenses/by/4.0/).
