Preprint
Article

Application of Sodium Hypochlorite for Human Norovirus and Hepatitis A Virus Inactivation in Groundwater

Altmetrics

Downloads

153

Views

120

Comments

0

A peer-reviewed article of this preprint also exists.

This version is not peer-reviewed

Submitted:

22 February 2024

Posted:

22 February 2024

You are already at the latest version

Alerts
Abstract
In this study, the effect of NaOCl (10–200 ppm of Cl2) on the inactivation of human norovirus (HuNV) GII.4 and hepatitis A virus (HAV) in groundwater was investigated using PMA/RT­qPCR. Initially, 4.00 log copies/μL of HuNV GII.4 or 5.50 log copies/μL of HAV were artificially inoculated in ground water. The titers of HuNV GII.4 and HAV decreased significantly (p < 0.05) with increasing Cl2 concentrations. Ground water was treated with 10, 30, 50, 100, 150, and 200 ppm of Cl2, and the viable HuNV GII.4 was significantly (p < 0.05) reduced to 3.28 (0.21 log reduction), 3.18 (0.31 log reduction), 3.01 (0.48 log reduction), 2.75 (0.74 log reduction), 2.54 (0.95 log reduction), and 2.34 (1.15 log reduction) log copies/μL, respectively. The viable HAV was also significantly (p < 0.05) reduced to 4.99 (0.23 log reduction), 4.76 (0.46 log reduction), 4.55 (0.67 log reduction), 4.21 (1.01 log reduction), 3.89 (1.33 log reduction), and 3.64 (1.58 log reduction) log copies/μL, respectively. The decimal reduction time (D-value) (1-log reduction) of HuNV GII.4 and HAV infectivity in ground water was predicted as 116.7 and 98.9 ppm of Cl2, respectively using the first-order kinetics model (HuNV GII.4 ; y = - 0.0054x + 3.3585, R2= 0.97, HAV ; y = - 0.0091x + 5.0470, R2= 0.97). The result specifically suggests that 150–200 ppm Cl2 can potentially be used for the inactivation of > 1 log copies/μL HuNV GII.4 and HAV in ground water.
Keywords: 
Subject: Biology and Life Sciences  -   Virology

1. Introduction

Groundwater has long served humans and society in diverse ways, including for agriculture, domestic use, drinking, and industries, and has the largest annual production for a natural material [1]. However, in South Korea, most catering facilities that use groundwater for food production frequently report food poisoning caused by waterborne viruses [2]. In February 2018, a norovirus outbreak that affected nearly 200 people during the Pyeongchang Olympics was linked to groundwater contamination. Norovirus has also been found in kimchi (a traditional Korean fermented cabbage) processed and made from fresh agricultural produce [3]. From 1971 to 2008, contaminated groundwater was responsible for 52.7% of known drinking water outbreaks in the US. Additionally, approximately 32% of the US water outbreaks attributed to norovirus were caused by untreated groundwater [4]. Water-borne viruses account for 1.5 million deaths worldwide every year and are believed to be caused by a shortage of clean drinking water supply, hygiene, and sanitation. Furthermore, it is believed that waterborne viruses can remain infectious in groundwater for several months and can be detected in the environment for years if left untreated [5]. It is challenging to remove waterborne viruses from drinking water sources, such as groundwater, because of their small size and stable nature, making them more difficult to remove than bacteria [6]. After exposure to groundwater, they are highly persistent in the environment and are transferred via the fecal-oral route.
Chlorine-based disinfectants such as sodium hypochlorite (Cl2) are a commonly used disinfectant in the food industry in Korea due to its effectiveness and affordability [7]. Generally, chemical disinfectants, such as chlorine and chloramine, are added to remove viruses, bacteria, and other pathogenic microorganisms from groundwater. This is considered essential for restricting their transmission and is easy to use, safe, low cost, has outstanding biocidal effects, and minimal effect on the surface being decontaminated.
The major pathogens of viral gastroenteritis include rotavirus, adenovirus, norovirus, and hepatitis viruses. Among them, human norovirus (HuNV) and hepatitis A virus (HAV) have recently been recognized as significant causes of waterborne illnesses and are responsible for 23% of reported waterborne outbreaks in Korea in the last 5 years [8]. Water-borne virus outbreaks are known to spread through food, contaminated water (e.g., groundwater), and food handlers practicing poor personal hygiene. The HuNV genus is a non-enveloped positive-sense single-stranded RNA (+ ssRNA) virus that belongs to the Caliciviridae family [9]. Genetically, HuNV can be divided into multiple genogroups (GI–GⅩ) of which viruses from GI and GII cause almost all infections in humans [10]. A characteristic of HuNV infection is that a low level of infection may be sufficient to cause disease, and therefore a low concentration (10–100 viral particles) of the virus in drinking water constitutes a health risk. In addition, HuNV can enter municipal water supplies when old water pipes cause HuNV-contaminated wastewater to mix with drinking water.
HAV belongs to the family Picornaviridae. Its genome is a 27–32 nm non-enveloped capsid, positive-sense single-stranded RNA approximately 7.5 kb in length. HAV is responsible for causing viral hepatitis, resulting in 1000-10,000 cases/year in Korea and 4000-30,000 cases/year in the USA [11]. Since 2016, the number of people in Korea with hepatitis A has significantly increased. Furthermore, in 2017, there was a reported outbreak of hepatitis A caused by polluted groundwater in a park in South Korea [12]. The Ministry of Food and Drug Safety (MFDS) [13] reported that there are no water test methods available for water-borne viruses, except for HuNV; thus, more research is required to ensure the safety of water quality. The Korean public health authority examines the water-dispensing outlet of the groundwater facility quarterly. However, the tests only detect the presence of coliform bacteria and do not include viruses such as enteroviruses, norovirus, rotavirus, and HAV [14].
Therefore, the purpose of this study was to investigate the effects of Cl2 treatment (at concentrations of 10, 30, 50, 100, 150, and 200 ppm) against HuNV GII.4. HAV infectivity in groundwater using propidium monoazide (PMA)/qPCR to distinguish viable cells from dead cells and facilitate the reliable detection of HuNV GII.4 and HAV.

2. Materials and methods

2.1. HuNV GII.4 and HAV virus stock preparation

The HuNV GII. 4 stock used in this study were isolated from patients with acute gastroenteritis symptoms provided by the Waterborne Virus Bank (WAVA; Seoul, Korea). Hepatitis A virus (KBPV-VR-78) was obtained from the South Korean Bank of Pathogenic Viruses (KBPV, South Korea). After purchase, frozen samples were diluted with 500 μL phosphate-buffered saline (PBS; pH 7.2) and centrifuged at 8000 × g for 15 min at 4 °C. The supernatant was separated and stored at −80 °C in a freezer until further analysis and experimentation. Virus titer was determined as the genomic copy number of HuNV GII.4 and HAV RNA using a qPCR standard curve. HuNV GII.4 and HAV titers were approximately 4.0 and 5.5 log copies/μL, respectively.

2.2. Virus stock inoculation of groundwater sample

The groundwater used in this study was collected in a sterilized polyethylene (PE) water sample bottle immediately prior to analysis. qPCR was performed on the groundwater to detect the initial virus (HuNV GII.4, HAV), which was not detected. Bottled groundwater samples (200 mL) were inoculated with 20 μL of HuNV GII.4 and HAV and placed in a biological safety cabinet (CHC Lab Co., Daejeon, Korea) for approximately 1 hr to facilitate virus attachment. Uninoculated water samples were used as negative controls. The experiment was conducted in triplicate, from spiking to RNA extraction. RNA extracts were then analyzed in duplicate by qPCR assays for HuNV GII.4 and HAV.

2.3. Cl2 treatment of HuNV GII.4 and HAV in groundwater

For the treatment with Cl2, 4% Cl2 (free NaOCl, Yuhan Co., Seoul, Korea) was diluted with sterile distilled water to yield 50 ml solutions of 10, 30, 50, 100, 150, and 200 ppm (w/v) of chlorine. The bottles containing the samples were treated with Cl2 at each concentration for 10 min. After treatment, each groundwater sample was transferred into 200 μL of 10% sodium thiosulfate (Na2S2O3) solution (Sigma-Aldrich, Saint-Quentin-Fallavier, France).

2.4. Propidium monoazide (PMA) staining

PMA (Biotium, Hayward, CA, USA) was used to detect infectious HuNV GII.4 and HAV. PMA was used before RNA extraction. A groundwater sample solution (500 μL) and 5 μM PMA were mixed and incubated in a darkroom at 25 °C for 10 min to allow for dye penetration. Thereafter, the groundwater samples were exposed to 40 W LED light (Dynebio, Seongnam, Korea) at a wavelength of 460 nm at 25 °C for 20 min for photoactivation. The control group was not treated with PMA.

2.5. Extraction of Viral RNA

The QIAamp mini kit (Qiagen, Hilden, Germany) was used to isolate viral RNA following the manufacturer's protocol. Samples were added with Proteinase K (Sigma, St. Louis, MO, USA), incubated in a 37 ℃ shaker for 1 h, and subsequently rendered inactive using a 60 ℃-water bath for 15 min. The sample was then centrifuged at 5400× g for 10 min at 4 ℃ using a SUPRA22K centrifuge (Hanil Science Industrial Co., Gimpo, Republic of Korea). A clear supernatant was then collected using a sterilized conical tube. Viral RNA was extracted and purified to a final volume of 60 µL. HuNV GII.4 and HAV were detected and quantified following extraction by qPCR analysis of the sample RNA.

2.6. Quantitative analysis of HuNV GII.4 and HAV by qPCR

The primers and probes used for the quantification of HuNV GII.4 and HAV were presented in a previous study [15]. A TP800-Thermal Cycler Dice Real-Time System (Takara) was used to perform quantitative analysis with the qPCR. HuNV GII 4 and HAV RNA were used as positive controls, while RNase-free water was used as the negative control.

2.7. Determination of decimal reduction times (D-values) by linear modeling

The D-value for the reduction of HuNV GII.4 and HAV in the Cl2 concentration was measured using the first-order kinetics model. The D-value corresponds to the concentration of treatment needed to decrease the number of HuNV GII.4 and HAV by 1 log copies/μL (> 90%). This was calculated using the following formula:
l o g N 0 N = k 2.303 × t
  • N0 = Initial HuNV GII.4 and HAV titer (log copies/μL)
  • N = HuNV GII.4 and HAV titer after Cl2 treatment (log copies/μL)
  • t = Cl2 concentraion (ppm)
  • k = reduction rate constant

2.8. Statistical analysis

Statistical analysis confirmed a significant difference between the reduction (log copies/μL) in HuNV GII.4 and HAV and the results of the D-value based on the Cl2 concentration. Statistical analysis was presented as mean ± standard deviation (SD), and the experiment was performed three times per sample. The results were subjected to a one-way analysis of variance (ANOVA) using SPSS software (SPSS Inc., Chicago, IL, USA), and the differences between means were compared using Duncan's multiple range test. The statistical significance of differences between samples was evaluated using SPSS software through a one-way ANOVA and t-tests.

3. Results

3.1. Effects of Cl2 on HuNV GII.4 in PMA-untreated and PMA-treated groundwater samples

This study evaluated the effects of different concentrations of Cl2 (10, 30, 50, 100, 150, and 200 ppm) on the infectivity of HuNV GII.4 in groundwater. The results presented in Table 1 demonstrate a gradual decrease in the infectivity of HuNV GII.4 with increasing concentrations of Cl2. Furthermore, there was a significant difference in the reductions of HuNV GII.4 titers between PMA-untreated and PMA-treated samples when exposed to Cl2 (p < 0.05). The initial titer of HuNV GII.4 was measured to be 3.49 log10 copies/μL without Cl2 treatment. Treatment with Cl2 concentrations of 10, 30, 50, 100, and 150 ppm resulted in reduced titers in both PMA-untreated (0.08, 0.18, 0.34, 0.52, and 0.68 log) and PMA-treated samples (0.21, 0.31, 0.48, 0.74, and 0.95 log). At the maximum concentration (200 ppm), PMA-treated groundwater samples showed a reduction of >1.15 log10 copies/μL, while PMA-untreated groundwater samples showed a reduction of 0.85 log10 copies/μL. As anticipated, measurement of viral inactivation by PMA-untreated samples alone resulted in a significantly lower log10 reduction. The PMA-treated samples showed a viral titer reduction equivalent to a 0.20 log10 reduction. Furthermore, as the concentration of Cl2 increased, the log10 reduction in the viral load after PMA treatment also increased. These observations indicated that PMA treatment was effective in measuring HuNV GII.4 infectivity after exposure to increasing concentrations of Cl2.

3.2. Effects of Cl2 on HAV in PMA-untreated and PMA-treated groundwater samples

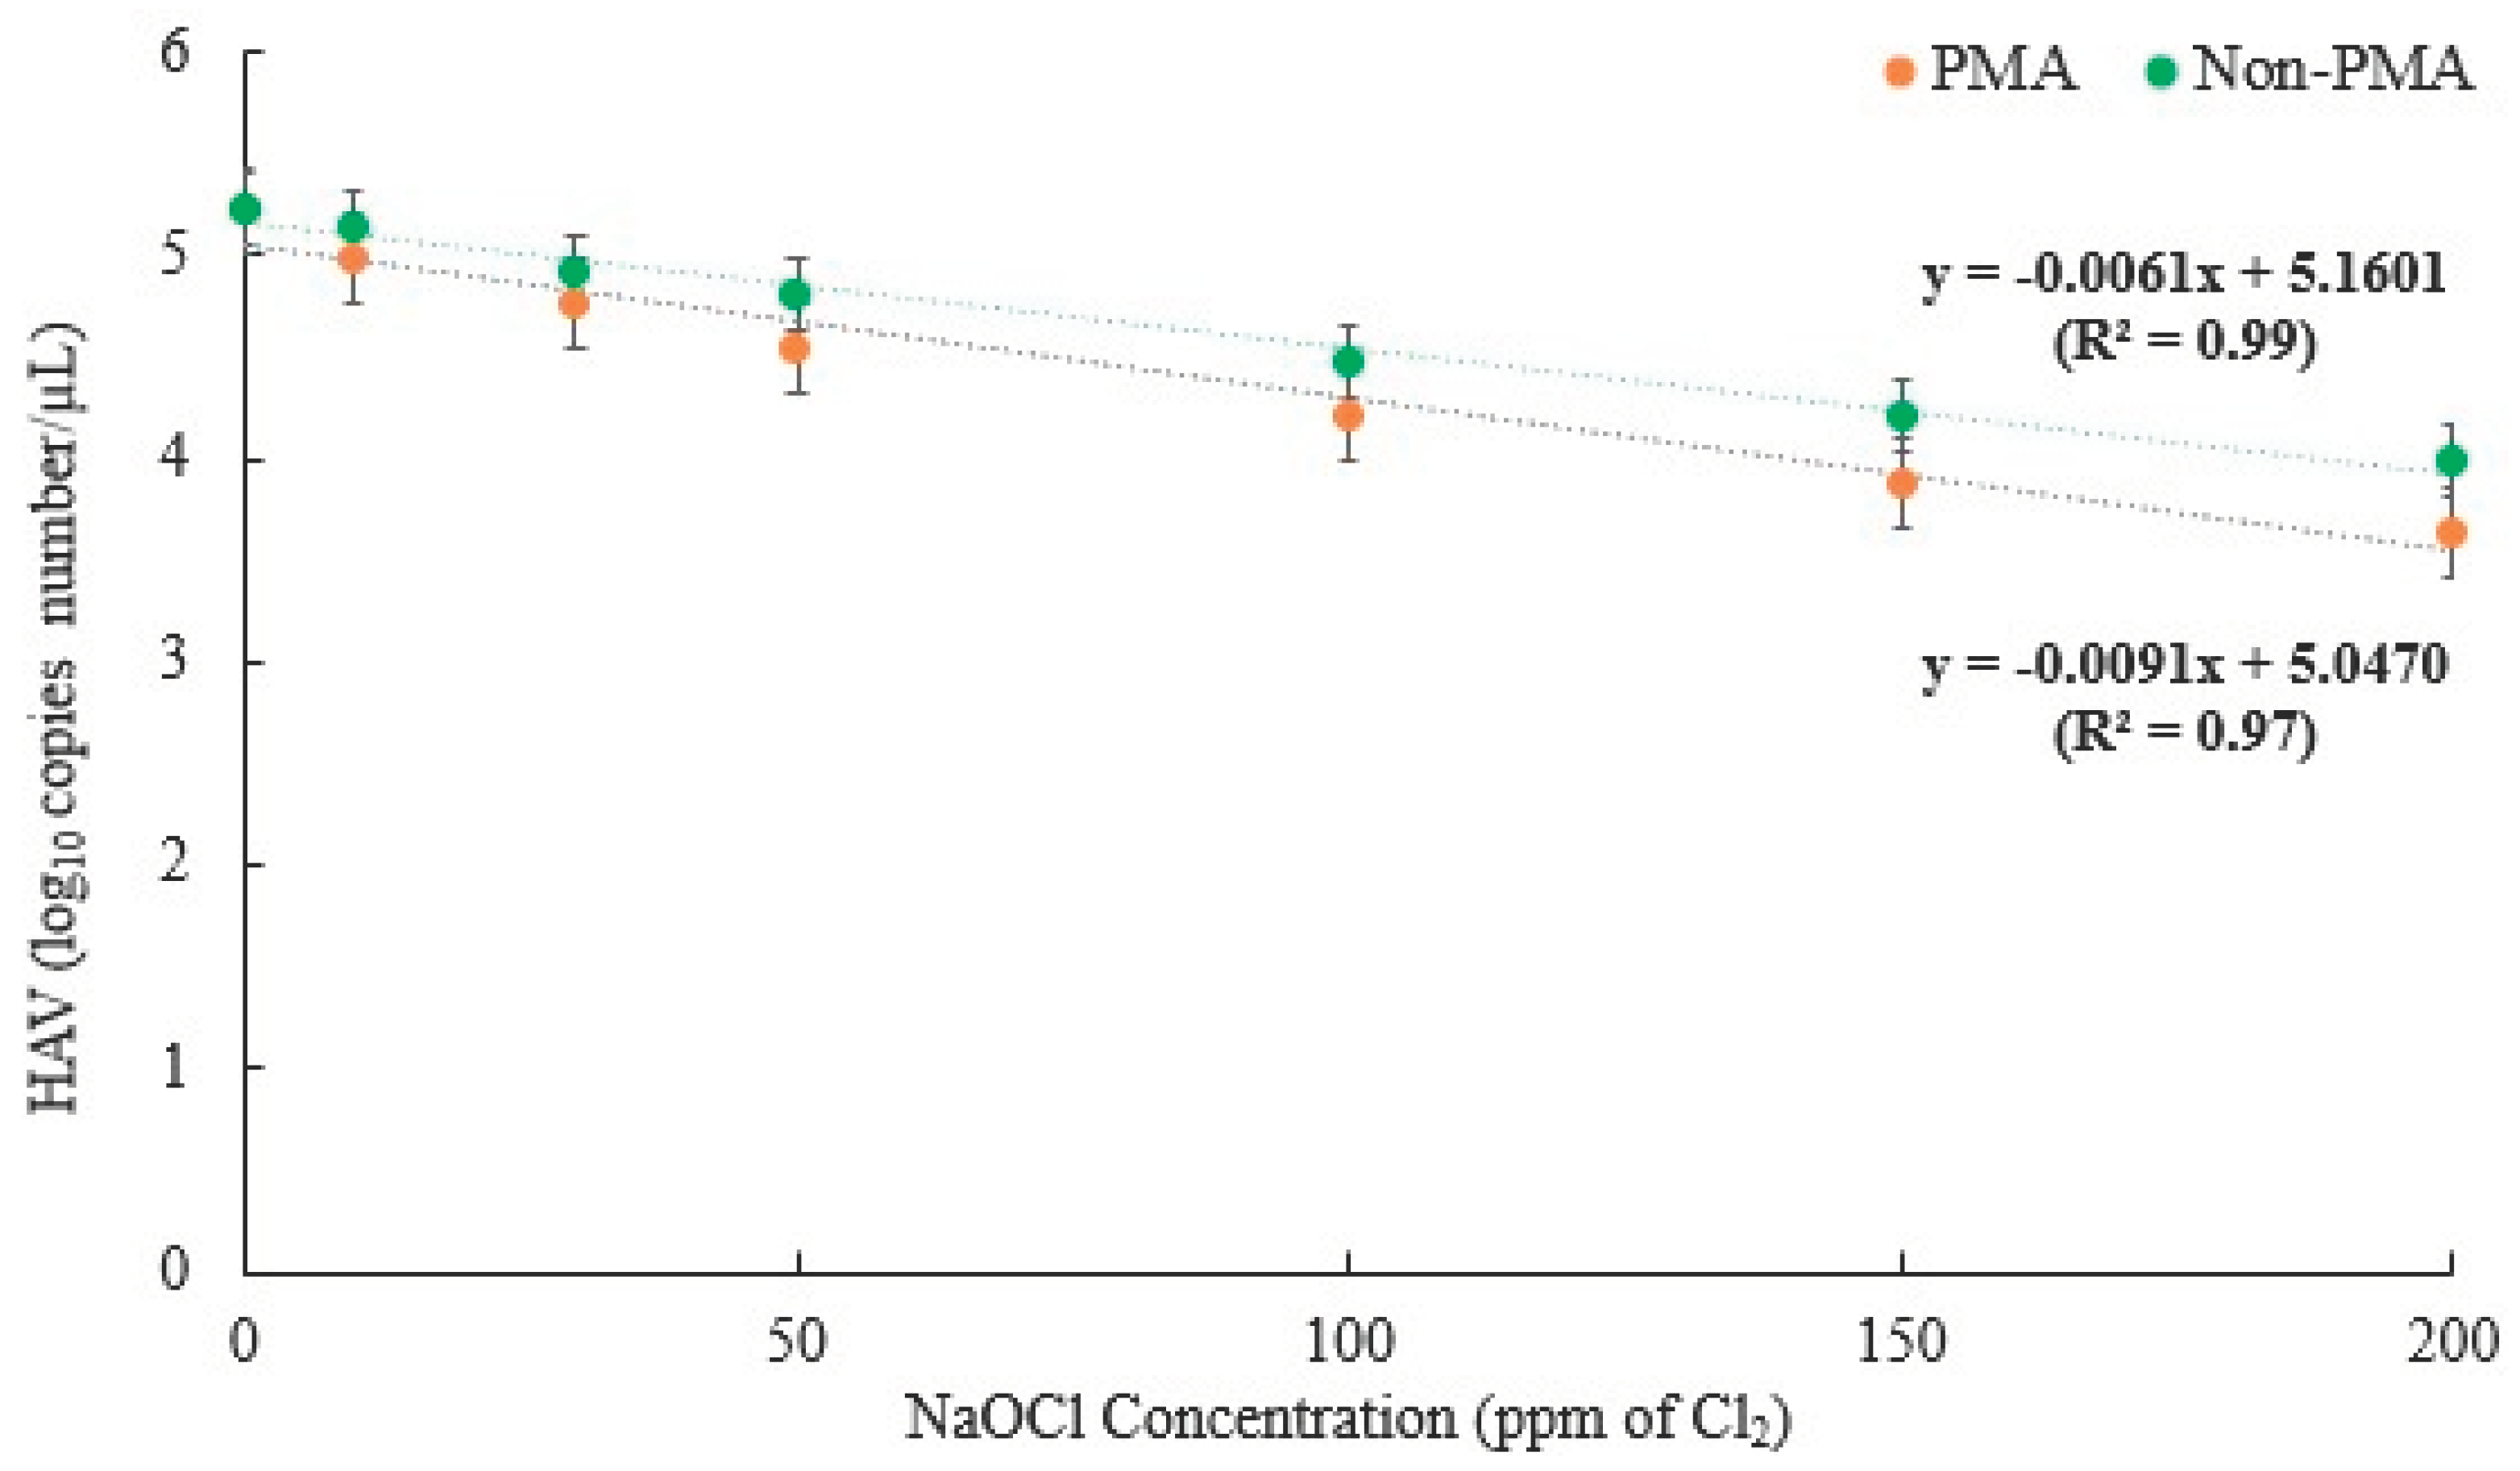
The efficiency of PMA-treated samples as survival markers for qPCR assays was also investigated. Table 2 shows that PMA was more effective than activated HAV in preventing the qPCR amplification of inactivated HAV. The initial titer of HAV was 5.22 log10 copies/μL without Cl2 treatment. Following treatment with Cl2 at concentrations of 10, 30, 50, 100, 150, and 200 ppm, the PMA-untreated samples showed a significant decrease in copies/μL as treatment time increased (p < 0.05). The reduced copies/μL values were 0.07, 0.30, 0.40, 0.74, 1.00, and 1.23, respectively. PMA-treated samples also showed a significant reduction in copies /μL with increasing processing time (p < 0.05). The reduced copies/μL values were 0.23, 0.46, 0.67, 1.01, 1.33, and 1.58, respectively. The use of PMA resulted in a better correlation with infectivity, with an average additional log10 reduction of 0.26 copies/μL for HAV. These observations indicate that PMA treatment was effective in measuring HAV infectivity after exposure to increasing concentrations of Cl2. Furthermore, the PMA-treated technique could be very effective in objectively discriminating between the viability of HuNV and HAV in groundwater, even at very high Cl2 concentrations (> 200ppm).

3.3. D-values of HuNV GII.4 and HAV with PMA reduction by first-order kinetics model

A first-order kinetic model for linear viral survival was used to model the survival curves of HuNV GII.4 and HAV in treated groundwater as a function of Cl2 concentration. Table 3 presents data for the first-order kinetic model. T-tests were used to compare HuNV GII.4 and HAV, revealing significant differences (p < 0.05) between the observed and predicted D-values. For HuNV GII.4, correlation coefficients (R2) close to 1 indicate that the reduction patterns are well explained by first-order kinetics. All values were close to 1.0 (0.98 for PMA-untreated and 0.97 for PMA-treated), confirming that the model was a good fit to the survival curves (Figure 1). Here, the D-values (90% reduction concentration) were determined to be 214.3 ppm and 116.7 ppm for survival in the PMA-untreated and PMA-treated samples, respectively. A Cl2 concentration of 200 ppm was found to be consistent with the experimental results. The results showed a 0.85 log10 reduction (76.5% reduction) for PMA-untreated samples and a 1.15 log10 reduction (103.5% reduction) for PMA-treated samples. In addition, the data demonstrated that the model was effective in assessing the decrease in HuNV GII.4 in PMA-treated and PMA-untreated samples following treatment with Cl2 concentrations.
The R2 values for PMA-untreated and PMA-treated samples were 0.99 and 0.97, respectively, indicating that this log-linear model is appropriate for predicting the D-value for HAV log10 reduction kinetics (Figure 2). Here, the D-values (90% reduction concentration) were 147.5 ppm and 98.9 ppm for survival in the PMA-untreated and PMA-treated samples, respectively. The Cl2 concentration of 150 ppm was consistent with the experimental results, which demonstrated a 1.00 log10 reduction (90.0% reduction) for PMA-untreated samples. Similarly, the findings at a Cl2 concentration of 100 ppm were consistent with the experimental results, which showed a 1.01 log10 reduction (90.9% reduction) for PMA-treated samples. These findings indicated that this model is suitable for measuring HAV inactivation following Cl2 treatment. The D-values of the two viruses exhibited a significant difference (p < 0.05), with HuNV GII.4 being larger than that of HAV, suggesting that HuNV GII.4 is more resistant to Cl2 concentration than HAV.

4. Discussion

Microorganisms are commonly found in raw water sources such as rivers, lakes, and groundwater. Pathogens present in water can lead to waterborne diseases in individuals who consume it [16]. Chlorination is a method of chemical disinfection that utilizes different types of chlorine or chlorine-containing substances to oxidize and disinfect water sources. It is one of several methods for disinfecting water and preventing the spread of waterborne diseases through water distribution systems. Chlorination is considered advantageous due to its proven effectiveness against bacteria and viruses [17]. However, pathogens may regrow in water that is not treated with chlorine, or where proper residual chlorine is not maintained, which can pose a risk to public health.
When using groundwater as a source of drinking water, it is important to follow relevant guidelines. Domestic and international guidelines recommend that drinking water engineers consider the presence of enteric viruses in drinking water sources [18]. For example, in 2016, the United States Environmental Protection Agency (USEPA) added adenovirus, norovirus, polioviruses, and hepatitis A virus to the contaminant candidate list 4 as common microbial contaminants in drinking water [19]. In the United States, sodium hypochlorite is used at a concentration of 50–200 ppm to remove microbial contaminants from harvested fruits and vegetables. Similarly, in Korea, the maximum permissible NaOCl concentration of sodium hypochlorite is 200 ppm. Use of drinking water treated with up to 200 ppm chlorine does not have negative effects on health and can protect against outbreaks of water-borne diseases. In our study, the Cl2 concentration showed a 1-log reduction (10–100 particles) when treated with 100–120 ppm. However, if the virus concentration is high, it cannot be inactivated at low chlorine levels. To prevent virus outbreaks, it is crucial to effectively inactivate viruses during disinfection, the final step in processing drinking water or wastewater treatment. This study examined the effectiveness of different concentrations of Cl2 in reducing the titer of HuNV GII.4 and HAV through PMA treatment.
The impact of chlorination on different viral types varied significantly. Thurston-Enriquez et al. [20] found that a free chlorine concentration of 0.50–0.54 mg/L for 15 sec resulted in a reduction of above 4-log10 for calicivirus and 2-log10 for adenovirus. El-Senousy et al. [21] found that when raw water was treated with 5 mg/L of chlorine for 15 min, the hepatitis E virus was reduced by approximately 1-log10. Li et al. [22] studied the mechanism of HAV inactivation in water by chlorine dioxide. The study found that a concentration of 5 mg/L chlorine dioxide was insufficient to completely inactivate HAV, even after 60 min of exposure. However, a concentration of 7.5 mg/L and an exposure time of 10 min were effective in completely inactivating HAV. For an infectious virus to infect a host cell, it must be capable of binding to the cell, injecting its genome, and replicating and translating genetic material within the cell. If any of these functions are compromised, the virus will not be able to infect the host. Therefore, at least one of these features must be disrupted to deactivate the virus. Cl inactivates microorganisms by damaging their cell membranes. This weakens the membrane, allowing chlorine to enter the cell and disrupt cellular respiration and DNA activity, both of which are necessary for cell survival. Chlorine may target the capsids (VP1 and VP2) of viruses, as shown by changes in the nucleotide sequence encoding the capsid protein after exposure [23].
Meanwhile, Kitajima et al. [24] showed that treating drinking water with a chlorine concentration of 0.1–0.5 mg/L for 30 min resulted in a reduction of murine virus (MNV) titer by 1.69-log10 and 4.42-log10, respectively. HuNV decreased by 3.64 log10 when treated for 30 min with a chlorine concentration of 0.5 mg/L. Our study demonstrated inactivation even at low chlorine concentrations compared to the reference study. In addition, the observed differences may have contributed to the higher resistance of HuNV compared to that of MNV following chlorine treatment. Similarly, our findings suggest that despite the fact that both viruses belong to the same family, they may exhibit different behaviors during disinfection. Thus, HuNV may be more resistant to chemical disinfection than HAV. The study found that the reduction in HuNV and HAV was up to 1–2 log10, indicating that the amount of virus present in the inoculum could still potentially cause infection even after thorough disinfection, such as a reduction of >2–3 log10. The chlorine concentration can also be affected by the treatment time. In this study, the treatment was conducted for 5 min, whereas in their study, the treatment was conducted for as little as 15 s and as long as 30 min. All these factors make it possible for a portion of the initial HuNV and HAV titers to survive the treatment conditions and cause disease in humans. Since HuNV and HAV are infectious at very low doses, only a small number of infectious viral cells are required to cause infection in humans. Disinfection studies involving viruses that are artificially introduced into body secretions or excretions may overestimate the effectiveness of disinfectants compared to real-world scenarios. This is because naturally occurring viruses, which tend to aggregate and attach to cell debris, are more resistant to disinfection. This phenomenon was previously suggested by Tree et al. [25].
Intercalating dyes, such as PMA, can be used as a pretreatment to prevent the amplification of damaged capsid virus particles during RT-qPCR. This allows for the identification of intact capsid virus particles [26]. The ability of PMA to differentiate between non-infectious and infectious viral particles may vary depending on the extent of RNA or capsid damage caused by each inactivation method. According to Karim et al. [27], PMA can distinguish between infectious and non-infectious MNV only when chlorine is used for inactivation. We found that both HuNV and HAV cells lost their infectivity after treatment with Cl2. The difference between PMA-treated and PMA-untreated was approximately 0.30–0.35 copies/μL for both viruses Anfruns-Estrada et al. [28] used a PMAxx-RT/qPCR assay to report that 100 mg/L chlorine treatment resulted in the inactivation of approximately 2 logs of infectious HuNV GI and GII in a mixed vegetable salad. Jeon et al. [15] conducted a study on the reduction of HuNV GII.4 in thermally treated mussels. The study found that there was a 0.27 log10 reduction in virus copies/μL in PMA-treated samples compared to PMA-untreated samples. PMA-treated clams showed an average reduction of 0.20-0.27 log compared to PMA-untreated clams. The high variability of the food matrix resulted in differences in virus log reductions between previous and current studies. According to Fittipaldi et al. [29], PMA-treated samples with infectious viruses exhibited a 0.66 log10 reduction in virus concentrations compared to PMA-untreated samples. Although these pretreatments have the potential to detect only infectious virions, they are limited by the damage they cause to the capsid, which can result in inactivation of the particles of interest [30]. Viral inactivation using chlorine can be caused by protein reactions or genomic damage [31]. If chlorine is unable to penetrate the virus particles and reach the genome, reactions with proteins may be more likely to cause inactivation. Our research demonstrates that predicting the effect of encapsulation on viral genome reactivity requires analyzing more viral models to identify the mechanisms that dictate nucleic acid reactivity in a virus.

5. Conclusions

This study provides additional evidence that treating groundwater with Cl2 effectively reduces the titers of infective HuNV and HAV when using PMA treatment. For HuNV, at the maximum Cl2 concentration (200 ppm), PMA-treated groundwater samples showed a reduction of >1.15 log10 copies/μL, while PMA-untreated groundwater samples showed a reduction of 0.85 log10 copies/μL. Similarly, treatment with PMA resulted in a better correlation with infectivity, with an additional average log10 reduction of 0.26 copies/μL for HAV. The D-values for Cl2 treatment of HuNV and HAV were also predicted to be 116.7 and 98.9 mg/L for chlorine in PMA treatment, respectively. In conclusion, these results suggest that an appropriate water treatment process involving chlorination can manage the risk of HuNV and HAV infections via groundwater supply systems. Future experiments are required, because real environmental matrices are much more complex and contain a wide variety of particles, solvents, organic substances, and microbial communities.

Acknowledgments

This study was supported by the Basic Science Research Program of the National Research Foundation of Korea (NRF), funded by the Ministry of Education (2021R1I1A3A04037468).

References

  1. Struckmeier, W.; Rubin, Y.; Jones, J.A.A. Groundwater - Reservoir for a Thirsty Planet?: Earth Sciences for Society ; a Prospectus for a Key Theme of the International Year of Planet Earth. IUGS, Norway. 2005, 16 p.
  2. Gwack, J.; Lee, K.C.; Lee, H.J.; Kwak, W.S.; Lee, D.W.; Choi, Y.H.; Kim, J.S.; Kang, Y.A. Trends in water- and foodborne disease outbreaks in Korea, 2007–2009. Osong. Pub. Health Res. Perspect. 2010, 1, 50–54. [CrossRef]
  3. Lee, M.J.; Kim, W.H.; Cho, H.G.; Lee, S.S. Epidemiological study of ground waterborne norovirus GI.3-associated gastroenteritis outbreaks in Gyeonggi province of South Korea in May 2011. J. Bacteriol. Virol. 2012, 42, 232–241. [CrossRef]
  4. Wallender, E.K.; Ailes, E.C.; Yoder, J.S.; Roberts, V.A.; Brunkard. J.M. Contributing factors to disease outbreaks associated with untreated groundwater. Groundwater. 2014, 52, 886–897. [CrossRef]
  5. Kauppinen, A.; Pitkanen, T.; Miettinen, I.T. Persistent norovirus contamination of groundwater supplies in two waterborne outbreaks. Food Environ. Virol. 2018, 10, 39–50. [CrossRef]
  6. Ferguson, C.; Husman, A.M. de R.; Altavilla, N.; Deere, D.; Ashbolt, N. Fate and transport of surface water pathogens in watersheds. Crit. Rev. Environ. Sci. Technol. 2003, 33, 299–361. [CrossRef]
  7. Rhee, C.H.; Kim, S.; Kang, Y.E.; Han, B.; Swo, S-J.; Kim, Y.W.; Her, M.; Jeong, W. Virucidal efficacy of acidic electrolyzed water (AEW) against African swine fever virus and avian influenza virus. J Vet. Med. Sci. 2021, 83, 201–207. [CrossRef]
  8. Korea Centers for Disease Control and Prevention (KCDC) Management guidelines for water & foodborne diseases [Internet] [cited 2020 Sep 1]. 2020. Available from: https://www.kdca.go.kr/upload_comm/syview/doc.html?fn=158209329137500.pdf&rs=/upload_comm/docu/0019/ (Accessed 3 Jun 2023).
  9. Matthews, J.E.; Dickey, B.W.; Miller, R.D.; Felzer, J.R.; Dawson, B.P.; Lee, A.S.; Rocks, J.J.; Kiel, J.; Montes, J. S.; Moe, C.L.; Eisenberg, J.N.S.; Leon, J.S. The epidemiology of published norovirus outbreaks: a review of risk factors associated with attack rate and genogroup. Epidemiol Infect. 2012, 140, 1161–1172. [CrossRef]
  10. Lodder, W.J.; De Roda, A.M. Husman, Presence of noroviruses and other enteric viruses in sewage and surface waters in The Netherlands. Appl. Environ. Microbiol. 2005, 71, 1453–1461. [CrossRef]
  11. Cristina, J.; Costa-Mattioli, M. Genetic variability and molecular evolution of hepatitis a virus. Virus Res. 2007, 127, 151–157. [CrossRef]
  12. Ryu, S.; Won, S.A.; Uh, J.; Song, J.Y. Hepatitis A virus infection from a contaminated tap of ground water facility in a neighborhood park, Republic of Korea. Infect Chemother. 2019, 51, 62–66. [CrossRef]
  13. Ministry of Food and Drug Safety (MFDS). Guidance Documents of Food poisoning. 2022. Available online: http://various.foodsafetykorea.go.kr/fsd/#/ext/Document/FC (accessed on 15 June 2023).
  14. Ministry of Government Legislation (MOLEG). Regulations on water quality standards and inspection for drinking water Article No. 4. 2023. Available online: http://www.law.go.kr/%EB%B2%95%EB%A0%B9/%EB%A8%B9%EB%8A%94%EB%AC%BC%EC%88%98%EC%A7%88%EA%B8%B0%EC%A4%80%EB%B0%8F%EA%B2%80%EC%82%AC%EB%93%B1%EC%97%90%EA%B4%80%ED%95%9C%EA%B7%9C%EC%B9%99 (Accessed 23 June 2023).
  15. Jeon, E.B.; Choi, M.-S.; Kim, J.Y.; Ha, K.S.; Kwon, J.Y.; Jeong, S.H.; Lee, H.J.; Jung, Y.J.; Ha, J.-H.; Park, S.Y. Characterizing the effects of thermal treatment on human norovirus GII.4 viability using propidium monoazide combined with RT-qPCR and quality assessments in mussels. Food Control. 2019, 109, 106954. [CrossRef]
  16. Genter, F.; Willetts, J.; Foster, T. Fecal contamination of groundwater self-supply in low- and middle-income countries: Systematic review and meta-analysis. Water Res. 2021, 201, 117350. [CrossRef]
  17. Han, J.; Zhang, X.; Li, W.; Jiang, J. Low chlorine impurity might be beneficial in chlorine dioxide disinfection. Water Res. 2021, 188, 116520. [CrossRef]
  18. Rachmadi, A.T.; Kitajima, M.; Kato, T.; Kato, H.; Okabe, S.; Sano, D. Required chlorination doses to fulfill the credit value for disinfection of enteric viruses in water: a critical review. Environ. Sci. Technol. 2020, 54, 2068–2077. [CrossRef]
  19. U.S.EPA. Contaminant Candidate List (CCL) and Regulatory Determination. 2018. Available online: https//www.epa.gov/ccl/microbial-contaminants-ccl-4 (Accessed 23 March 2023).
  20. Thurston-Enriquez, J.A.; Haas, C.N.; Jacangelo, J.; Gerba, C.P. Chlorine inactivation of adenovirus type 40 and feline calicivirus. Appl. Environ. Microbiol. 2003, 69, 3979–3985. [CrossRef]
  21. El-Senousy, W.M.; El-Gamal, M.S.; Mousa, A.A.E.; El-Hawary, S.E.; Kamel, M.M.; Fathi, M.N.; El-Mahdy, E.M. Effect of Chlorine on Noroviruses, Rotaviruses and Hepatitis E Virus in Drinking Water. WASJ. 2014, 32, 2206–2212. [CrossRef]
  22. Li, J.W.; Xin, Z.T.; Wang, X.W.; Zheng, J.L.; Chao, F.H. Mechanisms of inactivation of hepatitis A virus in water by chlorine dioxide. Water Res. 2004, 38, 1514–1519. [CrossRef]
  23. Rachmadi, A.T.; Kitajima, M.; Watanabe, K.; Yaegashi, S.; Serrana, J.; Nakamura, A.; Nakagomi, T.; Nakagomi, O.; Katayama, K.; Okabe, S.; Sano, D. Free Chlorine Disinfection as a Selection Pressure on Norovirus. Appl. Environ. Microbiol. 2018, 84, 00244–18. [CrossRef]
  24. Kitajima, M.; Tohya, Y.; Matsubara, K.; Haramoto, E.; Utagawa, E.; Katayama, H. Chlorine inactivation of human norovirus, murine norovirus and poliovirus in drinking water. Applied Microbiology. 2010, 51, 119–121. [CrossRef]
  25. Tree, J.A.; Adams, M.R.; Lees, D.N. Disinfection of feline calicivirus (a surrogate for norovirus) in wastewaters. J. Appl. Microbiol. 2005, 98, 155–162. [CrossRef]
  26. Kim, S.Y.; Ko, G. Using propidium monoazide to distinguish between viable and nonviable bacteria, MS2 and murine norovirus. Lett Appl Microbiol. 2012, 55,182–188. [CrossRef]
  27. Karim, M.R.; Fout, G.S.; Johnson, C.H.; White, K.M.; Parshionikar, S.U. Propidium monoazide reverse transcriptase PCR and RT-qPCR for detecting infectious enterovirus and norovirus. J Virol Methods. 2015, 219, 51–61. [CrossRef]
  28. Anfruns-Estrada, E.; Bottaro, M.; Pinto, R.M.; Guix, S.; Bosch, A. Effectiveness of consumers washing with sanitizers to reduce human norovirus on mixed salad. Foods. 2019, 8, 637. [CrossRef]
  29. Fittipaldi, M.; Rodriguez, N.J.; Codony, F.; Adrados, B.; Peñuela, G.A.; Morató, J. Discrimination of infectious bacteriophage T4 virus by propidium monoazide real time PCR. J. Virol. Methods. 2010, 168, 228–232. [CrossRef]
  30. Chen, L.; Zhang, H.; Liu, Q.; Pang, X.; Zhao, X.; Yang, H. Sanitising efficacy of lactic acid combined with low-concentration sodium hypochlorite on Listeria innocua in organic broccoli sprouts. Int. J. Food Microbiol. 2019, 295, 41–48. [CrossRef]
  31. Meister, S.; Verbyla, M. E.; Klinger, M.; Kohn, T. Variability in Disinfection Resistance between Currently Circulating Enterovirus B Serotypes and Strains. Environ. Sci. Technol. 2018, 52, 3696–3705. [CrossRef]
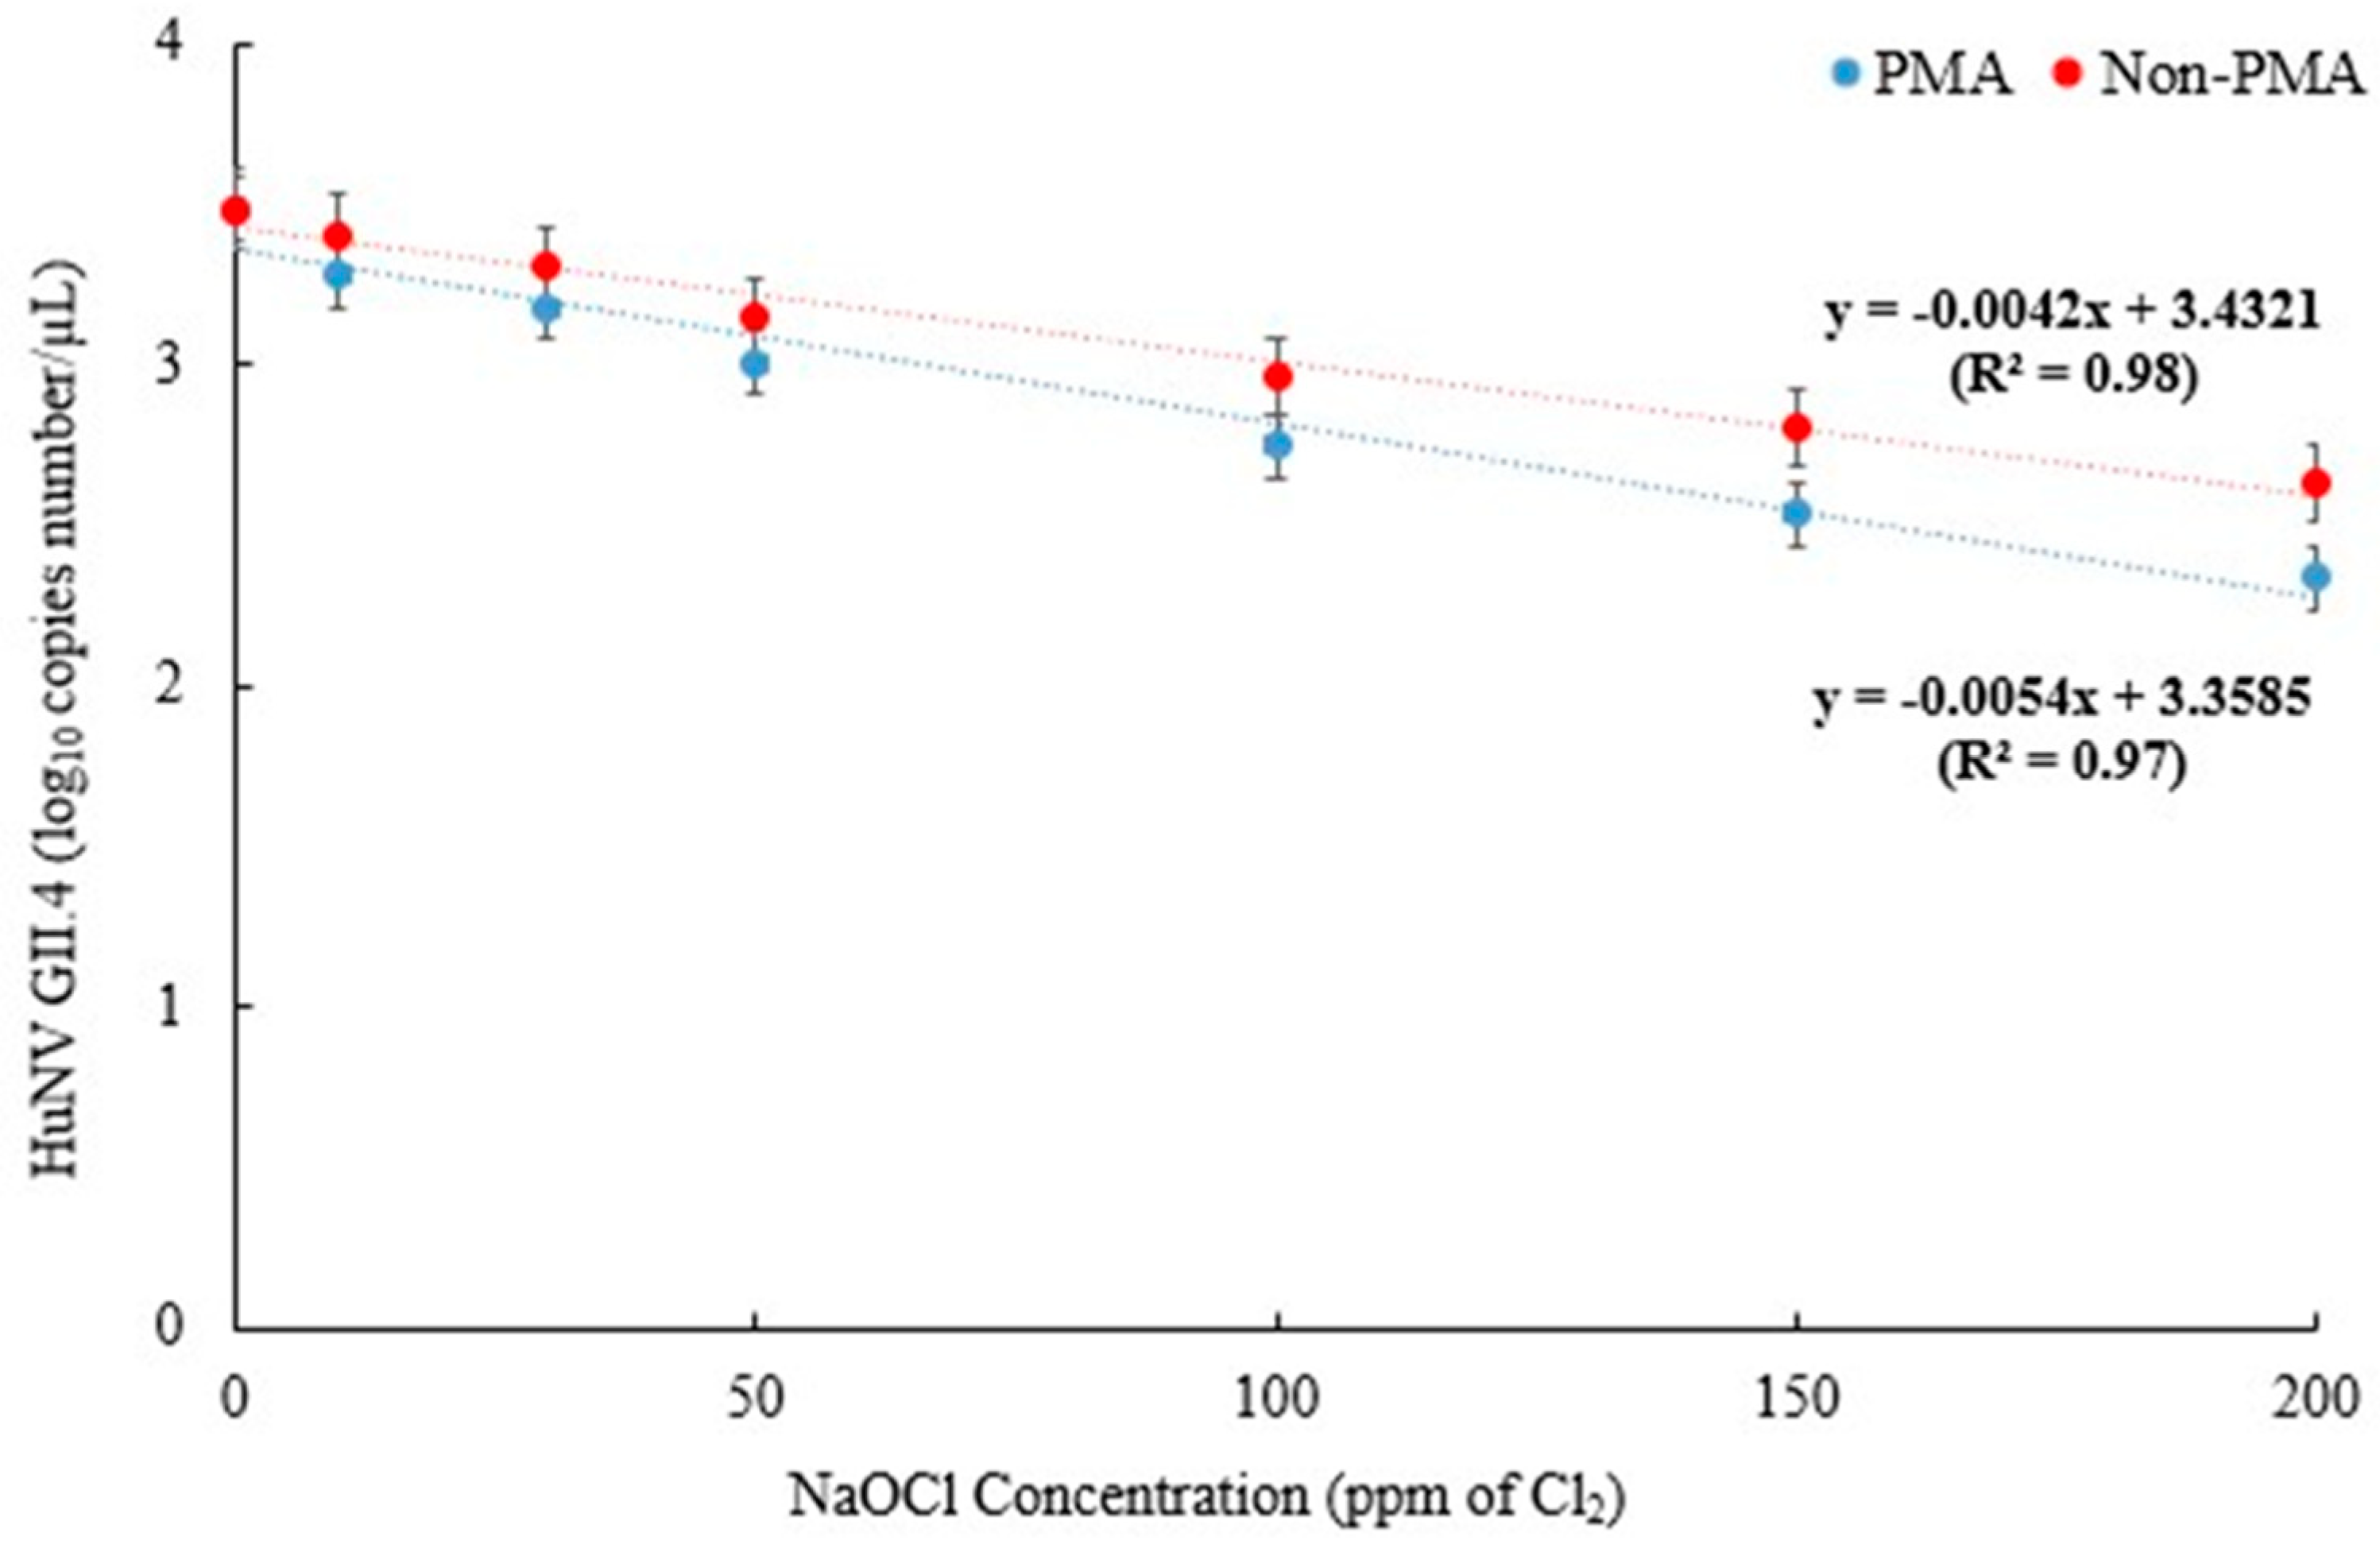
Figure 1. Fitted survival curves of HuNV GII.4 infectivity from Cl2-treated groundwater using the first-order kinetic model. The correlation coefficient (R2) was used to evaluate the goodness of fit, with a higher R2 value indicating a better fit to the data. The data presented are the mean ± standard deviation of three independent replicates.
Preprints 99577 g001
Figure 2. Fitted survival curves of HAV infectivity from Cl2-treated groundwater using the first-order kinetic model. The correlation coefficient (R2) was used to evaluate the goodness of fit, with a higher R2 value indicating a better fit to the data. The data presented are the mean ± standard deviation of three independent replicates.
Preprints 99577 g002
Table 1. Changes in HuNV GII.4 titers in groundwater resulting from NaOCl concentration (ppm of Cl2) by RT-qPCR and PMA+RT-qPCR.
RT-qPCR PMA+RT-qPCR Before/after using PMA to HNV reduction difference (log10 copies number/µL)
log10 copies number/µL log10 copies number/µL
Control 3.49 ± 0.04aA 3.49 ± 0.04aA -
10 ppm 3.41 ± 0.04bA 3.28 ± 0.03bB (3.41–3.28) = 0.13
30 ppm 3.31 ± 0.03cA 3.18 ± 0.03cB (3.31–3.18) = 0.13
50 ppm 3.15 ± 0.04dA 3.01 ± 0.02dB (3.15–3.01) = 0.14
100 ppm 2.97 ± 0.02eA 2.75 ± 0.04eB (2.97–2.75) = 0.22
150 ppm 2.81 ± 0.05fA 2.54 ± 0.05fB (2.81–2.54) = 0.27
200 ppm 2.64 ± 0.03gA 2.34 ± 0.02gB (2.64–2.34) = 0.30
The data indicates means with standard deviations (three samples/treatment). Within the same column, means with different letters a-g for RT-qPCR, a-g for PMA/RT-qPCR differ significantly (p < 0.05) by Duncan’s multiple range test. Within the same row, means with different letters(A-B) differ significantly (p < 0.05) by t-test.
Table 2. Changes in HAV titers in groundwater resulting from NaOCl concentration (ppm of Cl2) by RT-qPCR and PMA+RT-qPCR.
RT-qPCR PMA+RT-qPCR Before/after using PMA to HAV reduction difference (log10 copies number/µL)
log10 copies number/µL log10 copies number/µL
Control 5.22 ± 0.03aA 5.22 ± 0.03aA -
10 ppm 5.15 ± 0.03bA 4.99 ± 0.04bB (5.15–4.99) = 0.16
30 ppm 4.92 ± 0.04cA 4.76 ± 0.03cB (4.92–4.76) = 0.16
50 ppm 4.82 ± 0.05dA 4.55 ± 0.02dB (4.82–4.55) = 0.27
100 ppm 4.48 ± 0.03eA 4.21 ± 0.04eB (4.48–4.21) = 0.27
150 ppm 4.22 ± 0.03fA 3.89 ± 0.04fB (4.22–3.89) = 0.33
200 ppm 3.99 ± 0.04gA 3.64 ± 0.03gB (3.99–3.64) = 0.35
The data indicates means with standard deviations (three samples/treatment). Within the same column, means with different letters a-g for RT-qPCR, a-g for PMA/RT-qPCR differ significantly (p < 0.05) by Duncan’s multiple range test. Within the same row, means with different letters(A-B) differ significantly (p < 0.05) by t-test.
Table 3. D-values of NaOCl concentration (ppm of Cl2) of HuNV GII.4 and HAV in groundwater using first-order kinetic model.
D-values of NaOCl concentration (ppm of Cl2)
Non-PMA/RT-qPCR PMA/RT-qPCR
HuNV GII.4 214.3 ± 0.05aA 116.7 ± 0.04bA
HAV 147.5 ± 0.07aB 98.9 ± 0.06bB
Within the same row, means with different letters(a-b) differ significantly (p < 0.05) by t-test. Within the same column, means with different letters(A-B) differ significantly (p < 0.05) by t-test.
Disclaimer/Publisher’s Note: The statements, opinions and data contained in all publications are solely those of the individual author(s) and contributor(s) and not of MDPI and/or the editor(s). MDPI and/or the editor(s) disclaim responsibility for any injury to people or property resulting from any ideas, methods, instructions or products referred to in the content.
Copyright: This open access article is published under a Creative Commons CC BY 4.0 license, which permit the free download, distribution, and reuse, provided that the author and preprint are cited in any reuse.
Prerpints.org logo

Preprints.org is a free preprint server supported by MDPI in Basel, Switzerland.

Subscribe

© 2024 MDPI (Basel, Switzerland) unless otherwise stated