Submitted:
21 February 2024
Posted:
22 February 2024
You are already at the latest version
Abstract
Keywords:
1. Introduction
2. Experimental Set-Up
2.1. Overall System
2.1.1. System Description
2.1.2. System Implementation
2.2. Motion Tracking Methodology
2.3. Magnetic Flux and Force
2.4. Viscous Friction Force
2.5. Closed-Loop Position Control
3. Experiments
3.1. Case 1: Motion in Air
3.2. Case 2: Motion in Water
3.3. Case 3: Motion in Glycol
3.4. System Comparison
4. Conclusions
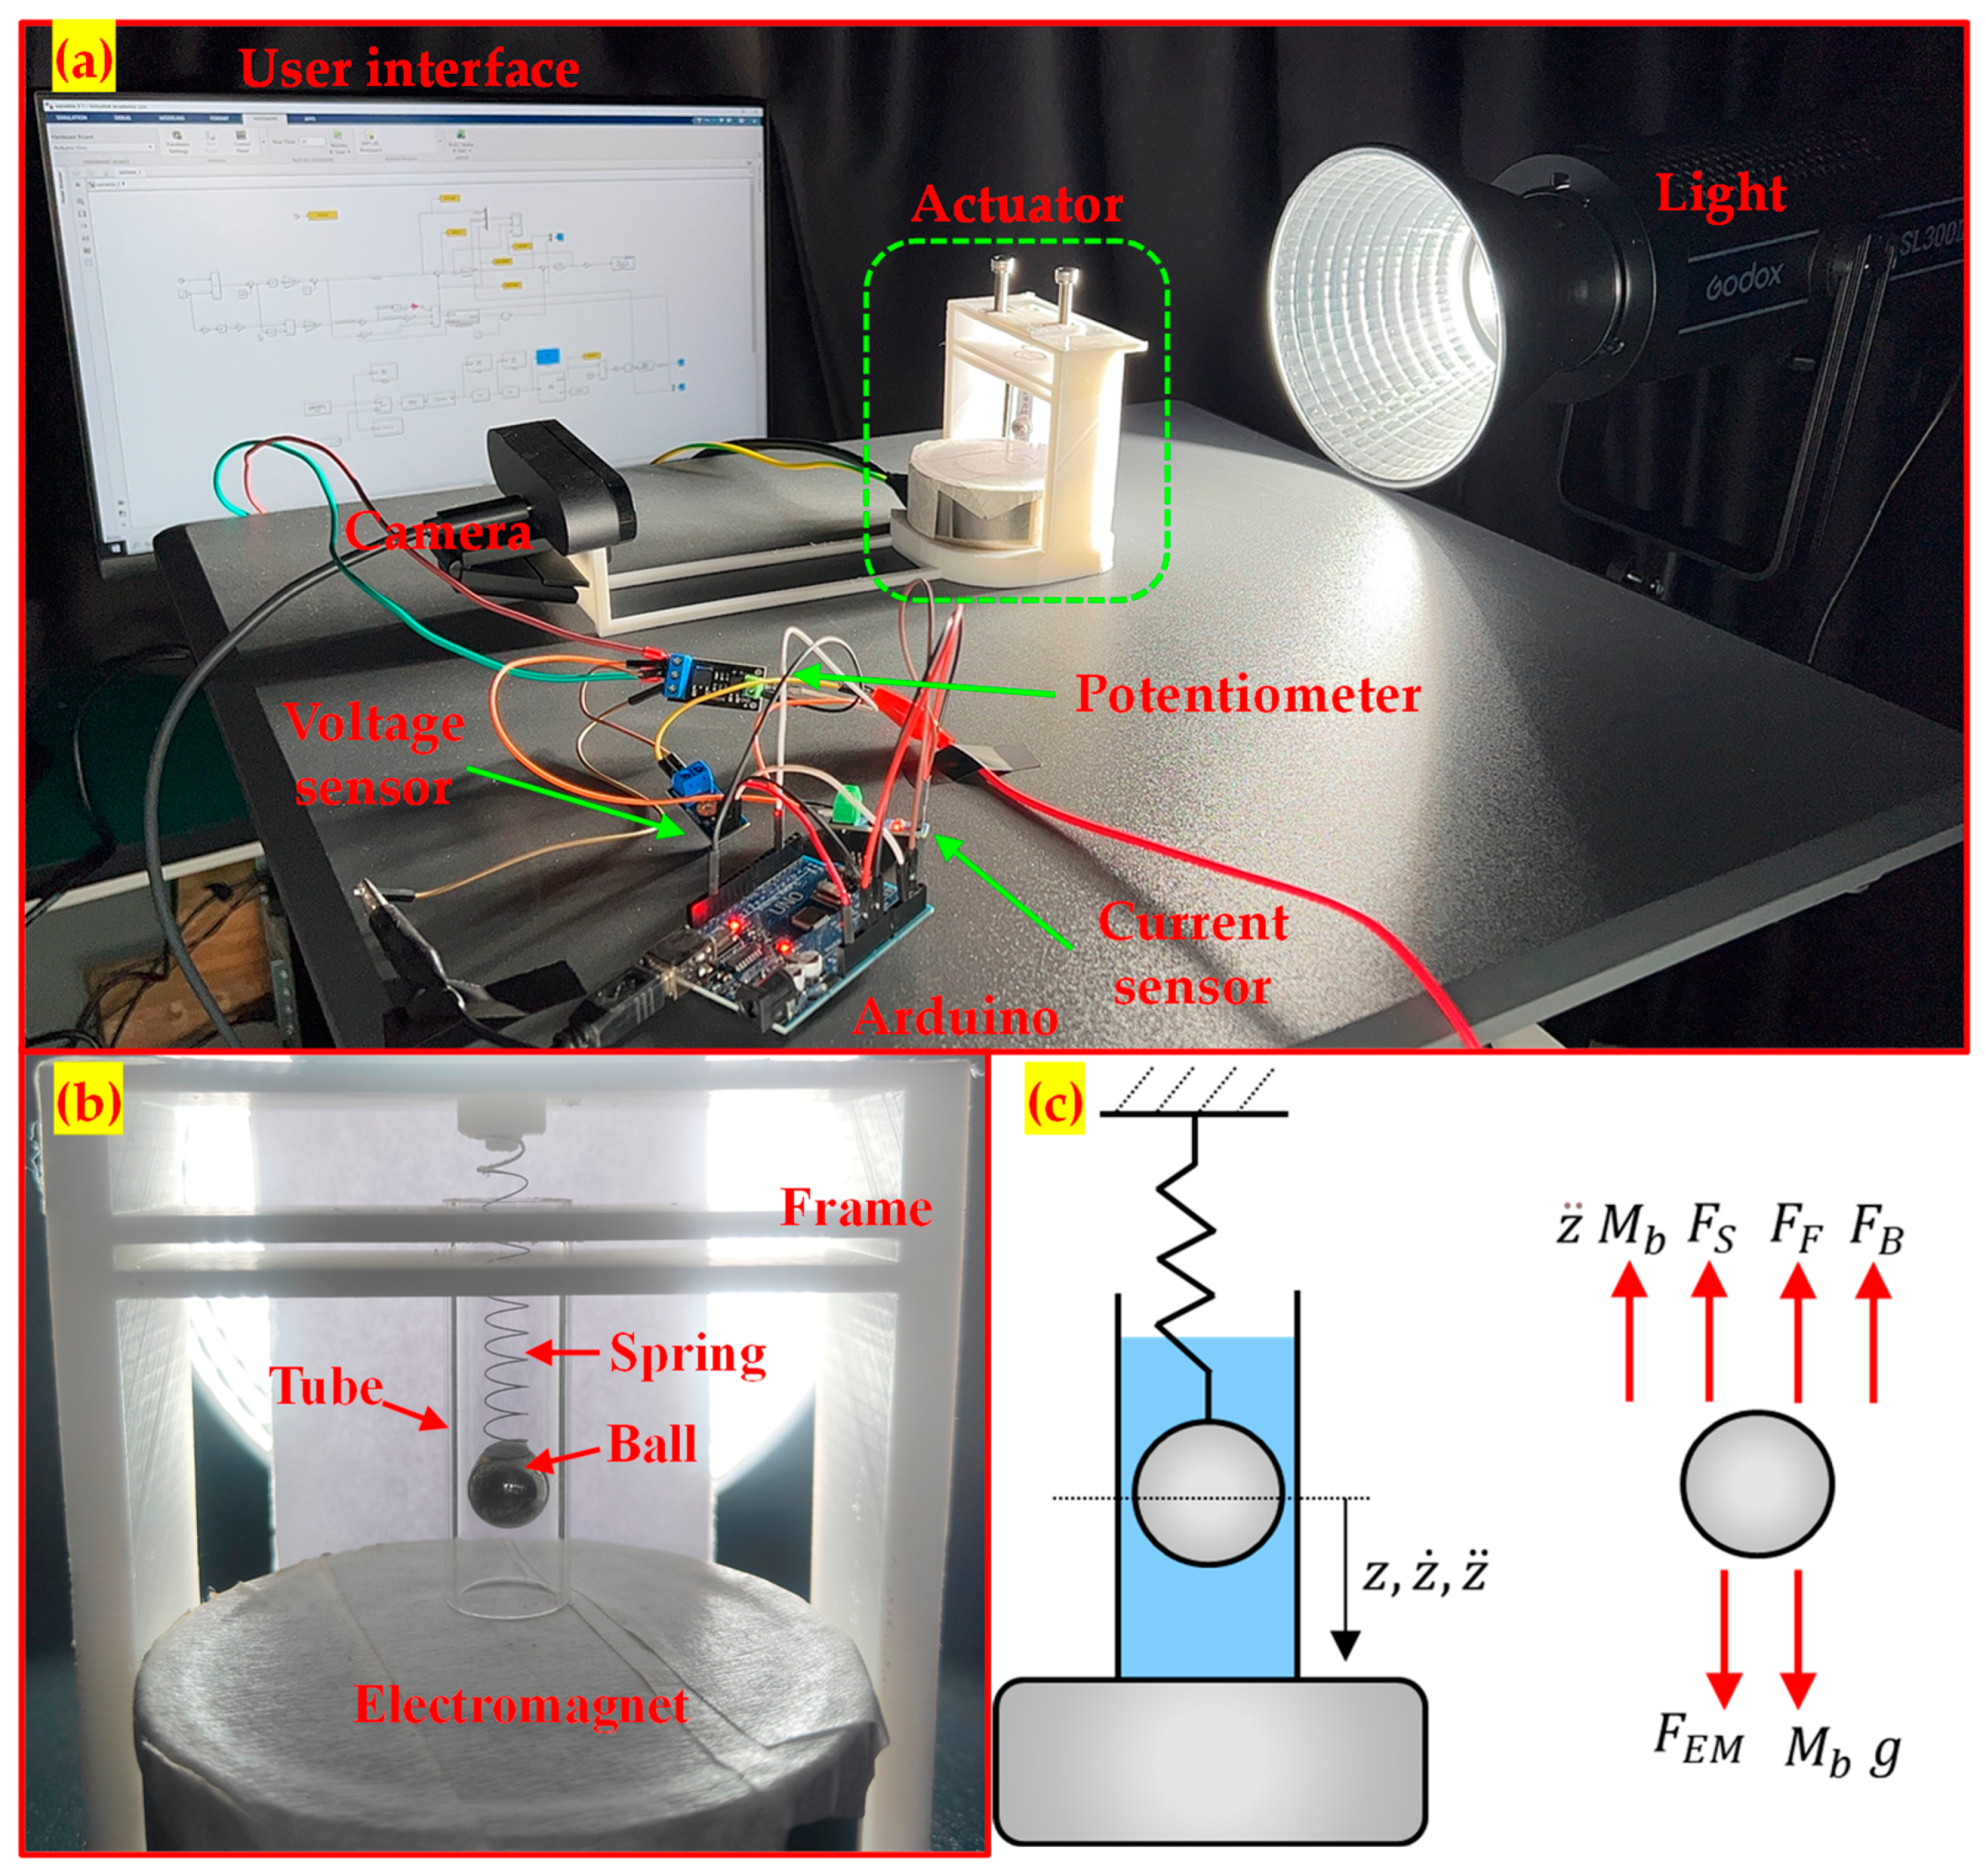
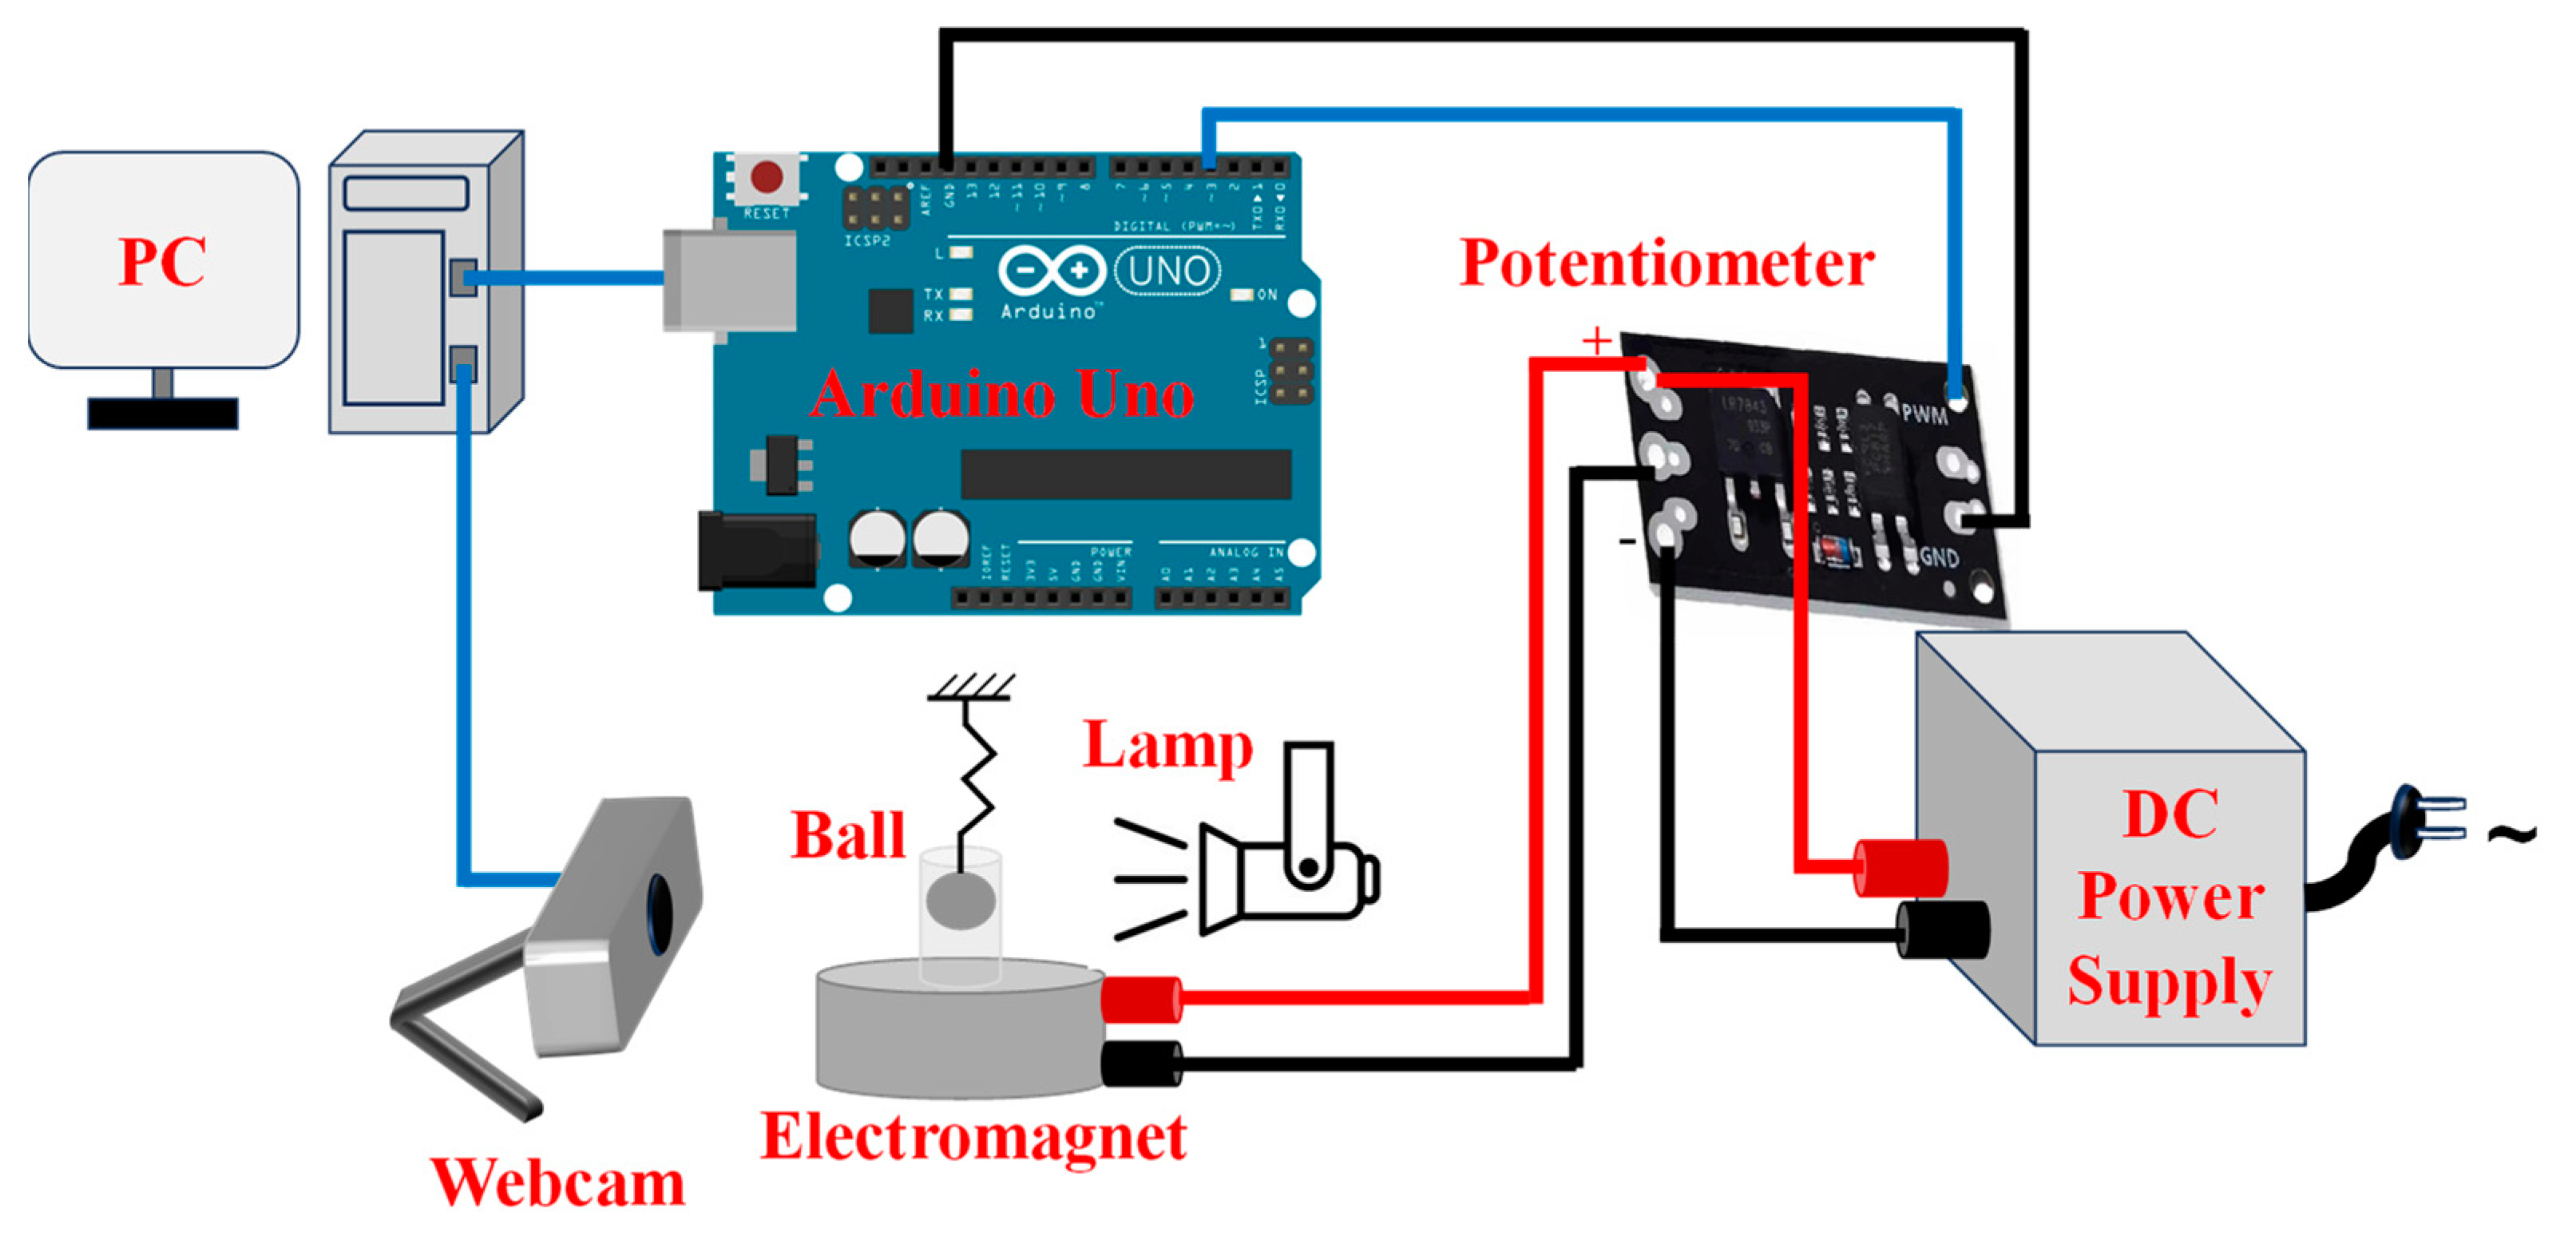
- We have proposed a user-friendly set-up that relies on cost-effective, off-the-shelf components. This set-up combines three main subsystems: actuation, motion tracking, and feedback control. Our approach has minimum complexity since we have chosen a plug-and-play webcam for optical tracking and developed an intuitive, model-based control law.
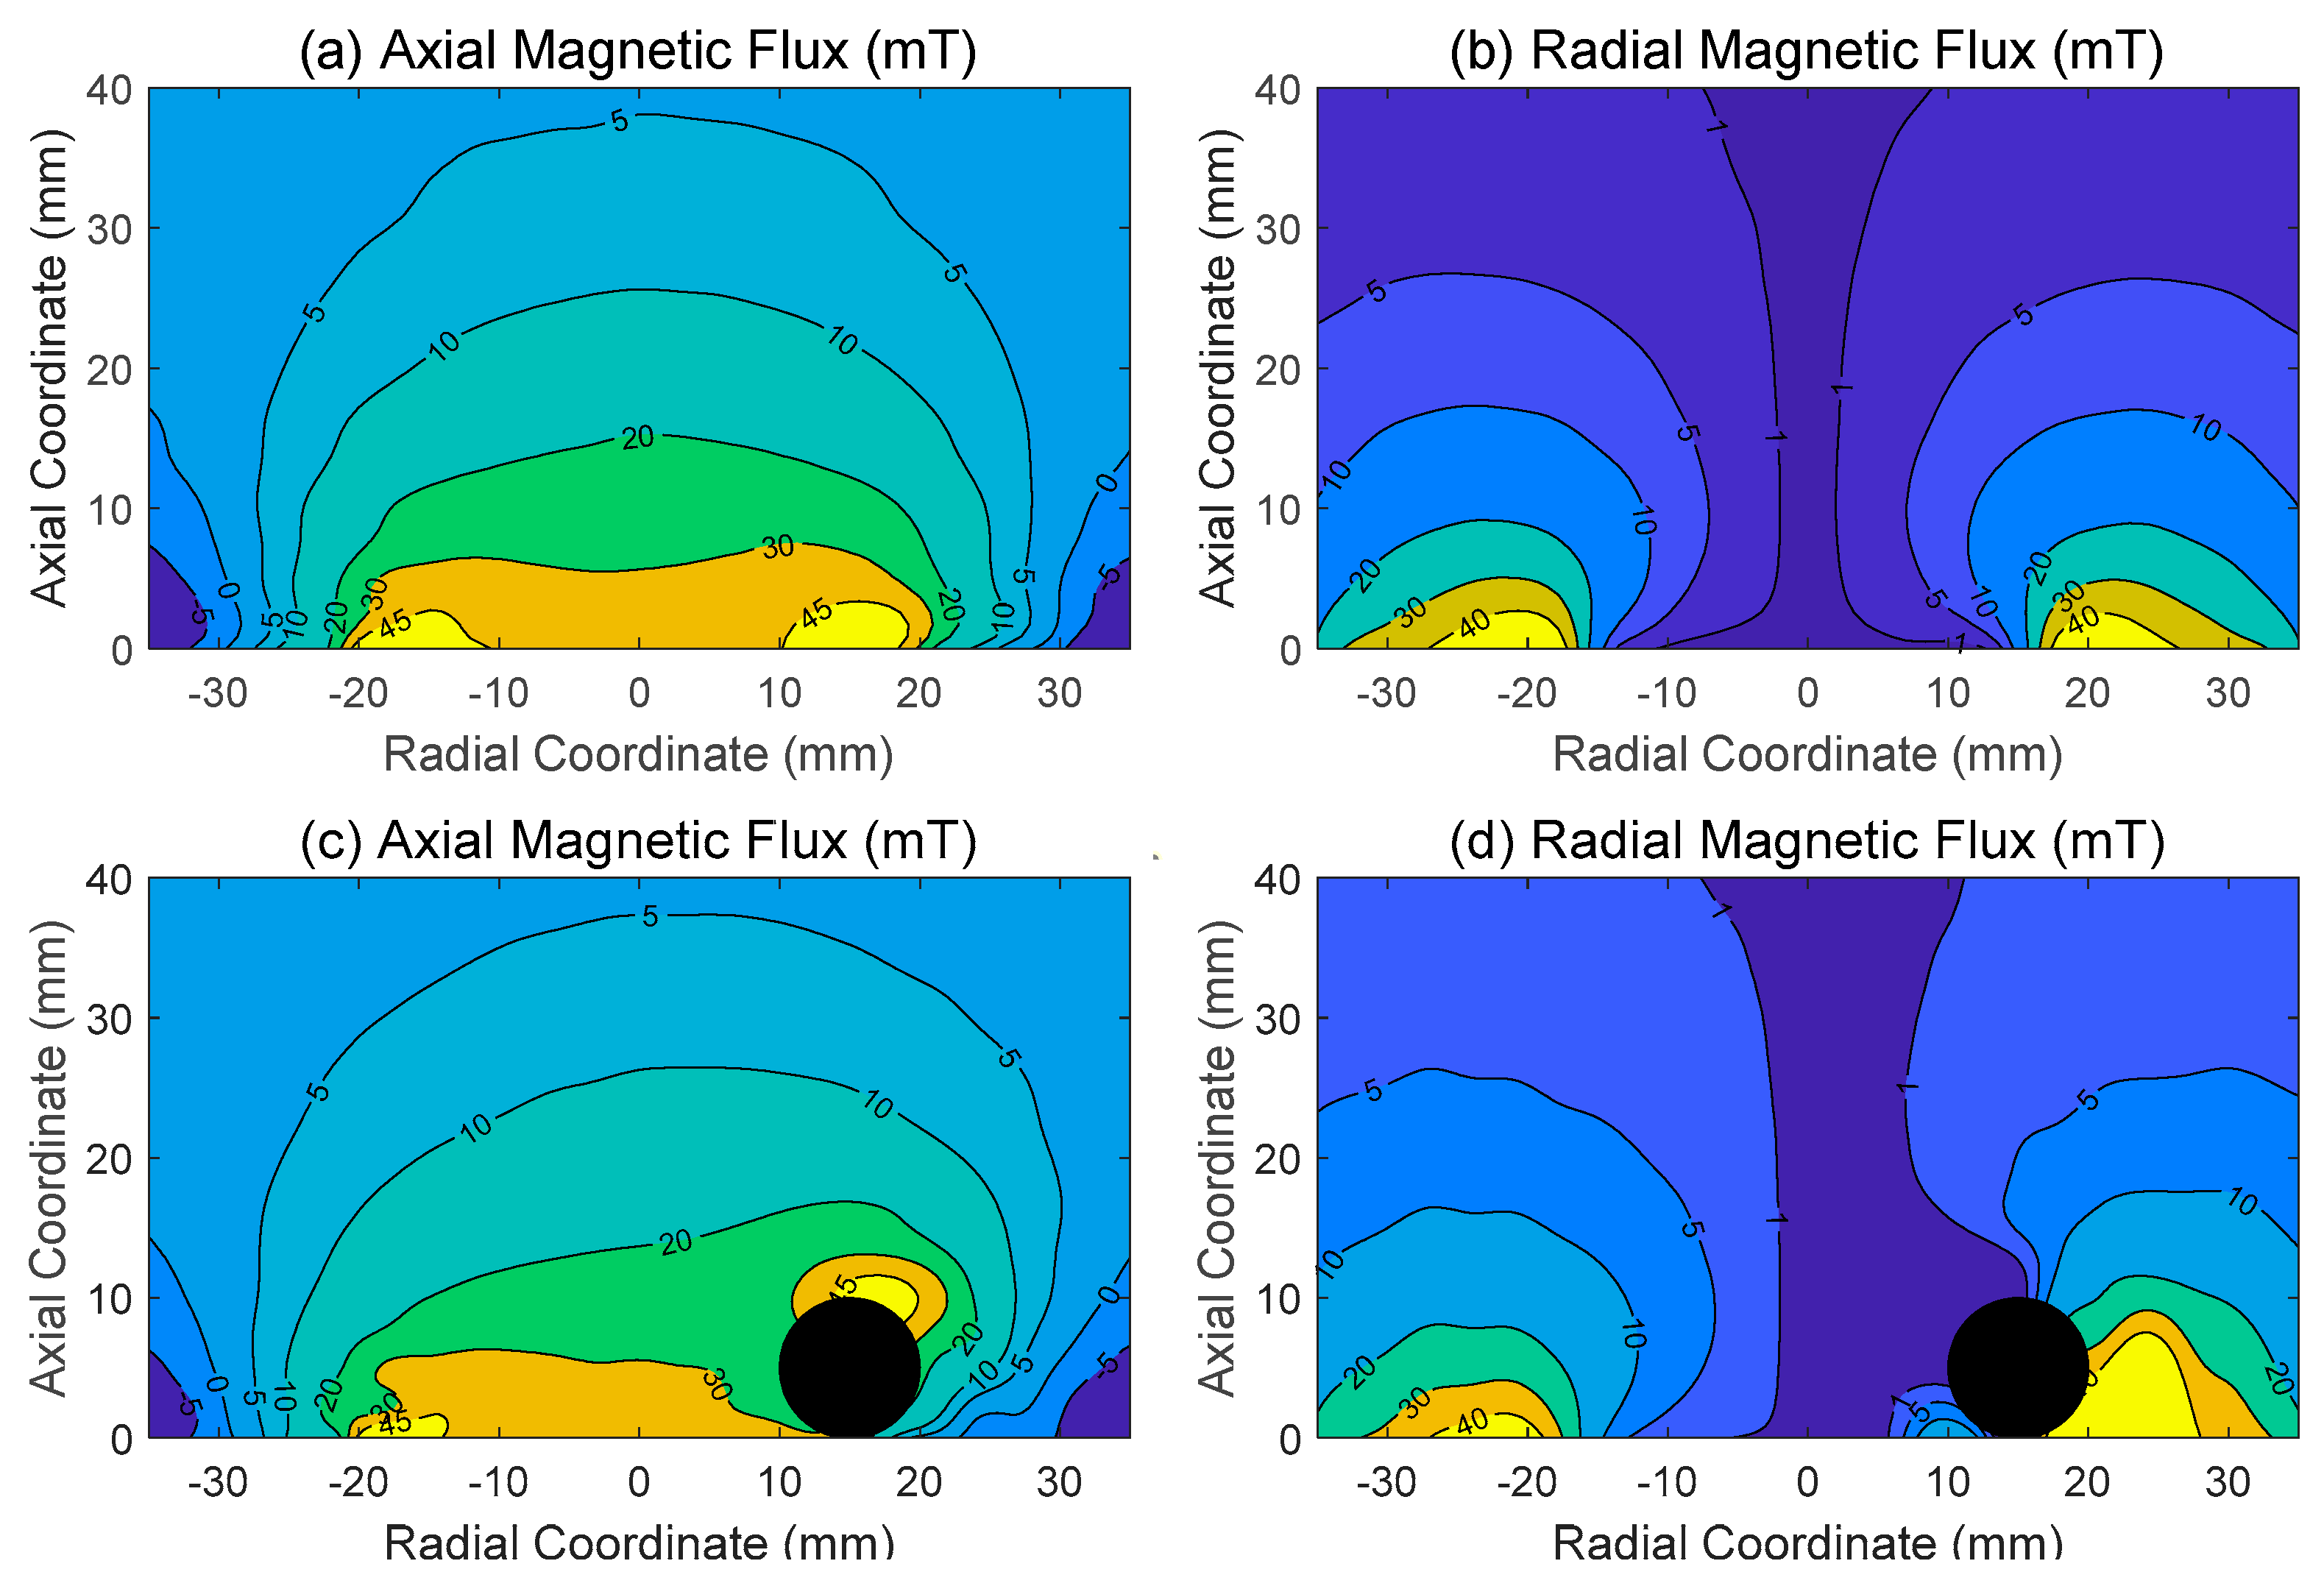
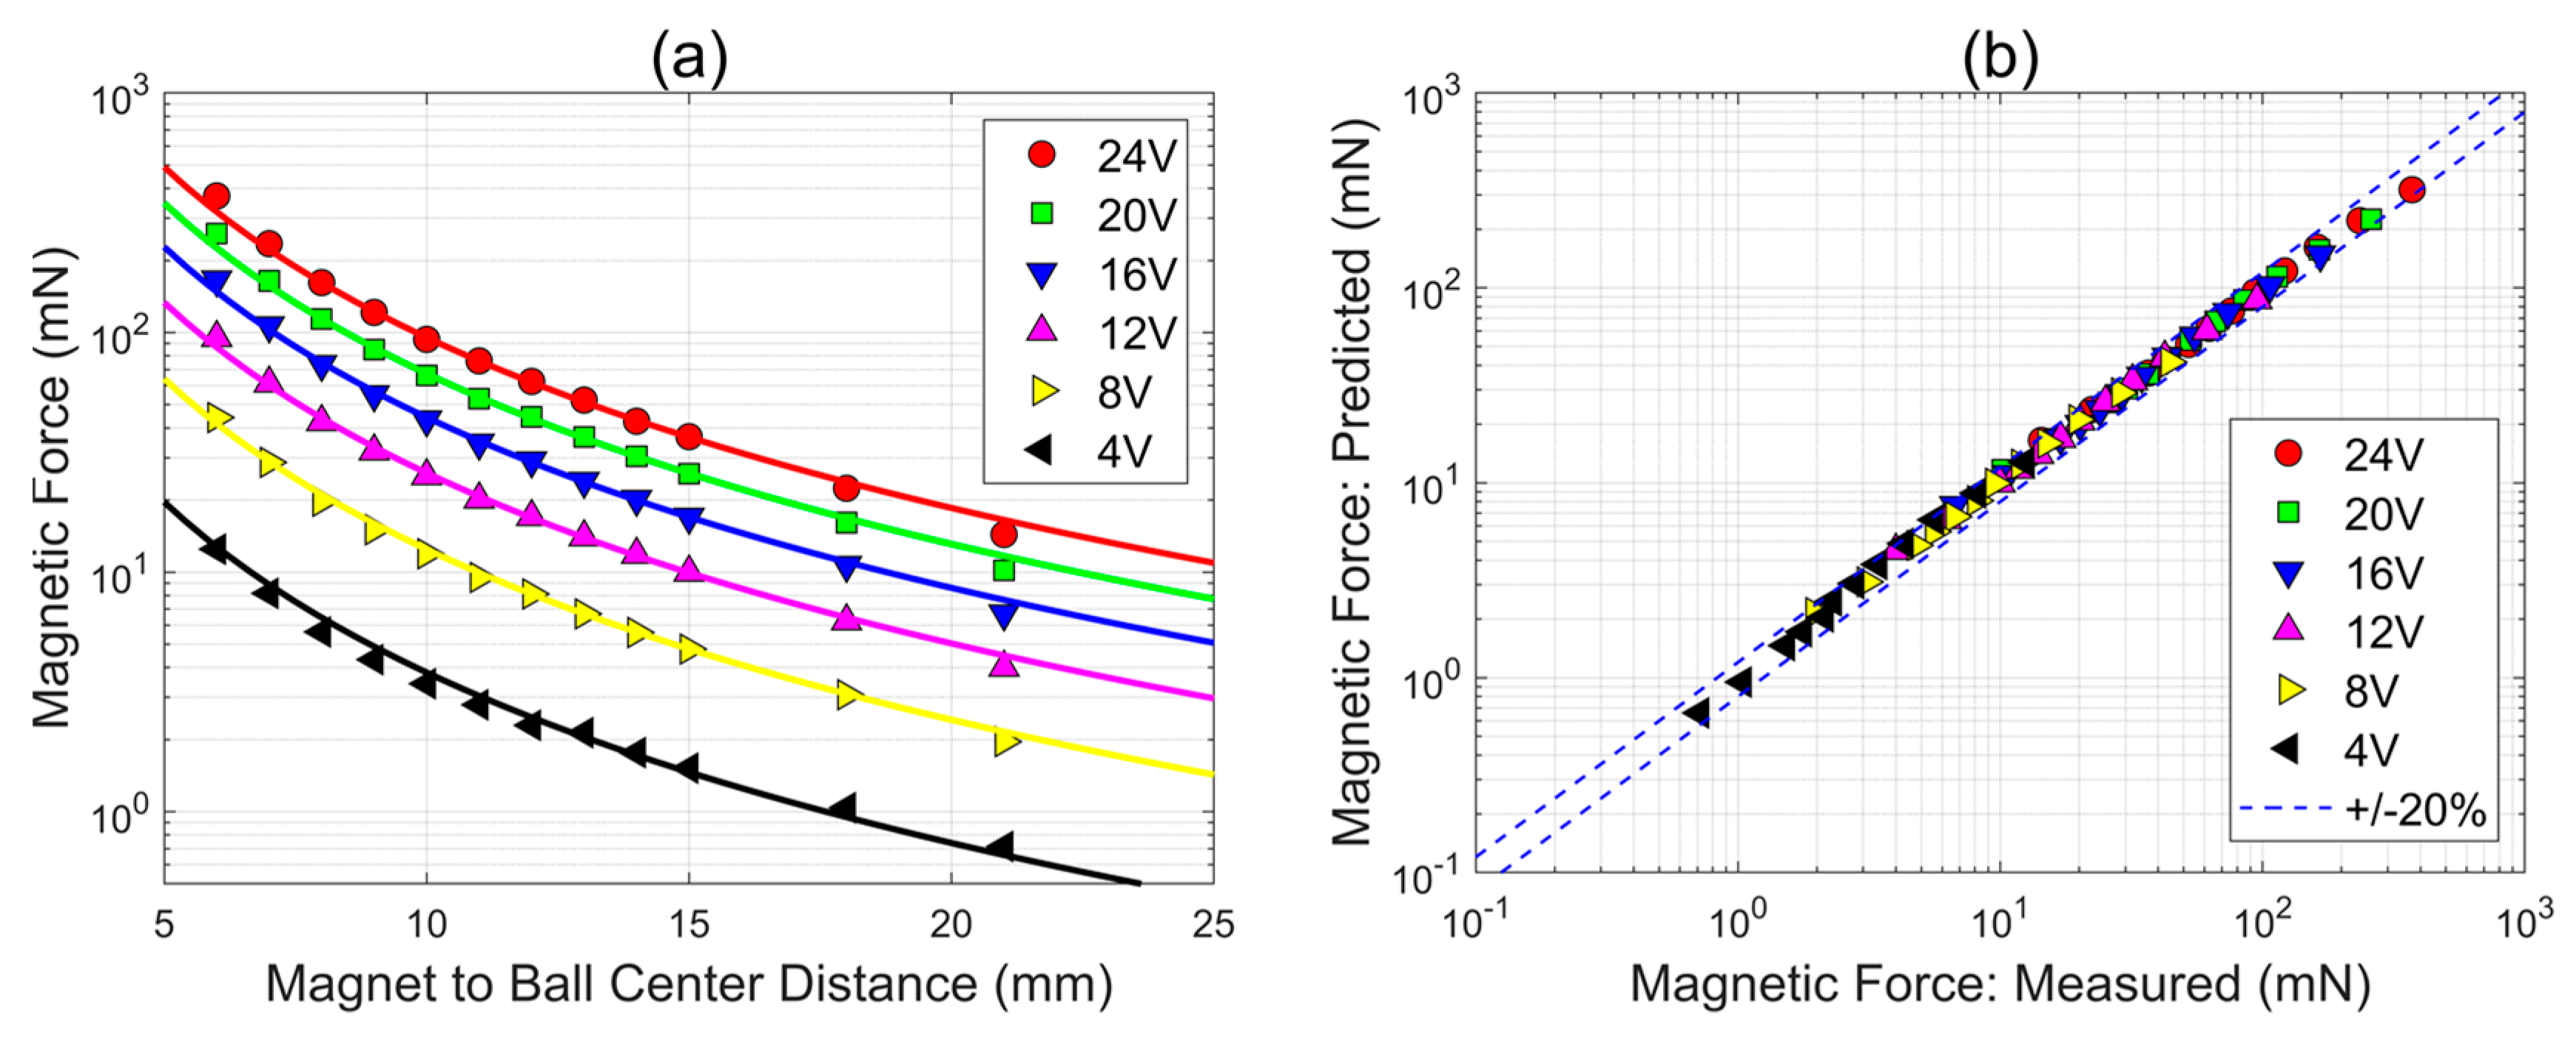
- We have gained significant insight into the distribution of the magnetic flux / magnetic force of electromagnets. We have shown that the magnetic flux is highly nonlinear and severely changes when a ferromagnetic object is nearby. We have also done an accurate and experimentally validated fitting of the electromagnetic force by creating an invertible function to be used for the control design.
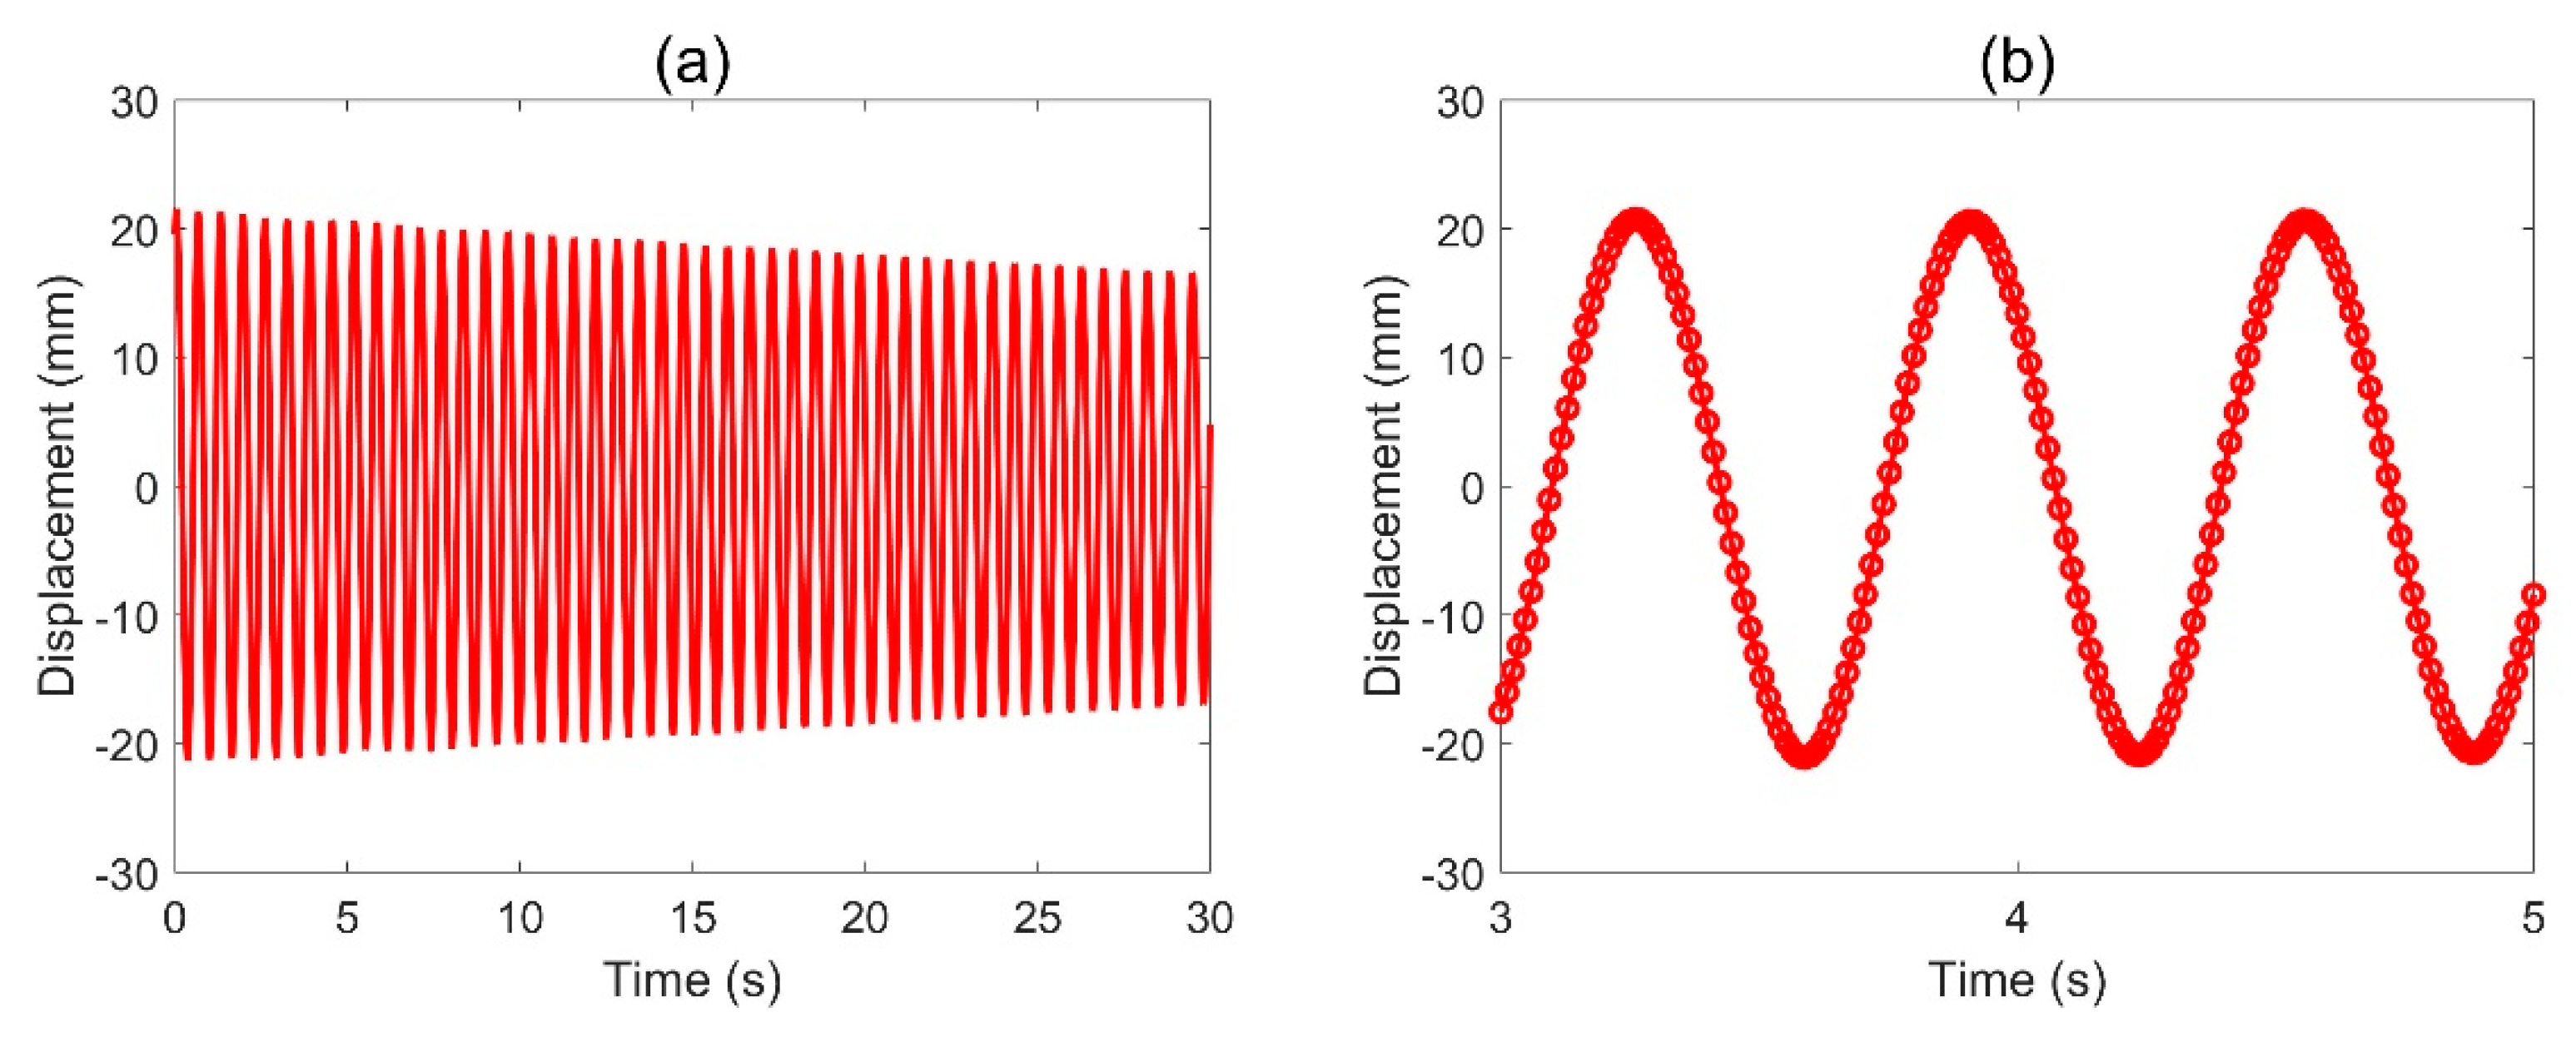
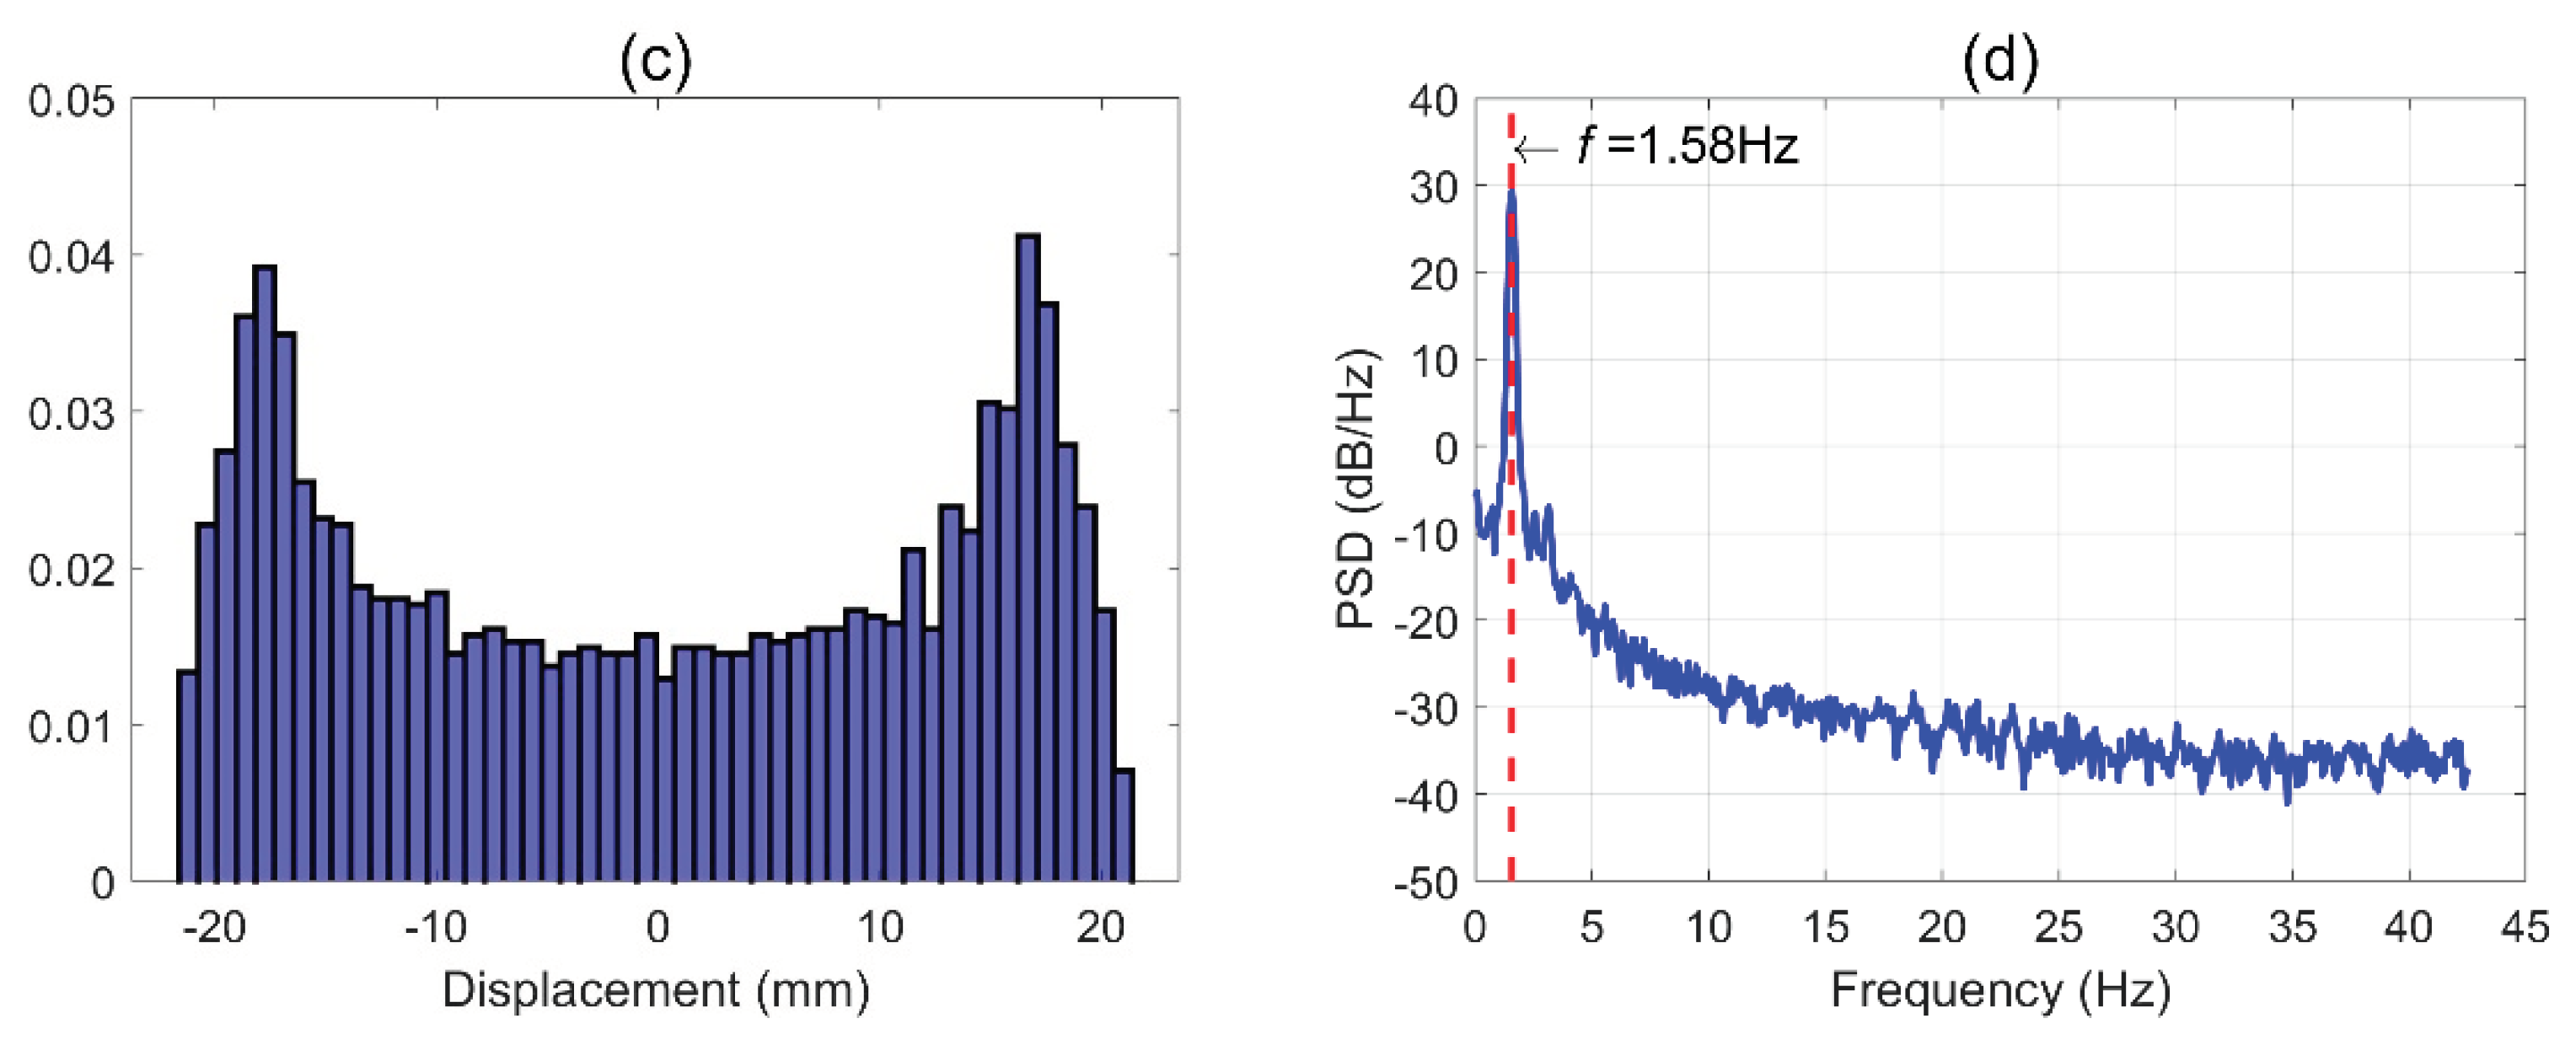
- We have used an off-the-shelf webcam to implement motion tracking via visual feedback. The camera samples images in the range of 85 ± 2 fps. Our conservative estimate for the sensing accuracy of the ball centroid’s location is about ± 300 microns. We have validated this approach with an oscillating pendulum whose power spectrum presents one dominant peak that closely matches its theoretical oscillation frequency.
- We have deliberately designed a control algorithm for closed-loop, position control of the actuated object with minimum complexity. This law combines a model-based feedforward term (it predicts the electromagnet’s voltage command based on the desired motion) and a feedback term (it corrects the voltage command by applying proportional-integrative control on the position error).
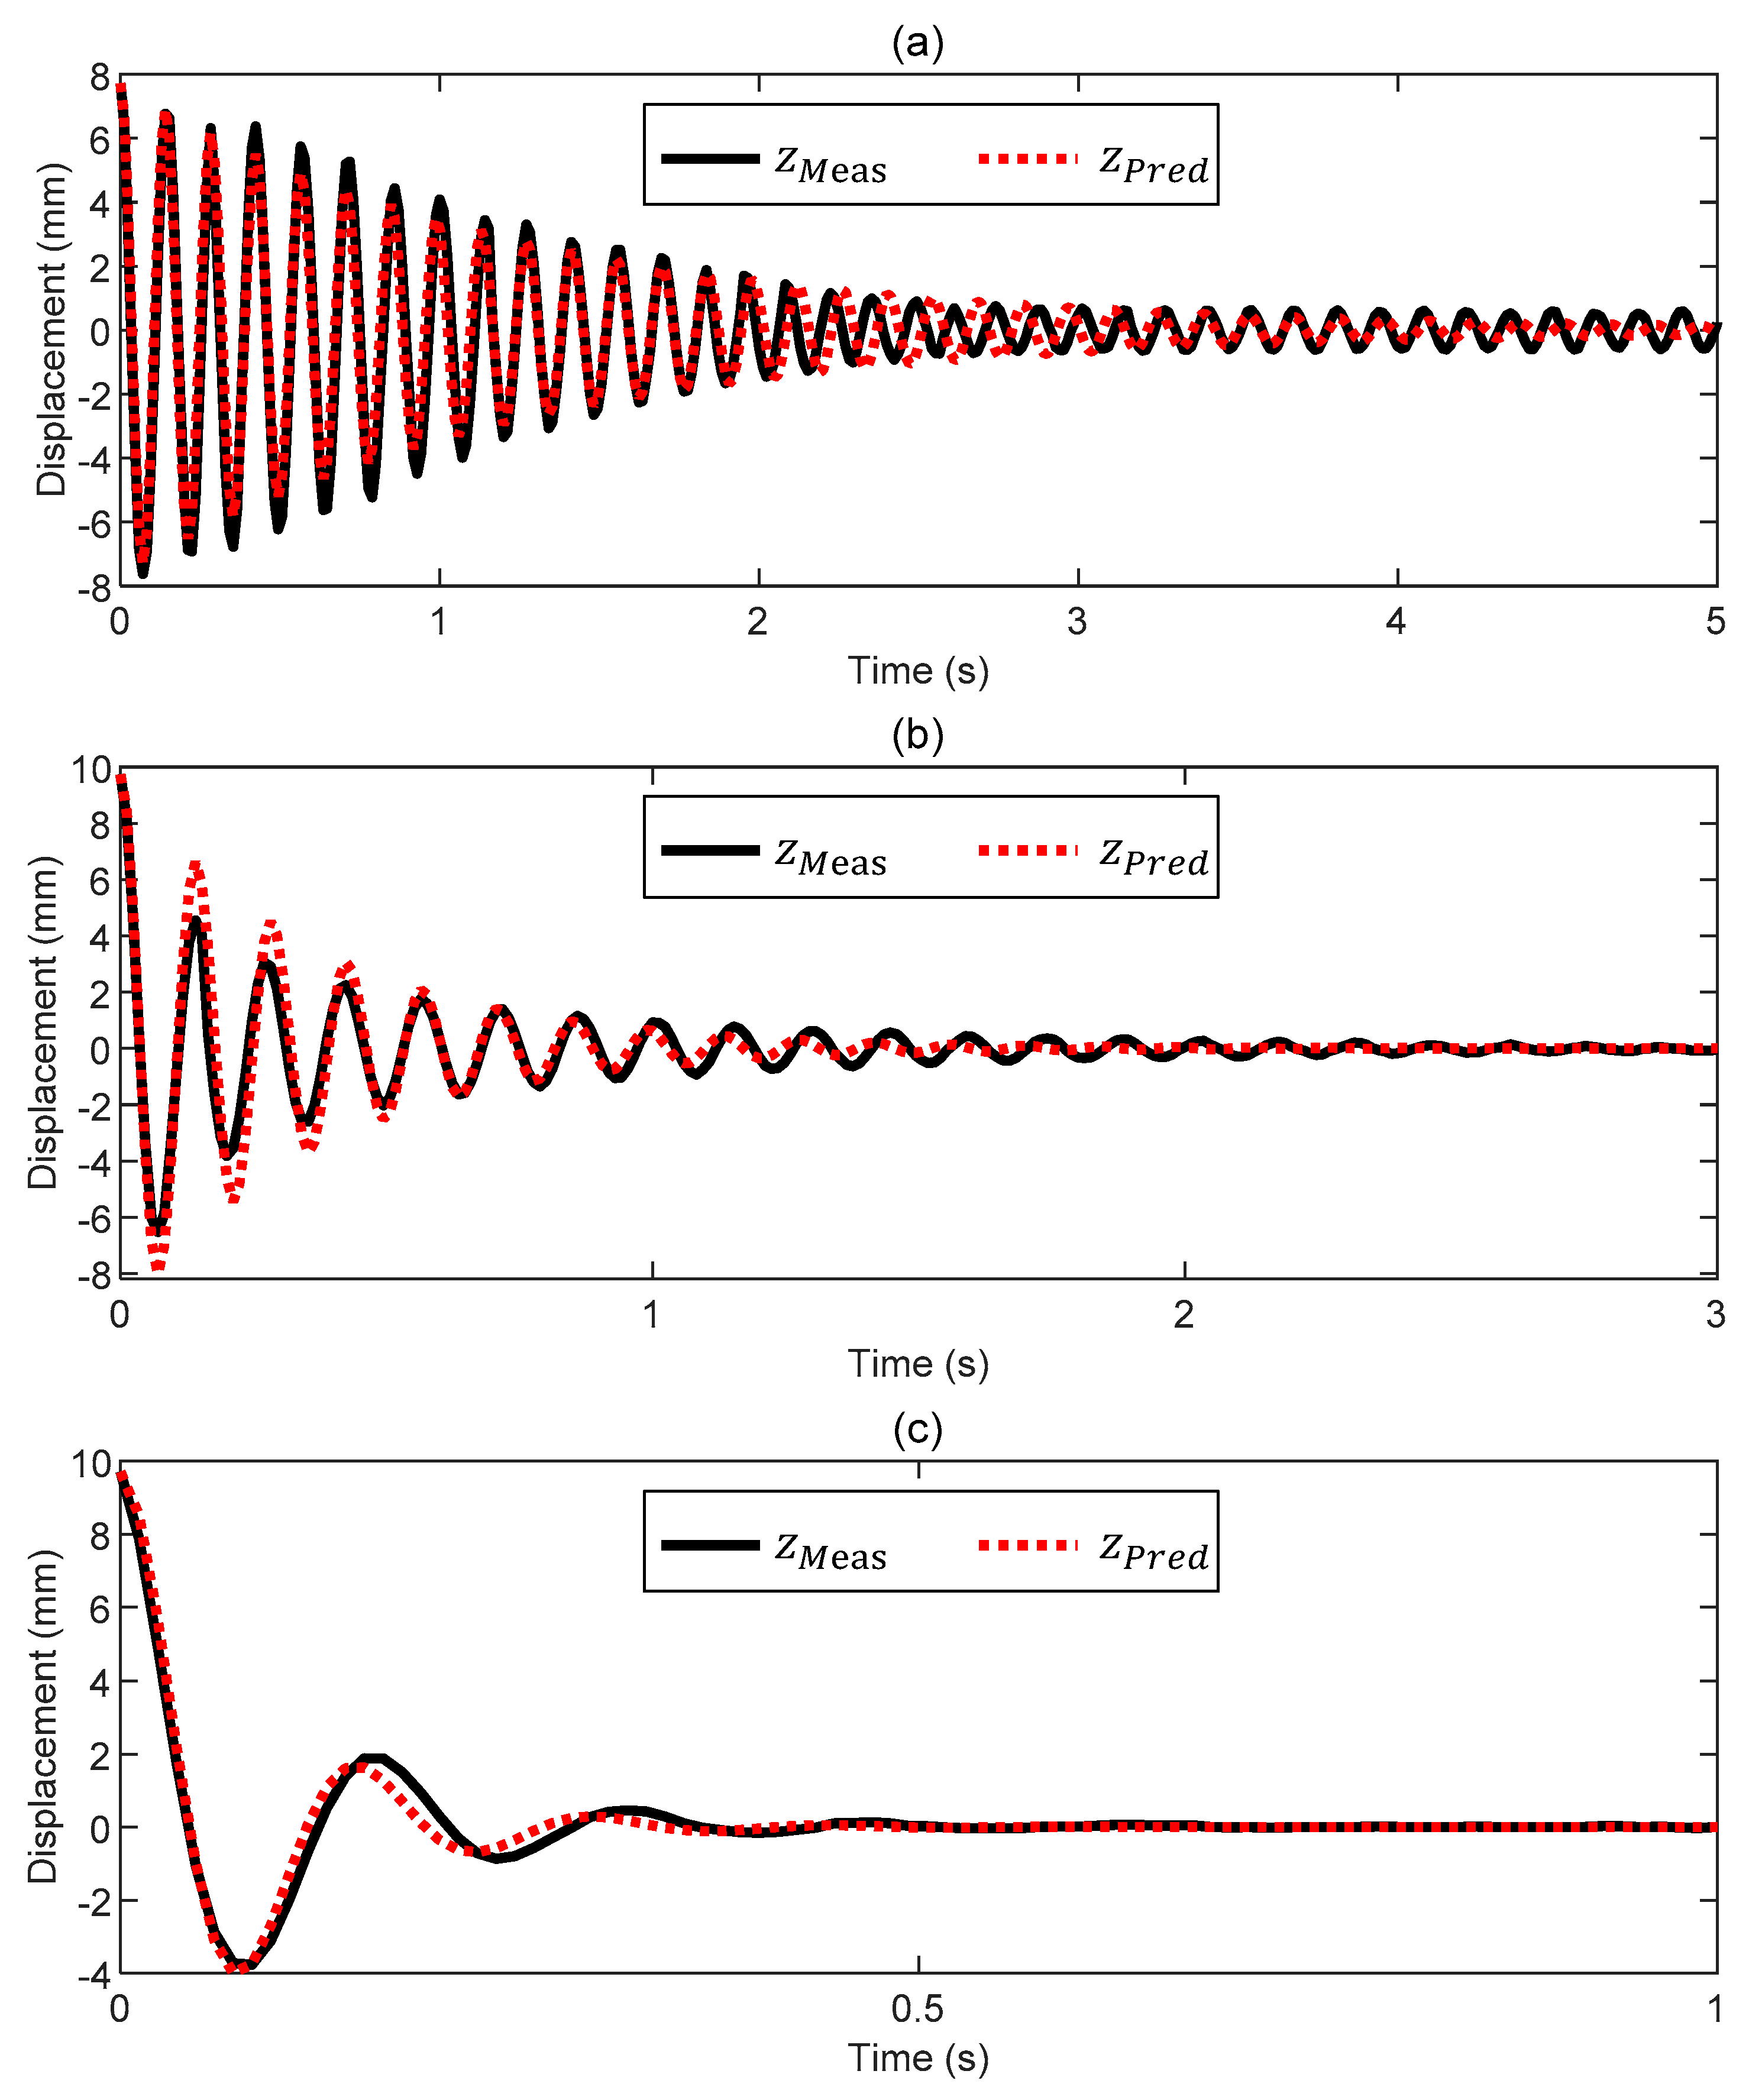
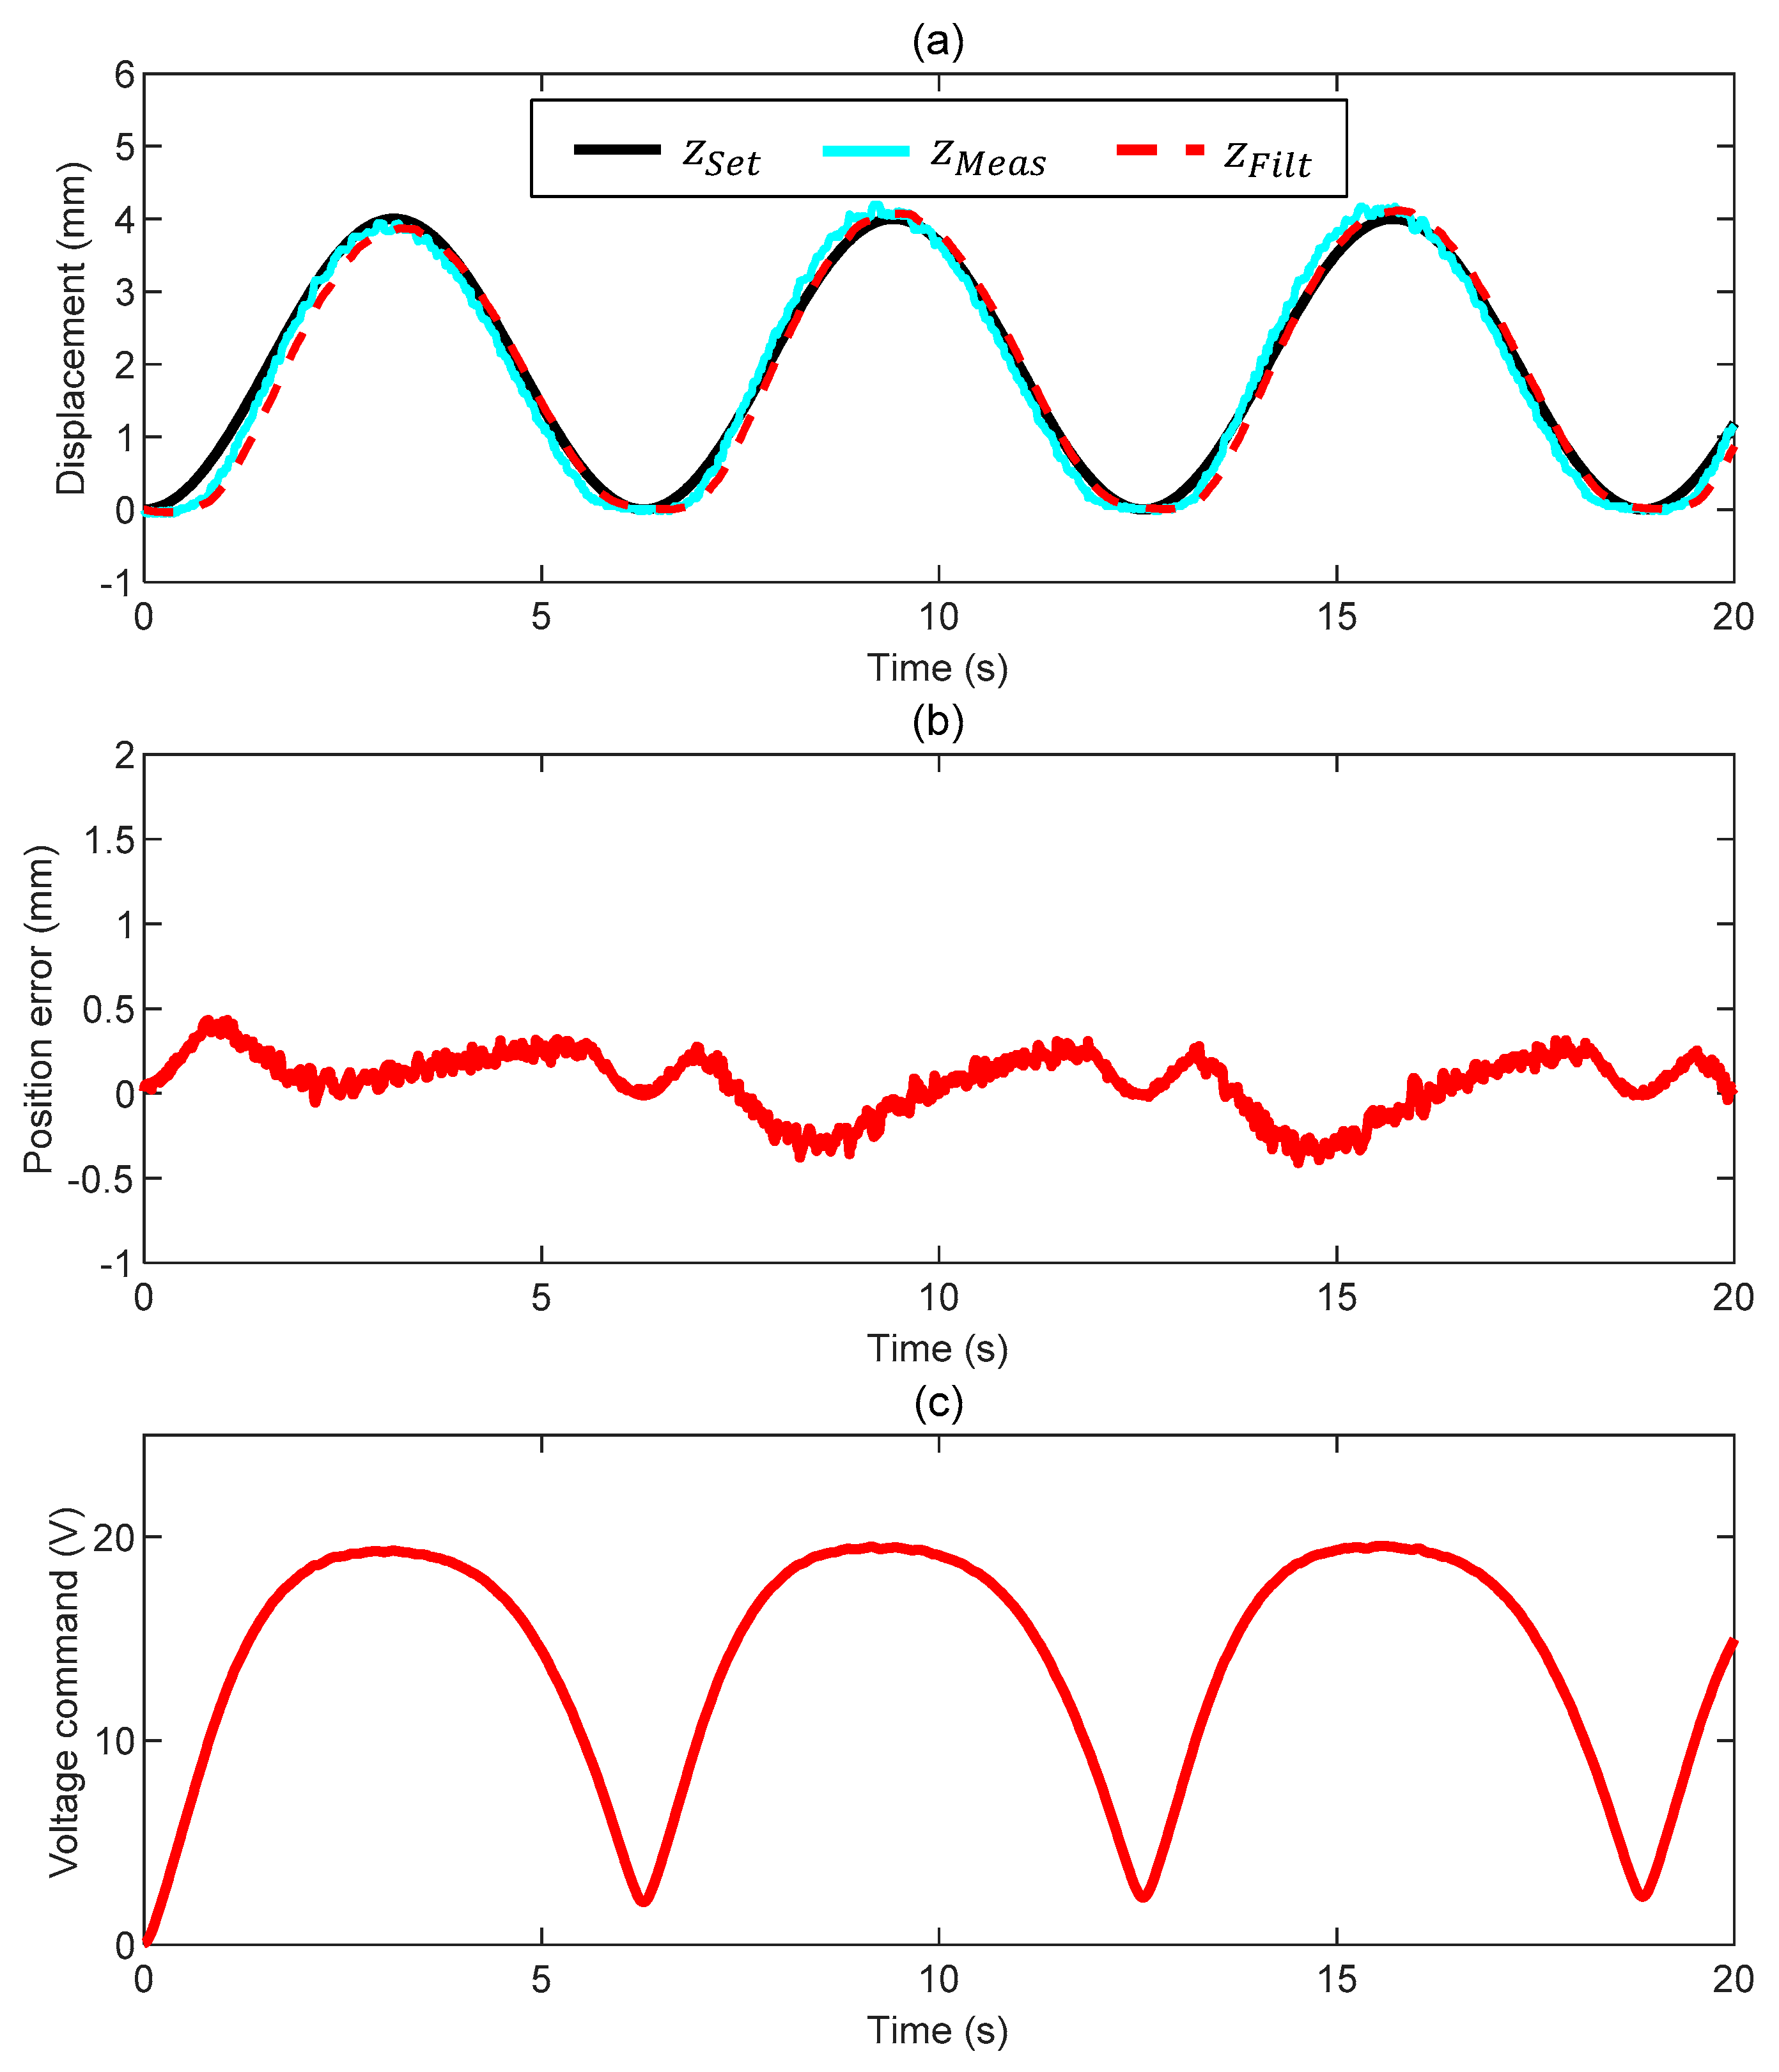
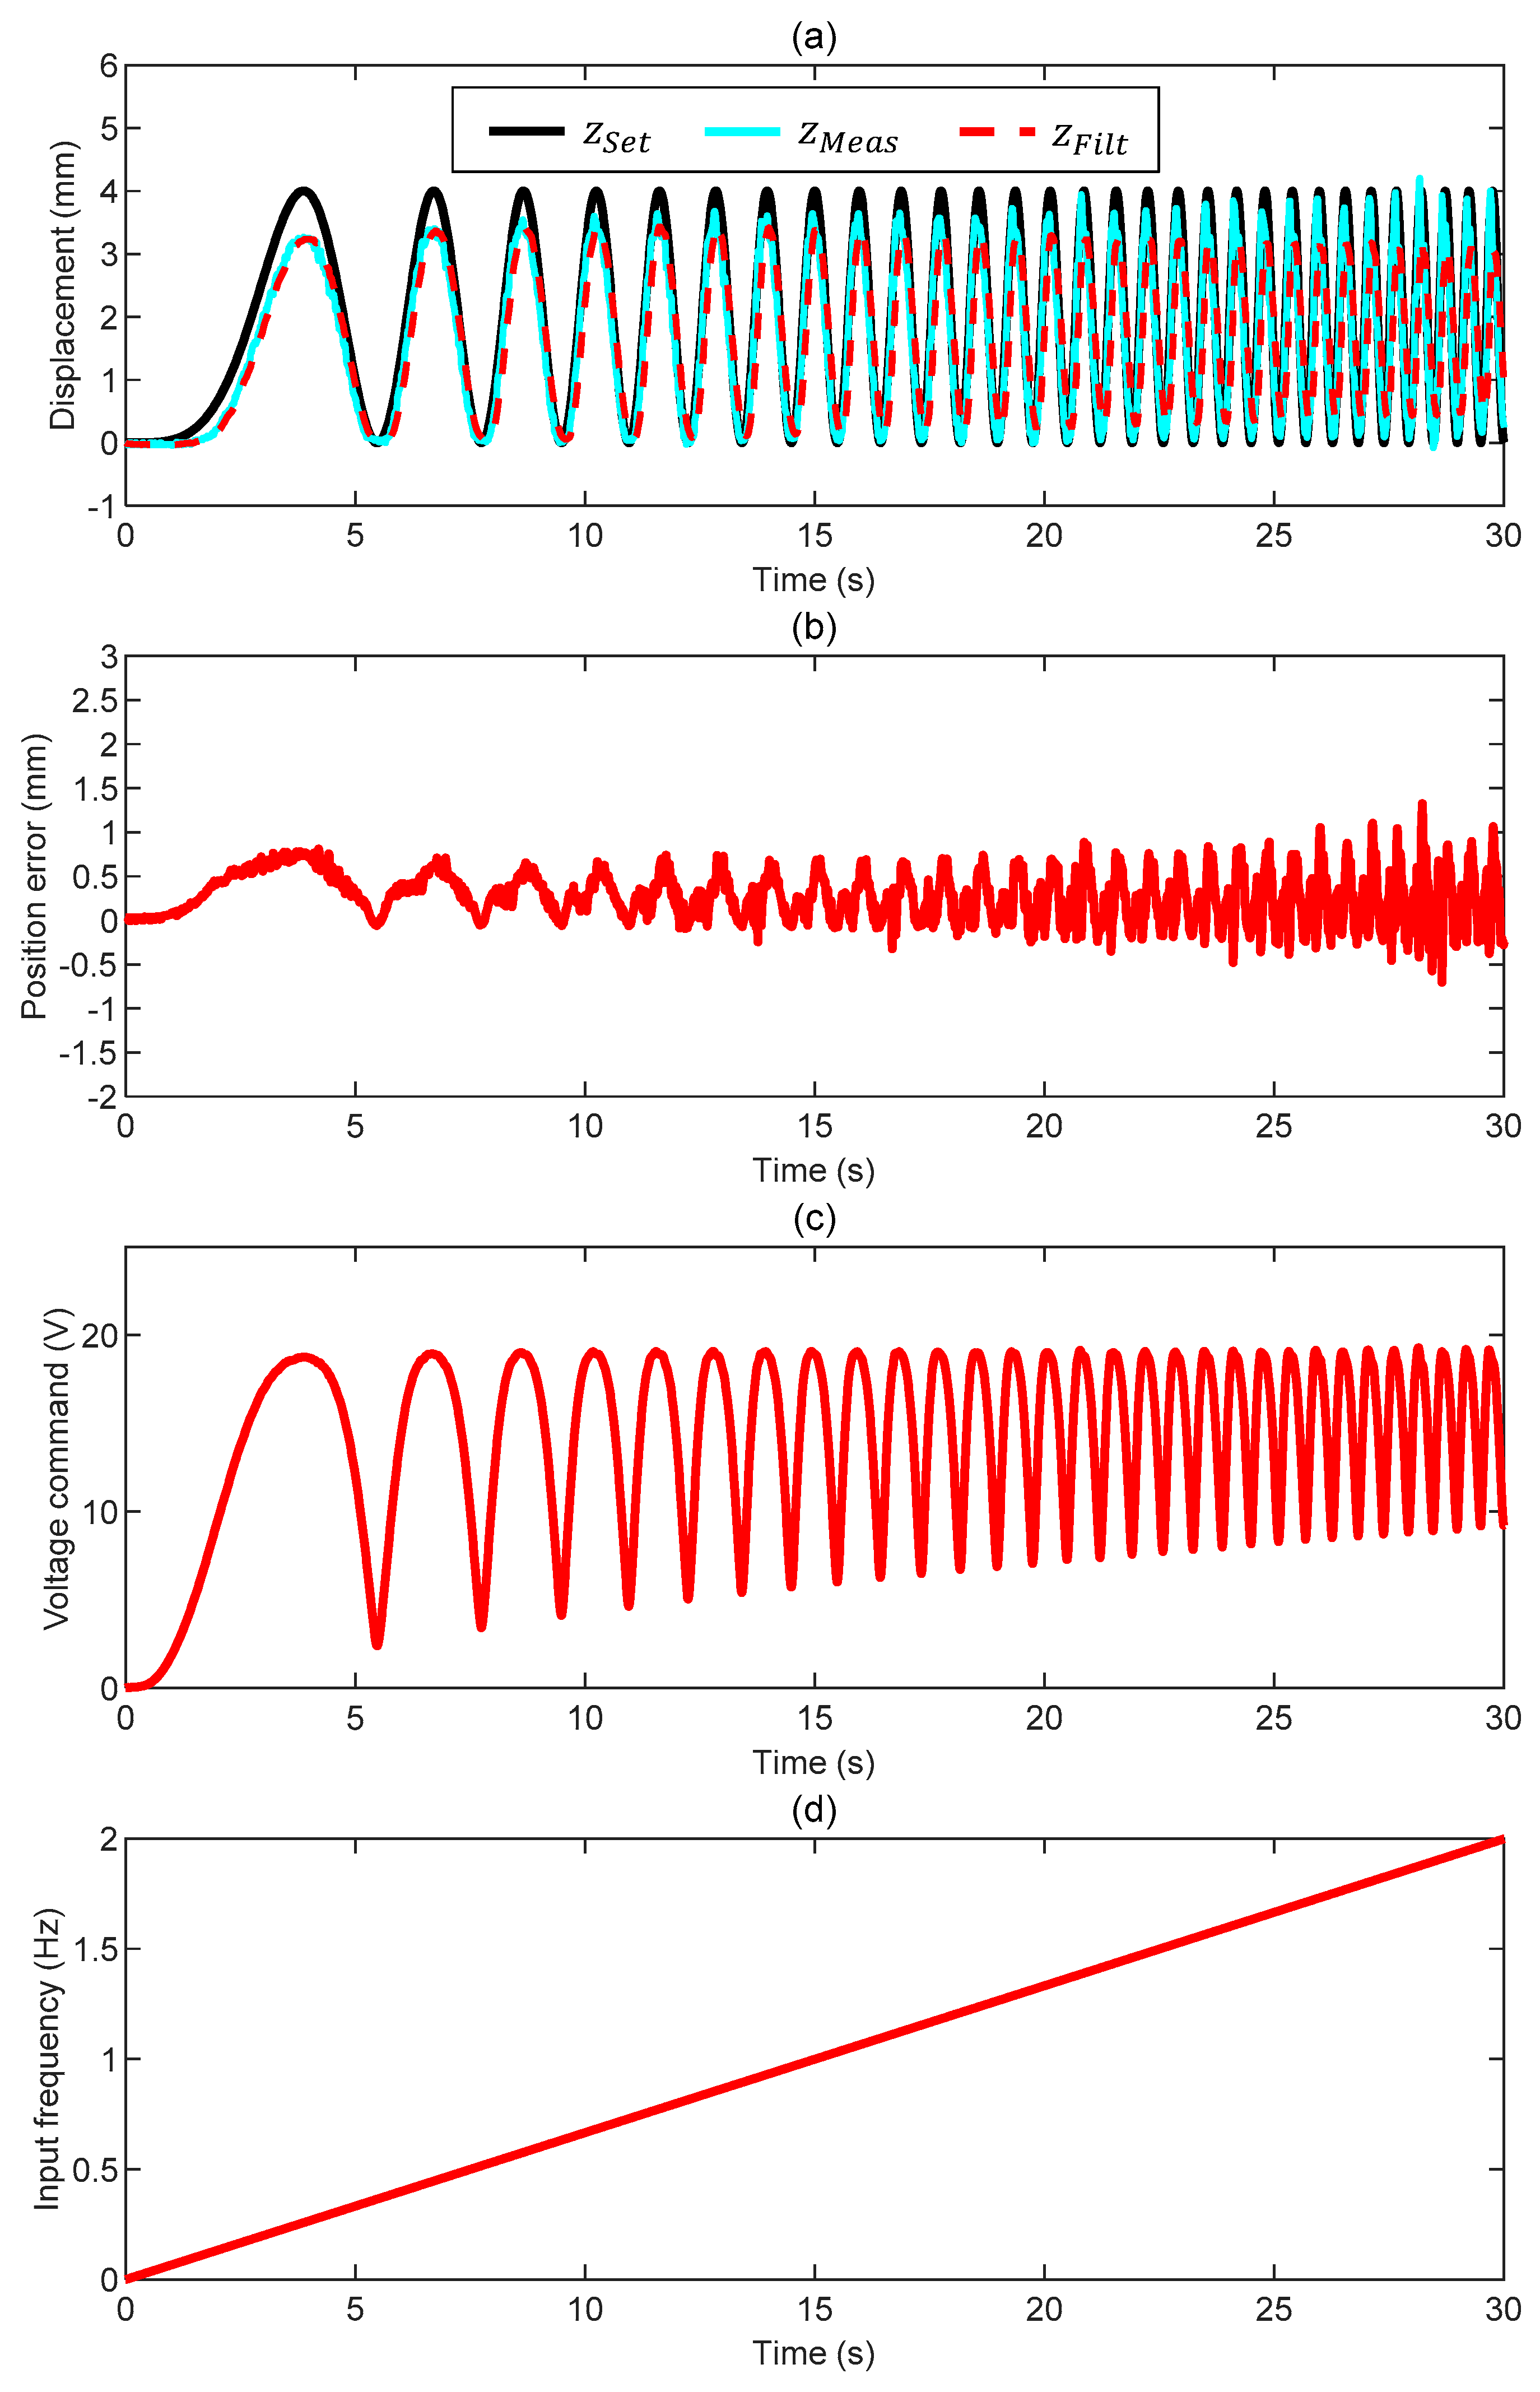
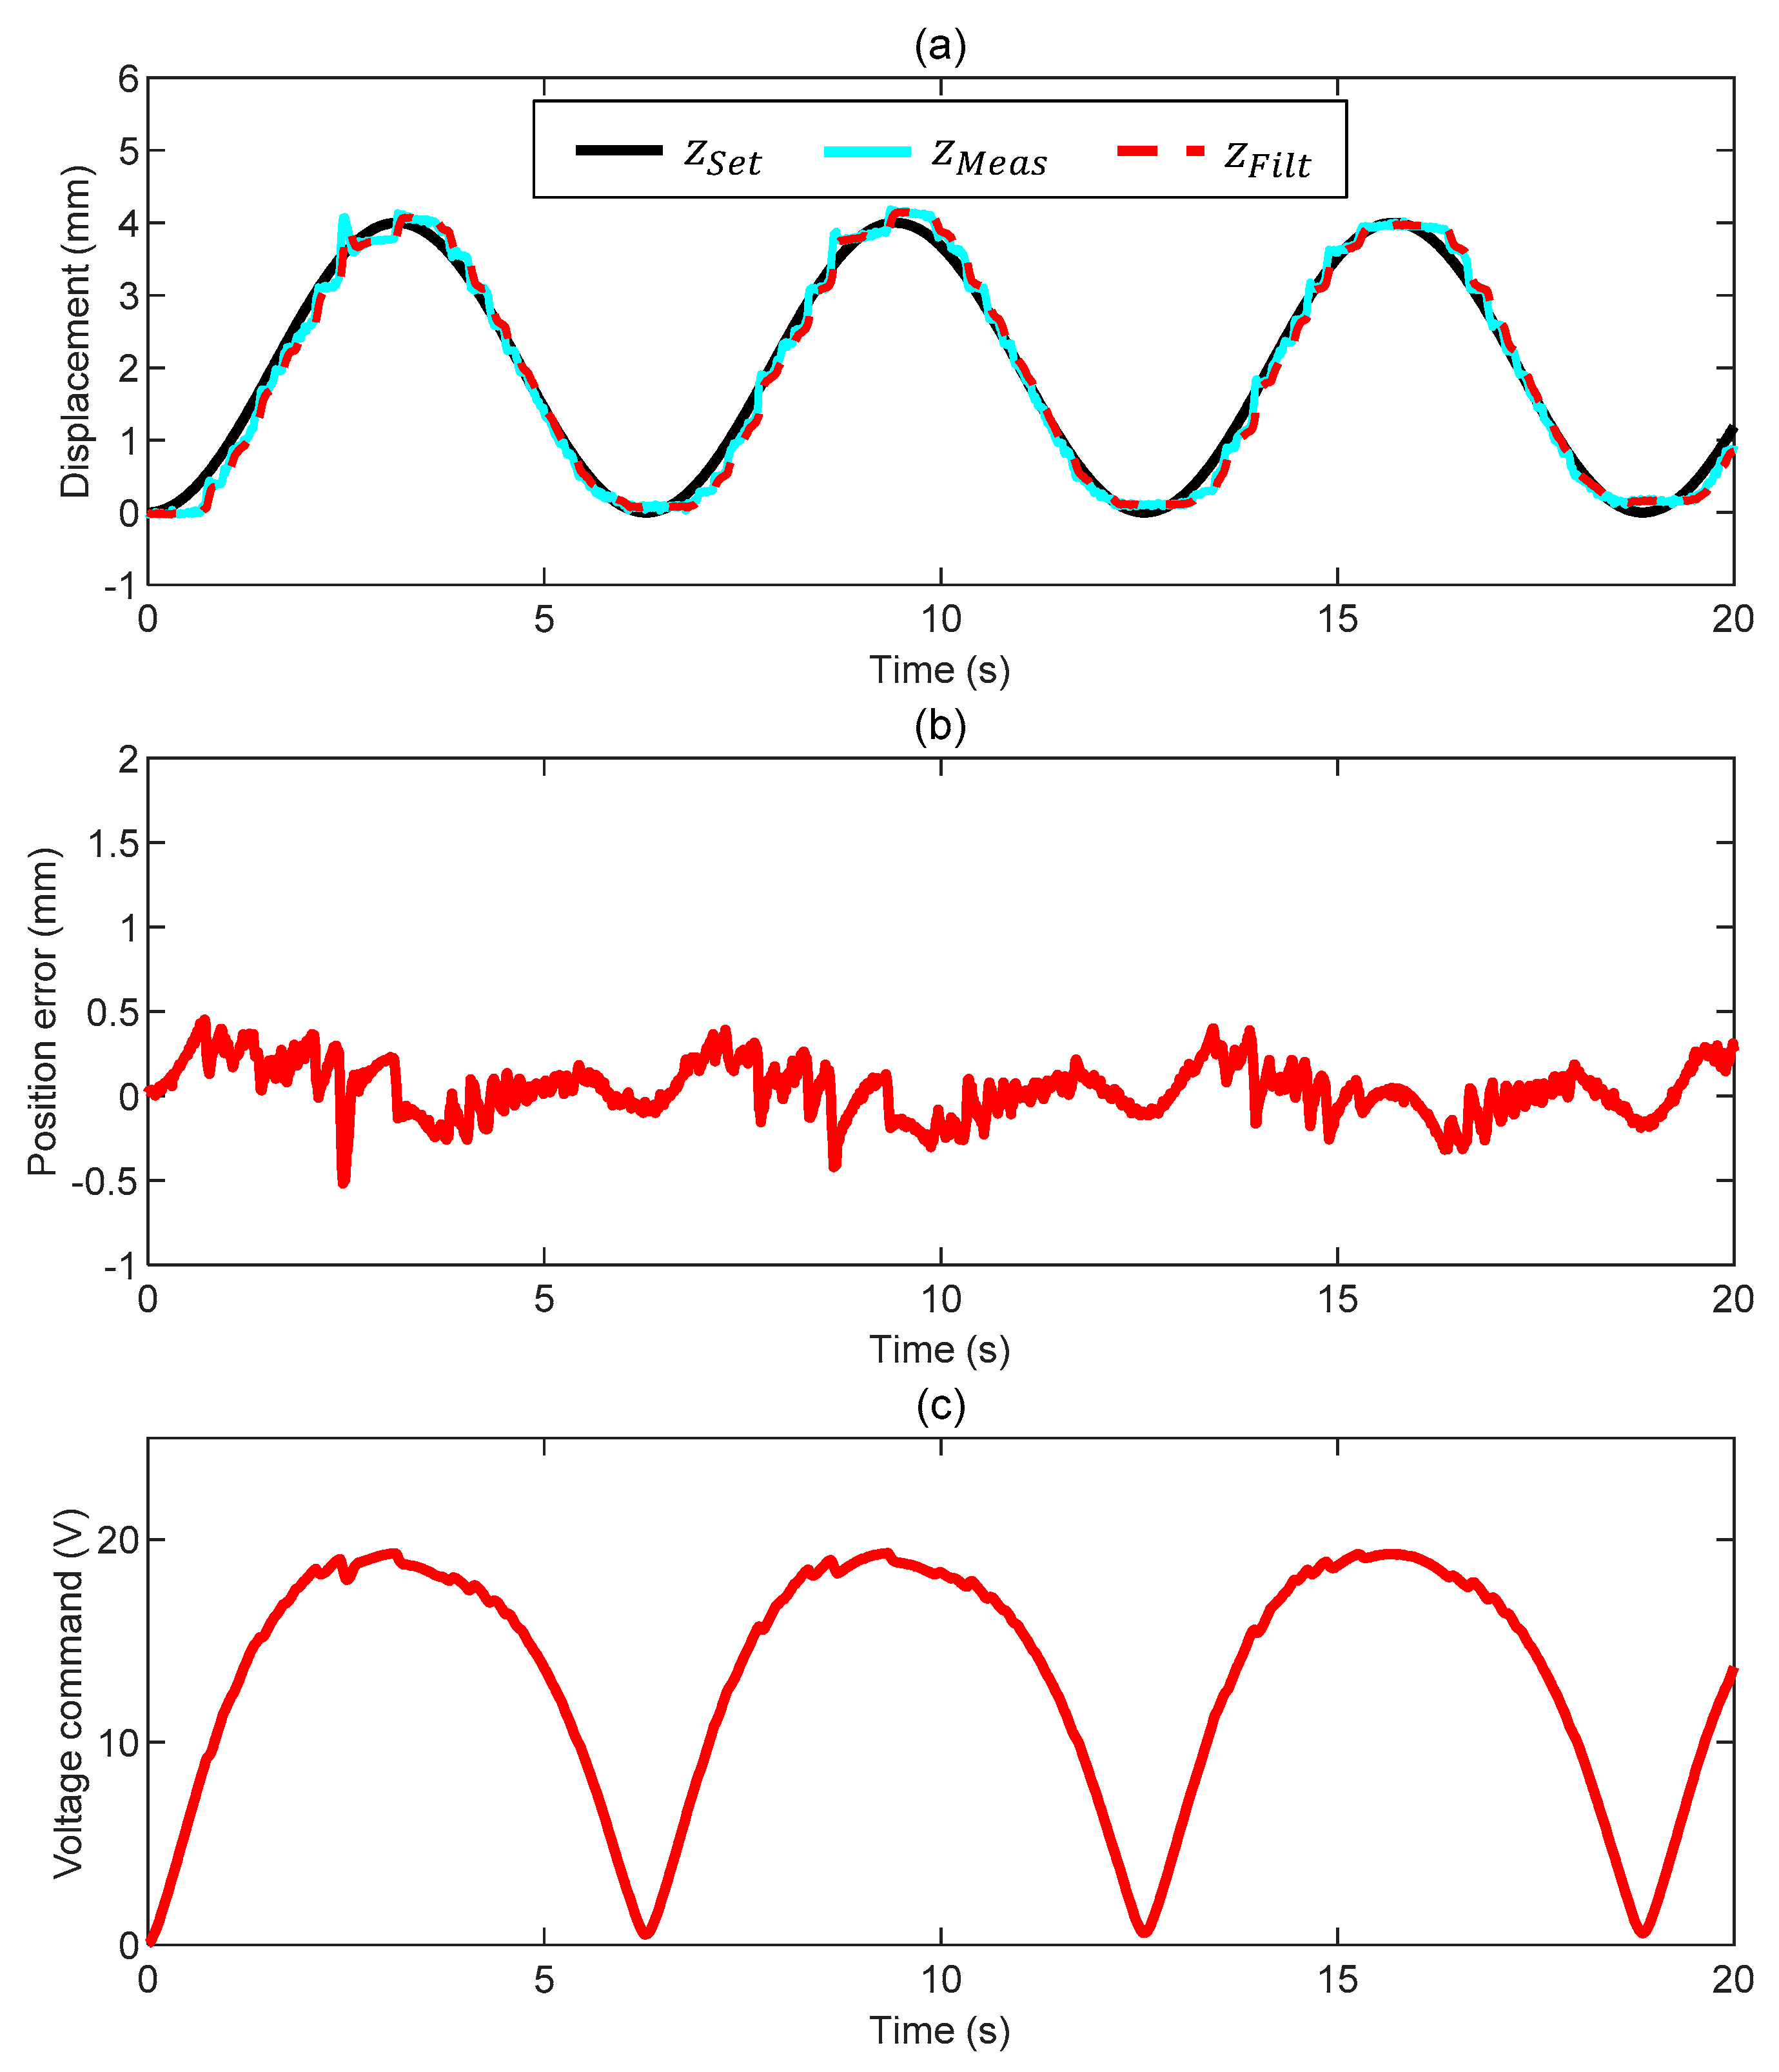
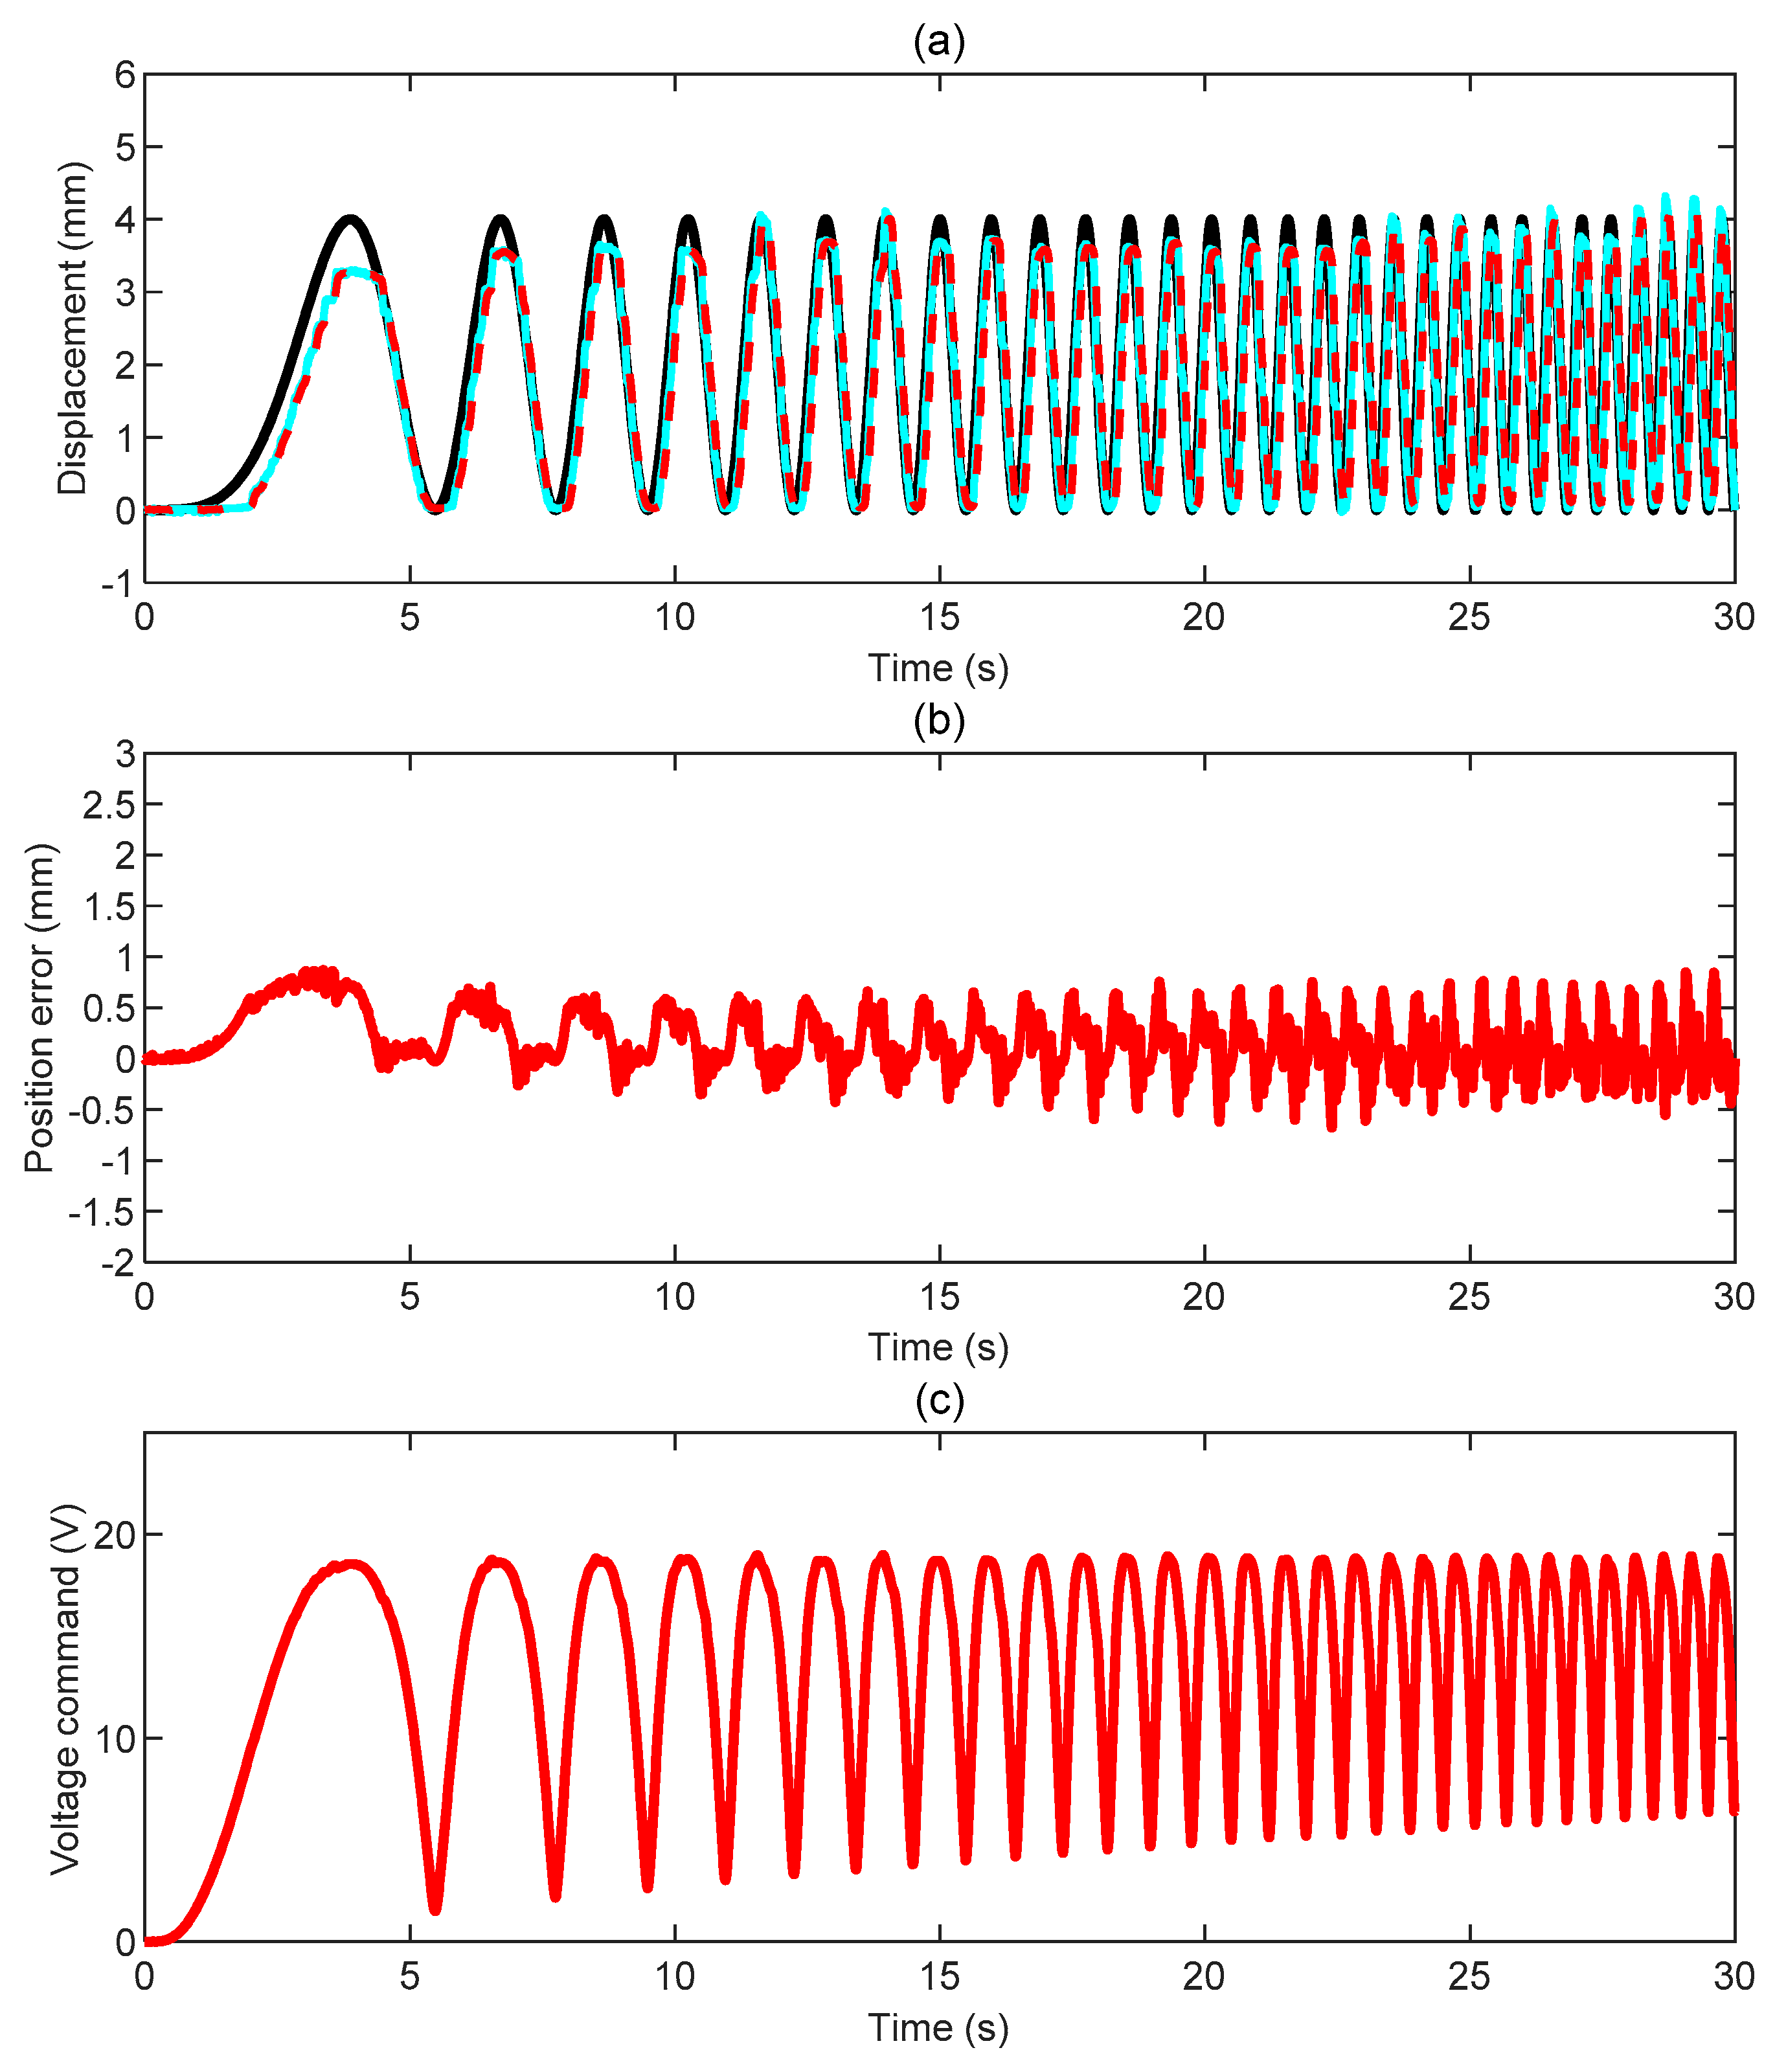
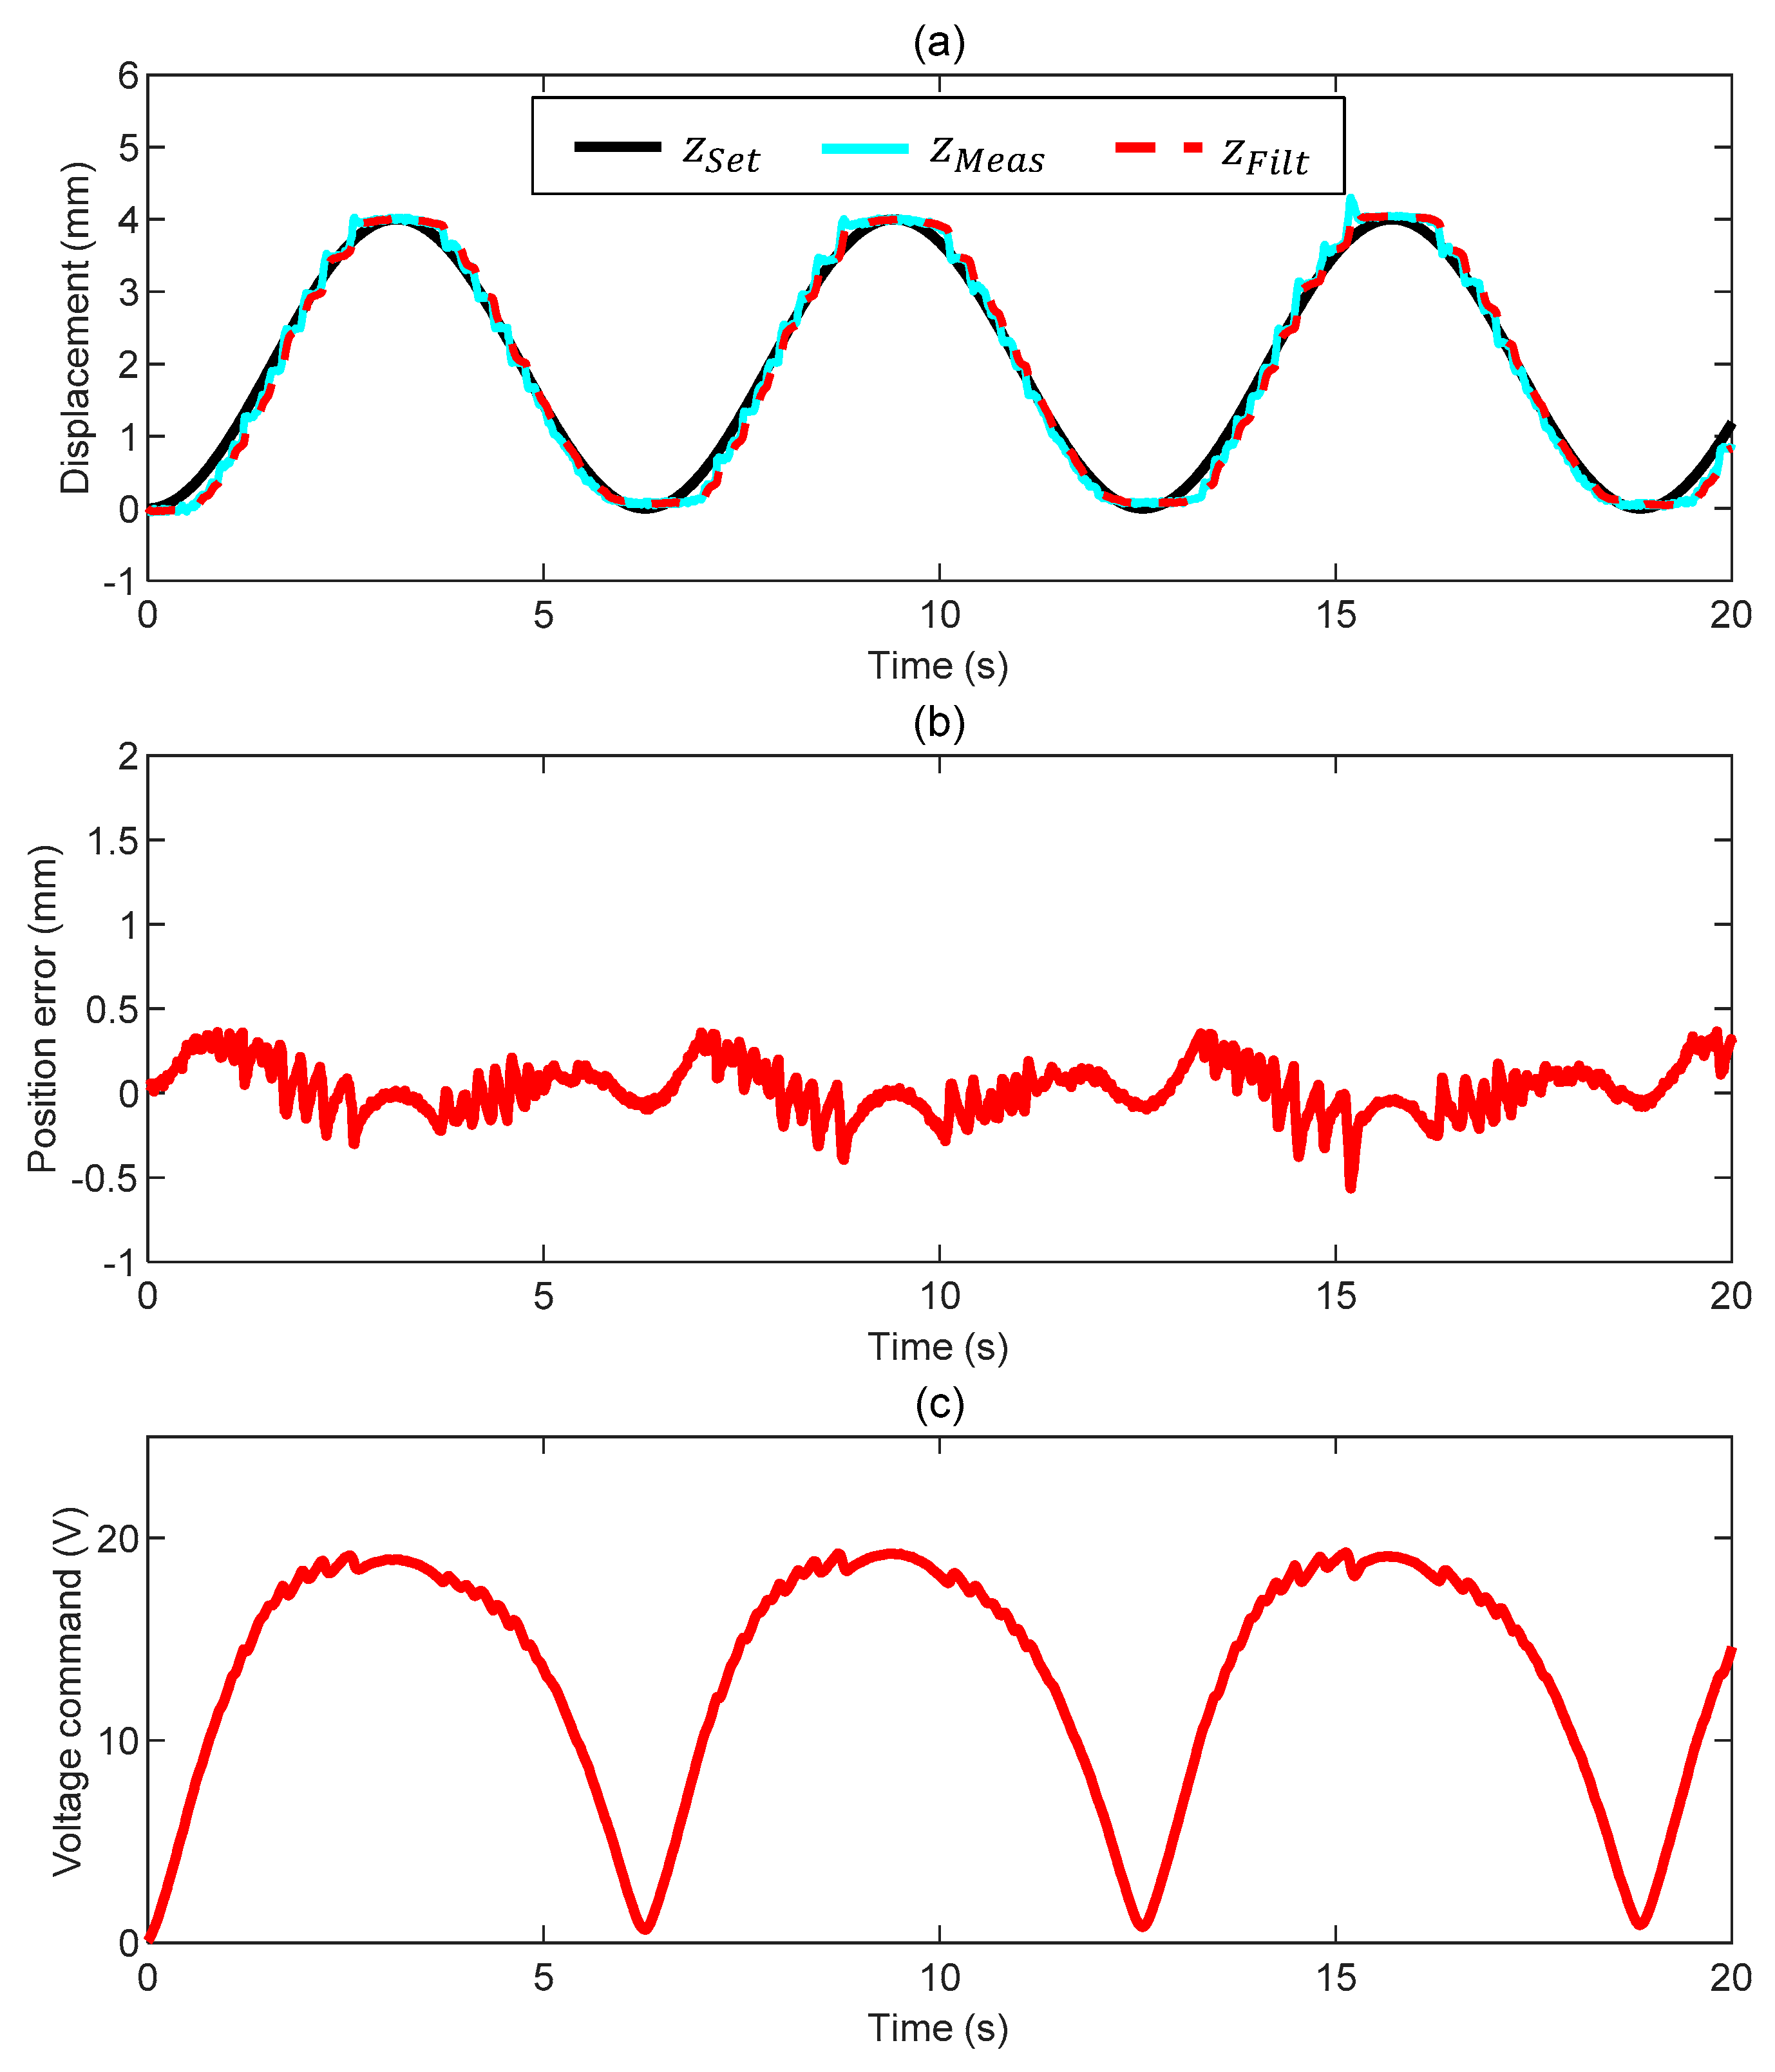
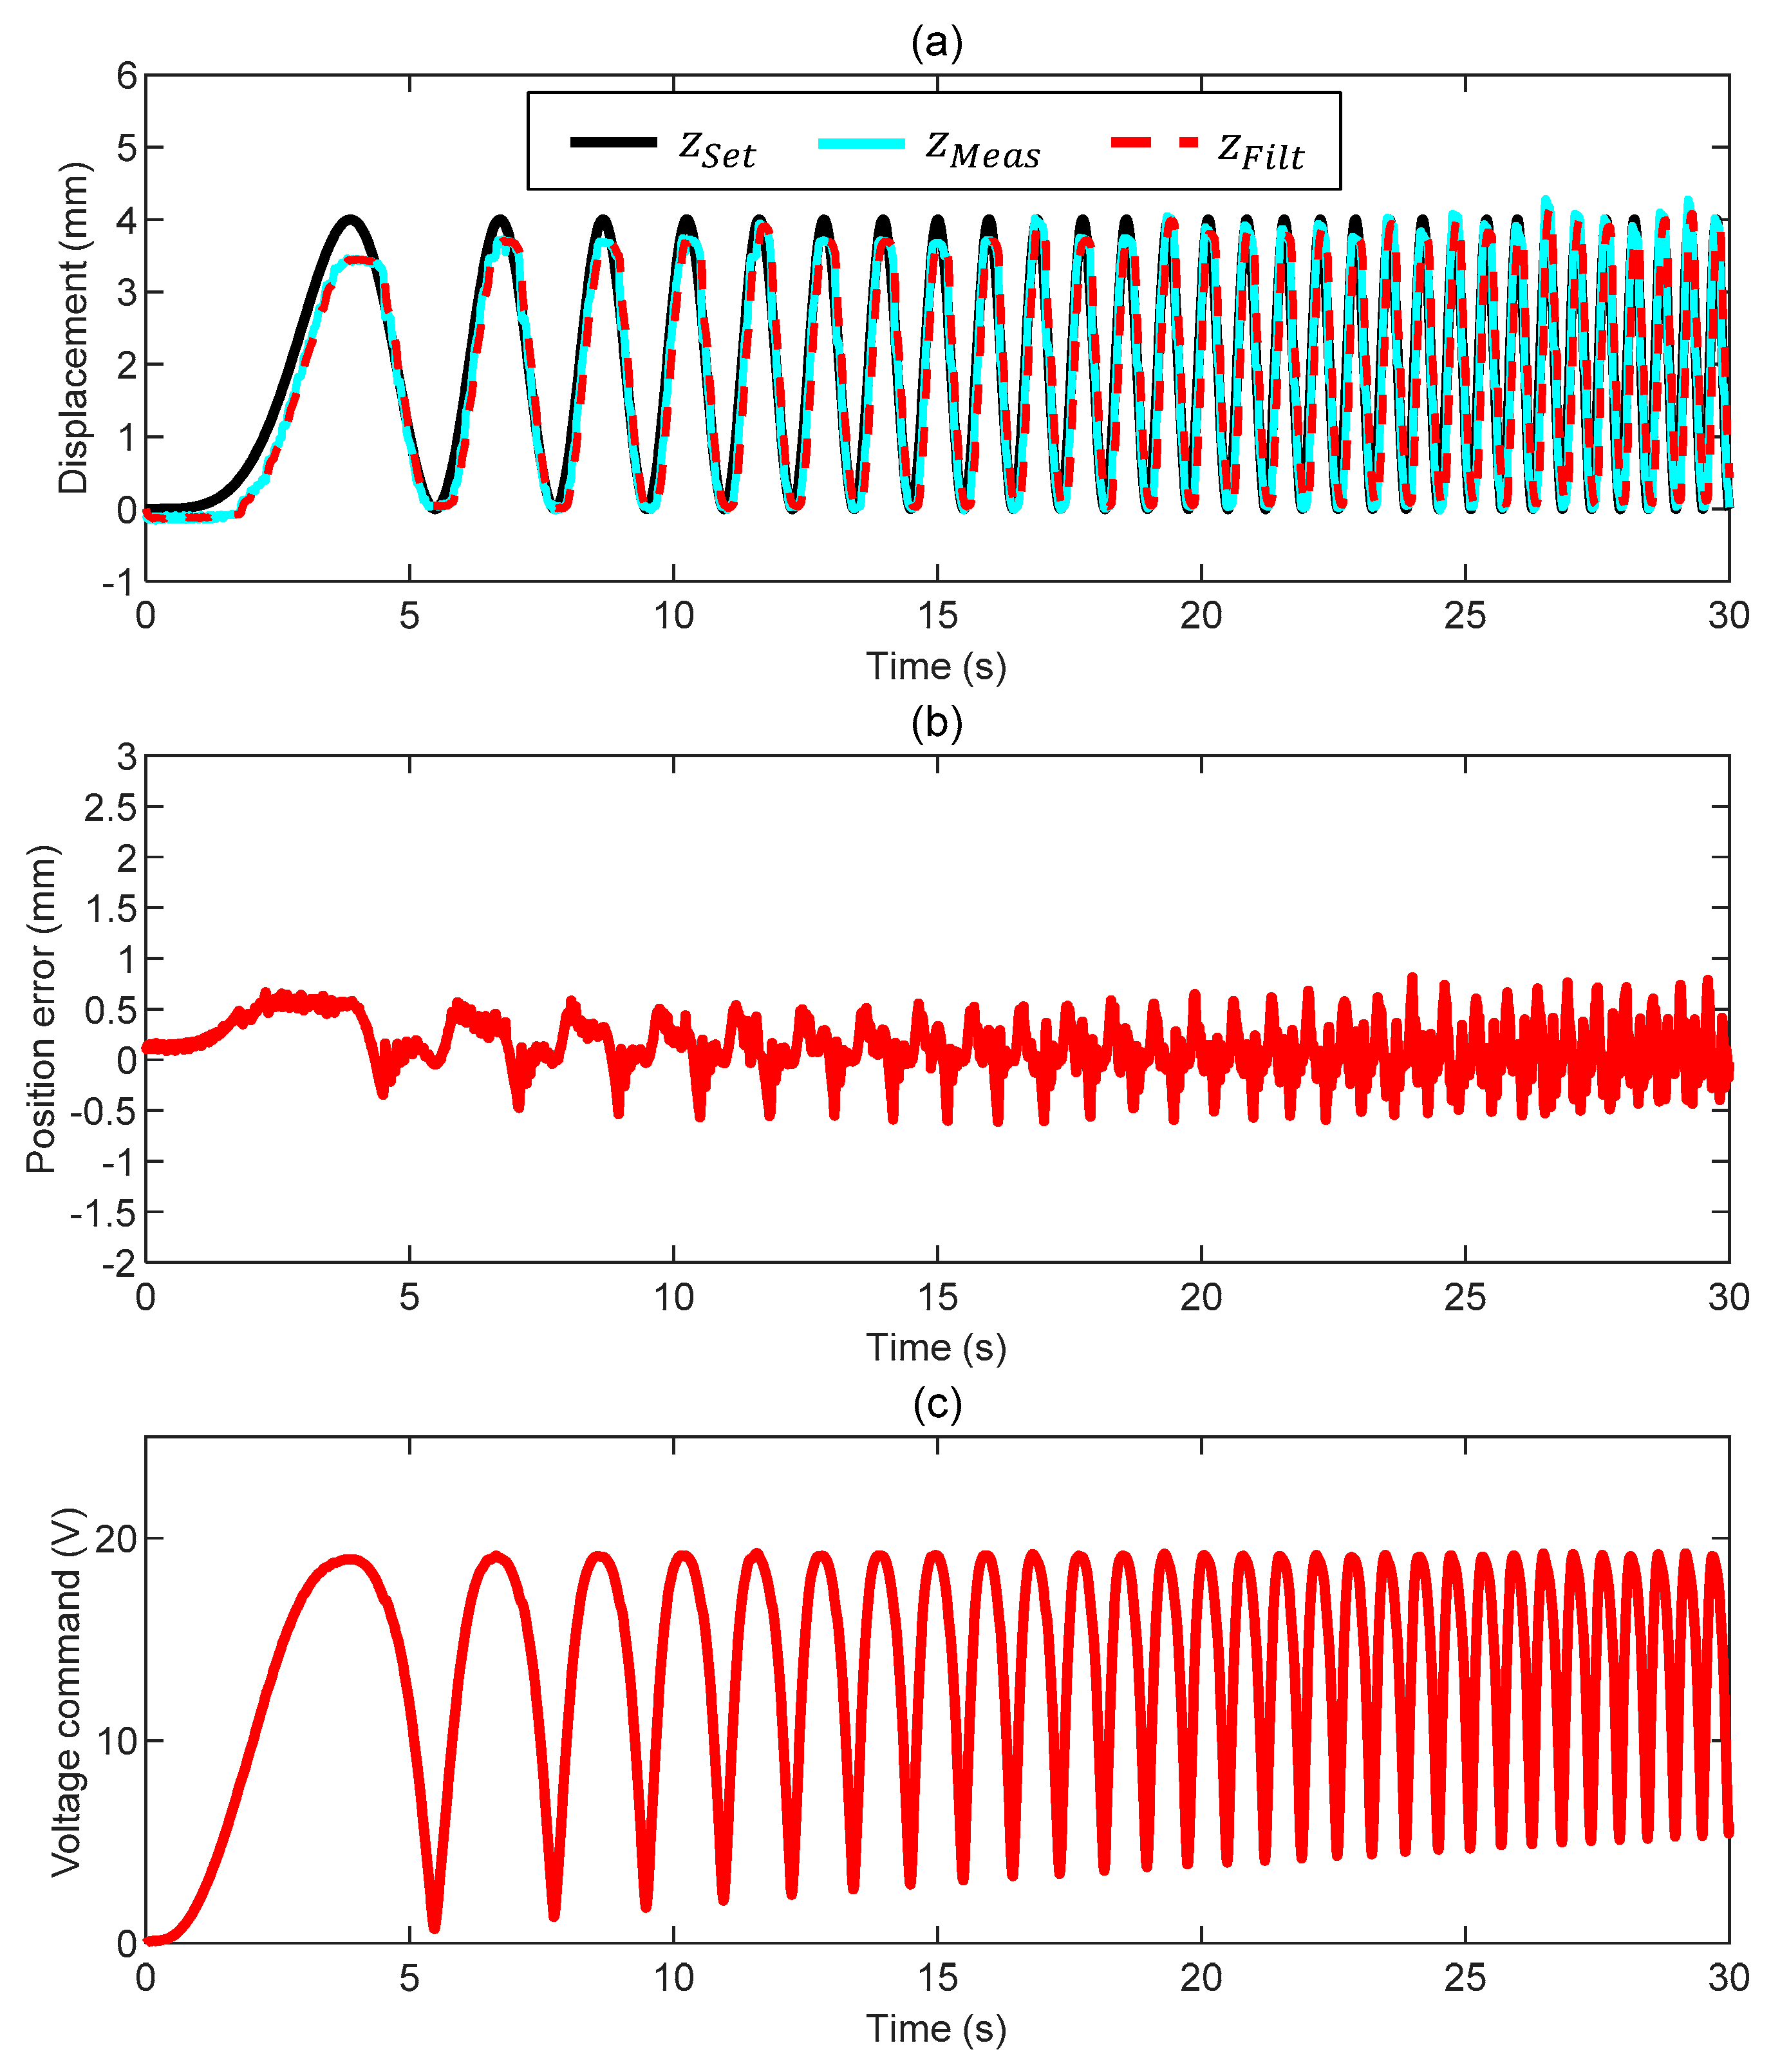
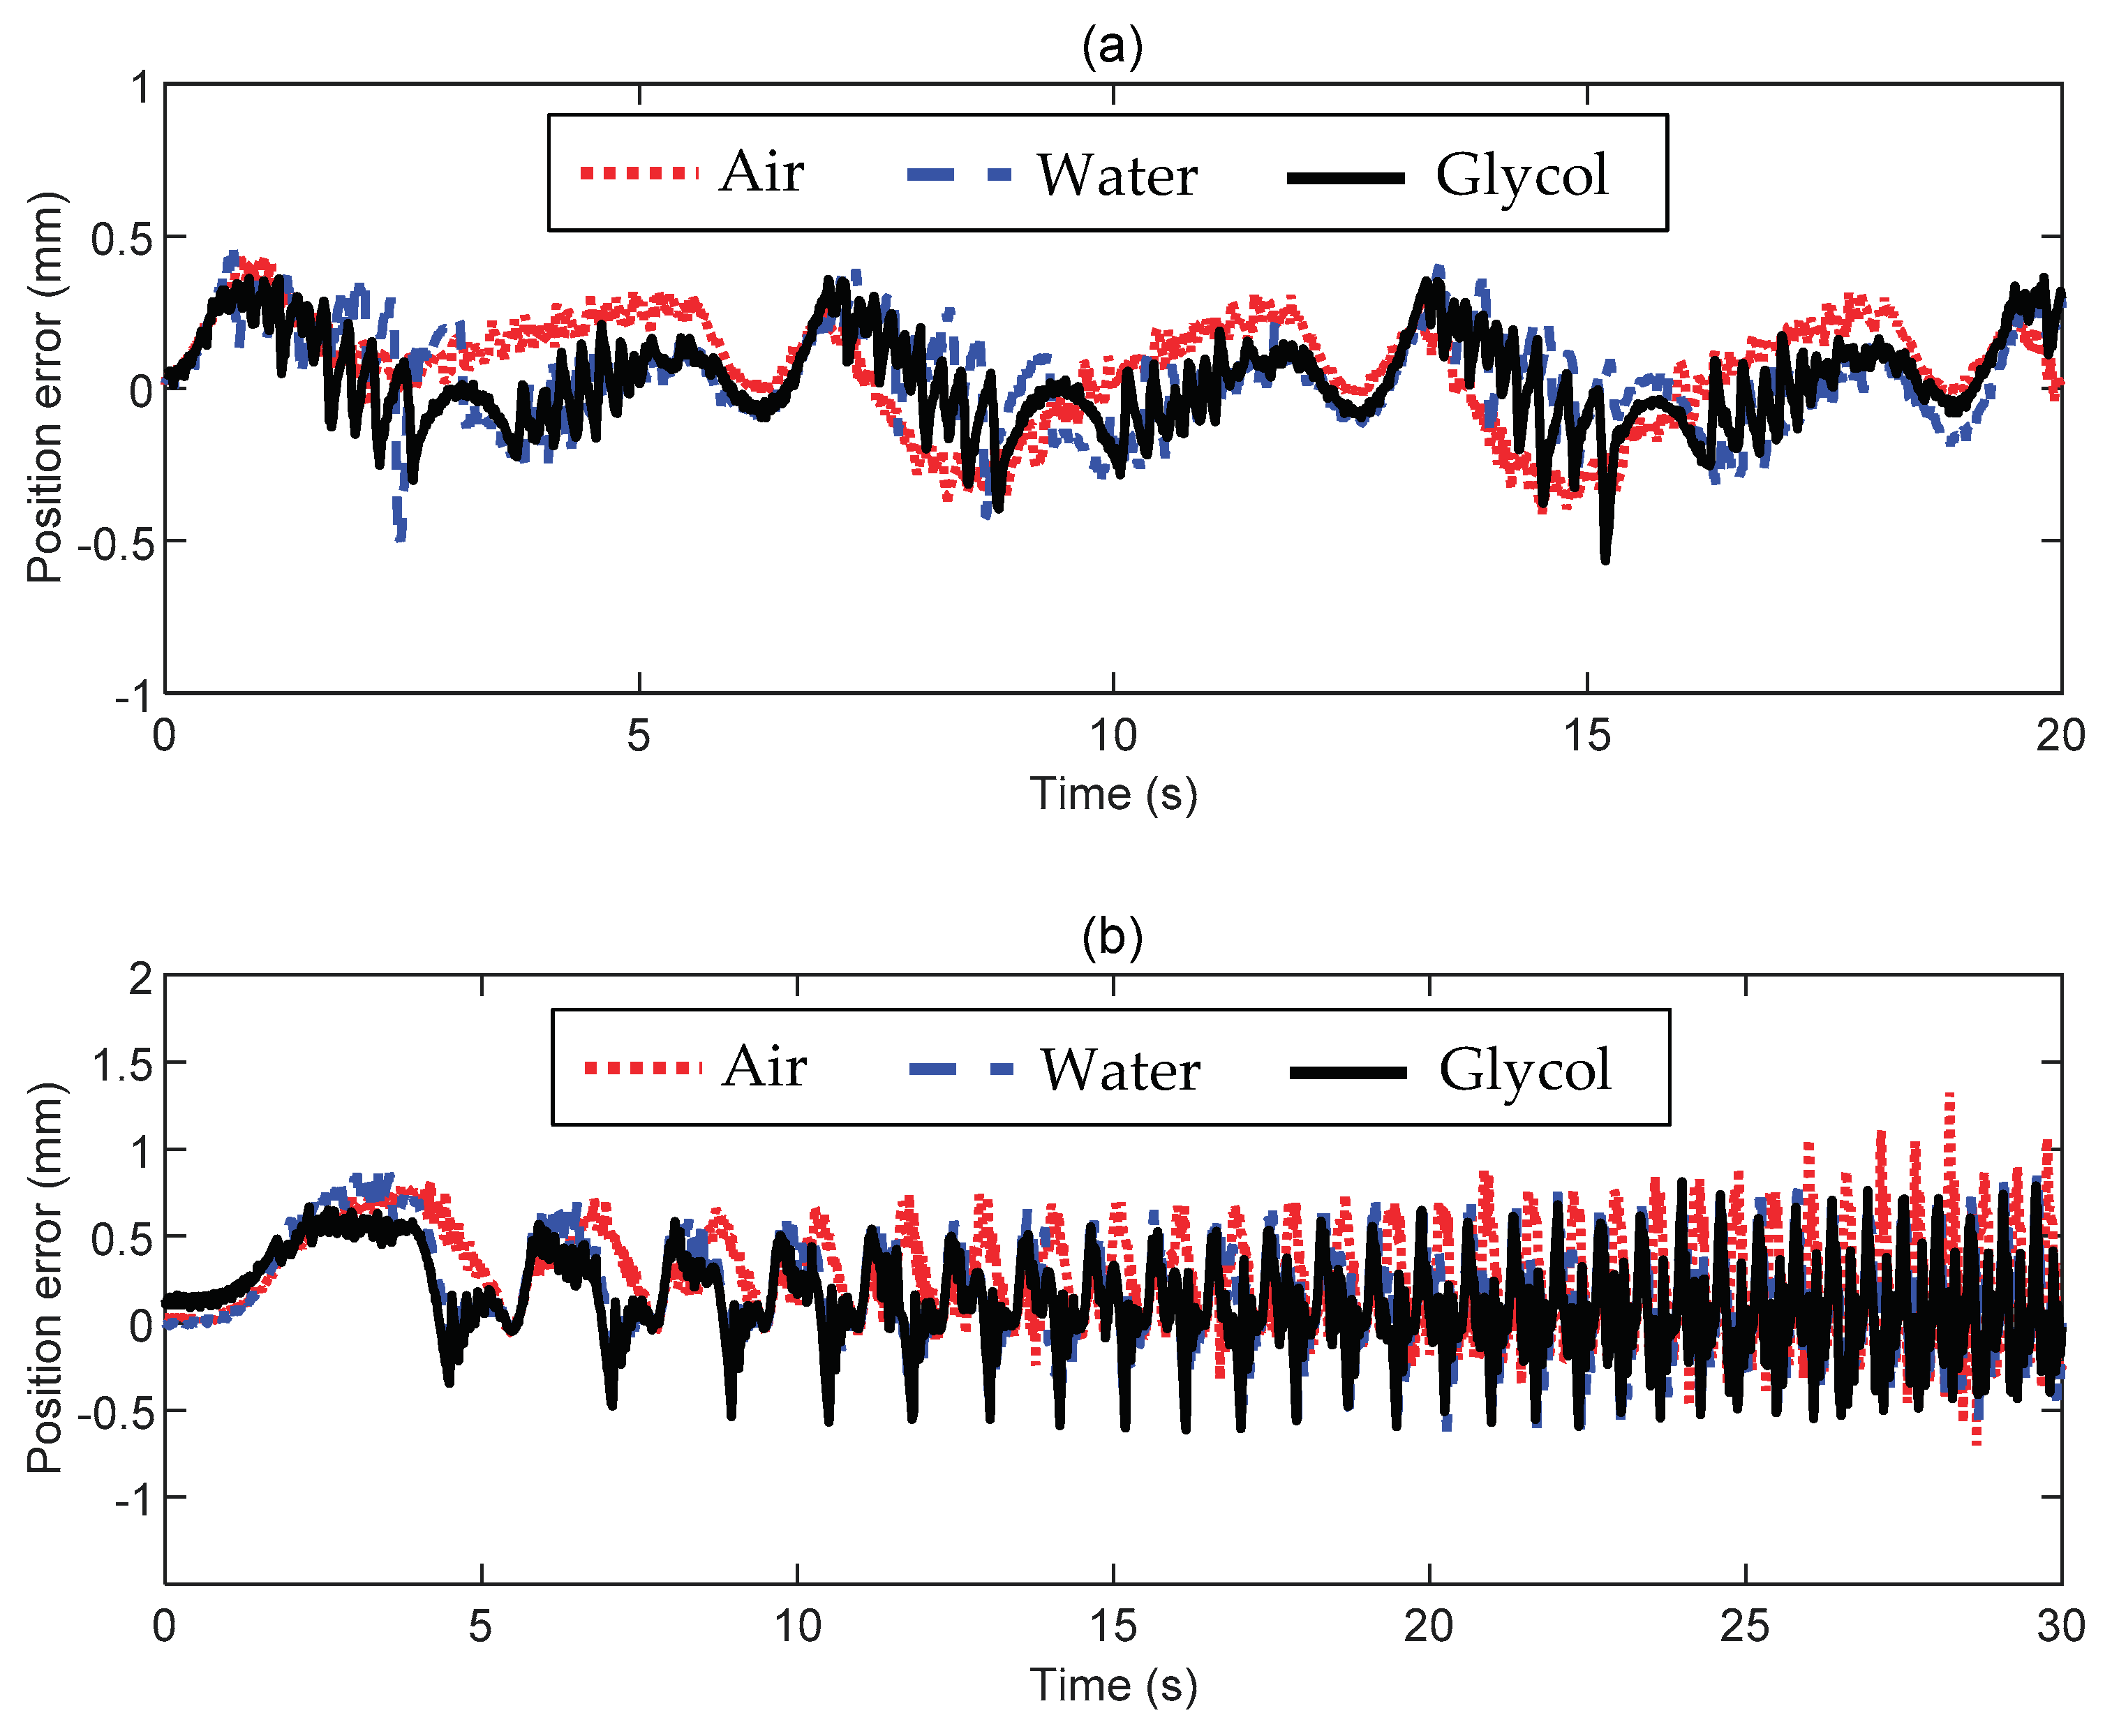
- We have performed closed-loop position tracking (1D vertical motion) with a 10 mm steel ball hanging to a low-stiffness spring and surrounded by diverse fluids (air, water, and glycol). Despite the different conditions, our set-up can consistently perform well when proper control settings are chosen. When commanded by a sinusoidal position with constant frequency, the tracking error stays within ±0.5 mm with a negligible phase delay.
Supplementary Materials
Author Contributions
Funding
Data Availability Statement
Conflicts of Interest
References
- Heya, A.; Hirata, K. Experimental Verification of Three-Degree-of-Freedom Electromagnetic Actuator for Image Stabilization. Sensors (Switzerland) 2020, 20. [Google Scholar] [CrossRef]
- Nelson, B.J.; Kaliakatsos, I.K.; Abbott, J.J. Microrobots for Minimally Invasive Medicine. Annu Rev Biomed Eng 2010, 12, 55–85. [Google Scholar] [CrossRef]
- Zhou, J.; Li, M.; Li, N.; Zhou, Y.; Wang, J.; Jiao, N. System Integration of Magnetic Medical Microrobots: From Design to Control. Front Robot AI 2023, 10. [Google Scholar] [CrossRef]
- Xu, T.; Yu, J.; Yan, X.; Choi, H.; Zhang, L. Magnetic Actuation Based Motion Control for Microrobots: An Overview. Micromachines (Basel) 2015, 6, 1346–1364. [Google Scholar] [CrossRef]
- Ebrahimi, N.; Bi, C.; Cappelleri, D.J.; Ciuti, G.; Conn, A.T.; Faivre, D.; Habibi, N.; Hošovský, A.; Iacovacci, V.; Khalil, I.S.M.; et al. Magnetic Actuation Methods in Bio/Soft Robotics. Adv Funct Mater 2021, 31. [Google Scholar] [CrossRef]
- Yang, Z.; Yang, H.; Cao, Y.; Cui, Y.; Zhang, L. Magnetically Actuated Continuum Medical Robots: A Review. Advanced Intelligent Systems 2023, 5, 2200416. [Google Scholar] [CrossRef]
- Yuan, S.; Wan, Y.; Song, S. RectMag3D: A Magnetic Actuation System for Steering Milli/Microrobots Based on Rectangular Electromagnetic Coils. Applied Sciences (Switzerland) 2020, 10. [Google Scholar] [CrossRef]
- Erin, O.; Raval, S.; Schwehr, T.J.; Pryor, W.; Barnoy, Y.; Bell, A.; Liu, X.; Mair, L.O.; Weinberg, I.N.; Krieger, A.; et al. Enhanced Accuracy in Magnetic Actuation: Closed-Loop Control of a Magnetic Agent With Low-Error Numerical Magnetic Model Estimation. IEEE Robot Autom Lett 2022, 7, 9429–9436. [Google Scholar] [CrossRef] [PubMed]
- Zarrouk, A.; Belharet, K.; Tahri, O. Vision-Based Magnetic Actuator Positioning for Wireless Control of Microrobots. Rob Auton Syst 2020, 124, 103366. [Google Scholar] [CrossRef]
- Nadour, H.; Bozorg Grayeli, A.; Poisson, G.; Belharet, K. CochleRob: Parallel-Serial Robot to Position a Magnetic Actuator around a Patient’s Head for Intracochlear Microrobot Navigation. Sensors 2023, 23. [Google Scholar] [CrossRef] [PubMed]
- Sun, H.; Liu, J.; Wang, Q. Magnetic Actuation Systems and Magnetic Robots for Gastrointestinal Examination and Treatment. Chinese Journal of Electrical Engineering 2023, 9, 3–28. [Google Scholar] [CrossRef]
- Hajjaji, A. El; Ouladsine, M. Modeling and Nonlinear Control of Magnetic Levitation Systems. IEEE Transactions on Industrial Electronics 2001, 48, 831–838. [Google Scholar] [CrossRef]
- Probst, R.; Lin, J.; Komaee, A.; Nacev, A.; Cummins, Z.; Shapiro, B. Planar Steering of a Single Ferrofluid Drop by Optimal Minimum Power Dynamic Feedback Control of Four Electromagnets at a Distance. J Magn Magn Mater 2011, 323, 885–896. [Google Scholar] [CrossRef]
- Callaghan, E.E.; Maslen, S.H.; L. R. Center The Magnetic Field of a Finite Solenoid; NASA, Washington, DC, USA, Tech. Note D-465, 1960.
- Engel-Herbert, R.; Hesjedal, T. Calculation of the Magnetic Stray Field of a Uniaxial Magnetic Domain. J Appl Phys 2005, 97. [Google Scholar] [CrossRef]
- Waindok, A.; Tomczuk, B.; Koteras, D. Modeling of Magnetic Field and Transients in a Novel Permanent Magnet Valve Actuator. Sensors (Switzerland) 2020, 20. [Google Scholar] [CrossRef]
- Waindok, A.; Tomczuk, B.; Koteras, D. Modeling of Magnetic Field and Transients in a Novel Permanent Magnet Valve Actuator. Sensors (Switzerland) 2020, 20. [Google Scholar] [CrossRef] [PubMed]
- Yang, Z.-J.; Tateishi, M. Adaptive Robust Nonlinear Control of a Magnetic Levitation System. Automatica 2001, 37, 1125–1131. [Google Scholar] [CrossRef]
- Le, T.-A.; Zhang, X.; Hoshiar, A.K.; Yoon, J. Real-Time Two-Dimensional Magnetic Particle Imaging for Electromagnetic Navigation in Targeted Drug Delivery. Sensors 2017, 17, 2050. [Google Scholar] [CrossRef] [PubMed]
- Komaee, A.; Shapiro, B. Steering a Ferromagnetic Particle by Magnetic Feedback Control: Algorithm Design and Validation. In Proceedings of the American Control Conference Marriott Waterfront, Baltimore, MD, USA, 2010. [Google Scholar]
- Komaee, A.; Shapiro, B. Steering a Ferromagnetic Particle by Optimal Magnetic Feedback Control. IEEE Transactions on Control Systems Technology 2012, 20, 1011–1024. [Google Scholar] [CrossRef]
- Ghanbari, A.; Chang, P.H.; Nelson, B.J.; Choi, H. Electromagnetic Steering of a Magnetic Cylindrical Microrobot Using Optical Feedback Closed-Loop Control. Int J Optomechatronics 2014, 8, 129–145. [Google Scholar] [CrossRef]
- Alessandri, A.; Bagnerini, P.; Gaggero, M.; Mantelli, L.; Santamaria, V.; Traverso, A. Black-Box Modeling and Optimal Control of a Two-Phase Flow Using Level Set Methods. IEEE Transactions on Control Systems Technology 2022, 30, 520–534. [Google Scholar] [CrossRef]
- Padovani, D.; Cioncolini, A.; Alessandri, A. State Observers for Output Feedback Control of an Electromagnetic Levitation System. In Proceedings of the IEEE 18th International Conference on Advanced Motion Control, Kyoto, Japan, 2024. (in press). [Google Scholar]
- Bächle, T.; Hentzelt, S.; Graichen, K. Nonlinear Model Predictive Control of a Magnetic Levitation System. Control Eng Pract 2013, 21, 1250–1258. [Google Scholar] [CrossRef]
- Wang, J.; Rong, J.; Yang, J. Adaptive Fixed-Time Position Precision Control for Magnetic Levitation Systems. IEEE Transactions on Automation Science and Engineering 2023, 20, 458–469. [Google Scholar] [CrossRef]
- Hu, W.; Lum, G.Z.; Mastrangeli, M.; Sitti, M. Small-Scale Soft-Bodied Robot with Multimodal Locomotion. Nature 2018, 554, 81–85. [Google Scholar] [CrossRef] [PubMed]
- Son, D.; Cagri Ugurlu, M.; Sitti, M. Permanent Magnet Array-Driven Navigation of Wireless Millirobots inside Soft Tissues. Sci. Adv 2021, 7. [Google Scholar] [CrossRef] [PubMed]
- Jeong, M.; Tan, X.; Fischer, F.; Qiu, T. A Magnetic Millirobot Walks on Slippery Biological Surfaces for Targeted Cargo Delivery. Micromachines (Basel) 2023, 14. [Google Scholar] [CrossRef]
- Al Khatib, E.; Razzaghi, P.; Hurmuzlu, Y. Feedback Control of Millimeter Scale Pivot Walkers Using Magnetic Actuation. Rob Auton Syst 2023, 168. [Google Scholar] [CrossRef]
- Logitech C1000e Webcam with 4K Ultra HD Video & HDR. Available online: https://www.logitech.com/zh-cn/products/webcams/brio-4k-hdr-webcam.960-001107.html (accessed on 31 January 2024).
- Fisher, R.B. Subpixel Estimation. In Computer Vision: A Reference Guide; Ikeuchi, K., Ed.; Springer International Publishing: Cham, 2021; pp. 1217–1220 ISBN 978-3-030-63416-2. [Google Scholar]
- Morley, S.K.; Brito, T. V.; Welling, D.T. Measures of Model Performance Based On the Log Accuracy Ratio. Space Weather 2018, 16, 69–88. [Google Scholar] [CrossRef]

| Test | (-) | (-) | (V/mm) | (V/mm/s) | (Hz) |
|---|---|---|---|---|---|
| Air (constant-frequency) | 1 | 0 | 2.2 | 1.8 | 7 |
| Air (variable-frequency) | 1 | 0.05/30 | 1.5 | 1.05 | 15 |
| Water (constant-frequency) | 1 | 0 | 1.8 | 1.2 | 25 |
| Water (variable-frequency) | 1 | 0.005 | 1.05 | 0.7 | 30 |
| Glycol (constant-frequency) | 1 | 0 | 3 | 2.5 | 25 |
| Glycol (variable-frequency) | 1 | 0.1/30 | 0.8 | 0.7 | 30 |
| Test | RMS value | Test | RMS value | |
|---|---|---|---|---|
| Air (constant-frequency) | 0.1884 | Air (variable-frequency) | 0.3857 | |
| Water (constant-frequency) | 0.1612 | Water (variable-frequency) | 0.3471 | |
| Glycol (constant-frequency) | 0.1491 | Glycol (variable-frequency) | 0.2896 |
Disclaimer/Publisher’s Note: The statements, opinions and data contained in all publications are solely those of the individual author(s) and contributor(s) and not of MDPI and/or the editor(s). MDPI and/or the editor(s) disclaim responsibility for any injury to people or property resulting from any ideas, methods, instructions or products referred to in the content. |
© 2024 by the authors. Licensee MDPI, Basel, Switzerland. This article is an open access article distributed under the terms and conditions of the Creative Commons Attribution (CC BY) license (http://creativecommons.org/licenses/by/4.0/).


