
Submitted:
21 February 2024
Posted:
23 February 2024
You are already at the latest version
Abstract
Background: Annual influenza epidemics are a serious public health problem, causing particularly severe morbidity and mortality in high-risk groups. The study aimed to understand Poles' attitudes and beliefs towards influenza vaccinations in the flu season of 2022–2023, analyze preferences and unmet needs regarding influenza vaccinations, and examine the perception and acceptance of the influenza vaccine among individuals at risk of flu complications.
Methods: A cross-sectional survey-based study was carried out on a sample of 1446 respondents.
The Google Forms questionnaire was created and disseminated electronically using social media and e-mail. The pre-test was performed at the beginning of the project.
Results: The majority of respondents (71%) could identify "high-risk groups" recommended for influenza vaccination. Furthermore, it was observed that individuals aged 21 to 59 demonstrated a higher level of knowledge in this regard compared to those below 20 and above 65 years old, and individuals with higher and medium education levels were much better at identifying risk groups for influenza virus infection. The majority of respondents (52.01%) reported receiving influenza vaccination at some point in the past, with 32.12% receiving it in the 2022–2023 flu season and 41.09% in the 2021–2022 season. The majority of respondents declaring acceptance of the vaccine for the 2022-2023 season were in the high-risk group. Only 17.28% of respondents declared receiving both influenza and SARS-CoV-2 vaccines in the 2022-2023 season, with the vast majority being respondents from the "high-risk group" (p
Keywords:
vaccines
; influenza
; high-risk groups
; attitudes
; practice
1. Introduction
Annual influenza epidemics are a serious public health problem, causing particularly severe morbidity and mortality in high-risk groups. Children are among the high-risk groups, especially those under 2 years of age, as well as persons over 65 and patients with underlying medical conditions that may make them more susceptible to complications from the flu [1,2]. The World Health Organization and European Centre for Disease Prevention and Control (ECDC) recommend annual influenza vaccinations for selected groups of patients, especially for pregnant women, children aged between 6 months and 5 years, and older patients, specifically those above 65 years of age. In the patient group with a high risk of flu-related complications, individuals with chronic diseases, as well as healthcare workers, are also included [3,4]. The recommendations are analogous to those of the scientific community [5,6,7]. Regardless of recommendations, influenza vaccination coverage varies depending on the country [3,4]. Studies indicate that the level of flu cases and influenza coverage in the European regions of the WHO during the 2021-2022 season was relatively high and also varied by country [8]. Currently, influenza vaccination rates are below optimal levels, with only a few developed countries reaching the WHO/European Council target of 75% vaccination coverage in persons aged 65 years and above [9].
The vaccination coverage rate in other developed countries is estimated to be at an average level of around 70%. Reports from Poland suggest that the attitude of Poles towards influenza vaccinations does not align with the actual vaccination coverage, as despite a positive opinion regarding the effectiveness and importance of vaccinations, the percentage of vaccinated individuals remains low [10]. The vaccination coverage rate in other developed countries is estimated to be at an average level of around 70%. Reports from Poland suggest that the attitude of Poles towards influenza vaccinations does not align with the actual vaccination coverage, as despite a positive opinion regarding the effectiveness and importance of vaccinations, the percentage of vaccinated individuals remains low[11].
Poland is a country with one of the lowest influenza vaccination coverage rates among the EU member states [4]. In Poland, influenza vaccination is voluntary. Public health authorities largely align with those guidelines specified by the WHO and ECDC. An additional expanded group in Polish recommendations includes selected professional categories. In addition to healthcare workers, vaccination is recommended for uniformed services personnel, trade workers, transportation sector workers, teachers, social workers, and medical students [12].
According to data published by the Polish Chief Sanitary Inspectorate, the percentage of people vaccinated against the flu during the 2019/2020 flu season was 4.12%, while in the previous season (2018/2019) it was 3.9%. On the other hand, influenza vaccination coverage among people aged 65+ increased over the decade from 12.5% to 22.6%. The low level of vaccination coverage thus indicates a low level of public awareness of the dangers of not being vaccinated. The situation is even more serious as we know that the world is still struggling with the current SARS-CoV-2 virus, which may result in additional health burdens. The awareness of the role of vaccinations in ensuring individual and population health safety plays a significant role in this regard.
The study aimed to understand Poles’ attitudes and practices towards influenza vaccinations in the flu season of 2022–2023, analyze preferences and unmet needs regarding influenza vaccinations, and examine the perception and acceptance of the influenza vaccine among individuals at risk of flu complications. The results of this study may be helpful in the development of future educational programs that will contribute to increasing public awareness and thus increasing the percentage of people vaccinated against the influenza virus in the coming years.
2. Materials and Methods
A prospective, cross-sectional web-based survey design was adopted. The study horizon was from 1 Jul 2022 to 31 Jul 2023. The survey was performed using the Computer-Assisted Web Interview (CAWI) method. The Google Forms questionnaire was created and disseminated electronically using social media. Questionnaires were also distributed electronically (by e-mail) throughout the country. A pre-test procedure on a representative sample of 200 subjects was used. After the procedure, if necessary, the questions could be modified. However, the pre-test results were included in the post-test because the pre-test showed no need to modify the study tool.
The questionnaire (Supplement materials) comprised 27 questions divided into four categories: Demographic data (age, sex, education, place of living); Medical anamneses (chronic illnesses, health status); COVID-19-related and Influenza anamneses ( number of vaccine doses, previous infection, side effects).; Correlation between vaccination on Influenza and COVID-19 and attitude on general Influenza vaccination. Most of the questions involved multiple variables, and the number of questions visible to respondents depended on their answers, as some (but not all) responses led to additional questions.
The survey response rate was 56%. Out of 1446 completed questionnaires, 810 respondents were included for further analysis. 636 respondents were excluded for further analysis based on exclusion criteria (Figure 1). A prespecified high-risk subgroup included respondents who met at least one of the following criteria: ≥ 65 years of age, pregnancy, residing in a long-term care facility, Indigenous origin, or a high-risk condition as defined by the Centers for Disease Control and Prevention (CDCP) (i.e., hypertension, diabetes, or other metabolic diseases, asthma, other chronic lung diseases, heart diseases, body mass index [BMI] above 40 kg/m2, anemia, immune disorders, cancer, or other conditions negatively affecting respiratory function and/or increasing the risk of aspiration).
Statistical analysis was performed using STATISTICA PL 10.0 (StatSoft). The data distribution pattern was not normal (unlike the Gaussian function). The analysis of the Test for Proportions determined significant differences between % of group results.
3. Results
The study involved 1446 respondents. After considering the previously discussed inclusion criteria, responses from 810 participants were included for further analysis (Figure 1). The study group comprised 467 women and 343 men aged 18 to 87 years. The average age was estimated at 38.32 years (Table 1). Individuals defined as belonging to the “high-risk group” with a medical background constituted 38.23% of the study population (Table 1). The entire high-risk cohort accounted for 58.23% of the study population, including individuals aged 65 and older, pregnant women, and those with a high medical risk. The majority of respondents (71%) could identify “high-risk groups” recommended for influenza vaccination, with a significant majority being respondents defined as patients in the “high-risk group” (77.83%) (p<0.0001) (Table 2). Furthermore, it was observed that individuals aged 21 to 59 demonstrated a higher level of knowledge in this regard compared to those below 20 and above 65 years old (Table 2). Additionally, education level was a differentiating factor in knowledge about risk groups, as individuals with higher and medium education levels were much better at identifying risk groups for influenza virus infection. It was also statistically significant, and the strength of significance varied depending on the represented age group (Table 2).
Only 36% of respondents declared being diagnosed with influenza virus infection in the 2022-2023 season, with a significant majority being respondents from the “high-risk group” (p<0.0001), individuals above 65 years old (p<0.05), and those with higher education (p<0.05) (Table 2).
The majority of respondents (52.01%) reported receiving influenza vaccination at some point in the past, with 32.12% receiving it in the 2022–2023 flu season and 41.09% in the 2021–2022 season.
The majority of respondents declaring acceptance of the vaccine for the 2022-2023 season were in the high-risk group, and it was also observed that individuals above 65 years of age were more likely to undergo influenza vaccination. Interestingly, no statistically significant differences were observed in the observed results based on the respondent’s level of education (Table 2).
Only 28.08% of them experienced adverse events (AE), with 65.28% having mild AE, 31.22% having moderate AE, and one patient experiencing severe AE (Table 2).
Only 17.28% of respondents declared receiving both influenza and SARS-CoV-2 vaccines in the 2022-2023 season, with the vast majority being respondents from the “high-risk group” (p<0.0001) (Table 2). Most of them received three doses of the SARS-CoV-2 vaccine. These observations were independent of age or education level (p≥0.05). Furthermore, 67.09% of respondents believed that the flu vaccine they received alleviates the symptoms of a SARS-CoV-2 infection, with a significant majority of those agreeing to be from the “high-risk group” (p=0.0087), and these observations were age-dependent, coming from older individuals (Table 2).
Only 26.12% of respondents declared the intention to continue influenza vaccination in the future, while 27.88% were uncertain about taking such action (Table 2). Of those expressing the intention to get vaccinated against the influenza virus in future seasons, 46.79% were from the “high-risk group” (p=0.0087) (Table 2). These declarations were correlated with age, with older respondents (above 41 years old) more willingly making such statements (p<0.05) (Table 2).
The main reason for respondents opting for influenza vaccination was the fact that they or their close ones belonged to the “high-risk group.” Additionally, individuals in the “high-risk group” declared that getting vaccinated is a matter of social responsibility and that it significantly influences their decision, as vaccinations alleviate the symptoms of other diseases, including viral ones (Figure 2). On the other hand, the primary reason for individuals outside the “high-risk group” to undergo vaccinations was the frequent occurrence of influenza in themselves or their close ones (Figure 2).
Among those expressing unwillingness to get vaccinated against influenza in future seasons, the majority were respondents outside the “high-risk group” (p=0.0057). These observations were also correlated with age and education level, with respondents aged 21-40 and 41-59, as well as those with lower education levels, more frequently reporting a lack of willingness to undergo vaccinations in the future (p<0.05) (Table 2).
The main reasons for respondents not wanting to undergo influenza vaccination were fear of adverse events and doubts about the effectiveness of vaccinations (Figure 3).
4. Discussion
In the WHO European Region, annual influenza epidemics typically occur in the fall and winter [13].
In Poland, to reduce financial barriers, refunds for influenza vaccine costs were introduced in 2018, including full reimbursement for selected groups from 2020 [14].
However, despite increased access to vaccinations, during the 2020/2021 flu season, only a negligible percentage of Poles were vaccinated against seasonal influenza [15]. Interestingly, more Poles (13.4%) declared their willingness to be vaccinated against the flu in the 2020/2021 season than the actual number of those vaccinated (6%). Such observations serve as evidence of existing disparities between the attitudes of Poles towards vaccinations and the practices they undertake.
We can also speculate that such a significant difference between the percentage of respondents declaring their intention to be vaccinated against the flu and the actual number of those vaccinated may not only stem from educational barriers but also financial or systemic ones. In addition to ensuring access to vaccines, the opportunity for vaccination near one’s home, and the elimination of financial barriers, health policy programs should focus on educating about the “patient path” and removing all kinds of restrictions. Studies indicate that the highest vaccination rates are observed among individuals aged 65 and above. However, during the epidemic season of 2019/2020 in Poland, vaccine uptake in this group was only 10.4%, significantly below the average coverage in EU member states (44%). This aligned with the results of our study, as only 18.45% of respondents declared ever receiving the vaccine. On the other hand, vaccine acceptance for the season 2022-2023 was declared by 32.12%. Similar observations were made by authors of other studies [16], which indicated that 39% of all adults, 27% of adults aged 18–64 without chronic diseases, 38% in the age group of 18–64 with chronic diseases, and 71% of adults aged 65 and above were vaccinated against the flu.
The findings of our study also suggest certain relationships, such as the presented level of knowledge, attitudes toward vaccination, and vaccination practices. In our study, a relatively high level of knowledge was observed regarding the identification of factors and risk groups for influenza, translating into a proactive approach to vaccination. Respondents who could identify risk groups tended to express a greater willingness to undergo vaccination. This was particularly evident among older individuals who belong to a high-risk group. The reports contrast with observations from other authors [17,18,19], where it was assessed that although the majority of adults under the age of 65 at high risk were familiar with the recommended guidelines for flu vaccination, only 35.8% (95% CI, 32.1–39.5%) were aware of their high-risk status. In our study, it was additionally observed that qualification for the “high-risk group” influences respondents’ attitudes towards getting protective vaccinations, as individuals above 65 years old in the high-risk group had a more positive attitude towards getting flu vaccinations compared to respondents in the same age range who were not at risk. Furthermore, 33% of respondents in the high-risk group and 30% outside this group believed that flu vaccination is important for individuals at risk. Similar proportions are observed when analyzing the motivations for respondents not getting vaccinated against the flu, with 36% and 35% expressing concerns about adverse events (AE), respectively, among patients at risk and those not at risk. This forms the basis for considering the development of awareness programs for society regarding the safety profile of available vaccines, as well as the significant advantages of vaccination [20].
The vaccination rates reported in this study can be considered an assessment of the knowledge and perceptions of respondents regarding influenza vaccination in Poland. This issue has also been addressed by authors in other studies [21,22,23]. The fact that only 32.12% of respondents received the flu vaccine in the current season, compared to 41.09% in the previous season, suggests that many Poles may not be aware of the benefits of flu vaccination. It is also concerning that as many as 23% of at-risk respondents did not get vaccinated against the flu due to such a trivial reason as lack of time. Considering the high availability of vaccines, these results suggest that education of the society plays a crucial role in improving vaccination coverage rates, especially if these efforts are targeted at high-risk individuals. Among those declaring vaccine acceptance, older individuals (over 65 years old) were significantly predominant, aligning with the vaccination coverage goals of 70% according to WHO. Compared to adults under 65 years old (with or without chronic diseases), older individuals not only more frequently reported being vaccinated but also had a stronger belief in the importance of flu vaccination for high-risk groups. These results are corroborated by authors of another study [21,22].
It’s worth noting that although vaccination rates were relatively high among older individuals in our study, 34.12% of them did not know or were unsure if they were at risk of flu complications. Our study did not inquire about the types of vaccines respondents received in the 2022–2023 season, so it is unknown whether older participants in the study received the standard flu vaccine or an enhanced one specially designed for their age group. Overall, our results in both younger and older high-risk groups suggest the need for greater education and communication between healthcare decision-makers and the community to increase awareness of the importance of flu vaccination, especially among those at risk of complications. As for concurrent COVID-19 and flu vaccination in the 2022-2023 season, the vaccination rate was estimated at a very low level of 17.28%. This rate was significantly lower than in other studies [17].
Low co-administration rates were not associated with a lack of awareness, as most respondents were aware that both vaccines could be administered simultaneously. The majority of respondents also expressed interest in the concurrent administration of vaccines, especially those aged 65 and above. Such observations suggest an urgent need to develop educational programs to increase awareness among Poles about the benefits of receiving vaccines during the flu season and in the era of ongoing COVID-19 infections.
Because the study was designed as a survey, the presented results are subject to several limitations. The main constraint of this study is that it relies on the perception of respondents without the possibility of verifying the source of data. Another limitation of this study is its cross-sectional nature, meaning it cannot be used to establish causative relationships. The quality of data also depends heavily on the accurate reporting of information by respondents, which may be subject to memory errors.
5. Conclusions
The results of the presented study indicate a relatively high level of interest and overall acceptance of flu vaccinations among surveyed Poles in the 2022–2023 season. However, at the same time, observed vaccination coverage rates significantly deviated from the targets set by the WHO, especially among individuals aged 18–64 with chronic diseases. The primary concern of the unvaccinated individuals was the perceived lack of effectiveness of flu vaccines. Individuals above the age of 65 were considerably more willing to undergo flu vaccination; however, the actual practice did not fully align with the declarations in this group of respondents. Despite the majority of surveyed respondents being aware of the recommendations for flu vaccinations, especially for those at high risk of flu complications, most respondents under 65 with chronic diseases and nearly half of those above 65 did not consider themselves to meet the criteria for high risk. These results suggest the necessity of collaborative efforts in healthcare policy, social engagement, and education, particularly for individuals at risk of flu complications.
Author Contributions
Conceptualization, D.K., K.K., K.H., A.P; Methodology: D.K., K.H, A.P.; Software: K.K, D.K.; Formal analysis: D.K., E.N., A.K.S., A.P.; Investigation: D.K., A.K.S.; A.P., P.R.; Data curation: D.K., A.K.S, A.P., E.N., K.H., P.R, K.K; Writing—original draft: D.K.; Writing—review: D.K., K.K., A.P., A.K.S., P.R., E.N., K.H.; Editing, D.K.; Supervision: D.K., A.P., E.N.; Project administration: D.K., P.R., A.P. All authors have read and agreed to the published version of the manuscript.
Funding
This research received no external funding.
Institutional Review Board Statement
The study was approved by the Bioethics Committee at the Poznan University of Medical Sciences in Poznań, Poland. In the document (KB-90/23) there is a confirmation that the research project had no features of a medical experiment.
Informed Consent Statement
Informed consent was obtained from all subjects involved in the study.
Data Availability Statement
The datasets used and/or analyzed during the current study are available from the corresponding author upon reasonable request.
Conflicts of Interest
The authors declare no conflict of interest.
References
- Vaccines against Influenza WHO Position Paper – November 2012. Wkly Epidemiol Rec 2012, 87, 461–476.
- Mortality, Morbidity, and Hospitalisations Due to Influenza Lower Respiratory Tract Infections, 2017: An Analysis for the Global Burden of Disease Study 2017 - The Lancet Respiratory Medicine. Available online: https://www.thelancet.com/journals/lanres/article/PIIS2213-2600(18)30496-X/fulltext (accessed on 5 February 2024).
- Seasonal Influenza Vaccination Strategies. Available online: https://www.ecdc.europa.eu/en/seasonal-influenza/prevention-and-control/vaccines/vaccination-strategies (accessed on 5 February 2024).
- Seasonal Influenza Vaccination and Antiviral Use in EU/EEA Member States. Available online: https://www.ecdc.europa.eu/en/publications-data/seasonal-influenza-vaccination-antiviral-use-eu-eea-member-states (accessed on 5 February 2024).
- Van Kerkhove, M.D.; Vandemaele, K.A.H.; Shinde, V.; Jaramillo-Gutierrez, G.; Koukounari, A.; Donnelly, C.A.; Carlino, L.O.; Owen, R.; Paterson, B.; Pelletier, L.; et al. Risk Factors for Severe Outcomes Following 2009 Influenza A (H1N1) Infection: A Global Pooled Analysis. PLoS Med 2011, 8, e1001053. [Google Scholar] [CrossRef] [PubMed]
- Mertz, D.; Kim, T.H.; Johnstone, J.; Lam, P.-P.; Science, M.; Kuster, S.P.; Fadel, S.A.; Tran, D.; Fernandez, E.; Bhatnagar, N.; et al. Populations at Risk for Severe or Complicated Influenza Illness: Systematic Review and Meta-Analysis. BMJ 2013, 347, f5061. [Google Scholar] [CrossRef] [PubMed]
- CDC People at High Risk of Flu. Available online: https://www.cdc.gov/flu/highrisk/index.htm (accessed on 19 February 2024).
- Seasonal Influenza 2022-2023 Annual Epidemiological Report 2023. 2023.
- Influenza Vaccination Coverage Rates in the EU/EEA. Available online: https://www.ecdc.europa.eu/en/seasonal-influenza/prevention-and-control/vaccines/vaccination-coverage (accessed on 5 February 2024).
- Health Care Use - Influenza Vaccination Rates - OECD Data. Available online: http://data.oecd.org/healthcare/influenza-vaccination-rates.htm (accessed on 5 February 2024).
- State of Vaccine Confidence in the EU (2022) - European Commission. Available online: https://health.ec.europa.eu/publications/state-vaccine-confidence-eu-2022_en (accessed on 5 February 2024).
- Vaccine Scheduler | ECDC. Available online: https://vaccine-schedule.ecdc.europa.eu/Scheduler/ByCountry?SelectedCountryId=166&IncludeChildAgeGroup=true&IncludeChildAgeGroup=false&IncludeAdultAgeGroup=true&IncludeAdultAgeGroup=false/ (accessed on 5 February 2024).
- Influenza Vaccination Coverage and Effectiveness. Available online: https://www.who.int/europe/news-room/fact-sheets/item/influenza-vaccination-coverage-and-effectiveness (accessed on 5 February 2024).
- Announcement of the Minister of Health of 20 August 2021, on the List of Reimbursed Drugs, Foodstuffs for Particular Nutritional Uses and Medical Devices. J. Laws Minist. Health 2021, 65. Available online: http://Dziennikmz.Mz.Gov.Pl/Legalact/2021/65.
- The Polish National Program for Influenza Prevention. Expert Consensus on the Need for Influenza Vaccines in the 2021/202 Season. Available online: http://Opzg.Cn-Panel.Pl/Resources/Konsensus/2021_03_09_Konsensus_ekspert%C3%B3w_szacuknkowe_liczby_dawek.Dokument.Pdf.
- Canada, P.H.A. of Highlights from the 2021–2022 Seasonal Influenza (Flu) Vaccination Coverage Survey. Available online: https://www.canada.ca/en/public-health/services/immunization-vaccines/vaccination-coverage/seasonal-influenza-survey-results-2021-2022.html (accessed on 5 February 2024).
- Roumeliotis, P.; Houle, S.K.D.; Johal, A.; Roy, B.; Boivin, W. Knowledge, Perceptions, and Self-Reported Rates of Influenza Immunization among Canadians at High Risk from Influenza: A Cross-Sectional Survey. Vaccines (Basel) 2023, 11, 1378. [Google Scholar] [CrossRef] [PubMed]
- You, Y.; Li, X.; Chen, B.; Zou, X.; Liu, G.; Han, X. Knowledge, Attitude, and Practice towards Influenza Vaccination among Older Adults in Southern China during the COVID-19 Pandemic. Vaccines 2023, 11, 1197. [Google Scholar] [CrossRef] [PubMed]
- Near, A.M.; Tse, J.; Young-Xu, Y.; Hong, D.K.; Reyes, C.M. Burden of Influenza Hospitalization among High-Risk Groups in the United States. BMC Health Services Research 2022, 22, 1209. [Google Scholar] [CrossRef] [PubMed]
- Schmid, P.; Rauber, D.; Betsch, C.; Lidolt, G.; Denker, M.-L. Barriers of Influenza Vaccination Intention and Behavior – A Systematic Review of Influenza Vaccine Hesitancy, 2005 – 2016. PLOS ONE 2017, 12, e0170550. [Google Scholar] [CrossRef] [PubMed]
- Sulis, G.; Basta, N.E.; Wolfson, C.; Kirkland, S.A.; McMillan, J.; Griffith, L.E.; Raina, P. Influenza Vaccination Uptake among Canadian Adults before and during the COVID-19 Pandemic: An Analysis of the Canadian Longitudinal Study on Aging (CLSA). Vaccine 2022, 40, 503–511. [Google Scholar] [CrossRef] [PubMed]
- Cho, H.; Houle, S.K.D. ; Alsabbagh, Mhd. W. The Trends and Determinants of Seasonal Influenza Vaccination after Cardiovascular Events in Canada: A Repeated, Pan-Canadian, Cross-Sectional Study. Health Promot Chronic Dis Prev Can 2023, 43, 87–97. [Google Scholar] [CrossRef]
- Skyles, T.J.; Stevens, H.P.; Obray, A.M.; Jensen, J.L.; Miner, D.S.; Bodily, R.J.; Nielson, B.U.; Poole, B.D. Changes in Attitudes and Barriers to Seasonal Influenza Vaccination from 2007 to 2023. J Community Health 2023. [CrossRef] [PubMed]
Figure 1.
Disposition of survey participants.
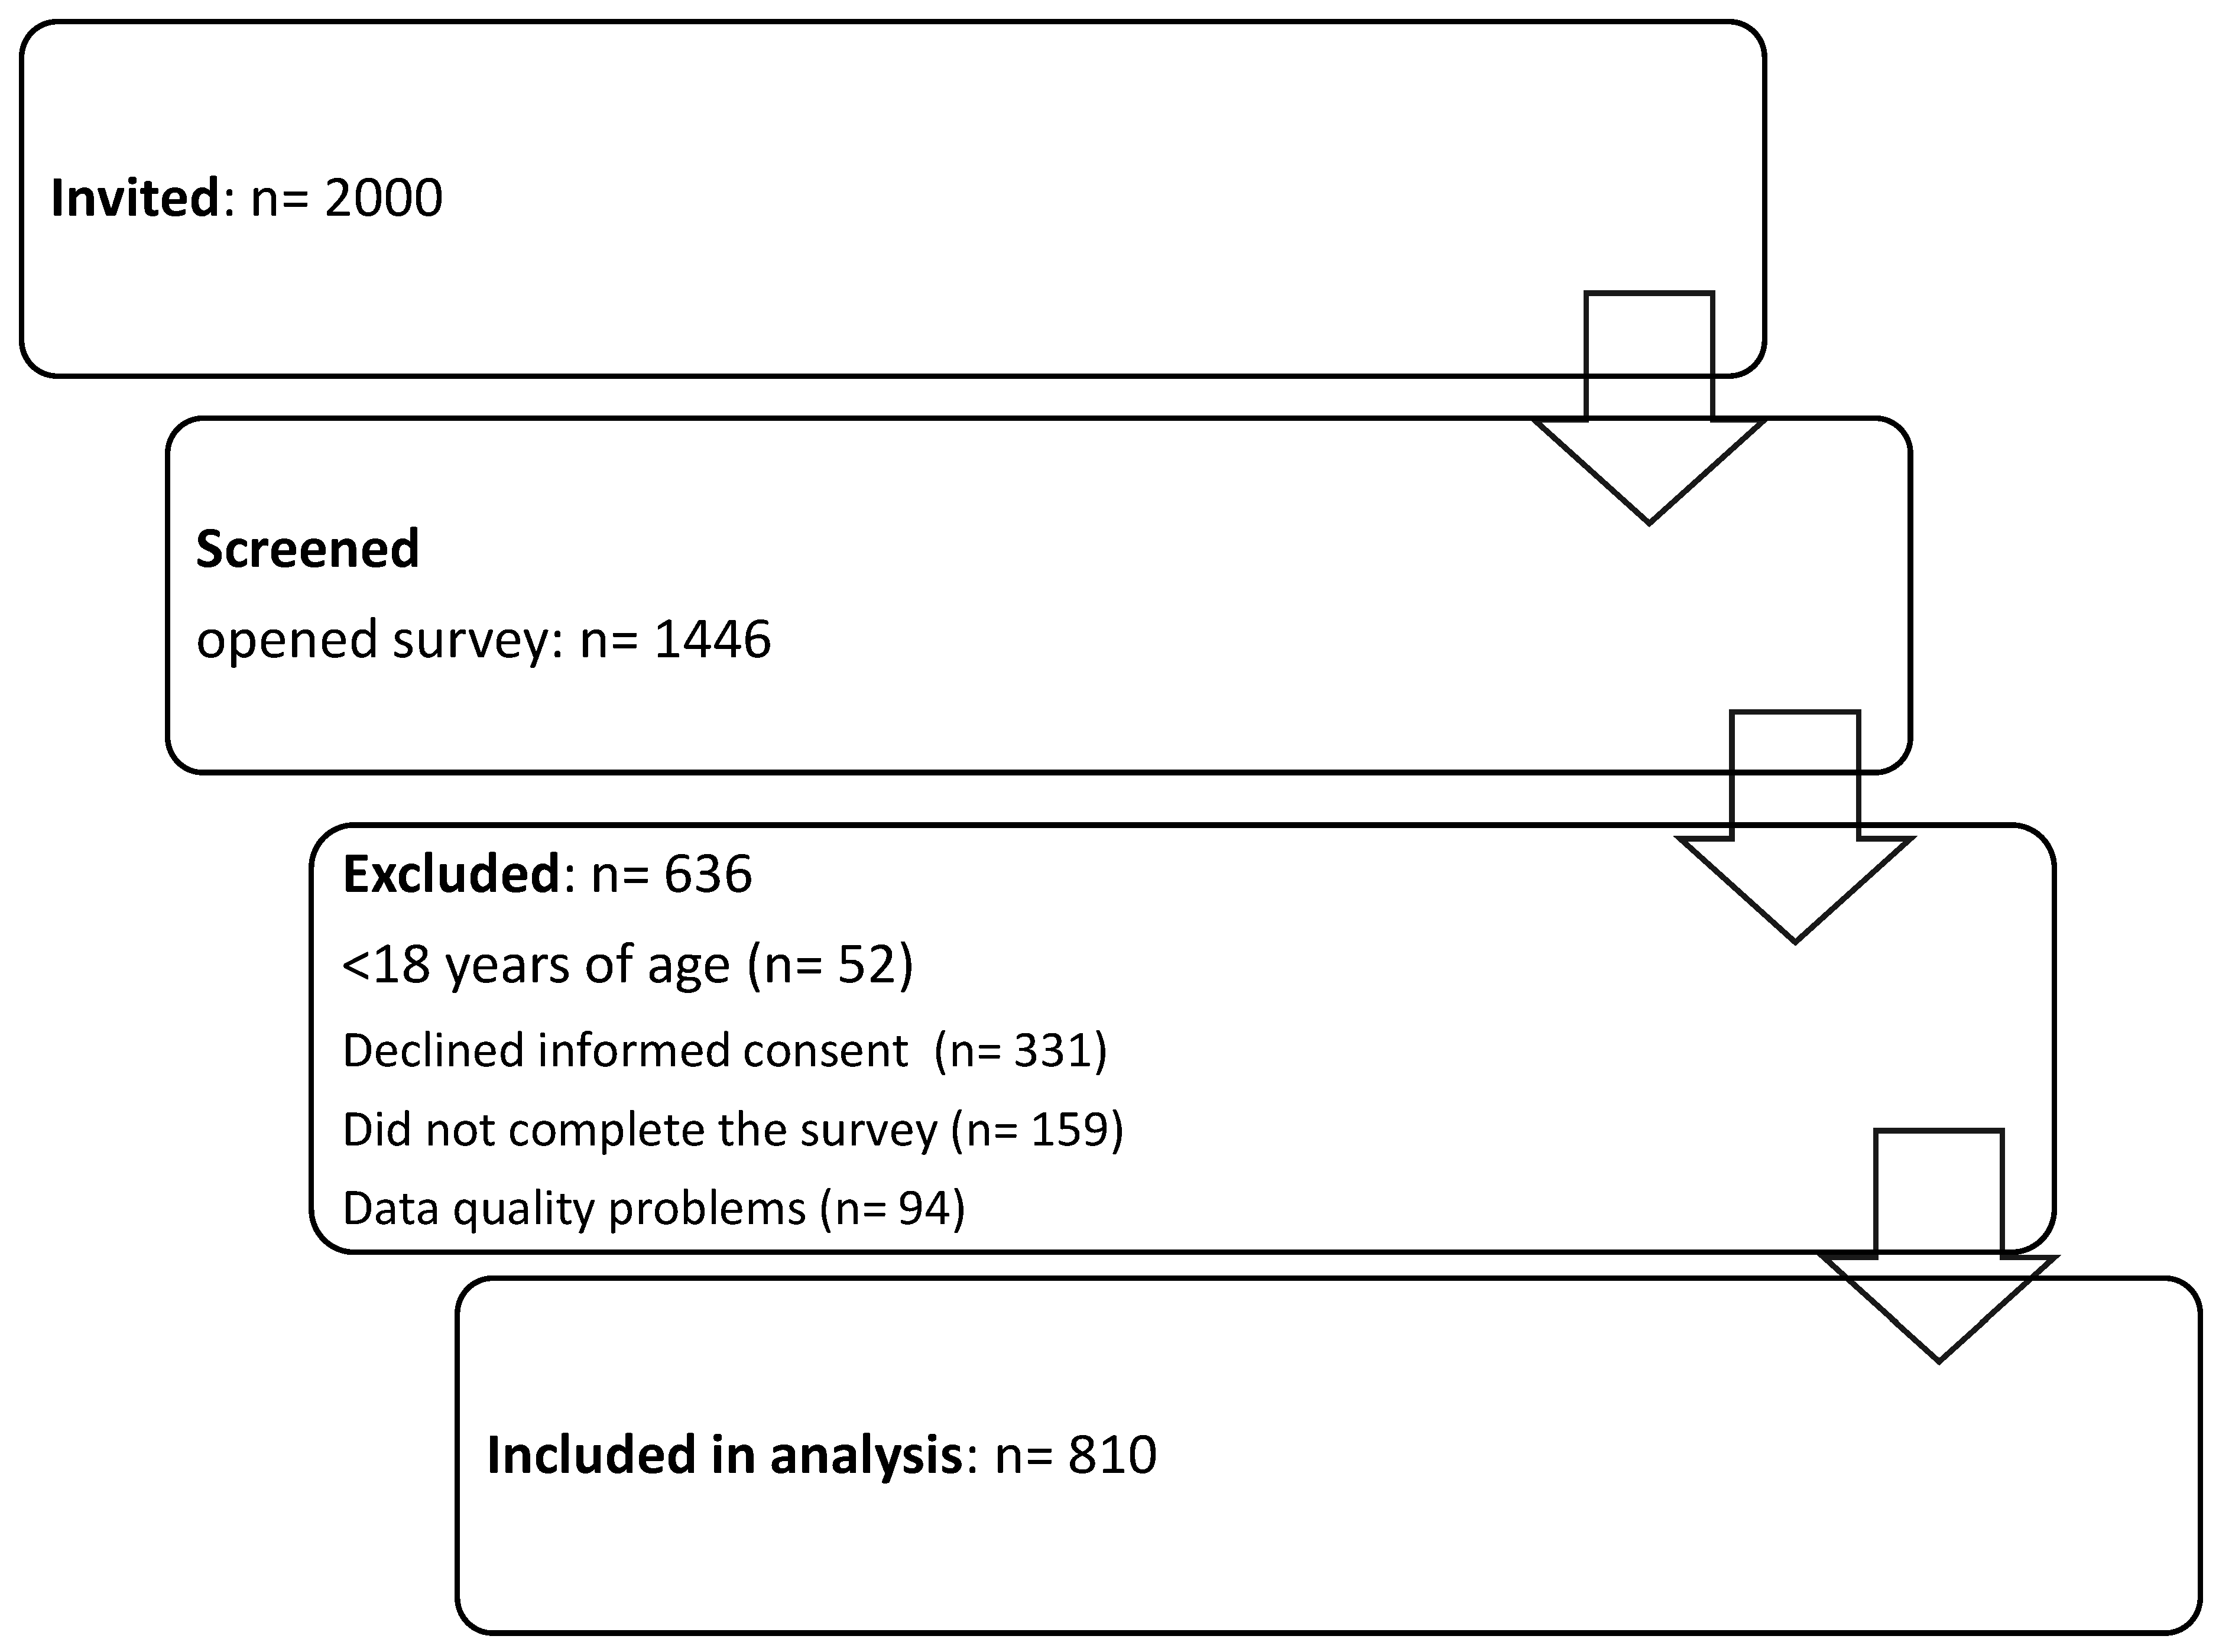
Figure 2.
Reasons for getting vaccinated against the flu virus.
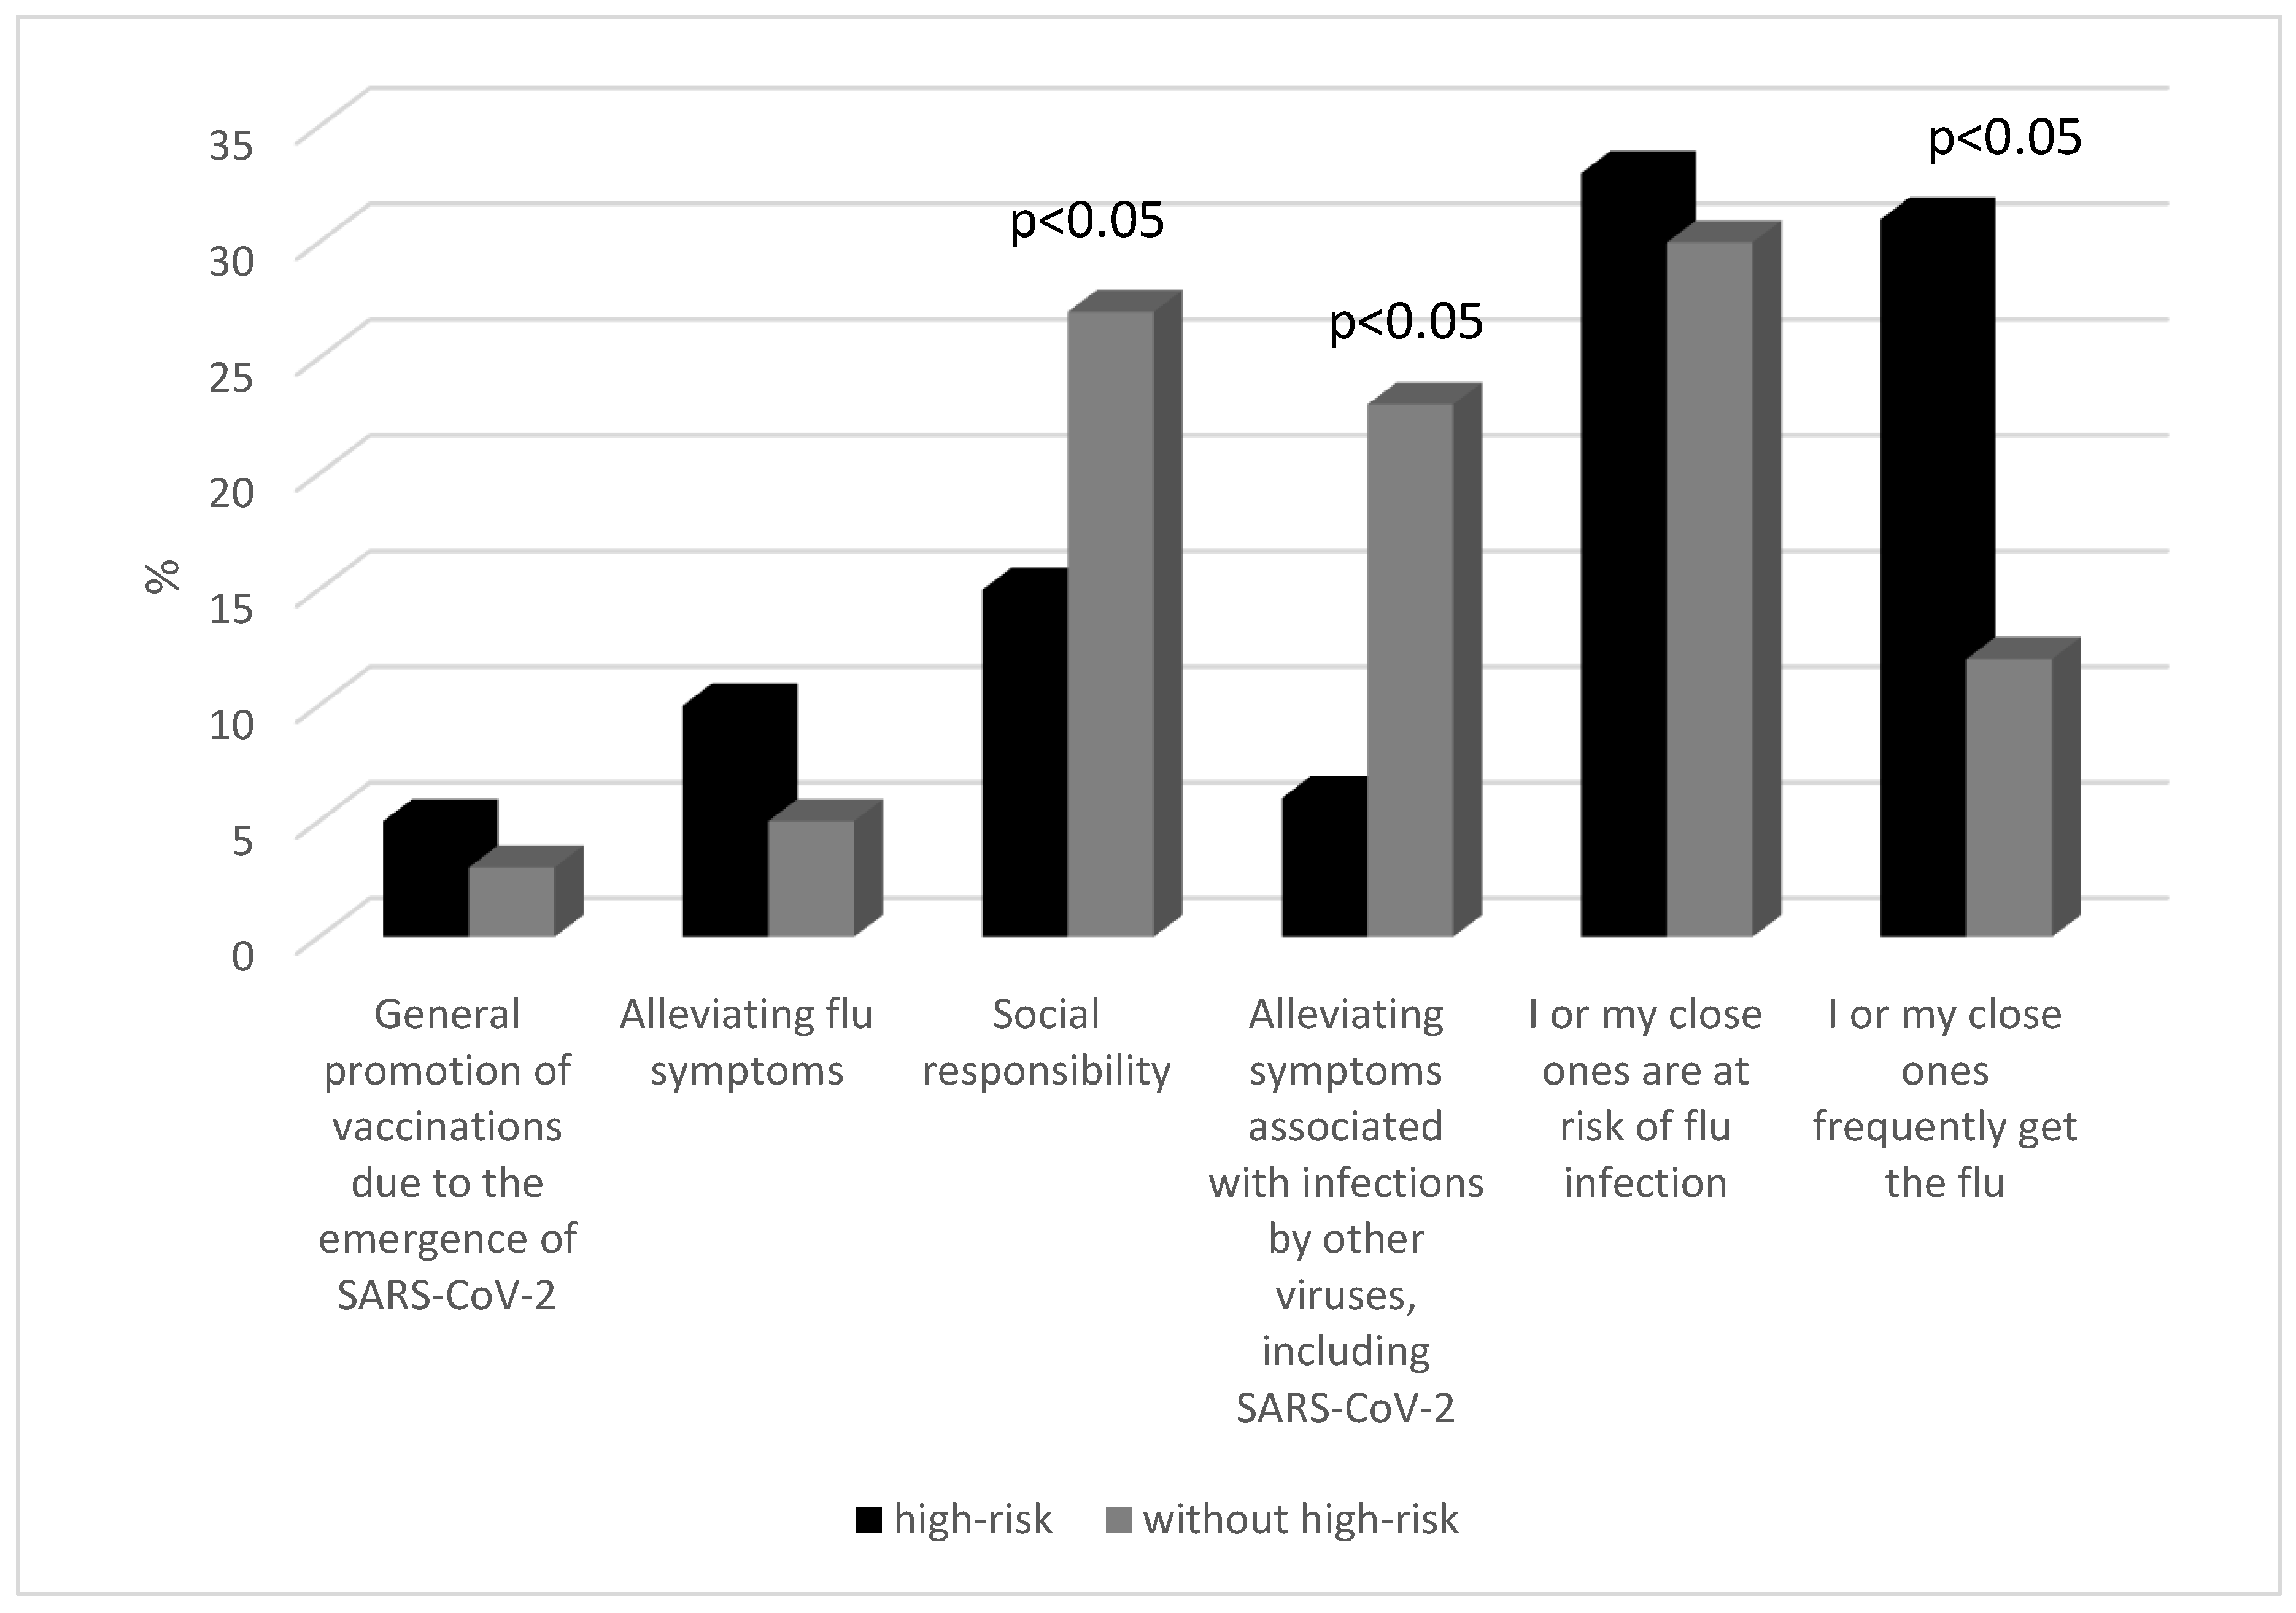
Figure 3.
The reasons for not getting vaccinated.
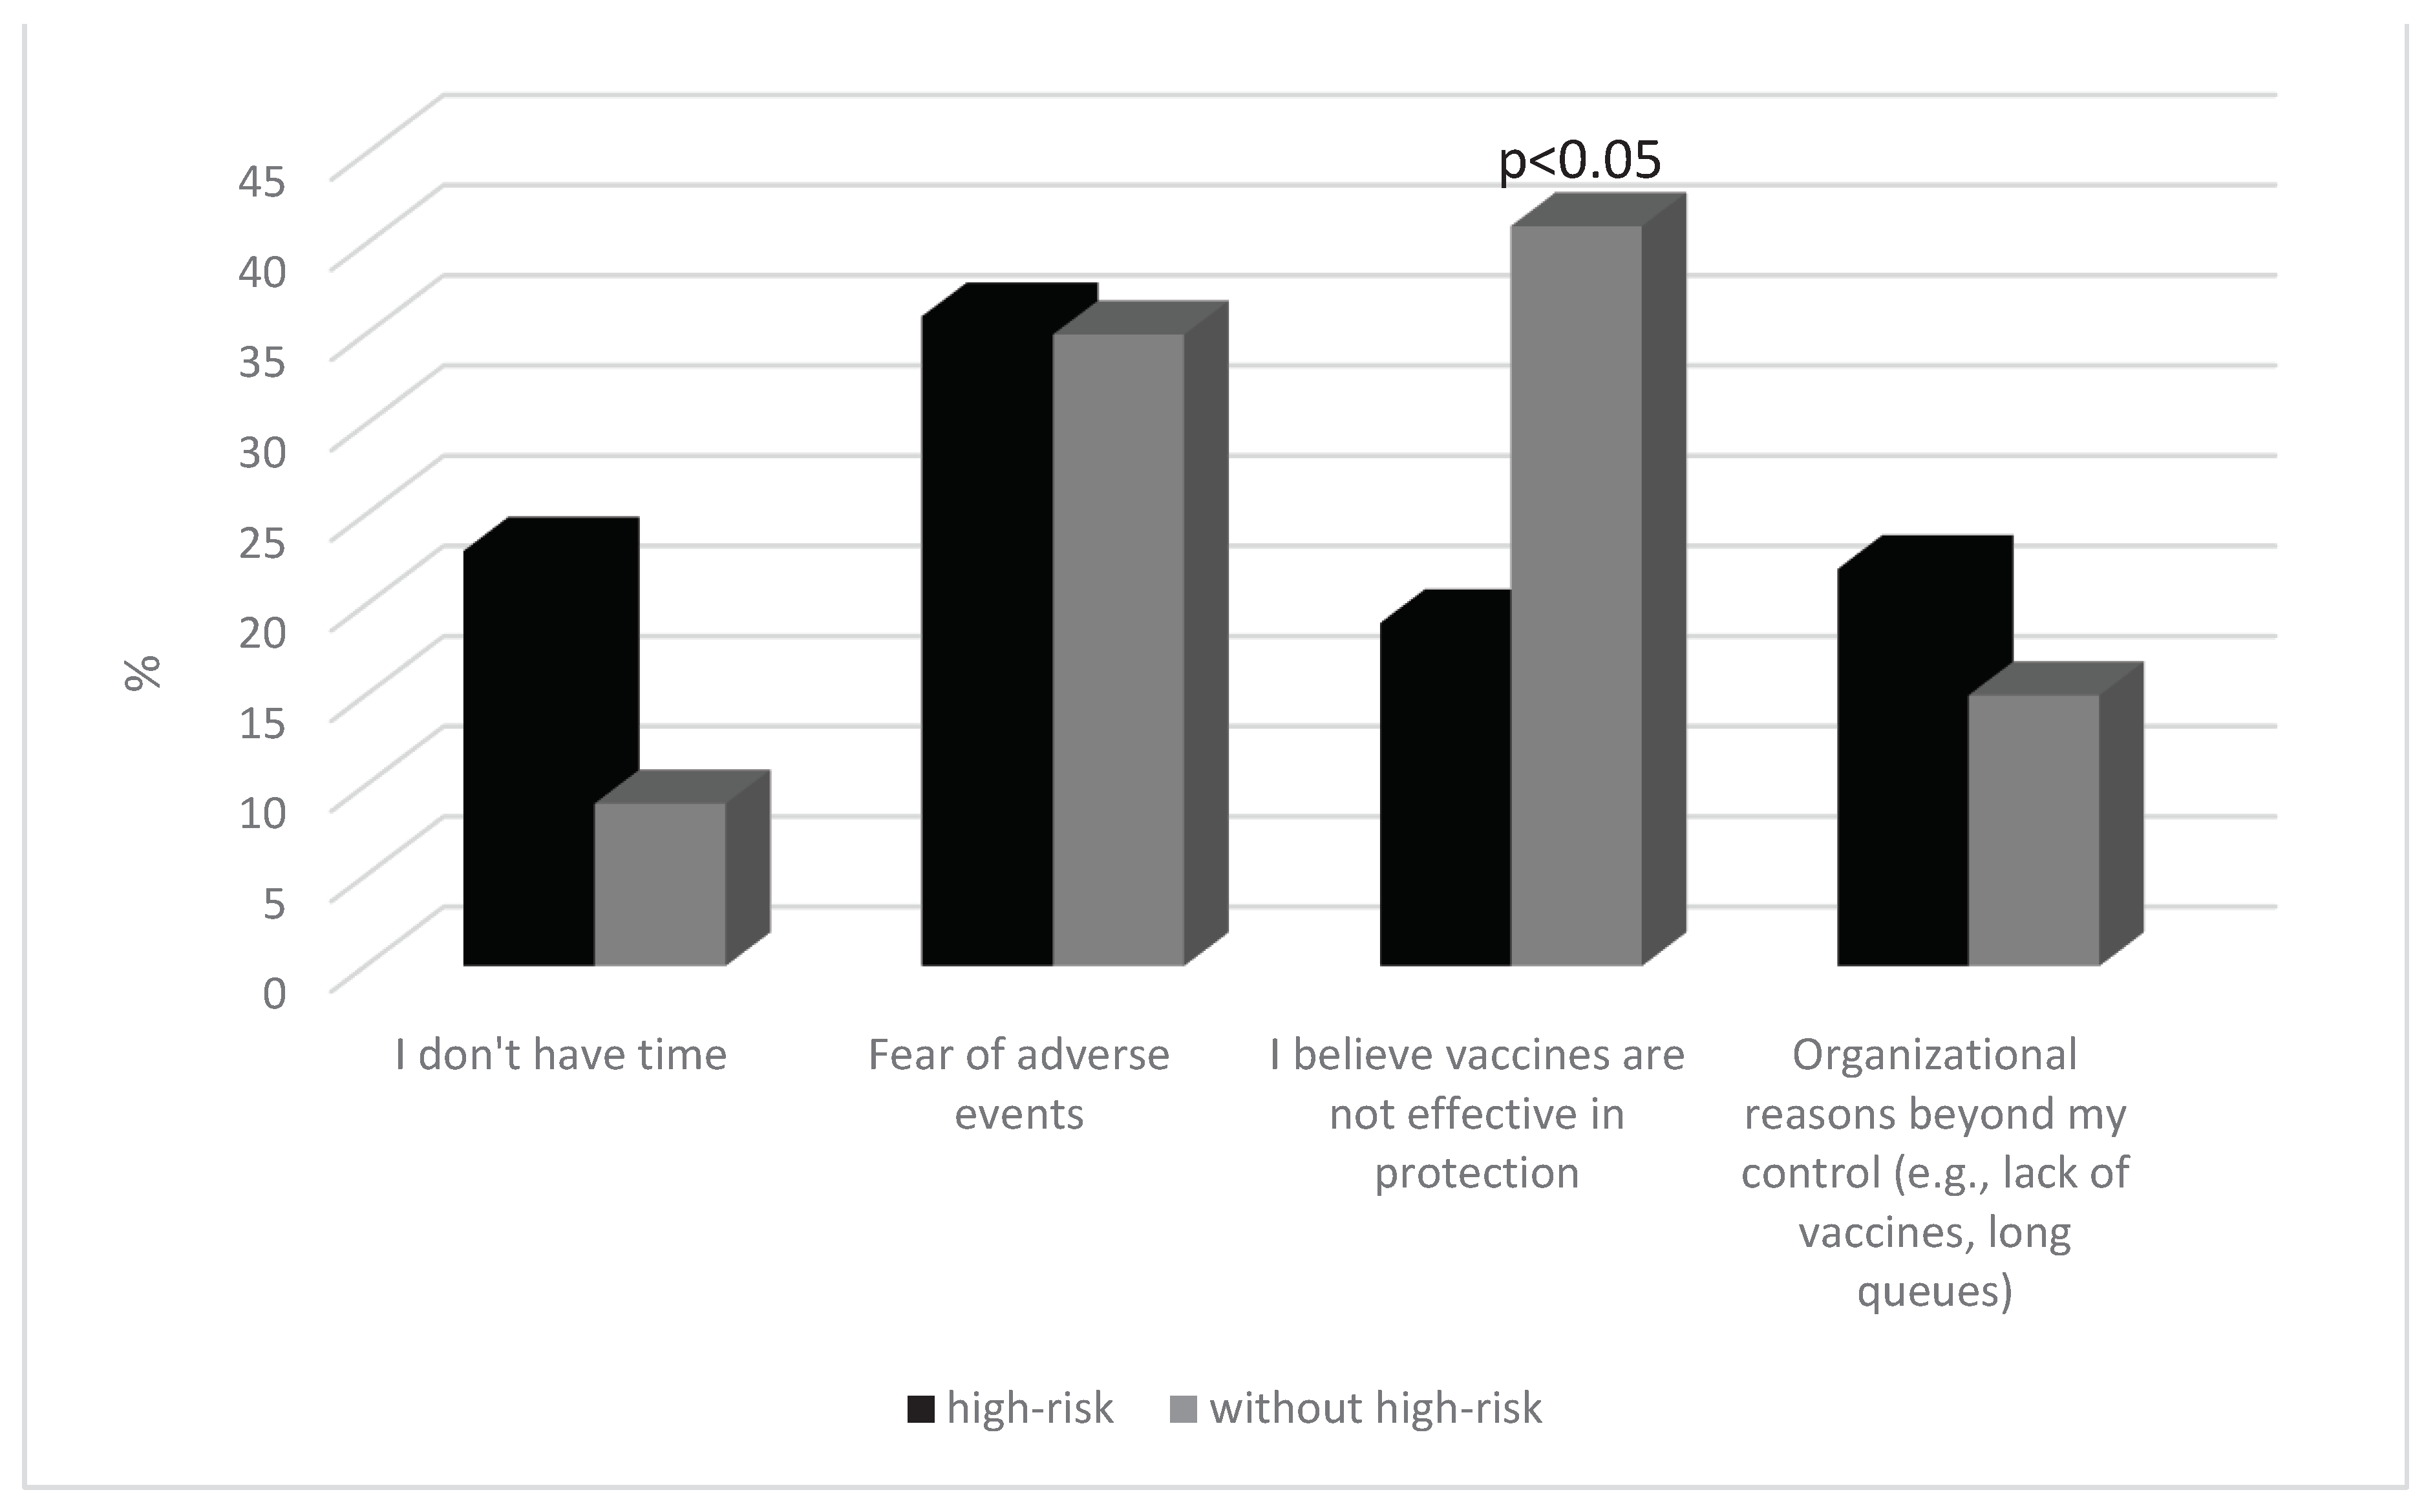

Table 1.
Demographic characteristics of respondents (n=810).
| Parameter | General | |||
|---|---|---|---|---|
| Age [years; mean(±SD)] | 38.32 (3.86) | |||
| Sex [female; N (%)] | 467(57.67) | |||
| Place of residence | Village | 90(11.12) | ||
| A town with up to 50,000 residents | 97(12.01) | |||
| A town with up to 100,000 residents | 197(24.33) | |||
| A town with up to 250,000 residents | 206(25,42) | |||
| A city with over 250,000 residents | 220(27.12) | |||
| Education | Elementary | 140(17.39) | ||
| Vocational school | 211(26.06) | |||
| High school | 196(24.04) | |||
| College/University | 263(32.51) | |||
| High-risk group | Without; N(%) | 500(61.77) | ||
| With; N(%) | 310(38.23) | |||
| Anemia, thalassemia, hemoglobinopathy | 16(2.05) | |||
| Asthma | 60(7.50) | |||
| BMI > 40 kg/m | 28(3.47) | |||
| Cancer | 8(1.49) | |||
| Chronic CSF leak | 5(0.67) | |||
| Chronic lung disease1 | 82(10.12) | |||
| Chronic kidney disease | 17(2.20) | |||
| Chronic liver disease | 10(1.30) | |||
| Hypertension | 285(35.21) | |||
| Heart disease2 | 100(12.33) | |||
| Respiratory secretion impairment3 | 10(1.21) | |||
| Immune disorder or immune suppression4 | 4(0.50) | |||
| Diabetes or other metabolic diseases | 122(15.10) | |||
| Spleen problems or removal | 9(1.09) | |||
| Other high-riskgroup | ≥65 years | 195(24.10) | ||
| Pregnant | 15(1.90) | |||
| Long-term care resident | 8(1.00) | |||
| Indigenous ancestry | 15(1.87) | |||
1 Including emphysema, chronic bronchitis, or cystic fibrosis; 2 Including coronary heart disease, heart failure, and heart attack; 3 Including increased risk of aspiration; 4 Including chemotherapy, radiation, steroid use, or an organ transplant. Abbreviations: BMI- body mass index; CSF- cerebrospinal fluid.
Table 2.
Assessment of knowledge and practice toward influenza vaccination (n=810).
| Response[N(%)] | High-risk(%) | Age (%) | Education (%) | |||||||||
| with | without | ≤20 | 21- 40 | 41- 59 | ≥65 | Elementary | Vocational school | High school | College/University | |||
| How do you understand the phrase “40-70% vaccine effectiveness against the flu”?:(n=810) | Correct answer [421(52.00)] | 66.08 | 33.92 | 33.23 | 42.01 | 18.78 | 5.98 | 5.21 | 13.55 | 33.12 | 48.12 | |
| P-value | p < 0.0001 | ≤20 vs 21-40: p = 0.1116≤20 vs 41-59: p = 0.0224≤20 vs 65: p = 0.005721-40 vs 41-59: p = 0.000321-40 vs ≥65: p = 0.018841-59 vs ≥65: p = 0.0005 | Elementary vs vocational: p = 0.3022Elementary vs High school: p = 0.0089Elementary vs College :p = 0.0002Vocational vs High school: p = 0.0053Vocational vs College: p < 0.0001High school vs College: p = 0.0058 | |||||||||
| Do you know what the risk groups for influenza infection are? (n=810) | Yes [575(71.00)] | 77.83 | 22.17 | 15.16 | 33.76 | 34.44 | 16.64 | 2.28 | 9.98 | 25.15 | 62.77 | |
| P-value | p < 0.0001 | ≤20 vs 21-40: p = 0.0013≤20vs41-59 p = 0.0009≤20vs65 p = 0.785221-40vs41-59 p = 0.887121-40 vs ≥65 p = 0.002441-59 vs ≥65 p = 0.0016 | Elementary vs Vocational: p = 0.3703Elementary vs High school: p = 0.0616Elementary vs College: p < 0.0001Vocational vs High school: p = 0.0170Vocational vs College: p < 0.0001High school vs College: p < 0.0001 | |||||||||
| Have you been confirmed to have a SARS-CoV-2 infection in the last season (2022-2023)?(n=810) | Yes[543(67.00)] | 67.09 | 32.91 | 2.69 | 25.12 | 28.10 | 44.09 | 26.49 | 23.98 | 24.03 | 25.50 | |
| P-value | p < 0.0001 | ≤20vs21-40 p = 0.0577≤20vs41-59 p = 0.0380≤20vs65 p = 0.002321-40vs41-59 p = 0.568221-40vs ≥65 p = 0.000341-59vs ≥65 p = 0.0015 | Elementary vs Vocational: p = 0.6337Elementary vs High school: p = 0.6406Elementary vs College: p = 0.8500Vocational vs High school: p = 0.9925Vocational vs College: p = 0.7733High school vs College: p = 0.7806 | |||||||||
| Have you been confirmed to have a flu virus infection in the last season(2022-2023)? (n=810) | Yes [291(36.00)] | 68.77 | 31.23 | 7.62 | 17.85 | 35.43 | 39.10 | 7.00 | 21.77 | 23.80 | 47.43 | |
| P-value | p < 0.0001 | ≤20vs21-40 p = 0.2583≤20vs41-59 p = 0.0101≤20vs65 p = 0.004321-40vs41-59 p = 0.024521-40vs ≥65 p = 0.007241-59vs ≥65 p = 0.5776 | Elementary vs Vocational: p = 0.1359Elementary vs High school: p = 0.0983Elementary vs College: p = 0.0006Vocational vs High school: p = 0.7814Vocational vs College: p = 0.0006High school vs College: p = 0.0010 | |||||||||
| Have you ever received the flu vaccine?(n=810) | Yes [421.2(52.01%)] | ever in the past [40(26.79)] | 70.01 | 29.99 | 6.75 | 5.07 | 18.87 | 69.31 | 24.12 | 51.23 | 13.09 | 11.56 |
| p = 0.0188 | ≤20vs21-40 p = 0.9386≤20vs41-59 p = 0.6250≤20vs65 p = 0.033221-40vs41-59 p = 0.637021-40vs ≥65 p = 0.066341-59 vs ≥65: p = 0.0156 | Elementary vs Vocational: p = 0.1723Elementary vs High scool: p = 0.6222Elementary vs College: p = 0.6030Vocational vs High school: p = 0.1240Vocational vs College: p = 0.1451High school vs College: p = 0.9448 | ||||||||||
| during the 2022-2023 flu season [48(32.12)] | 81.08 | 18.92 | 12.65 | 19.95 | 29.13 | 58.27 | 26.09 | 24.98 | 24.43 | 24.50 | ||
| p = 0.0003 | ≤20 vs 21-40: p = 0.7125≤20 vs 41-59: p = 0.4338≤20 vs 65: p = 0.043221-40 vs 41-59: p = 0.626621-40 vs ≥65: p = 0.046441-59 vs ≥65: p = 0.0842 | Elementary vs Vocational: p = 0.9514Elementary vs High school: p = 0.9271Elementary vs College: p = 0.9302Vocational vs High school: p = 0.9761Vocational vs College: p = 0.9792High school vs College: p = 0.9970 | ||||||||||
| in the previous 2021-2022 flu season [61(41.09] | 68.22 | 31.78 | 4.86 | 16.07 | 23.09 | 55.98 | 20.08 | 26.12 | 27.12 | 26.68 | ||
| p = 0.0071 | ≤20 vs 21-40: p = 0.6197≤20 vs 41-59: p = 0.4727≤20 vs 65: p = 0.089421-40 vs 41-59: p = 0.672621-40 vs ≥65: p = 0.026241-59 vs ≥65: p = 0.0378 | Elementary vs Vocational: p = 0.7093Elementary vs High school: p = 0.6665Elementary vs College: p = 0.6851Vocational vs High school: p = 0.9490Vocational vs College: p = 0.9713High school vs College: p = 0.9776 | ||||||||||
| Did you experience any adverse effects from receiving the flu vaccine? (n=149) | Yes [42 (28.08)] | 43.44 | 55.56 | 7.62 | 28.98 | 19.10 | 43.30 | 19.95 | 21.30 | 27.32 | 31.43 | |
| P-value | p =0.4343 | ≤20 vs 21-40: p = 0.4430≤20 vs 41-59: p = 0.6434≤20 vs 65: p = 0.239021-40 vs 41-59: p = 0.617321-40 vs ≥65: p = 0.427541-59 vs ≥65: p = 0.2350 | Elementary vs Vocational: p = 0.9372Elementary vs Hihg school: p = 0.7112Elementary vs College: p = 0.5652Vocational vs High school: p = 0.7558Vocational vs College: p = 0.6000High school vs College: p = 0.8260 | |||||||||
| How severe were the adverse effects you experienced after receiving the flu vaccine?(n=42) | Mild [27(65.28)] | 63.89 | 36.11 | 26.12 | 1.77 | 33.65 | 38.46 | 30.72 | 29.36 | 18.74 | 21.18 | |
| P-value | p = 0.1622 | ≤20 vs 21-40: p = N.D.≤20 vs 41-59: p = 0.7512≤20 vs ≥65: p = 0.595421-40 vs 41-59: p = N.D.21-40 vs ≥65: p = N.D.41-59 vs ≥65: p = 0.8275 | Elementary vs Vocational: p = 0.9527Elementary vs High school: p = 0.6324Elementary vs College: p = 0.4113Vocational vs High school: p = 0.6682Vocational vs College: p = 0.7294High school vs College: p = 0.9199 | |||||||||
| Moderate [13(31.22)] | 62.10 | 37.90 | 20.62 | 21.10 | 28.17 | 30.11 | 17.20 | 25.99 | 29.81 | 27.00 | ||
| P-value | p = 0.3549 | ≤20 vs 21-40: p = 0.9906≤20 vs 41-59: p = 0.8488≤20 vs ≥65: p = 0.804921-40 vs 41-59: p = 0.858721-40 vs ≥ 65: p = 0.814941-59 vs ≥65: p = 0.9555 | Elementary vs Vocational: p = 0.8176Elementary vs High school: p = 0.7387Elementary vs College: p = 0.7989Vocational vs High school: p = 0.9115Vocational vs College: p = 0.9776High school vs College: p = 0.9351 | |||||||||
| Severe [1(3.50)] | 100 | 0 | 12.66 | 12.32 | 34.12 | 40.09 | 28.17 | 33.10 | 24.88 | 13.85 | ||
| - | p = N.D. | p = N.D. | ||||||||||
| Did you receive both: the flu and SARS-CoV-2 vaccines during the 2022-2023 season?(n=810) | Yes [140(17.28)] | 81.08 | 18.92 | 16.51 | 16.69 | 29.10 | 37.70 | 24.10 | 17.99 | 26.48 | 31.43 | |
| P-value | p < 0.0001 | ≤20 vs 21-40: p = 0.9869≤20 vs 41-59: p = 0.2633≤20 vs ≥65: p = 0.067821-40 vs 41-59: p = 0.268221-40 vs ≥65: p = 0.069541-59 vs ≥65: p = 0.3879 | Elementary vs Vocational: p = 0.5746Elementary vs High school: p = 0.8193Elementary vs College: p = 0.4797Vocational vs High school: p = 0.4362Vocational vs College: p = 0.2244High school vs College: p = 0.6254 | |||||||||
| How many doses of the SARS-CoV-2 vaccinehave you received during the season 2022-2023? ( n=140) | 1 [12(8.53)] | 41.01 | 58.99 | 26.12 | 1.77 | 33.65 | 38.46 | 24.12 | 51.23 | 13.09 | 11.56 | |
| 2 [13(9.12)] | 33.87 | 66.13 | 41.23 | 12.38 | 27.15 | 19.24 | 29.09 | 31.65 | 39.26 | 36.47 | ||
| 3 [80(57.02)] | 91.10 | 8.90 | 3.69 | 29.12 | 33.43 | 33.76 | 44.10 | 38.12 | 17.78 | 28.98 | ||
| 4 [35(25.33)] | 87.28 | 12.72 | 12.65 | 19.95 | 29.13 | 58.27 | 26.49 | 23.98 | 24.03 | 25.50 | ||
| In your opinion, does the flu vaccine you’ve received alleviate the symptoms of a SARS-CoV-2 infection? (n=140) | Yes [94(67.09)] | 71.99 | 28.01 | 4.86 | 16.07 | 23.09 | 55.98 | 20.08 | 26.12 | 27.12 | 26.68 | |
| P-value | p = 0.0001 | ≤20 vs 21-40: p = 0.5625≤20 vs 41-59: p = 0.4050≤20 vs ≥65: p = 0.048521-40 vs 41-59: p = 0.604821-40 vs ≥65: p = 0.006441-59 vs ≥65: p = 0.0108 | Elementary vs Vocational: p = 0.6433Elementary vs High school: p = 0.5948Elementary vs College: p = 0.6167Vocational vs High school: p = 0.9369Vocational vs College: p = 0.9645High school vs College: p = 0.9720 | |||||||||
| Do you plan to get regular flu vaccinations in the future seasons?(n=810) | Yes [211 (26.12)] | 46.79 | 24.81 | 12.66 | 12.32 | 34.12 | 40.09 | 31.76 | 38.44 | 29.80 | 0 | |
| P-value | p = 0.0087 | ≤20 vs 21-40: p = 0.9704≤20 vs 41-59: p = 0.0376≤20 vs ≥65: p = 0.009721-40 vs 41-59: p = 0.034521-40 vs ≥65: p = 0.008841-59 vs ≥65: p = 0.4422 | Elementary vs Vocational: p = 0.3977Elementary vs High school: p = 0.8097Elementary vs College: p = N.D.Vocational vs High school: p = 0.2821Vocational vs College: p = N.D.High school vs College: p = N.D. | |||||||||
| No [373(46.00)] | 22.12 | 40.09 | 19.16 | 33.76 | 30.44 | 16.64 | 33.10 | 37.32 | 20.58 | 9.58 | ||
| P-value | p = 0.0057 | ≤20 vs 21-40: p = 0.0293≤20 vs 41-59: p = 0.0898≤20 vs 65: p = 0.705821-40 vs 41-59: p = 0.583421-40 vs ≥65: p = 0.014141-59 vs ≥65: p = 0.0453 | Elementary vs Vocational: p = 0.4758Elementary vs High school: p = 0.0568Vocational vs College: p = 0.0062Vocational vs High school: p = 0.0115High school vs College: p = 0.0016Vocational vs Hihg school: p = 0.1528 | |||||||||
| Not sure [226(27.88)] | 31.09 | 35.10 | 26.12 | 1.77 | 33.65 | 38.46 | 40.10 | 36.12 | 17.78 | 6.00 | ||
| P-value | p = 0.6040 | ≤20 vs 21-40: p = 0.3244≤20 vs 41-59: p = 0.1602≤20 vs ≥65: p = 0.044121-40 vs 41-59: p = 0.183021-40 vs ≥65: p = 0.136941-59 vs ≥65: p = 0.5239 | Elementary vs Vocational: p = 0.5928Elementary vs High school: p = 0.0126Elementary vs College: p = 0.0165Vocational vs Hihg school: p = 0.0385Vocational vs College: p = 0.0306High school vs College: p = 0.3000 | |||||||||
N.D.- no data.
Disclaimer/Publisher’s Note: The statements, opinions and data contained in all publications are solely those of the individual author(s) and contributor(s) and not of MDPI and/or the editor(s). MDPI and/or the editor(s) disclaim responsibility for any injury to people or property resulting from any ideas, methods, instructions or products referred to in the content. |
© 2024 by the authors. Licensee MDPI, Basel, Switzerland. This article is an open access article distributed under the terms and conditions of the Creative Commons Attribution (CC BY) license (http://creativecommons.org/licenses/by/4.0/).
Copyright: This open access article is published under a Creative Commons CC BY 4.0 license, which permit the free download, distribution, and reuse, provided that the author and preprint are cited in any reuse.


