Introduction
GWAS studies have catalogued genomic variants (SNPs) contributing to various traits. However, a GWAS cannot provide functional insight into the mechanism whereby a SNP exerts its impact. As such, multiomics studies have been developed to identify the intermediary elements (gene, CpG site, non-coding RNA, …) through which a SNP acts. A version of these studies known as TWAS (transcriptome-wide association study) aims to identify genes underlying complex traits by merging eQTLs and GWAS data. For this purpose computational tools have been developed that quantify the degree of colocalization between eQTLs and GWAS signals in order to identify the causal genes [
1,
2,
3]. However, a problem that sometimes occurs in this context is the observation of association between several genes in a genomic region with a trait. This happens because genes in a region could be under the regulatory impact of common elements and coexpress. As such, computational approaches that rely on cis-eQTL information can not exactly pinpoint the causal gene. A conventional path to resolve this issue is to conduct experiments such as gene silencing or knockdown studies which are expensive. Here, I report an alternative in-silico solution, that uses trans-eQTLs to test the association between a gene and a trait. Trans-eQTLs are scattered across different loci, this provides a good context to resolve the problem of coexpression-causality without the interference of cis-regulatory SNPs. In this study, I report that such SNPs can be used to untangle the problem of coexpression-causality by applying it to adjacent genes that show concordant association with blood traits.
Methods
Initially, I examined the content of PhenomeXcan (
http://phenomexcan.org/, release date: February 28, 2020) which is a database of gene expression-trait associations[
1]. PhenomeXcan has integrated GTEX and GWAS information on various traits to identify genes whose change in their expressions impact a trait. To identify gene pairs that coexpress and concordantly impacts a trait, I limit the search to genes that are within 50KB distance and are significantly (P<5e-8) associated with a blood trait from the UK Biobank database. Through this procedure, I identified 259 gene-pairs that show significant association (P<5e-8) with blood traits. Next, I obtained cis-eQTL data from the eQTLGen database[
4] to verify the findings from the PhenomeXcan. For, this purpose, I conducted Mendelian randomization using independent eQTLs (r
2<0.05) that are significantly associated with the studied genes (P<5e
-8). The outcome of analyses revealed 29 gene-pairs (P<5e-8) associated with blood traits. Mendelian randomization was performed using the GSMR algorithm implemented in GCTA software (version v1.94).[
5].
eQTLGen consortium has reported trans-eQTLs for 4343 genes. I obtained these data pruned them for linkage disequilibrium (LD) to keep independent trans-eQTLs (r
2<0.05) and used them as an instrument to examine the association between the identified genes and their target traits. Pruning was performed using the clump algorithm implemented in PLINK (v1.90b6.18)[
6]. The algorithm takes a list of eQTLs and their P-values, conducts LD pruning, and returns a list of eQTLs in linkage equilibrium and prioritized by P-values. The algorithm requires access to a genotype panel to compute LD values. For this purpose, I used a subset of genotype data from the 1000 genomes (phase 3), compromising 503 individuals of European ancestry. By examining the association of trans-eQTLs with the target traits, I identified 3 gene-pairs whereby trans-eQTLs could pinpoint the causal gene. Below, I review the findings:
CDA-PINK1:
CDA and
PINK1 are located on chromosome band 1p36.12. According to the PhenomeXcan database, both genes are associated with mean reticulocyte volume (
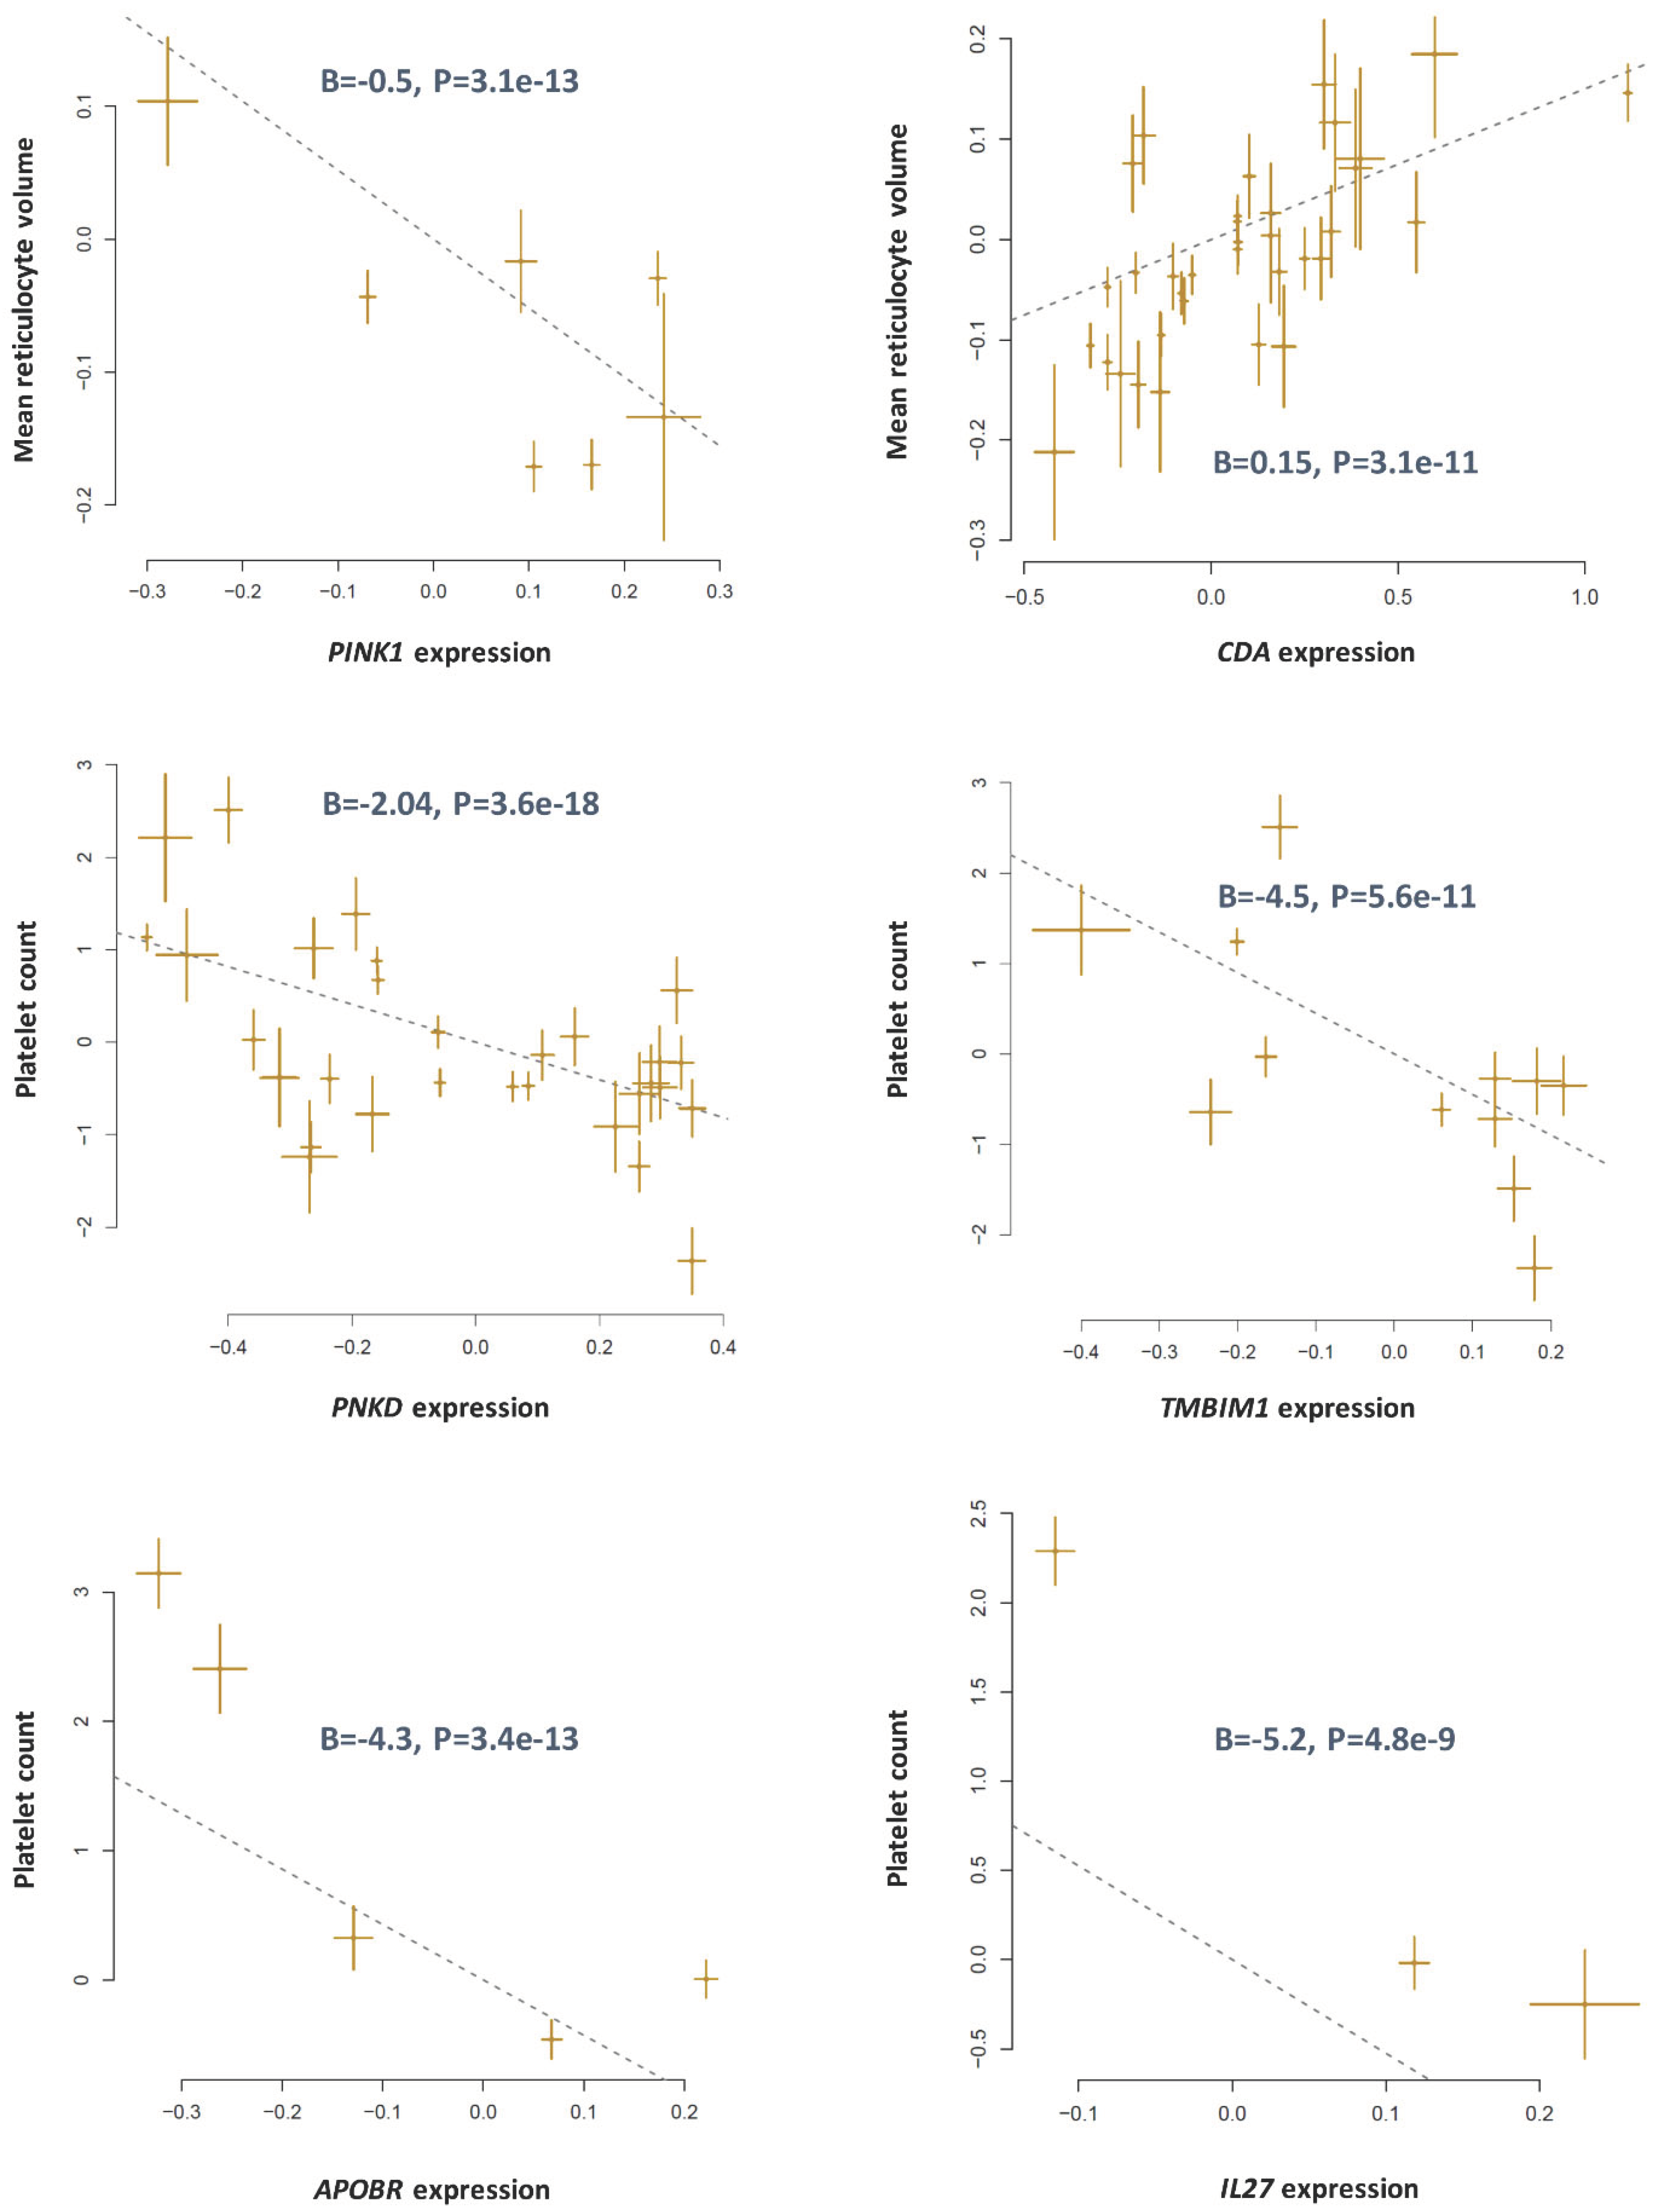
Table 1). The results of Mendelian randomization analysis using cis-eQTLs were also consistent, namely higher expression of
PINK1 contributed to lower reticulocyte volume; whereas, higher expression of
CDA increased it (
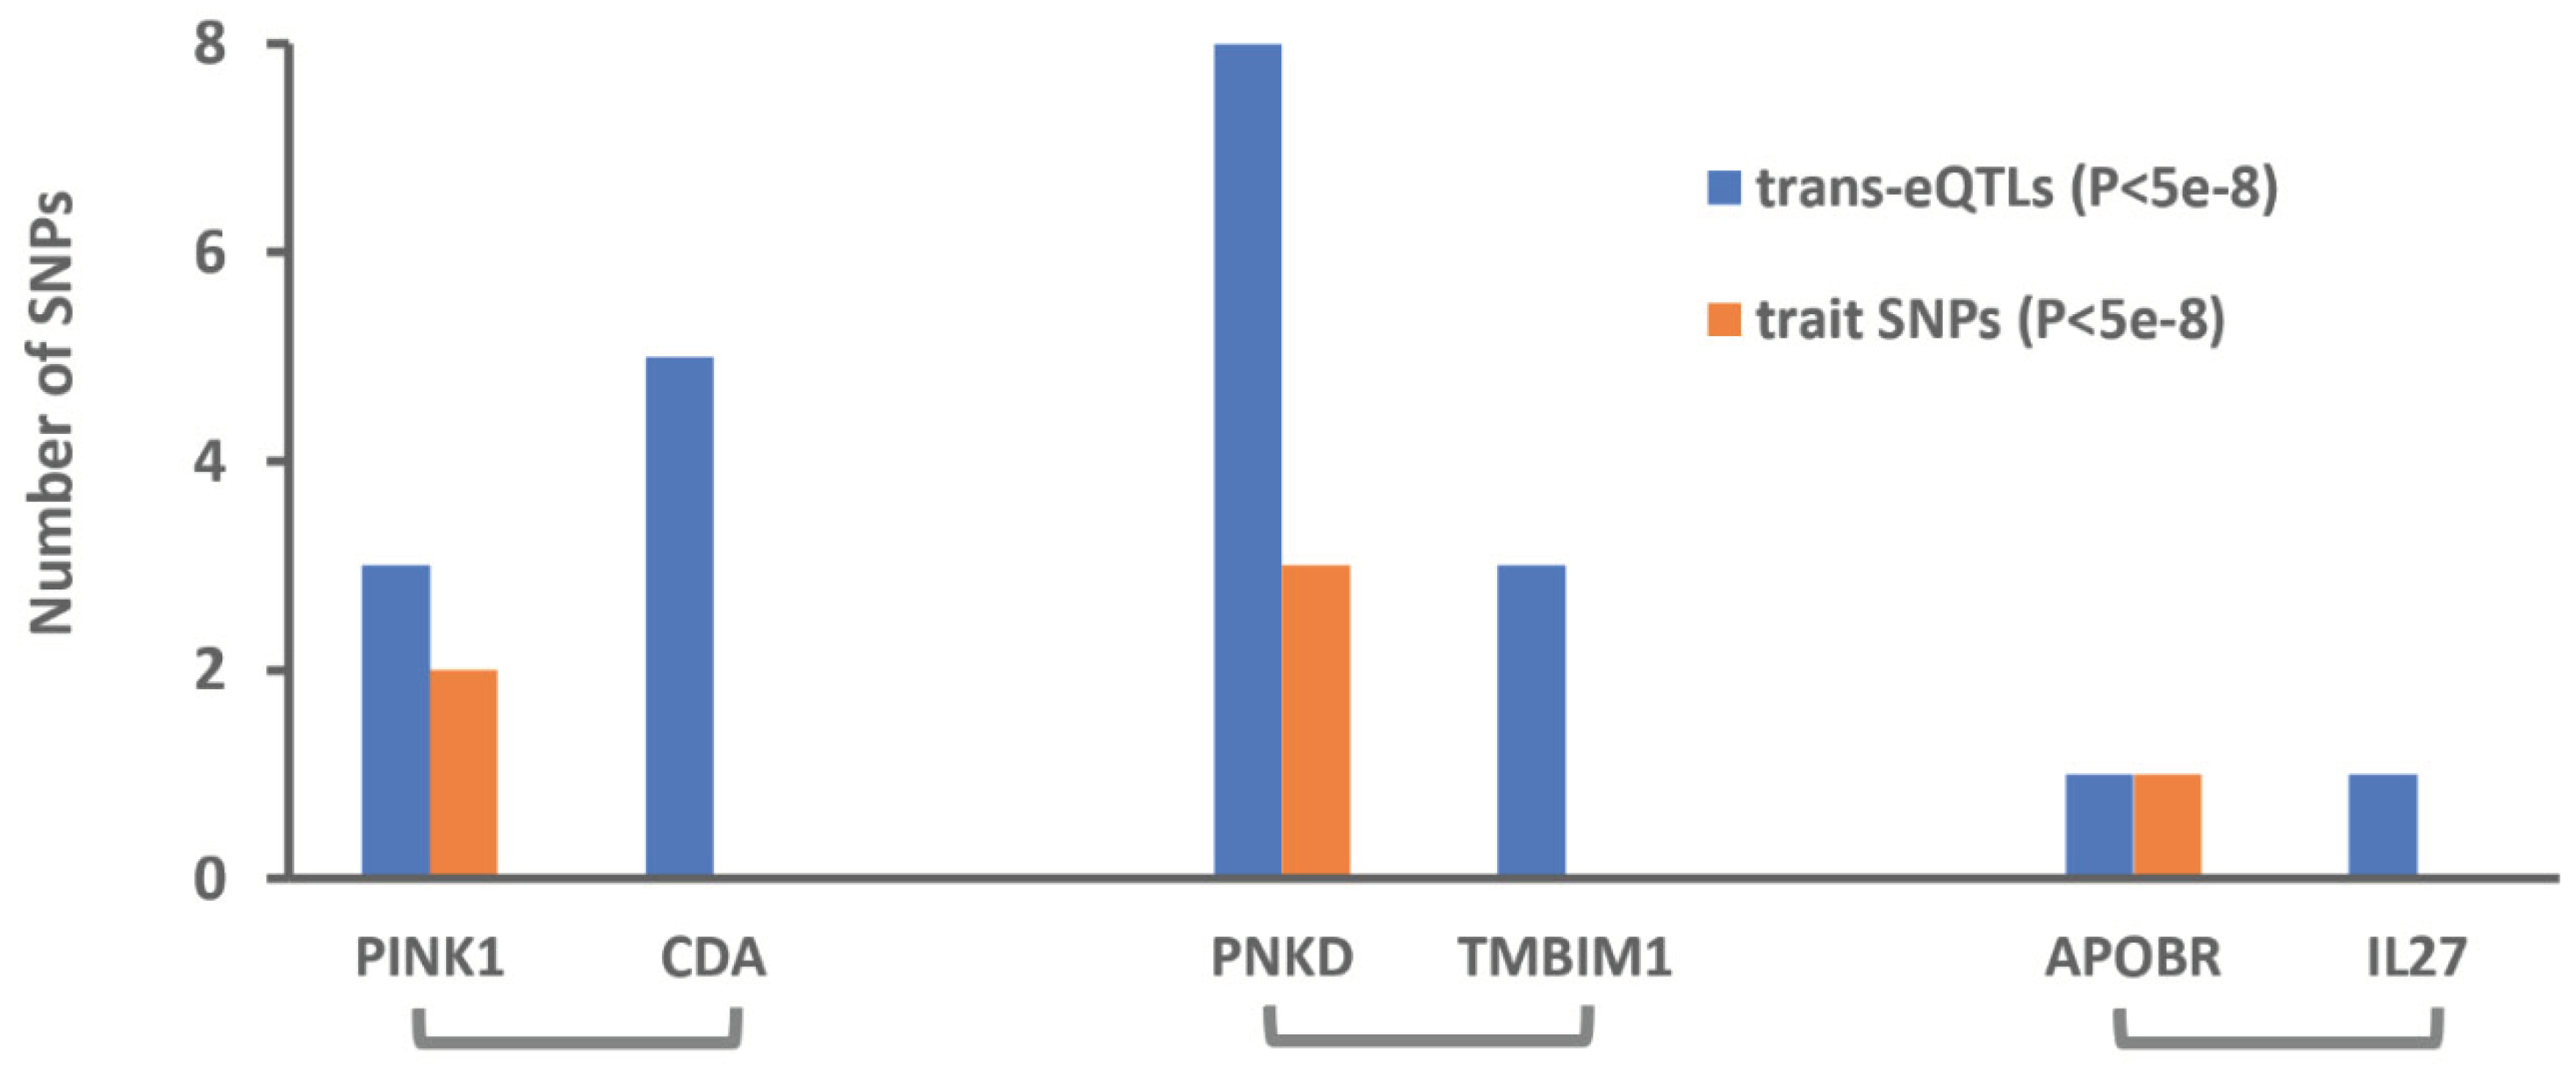
Figure 1). Next, I examined the pattern of association of trans-eQTLs with the reticulocyte volume to determine the causal gene. The three independent trans-eQTLs reported for
PINK1 in the eQTLGen database were significantly associated with reticulocyte volume; however, none of SNPs identified for
CDA showed significant association with reticulocyte volume (
Figure 2 and Table S1). Reticulocytes are blood cells that mature into the red blood cells following changes in their cellular components including losing their mitochondria. Therefore, the contribution of
PINK1 to reticulocytes volume could be at this stage, because
PINK1 is implicated in mitophagy [
7].
PNKD-TMBIM1:
I found the neighboring genes
PNKD and
TMBIM1 in 2q35 locus that impacted the platelet counts. According to the data from the PhenomeXcan database, higher expression of
PNKD and
TMBIM1 contributed to lower levels of platelets (
Table 1). Mendelian randomization based on cis-eQTL data from the eQTLGen database also confirmed both genes are associated with platelet counts (
Figure 1).
Next, I used trans-eQTLs to investigate the association of
PNKD, and
TMBIM1 with platelet counts (
Figure 2 and Table S1). After LD pruning, 8 independent trans-eQTL were identified for
PNKD among them, three were concordantly and significantly associated with platelet counts. Three independent trans-eQTLs were also identified for
TMBIM1; however, none showed significant association with platelet count (
Figure 2 and Table S1). As such, these findings indicate between
PNKD and
TMBIM1. The likely causal gene that impact platelet counts is
PNKD. Alternative splicing of
PNKD results into 3 distinct isoform proteins[
8], therefore this gene may have diverse functions.
APOBR-IL26:
APOBR and
IL26 are adjacent genes located on chromosome 16. Based on data from the PhenomeXscan both genes are associated with platelet count (
Table 1). The findings from Mendelian randomization analysis revealed higher expression of these genes are associated with lower levels of platelets (
Figure 1). In the eQTLGen database, independent trans-eQTLs have been listed for
ABPOBR and
IL26. By examining the association of these SNPs with platelet count (
Figure 2 and Table S1). I found SNP, rs10512472 reported for
APOBR (B=-0.08,P=4.2e-11) is strongly associated with platelet count (B=3.7,P=3.9e-92); however, the trans-eQTL rs12485444 reported for
IL27 (B=-0.05,P=3.6e-8) does not show association with platelet count (B=0.05,P=0.7) indicating the causal gene is
APOBR (
Figure 2 and Table S1).
APOBR encodes a scavenger receptor for LDL on the surface of macrophages [
9]; therefore, lower expression of this gene could increase the risk of atherosclerosis and accompanying comorbidities such as higher levels of platelets.
Discussion
In genomic regions where several genes coexpress, it is difficult to identify the causal gene because the currently used approaches rely on cis-eQTLs to draw a correlation between the expression of a gene and a trait. To tackle this problem, in this study, I used trans-eQTLs to identify the causal gene among genes that are coexpress and concordantly impact a trait. The outcome of analyses revealed most trans-QTLs that impact adjacent genes are not the same and scattered across different loci, this provides a good context to investigate the impact of change in expression of a gene on the risk of a phenotype without the interference of cis-eQTLs. Of note, previous studies indicated that trans-eQTLs have smaller effect size compared to cis-eQTLs[
10,
11]. As such, studies that aim to leverage the trans-eQTLs should obtain their data from datasets with large sample size[
12]. Furthermore, compared to cis-eQTL, trans-eQTLs show tissue specificity[
10,
13]. Therefore, care should be taken to obtain trans-eQTLs from datasets that match the studied trait with regard to the tissue of origin.
GWAS studies of functional elements including transcripts tend to report cis-acting SNPs only; however, findings from this study indicate reporting full GWAS summary statistics is necessary, because not only it covers trans-acting SNPs but also provide the possibility to compare same SNPs across different datasets for better judgment. Finally, the principle of this study could be extended to other multiomics studies that aim to catalogue the non-transcript functional elements underlying traits. This requires generating QTLs for such functional elements beforehand.
In summary, this study provide evidence that trans-eQTLs can be used to identify the causal gene in genomic regions that several genes coexpress and concordantly impact a trait. Therefore, indexing trans-QTLs underlying gene expression will provide a better framework to identify genes underlying traits.
Funding
This research received no external funding
Institutional Review Board Statement
Not applicable
Informed Consent Statement
Not applicable
Data Availability Statement
Acknowledgments
This research work was enabled in part by computational resources and support provided by the Compute Ontario and the Digital Research Alliance of Canada.
Conflict of Interest
The author declares no competing interests.
References
- Pividori, M., et al., PhenomeXcan: Mapping the genome to the phenome through the transcriptome. Science Advances, 2020, 6, eaba2083. [CrossRef]
- Zhao, S. , et al., Adjusting for genetic confounders in transcriptome-wide association studies improves discovery of risk genes of complex traits. Nat Genet, 2024, 56, 336-347. [CrossRef]
- Gamazon, E.R., et al., A gene-based association method for mapping traits using reference transcriptome data. Nat Genet, 2015, 47, 1091-1098. [CrossRef]
- Võsa, U., et al., Large-scale cis- and trans-eQTL analyses identify thousands of genetic loci and polygenic scores that regulate blood gene expression. Nature genetics, 2021, 53, 1300-1310. [CrossRef]
- Zhu, Z., et al., Causal associations between risk factors and common diseases inferred from GWAS summary data. Nature communications, 2018, 9, 224. [CrossRef]
- Chang, C.C., et al., Second-generation PLINK: rising to the challenge of larger and richer datasets. GigaScience, 2015, 4. [CrossRef]
- Narendra, D.P., et al., PINK1 is selectively stabilized on impaired mitochondria to activate Parkin. PLoS biology, 2010, 8, e1000298. [CrossRef]
- Shen, Y., et al., Mutations in PNKD causing paroxysmal dyskinesia alters protein cleavage and stability. Human molecular genetics, 2011, 20, 2322-2332. [CrossRef]
- Brown, M.L., et al., A macrophage receptor for apolipoprotein B48: Cloning, expression, and atherosclerosis. Proceedings of the National Academy of Sciences, 2000, 97, 7488-7493. [CrossRef]
- Consortium, G., The GTEx Consortium atlas of genetic regulatory effects across human tissues. Science, 2020, 369, 1318-1330. [CrossRef]
- Nica, A.C. and E.T. Dermitzakis, Expression quantitative trait loci: present and future. Philosophical Transactions of the Royal Society B: Biological Sciences, 2013, 368, 20120362. [CrossRef]
- Nikpay, M., Trans-eQTLs Can Be Used to Identify Tissue-Specific Gene Regulatory Networks, in Preprints2024, Preprints. [CrossRef]
- Price, A.L., et al., Single-tissue and cross-tissue heritability of gene expression via identity-by-descent in related or unrelated individuals. PLoS Genet, 2011, 7, e1001317. [CrossRef]
|
Disclaimer/Publisher’s Note: The statements, opinions and data contained in all publications are solely those of the individual author(s) and contributor(s) and not of MDPI and/or the editor(s). MDPI and/or the editor(s) disclaim responsibility for any injury to people or property resulting from any ideas, methods, instructions or products referred to in the content. |
© 2024 by the authors. Licensee MDPI, Basel, Switzerland. This article is an open access article distributed under the terms and conditions of the Creative Commons Attribution (CC BY) license (http://creativecommons.org/licenses/by/4.0/).


