Preprint
Article

Facile and economical preparation method of TiO2/activated carbon for photocatalytic degradation of methylene blue

Altmetrics

Downloads

137

Views

84

Comments

0

A peer-reviewed article of this preprint also exists.

Submitted:

22 February 2024

Posted:

23 February 2024

You are already at the latest version

Alerts
Abstract
Nanocomposites of TiO2 Degussa P25 nanoparticles/activated carbon (TiO2/AC ) were prepared at various mass ratios of (4:1), (3:2), (2:3), and (1:4) by a facile process. The effects of TiO2/AC mass ratios on the structural, morphological, and photocatalytic properties were systematically studied in comparison with bare TiO2 and bare AC. TiO2 nanoparticles exhibited dominant anatase and minor rutile phases, and a crystallite size of approximately 21 nm; while AC had XRD peaks of graphite and carbon, and a crystallite size of 49 nm. The composites exhibited tight decoration of TiO2 nanoparticles on micron-/submicron AC particles, and uniform TiO2/AC composites were obtained as evidenced by the uniform distribution of Ti, O, and C in an EDS mapping. Moreover, Raman spectra show the typical vibration modes of anatase TiO2 (e.g., E1g(1), B1g(1), Eg(3)) and carbon materials with D and G bands. The TiO2/AC with (4:1), (3:2), and (2:3) possessed higher reaction rate constants (k) in photocatalytic degradation of methylene blue (MB) than that of either TiO2 or AC. Among the investigated materials, TiO2/AC = 4:1 achieved the highest photocatalytic activity with a high k of 55.2×10⁻³ min-1 and an MB removal efficiency of 96.6% after 30 min treatment under UV-Vis irradiation (120 mW/cm2). The enhanced photocatalytic activity for TiO2/AC is due to the synergistic effect of the high adsorption capability of AC and the high photocatalytic activity of TiO2. Furthermore, TiO2/AC promotes the separation of photoexcited electron/hole (e-/h+) pairs to reduce their recombination rate and thus enhance photocatalytic activity. The optimal TiO2/AC composite in this study can be used for treating industrial or household wastewater with organic pollutants.
Keywords: 
Subject: Chemistry and Materials Science  -   Materials Science and Technology

1. Introduction

Water is an essential resource for the growth of the natural environment on the earth and people. Water pollution with organic dyes, heavy metals, and other contaminants (i.e, pesticides, steroid hormones, antibiotics) is a current environmental issue [1]. Synthetic organic dyes are omnipresent in many application areas of the textile, tannery, cosmetic and food industries, and medicine [1]. The dying process in the textile and tannery industries can release a vast majority of organic dyes due to the nature low efficiency of the dying process with approximately 15% of dye lost [1,2]. Organic dye pollution in the aquatic environment poses a threat to animal or human health and causes adverse effects on aquatic biota and water ecosystems [1,3]. Semiconductor photocatalysis for environmental applications was introduced [4], and the field has been greatly developed over the years [5,6].
Titanium dioxide (TiO2) is well-known to be the most practical and prevalent photocatalyst owing to its high photocatalytic activity, cost-effectiveness, chemical stability, abundant, and nontoxic [5]. Commercial powder of TiO2 Degussa P25 (a flame-made multiphasic TiO2 nanoparticles) was developed, and it has been widely used as a benchmark material for studying photocatalytic mechanisms, materials, and processes [7]. TiO2 P25 contains anatase, rutile, and a small amount of amorphous phase, which were reported to be 77.1% anatase, 15.9% rutile, and 7.0% amorphous TiO2 [7]. However, TiO2 is a wide band gap semiconductor with Eg = 3.2 eV for anatase and 3.0 for rutile [8], and consequently, TiO2 only works in the ultraviolet region, which accounts for less than 5% of the total energy of the solar spectrum [9]. A drawback of TiO2 nanoparticles is the fast recombination of photoexcited carriers (electrons and holes) [10], and low specific surface area that limits the contaminant adsorption capability and the photocatalytic activity.
TiO2 P25 (a powder form photocatalyst) offers relatively high photocatalytic degradation of organic dyes [11] and pharmaceuticals [11,12,13,14] and a high possibility toward practical scale application. However, TiO2 P25 use in the form of suspension (slurry) may pose an ecological risk to aquatic organisms [15], which should need an expensive filtration process to separate the suspension catalyst from the treated water. Therefore, many nanostructured TiO2 films developed on rigid substrates (e.g. TiO2 nanotubes [16], TiO2 nanowires on TiO2 nanotube arrays [17,18,19]) have been studied for photocatalyst, solar energy conversion, and other applications [16]. The film forms of TiO2 nanomaterials face a big challenge in scaling up to the practical scale of water treatment. Another approach is that TiO2 nanomaterial is loaded on/in another bigger nano/micro-scale structure to form a heterostructure or a composite. Heterostructure and composite photocatalysts can offer activity enhancement due to some mechanism related to manipulating the photoresponse region and the fate of the electron/hole pairs [9]. In this way, TiO2 has been impregnated on several porous supports such as silica, alumina, zeolite, and carbon materials [e.g., activated carbon (AC)] [20,21,22]. TiO2/AC has been found to possess higher photocatalytic activity than bare TiO2 as it combines the good photocatalytic activity of TiO2 and the high surface area of AC [21,22,23,24,25,26,27,28]. In addition, TiO2 nanoparticles loaded in the AC immobilization can resolve the limitation of using TiO2 suspension, while AC is a very economical–useful adsorbent, and it is characterized by high surface area, micro- to macro-pore structures, and a high degree of surface reactivity [29].
Many studies focused on developing TiO2/AC with structural, compositional, and surface functional modification [21,22,23,24,25,26,27,28], which usually needs the use of chemicals and laboratory equipment. Noticeably, a complicated preparation process of TiO2/AC can hinder the practical application at the household level, where non-specialized people will the the operator of their household water treatment tank or plant. In this study, we prepared TiO2 P25/AC using the two commercial raw materials by a facile and low-cost method by mixing TiO2/AC mechanically at different mass ratios. Differ from the previous studies, the compositional weight portions of TiO2/AC were in some specific range such as TiO2/ (1–15 wt.%)-AC [28], TiO2/ (5–75 wt.%)-AC prepared by sol-gel method [21], while the weight ratios of TiO2/AC in this study were TiO2/AC = 5:0, TiO2/AC = 4:1, TiO2/AC = 3:2, TiO2/AC = 2:3, TiO2/AC = 1:4, TiO2/AC = 0:5. It is worthy to mention that the use mass ratio unit for the composite should be easier and more convenient for normal people to apply in practice when they implement TiO2/AC material into their household water treatment plant. Moreover, this study has two reference samples (i.e., TiO2, AC) to get insight into the role of either TiO2 or AC in the photocatalytic degradation of methylene blue, which is a typical organic dye and considered a good model for studying photocatalyst activity and process. This study provides the effect of mixing weight ratios of TiO2/AC on the morphological, structural, compositional, and photocatalytic properties of the composite.

2. Materials and Methods

2.1. Materials

Commercial Degussa TiO2 P25 was purchased from Merck (Germany), and activated carbon (AC) was a product of Tra Bac company, Tra Vinh City, Vietnam, which was made from coconut shell. First, TiO2 Degussa P25 was activated in NaOH 5 M solution at room temperature for 100 min, then it was filtered and cleaned with deionized water before drying in an oven at 100°C for 3 hrs. Then, AC (~5 g) was placed in a clean mortar, then crushed with a pestle for 30 minutes (Figure 1a). Next, AC was mixed with TiO2 nanoparticles (P25) at different weight ratios, while the total weight of the material (TiO2 + AC) was fix at 0.5 g. Six types of samples were prepared, including S1 (TiO2), S2 (TiO2/AC = 4:1), S3 (TiO2/AC = 3:2), S4 (TiO2/AC = 2:3), S5 (AC/TiO2 = 1:4), and S6 (AC). Specifically, for example, we mixed 0.3 g TiO2 with 0.2 g AC to prepare the S3 sample. To obtain a uniform mixture and surface functionalize for the TiO2/AC composite, the 0.5 g powder was placed in a beaker filled with 10 ml ethanol 95% under sonication for 30 min (Figure 1b). Next, the powder mixture was filtered using a paper filter (Figure 1c). Finally, the material was annealed in an oven at 160°C for 3h. The powder products were stored in glass containers for later use.

2.2. Photocatalytic Activity in Degradation MB of TiO2/AC

Photocatalysis was carried out by placing 10 mg of the material powder in a 30 mL MB (at an initial concentration of 10 mg/L; the catalyst dosage of 333.3 mg/L) beaker and irradiating with ultraviolet-visible (UV-VIS) radiation from a Xenon lamp (power 100 W and power density of 120 mW/cm2). The temperature of all QXT reaction beakers was kept at 32-33°C. After each given photocatalytic reaction time (15, 30, 45, or 60 min), 1 mL of MB solution was extracted for qualitative and quantitative study of the relative concentration of MB by UV-VIS spectrophotometer (Hitachi U-2900, Japan) through the characteristic absorption peak of MB at 655 nm.

2.3. Characterization Methods

The orientation and crystallinity of the materials were determined by X-ray diffraction (XRD, Bruker D2, Bruker, USA) using Cu Kα radiation (λ= 1.5406 Å) and θ-2θ configuration. The morphology of the samples was determined by scanning electron microscope (SEM, Hitachi S-4800, Japan). The chemical composition was analyzed by X-ray energy dispersive spectroscopy (EDS, Oxford probe) integrated SEM (JEOL JSM-IT700HR). Raman spectrum of a selected TiO2/AC was obtained using a Horiba Evolution (Labram HR model) spectrometer operated with an excitation wavelength of 514 nm.

3. Results and Discussion

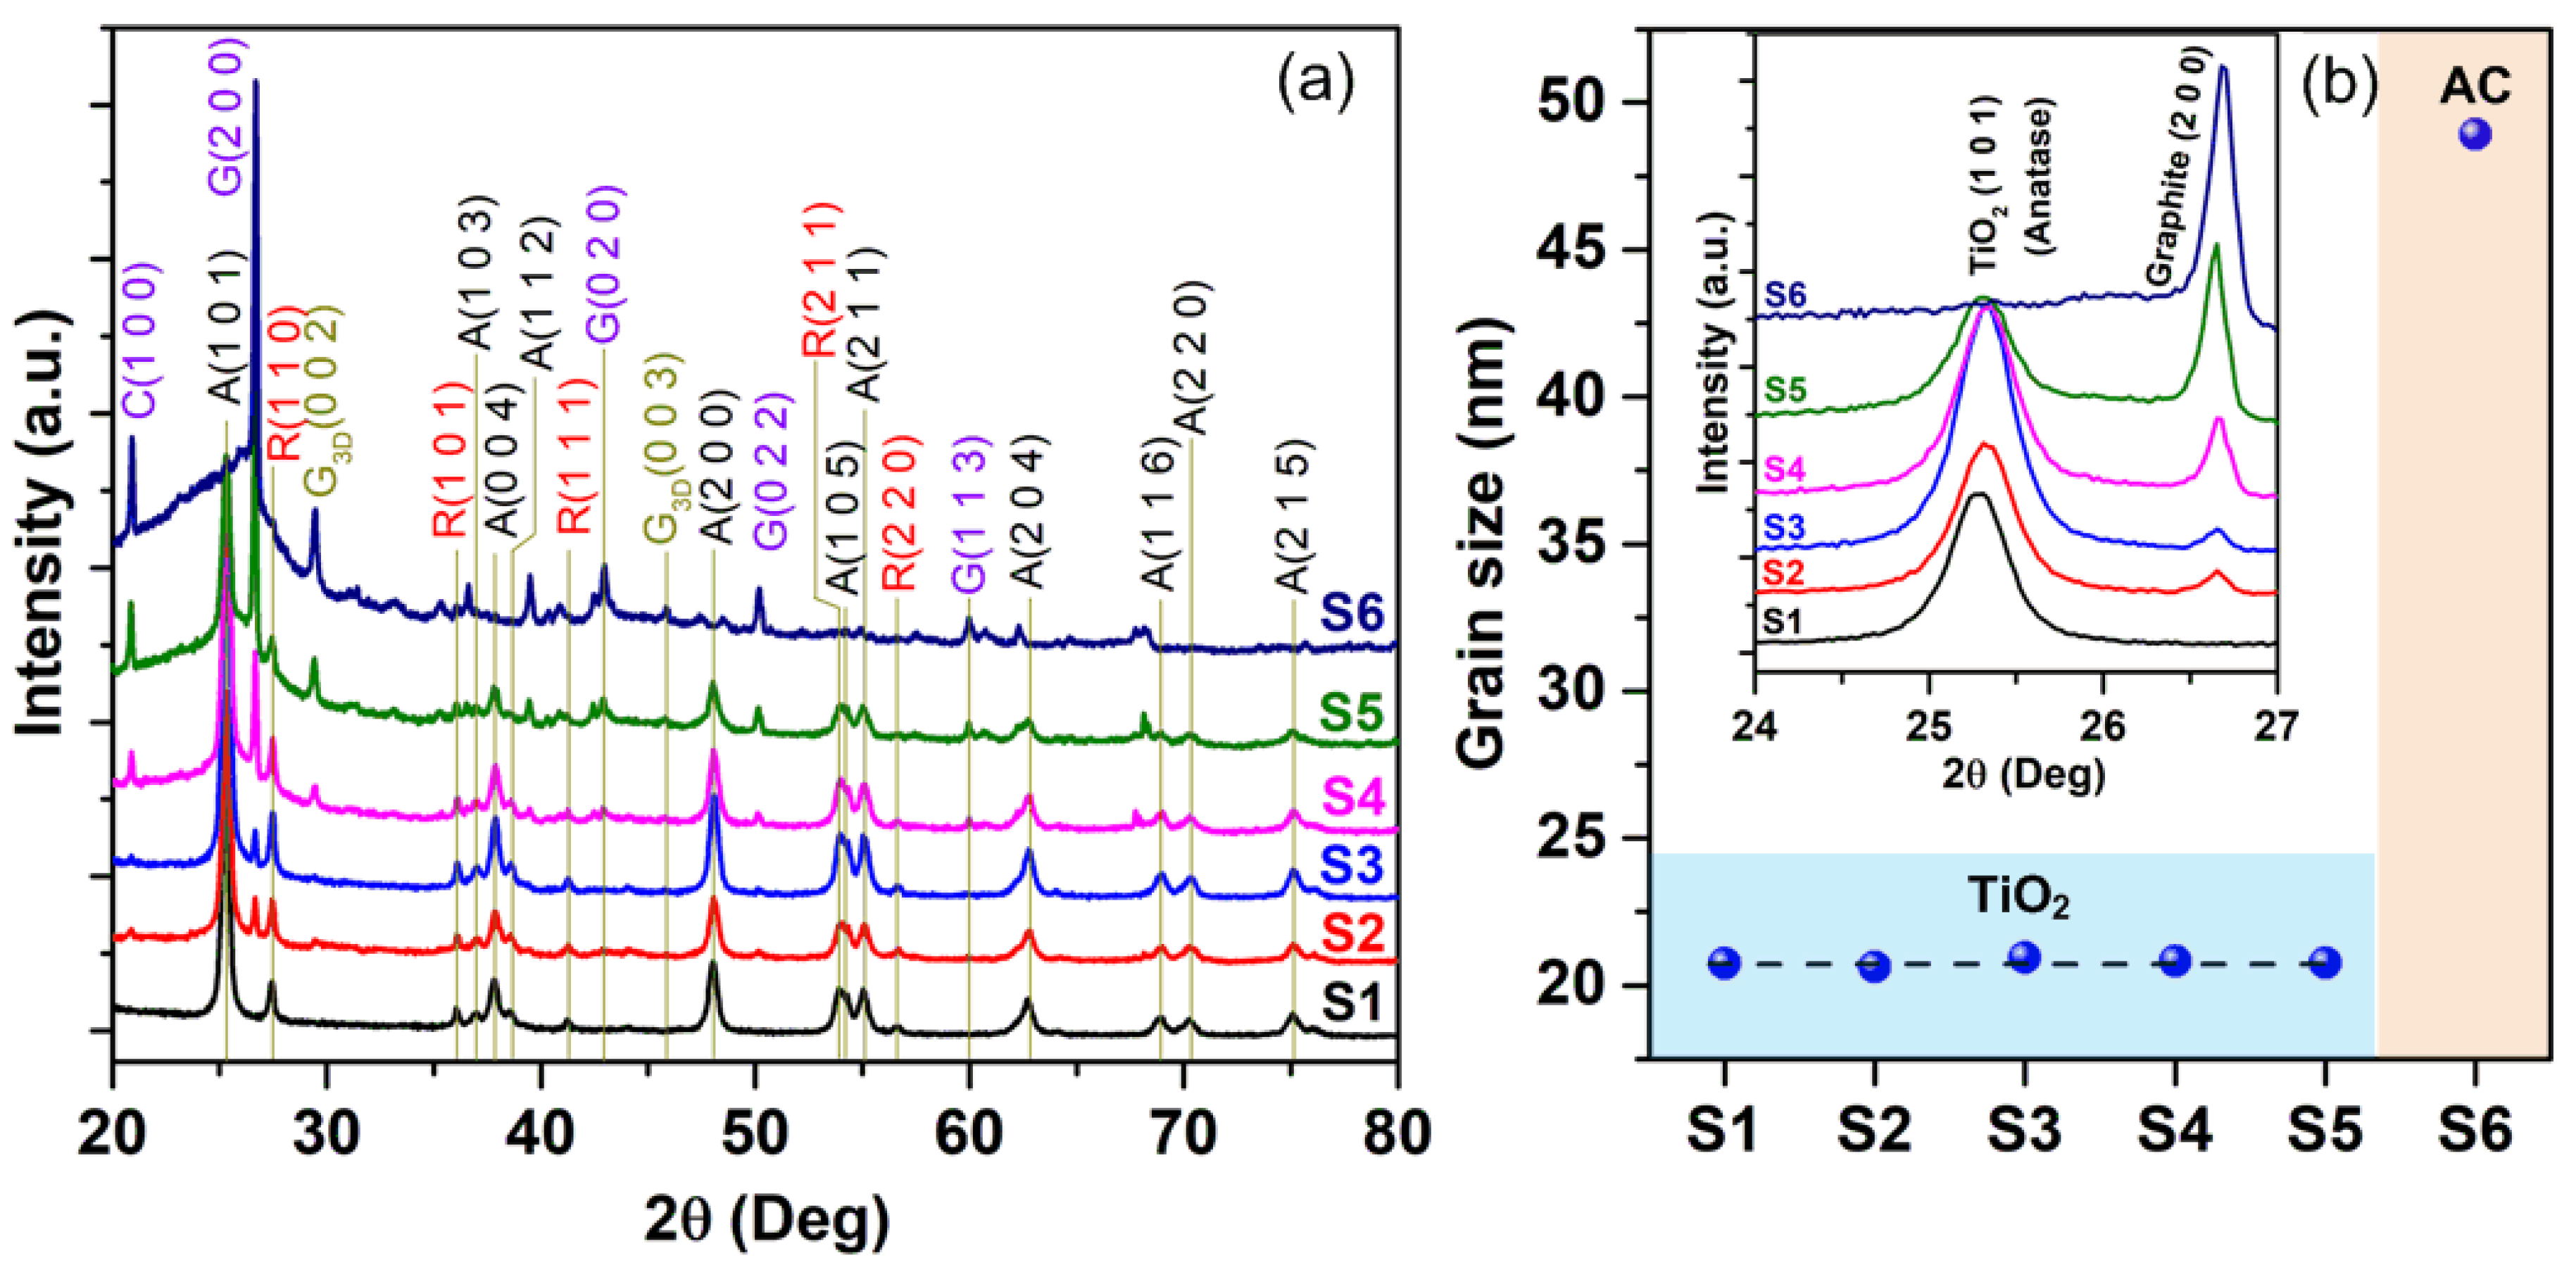
Figure 2a presents the XRD pattern of TiO2 P25 nanoparticles (S1), TiO2/AC composites prepared at various mass ratios (S2 – S5), and AC (S6). Generally, TiO2 had dominant anatase phase characterized by diffraction peaks of A(101) at 25.3°, A(004) at 37.9°, A(200) at 48.2°, A(204) at 62.8°, and minor rutile phase with the observed peaks of R(110) at 27.5° and R(211) at 54.1°. Meanwhile, the AC exhibited the diffraction peaks of graphite [e.g., G(002) at 26.6°, G(020) at 45.5°], carbon C(100) at 20.9°, and 3D carbon structures with peaks G3D(002) at 30.0°. The intensity of TiO2 and AC peaks varied reasonably with the evolution of TiO2/AC content (see Figure 2a). The dominant anatase phase over the rutile one for TiO2 Degussa P25 in this study is consistent well with results reported in ref. [30].
The crystallite size (D) in TiO2 P25 and AC were estimated using the Scherrer equation and TiO2 (101) and G(200) peaks, respectively. The Scherrer equation is given as, D = 0.9λ/βcosθ, where λ, β, and θ are the X-ray wavelength, full width at half maximum of the diffraction peak, and Bragg diffraction angle, respectively [19,21,31]. The D value for TiO2 P25 in S1–S5 samples was a range of 20.6 – 21.0 nm, while the D of AC was 48.9 nm. The D of TiO2 in this study is comparable with that of pristine TiO2 synthesized by the sol-gel method (D = 17.5 nm), smaller than the D values of 43.4 – 109.0nm for the TiO2 annealed thermally at 200 – 500°C for 120 min [26]. Noticeably, the crystallite size (48.9 nm) for the present AC is very close to the D of 50 nm for the commercial AC used in ref. [26].
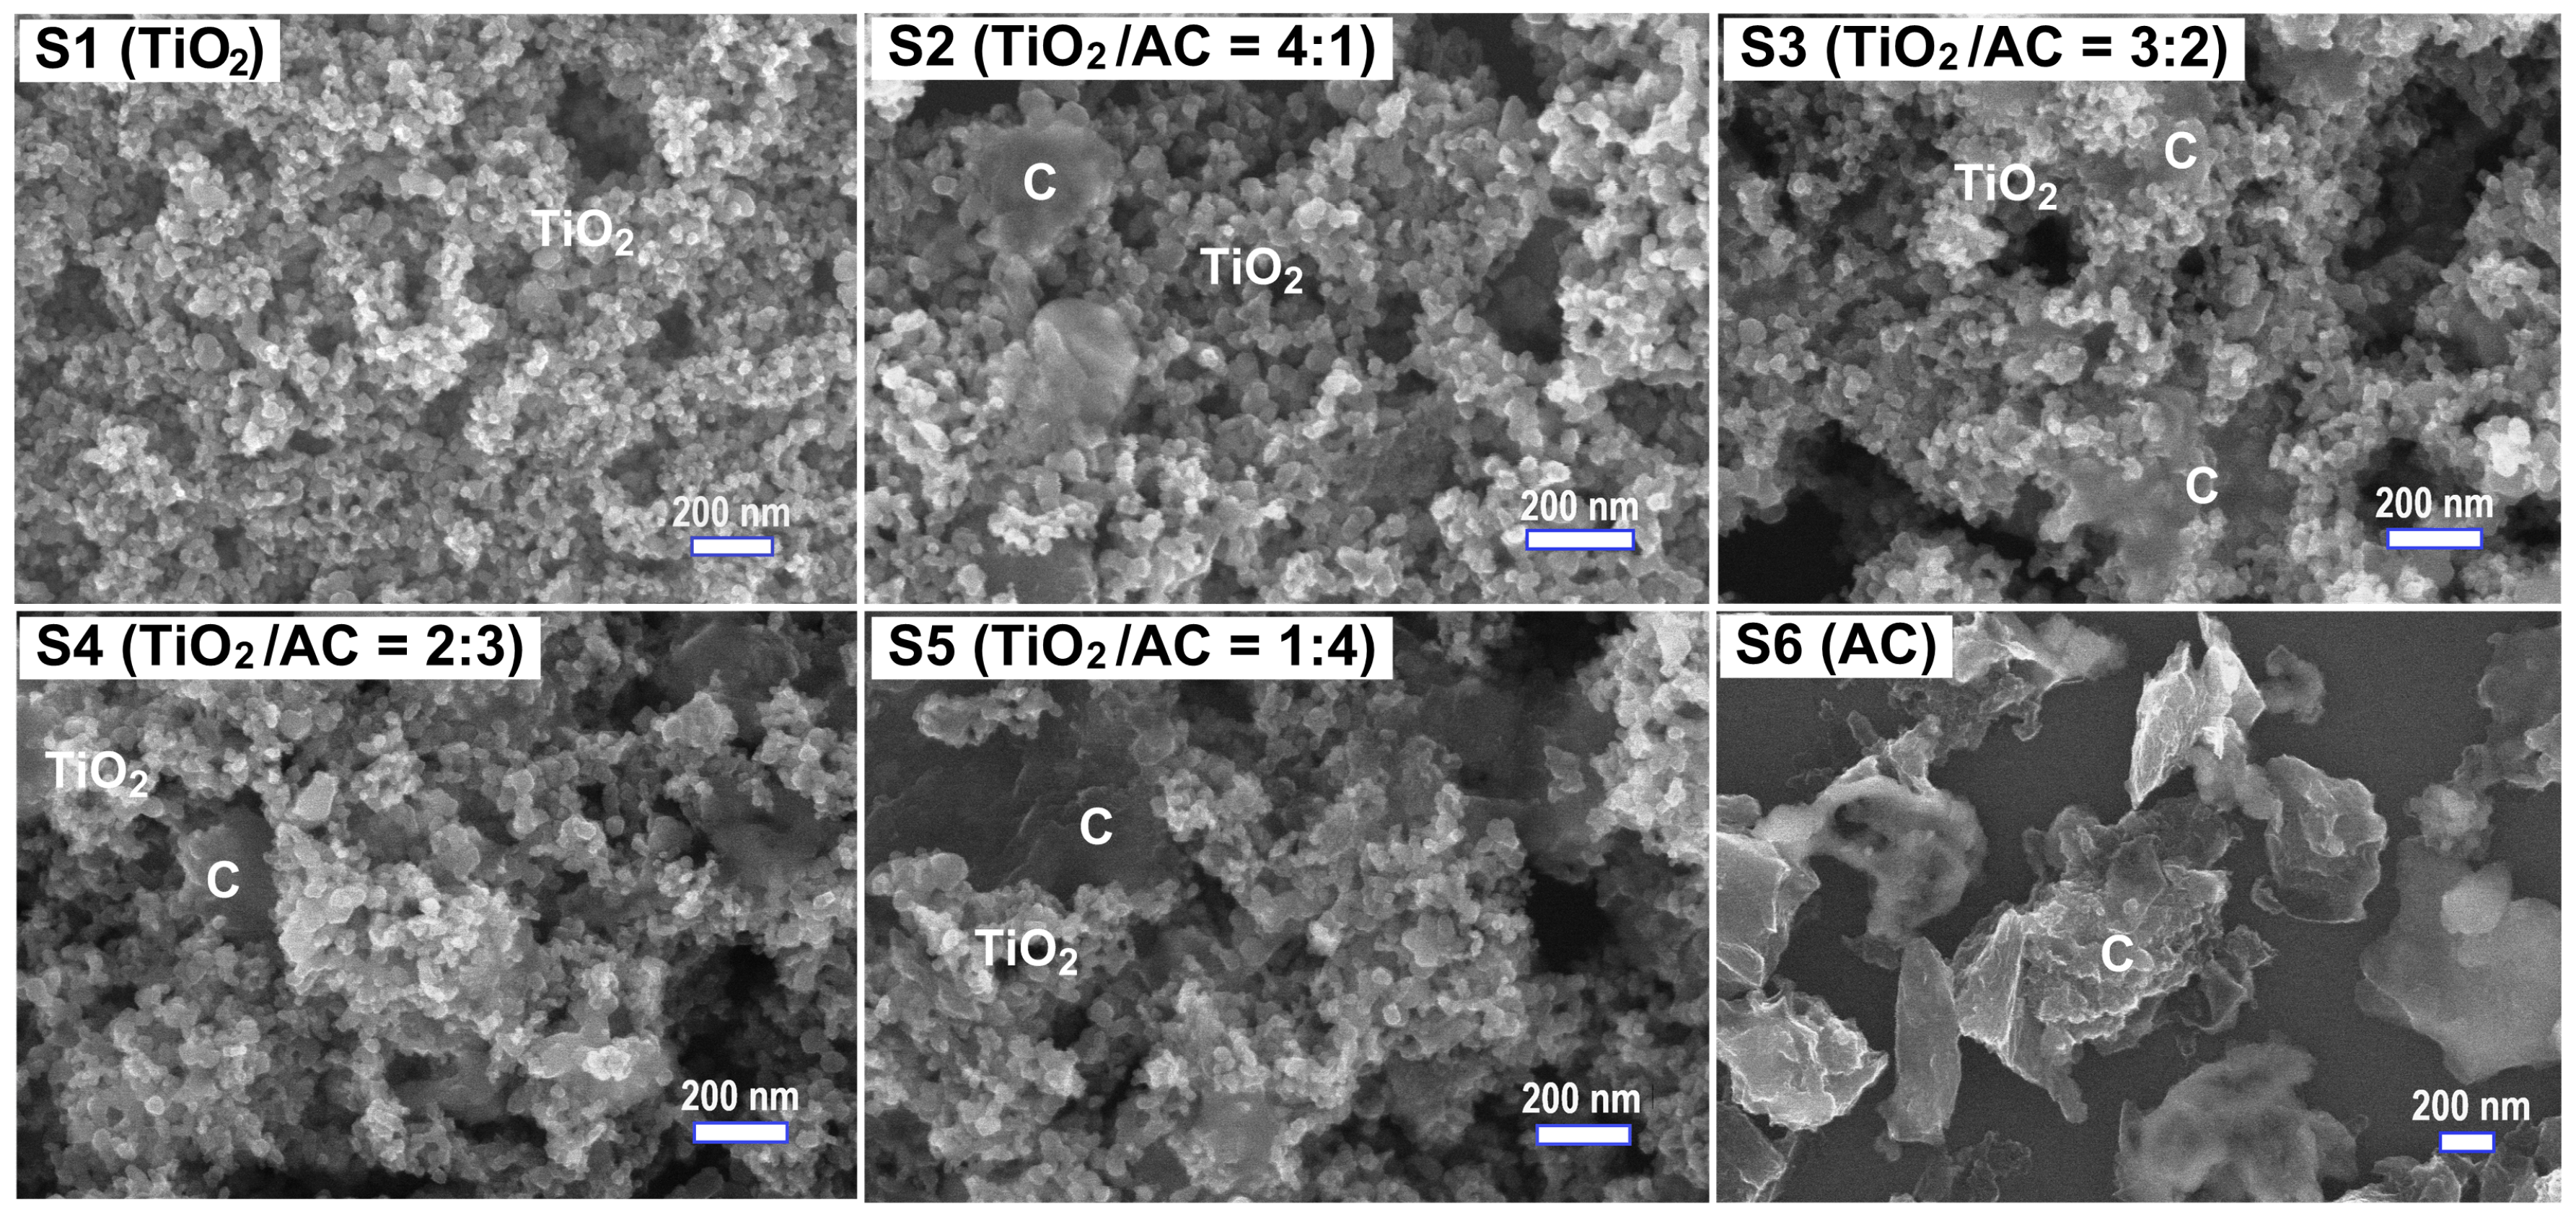
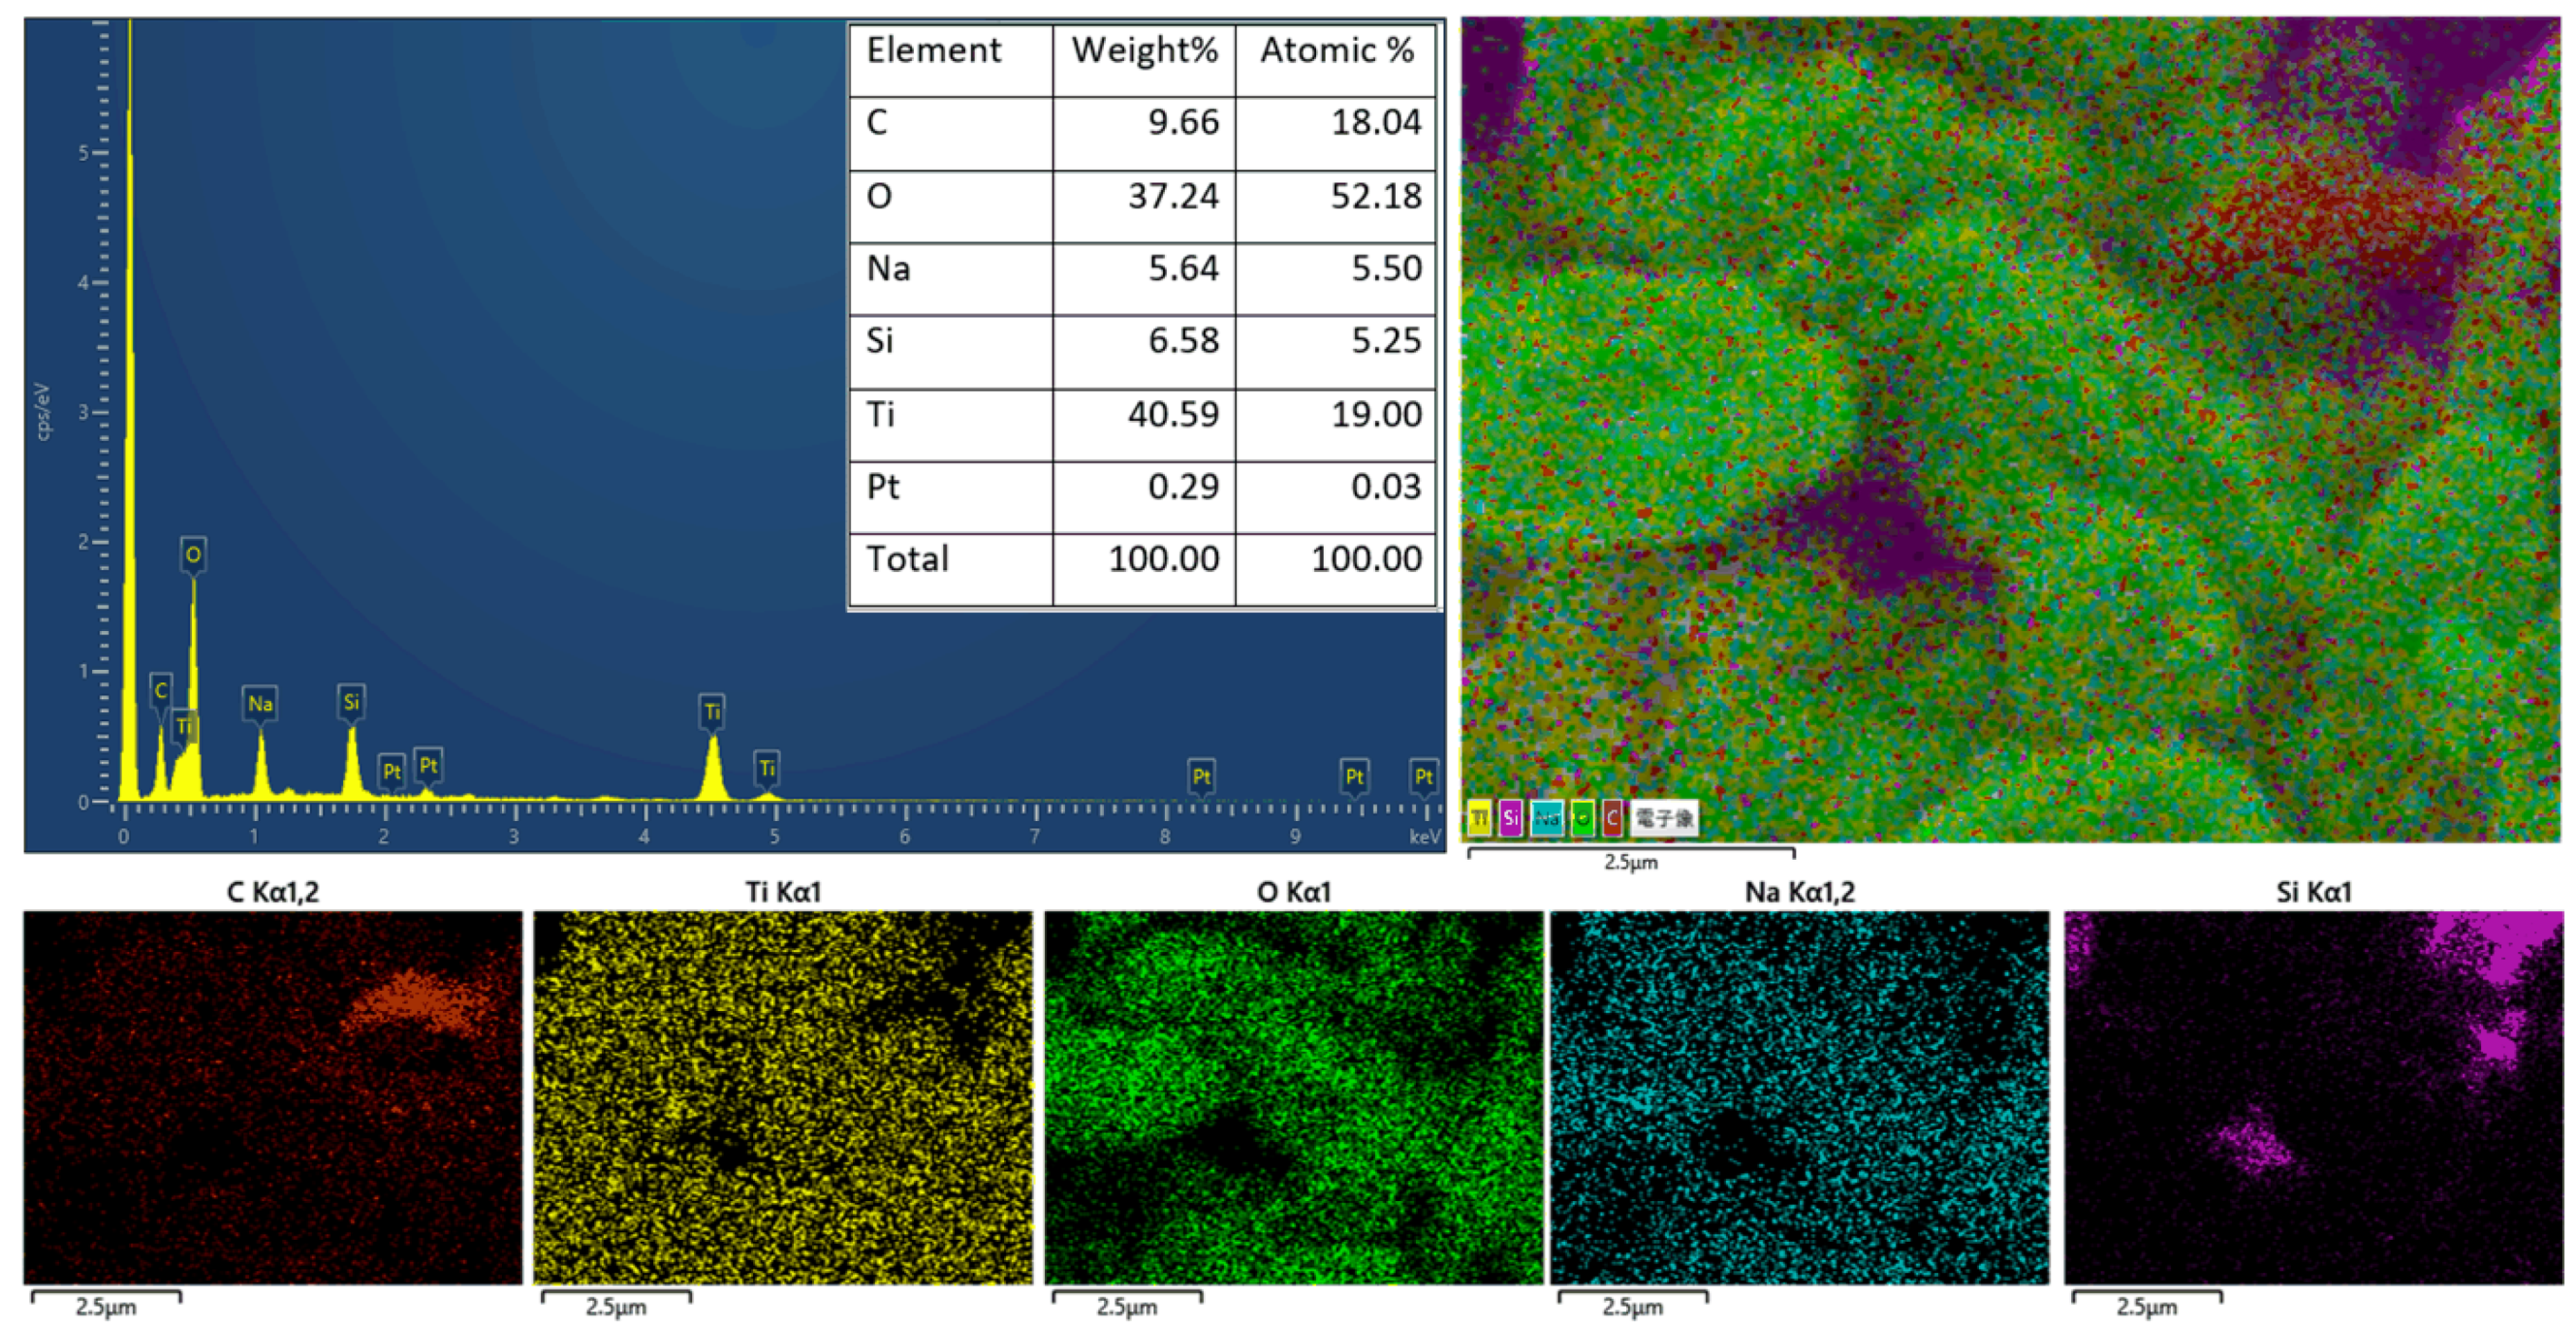
Figure 3 shows the surface morphology of the studied materials. TiO2 P25 exhibited uniform spherical nanoparticles (NPs) with a size of 25 – 35 nm, while AC was micron- and sub-micron particles. For TiO2/AC composites, TiO2 nanoparticles were well dispersed and decorated tightly on AC particles (Figure 3). The SEM images also reflect the contents of TiO2 and AC in the composites, e.g., TiO2 content decreases while AC content increases when we observe the SEM images from S2 to S5 (Figure 3). The elemental composition and distribution were illustrated by the EDS result (S4) in Figure 4. This composite has 18.04 at.% C, 52.18 at.% O, 19.00 at.% Ti, which indicates a composition of AC/TiO2. Notably, small contents of Na (5.5 at.%), Si (5.25 at.%), and Pt (0.03 at.%) were observed due to the remaining after the surface activation process for P25 using NaOH 5 M, the Si substrate, and Pt coating for taking SEM images, respectively. In addition, the EDS mapping in Figure 4 suggests a uniform elemental distribution, uniform decoration of TiO2 on AC, and possibly loading of TiO2 NPs inside the micro-pores and micro-channels of AC. The SEM and EDS results indicate the tight binding between TiO2 and AC that should support the carrier transport for enhancing photocatalytic activity.
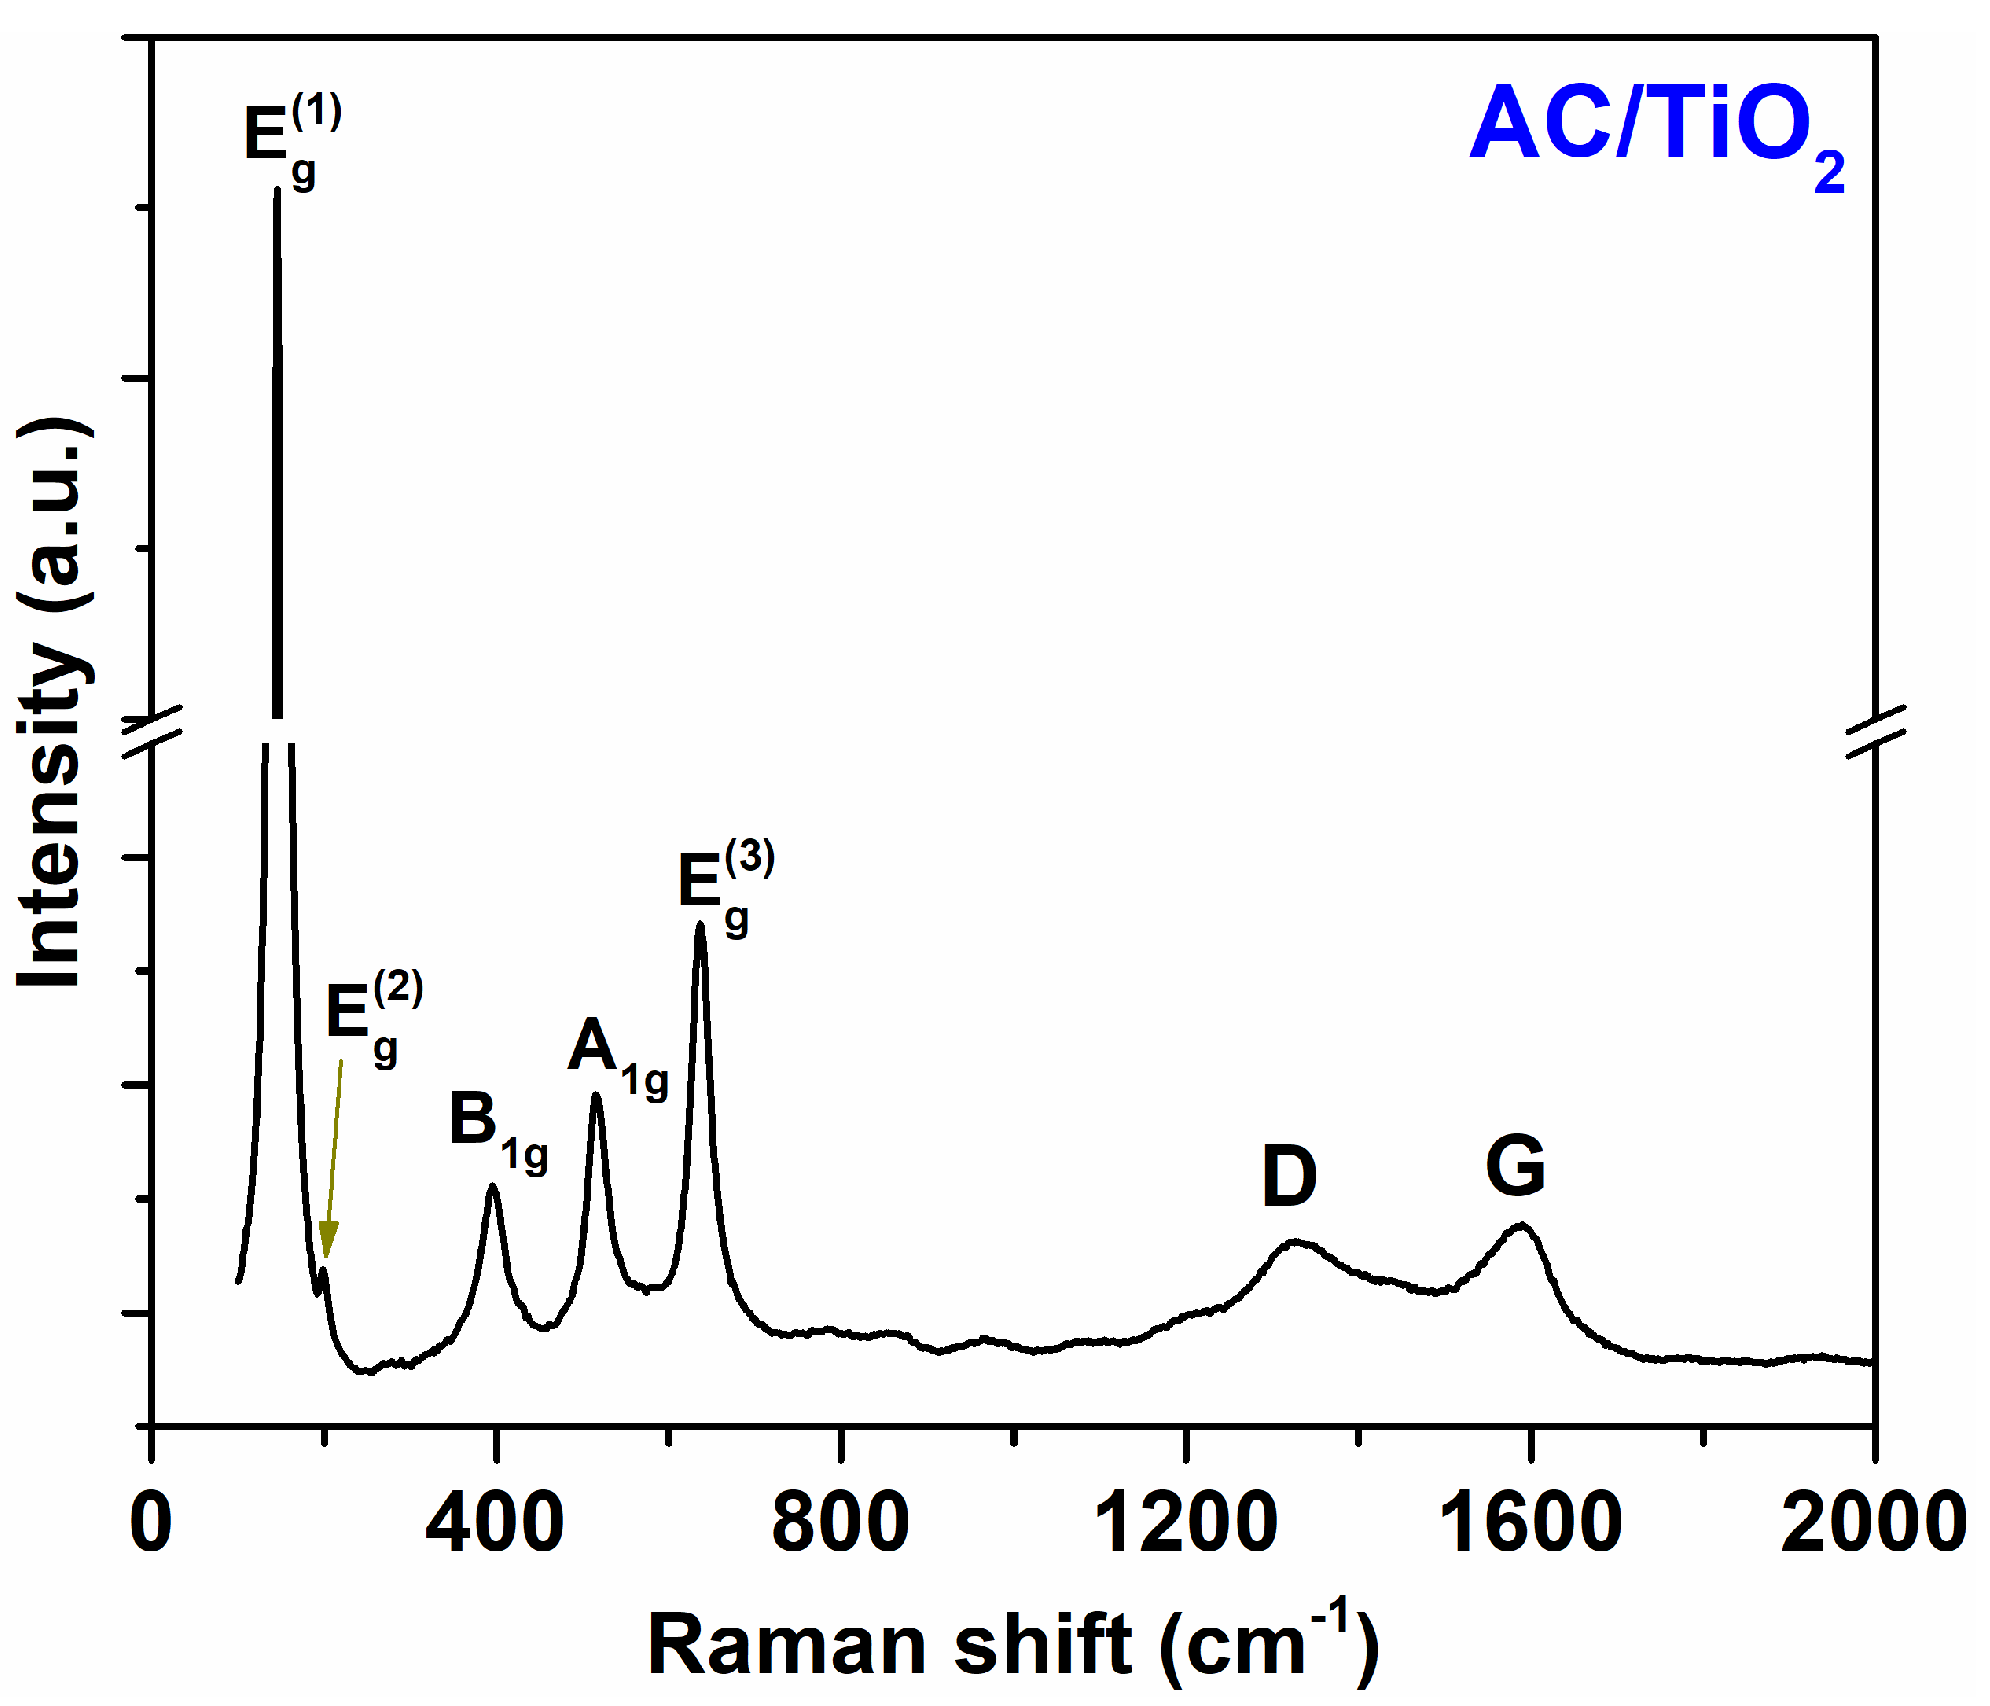
To gain insight into the crystalline structure of TiO2/AC composites, a typical Raman spectrum of TiO2/AC was examined. In Figure 5, the spectrum exhibited characteristic peaks of TiO2 predominant anatase phase at 146 cm-1 (Eg(1)), 200 cm-1 (Eg(2)), 396 cm-1 (B1g), 516 cm-1 (A1g), and 635 cm-1 (Eg) as well as two graphite carbon peaks at 1327 cm-1 (D-band) and 1588 cm-1 (G-band) (Figure 5). The D-band is associated with asymmetric lattices and bond-angle disorders in graphitic structures [25], while G-band comes from the doubly-degenerate iTO and LO phonon with E2g symmetry at the Brillouin zone center [32]. This Raman results for TiO2/AC agreed well with the Raman results for the TiO2/AC in ref. [25].
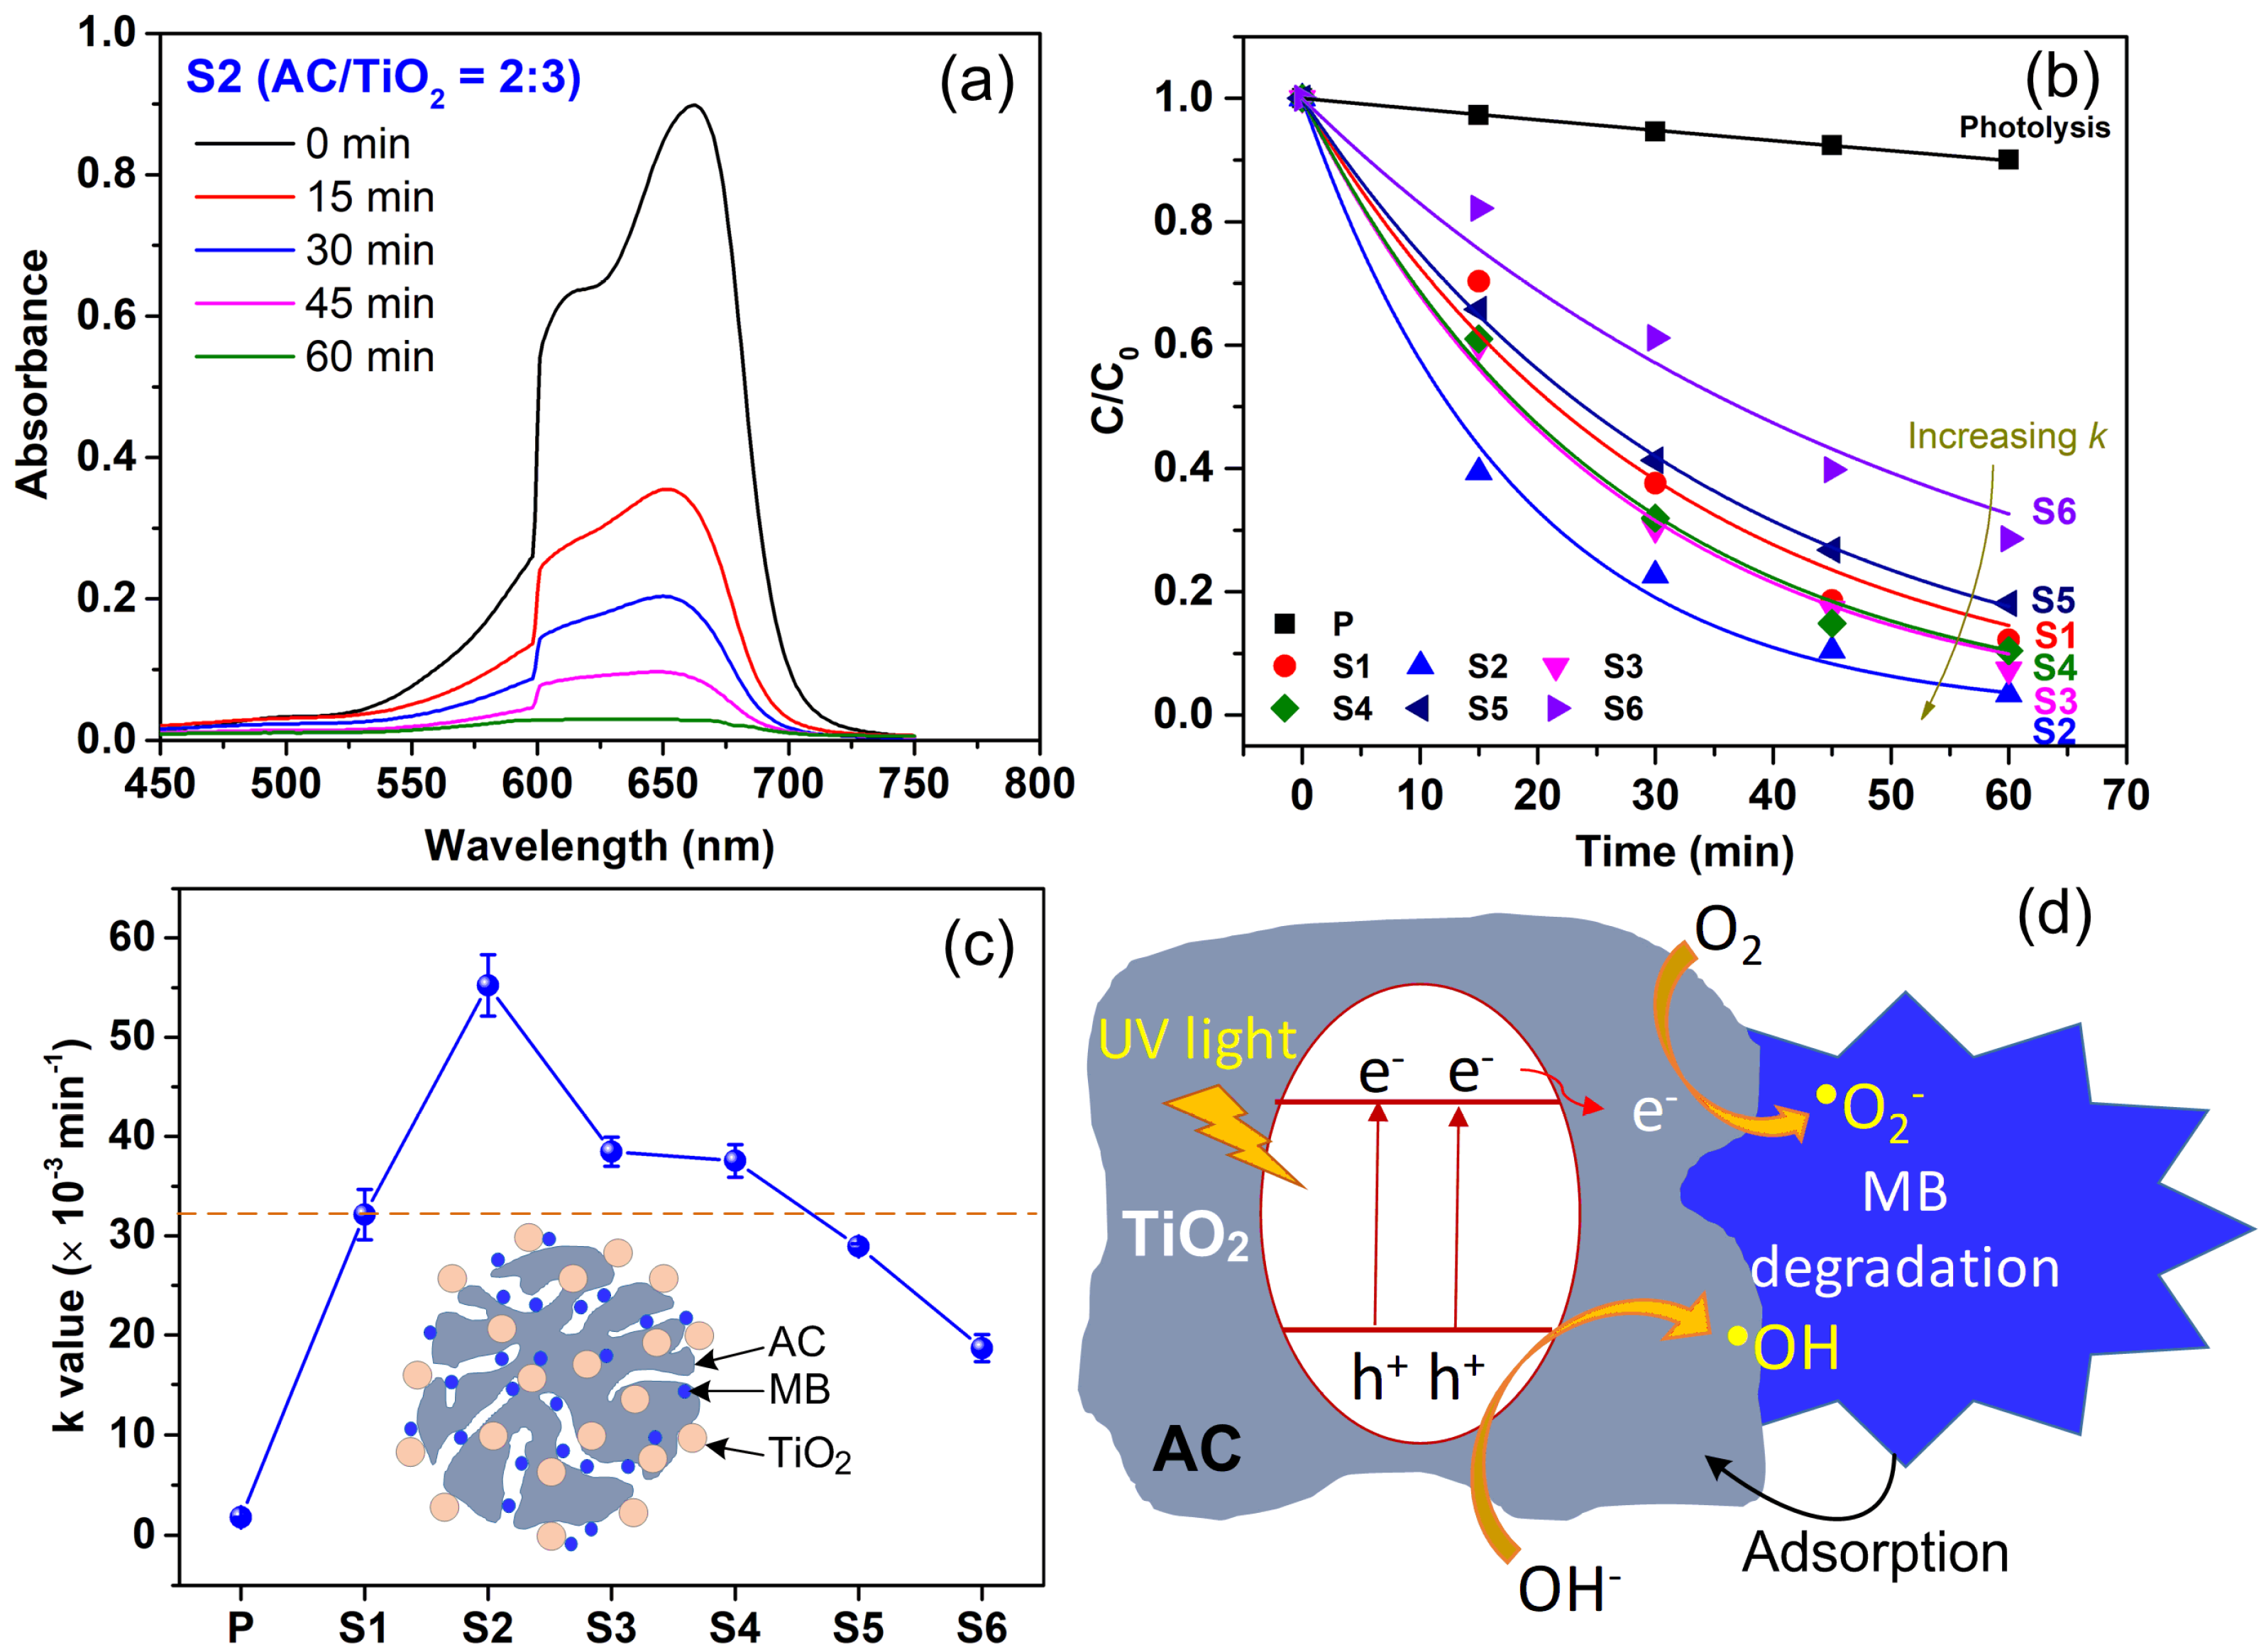
The photocatalytic activities of TiO2, AC, and TiO2/AC with different mixing mass ratios were studied by monitoring the photodegradation kinetics of MB (an organic substance, and popular use as an organic pollutant model) under UV-Vis irradiation (120 mW/cm2). Figure 6a shows the evolution of the MB absorption peak (at ~655 nm) over the photocatalytic reaction time (t) using the TiO2/AC (S2). The peak intensity (associated with MB concentration) decreased with t, and this behavior is true for the other photocatalysts in this study (S1, S3, S4, S5, S6). The photodegradation kinetics by photolysis and photocatalytic processes using the materials are shown in Figure 6b, which obeys the Langmuir–Hinshelwood kinetic model with the first-order reaction rate constant (k), Ct = Co×e-kt, where Ct is the concentration of MB at time t (mg/L), Co is the initial MB concentration (mg/L).
The solid lines in Figure 6b are the fitting curves using the kinetic model. The fittings yield the k values of the photolysis (P) and photocatalytic processes using the S1–S6 materials (see Figure 6c). The k of the photolysis reaction was a small value of 1.8×10⁻³min-1, while the k values were 32.1×10⁻³ min-1 (S1), 55.2×10⁻³ min-1 (S2), 38.5×10⁻³ min-1 (S3), 37.5×10⁻³ min-1 (S4), 28.9×10⁻³ min-1 (S5), 18.7×10⁻³ min-1 (S6). This indicates that MB degradation is much faster and more effective by using the photocatalysts as compared to the photolysis process. In addition, the composites of TiO2/AC (S2, S3, S4) exhibited an enhancement in the photocatalyst activity over either the pristine TiO2 (S1) or AC (S6). Among the investigated TiO2/AC composites with various mass mixing ratios (S2 – S5), the S2 possessed the highest photocatalyst activity, suggesting that TiO2/AC = 4:1 is the optimal mass mixing ratio between TiO2 P25 and micron- and sub-micron AC. Further increased AC and decreased TiO2 contents to TiO2/AC = 3:2 and TiO2/AC = 2:3 also exhibited higher photocatalytic activities than that for TiO2. Meanwhile, the sufficient low TiO2 and high AC contents for the TiO2/AC = 1:4 (S5) lead to the decrease of activity as compared to pristine TiO2 (see the dashed line in Figure 6c). Noticeably, the observed decrease in MB concentration over t for AC (S6) material is attributed to the excellent adsorption characteristic of porous carbon materials (Figure 6c inset) [27,33,34].
AC/TiO2 composites with mass mixing ratios of (4:1), (3:2), and (2:3) have higher MB removal performance than either TiO2 or AC, which is attributed to the synergistic effect of the high adsorption capability of AC and the high photocatalytic activity of TiO2. As illustrated in Figure 6d, under UV-VIS irradiation, electron/hole (e-/h+) pairs are generated, which lead subsequently to oxidation and reduction reactions in the treated solution to generate highly active free radicals, primarily OH and O2 ⁻ (Figure 6d) [27,33,34], which in turn degrade MB dye. It is well-known that the recombination rate of e-/h+ in TiO2 is fast. Meanwhile, in TiO2/AC composites, the photogenerated carriers can be transferred between TiO2 and AC, allowing to increase in e-/h+ separation and reducing the e-/h+ recombination rate, and consequently enhancing the photocatalytic activity. The AC (S6) removes MB with k of 18.7×10⁻³ min-1 (58.3% of k for TiO2), suggesting the AC has high adsorption capacity with many sufficient active adsorption sites and a large surface area [27,33,34]. The lower k value of S5 than S1 indicates that a composite with too little TiO2 and too much AC contents (TiO2/AC = 1:4 for the present case) will not give an enhancement of the photocatalytic activity. An advantage of a combination of a good photocatalyst with a good adsorption material (i.e., TiO2/AC) is that TiO2 degrades MB to create renewable active adsorption sites on the AC to adsorb more MB molecules as evidenced by the higher adsorption efficiency of pollutants near TiO2 positions on the composite surfaces [27,35]. Also, TiO2 plays the role of photocatalytic regeneration of AC, and this allows minimizing operational costs and product waste. The optimal TiO2/AC (S2) obtained a high MB removal efficiency of 96.6% after 60 min treatment at the initial MB concentration of 10 mg/L and a composite dosage of 333.3 mg/L. This efficiency is comparable to that for the TiO2/AC (i.e., 86.5%, 97.1%, and 99.4%, depending on the type of AC) under similar experimental conditions (i.e., reaction time of 60 min, UV light source, catalyst dosage of 400 mg/L, and MB initial concentration of 20 mg/L) [27].

4. Conclusions

In this study, TiO2/AC composites with various mass mixing ratios were prepared through a facile and cost-effective process. The composites exhibited tight decoration of TiO2 nanoparticles on micron-/submicron AC particles. TiO2 had crystal phases of dominant anatase and minor rutile, and the crystallite size of TiO2 was ~21 nm. Meanwhile, AC presented the XRD peaks of graphite and carbon, and it had a crystallite size of ~49 nm. TiO2/AC composites are reasonably composed of main elements (O, Ti, C). The EDS mapping confirmed the uniform distribution of elements, indicating the formation of uniform TiO2/AC composites. Among the TiO2/AC composites prepared at different mixing ratios of (4:1), (3:2), (2:3), (1:4), bare TiO2, and bare AC, the TiO2/AC = 4:1 possessed the highest photocatalytic activity in degradation of MB under UV-Vis irradiation, which yielded a high MB removal efficiency of 96.6% after 60 min treatment. The enhanced photocatalytic activity of TiO2/AC composites is attributed to the synergistic effect of the high adsorption capability of AC and the high photocatalytic activity of TiO2. In addition, TiO2/AC composites allow charge transfer for enhancing e-/h+ separation to reduce their recombination rate and enhance their photocatalytic activity. Thus, TiO2/AC composite with a weight ratio of 4/1 possibly be used for treating industrial or household wastewater with organic pollutants.

Author Contributions

P.H.L: Conceptualization, Methodology, Investigation, Writing – original draft, Project administration; S.R.J: Resources, Writing – Review & editing, Supervision; T.T.T.V, Q-T.T; V.V.T, D.H.H, N.C.T, L.T.X: Data curation, Investigation, Data Analysis, Writing – original draft; L.T.C.T, N.N.U: Data curation, Data analysis; N-V.T.N, N.T.T.T, T.T.K, Y-M.H: Resources, Review & editing.

Funding

This research is funded by Vietnam National Foundation for Science and Technology Development (NAFOSTED) under grant number 103.02-2019.374.

Acknowledgments

The authors would like to acknowledge Can Tho University of Medical and Pharmacy, Vietnam, and Ming Chi University of Technology, Taiwan for supporting the study.

Conflicts of Interest

The authors declare no conflicts of interest.

References

  1. Tkaczyk, A.; Mitrowska, K.; Posyniak, A. Synthetic organic dyes as contaminants of the aquatic environment and their implications for ecosystems: A review. Science of the Total Environment 2020, 717, 137222. [Google Scholar] [CrossRef]
  2. Houas, A.; Lachheb, H.; Ksibi, M.; Elaloui, E.; Guillard, C.; Herrmann, J.-M. Photocatalytic degradation pathway of methylene blue in water. Applied Catalysis B: Environmental 2001, 31, 145–157. [Google Scholar] [CrossRef]
  3. Thakur, M.; Pathania, D. Chapter 12 - Environmental fate of organic pollutants and effect on human health. Abatement of Environmental Pollutants: Trend and Strategies. Elsevier 2020, 245-262. [CrossRef]
  4. Hoffmann, M.R.; Martin, S.T.; Choi, W.; Bahnemann, D.W. Environmental Applications of Semiconductor Photocatalysis. Chem. Rev. 1995, 95, 69–96. [Google Scholar] [CrossRef]
  5. Asahi, R.; Morikawa, T.; Irie, H.; Ohwaki, T. Nitrogen-Doped Titanium Dioxide as Visible-Light-Sensitive Photocatalyst: Designs, Developments, and Prospects. Chem. Rev. 2014, 114, 9824–9852. [Google Scholar] [CrossRef]
  6. Mazivila, S.J.; Ricardo, I.A.; Leitão, J.M.M.; Esteves da Silva, J.C.G. A review on advanced oxidation processes: From classical to new perspectives coupled to two- and multi-way calibration strategies to monitor degradation of contaminants in environmental samples. Trends in Environmental Analytical Chemistry 2019, 24, e00072. [Google Scholar] [CrossRef]
  7. Jiang, X.; Manawan, M.; Feng, T.; Qian, R.; Zhao, T.; Zhou, G.; Kong, F.; Wang, Q.; Dai, S.; Pan, J.H. Anatase and rutile in evonik aeroxide P25: Heterojunctioned or individual nanoparticles? Catalysis Today 2018, 300, 12–17. [Google Scholar] [CrossRef]
  8. Yen, Y.C.; Chen, J.A.; Ou, S.; Chen, Y.S.; Lin, K.J. Plasmon-Enhanced Photocurrent Using Gold Nanoparticles on a Three-Dimensional TiO2 Nanowire-Web Electrode. Scientific Reports 2017, 7, 1–8. [Google Scholar] [CrossRef] [PubMed]
  9. Zheng, Y.-Z.; Xu, Y.-Y.; Fang, H.-B.; Wang, Y.; Tao, X. Au nanoparticle homogeneously decorated C@TiO2 for enhanced visible-light-driven photocatalytic activity. RSC Adv. 2015, 5, 103790–103796. [Google Scholar] [CrossRef]
  10. Ozawa, K.; Emori, M.; Yamamoto, S.; Yukawa, R.; Yamamoto, S.; Hobara, R.; Fujikawa, K.; Sakama, H.; Matsuda, I. Electron − Hole Recombination Time at TiO2 Single-Crystal Surfaces: Influence of Surface Band Bending. J. Phys. Chem. Lett. 2014, 5, 1953–1957. [Google Scholar] [CrossRef] [PubMed]
  11. Shourong, Z.; Qingguo, H.; Jun, Z.; Bingkun, W. A study on dye photoremoval in TiO2 suspension solution. Journal of Photochemistry and Photobiology A: Chemistry 1997, 108, 235–238. [Google Scholar] [CrossRef]
  12. Leyva, E.; Montalvo, C.; Moctezuma, E.; Leyva, S. Photocatalytic degradation of pyridine in water solution using ZnO as an alternative catalyst to TiO2. Journal of Ceramic Processing Research 2008, 9, 455–462. [Google Scholar]
  13. Hu, L.; Flanders, P.M.; Miller, P.L.; Strathmann, T.J. Oxidation of Sulfamethoxazole and Related Antimicrobial Agents by TiO2 Photocatalysis. Water Research 2007, 41, 2612–2626. [Google Scholar] [CrossRef]
  14. Hapeshi, E.; Achilleos, A.; Vasquez, M.I.; Michael, C.; Xekoukoulotakis, N.P.; Mantzavinos, D.; Kassinos, D. Drugs degrading photocatalytically: Kinetics and mechanisms of ofloxacin and atenolol removal on titania suspensions. Water Research 2010, 44, 1737–1746. [Google Scholar] [CrossRef]
  15. Westerhoff, P.; Song, G.; Hristovski, K.; Kiser, M.A. Occurrence and removal of titanium at full scale wastewater treatment plants: implications for TiO2 nanomaterials. J. Environ. Monit. 2011, 13, 1195–1203. [Google Scholar] [CrossRef] [PubMed]
  16. Roy, P.; Berger, S.; Schmuki, P. TiO2 Nanotubes: Synthesis and Applications. Angew. Chem. Int. Ed. 2011, 50, 2904–2939. [Google Scholar] [CrossRef] [PubMed]
  17. Hsu, M.-Y.; Hsu, H.-L.; Leu, J. TiO2 Nanowires on Anodic TiO2 Nanotube Arrays (TNWs/TNAs): Formation Mechanism and Photocatalytic Performance. Journal of The Electrochemical Society 2012, 159, H722–H727. [Google Scholar] [CrossRef]
  18. Do, T.C.M.V.; Nguyen, D.Q.; Nguyen, K.T.; Le, P.H. TiO2 and Au-TiO2 Nanomaterials for Rapid Photocatalytic Degradation of Antibiotic Residues in Aquaculture Wastewater. Materials 2019, 12, 2434. [Google Scholar] [CrossRef] [PubMed]
  19. Uyen, N.N.; Tuyen, L.T.C.; Hieu, L.T.; Nguyen, T.T.T.; Thao, H.P.; Do, T.C.MV.; Nguyen, K.T.; Hang, N.T.N.; Jian, S.-R.; Tu, L.A.; Le, P.H.; Luo, C.W. TiO2 Nanowires on TiO2 Nanotubes Arrays (TNWs/TNAs) Decorated with Au Nanoparticles and Au Nanorods for Efficient Photoelectrochemical Water Splitting and Photocatalytic Degradation of Methylene Blue. Coatings, 2022, 12, 1957. [CrossRef]
  20. Jampawal, J.; Supothina, S.; Chuaybamroong, P. Solar photocatalytic degradation of carbaryl in water using TiO2-coated filters with different binders and effect of the operating conditions. Environmental Science and Pollution Research 2022, 29, 88027–88040. [Google Scholar] [CrossRef]
  21. Gloria, D.C.S.; Brito, C.H.V.; Mendonça, T.A.P.; Brazil, T.R.; Domingues, R.A.; Vieira, N.C.S.; Santos, E.B.; Gonçalves, M. Preparation of TiO2/activated carbon nanomaterials with enhanced photocatalytic activity in paracetamol degradation. Materials Chemistry and Physics 2023, 305, 127947. [Google Scholar] [CrossRef]
  22. Asencios, Y.J.O.; Lourenço, V.S.; Carvalho, W.A. Removal of phenol in seawater by heterogeneous photocatalysis using activated carbon materials modified with TiO2. Catalysis Today 2022, 389-389, 247–258. [Google Scholar] [CrossRef]
  23. Li, Y.; Li, X.; Li, J.; Yin, J. Photocatalytic degradation ofmethyl orange by TiO2-coated activated carbon and kinetic study. Water Research 2006, 40, 1119–1126. [Google Scholar] [CrossRef]
  24. Ao, W.; Qu, J.; Yu, H.; Liu, Y.; Liu, C.; Fu, J.; Dai, J.; Bi, X.; Yuan, Y.; Jin, Y. TiO2/activated carbon synthesized by microwave-assisted heating for tetracycline photodegradation. Environmental Research 2022, 214, 113837. [Google Scholar] [CrossRef]
  25. Liu, W.; Wang, B.; Zhang, M. Effect of Process Parameters on the Microstructure and Performance of TiO2-Loaded Activated Carbon. ACS Omega 2021, 6, 35076–35092. [Google Scholar] [CrossRef]
  26. Arutanti, O.; Sari, A.L.; Kartikowati, C.W.; Sari, A.A.; Arif, A.F. Design and Application of Homogeneous-structured TiO2/Activated Carbon Nanocomposite for Adsorption–Photocatalytic Degradation of MO. Water Air Soil Pollut 2022, 233, 118. [Google Scholar] [CrossRef]
  27. Xu, W.; Jin, Y.; Ren, Y.; Li, J.; Wei, Z.; Ban, C.; Cai, H.; Chen, M. Synergy mechanism for TiO2 /activated carbon composite material: Photocatalytic degradation of methylene blue solution. Can J Chem Eng 2021, 1–15. [Google Scholar] [CrossRef]
  28. Asiltürk, M.; Sener, S. TiO2-activated carbon photocatalysts: Preparation, characterization and photocatalytic activities. Chemical Engineering Journal 2012, 180, 354–363. [Google Scholar] [CrossRef]
  29. Verma, C.; Quraishi, M.A. Activated Carbon: Progress and Applications. The Royal Society of Chemistry 2023, 1–450. [Google Scholar] [CrossRef]
  30. Mountassir, E.M.E.; Daou, C.; Rafqah, S.; Najjar, F.; Anane, H.; Piram, A.; Hamade, A.; Briche, S.; Wong-wah-chung, P. TiO2 and activated carbon of Argania Spinosa tree nutshells composites for the adsorption photocatalysis removal of pharmaceuticals from aqueous solution. Journal of Photochemistry & Photobiology A: Chemistry 2020, 338, 112183. [Google Scholar] [CrossRef]
  31. Tuyen, L.T.C.; Jian, S.R.; Tien, N.T.; Le, P.H. Nanomechanical and Material Properties of Fluorine-Doped Tin Oxide Thin Films Prepared By Ultrasonic Spray Pyrolysis: Effects of F-doping. Materials 2019, 12, 1665. [Google Scholar] [CrossRef] [PubMed]
  32. Li, Z.; Deng, L.; Kinloch, I.A.; Young, R.J. Raman Spectroscopy of Carbon Materials and Their Composites: Graphene, Nanotubes and Fibres. Progress in Materials Science 2023, 135, 101089. [Google Scholar] [CrossRef]
  33. Sathishkumar, K.; Sowmiya, K.; Pragasan, L.A.; Rajagopal, R.; Sathya, R.; Ragupathy, S.; Krishnakumar, M.; Reddy, V.R.M. Enhanced photocatalytic degradation of organic pollutants by Ag–TiO2 loaded cassava stem activated carbon under sunlight irradiation. Chemosphere 2022, 302, 134844. [Google Scholar] [CrossRef] [PubMed]
  34. Sun, Z.; He, X.; Du, J.; Gong, W. Synergistic effect of photocatalysis and adsorption of nano-TiO2 self-assembled onto sulfanyl/activated carbon composite. Environ Sci Pollut Res 2016, 23, 21733–21740. [Google Scholar] [CrossRef] [PubMed]
  35. Cunha, D.L.; Kuznetsov, A.; Araujo, J.R.; Neves, R.S.; Archanjo, B.S.; Canela, M.C.; Marques, M. Optimization of Benzodiazepine Drugs Removal from Water by Heterogeneous Photocatalysis Using TiO2/ Activated Carbon Composite. Water Air Soil Pollut 2019, 230, 141. [Google Scholar] [CrossRef]
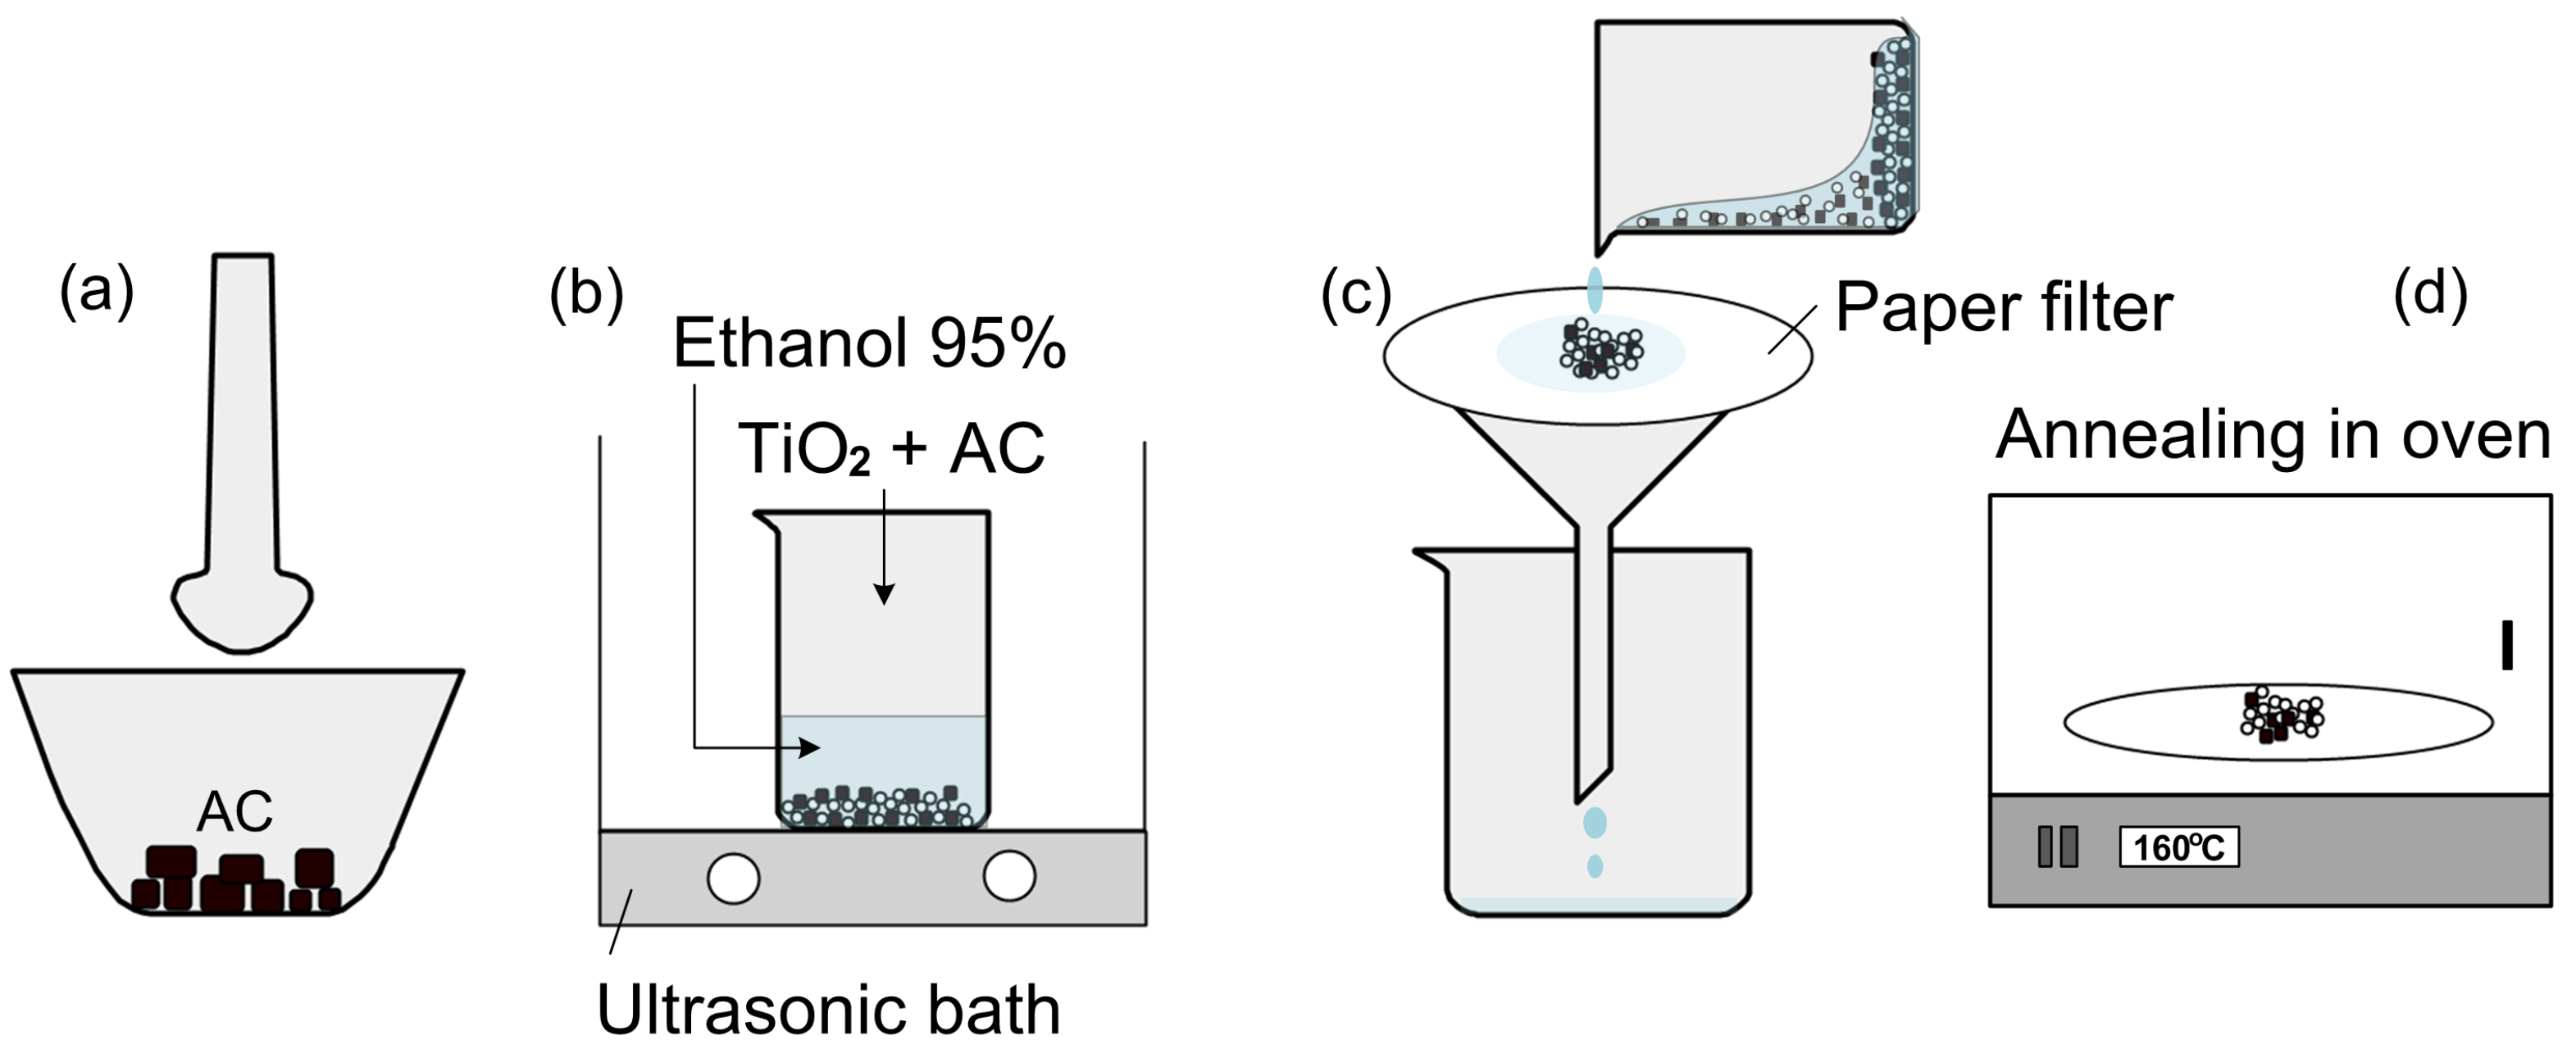
Figure 1. TiO2/AC preparation process.
Preprints 99625 g001
Figure 2. (a) X-ray diffraction patterns of TiO2, TiO2/AC composites, and AC. The symbol C (hkl) is the spectral peak of carbon (IMCSD #0013020); the symbol G (hkl) and G3D (hkl) are the peaks of graphite (IMCSD #0000049) and graphite 3D structures (IMCSD #0013980), respectively; A (hkl) and R (hkl) indicate the patterns of TiO2 anatase and TiO2 rutile phases, respectively. (b) The crystallite size of the materials; the inset is the zoom-in-view of high-intensity characteristic peaks for TiO2 and AC.
Preprints 99625 g002
Figure 3. Scanning electron microscopy (SEM) images of TiO2 P25 (S1), TiO2/activated carbon (AC) composites prepared at various mass ratios (S2-S5), and AC (S6).
Preprints 99625 g003
Figure 4. An EDS spectrum of a TiO2/AC prepared by dropping a DI water solution containing S4 powder on a clean Si substrate; and an EDS mapping of the S4 powder sample.
Preprints 99625 g004
Figure 5. A typical Raman spectrum of AC/TiO2.
Preprints 99625 g005
Figure 6. (a) Typical photodegradation of methylene blue (MB) using AC/TiO2 materials (e.g., S2 sample case). (b) Photocatalytic degradation of MB by AC/TiO2 materials prepared at various mass ratios under the UV-Vis irradiation of Xenon lamp (120 mW/cm2). (c) The pseudo-first-order kinetics constant k of photolysis (P) and photocatalytic reaction using AC/TiO2 (S1 – S6); Inset in (c) shows a schematic of porous AC/TiO2 in MB solution. (d) A schematic diagram for the photocatalytic degradation mechanism of MB using AC/TiO2 composite.
Preprints 99625 g006
Disclaimer/Publisher’s Note: The statements, opinions and data contained in all publications are solely those of the individual author(s) and contributor(s) and not of MDPI and/or the editor(s). MDPI and/or the editor(s) disclaim responsibility for any injury to people or property resulting from any ideas, methods, instructions or products referred to in the content.
Copyright: This open access article is published under a Creative Commons CC BY 4.0 license, which permit the free download, distribution, and reuse, provided that the author and preprint are cited in any reuse.
Prerpints.org logo

Preprints.org is a free preprint server supported by MDPI in Basel, Switzerland.

Subscribe

© 2024 MDPI (Basel, Switzerland) unless otherwise stated