Submitted:
21 February 2024
Posted:
23 February 2024
You are already at the latest version
Abstract
Keywords:
1. Introduction
2. Materials and Methods
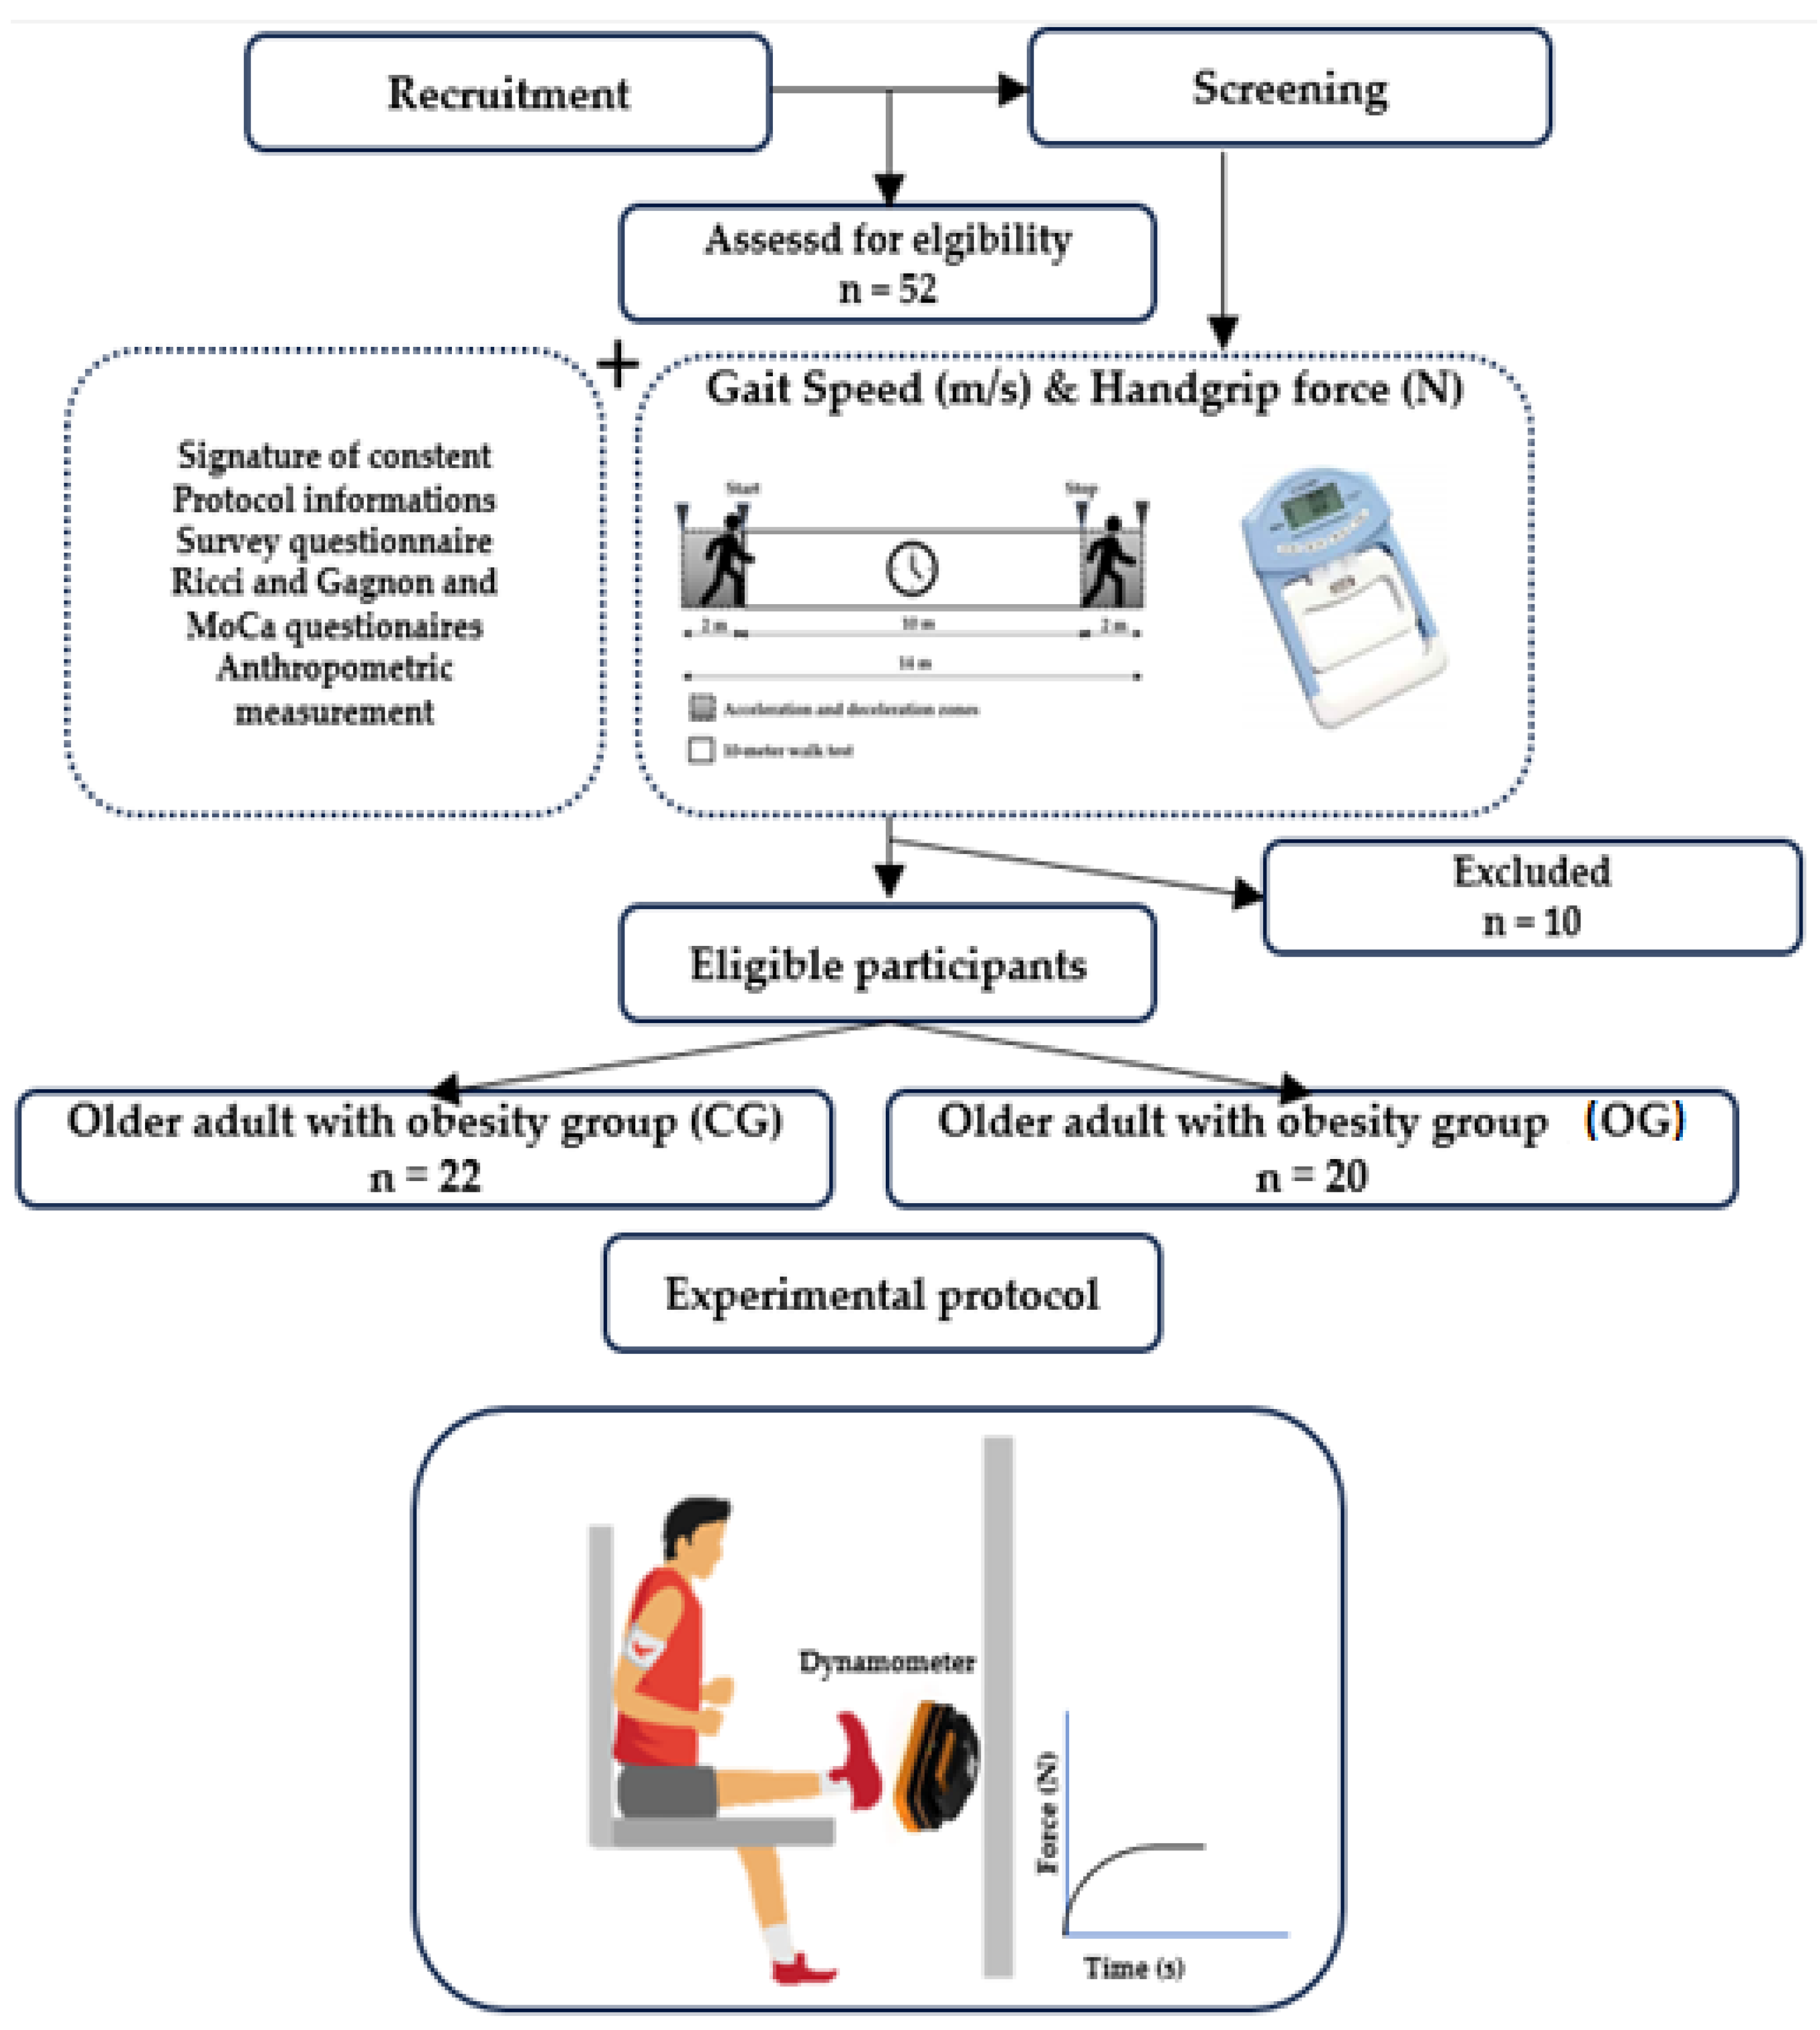
2.1. Study Design
2.2. Recruitment

2.3. Experimental Protocol
2.3.1. Gait Speed Evaluation

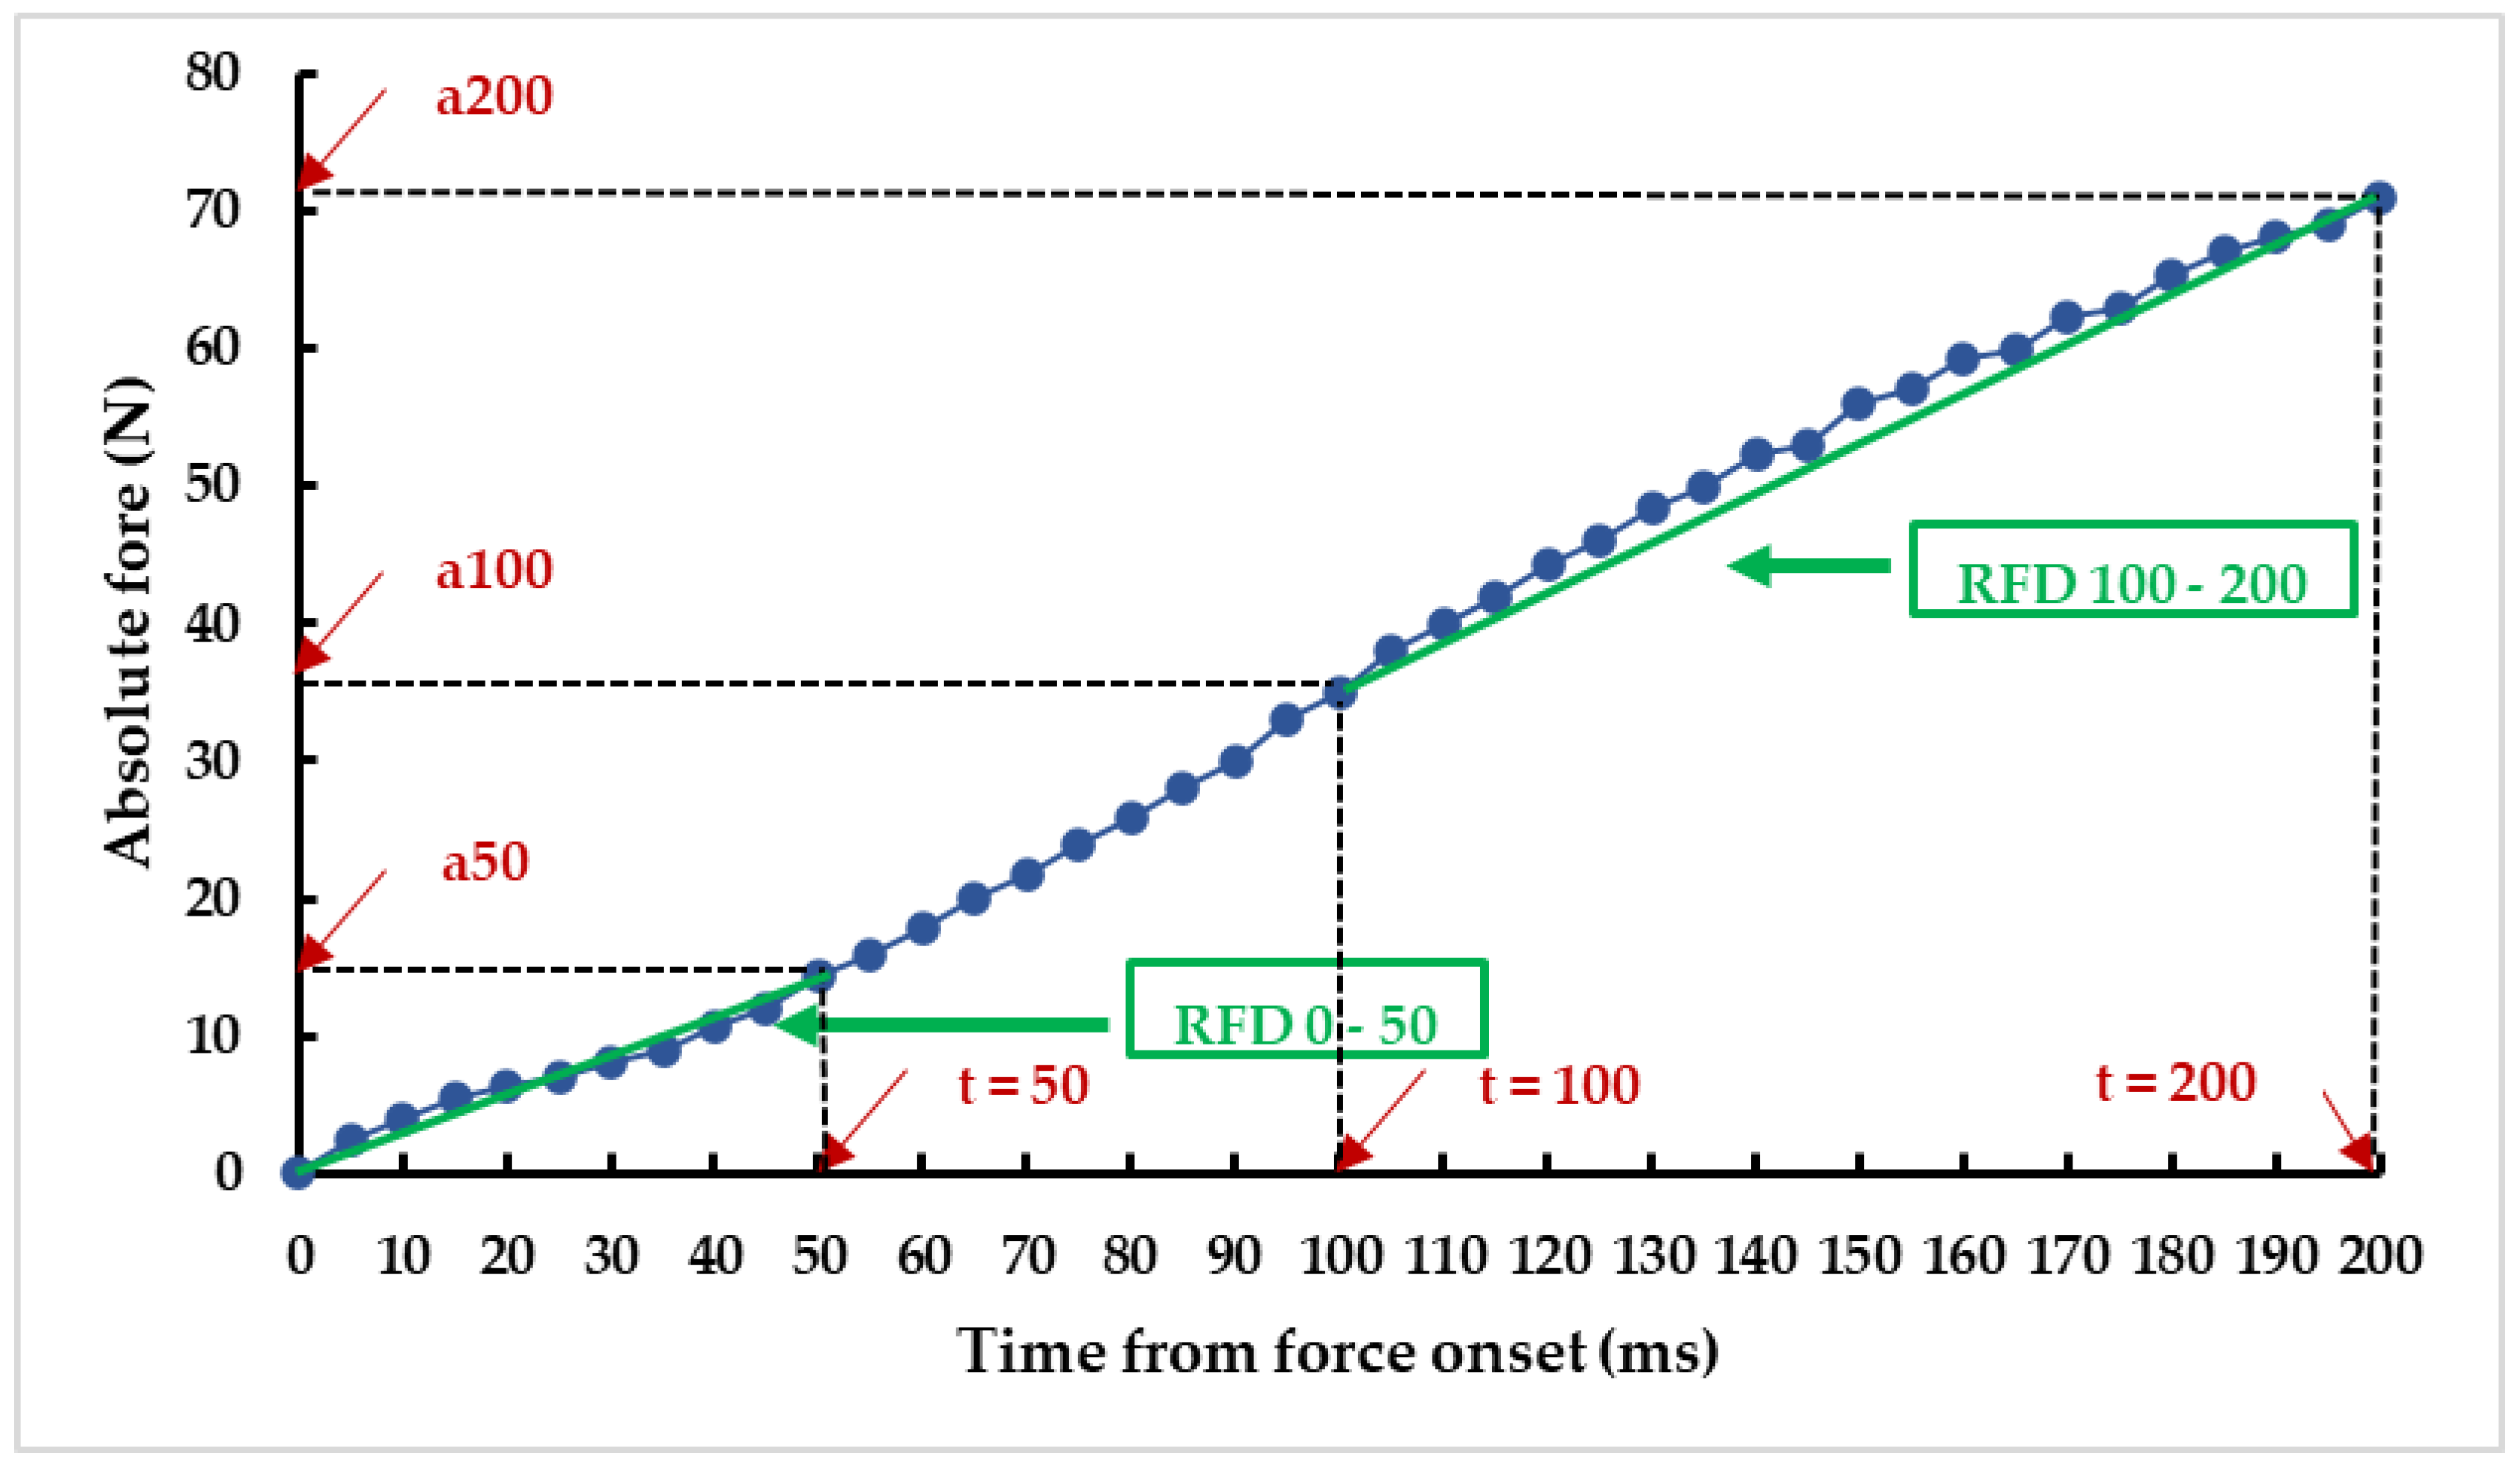
2.3.2. Neuromuscular Parameters Evaluation

2.4. Statistical Analysis
3. Results
3.1. Participants
| Parameters | Groups | Mean ± SD |
|---|---|---|
| Age (y) |
OG | 77.7 ± 2.9 |
| CG | 81.1 ± 4.0 | |
| Height (cm) |
OG | 162.9 ± 6.3 |
| CG | 166.0 ± 7.5 | |
| Body mass (kg) |
OG | 91.0 ± 3.9*** |
| CG | 68.74 ± 5.5 | |
| Body mass index (kg/h²) |
OG | 34.5 ± 3.2*** |
| CG | 25.1 ± 3.4 | |
| Body fat (%) |
OG | 35.0 ± 6.34*** |
| CG | 17.7 ± 1.98 | |
| Fat body mass (kg) |
OG | 32.0 ± 6.9*** |
| CG | 12.2 ± 1.5 | |
| Lean body mass (kg) | OG | 58.9 ± 4.1*** |
| CG | 56.6 ± 5.0 |
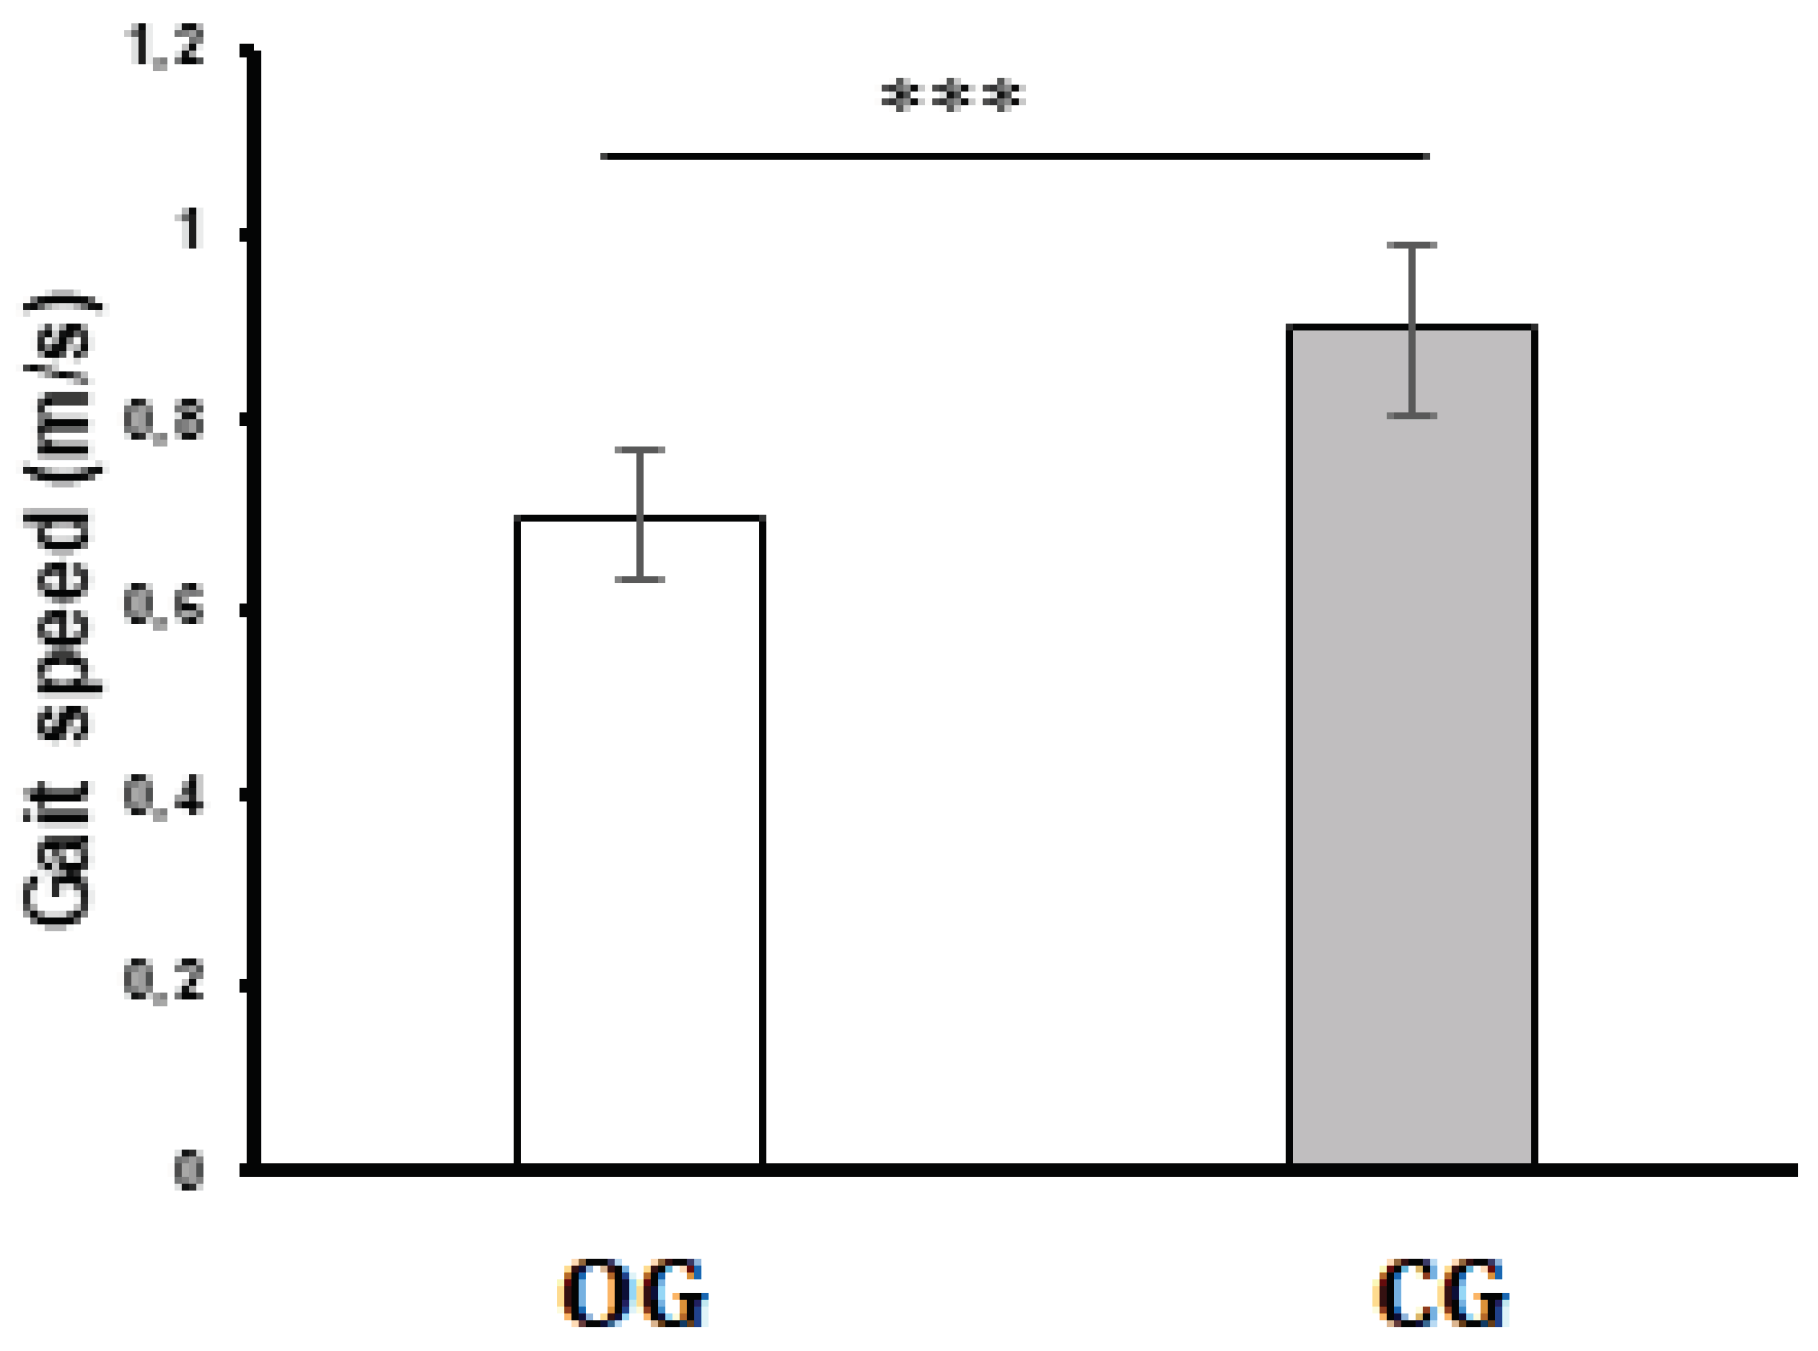
3.2. Gait Speed

3.3. Neuromuscular Parameters
| Parameters | Groups | Mean ± SD |
|---|---|---|
| Fmax (N) |
OG | 192.69 ± 15.41 |
| CG | 194.89 ± 13.28 | |
| R-Fmax (N/kg) |
OG | 2.12 ± 0.22*** |
| CG | 2.86 ± 0.36 | |
| F50 (N) |
OG | 31.18 ± 2.12*** |
| CG | 33.80 ± 2.65 | |
| R-F50 (N/kg) |
OG | 0.37 ± 0.03*** |
| CG | 0.45 ± 0.05 | |
| F100 (N) |
OG | 69.53 ± 5.45* |
| CG | 73.51 ± 4.73 | |
| R-F100 (N/kg) |
OG | 0.76 ± 0.08*** |
| CG | 1.07 ± 0.12 | |
| F200 (N) |
OG | 113.96 ± 8.93*** |
| CG | 124.73 ± 8.48 | |
| R-F200 (N/kg) |
OG | 1.25 ± 0.13 |
| CG | 1.82 ± 0.21 | |
| 50-Fmax (%) |
OG | 17.60 ± 1.56 |
| CG | 16.02 ± 0.96 | |
| 100-Fmax (%) |
OG | 36.14 ± 2.01 |
| CG | 37.81 ± 2.57 | |
| 200-Fmax (%) |
OG | 59.40 ± 5.64* |
| CG | 64.16 ± 4.72 | |
| RFD 50/100 (N/ms) |
OG | 676.06 ± 53.00*** |
| CG | 708.19 ± 38.21 | |
| RFD 100/200 (N/ms) | OG | 444.26 ± 81.50*** |
| CG | 512.11 ± 78.13 |
3.4. Relationships between Neuromusclar Parameters and Gait Speed
| Neuromuscular parameters |
Gait speed (m/s) | |
|---|---|---|
| r | p | |
| RFD50/100 (N/ms) | 0.84 | <0.001 |
| RFD100/200 (N/ms) | 0.83 | <0.001 |
| R-F50 (N/kg) | 0.77 | <0.001 |
| R-F100 (N/kg) | 0.66 | <0.001 |
| R-F200 (N/kg) | 0.75 | <0.001 |
| R-Fmax (N/kg) | 0.60 | <0.05 |
| 50-Fmax (%) | 0.32 | 0.164 |
| 100-Fmax (%) | 0.26 | 0.236 |
| 200-Fmax (%) | 0.35 | 0.129 |
| Unstard. Coef. | Standard. Coef. | Model summary | |||||||||
|---|---|---|---|---|---|---|---|---|---|---|---|
| Model | B | Beta | SD | t | p | r | R² | Adj R² | SD | ||
|
Gait speed (m/s) |
1 | (Constant) | -0.46 | 0.18 | -2.58 | 0.019 | 0,84 | 0,7 | 0,69 | 0,06 | |
| RFD50/100 (N/ms) | 0 | 0.84 | 0 | 6.55 | <0.001 | ||||||
| 2 | (Constant) | -0,28 | 0,15 | -1,89 | ,076 | 0,91 | 0,82 | 0,8 | 0,05 | ||
| RFD50/100 (N/ms) | 0 | 0,51 | 0 | 3,61 | ,002 | ||||||
| RFD100/200 (N/ms) | 0 | 0,48 | 0 | 3,39 | ,004 | ||||||
| 3 | (Constant) | -0,51 | 0,14 | -3,55 | ,003 | 0,94 | 0,89 | 0,87 | 0,04 | ||
| RFD50/100 (N/ms) | 0 | 0,51 | 0 | 4,45 | <.001 | ||||||
| RFD100/200 (N/ms) | 0 | 0,35 | 0 | 2,8 | ,013 | ||||||
| R-Fmax (N) | 0,14 | 0,29 | 0,05 | 3,06 | ,008 | ||||||
| 4 | (Constant) | -0,47 | 0,16 | -3,01 | ,009 | 0,95 | 0,89 | 0,86 | 0,04 | ||
| RFD50/100 (N/ms) | 0 | 0,46 | 0 | 3,19 | ,006 | ||||||
| RFD100/200 (N/ms) | 0 | 0,38 | 0 | 2,58 | ,022 | ||||||
| R-F50 (N) | 0,3 | 0,1 | 0,42 | 0,71 | ,487 | ||||||
| R-F100 (N) | -0,15 | -0,1 | 0,25 | -0,57 | ,575 | ||||||
| 5 | (Constant) | -0,5 | 0,14 | -3,52 | ,003 | 0,95 | 0,89 | 0,87 | 0,04 | ||
| RFD50/100 (N/ms) | 0 | 0,43 | 0 | 3,04 | ,008 | ||||||
| RFD100/200 (N/ms) | 0 | 0,34 | 0 | 2,77 | ,014 | ||||||
| R-F200 (N) | 0,12 | 0,14 | 0,11 | 1,07 | ,302 | ||||||
| R-Fmax (N) | 0,13 | 0,26 | 0,05 | 2,64 | ,019 | ||||||
4. Discussion
4.1. Limitations and Perspectives
4.2. Practical Recommendations
5. Conclusions
Author Contributions
Funding
Institutional Review Board Statement
Informed Consent Statement
Data Availability Statement
Acknowledgments
Conflicts of Interest
References
- Olmos, A.A.; Stratton, M.T.; Ha, P.L.; Dalton, B.E.; VanDusseldorp, T.A.; Mangine, G.T.; Feito, Y.; Poisal, M.J.; Jones, J.A.; Smith, T.M.; et al. Early and Late Rapid Torque Characteristics and Select Physiological Correlates in Middle-Aged and Older Males. PLoS One 2020, 15. [Google Scholar] [CrossRef]
- Hester, G.M.; Ha, P.L.; Dalton, B.E.; Vandusseldorp, T.A.; Olmos, A.A.; Stratton, M.T.; Bailly, A.R.; Vroman, T.M. Rate of Force Development as a Predictor of Mobility in Community-Dwelling Older Adults. Journal of Geriatric Physical Therapy 2021, 44, 74–81. [Google Scholar] [CrossRef]
- Gerstner, G.R.; Thompson, B.J.; Rosenberg, J.G.; Sobolewski, E.J.; Scharville, M.J.; Ryan, E.D. Neural and Muscular Contributions to the Age-Related Reductions in Rapid Strength. Med Sci Sports Exerc 2017, 49, 1331–1339. [Google Scholar] [CrossRef] [PubMed]
- Aagaard, P.; Simonsen, E.B.; Andersen, J.L.; Magnusson, P.; Dyhre-Poulsen, P. Neural Adaptation to Resistance Training: Changes in Evoked V-Wave and H-Reflex Responses. J Appl Physiol 2002, 92, 2309–2318. [Google Scholar] [CrossRef]
- Hester, G.M.; Ha, P.L.; Dalton, B.E.; Vandusseldorp, T.A.; Olmos, A.A.; Stratton, M.T.; Bailly, A.R.; Vroman, T.M. Rate of Force Development as a Predictor of Mobility in Community-Dwelling Older Adults. Journal of Geriatric Physical Therapy 2021, 44, 74–81. [Google Scholar] [CrossRef] [PubMed]
- Thompson, B.J.; Ryan, E.D.; Herda, T.J.; Costa, P.B.; Herda, A.A.; Cramer, J.T. Age-Related Changes in the Rate of Muscle Activation and Rapid Force Characteristics. Age (Omaha) 2014, 36, 839–849. [Google Scholar] [CrossRef]
- Klass, M.; Baudry, S.; Duchateau, J. Age-Related Decline in Rate of Torque Development Is Accompanied by Lower Maximal Motor Unit Discharge Frequency during Fast Contractions. J Appl Physiol 2008, 104, 739–746. [Google Scholar] [CrossRef]
- Andersen, L.L.; Aagaard, P. Influence of Maximal Muscle Strength and Intrinsic Muscle Contractile Properties on Contractile Rate of Force Development. Eur J Appl Physiol 2006, 96, 46–52. [Google Scholar] [CrossRef]
- Maktouf, W.; Durand, S.; Boyas, S.; Pouliquen, C.; Beaune, B. Combined Effects of Aging and Obesity on Postural Control, Muscle Activity and Maximal Voluntary Force of Muscles Mobilizing Ankle Joint. J Biomech 2018, 79, 198–206. [Google Scholar] [CrossRef] [PubMed]
- Hilton, T.N.; Tuttle, L.J.; Bohnert, K.L.; Mueller, M.J.; Sinacore, D.R. Excessive Adipose Tissue Infiltration in Skeletal Muscle in Individuals With Obesity, Diabetes Mellitus, and Peripheral Neuropathy: Association With Performance and Function. Phys Ther 2008, 88, 1336–1344. [Google Scholar] [CrossRef]
- Erskine, R.M.; Tomlinson, D.J.; Morse, C.I.; Winwood, K.; Hampson, P.; Lord, J.M.; Onambélé, G.L. The Individual and Combined Effects of Obesity- and Ageing-Induced Systemic Inflammation on Human Skeletal Muscle Properties. Int J Obes 2017, 41, 102–111. [Google Scholar] [CrossRef]
- Tomlinson, D.J.; Erskine, R.M.; Morse, C.I.; Winwood, K.; Onambélé-Pearson, G.L. Combined Effects of Body Composition and Ageing on Joint Torque, Muscle Activation and Co-Contraction in Sedentary Women. Age (Dordr) 2014, 36, 9652. [Google Scholar] [CrossRef] [PubMed]
- Tomlinson, D.J.; Erskine, R.M.; Morse, C.I.; Winwood, K.; Onambélé-Pearson, G. The Impact of Obesity on Skeletal Muscle Strength and Structure through Adolescence to Old Age. Biogerontology 2016, 17, 467–483. [Google Scholar] [CrossRef] [PubMed]
- Handrigan, G.A.; Maltais, N.; Gagné, M.; Lamontagne, P.; Hamel, D.; Teasdale, N.; Hue, O.; Corbeil, P.; Brown, J.P.; Jean, S. Sex-Specific Association between Obesity and Self-Reported Falls and Injuries among Community-Dwelling Canadians Aged 65 Years and Older. Osteoporosis International 2017, 28, 483–494. [Google Scholar] [CrossRef] [PubMed]
- Xu, D.; Zhou, H.; Quan, W.; Jiang, X.; Liang, M.; Li, S.; Ugbolue, U.C.; Baker, J.S.; Gusztav, F.; Ma, X.; et al. A New Method Proposed for Realizing Human Gait Pattern Recognition: Inspirations for the Application of Sports and Clinical Gait Analysis. Gait Posture 2023. [Google Scholar] [CrossRef] [PubMed]
- Ferhi Hamza, Gaied Chortane Sabri, Durand Sylvain, Beaune Bruno, B.S. and M.W. Effects of Physical Activity Program on Body Composition, Physical Performance, and Neuromuscular Strategies during Walking in Older Adults with Sarcopenic Obesity : Randomized Controlled Trial. 2023, 11. [CrossRef]
- Dommershuijsen, L.J.; Ragunathan, J.; Ruiter, T.R.; Groothof, D.; Mattace-Raso, F.U.S.; Ikram, M.A.; Polinder-Bos, H.A. Gait Speed Reference Values in Community-Dwelling Older Adults – Cross-Sectional Analysis from the Rotterdam Study. Exp Gerontol 2022, 158. [Google Scholar] [CrossRef]
- Handrigan, G.A.; Maltais, N.; Gagné, M.; Lamontagne, P.; Hamel, D.; Teasdale, N.; Hue, O.; Corbeil, P.; Brown, J.P.; Jean, S. Sex-Specific Association between Obesity and Self-Reported Falls and Injuries among Community-Dwelling Canadians Aged 65 Years and Older. Osteoporosis International 2017, 28. [Google Scholar] [CrossRef]
- Laroche, D.P.; Marques, N.R.; Shumila, H.N.; Logan, C.R.; Laurent, R.S.; Goncąlves, M. Excess Body Weight and Gait Influence Energy Cost of Walking in Older Adults. Med Sci Sports Exerc 2015. [Google Scholar] [CrossRef] [PubMed]
- Ellis, R.G.; Sumner, B.J.; Kram, R. Muscle Contributions to Propulsion and Braking during Walking and Running: Insight from External Force Perturbations. Gait Posture 2014, 40, 594–599. [Google Scholar] [CrossRef]
- Tavakkoli Oskouei, S.; Malliaras, P.; Jansons, P.; Hill, K.; Soh, S.E.; Jaberzadeh, S.; Perraton, L. Is Ankle Plantar Flexor Strength Associated with Balance and Walking Speed in Healthy People? A Systematic Review and Meta-Analysis. Phys Ther 2021, 101. [Google Scholar] [CrossRef]
- Maktouf, W.; Durand, S.; Boyas, S.; Pouliquen, C.; Beaune, B. Interactions among Obesity and Age-Related Effects on the Gait Pattern and Muscle Activity across the Ankle Joint. Exp Gerontol 2020, 140, 111054. [Google Scholar] [CrossRef]
- Cleland, B.T.; Alex, T.; Madhavan, S. Concurrent Validity of Walking Speed Measured by a Wearable Sensor and a Stopwatch during the 10-Meter Walk Test in Individuals with Stroke. Gait Posture 2023, 107, 61–66. [Google Scholar] [CrossRef]
- Moore, J.L.; Potter, K.; Blankshain, K.; Kaplan, S.L.; O’Dwyer, L.C.; Sullivan, J.E. A Core Set of Outcome Measures for Adults with Neurologic Conditions Undergoing Rehabilitation. Journal of Neurologic Physical Therapy 2018, 42, 174–220. [Google Scholar] [CrossRef]
- Chatrenet, A.; Piccoli, G.; Audebrand, J.M.; Torreggiani, M.; Barbieux, J.; Vaillant, C.; Morel, B.; Durand, S.; Beaune, B. Analysis of the Rate of Force Development Reveals High Neuromuscular Fatigability in Elderly Patients with Chronic Kidney Disease. J Cachexia Sarcopenia Muscle 2023, 14, 2016–2028. [Google Scholar] [CrossRef]
- Faul, F.; Erdfelder, E.; Lang, A.G.; Buchner, A. G*Power 3: A Flexible Statistical Power Analysis Program for the Social, Behavioral, and Biomedical Sciences. In Proceedings of the Behavior Research Methods; 2007. [Google Scholar]
- Soumboundou, S.; Ndiaye, M.L.; Marcellin Nouaman, N.; Farhat, O.; Abdou Lecor, P. Three-Dimensional Anthropometric Study of the Facial Morphology of Black African Senegalese: 3D Photogrammetric Approach. J Oral Biol Craniofac Res 2023, 13, 522–526. [Google Scholar] [CrossRef] [PubMed]
- Xu, D.; Zhou, H.; Quan, W.; Gusztav, F.; Wang, M.; Baker, J.S.; Gu, Y. Accurately and Effectively Predict the ACL Force: Utilizing Biomechanical Landing Pattern before and after-Fatigue. Comput Methods Programs Biomed 2023, 241. [Google Scholar] [CrossRef] [PubMed]
- Maktouf, W.; Durand, S.; Boyas, S.; Pouliquen, C.; Beaune, B. Combined Effects of Aging and Obesity on Postural Control, Muscle Activity and Maximal Voluntary Force of Muscles Mobilizing Ankle Joint. J Biomech 2018. [Google Scholar] [CrossRef]
- Lafortuna, C.L.; Maffiuletti, N. a; Agosti, F. ; Sartorio, a Gender Variations of Body Composition, Muscle Strength and Power Output in Morbid Obesity. Int J Obes (Lond) 2005, 29, 833–841. [Google Scholar] [CrossRef] [PubMed]
- Maffiuletti, N.A.; Jubeau, M.; Munzinger, U.; Bizzini, M.; Agosti, F.; De Col, A.; Lafortuna, C.L.; Sartorio, A. Differences in Quadriceps Muscle Strength and Fatigue between Lean and Obese Subjects. Eur J Appl Physiol 2007, 101, 51–59. [Google Scholar] [CrossRef] [PubMed]
- Abdelmoula, A.; Martin, V.; Bouchant, A.; Walrand, S.; Lavet, C.; Taillardat, M.; Maffiuletti, N.A.; Boisseau, N.; Duché, P.; Ratel, S. Knee Extension Strength in Obese and Nonobese Male Adolescents. Applied Physiology, Nutrition, and Metabolism 2012, 37, 269–275. [Google Scholar] [CrossRef]
- Maktouf, W.; Durand, S.; Boyas, S.; Pouliquen, C.; Beaune, B. Interactions among Obesity and Age-Related Effects on the Gait Pattern and Muscle Activity across the Ankle Joint. Exp Gerontol 2020, 140, 111054. [Google Scholar] [CrossRef]
- Maffiuletti, N.A.; Jubeau, M.; Agosti, F.; Col, A.; Sartorio, A. Quadriceps Muscle Function Characteristics in Severely Obese and Nonobese Adolescents. Eur J Appl Physiol 2008, 103, 481–484. [Google Scholar] [CrossRef]
- Hotamisligil, G.S.; Arner, P.; Caro, J.F.; Atkinson, R.L.; Spiegelman, B.M. Increased Adipose Tissue Expression of Tumor Necrosis Factor-Alpha in Human Obesity and Insulin Resistance. J Clin Invest 1995, 95, 2409–2415. [Google Scholar] [CrossRef]
- Park, H.S.; Park, J.Y.; Yu, R. Relationship of Obesity and Visceral Adiposity with Serum Concentrations of CRP, TNF-α and IL-6. Diabetes Res Clin Pract 2005, 69, 29–35. [Google Scholar] [CrossRef]
- Galli, G.; Pinchera, A.; Piaggi, P.; Fierabracci, P.; Giannetti, M.; Querci, G.; Scartabelli, G.; Manetti, L.; Ceccarini, G.; Martinelli, S.; et al. Serum Insulin-like Growth Factor-1 Concentrations Are Reduced in Severely Obese Women and Raise after Weight Loss Induced by Laparoscopic Adjustable Gastric Banding. Obes Surg 2012, 22, 1276–1280. [Google Scholar] [CrossRef]
- Hammond, K.G.; Pfeiffer, R.F.; LeDoux, M.S.; Schilling, B.K. Neuromuscular Rate of Force Development Deficit in Parkinson Disease. Clinical Biomechanics 2017, 45, 14–18. [Google Scholar] [CrossRef] [PubMed]
- Maffiuletti, N.A.; Aagaard, P.; Blazevich, A.J.; Folland, J.; Tillin, N.; Duchateau, J. Rate of Force Development: Physiological and Methodological Considerations. Eur J Appl Physiol 2016, 116, 1091–1116. [Google Scholar] [CrossRef] [PubMed]
- Mathern, R.M.; Anhorn, M.; Uygur, M. A Novel Method to Assess Rate of Force Relaxation: Reliability and Comparisons with Rate of Force Development across Various Muscles. Eur J Appl Physiol 2019, 119, 291–300. [Google Scholar] [CrossRef] [PubMed]
- Bellumori, M.; Jaric, S.; Knight, C.A. Age-Related Decline in the Rate of Force Development Scaling Factor. Motor Control 2013, 17, 370–381. [Google Scholar] [CrossRef] [PubMed]
Disclaimer/Publisher’s Note: The statements, opinions and data contained in all publications are solely those of the individual author(s) and contributor(s) and not of MDPI and/or the editor(s). MDPI and/or the editor(s) disclaim responsibility for any injury to people or property resulting from any ideas, methods, instructions or products referred to in the content. |
© 2024 by the authors. Licensee MDPI, Basel, Switzerland. This article is an open access article distributed under the terms and conditions of the Creative Commons Attribution (CC BY) license (http://creativecommons.org/licenses/by/4.0/).


