Preprint
Communication

Through-Wall Imaging Using Low-Cost FMCW Radar Sensors

Altmetrics

Downloads

154

Views

64

Comments

0

A peer-reviewed article of this preprint also exists.

This version is not peer-reviewed

Submitted:

22 February 2024

Posted:

24 February 2024

You are already at the latest version

Alerts
Abstract
Many fields of human activity benefit from the ability to create images of obscured objects placed behind walls and to map their displacement in a noninvasive way. Usually, imaging devices like Synthetic Aperture Radars (SAR) and Ground Penetrating Radars (GPR) use expensive dedicated electronics which results in prohibitive prices. This paper presents the experimental implementation and the results obtained from an imaging system capable of performing SAR imaging and interferometric displacement mapping of targets located behind walls, as well as 3D GPR imaging using a low-cost general-purpose radar sensor. The proposed solution uses for the RF section of the system a K-band microwave radar sensor module implementing Frequency Modulated Continuous Wave operation. The low-cost sensor was originally intended for simple presence detection and ranging for domestic applications. The proposed system was tested in several scenarios and proved to operate as intended for a fraction of the cost of a commercial imaging device.
Keywords: 
Subject: Engineering  -   Electrical and Electronic Engineering

1. Introduction

Non-destructive imaging of objects situated behind optically opaque walls can be achieved by means of penetrating radio waves [1,2] in the form of Ground Penetrating Radars (GPR). Like all radars, GPRs generate radio waves and analyze the echoes resulted from the reflections of these waves at discontinuities in the tested medium [3]. This technology is very mature and has been successfully applied in many fields of human activity like geological surveys [4,5], archeology [6], military mine detection [7] and civil engineering applications [8].
Typical GPR images are difficult to interpret by an inexperienced user of the device due to their poor resolution. The pathway for improving the resolution of the image is to create synthetic large apertures of the GPR antennas by mathematically processing the raw image using algorithms inspired by the airborne Synthetic Aperture Radar (SAR).
The scientific literature presents several successful implementations of Synthetic Aperture GPR focusing techniques [9,10,11,12].
Although very well established, the GPR technology uses expensive dedicated electronics which results in prohibitive prices making it inaccessible to the amateur archeologist or domestic user. The current paper aims to solve this problem by proposing a low-cost imaging system capable of performing SAR imaging and interferometric displacement mapping of targets located behind walls, as well as 3D GPR imaging using a highly affordable general-purpose radar sensor and some simple electronics. The operating frequency of the proposed system lies in the K-band at 24GHz. This limits the penetration depth in soil to only a couple of centimeters making it useful only for detecting superficial buried objects. However, typical walls and floors can be penetrated easily by this frequency making the proposed system useful in finding objects or construction elements encased in walls or behind walls, in non-conductive cases or beneath floors.

2. Materials and Methods

2.1. GB-SAR implementation

The first proposed implementation of the imaging system takes the form of a Ground-Based Synthetic Aperture Radar (GB-SAR). The low-cost FMCW radar circuit has the schematic presented in Figure 1.
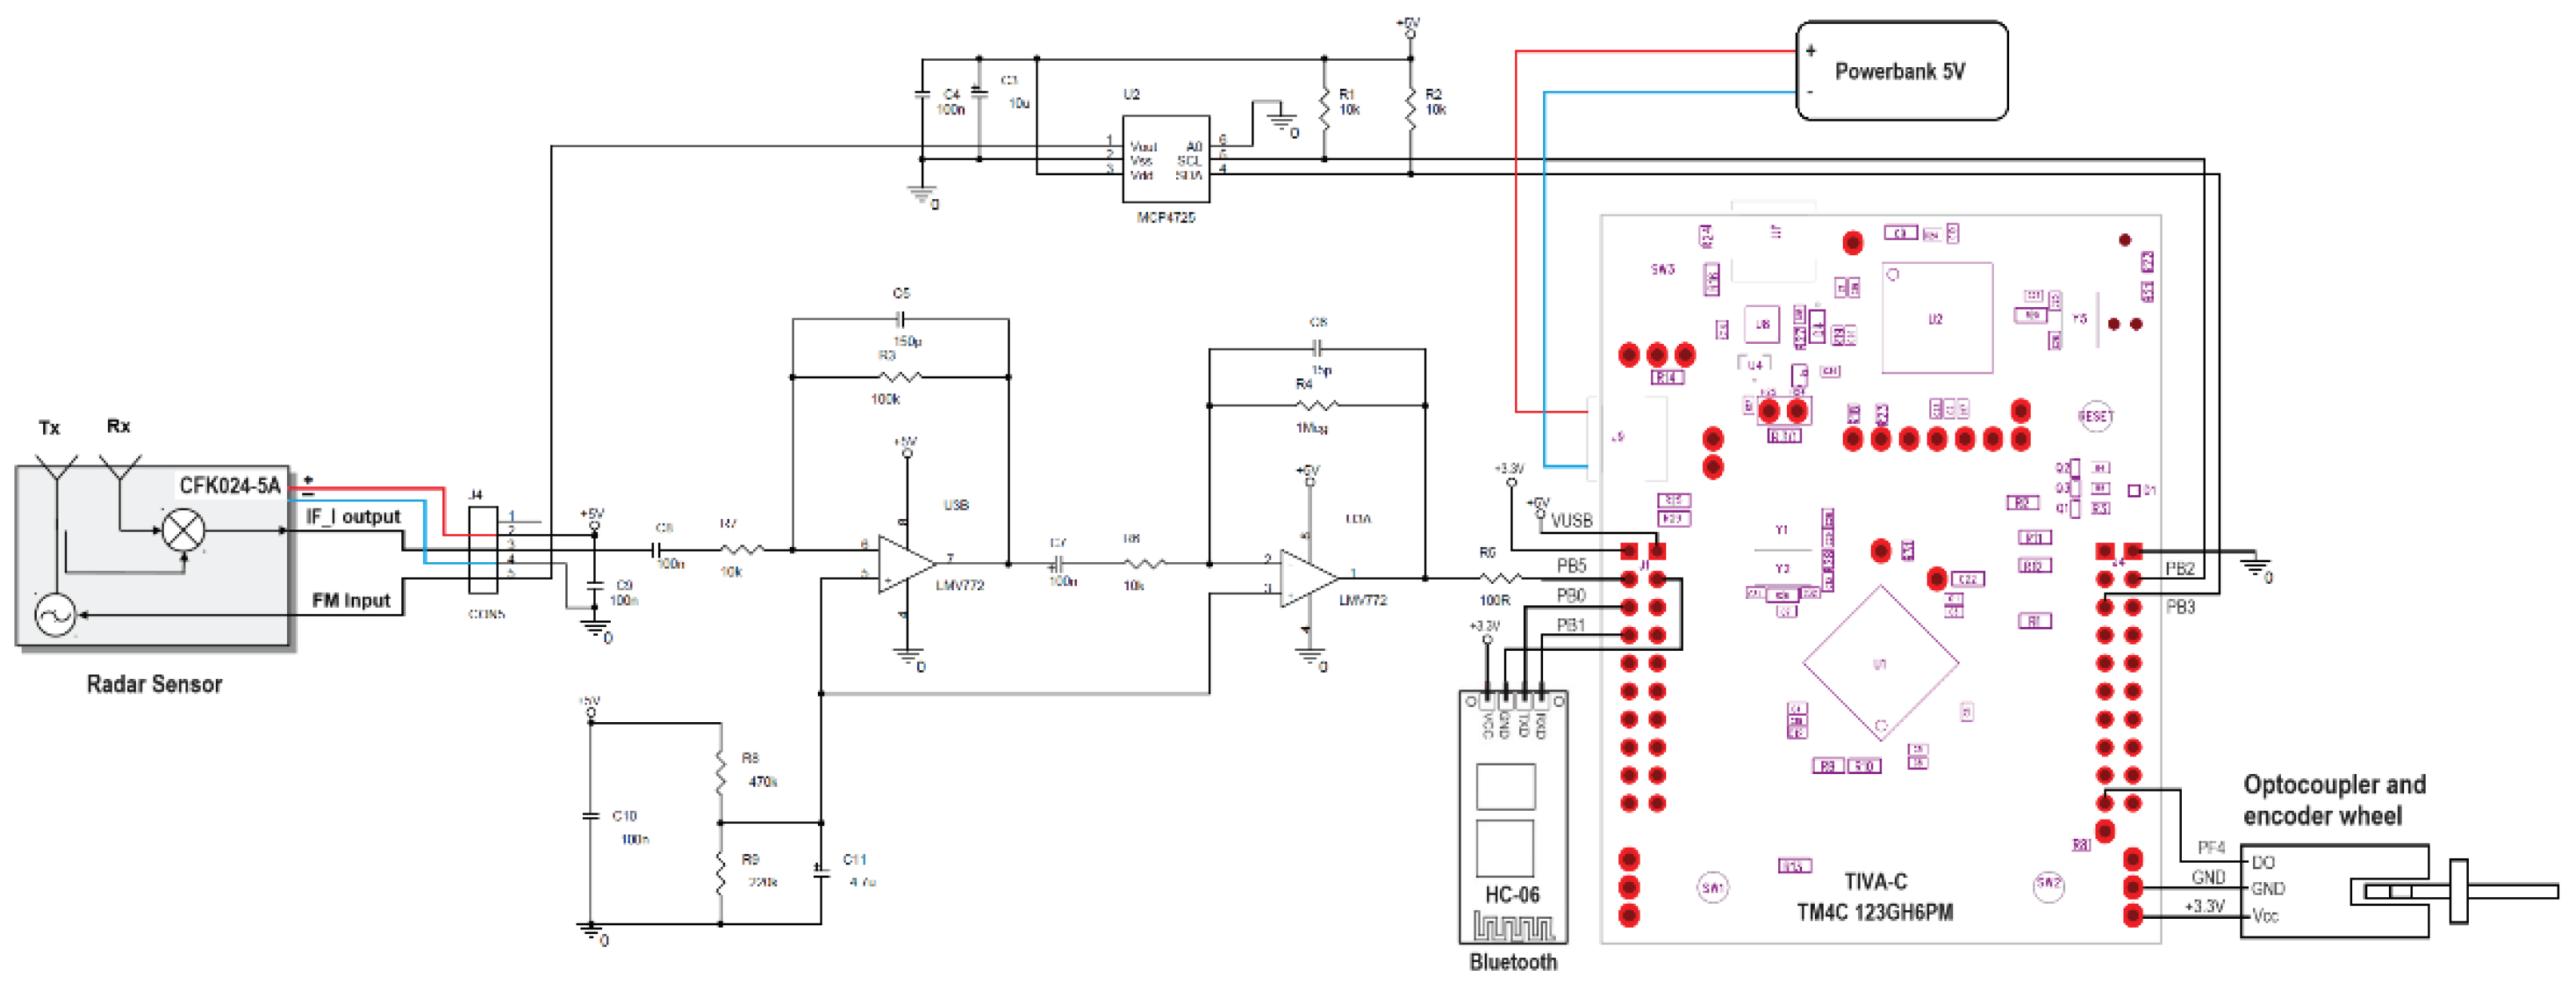
For the RF section, the low-cost K-band FMCW radar sensor CFK024-5A was used. The linear ramp 0 – 2V signal needed for modulating the transmitted frequency of the radar in order to generate a linear chirp is created by means of the MCP4725 Digital to Analogue Converter. The output of the radar sensor is amplified, shifted and filtered by the LMV772 Operational Amplifier. The digital section of the proposed system is implemented by the TIVA-C TM4C-123GH6PM development board. The sampling rate used for digitizing the signal obtained at the output of the amplifier is 20580 Hz with 12 bits of resolution. The frequency domain behavior of the amplifier is showed in Figure 2.
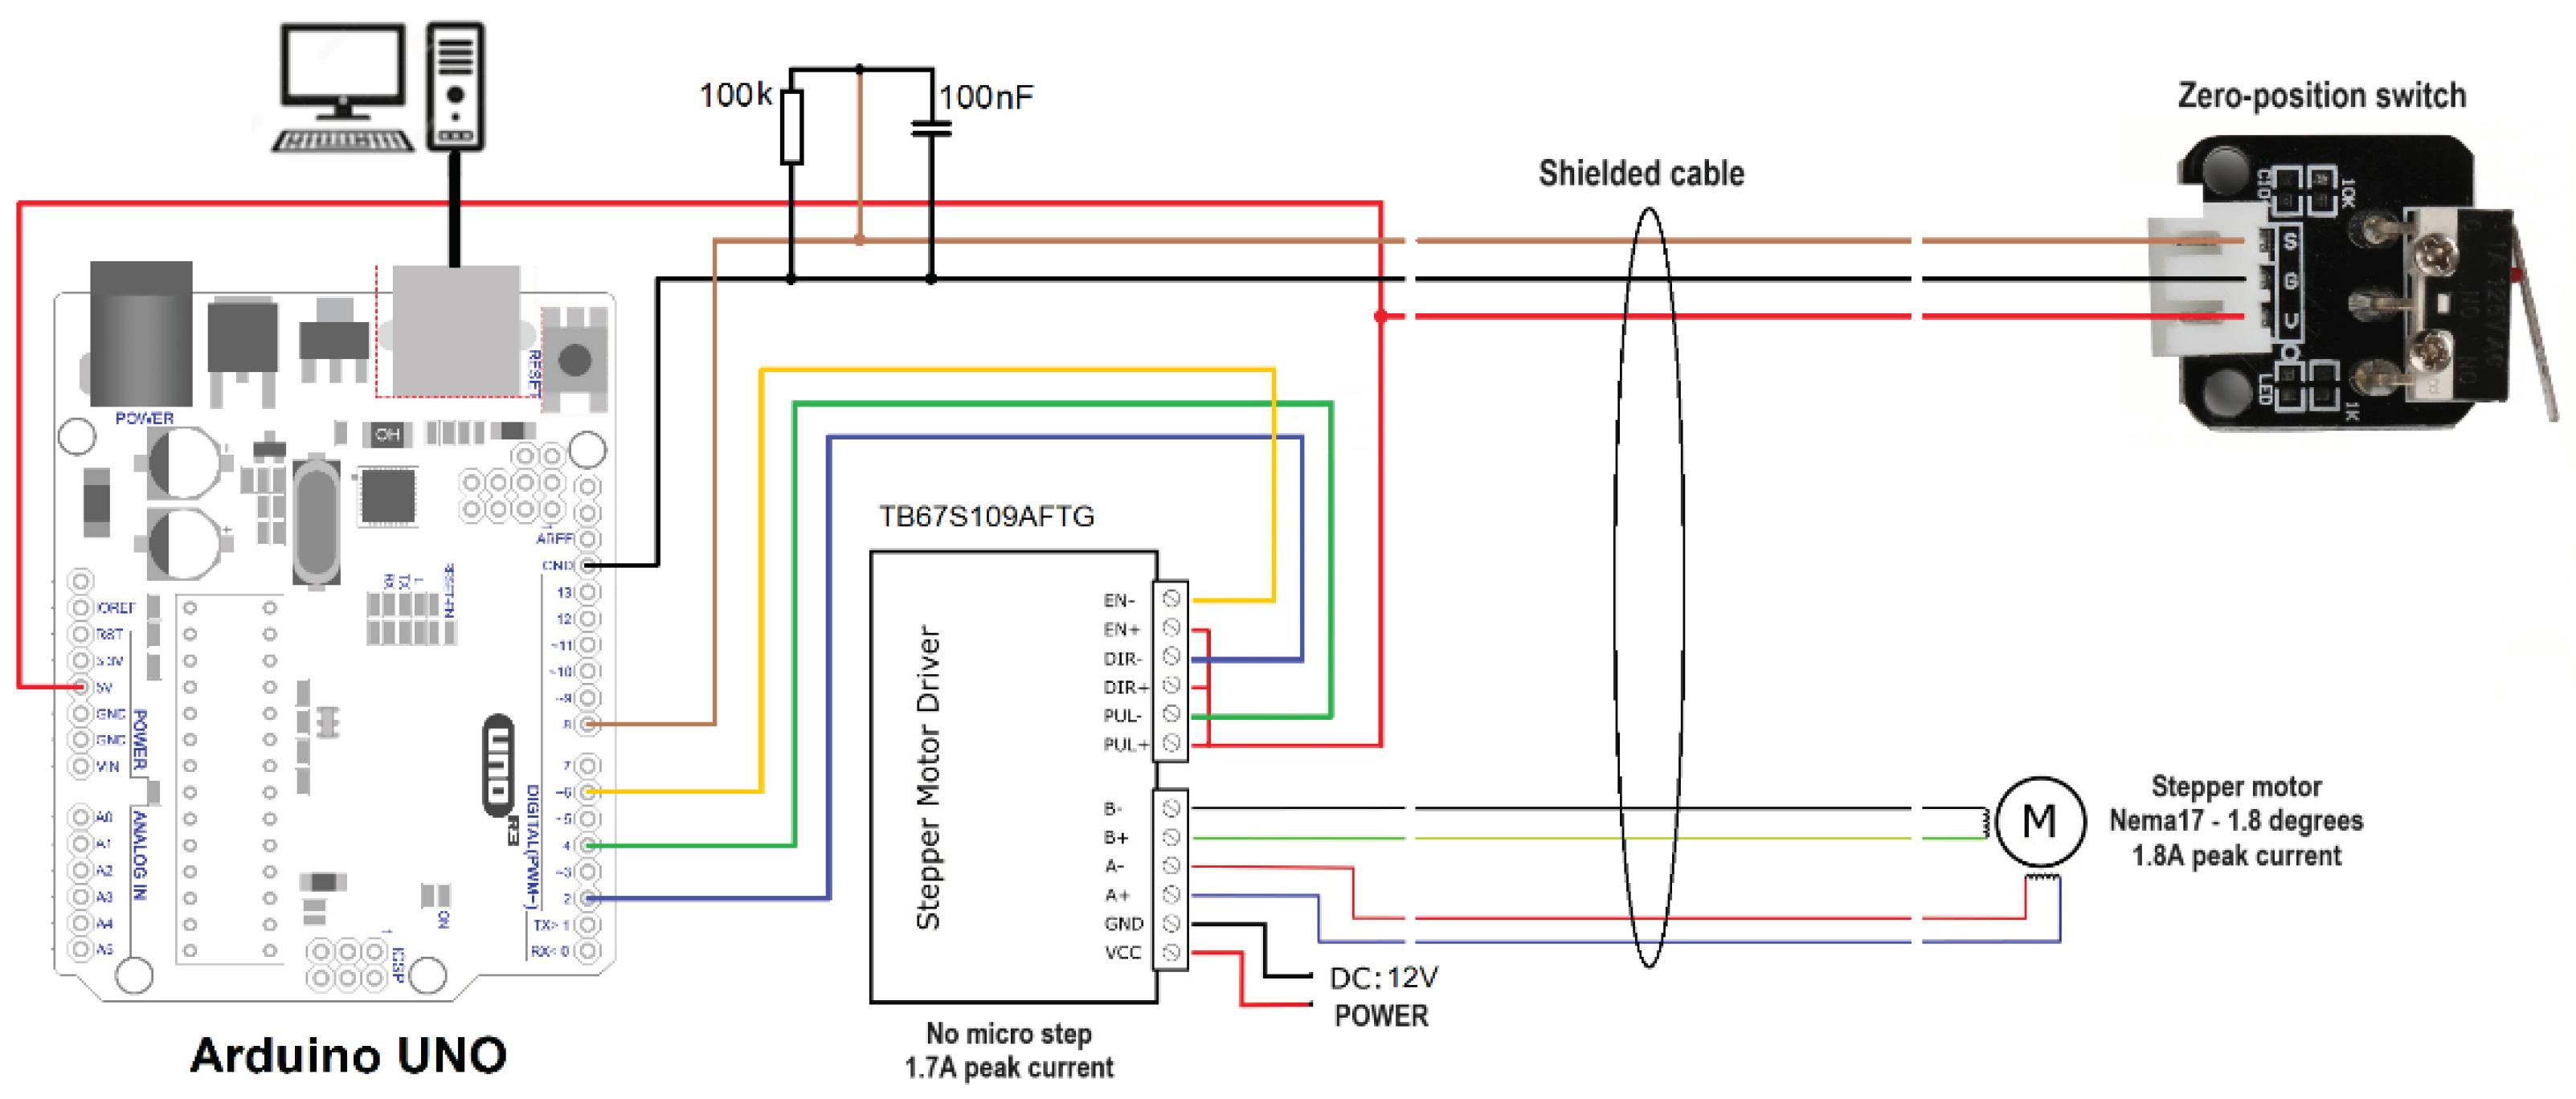
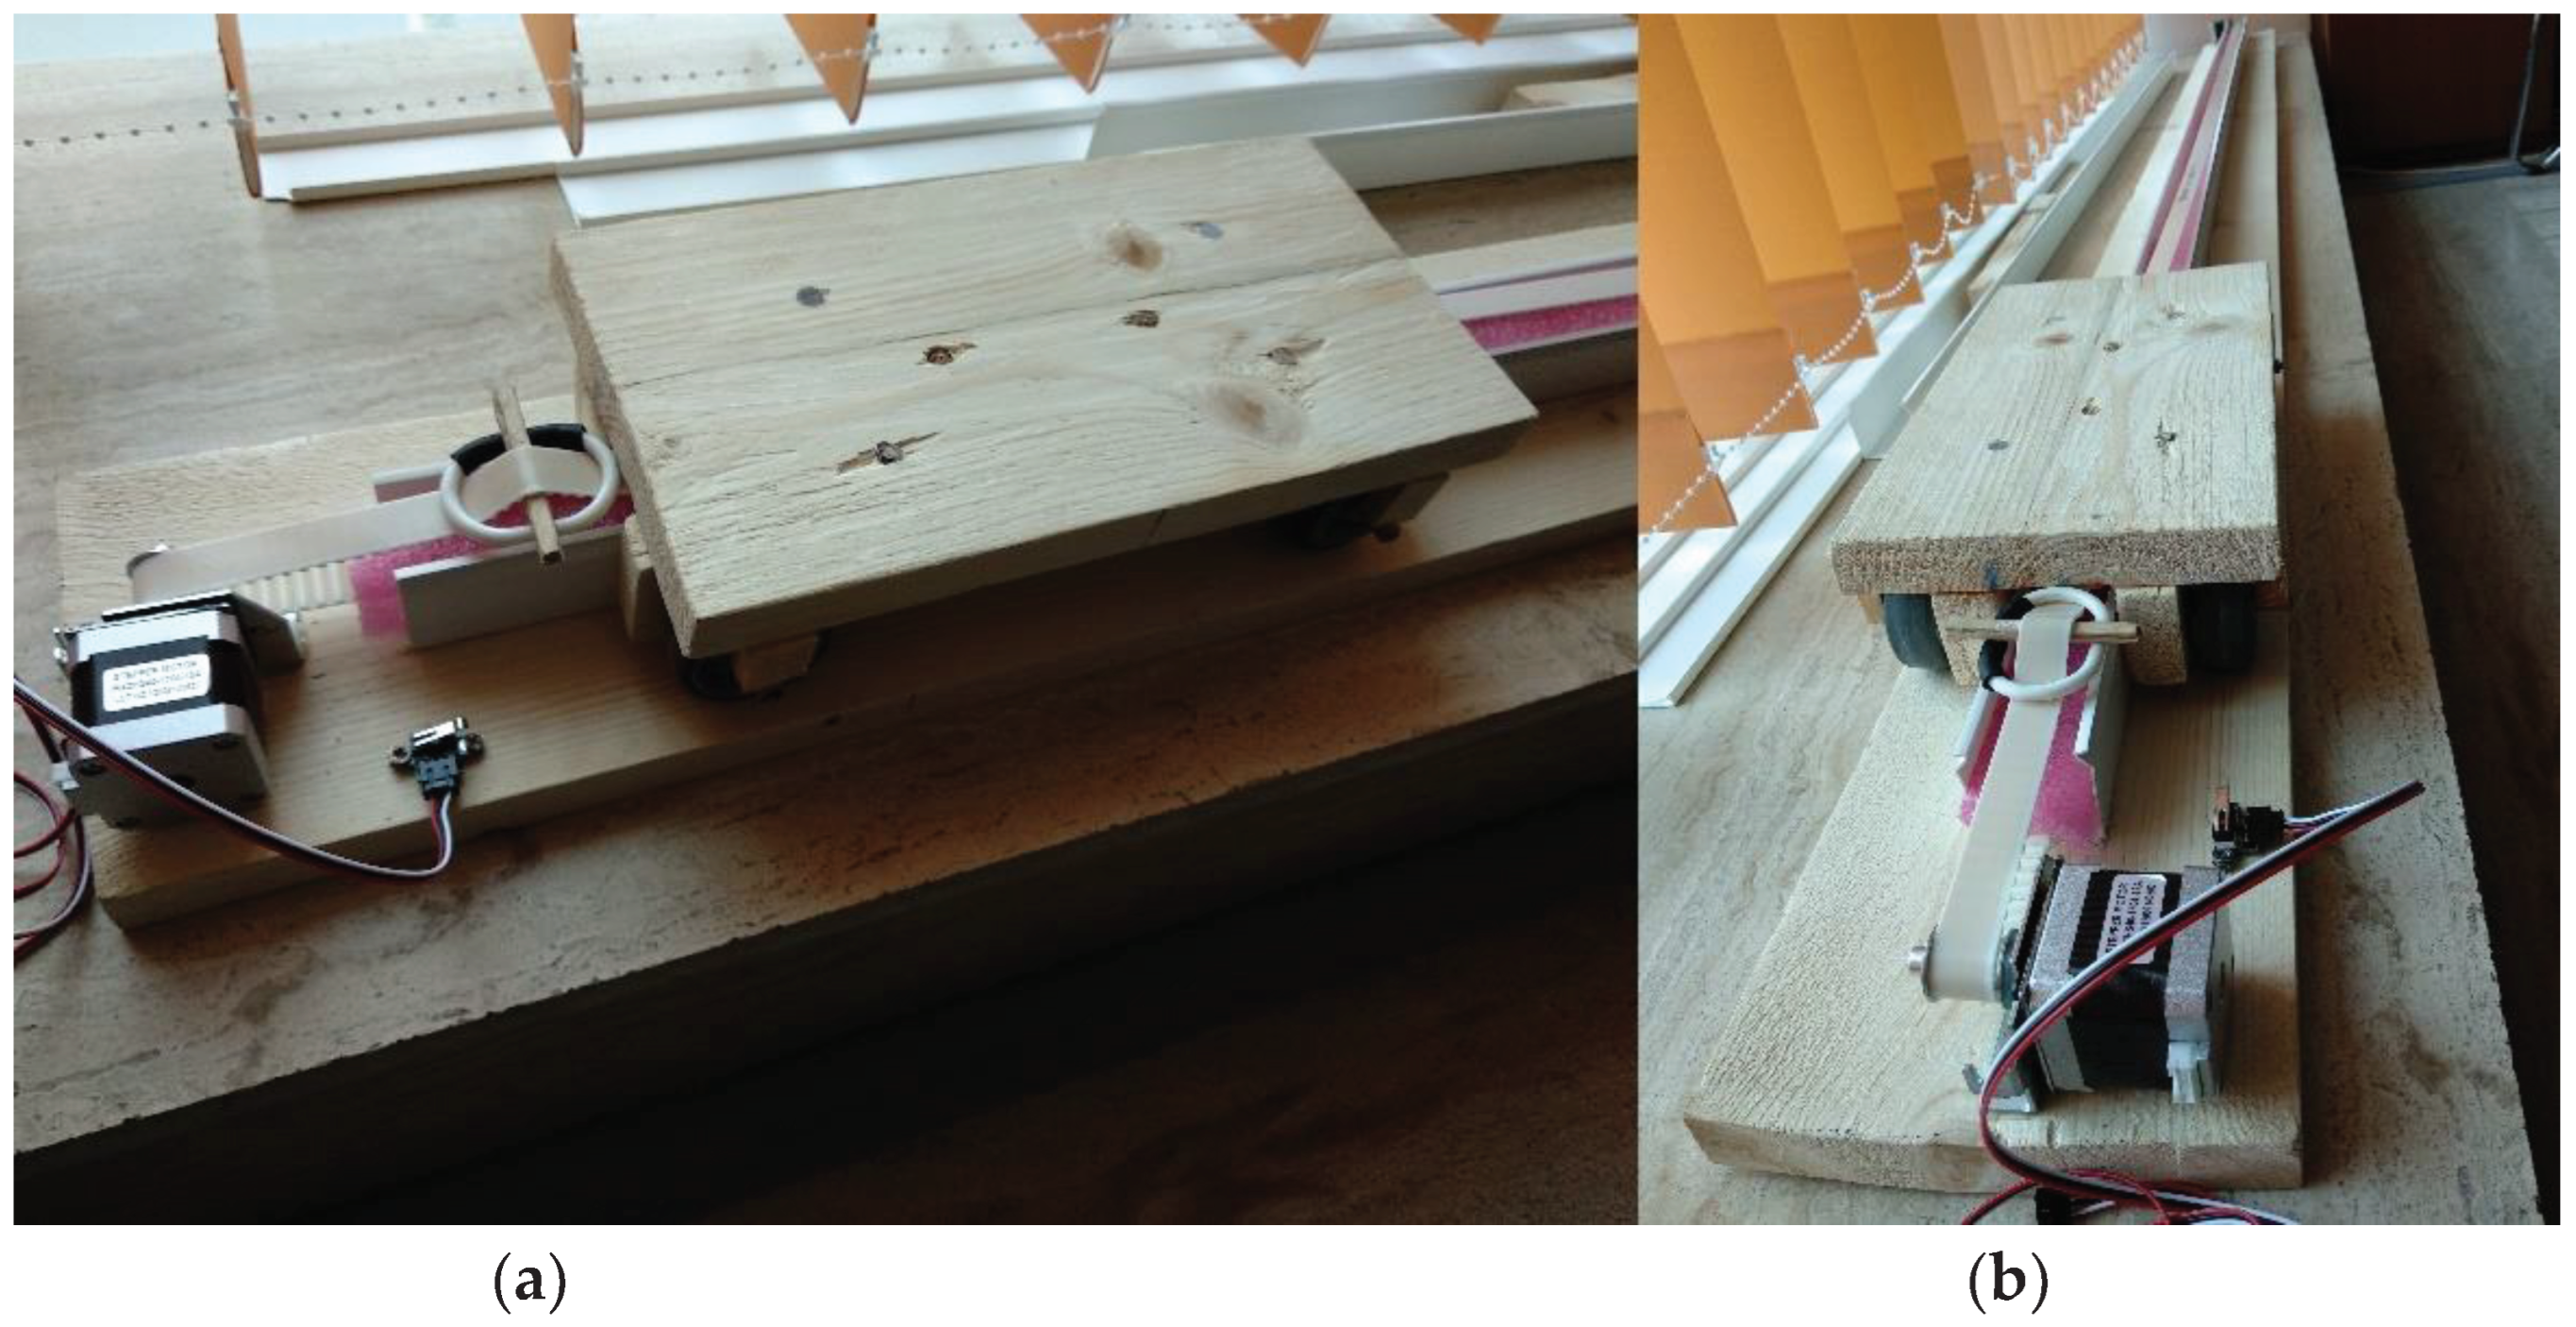
In order to move the radar module in a straight line during the scanning procedure a computer-controlled rail system was implemented. It will be named the radar positioning system. The rail uses an Arduino Uno board that continuously listens for positions expressed in millimeters sent from the computer through a USB connection, the same computer the radar module is connected to. When a position followed by a New Line ASCII character is received, the Arduino computes the number of steps needed by the stepper motor to move the carriage to the received position and sends the appropriate signal sequence to the Stepper Motor Driver. In order to calibrate the zero position of the rail at the beginning of the scanning procedure, a switch is placed at the start of the rail.
The schematic diagram of the rail electronics is presented in Figure 3. The practical implementation of the rail is depicted in Figure 4.
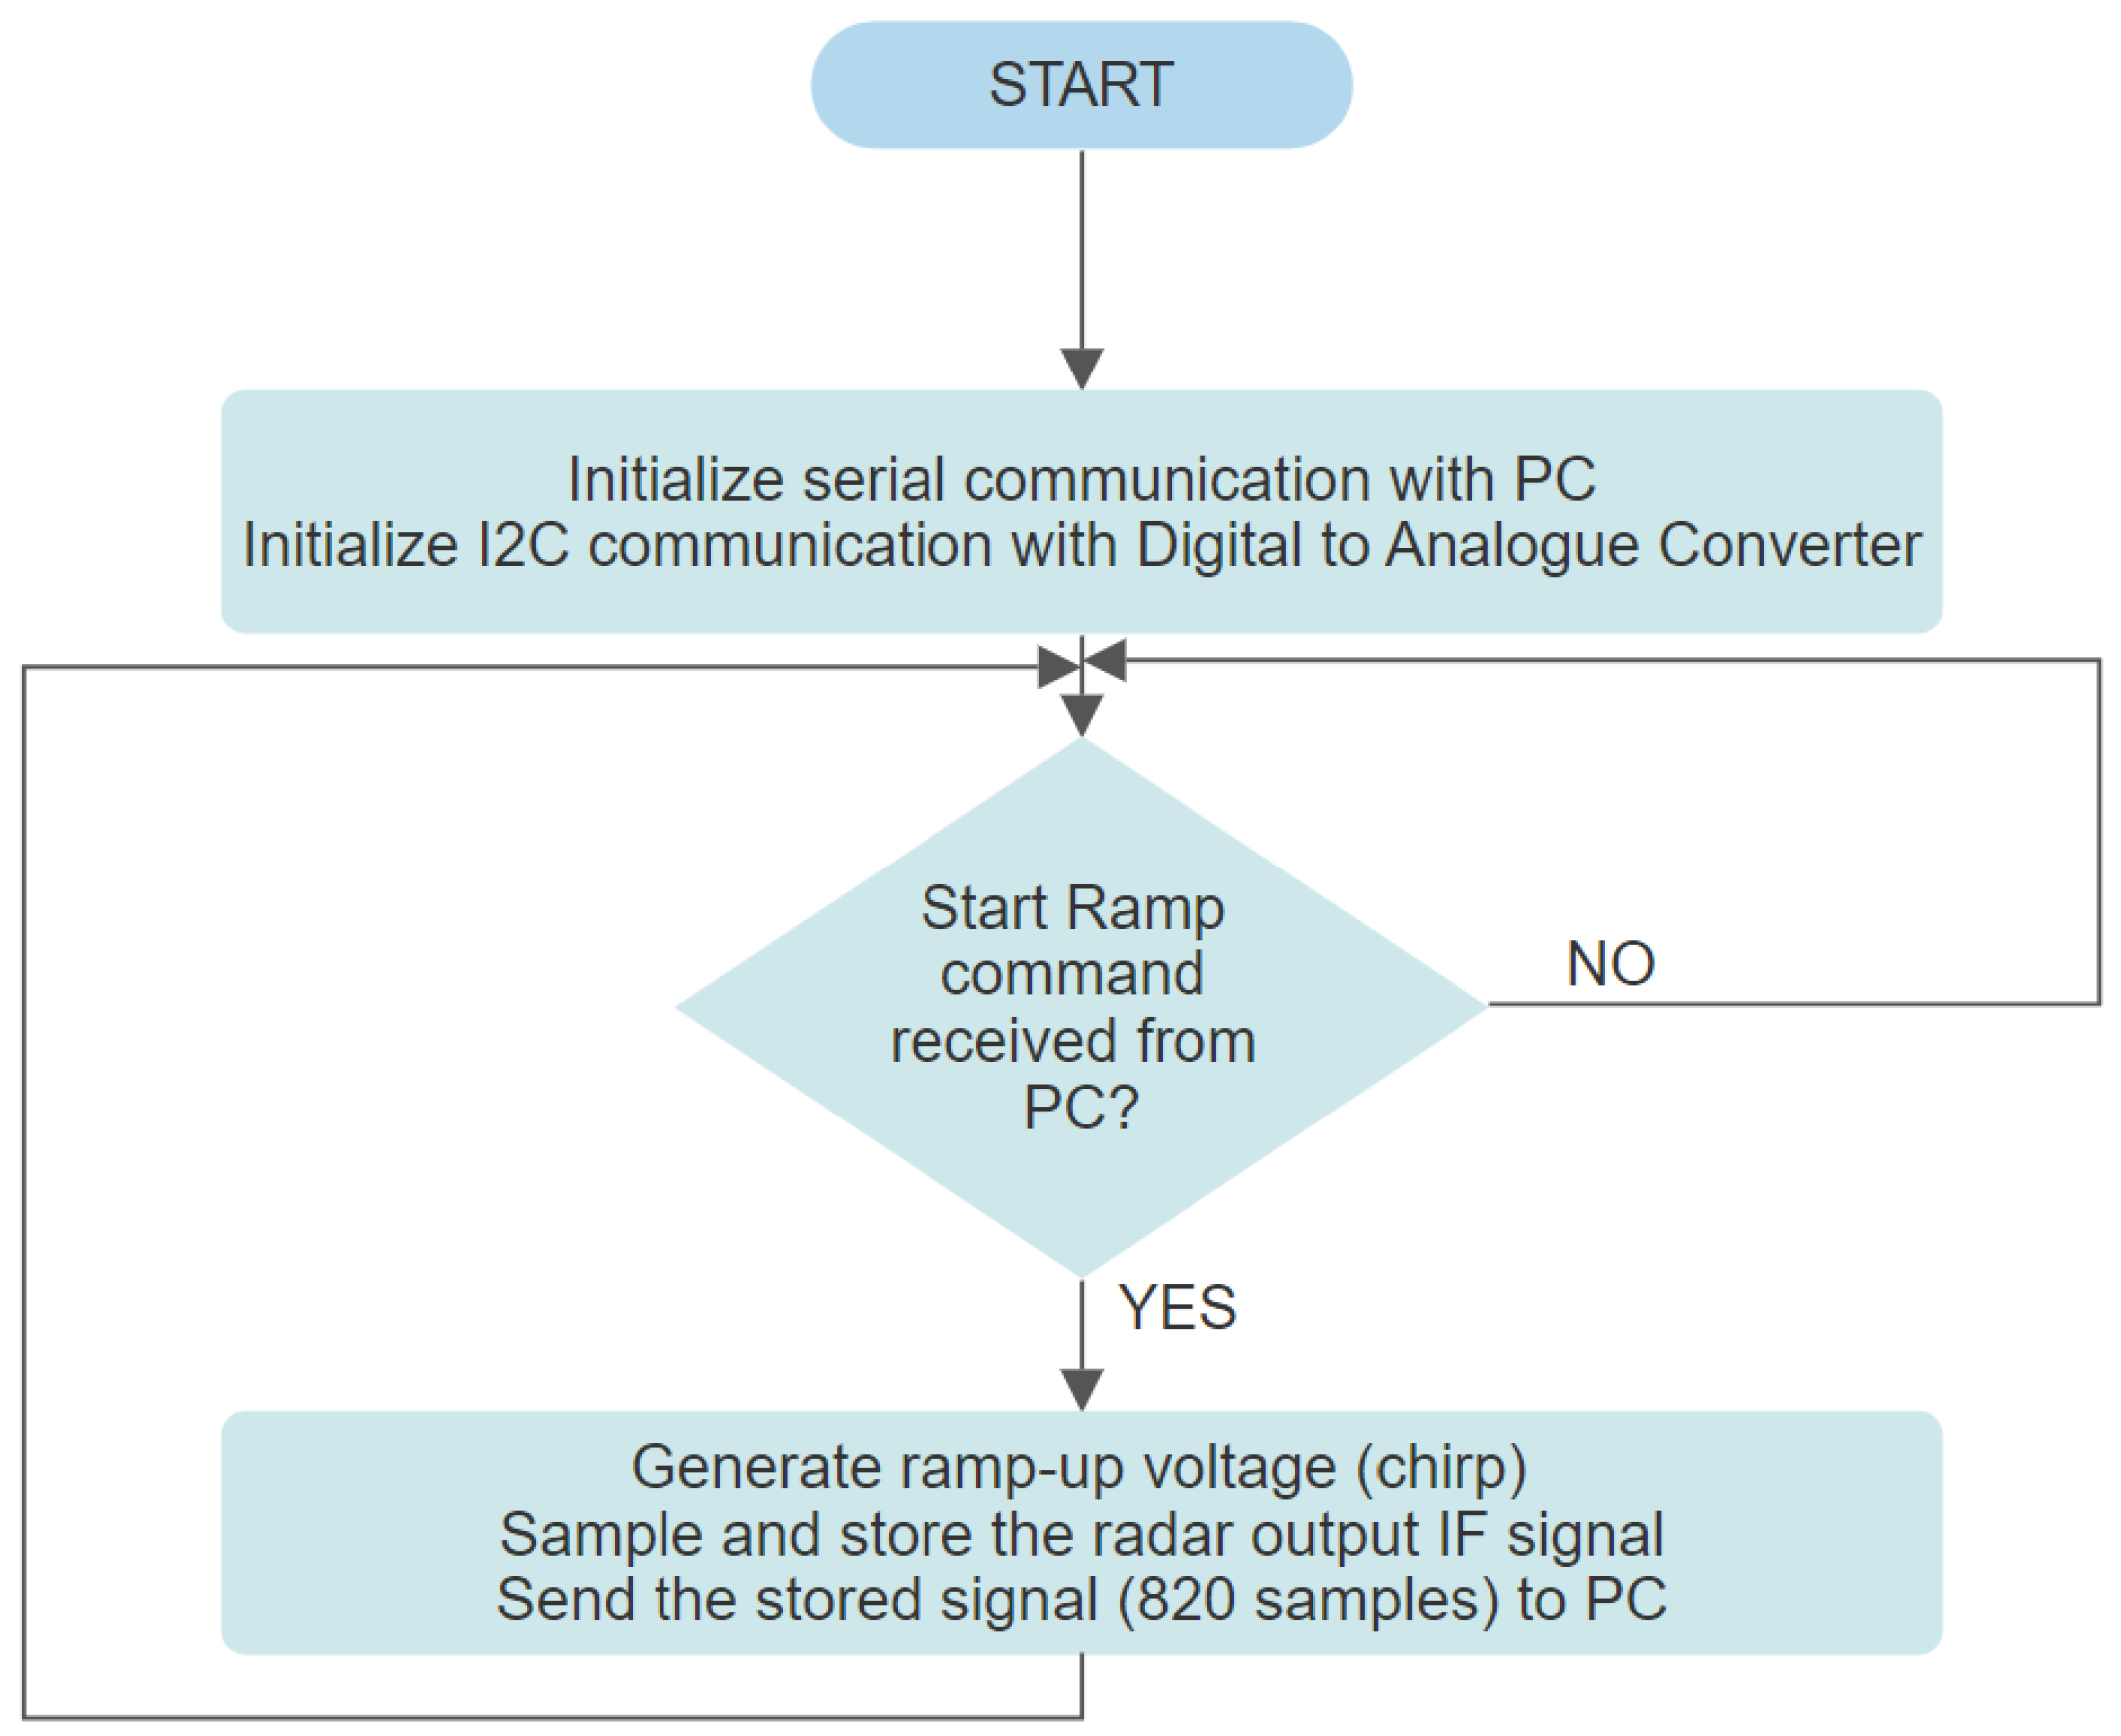
The program running on the TIVA-C TM4C-123GH6PM development board, the digital section of the radar module, implements the flowchart in Figure 5.
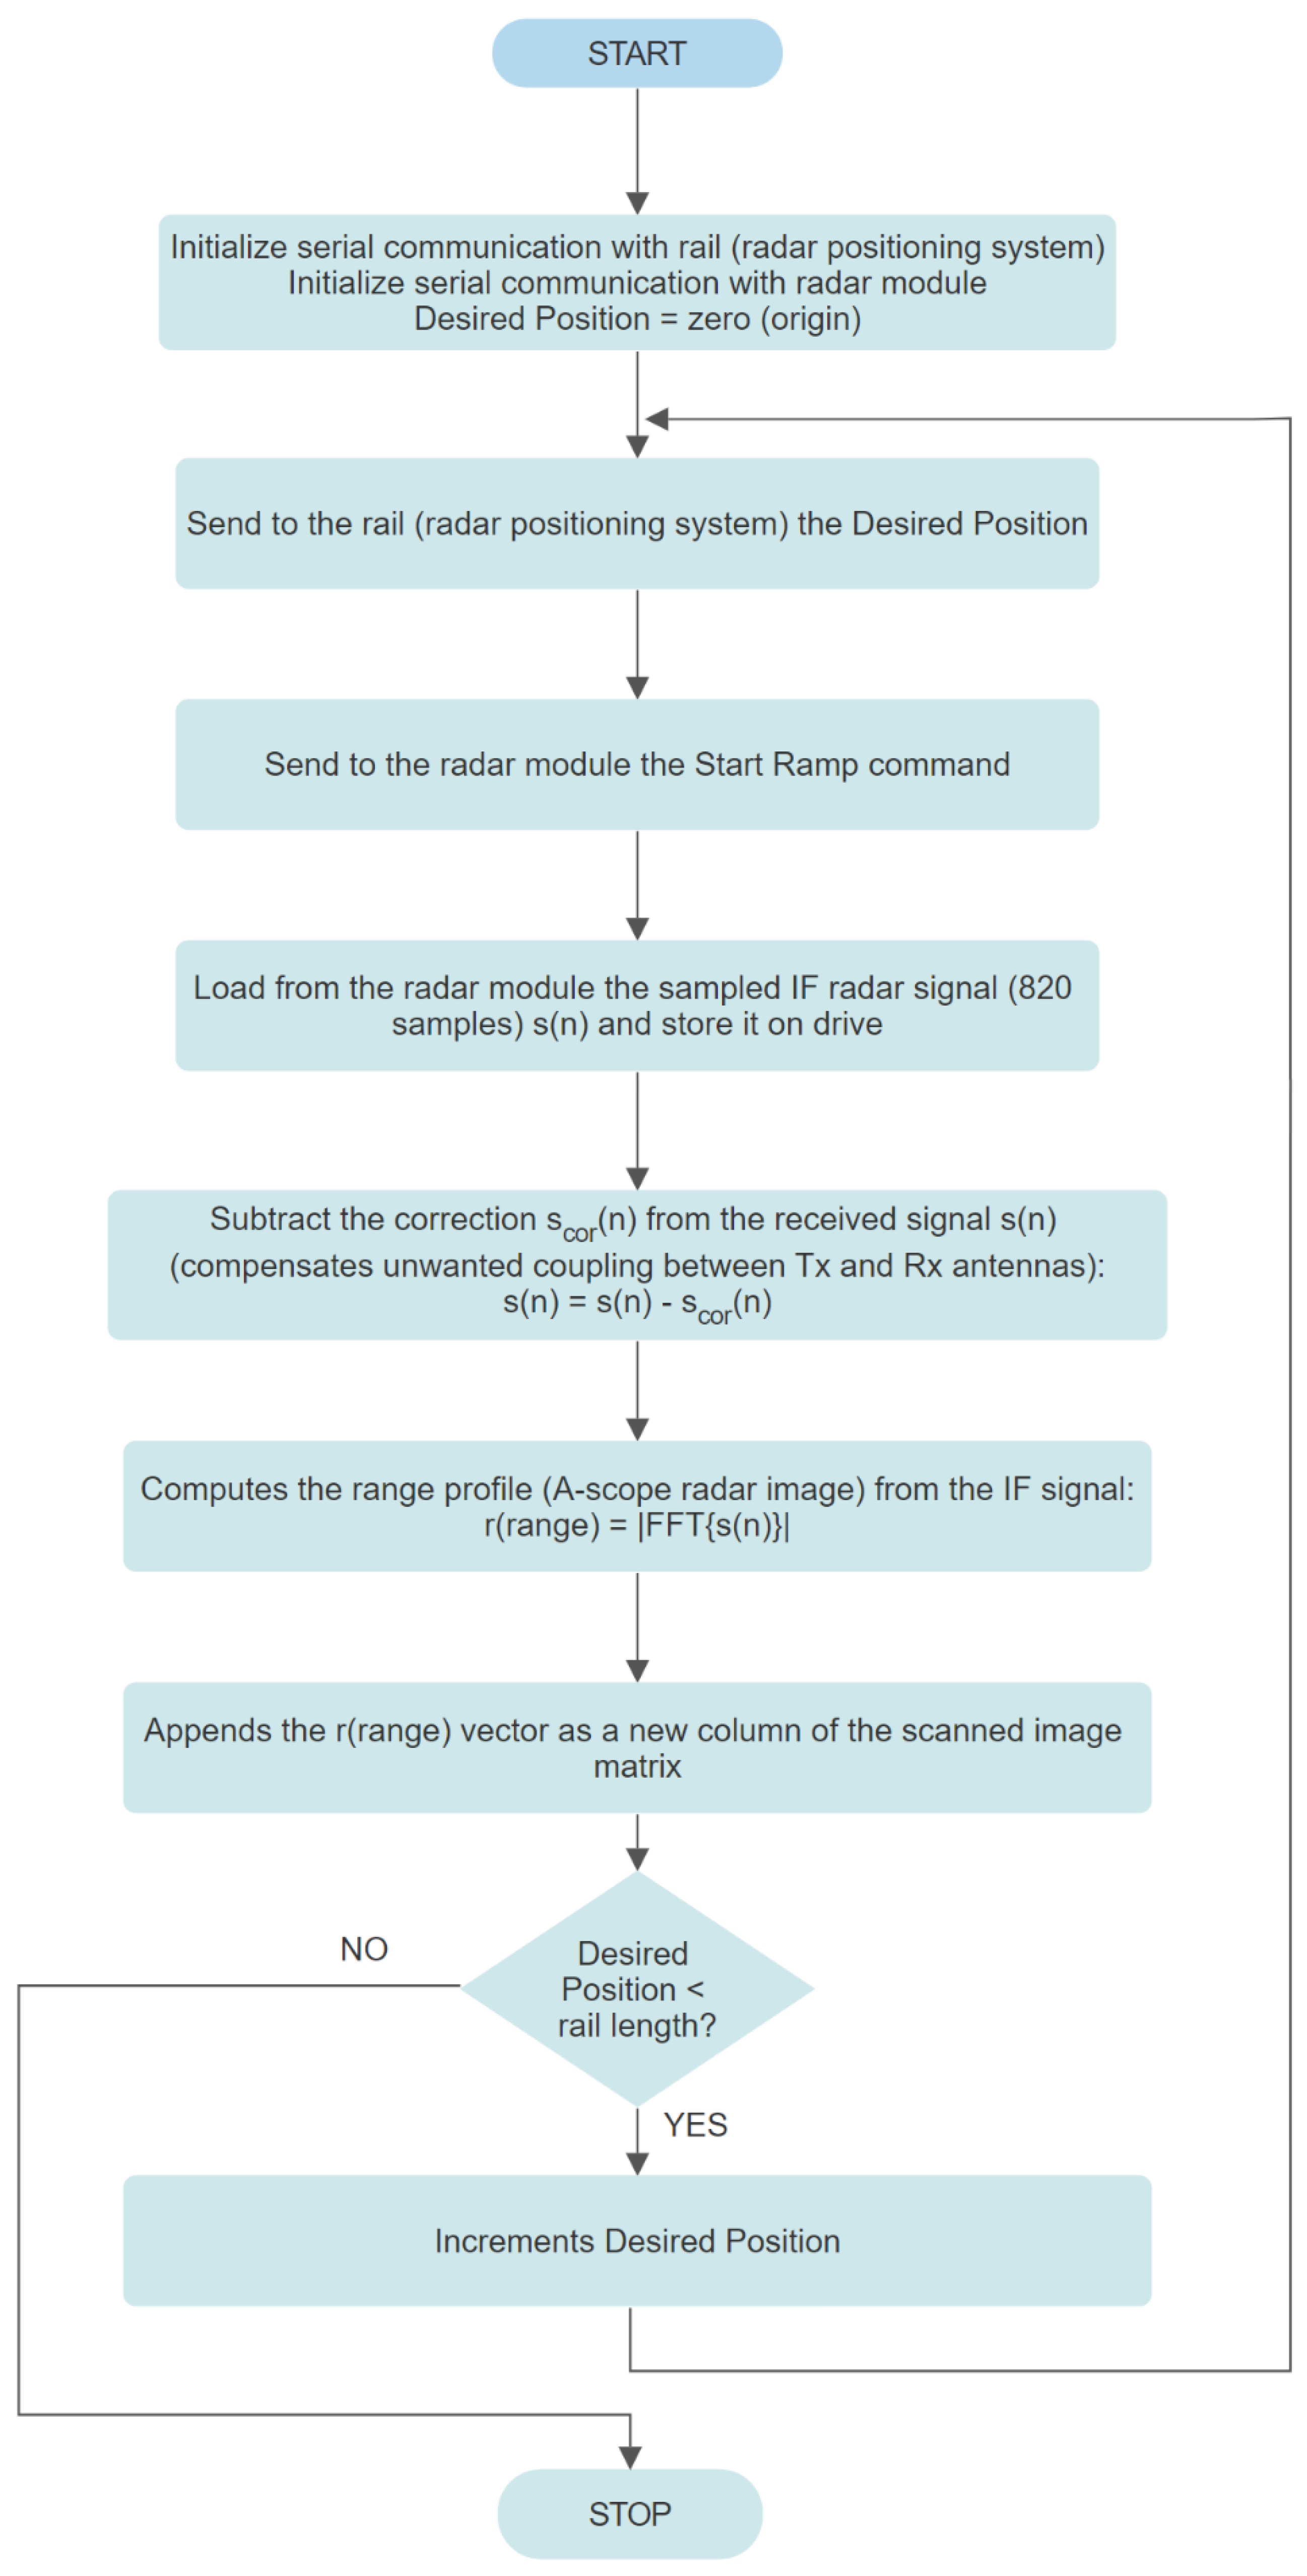
The program running on the PC implements the flowchart presented in Figure 6. The scor(n) correction signal is the radar output IF signal obtained in a reflection-free environment, the anechoic chamber. Range argument in r(range) is the discrete range or distance vector. FFT designates the Fast Fourier Transform.
In order to improve the azimuth resolution of the image created by the radar system, thanks to the coherency of the radar sensor module, synthetic aperture focusing can be applied on the stored raw data. The proposed SAR focusing algorithm is a Backprojection type algorithm operating in time-domain, inspired by [13,14].
The derivation of the focusing algorithm starts with the FMCW radar signal model. The transmitted waveform has the expression:
st(t) = cos (2πfst - πγt2),
where time t is the time variable 0 < t < T, T is the sweep duration, fs is the starting frequency of the sweep, γ is the sweep rate γ = B / T and B is the bandwidth of the sweep.
The received echo is a scaled time-delayed copy of the transmitted signal. If we ignore the amplitude scaling, the received signal is:
sr(t) = st(t - td) = cos [2πfs(t-td) - πγ(t-td)2],
where td is the time delay.
The radar sensor mixes the transmitted signal with the received signal. After filtering out the high frequency undesired components and neglecting the ½ scaling, the signal at the radar module IF (intermediate frequency) output, assuming a real valued (not complex) output, is:
sIF(t) = cos (-2πfstd - πγtd2 + 2πγtdt).
During the scan, the radar repeats this measurement while moving on a straight path, the rail, with constant distance increments. The position of the radar on the path is:
x = n Δx,
where Δx is the position increment on the rail and n designates the index of the radar position. For simplicity we assume the radar path starts from the origin of the coordinate system and y=z=0, so that the radar position is completely determined only by x.
By accounting the fact that the electromagnetic waves travel at the speed of light and the radar signal travels to the target and then back to the radar, we get the following expression for the received signal time delay:
td = 2 d(r, x) / c,
where c is the speed of light and d(r, x) is the distance between the radar located at position x and the reflecting target located at position r(xt, yt, zt) and can be computed from the Pythagorean theorem as d(r, x) = ( x t x ) 2 + y t 2 + z t 2 .
By introducing equation (5) in equation (3) the radar sensor output signal can be written:
Preprints 99632 i001
d2(r, x)].
By neglecting the last term in the cosine function argument, the so-called residual video phase term, and taking into account equation (4) the IF radar output signal can be written as:
Preprints 99632 i002
After sampling by the ADC (Analog to Digital) converter the IF signal becomes:
sIF(n, m) = sIF(n, mTs),
where t = mTs, Ts is the sampling period of the ADC and m is the sample index.
The most straight-forward method for generating a SAR focused image is to apply a matched filtering. For each pixel in the output image, we can calculate what the measured IF signal would have been if there was a target located at that pixel location r. Matched filtering the measured signal with the expected signal will produce a high value when the measurement matches the expectation. We need to repeat the filtering process for each pixel in the output in order to obtain the focused image.
The mathematical expression for filtering one pixel is:
Preprints 99632 i003
where I(r) is the focused image matrix, r is the location of the pixel, N is the total number of radar sweeps or scan positions, M is the total number of samples of the IF signal and sref[n, m] is the so-called reference function or expected IF response for an isotropic point scatterer:
Preprints 99632 i004
In order to obtain a complex image suitable for interferometric processing, the complex representation of the reference function will be used:
Preprints 99632 i005
We can implement the focusing algorithm directly by applying iteratively equation (9) for every pixel in the image. This approach is called the Matched Filter Algorithm. It works very well in terms of focused image quality, but it needs a huge number of arithmetic operations, making it unsuitable for large images. It has a computational complexity of O(n4).
Fortunately, there is a way to reduce the complexity to O(n3) by factoring the complex reference function into two parts:
Preprints 99632 i006
Now we can rewrite equation (9) as:
Preprints 99632 i007
Equation (13) can now be rewritten using the Direct Discrete Fourier Transform, which, if implemented using the efficient algorithm called FFT (Fast Fourier Transform) reduces the computational complexity by one order of magnitude.
The definition of the Direct FFT applied to sIF(n, m) is:
Preprints 99632 i008
In order to write equation (13) in terms of Direct FFT we need to solve for the index k in the equation:
Preprints 99632 i009
This leads to:
Preprints 99632 i010
Using γ = B / T and Ts = T / M we can rewrite k as:
Preprints 99632 i011
Using k, we can rewrite equation (13) in terms of Direct FFT as:
Preprints 99632 i012
where SIF[n, k] is the Direct Fourier transform of sIF[n, m] along the second axis.
Due to the fact that k = 2 B c   d(r, nΔx) index in equation (18) is not always a whole number and FFT computes only for whole k numbers, an interpolation step is needed.
Equation (18) applied to each pixel in the final image represents the Backprojection SAR focusing algorithm.
Each pixel in the focused image is a complex number, so that the image can be used for interferometry applications.
The hardware solution proposed in this paper, in order to reduce complexity and costs, uses only one output of the radar sensor, IF_I , so the real-valued IF signal situation discussed above applies. Also, the transmitted signal is a down-chirp, as was the case in the derivation above.
The IF_Q output of the radar module is left unconnected and is not represented in the schematics.

2.2. GPR implementation

The second proposed implementation of the imaging system takes the form of a hand-held Ground Penetrating Radar (GPR). It builds upon the hardware of the GB-SAR implementation by adding a Bluetooth module for wireless connection with the PC, an encoder wheel and optocoupler for determining the radar position and a battery (powerbank). The new radar circuit has the schematic presented in Figure 7.
The encoder wheel has a diameter of 3.82 cm and 4 equally spaced holes which gives 4 pulses at the output of the U-shaped optocoupler for every revolution. This means a pulse for every 3 cm traveled by the GPR. Every pulse triggers a scan producing an A-scope image, so that the azimuth sampling step of the radar image is 3 cm.
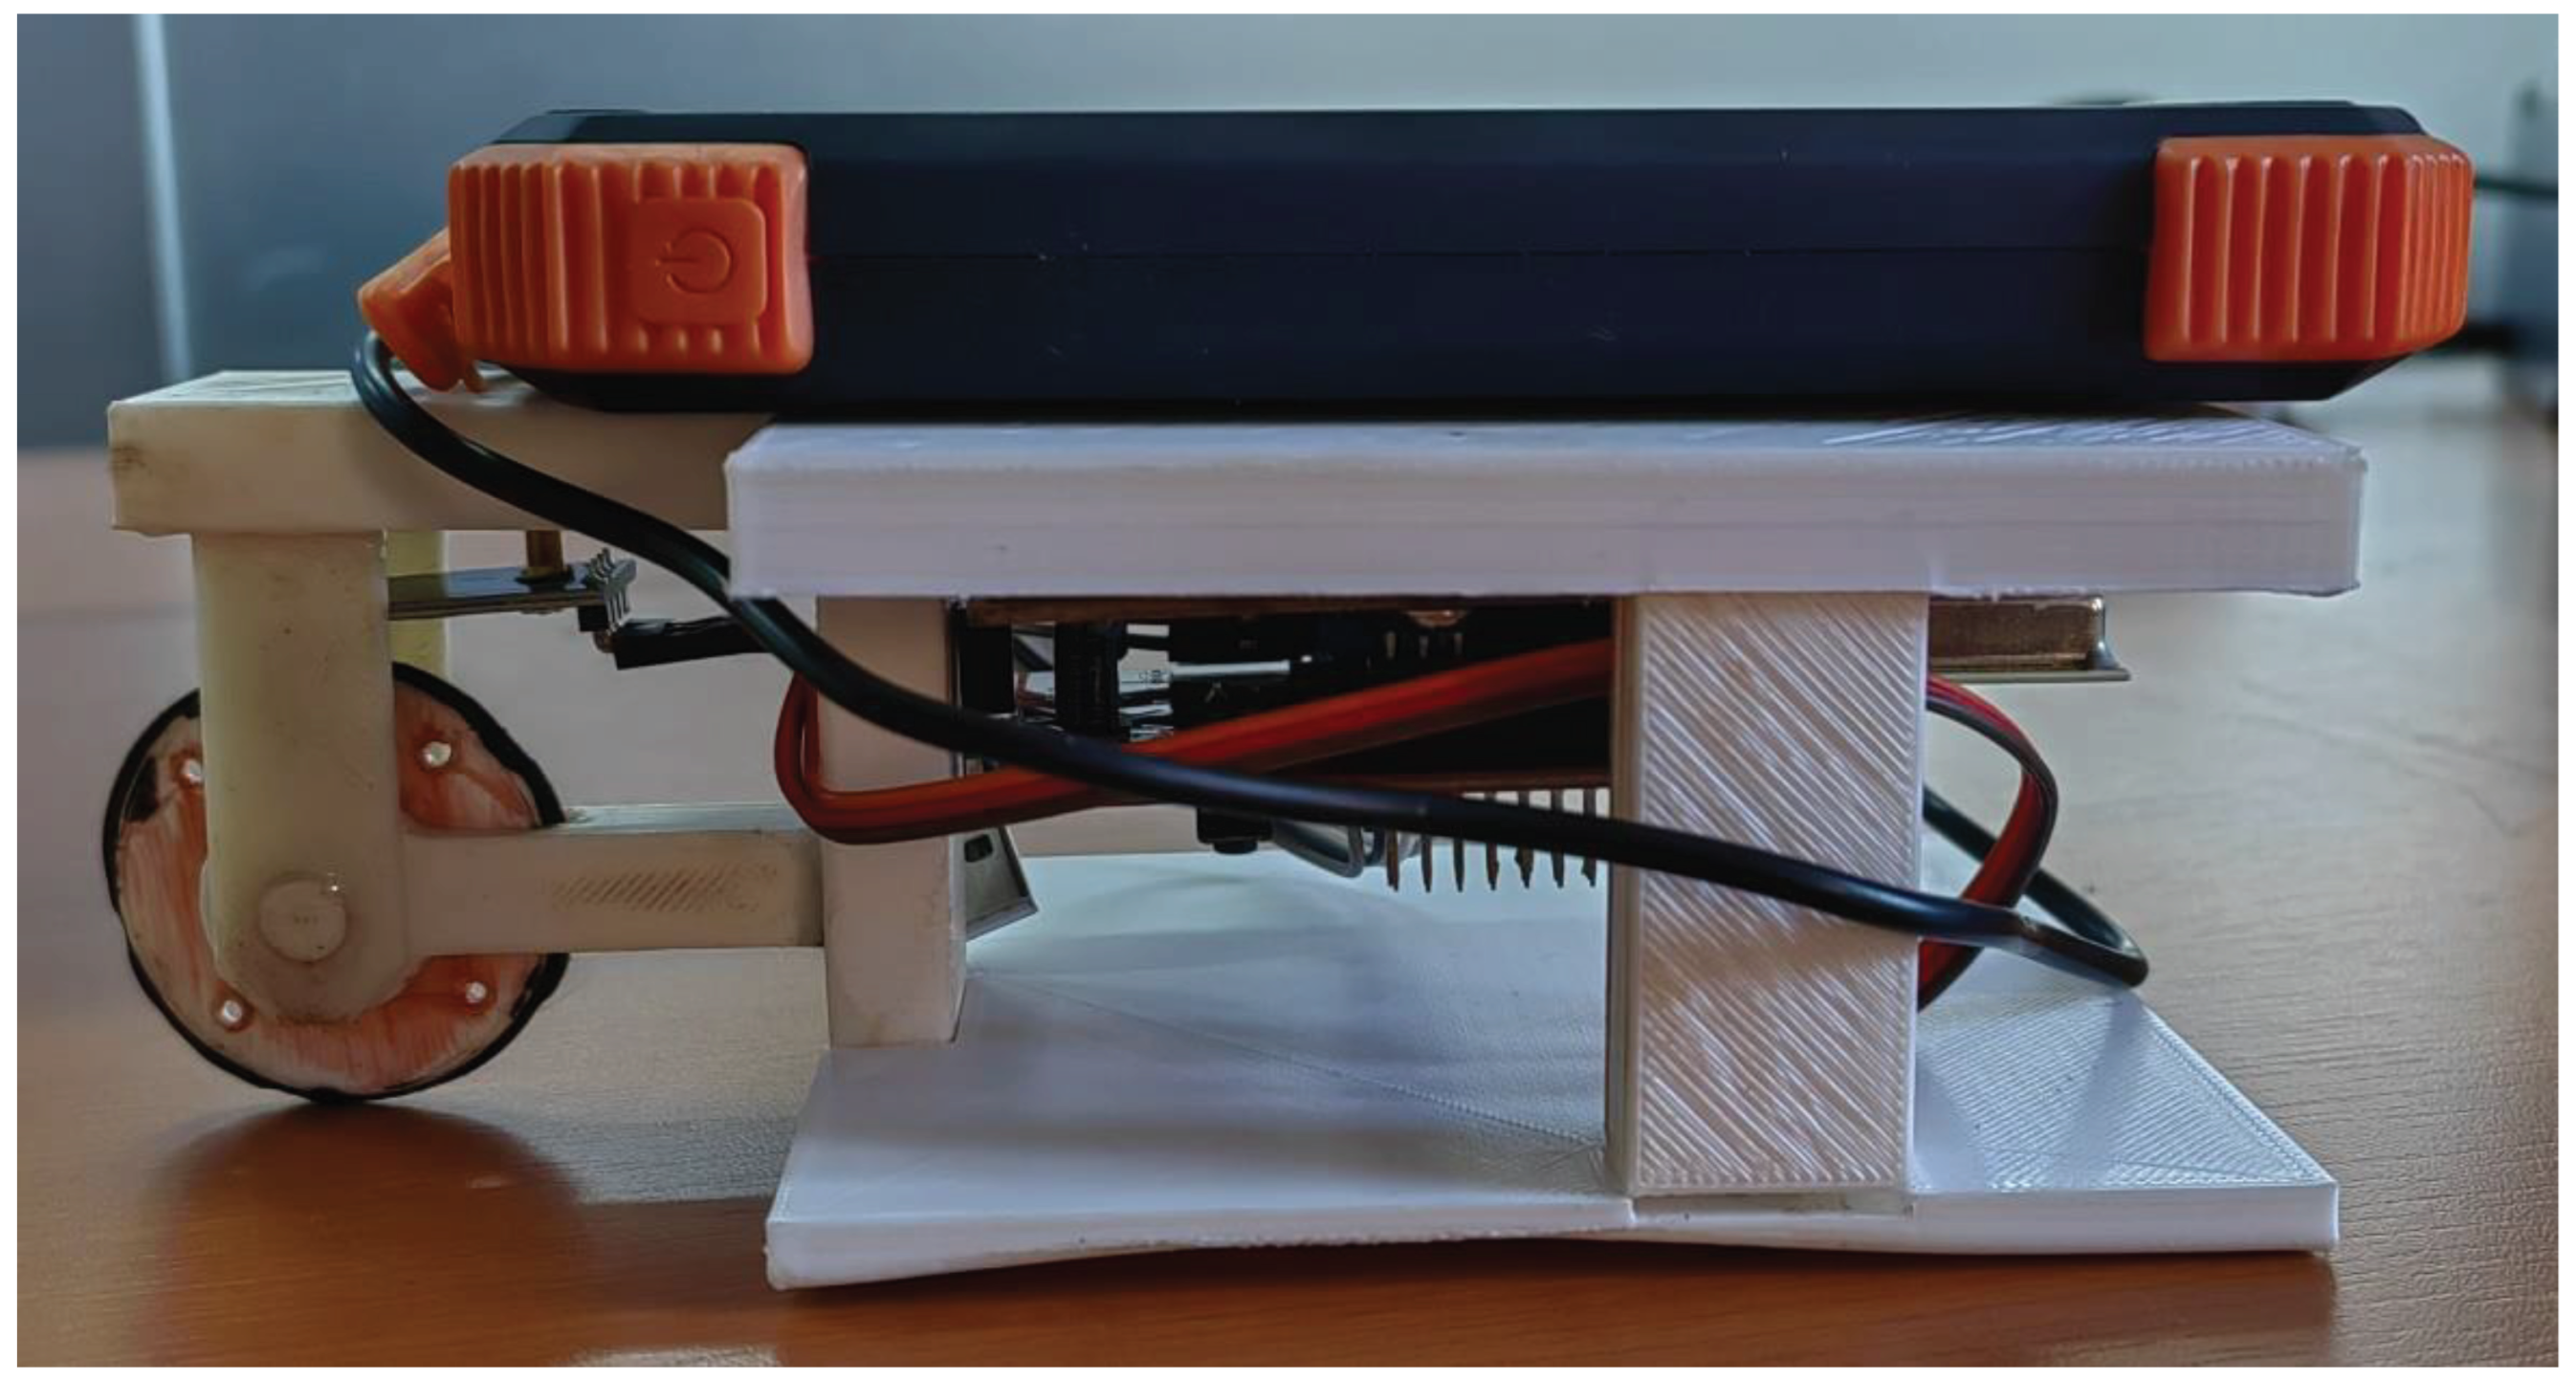
The practical implementation of the GPR system is presented in Figure 8.
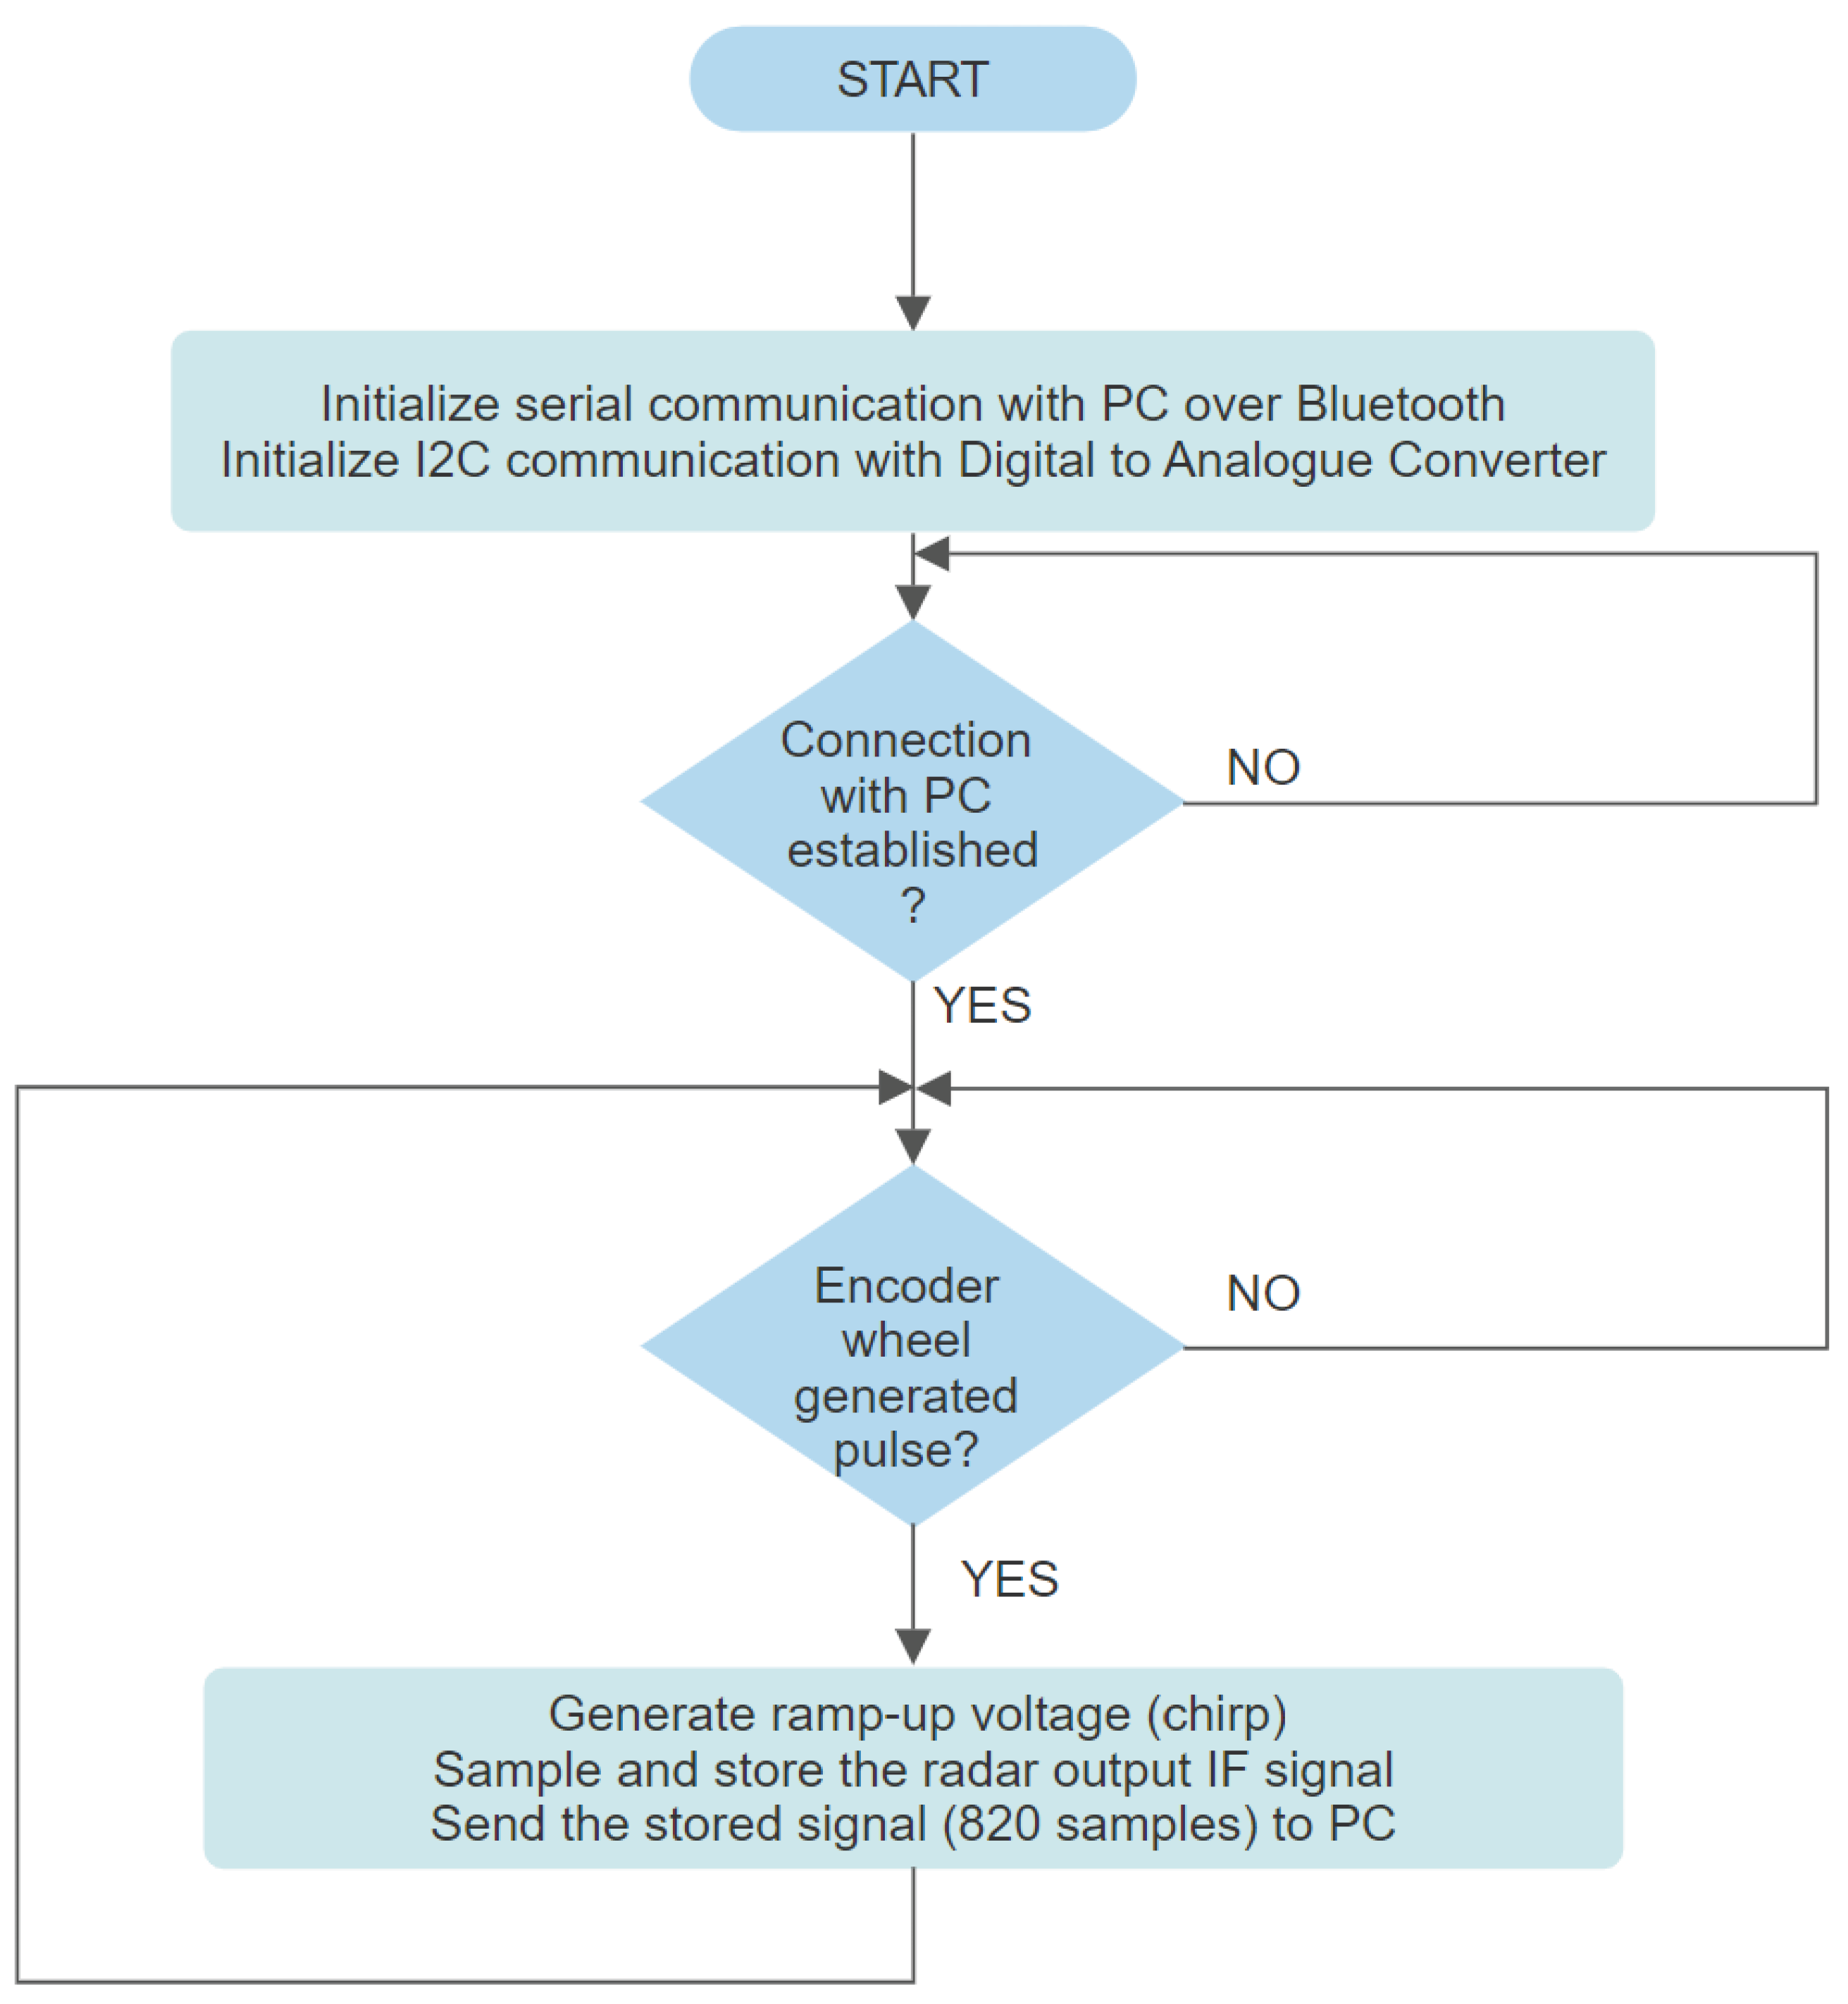
The program running on the TIVA-C TM4C-123GH6PM development board, the digital section of the radar module, implements the flowchart in Figure 9.
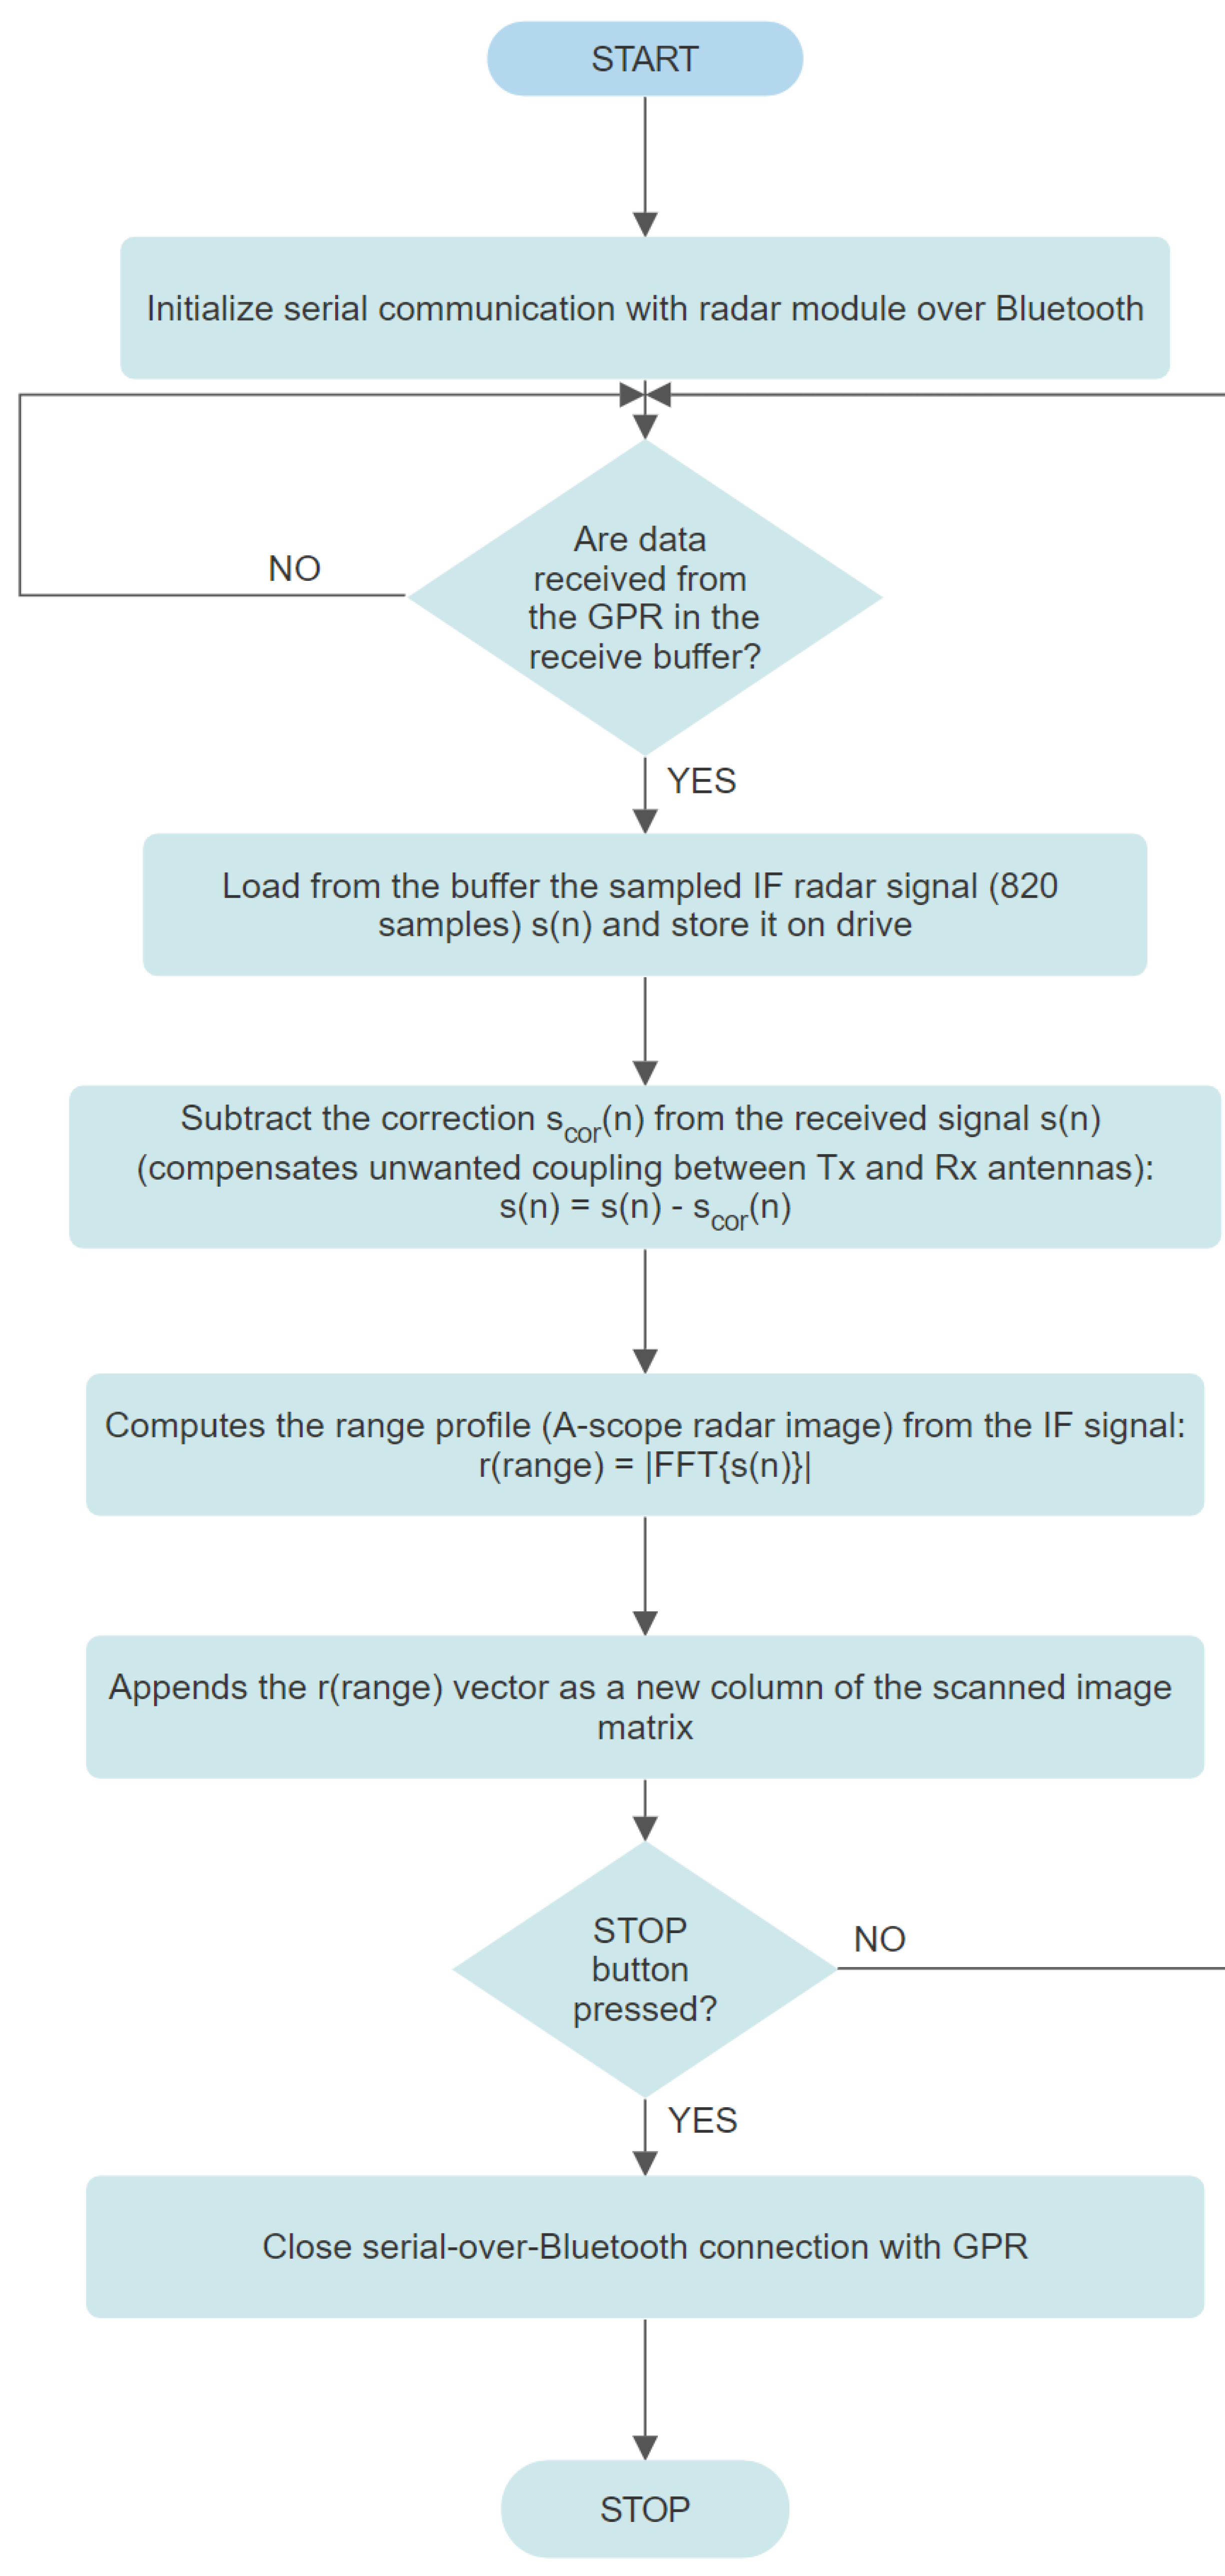
The program running on the PC implements the flowchart presented in Figure 10. The scor(n) correction signal is the radar output IF signal obtained in a reflection-free environment, the anechoic chamber. Range argument in r(range) is the discrete range or distance vector. FFT designates the Fast Fourier Transform.

3. Results

3.1. GB-SAR results

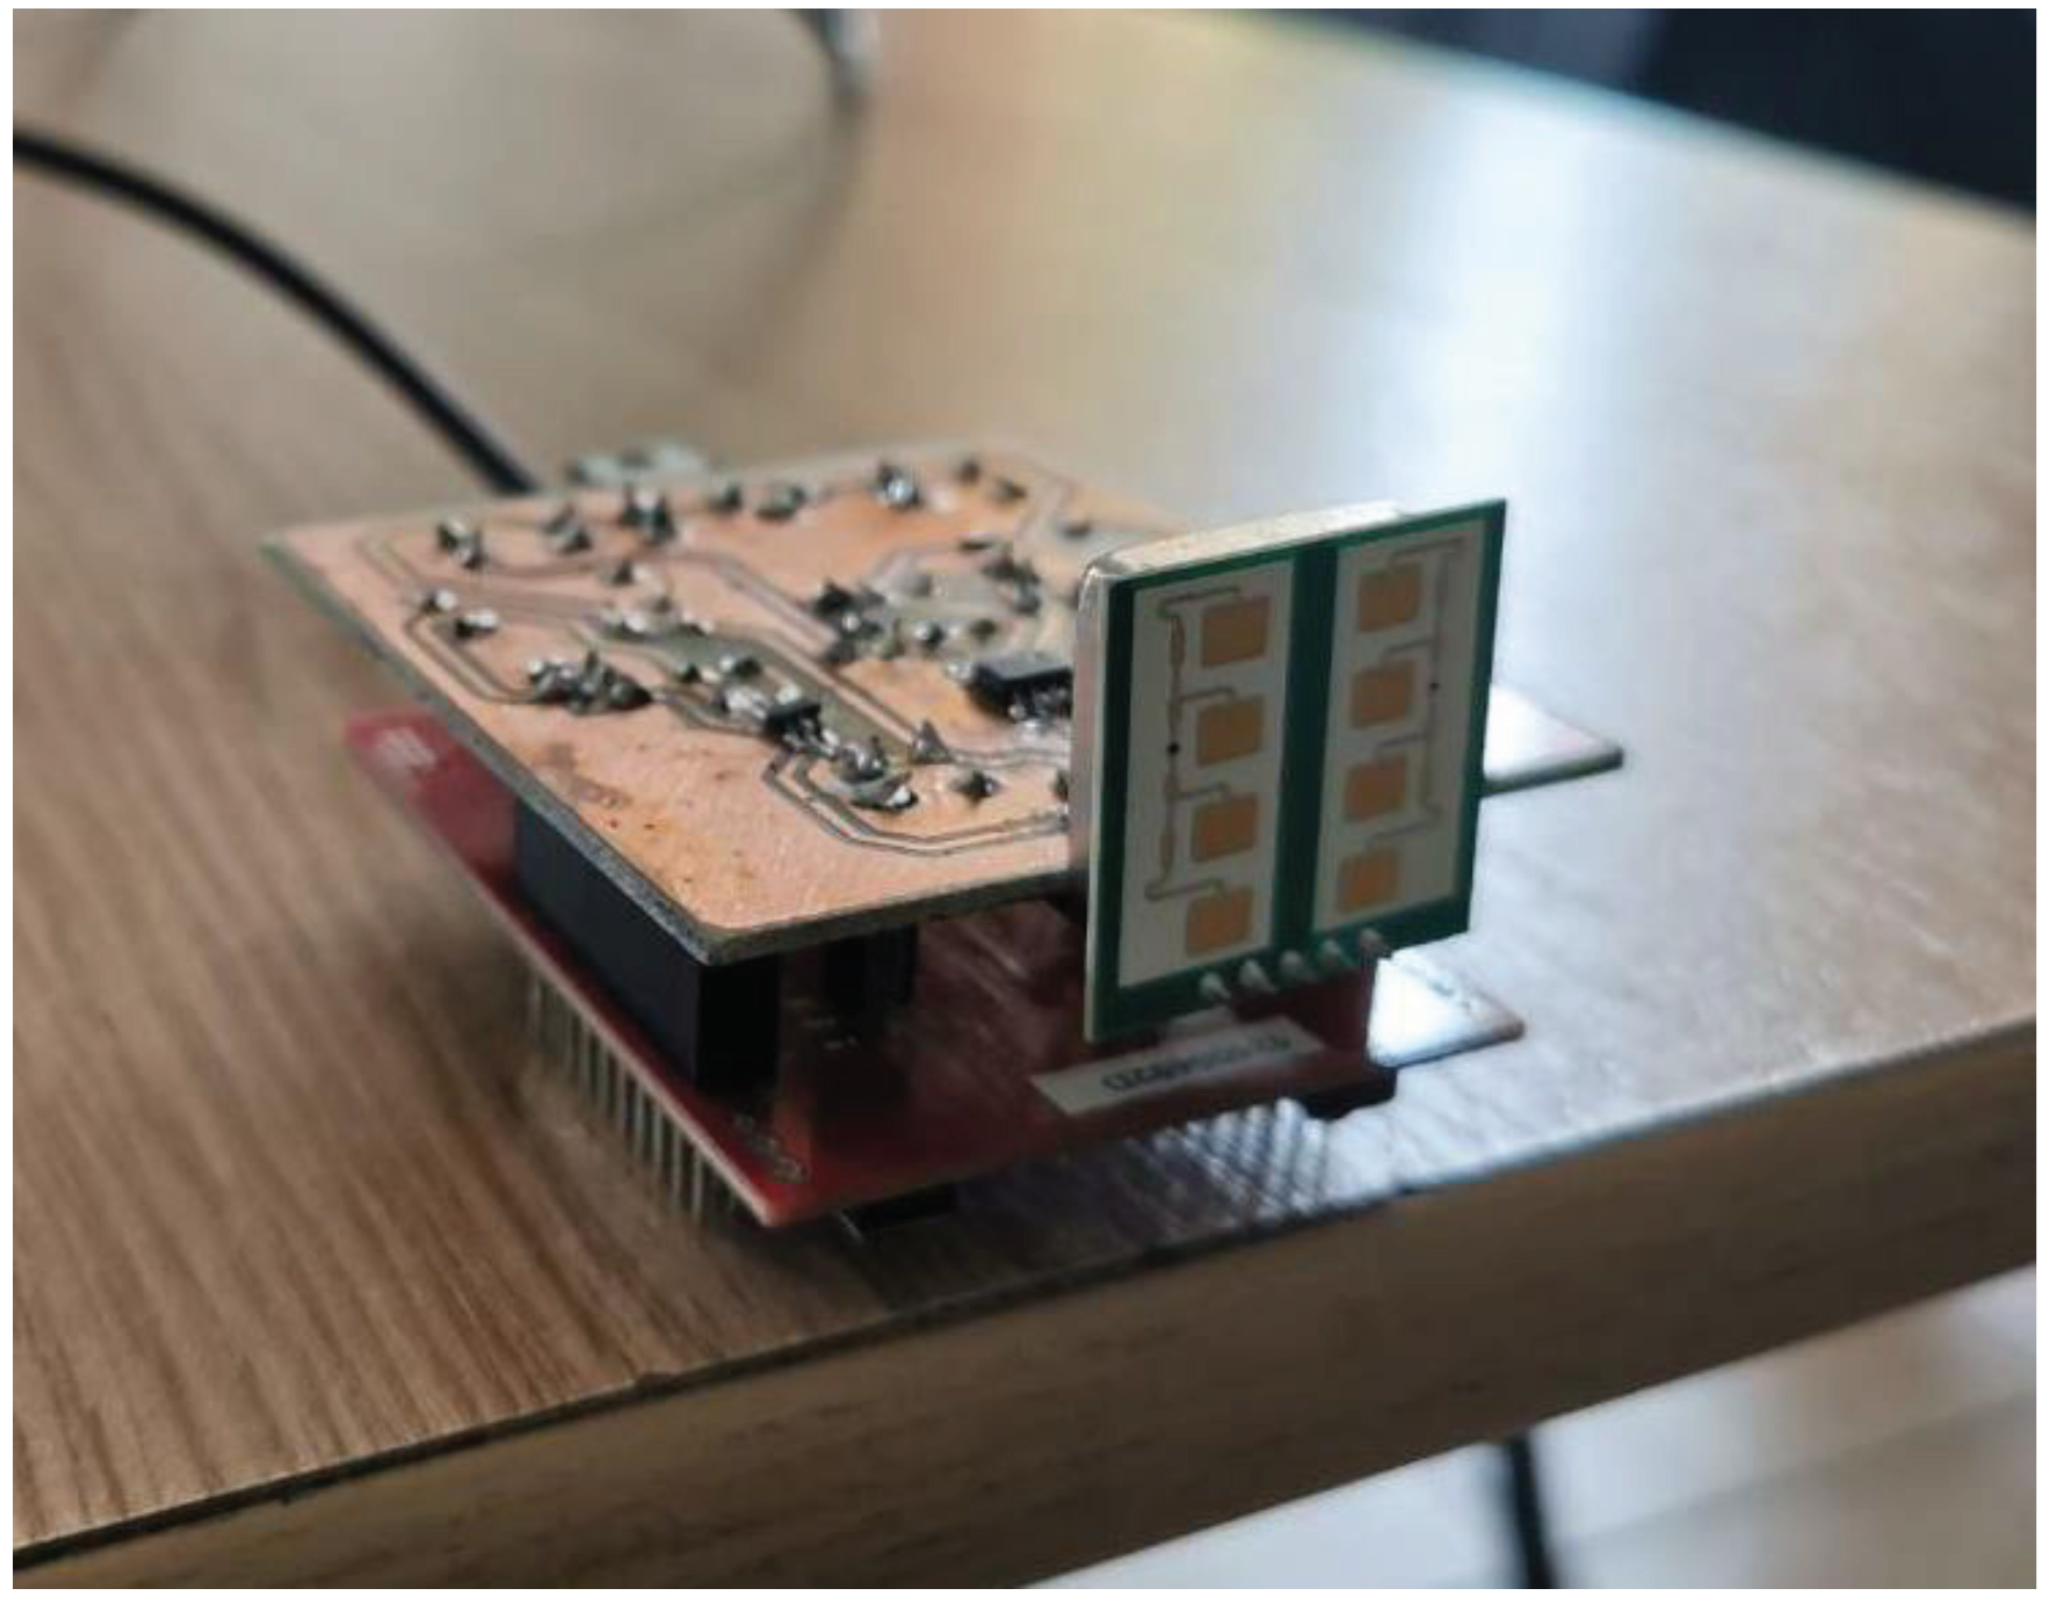
In Figure 11 the hardware implementation of the GB-SAR radar module is depicted. During the scanning process, it is moved by the carriage on the computer-controlled rail.
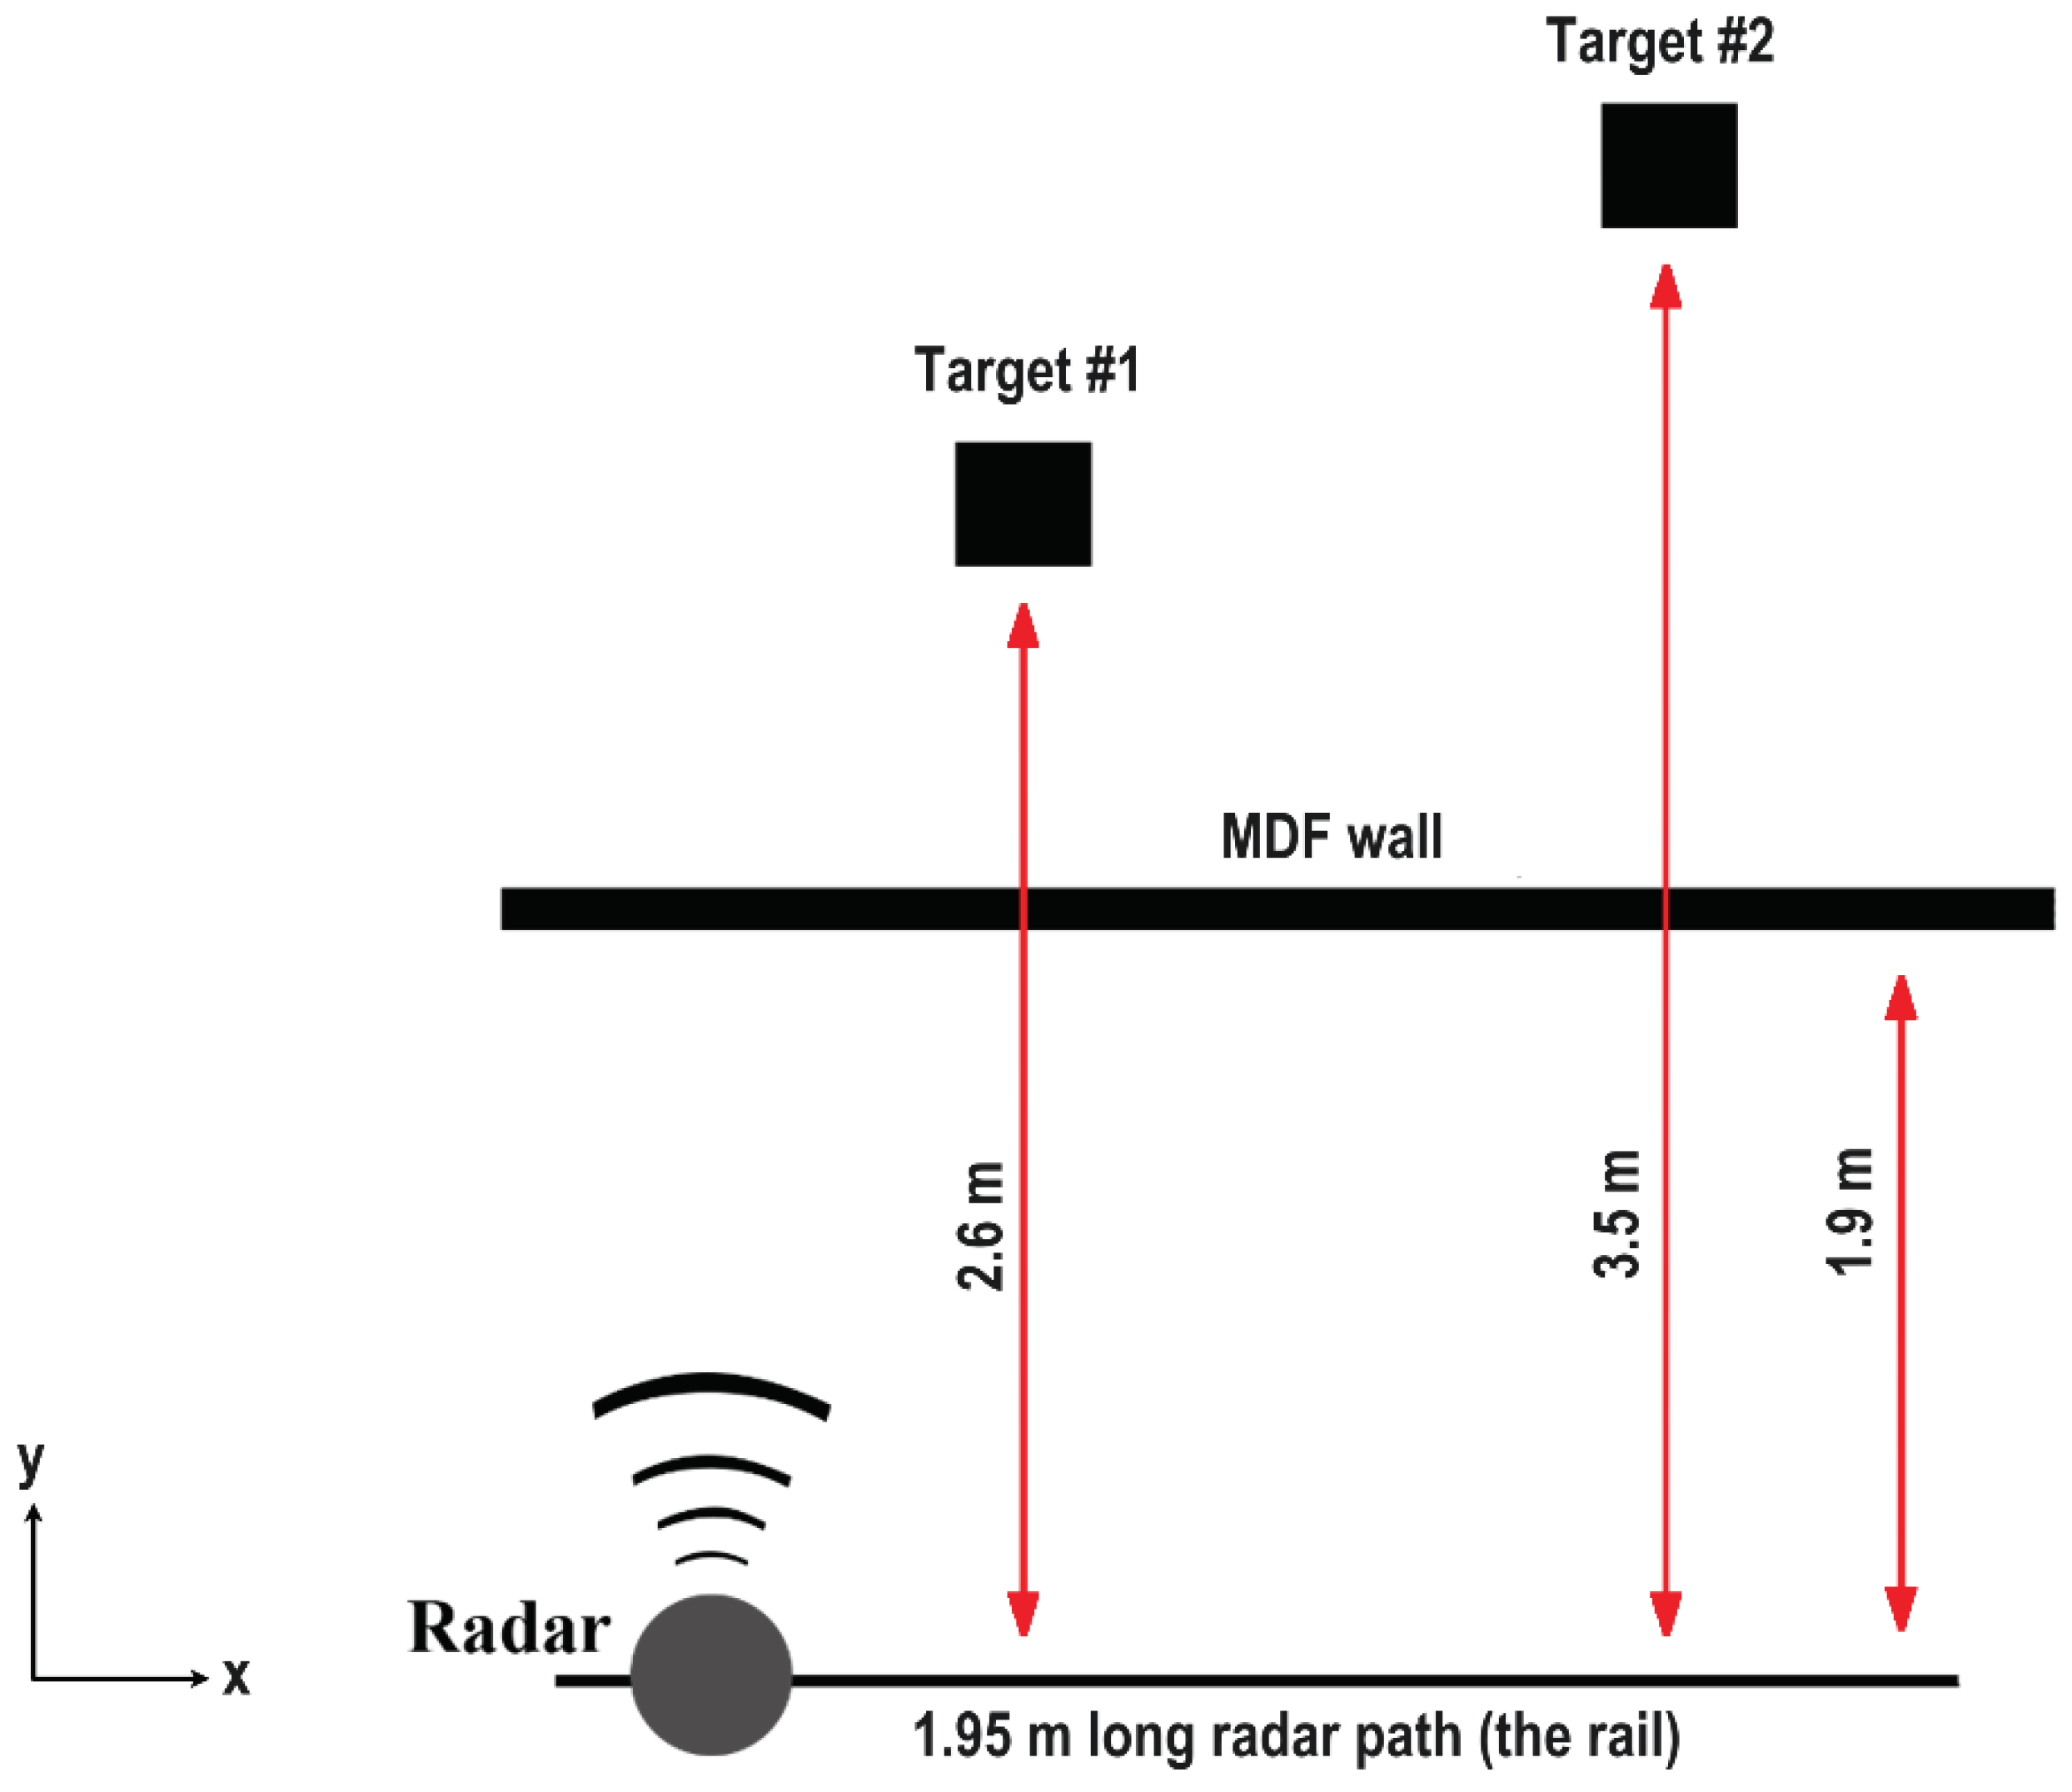
The system was tested using the setup described in Figure 12. Two cylindrical metal targets represented by two fire extinguishers were placed behind a 3 cm thick MDF (medium-density fiberboard) wall.
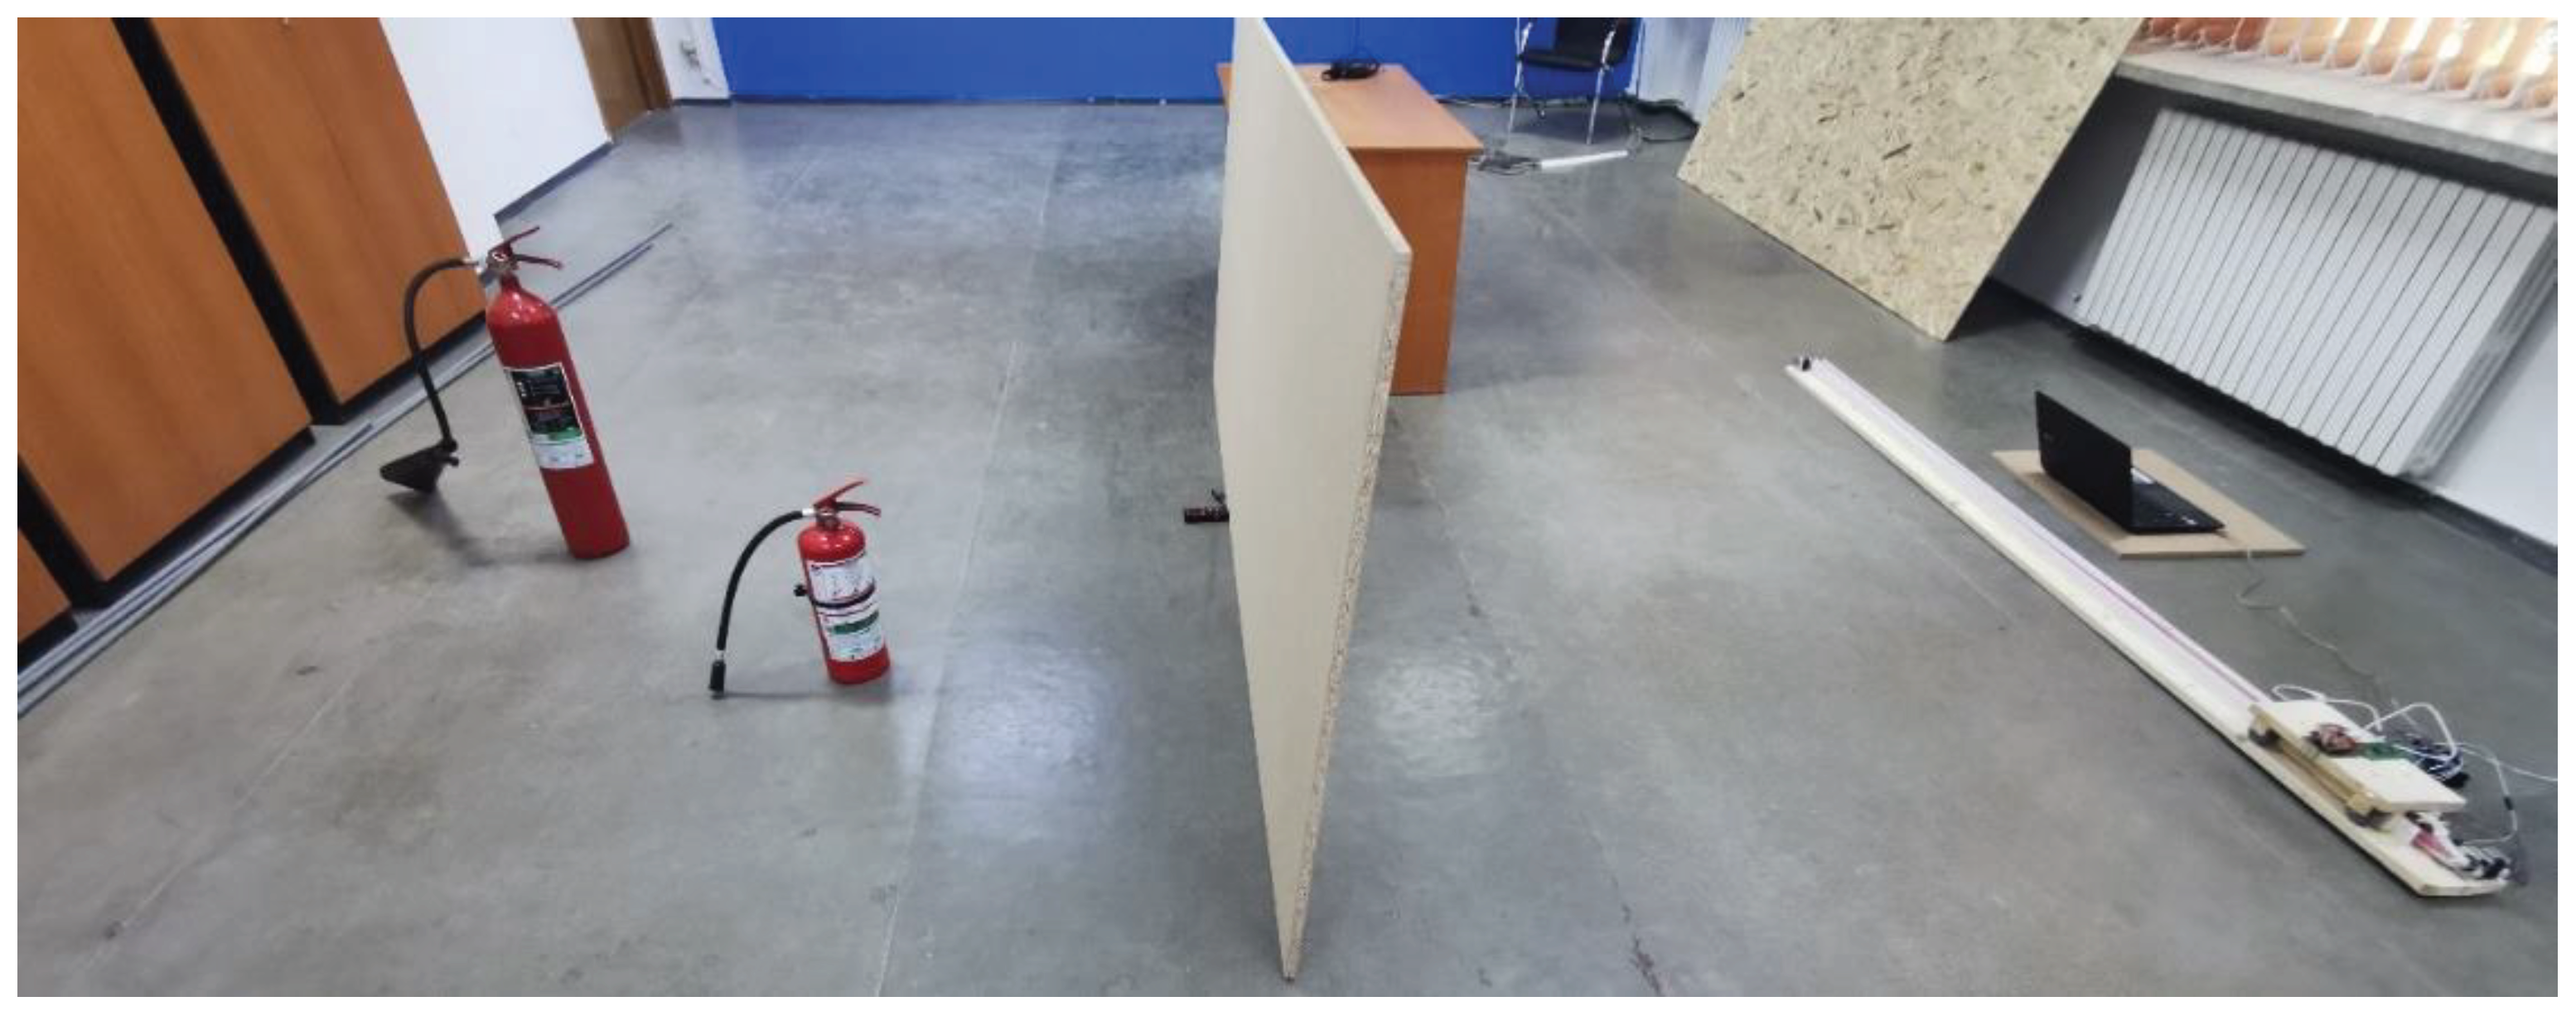
In Figure 13 a picture of the real setup is presented.
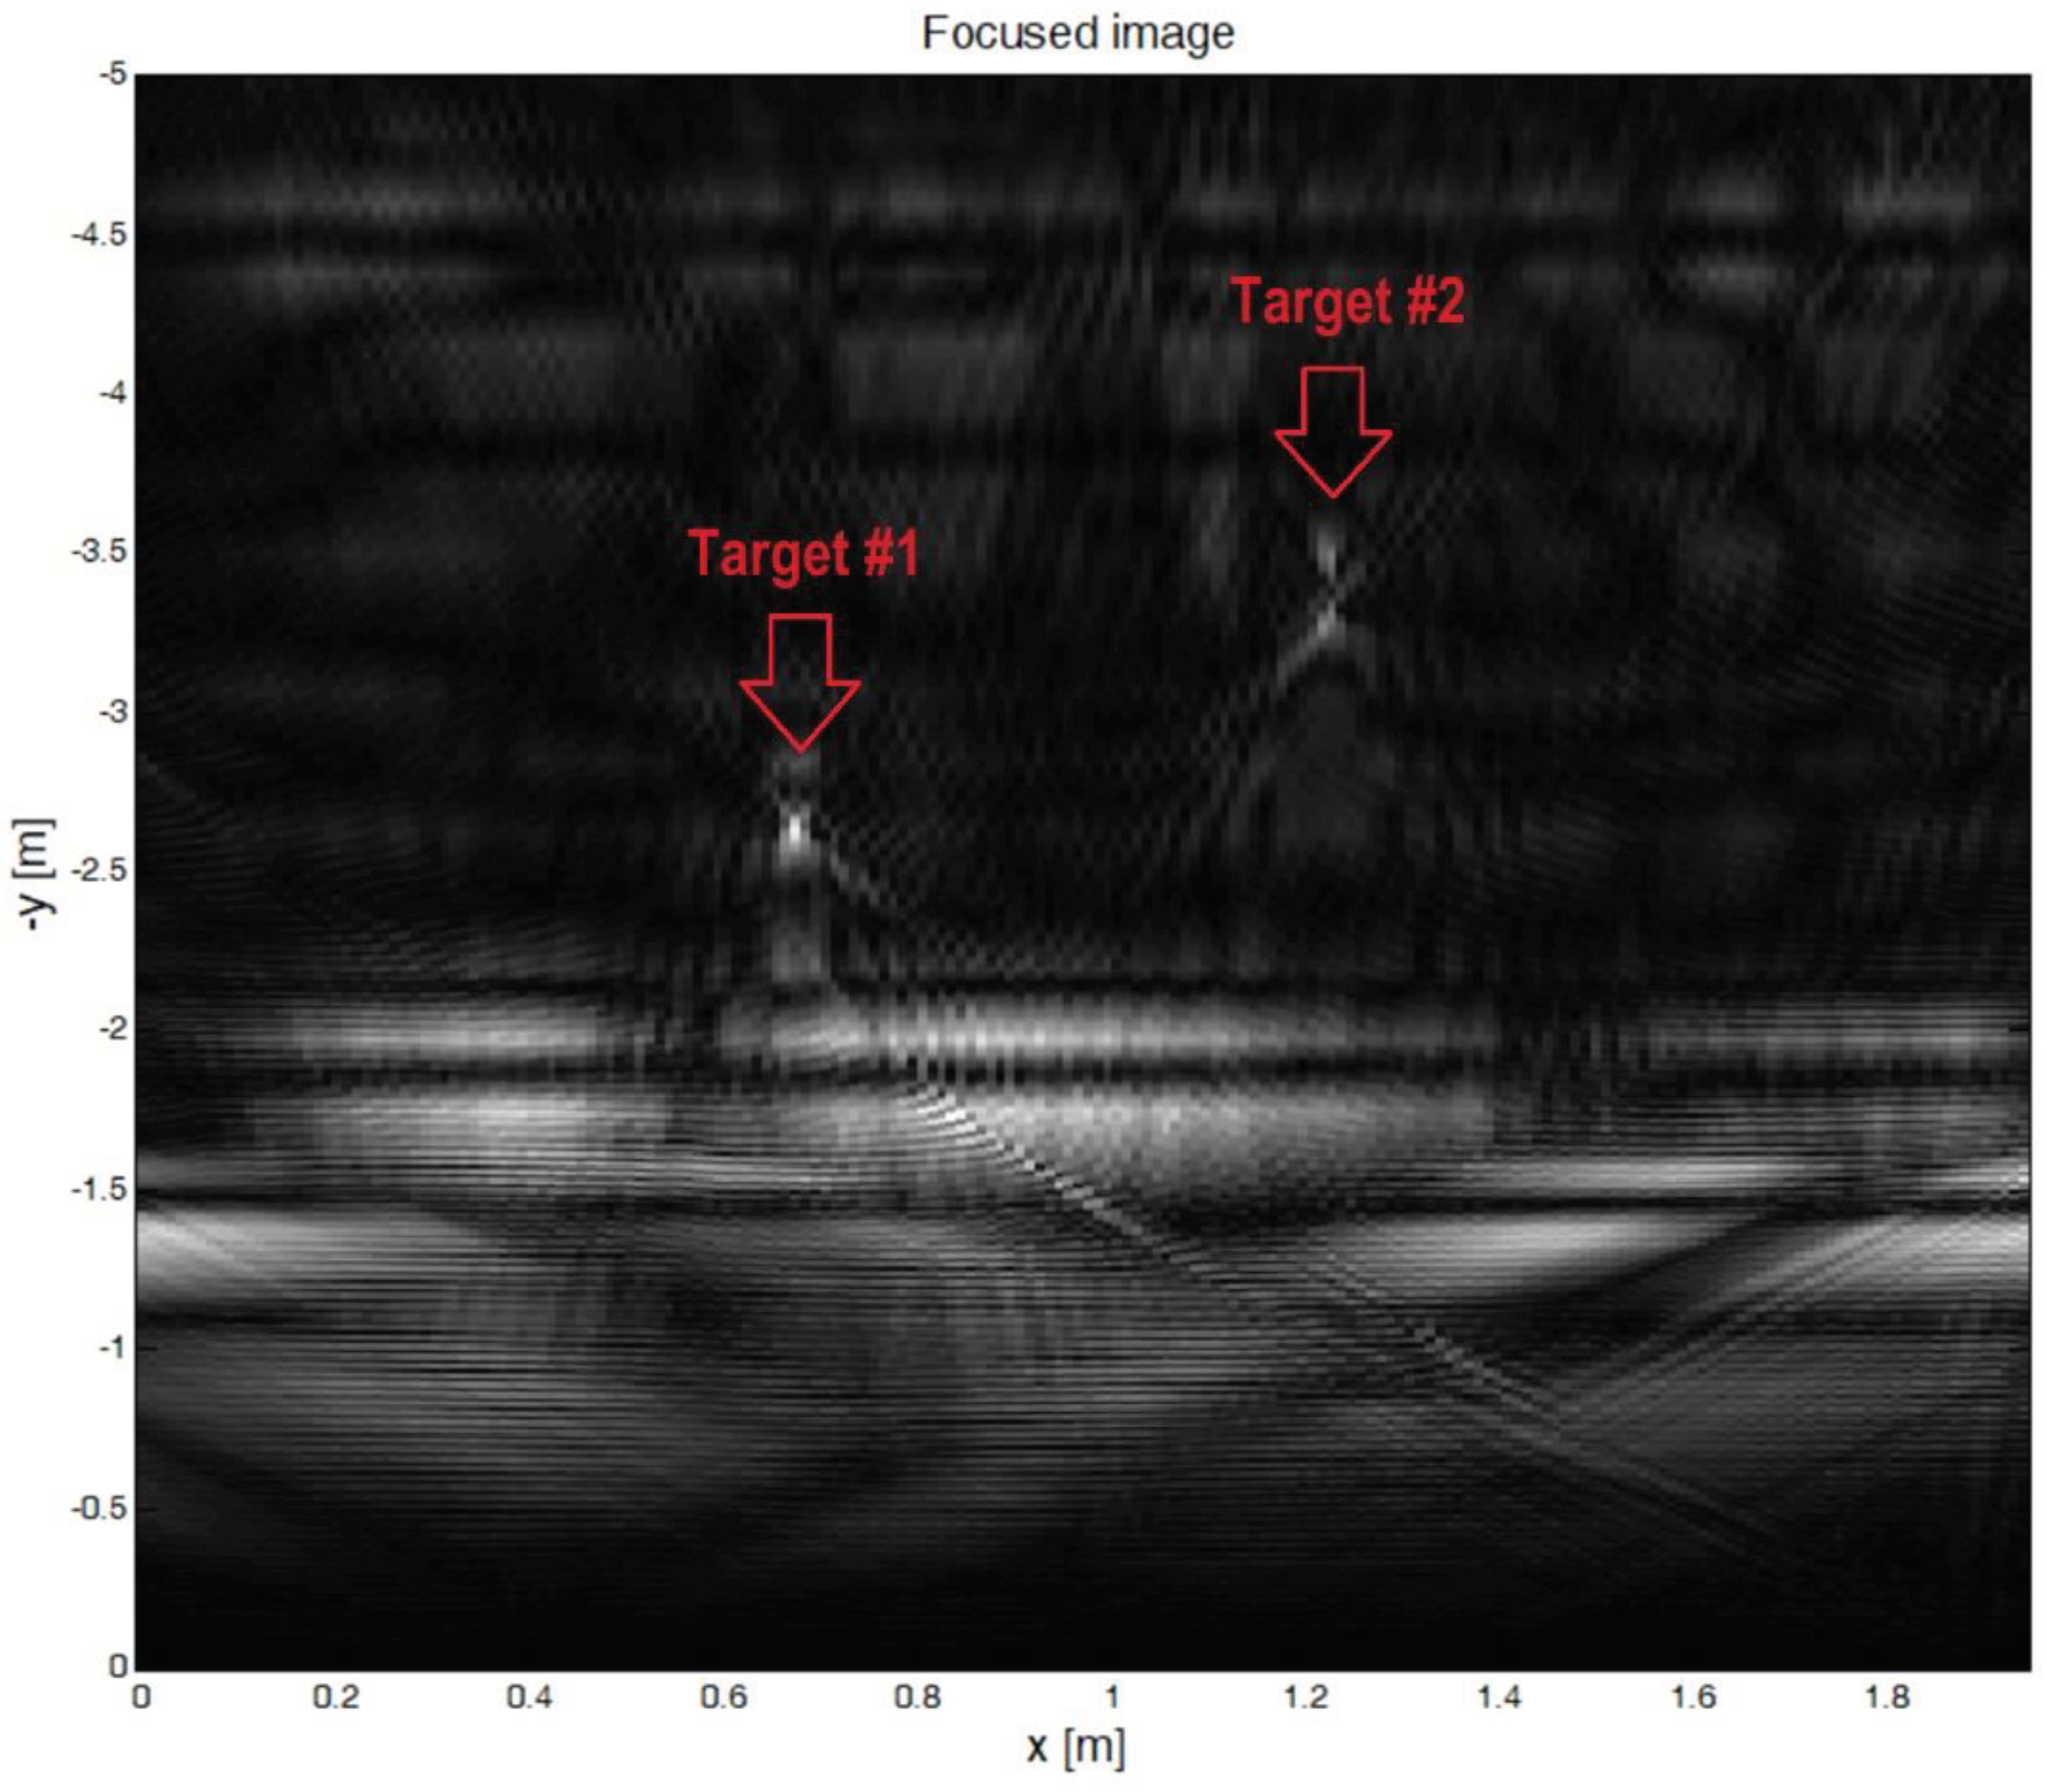
The focused radar image obtained from the test setup is depicted in Figure 14.
The two targets are clearly visible in the radar generated image. The image represents the absolute values of the complex pixels generated by the focusing algorithm. The image is a 2D section situated in a plane perpendicular to the wall. The z coordinate is 0.
The focusing algorithm was configured to take into account the radiation pattern of the radar antennas. When computing the contribution of each radar position to the final image only the pixels contained in the radar antennas real aperture, an 80 degrees cone, were updated.
The sampling step on x axis was 1 cm. The chirp bandwidth B was 685 MHz, giving a range (y axis) resolution of c / 2B = 21 cm. The x axis resolution after focusing is about 1 cm.
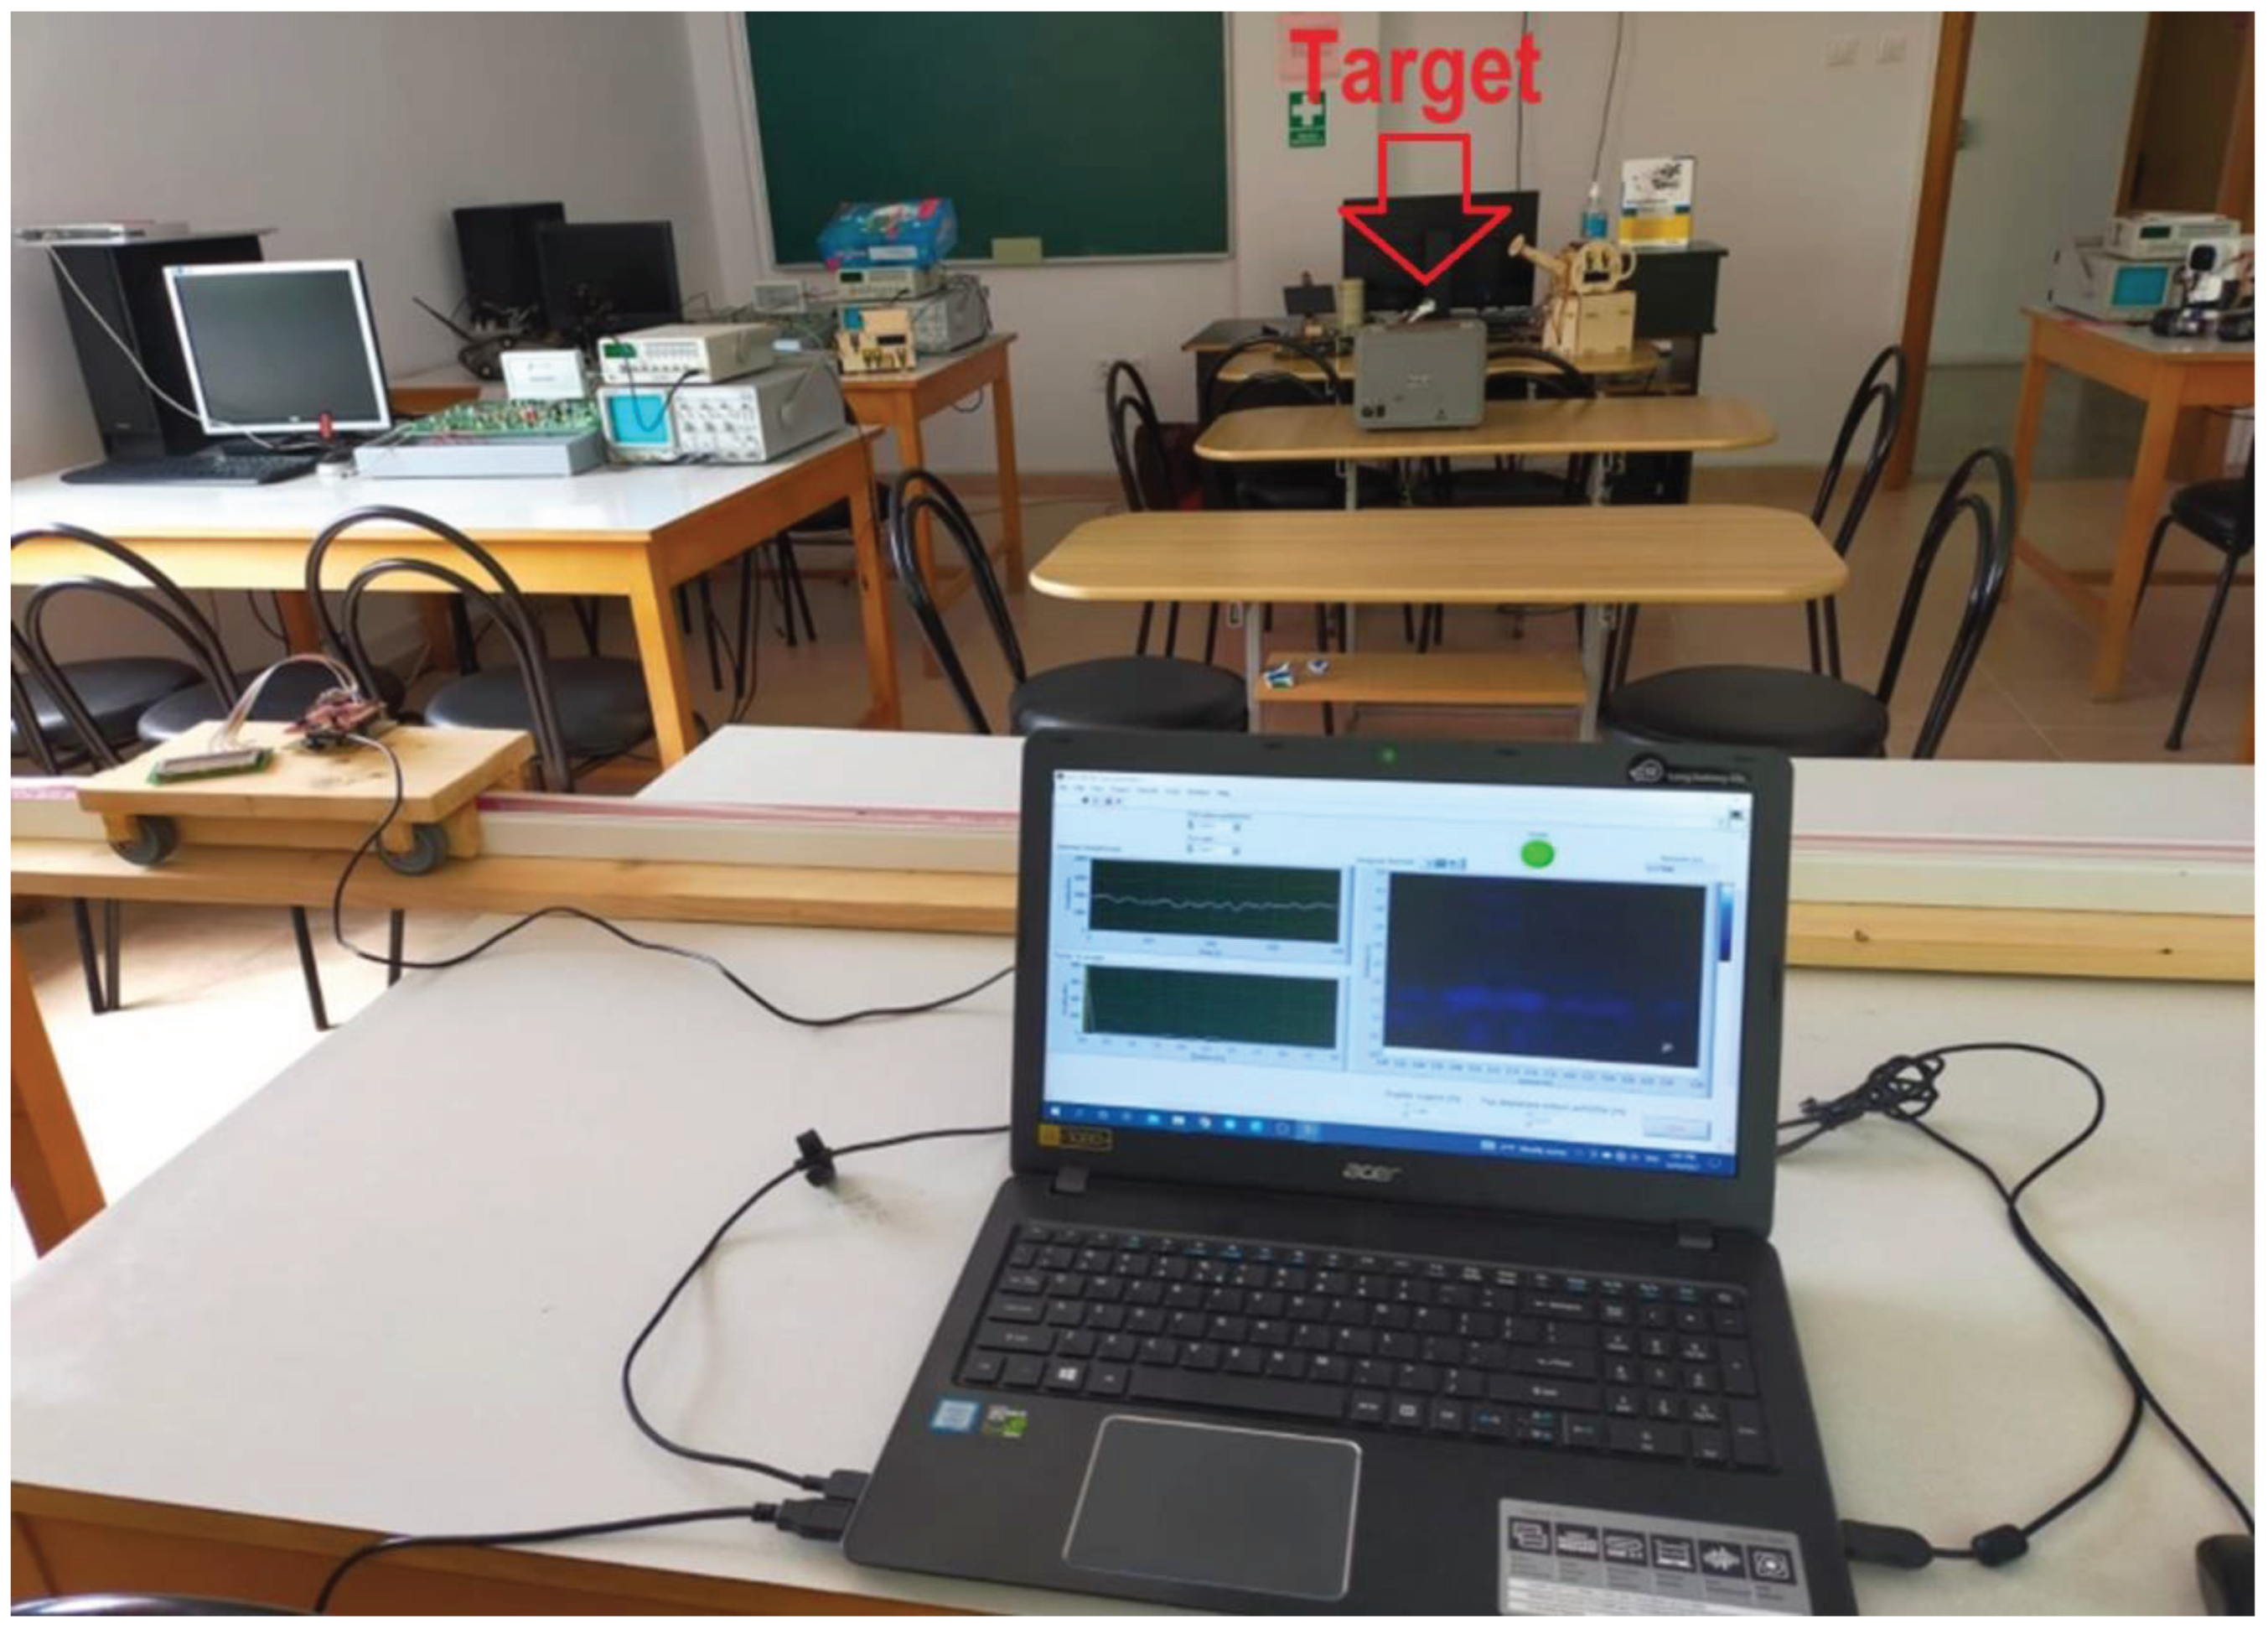
The interferometric capability of the proposed system was tested using the setup from Figure 15.
The analyzed target was the grey metallic box situated directly in front of the radar rail and will appear in the center of the radar image. Two scans have been performed. The box was moved by 3 mm towards the radar between the first and the second scan.
The two images were aligned by successively moving one image and searching the position that maximizes the cross-correlation of the images.
The complex interferogram Inter(r) was computed by multiplying the first focused complex image I1(r) with the complex conjugate of the aligned second focused complex image I2(r):
Inter(r) = I1(r) · conj[I2(r)].
The displacement map D(r) was created by multiplying the phases of the interferogram with λ/(4π):
Preprints 99632 i013
where λ = c / fs is the starting wavelength of the transmitted chirp.
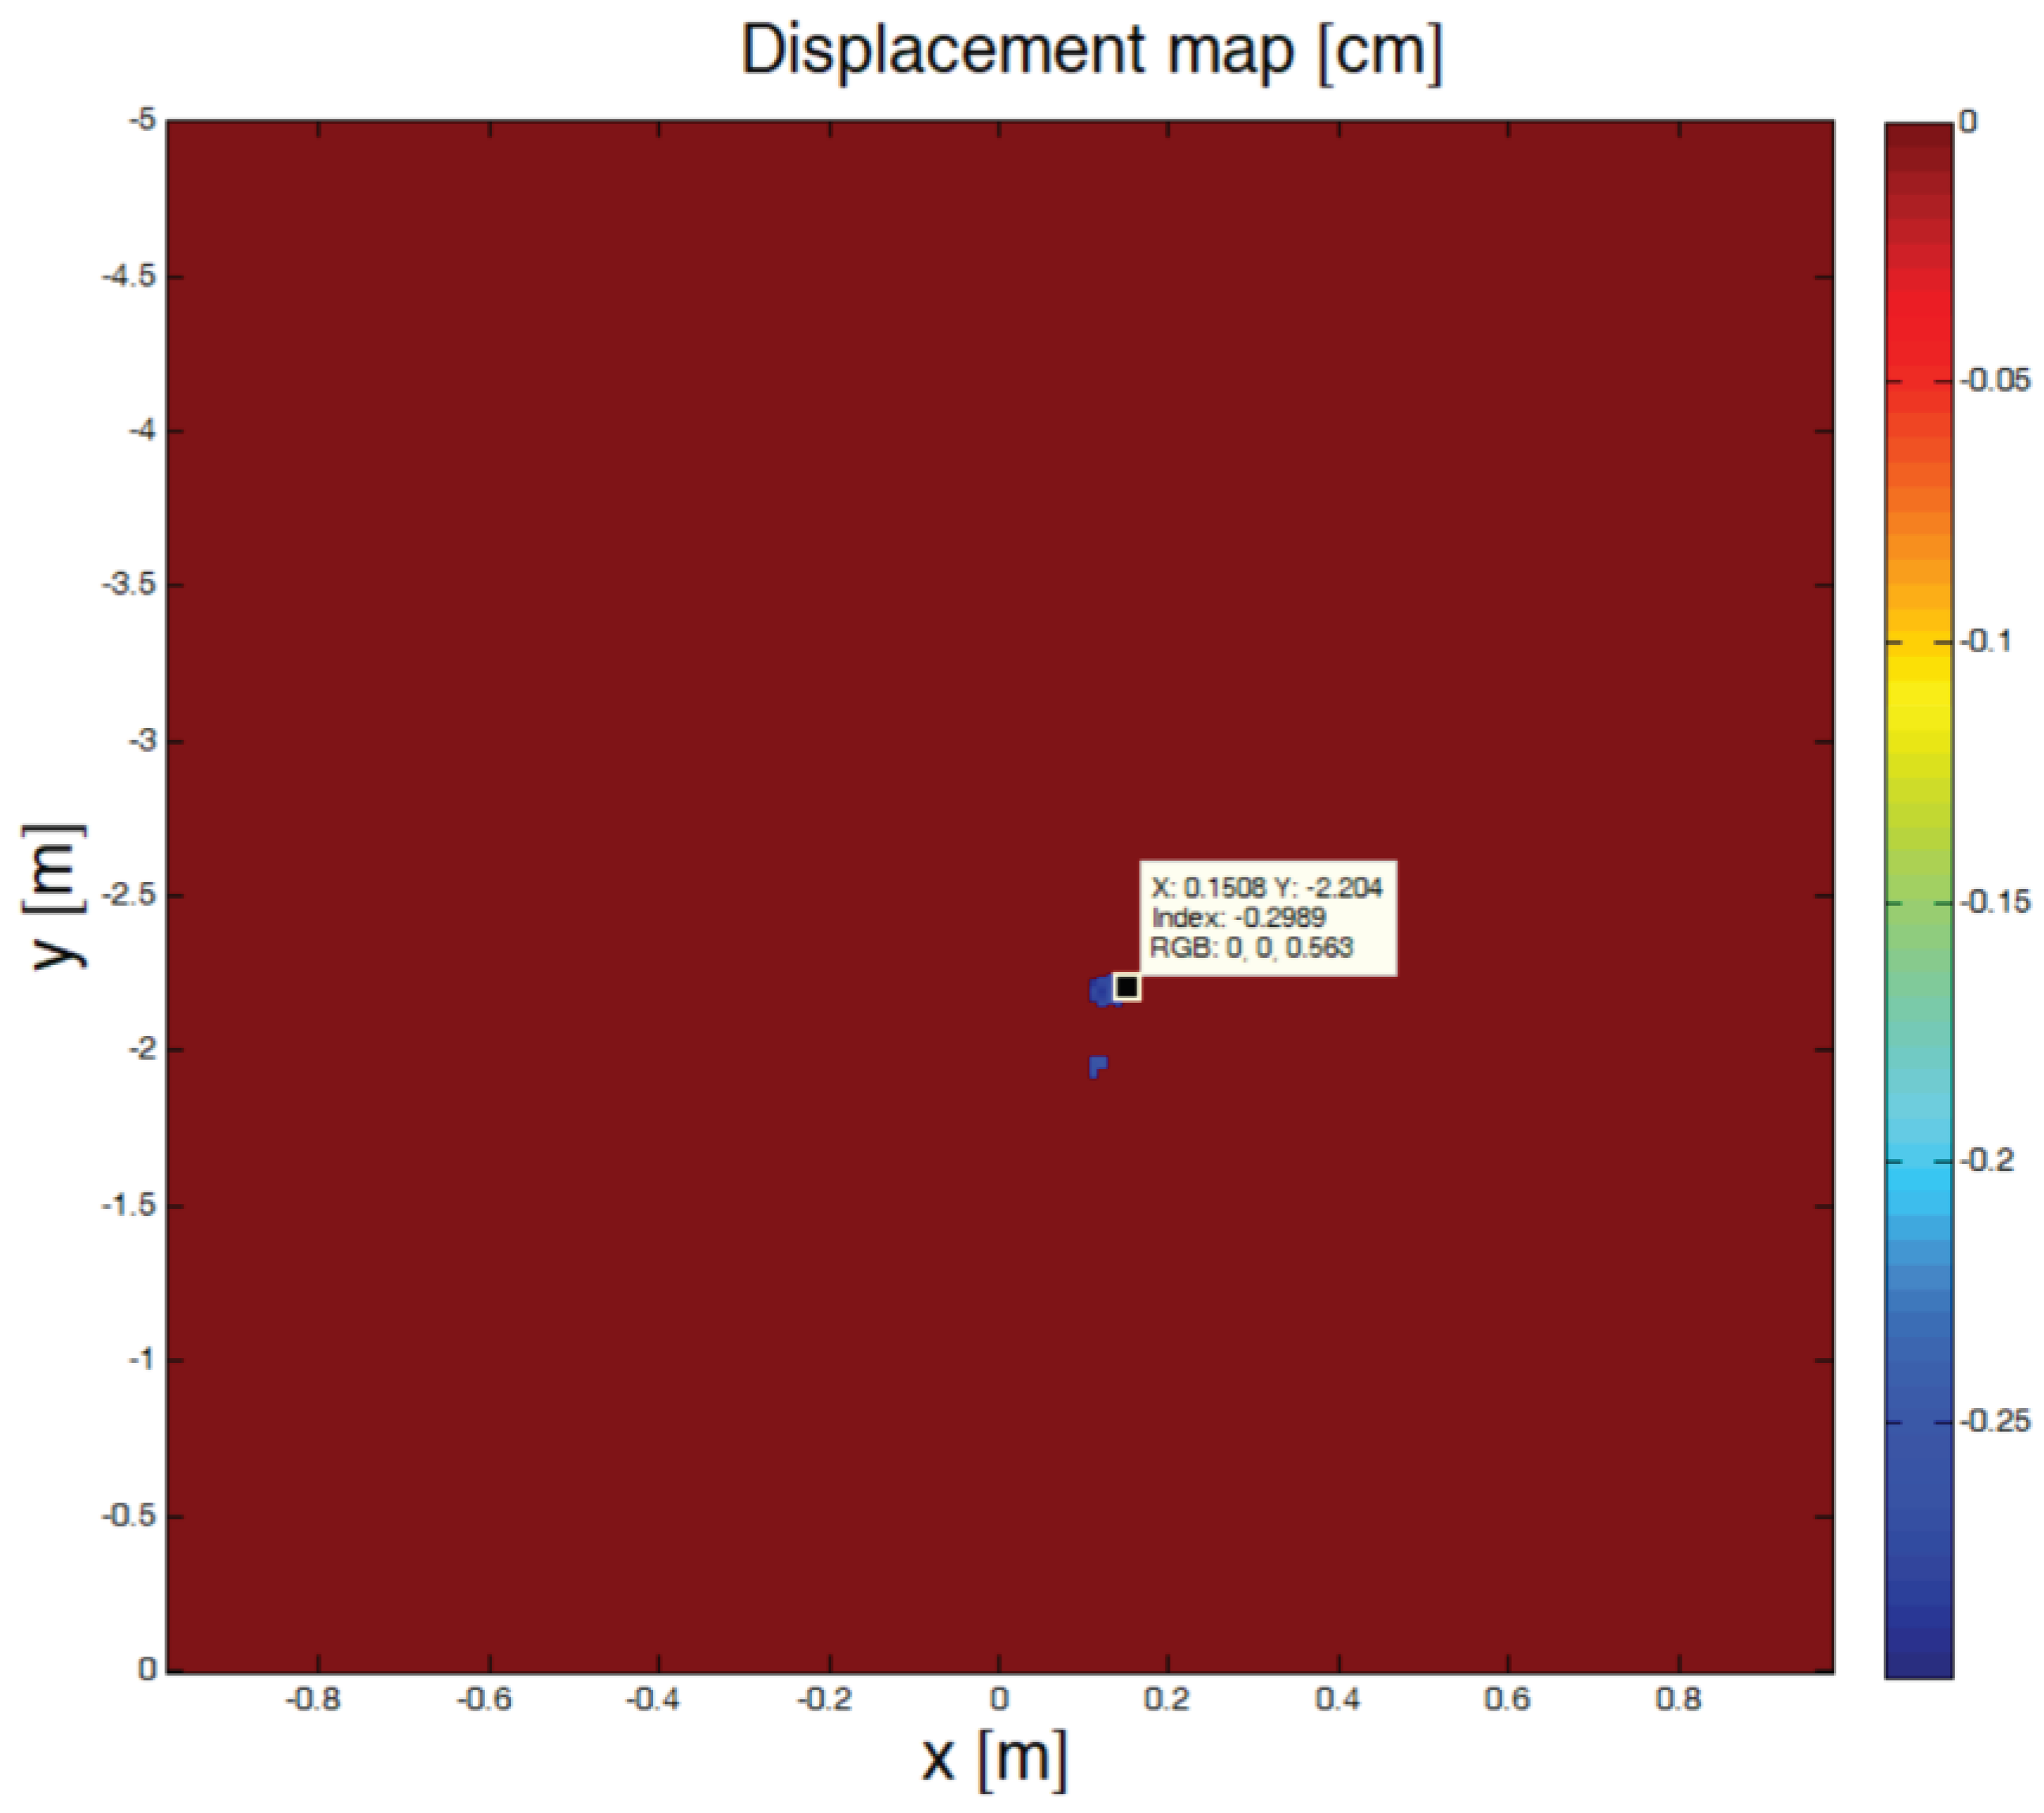
The displacement map was filtered so that only the pixels with high values in the interferogram magnitude were plotted. The threshold was 40% of the maximum value of the interferogram magnitude.
The filtered displacement map is presented in Figure 16.
The target displacement was estimated to be 0.298 cm, very close to the real 0.3 cm (3 mm) displacement.

3.2. GPR results

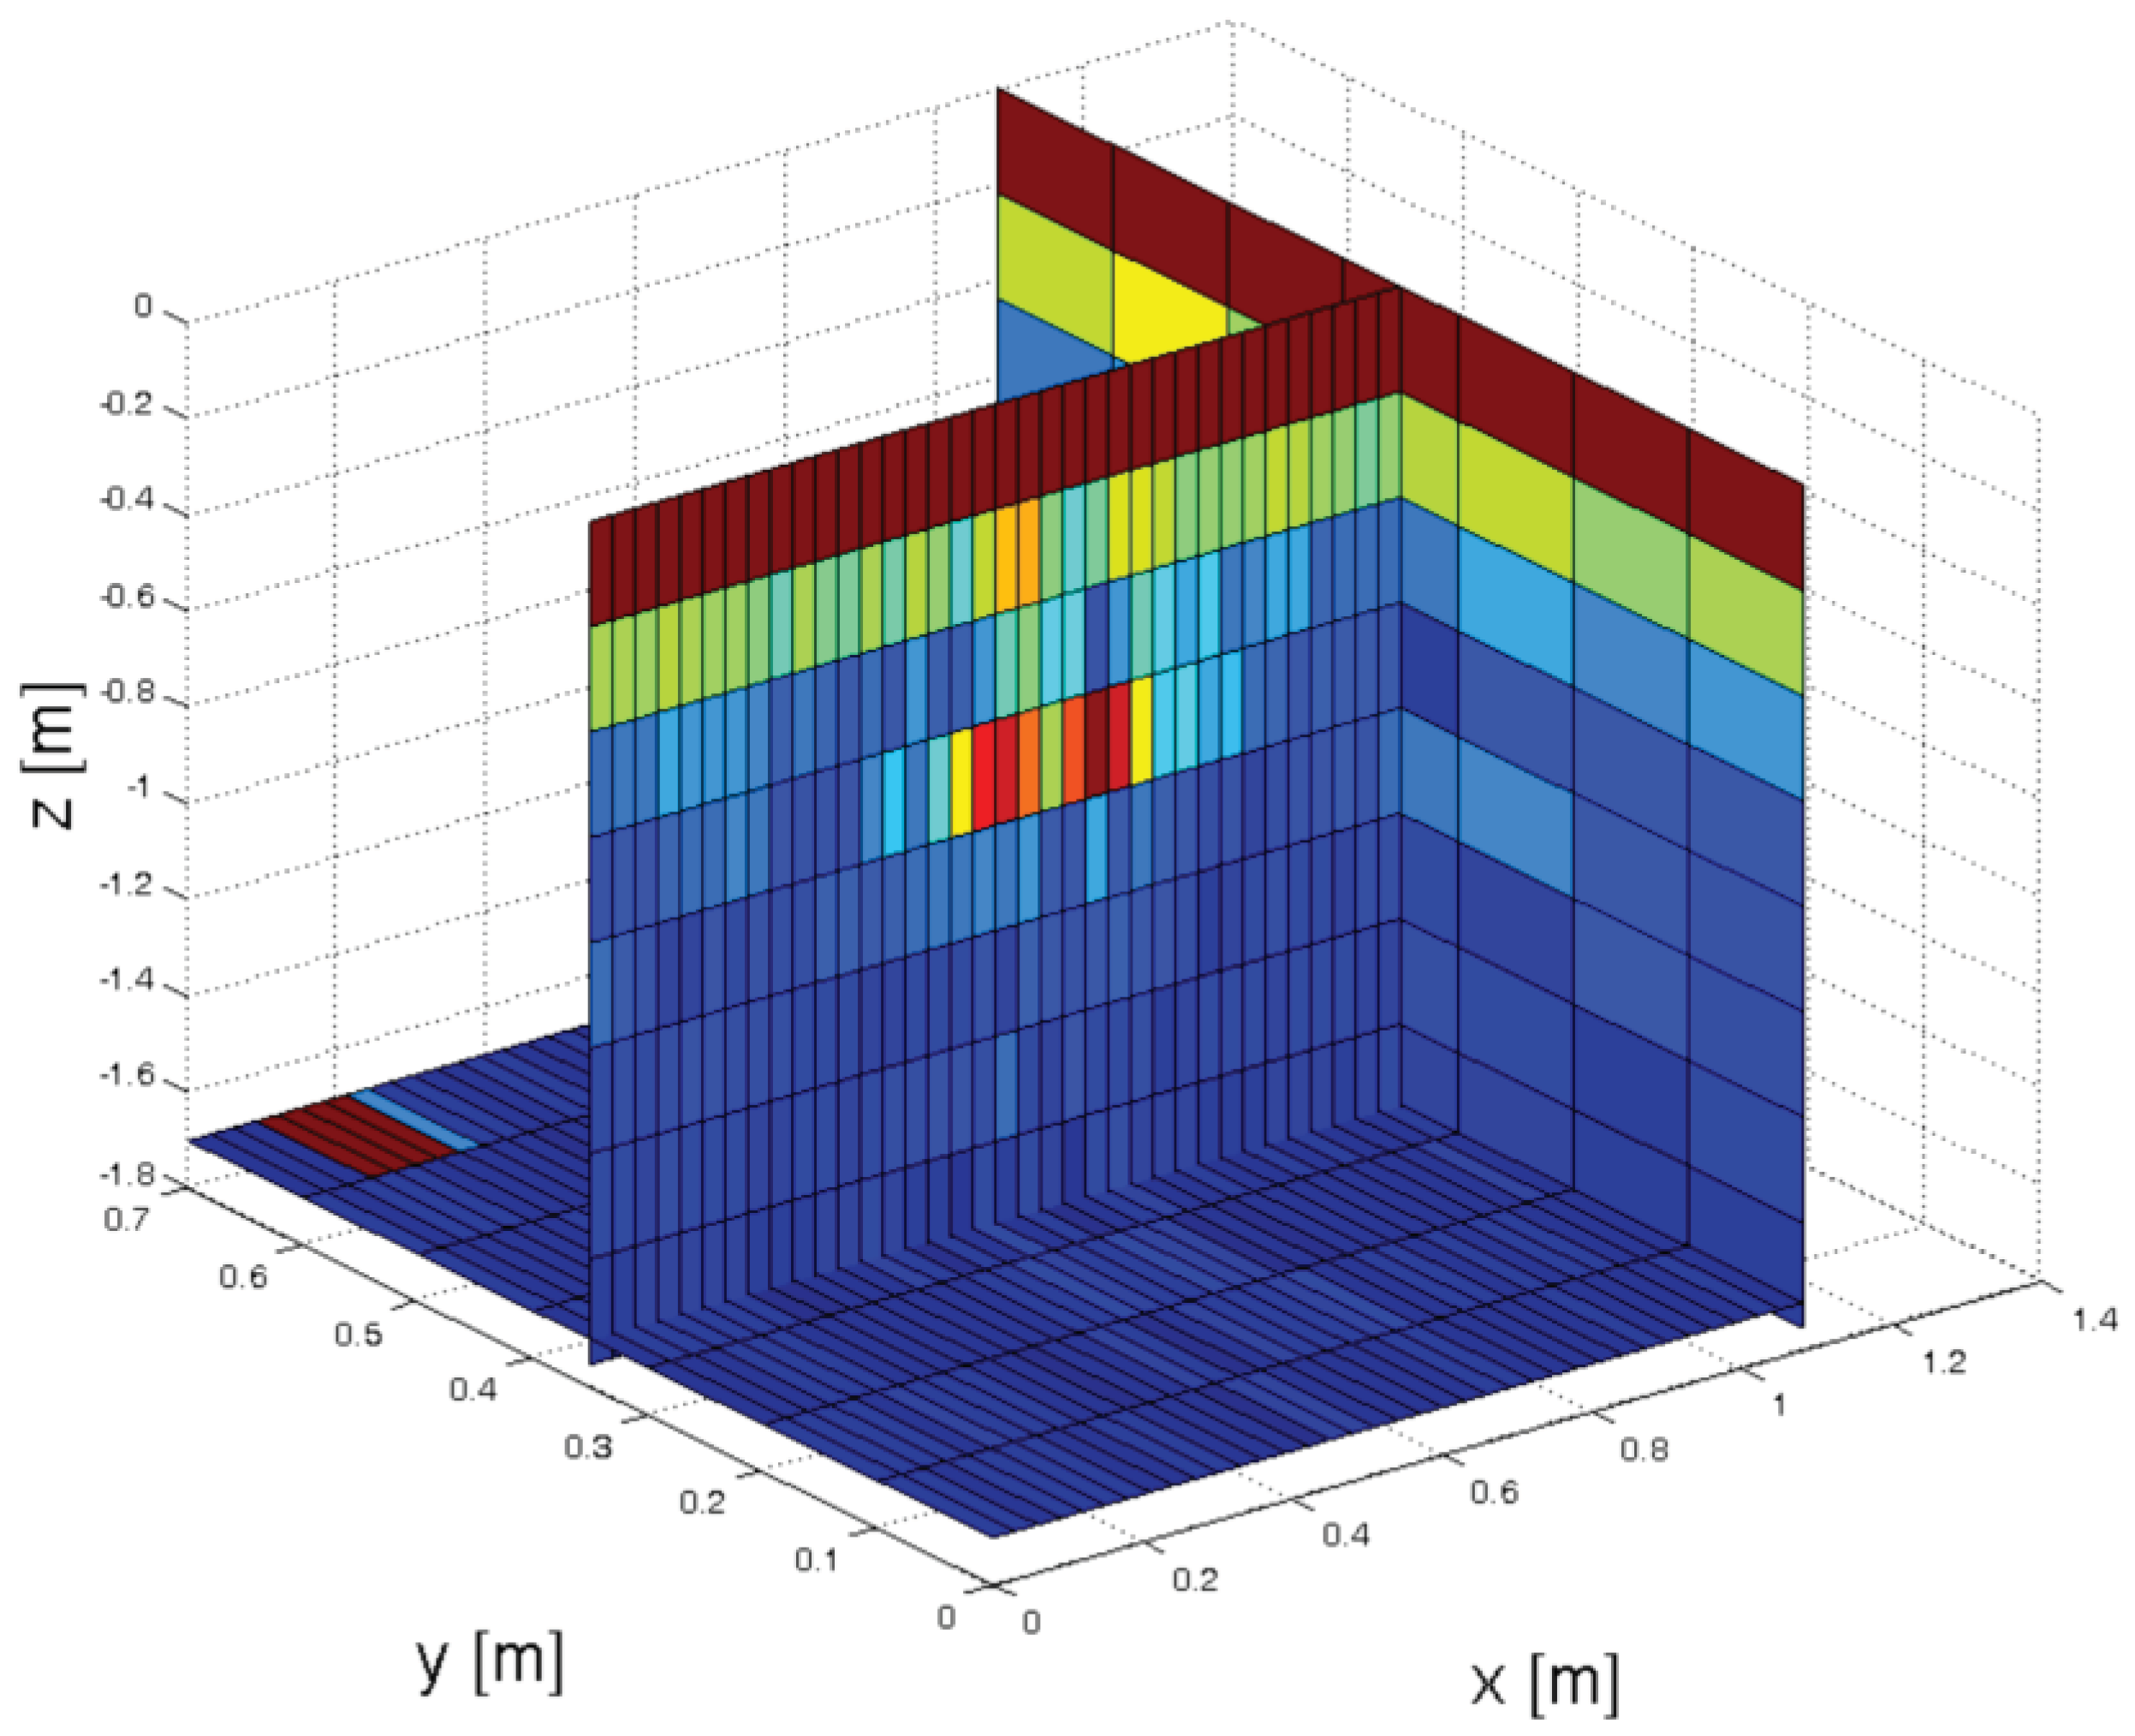
The hand-held GPR system was tested by performing a scan on top of a wooden table. Under the table, in the center, a metal case 40 cm by 25 cm by 15 cm was positioned on the floor. The height of the table top is 75 cm. The resulting image is presented in Figure 17. The metal case is clearly visible in the center at about 70 cm depth.
By moving the GPR on parallel lines a 3D image can be constructed.

4. Discussion

In this paper 2 low-cost systems capable of through-wall imaging were proposed and demonstrated. The first system implements a GB-SAR form and is suitable for generating multiple scans with precisely similar conditions, lending itself appropriate for interferometric displacement analysis of the obscured targets. The generated image is focused using SAR algorithm for enhancing its resolution, process that requires precise positioning of the radar obtained by means of the computer-controlled rail. The resolution on the radar movement axis is 1 cm, while the resolution on the perpendicular (range) axis is 21 cm.
The second implementation is a hand-held portable GPR device which can be used easily for generating ad-hoc images of objects placed behind obscuring surfaces or embedded in them. The range resolution is 21 cm, while the movement axis resolution is range dependent and degrades with increasing range as in typical GPR radars. By performing multiple parallel scans, the resulting cross-sections can be assembled in a 3D image of the analyzed volume.
Both proposed systems were experimentally tested and offered satisfactory results.

Funding

This work was supported by Constanta Maritime University.

Institutional Review Board Statement

Not applicable.

Data Availability Statement

Software and data used in this paper available at: https://github.com/miricip/Radar.

Conflicts of Interest

The authors declare no conflicts of interest.

References

  1. Zhang, W.; Xu, Z.; Guo, S.; Jia, Y.; Wang, L.; He, T.; Shao, H. MIMO through-wall-radar down-view imaging for moving target with ground ghost suppression. Digital Signal Processing 2023, Volume 134. [CrossRef]
  2. Saad, M.; Maali, A.; Salah Azzaz, M.; Benssalah, M. An efficient FPGA-based implementation of UWB radar system for through-wall imaging. Int J Commun Syst 2023, Volume 36. [CrossRef]
  3. Jol, H. M. Ground penetrating radar: theory and applications, 1st ed.; Elsevier Science: Amsterdam, Netherlands, 2009; pp. 1–41. [Google Scholar]
  4. Davis, J.L.; Annan, P. Ground-Penetrating Radar for High-Resolution Mapping of Soil and Rock Stratigraphy. Geophys. Prospect 1989, 37, 531–551. [Google Scholar] [CrossRef]
  5. Blindow, N. Ground Penetrating Radar. In Groundwater Geophysics-A Tool for Hydrology; Kirsch, R., Ed.; Springer-Verlag: Berlin Heidelberg, Germany, 2006; pp. 227–252. [Google Scholar] [CrossRef]
  6. Lowe, K.M.; Wallis, L.A.; Pardoe, C.; Marwick, B.; Clarkson, C.J.; Manne, T.; Smith, M.A.; Fullagar, R. Ground-penetrating radar and burial practices in western Arnhem Land, Australia. Archaeology in Oceania 2014, 49, 148–157. [Google Scholar] [CrossRef]
  7. Burr, R.; Schartel, M.; Schmidt, P.; Mayer, W.; Walter, T.; Waldschmidt, C. Design and Implementation of a FMCW GPR for UAV-based Mine Detection, Proceedings of the IEEE MTT-S International Conference on Microwaves for Intelligent Mobility (ICMIM), Munich, Germany, 15-17 April 2018. [CrossRef]
  8. Wai-Lok Lai, W.; Derobert, X.; Annan, P. A review of Ground Penetrating Radar application in civil engineering: A 30-year journey from Locating and Testing to Imaging and Diagnosis. NDT & E International 2018, 96, 58–78. [Google Scholar] [CrossRef]
  9. Yigit, E.; Demirci, S.; Ozdemir, C. Ground Penetrating Radar Image Focusing using Frequency-Wavenumber based Synthetic Aperture Radar Technique, Proceedings of the 2007 International Conference on Electromagnetics in Advanced Applications, Torino, Italy, 17-21 Sept. 2007, pp. 344-347. [CrossRef]
  10. Ozdemir, C.; Demirci, S.; Yigit, E. Practical Algorithms to Focus B-scan GPR Images: Theory and Application to Real Data. PIERS B 2008, 6, 109–122. [Google Scholar] [CrossRef]
  11. Baer, C.; Gutierrez, S.; Jebramcik, J. ; Barowski, J; Vega, F; Rolfes, I. Ground Penetrating Synthetic Aperture Radar Imaging Providing Soil Permittivity Estimation, Proceedings of the 2017 IEEE MTT-S International Microwave Symposium (IMS), Honolulu, HI, USA, 4-9 June 2017, pp. 1367-1370. [CrossRef]
  12. Ustun, D.; Yigit, E.; Toktas, A. ; Sabanci, K; Duysak, H. GPR Image Focusing Using Matched Filter Algorithm, Proceedings of the 2018 XXIIIrd International Seminar/Workshop on Direct and Inverse Problems of Electromagnetic and Acoustic Wave Theory (DIPED), Tbilisi, Georgia, 24-27 Sept. 2018, pp. 242-245. [CrossRef]
  13. Gorham, L.A.; Moore, L. J. SAR image formation toolbox for MATLAB. In Proc. SPIE 7699 Algorithms for Synthetic Aperture Radar Imagery XVII, 769906, SPIE Defense, Security, and Sensing, Orlando, Florida, United States, 2010. [CrossRef]
  14. Henrik’s Blog. Available online: https://hforsten.com/backprojection-backpropagation.html (accessed on 09 02 2024).
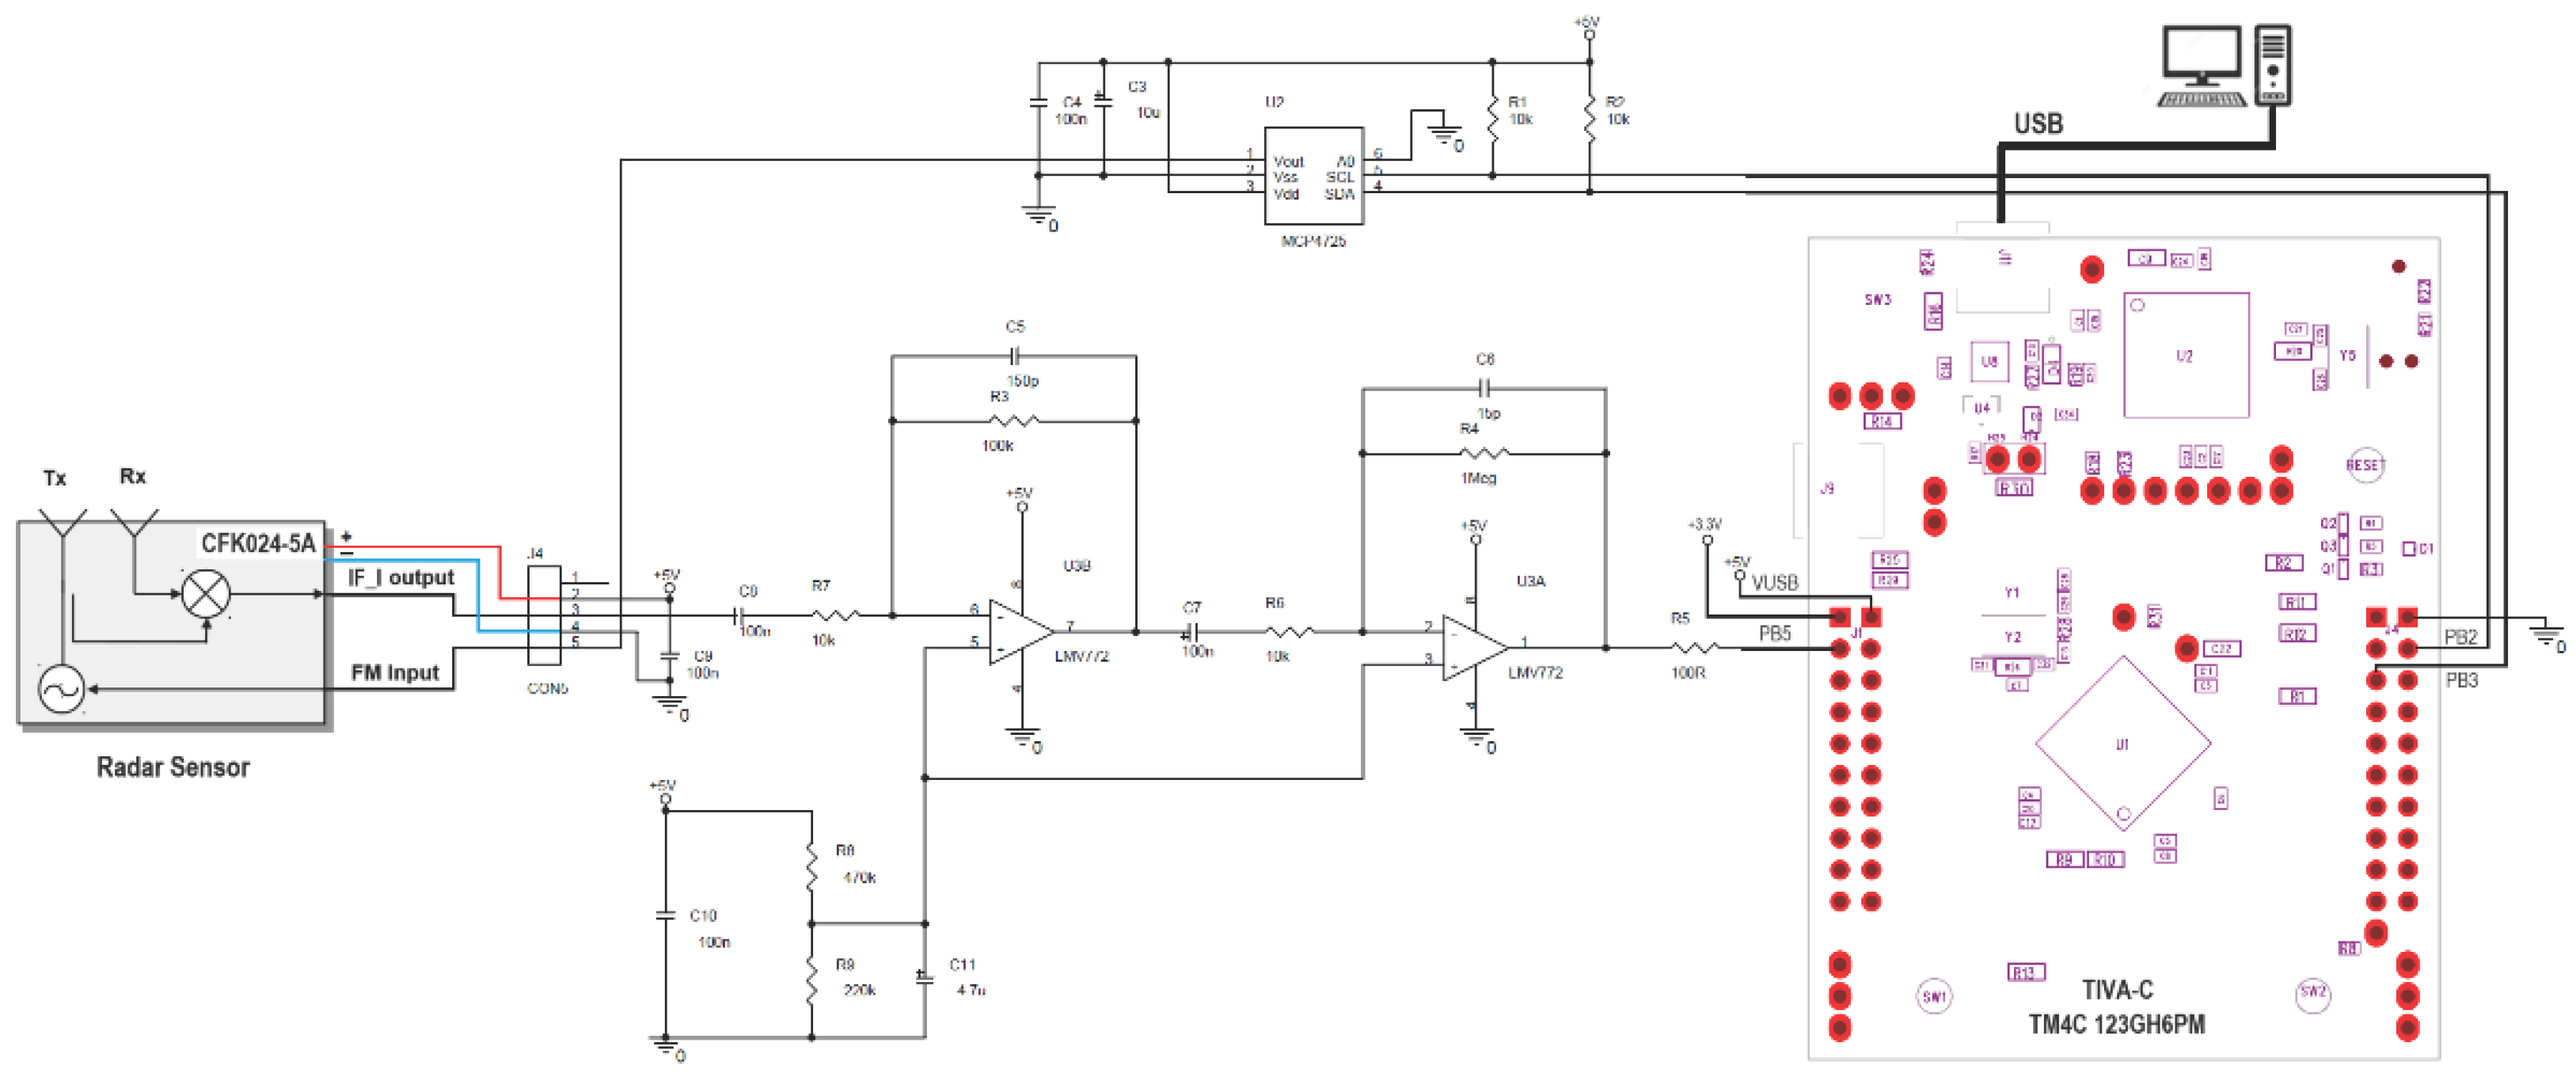
Figure 1. FMCW radar module schematic.
Preprints 99632 g001
Figure 2. Magnitude in dB of the amplifier transfer function.
Preprints 99632 g002
Figure 3. Radar positioning system electronic module diagram.
Preprints 99632 g003
Figure 4. Radar positioning system implementation, (a) detail and (b) full view.
Preprints 99632 g004
Figure 5. TIVA-C TM4C-123GH6PM program flowchart.
Preprints 99632 g005
Figure 6. PC program flowchart.
Preprints 99632 g006
Figure 7. GPR schematic.
Preprints 99632 g007
Figure 8. GPR practical implementation.
Preprints 99632 g008
Figure 9. TIVA-C TM4C-123GH6PM program flowchart.
Preprints 99632 g009
Figure 10. PC program flowchart.
Preprints 99632 g010
Figure 11. GB-SAR radar module.
Preprints 99632 g011
Figure 12. Test setup diagram.
Preprints 99632 g012
Figure 13. Picture of the test setup.
Preprints 99632 g013
Figure 14. The radar image.
Preprints 99632 g014
Figure 15. Picture of the interferometry test setup.
Preprints 99632 g015
Figure 16. Displacement map.
Preprints 99632 g016
Figure 17. GPR image.
Preprints 99632 g017
Disclaimer/Publisher’s Note: The statements, opinions and data contained in all publications are solely those of the individual author(s) and contributor(s) and not of MDPI and/or the editor(s). MDPI and/or the editor(s) disclaim responsibility for any injury to people or property resulting from any ideas, methods, instructions or products referred to in the content.
Copyright: This open access article is published under a Creative Commons CC BY 4.0 license, which permit the free download, distribution, and reuse, provided that the author and preprint are cited in any reuse.
Prerpints.org logo

Preprints.org is a free preprint server supported by MDPI in Basel, Switzerland.

Subscribe

© 2024 MDPI (Basel, Switzerland) unless otherwise stated