
Submitted:
22 February 2024
Posted:
24 February 2024
You are already at the latest version
Abstract
.Maize cultivation in Thailand faces challenges owing to climate change and soil organic carbon (SOC) loss. This highlights the importance of comparing maize soil with paddy soil in terms of the role of dissolved organic carbon (DOC) and nutrient availability, as they influence SOC content. Soil samples from Chiang Mai province, primarily Fluvisol, were collected for the cultivation of paddy rice and maize, analysed for carbon fractions and chemical properties, and categorised into layers. Comparative analysis revealed that maize soils had lower levels of labile carbon components and organic carbon than paddy soils (P
Keywords:
Maize
; SOC
; Available nutrients
; DOC
1. Introduction
Agricultural soils with low soil organic carbon (SOC) concentrations [1] are exacerbated by crop residue clearance, seedbed preparation, and excessive watering [2]. Degraded agricultural soils, particularly arable soils, have been linked to centuries of intensive agricultural use [3]. In northern Thailand, continuous maize cultivation has increased along paved roads due to infrastructure improvements [4]. Climate change has impacted (e.g., drought) maize production in northern Thailand, and mitigation strategies include additional irrigation and crop diversification [5]. The prediction of crop yields and production risks in northern Thailand from 2020 to 2029 shows that maize is at high risk and rice is at low risk [5]. The maize cultivation area is predicted to increase from 17.5% to 23.1% by 2030 [6,7]. Maize cultivation in Northern Thailand causes a decline in soil fertility and long-term land degradation [4,8]; due to intensive monocropping patterns [9]. Continuous maize cultivation accelerates soil organic carbon loss owing to the differences in natural 13C abundance between C3 and C4 plants [10]. Maize growers are encouraged to employ integrated land-use planning and stakeholder involvement to increase soil fertility, diversify crops, and expand their land use, particularly in highland areas [4]. This method was also applied to lowland maize. However, only a few studies have been conducted to identify the primary constraints on how fertiliser and soil characteristics affect the SOC content of maize-grown lands in the lowlands of northern Thailand. Generally, paddy soil, which is rich in microbial biomass, has restricted mineralisation of fresh substrates and a small priming effect, promoting the accumulation of organic C despite the presence of significant priming effects in upland soil [11]. In northern Thailand, paddy soils from rice rotation cropping systems, such as rice, fallow, and rice fallow shallots, have higher SOC and DOC levels due to low fertilisation, whereas rice, followed by many kinds of vegetables, such as potatoes, have higher SOC and carbon. Factors controlling SOC and carbon storage include clay content, available P, and DOC, with minor driving factors, such as Ca2+ and Mg 2+. While the SOC:clay ratio may explain carbon saturation and adsorption capacity [12], organic paddy soil has a higher SOC than mineral-fertilised paddy soil [13].
SOC is crucial for soil fertility, agricultural productivity, and climate control [14]. They play a significant role in the global carbon cycle and climate change mitigation [15,16]. SOC content can be influenced by labile carbon inputs, which can alter the priming effect (PE) in soils [17,18]. The addition of labile carbon to low-SOC soils leads to greater increases in PE, affecting not only deep, low-SOC soils but also soils already depleted by increased C input [18]. According to [19], straw has a notable priming effect on the release of autochthonous dissolved organic matter (DOM), and the availability of organic carbon for microbes is a prerequisite for the synthesis of CO2 in soil. The priming effect persists over time, depending on the microbial biomass, C and N substrate availability, and decomposition stage [20], and increases carbon metabolism and loss SOC [21]. Similarly, PE persists over time and depends on microbial biomass, C and N substrate availability, and decomposition stage [20].
Fertilisation enhances crop yield and returns plant residue to the soil. The fertilisation rate affects the effects of minerals N, P, and K [22]. Adapted fertilisation enhances soil microb and SOC [23]. The C:nutrient ratio is crucial for organic fertilisation, and additional dressings are required for low-quality substrates [22]. Balancing nutrient stoichiometry increases soil microbial carbon but does not increase carbon use efficiency (Sinsabaugh Fang et al., 2016). Mineral fertilisers accelerate maize stem and leaf degradation rates and promote soil organic matter formation; however, N does not affect agricultural residue breakdown [24]. Our study focused on the effect of the mineral fertiliser dose and the SOC content.
DOC is a labile fraction and a sensitive indicator of soil quality, reflecting land-use effects [25,26], and correlates with SOC and decreases with depth [27]. DOC should be considered when evaluating conservation management practices (i.e., tillage) for SOC sequestration [28,29]. However, DOC is positively correlated with clay content [30] but negatively correlated with native C decomposition levels (Ge, 2012). Moreover, DOM content fluctuates seasonally [31,32], and soil type and season significantly affect the contribution of DOM to mineralisation [33]. DOC in the soil following maize residue application initially dominates the soil DOM pool; however, after that, most DOM is formed from soil organic matter, casting doubt on its position as the dominant bioaccessible carbon pool in the soil [19]. However, paddy soils have higher mineralisation rates of DOC than upland soils, and the biodegradation rate of DOC is controlled by the percentage of the labile DOC fraction [34]. Plant-derived dissolved organic matter did not enhance soil organic carbon sequestration [35], with 98% of straw-derived DOM being hydrophilic in the initial pulse compared to 20-30% in the control samples [19].
Soil microorganisms regulate C turnover via stoichiometric flexibility to maintain an elemental stoichiometric balance between resources and microbial life [36]. Furthermore, the DOC-to-nutrient ratio is affected by SOC in the soil. Soil carbon mineralisation is positively correlated with soil DOC, NH4+, and NO3- and the abundance of bacteria, fungi, methanotrophs, and denitrifiers [37]. Stoichiometric control of input substrate, glucose, and native soil organic C mineralisation in paddy soils is also a key factor [36]. Moreover, bacterial abundance and diversity are negatively correlated with the DOC:NH4+ and DOC: P (Olsem) ratios, which have direct positive effects on SOC mineralisation [38]. Straw mineralisation increases exponentially with soil DOC:NH4+ and DOC: P (Olsen) until it reaches a maximum rate [36], which affects SOC mineralisation.
Notably, nitrogen availability is essential for carbon cycling in terrestrial ecosystems [36]. Soil management in dry tropical regions can significantly conserve resources by sequestering carbon and utilising inorganic N pools [2,39]. Moreover, the cropping system influences fertilisation-induced changes in soil carbon chemistry, with paddy soil being primarily determined by NO3–N and total N [40]., whereas upland soil is mostly explained by SOC and alkyl-C [29]. The higher concentrations of NH4+ in paddy soils likely reflect lower nitrification potential, while higher denitrification rates in paddy soils were indicative of higher NO3− [29,41]. Moreover, soil chemistry and the availability of nutrients, such as calcium (Ca) and pH, affect soil SOC. Ca contributes to SOC persistence by acting as a mediator of linked abiotic-biotic cycling rather than only as a driver of physicochemical processes to stabilise SOC in soil [42]. The concentrations of calcium and pH affect the partitioning of organic matter in soils; the concentration of DOC increases with increasing pH and decreases with increasing calcium concentration [43,44]. The amount of exchanged Ca significantly stabilises DOC and SOC in highly different agricultural soils. SOC is responsible for more than 80% of the CEC of highly weathered soils, such as Oxisols and Ultisols [45].
The current study utilised soil samples from a continuous 20-year paddy and maize farm in lowland northern Thailand with different soil preparations, irrigation, and fertilisation. In order to elucidate (i) the effects of differences in land use patterns, i.e., paddy and maize, on the pattern of chemical soil properties, soil nutrients, and the size of the labile carbon fraction, especially DOC, and (ii) the relationships between the size of the DOC and nutrients and chemical soil properties on SOC content, compared between paddy soil and upland maize soil, we performed data analysis of these two contrasting soils and assessed the impacts on SOC content in these soils.
2. Materials and Methods
Study area: Soil samples were collected between December 2018 and March 2019 in the Chiang Mai Province. The primary soil type is Fluvisol, and came from lands producing paddy rice (Oriza sativa) and maize (Zea mays Linn) (Figure 1 and Table 1).
Soil sampling: The selection of the type of soil to be used for the cultivation of rice and maize in Chiang Mai included the digging of holes across the soil with a soil profile 1 m wide and 1 m deep to study the morphological characteristics based on standard procedures. Soil samples were collected from 0-15, 15-30, 30-40, 40-60, 60-80, and 80-100 cm soil deep layers. Subsequently, soil samples were collected from each layer for analysis of the carbon fractions and chemical properties.
Paddy and maize soil: The site is a flat land, with a slope of 0–2%, 300–400 m above sea level, and is formed by carried water sediments and is a deep soil with moderate drainage. The topsoil is loamy, grey, or greyish brown. The subsoil is sandy loam, light grey, or pinkish-grey. They were yellowish-brown or dark-brown and had some soft red laterites. The paddy soil was deep soil; the topsoil was clay and silt throughout, the colour was dark brown and gray, and there were dark brown and brown spots. The subsoil was clay, dark grey, or dark brown. The soil was brown and yellowish-brown and contained mica, iron lumps, and manganese accumulations along the soil cross-section (Figure 2).
There were differences in the soil and water management between the paddy and maize soils. The intensity of tillage in the paddy soil was paddle (i.e., wet tillage), whereas that for the maize cultivation was dry; however, maize cultivation was more frequent (three times) than rice cultivation within a one-crop calendar year. We categorised the amount of mineral fertiliser used on the land according to [22].Owing to the size of the mineral fertiliser applied in these lands, maize cultivation received double the doses of N mineral fertiliser than rice (Table 1).
The gradients of soil management between the paddy and maize plantations in this study showed that the tillage pattern, soil use frequency, and dose of mineral fertiliser, especially N, would have a significant impact on soil properties and change soil carbon (Table 1). Subsequently, soil samples were collected from each layer for the analysis of labile carbon fractions and physiochemical properties.
Labile C fractionation: Labile Carbon (Labile carbon fractions and water-soluble carbon): Weighted soil samples were placed into 50 ml polypropylene centrifuge tubes to measure water-soluble carbon (WSC). These were extracted using 30 ml of deionised water for 30 minutes at 200 round per minute (rpm) at room temperature on an end-to-end shaker. After centrifugation for 20 min at 5000 rpm, the entire supernatant was filtered into an Erlenmeyer flask for carbon measurement by Cr2O7 oxidationAn additional 30 ml of deionised water was added to the mixture. To measure the hot water-soluble carbon (HWSC), the tube was then covered and placed in a hot water bath at 80 °C for 16 h. Each tube was manually shaken at the end of the extraction process to make sure the HWSC was released from the total SOC [46,47]. SOC content was determined after sieving (0.50 mm) by the wet combustion method, as described in [48]. DOC was calculated from WSC and HWSC. To measure the permanganate oxidisable carbon (POXC), a modified permanganate oxidisable C (POXC) method, as described by [49], was used to filter air-dried soil (< 0.5 mm) and a neutral 0.02 M KMnO4 solution was mixed. The process involved shaking, centrifuging, and mixing of the contents. The absorbance at 550 nm was measured using a spectrometer, and the concentration was calculated for POXC [49,50].
Soil chemical properties: Using Air-dried soil and 10 mL of water [51],the pH of soil samples was determined using the water suspension (1:1) method, which was calibrated using a Metrohm pH meter. The soil was stirred with water (1:5) and allowed to stand for 30 min, and electrical conductivity was measured using an electrical conductivity meter. Using standard procedures, the concentrations of NH4+ and NO3- were determined at 520 and 420 nm, respectively, by using a spectrophotometer [52]. An air-dried subsample and 1 N KCl solution were placed in a reciprocal shaker (120 cycles min−1) for a duration of 60 minutes. The supernatant was filtered using a Whatman 42 filter paper and leached with 1 N KCl. The NH4+ content in each soil extract was colourimetrically measured using a spectrophotometer (Cecil, Germany) to compute NH4+ and N levels. A spectrophotometer was used to measure the colourimetry of the sulfanilamide colour reagent after the extraction of NO3-N using 1 N K2SO4. NH4 and NO3- were incorporated to form the inorganic N in mg kg-1 units. The soil was extracted by a pH 7 solution of ammonium acetate and filtered to estimate the CEC, according to [53]. Subsequently, the solution was calibrated using a standard solution and introduced into an atomic adsorption spectrophotometer (AAS) for magnesium and calcium and a flame photometer for sodium and potassium. CEC was calculated by combining all base cations in units of cmol(+)/kg.
Data analysis: The difference in organic C fractions and soil properties based on the land use types and soil depths were determined using a one-way ANOVA. The relationship between SOC and DOC, the availability of soil nutrients, and the ratio of DOC to nutrients were determined by Pearson’s correlation coefficients, and principal component regression analysis (PCA) was performed to study the relationships between SOC and labile carbon fractions using the open-program R version 4.1.
3. Results
Comparison of SOC and DOC between maize and paddy soil
The soil organic carbon and labile carbon fractions were higher in paddy soils than in maize soils, and the SOC, POXC, and DOC (i.e., WSC and HWSC) were higher in paddy soils than in maize plantations by 59%, 11%, 137%, and 114%, respectively (P <0.05; Figure 3 and Table 2). This clearly shows that the DOC was higher in the paddy soils than in the maize soils. The top soils showed higher mean SOC, POXC, and DOC levels than the subsoil, and these fractions had consistent total organic C content.
Furthermore, the impact of labile carbon fractions on SOC content in both soil types was examined using PCA. DOC and POXC accounted for 90.1% of the variance in SOC content between the two soil types (Figure 4).
The chemical properties of maize and paddy soils
The pH, CEC, Ca2+, Mg2+, and NH4 + in the paddy soils were higher than those in the maize soils (P < 0.05; Table 3). K+ and Na+ levels in the maize soils were higher than those in the paddy soils (P < 0.05; Table 3). However, the NO3 levels were not significantly different (P > 0.05; Table 3). Exchangeable Ca2+, Mg2+, and NH4+ were higher in paddy soils than in maize soils (P < 0.05; Table 3). K+ and Na+ levels in the maize soils were higher than those in the paddy soils (P < 0.05; Table 3).
The correlation results showed a negative correlation between pH and NH4+ (P< 0.001) and NO3 (P < 0.001) in maize soil and NH4+ (P < 0.001) in paddy soils (Figure 5a). There was a negative correlation between pH and NH4+ (P < 0.001) and NO3- (P < 0.001) in maize soils (Figure 5b) and NH4+ (P < 0.001) in paddy soils (Figure 5a). This study found that the availability of Ca2+ for SOC retention in paddy soil (r = 0.42; P < 0.001) was lower than that in maize soil and was not statistically significant (Figure 5b). While Mg2+ showed a positive correlation with SOC content (r = 0.07; P < 0.01) in paddy soil, in maize it showed a negative correlation (r = -0.07; P < 0.01)(Figure 5b). K+ showed a highly positive correlation with SOC in both the paddy soil (r = 0.28; P < 0.001; Figure 5a) and maize soil (r = 0.47; P < 0.001; Figure 5b). Moreover, SOC increased proportionally with P availability in maize soils (r = 0.35; P < 0.001), whereas SOC seemed to decline in paddy soils (r = -0.02; P < 0.05; Figure 5a&b). Notably, this study showed a correlation between pH and SOC in maize soils (r = 0.08; P < 0.01; Figure 5b); however, pH was not related to SOC in paddy soils (Figure 5a). CEC was correlated with SOC in both paddy (r = 0.36; P < 0.001) and maize soils (r = 0.44; P < 0.001; Figure 5a,b). We also found a negative relationship between exchangeable Na+ and SOC in both paddy (r = -0.07; P < 0.01; Figure 5a) and maize soil (r = -0.09; P < 0.01; Figure 5b). There was a negative correlation between pH and NH4+ (P < 0.001) and NO3- (P < 0.001) in maize soils (Figure 5b) and NH4+ (P < 0.001)I n paddy soils (Figure 5a). Soil pH showed a correlation with SOC in maize soils (r = 0.08; P < 0.01); however, pH was not related to SOC in paddy soil (Figure 5a). Overall, we show that K+, Ca2+, CEC, and NH4+ in paddy soils increases SOC retention, whereas pH, K+, CEC, NH4+, and NO3- are positively correlated with SOC retention in maize soils. However, Mg2+ and Ca2+ showed a negative correlation with SOC retention in maize soil, whereas SOC and Mg2+ showed a positive correlation in paddy soils (Figure 5a,b).
DOC and availability of nutrients
Paddy soil had higher ratios of DOC:NO3-, DOC: P (Bray II), and DOC:SOC than maize soil. However, DOC:NH4+ and DOC:Mg2+ were not significantly different between the land-use types. The ratio of P:NH4+, DOC:SOC, and DOC:NO3- was higher in paddy soils than in maize plantations (P < 0.05; Figure 6a–c; Table 4). Additionally, we found that P:NH4, DOC:SOC, DOC:NH4+ and DOC:NO3- in paddy soils were higher than those in maize plantations; however, DOC:Ca2+ was lower in paddy soils than in maize (P < 0.05; Figure 6a–c; Table 4). However, DOC:NH4+ and DOC:Mg2+ (P > 0.05; Figure 6d,h; Table 4) were not significantly different between the paddy and maize fields. Overall, our analysis of the land-use effect revealed that DOC:Ca2+ was lower in paddy soils than in maize soils (P < 0.05; Figure 6e; Table 4).
The effect of DOC and nutrients on SOC
In the paddy soils, there were positive correlations between SOC and DOC:NO3- (r=0.81; P < 0.001), DOC:P (Bary II) (r=0.55; P < 0.001), P(Bary II):NH4+ (r=0.20; P < 0.001), and DOC:NH4+ (r=0.27; P < 0.001). Conversely, the ratio of DOC:Ca2+ (r=-0.32; P <0.001) and DOC:SOC (r=- 0.49; P < 0.001) negatively correlated with SOC in the paddy soils (Figure 7a). Our findings showed that DOC:P(BrayII) (r=0.23; P < 0.001), DOC:NH4+ (r=0.58; P < 0.001) DOC:NO3 -(r=0.17; P < 0.001), DOC:Ca (r=0.8; P < 0.001), and DOC:Mg (r=0.65; P < 0.001) correlated positively with SOC in maize soil; however, there was a significant negative association between DOC:SOC (r=-0.48; P < 0.001), P(Bary II):NH4+ (r= -0.29; P < 0.001) and SOC (Figure 7b). Overall, paddy soils showed negative correlations with SOC indicators, with decreased indicators indicating SOC loss in paddy soils and DOC:SOC loss in maize soils.
4. Discussion
The size of mineral fertiliser on SOC
The availability of nutrients and carbon dynamics, including substrate-derived C decomposition and priming of SOC mineralisation, affects soil carbon storage [54]. Organic matter decomposition and nutrient cycling rates are influenced by an imbalance between substrate and microbial biomass stoichiometry [55]. The application of N, P, and K plays a crucial role in enhancing crop yield and returning plant residues to the soil [22].
At low N fertilisation rates (<100 kg ha -1 year -1), roots exudate fewer organic substances into the soil to gain nutrients for crop growth through SOM decomposition, thus causing a reduction in SOC content [22]. Contrastingly, intermediate K fertilisation (50–150 kg ha -1 year -1) alleviates soil K depletion. Our study showed that maize soil that received intermediate N and low P and K had dramatically less SOC. Intermediate levels (100-300 kg -1 ha-1 year 1) and high levels (50-150 kg ha -1 year -1) of N and K, respectively, had the most significant effects on effect size, while high fertiliser amounts (> 60 kg P ha-1 year -1) had the most notable effect size (Liu et al., 2023). This indicates that maize uplands would be limited by P and K. This induced an increase in native SOC decomposition for C and other elements for utilisation by soil microbes. Reduced SOC content results from roots exuding less organic matter into the soil to get nutrients through SOM breakdown for crop development at low N fertiliser rates (<100 ha -1 year -1; Zhao et al., 2019). In maize soil, low dosages of N and K are considered extreme for soil degradation, ineffective for C sequestration, and cause low maize yield. Overall, the application of N, P, and K plays a significant role in enhancing the crop yield and returning plant residues to the soil.
The correlation studies (Figure 5) showed that the increased availability of nutrients such as P, K, NH4, and NO3 in the upland soil was coupled with increased SOC retention and SOC sequestration. Increases in available N, P, and K are beneficial for SOC sequestration [22]. Therefore, these nutrients should constitute a larger fraction in organic fertilisers, consequently increasing C sequestration. At intermediate levels of fertilisation, N and K have the most decisive impact on the effect size, whereas P fertilisation has the most remarkable effect size in upland soil (Liu et al., 2023). Our findings were also consistent with this report. Multinutrient fertilisation with intermediate N and K levels decreases organism dependency (Liu et al., 2023). To mitigate soil K depletion, both sites received low K (less than 50 kg ha year) and intermediate fertilisation with N (50–150 kg ha-1 year -1). According to Li et al. (2017), such fertilisation raised the fertility of the soil for K. However, excess K fertiliser (>150 kg ha -1 year -1) was unable to accelerate the pace at which organic carbon transferred from crop residues and roots, causing appreciable alterations in the SOC pool [56]. Overall, we show that the size of the effect of fertilisation on SOC stocks is significantly influenced by the type of fertilisation, with intermediate N and K applications and high P fertilisation having the most significant effect.
Notably, in paddy soils, soil moisture is crucial for plants to utilise nutrients and for the development and activity of the soil microbiota. Oxygen limitations through water conditions regulate SOM mineralisation rates and may arise in otherwise well-aerated soils [13]. Regarding the low mineral N and K in paddy soil identified in this study, the correlation coefficients of the availability of NH4+, K, Ca, and Mg showed positive relationships with SOC (Figure 5), which would increase N and K for C sequestration and rice yield production. However, our results showed a negative relationship between the availability of NO3-, P, and SOC in paddy soils. Increasing the soil C stock in temperate mono-rice paddy soils is beneficial at the optimum level of N fertilisation (113-127 kg N ha-1) rather than at an excessive level [57]. Greater C stocks in paddy soils are the result of 1) rice contributing more organic C to the soil than the majority of upland cereals, 2) plant residues and SOM decomposing more slowly under anoxic conditions, and 3) sesquioxides playing a larger role in the biochemical stabilisation of SOM [58]. Moreover, the application of manure and minerals N, P, and K increased C stocks, such as the content of particulate organic matter and chemically protected fractions, showing the highest increase per unit of total SOC [59]. Crop productivity is eventually increased by the effective application of P fertiliser to increase SOC levels and, simultaneously, soil C sequestration. This is contingent on the initial P fertility (rich or low) of the soil [60,61]. Moreover, SOC increased in proportion to the amount of P available in upland maize soil (r=0.35; P < 0.001), whereas SOC seemed to decline in paddy soil (r= -0.02; P < 0.05). In our study, an additional intermediate level of P (20–60 kg-1 P2O5 year-1 [60]; was identified in both land-use types. The amount of P fertilisation, such as monocalcium phosphate, is the main source of P availability in both intensive cultivations and is related to the optimal rates of crop productivity and soil C sequestration. The parallelly added P and Ca showed a positive correlation between P and Ca in upland (r = 0.68; P< 0.001) and paddy soils (r = -0.10; P < 0.001; Figure 5a,b). Furthermore, the increased calcium and magnesium cations in paddy soils result in liming [62,63]. The role of Ca and Mg on SOC sequestration in paddy soil is presented in the next section.
Effect of DOC on the changed availability of C in maize and paddy soils
Changes in the total SOC content due to land use may be difficult to detect owing to soil variability [25]. Consistent with our findings, previous studies have concluded that DOC is a more sensitive indicator of soil quality [25], reflecting land-use effects and highlighting the need for future research on DOC and nutrient dynamics. Our results showed that the SOC and labile carbon fractions were higher in paddy soils, with higher levels of SOC and DOC than in upland soils (Figure 3). The topsoils had higher SOC and DOC levels than the subsoil. Consistently, deeper soil depths have lower DOC content than the upper 0–20 cm soil (Qiu et al., 2017 [64]. Paddy soils had lower mineralisation, leading to higher DOC and SOC accumulation [65]. Additionally, weak microbial activity in paddy soils results in low priming effects [66]. Overall, initially, maize cultivation intensified mineralisation and increased DOC concentrations, but as cultivation progressed, DOC concentrations decreased [67].
DOC mainly consists of small molecules, less humified organic material and fulvic acids [67,68], and soil fertility increases the DOC content [69]. The biodegradation of DOC in soils is influenced by its properties, with less humified organic materials showing higher biodegradation rates and more stable dissolved organic matter (DOM) [68], resulting in longer half-lives [68]. DOC significantly influences soil C mineralisation in subtropical China, with variations based on soil type and season [69].
Season and soil type significantly influence DOM contribution [32,70]. Soil CO2 production relies on organic carbon availability for microorganisms. Recent, younger C is easier to access than older C, which affects soil mineralisation [71].
Therefore, the decreased SOC in the upland maize soil might be due to maize residue-derived SOC, which contributes significantly to DOC production in the upland soil (Flessa et al., 2003). Correlation analysis showed that DOC was significantly positively correlated with clay content [72]; [73] but negatively correlated with native C [72,73]. The conversion of paddy fields into uplands significantly decreased SOC content, whereas abandoning farmland did not improve carbon storage [75,76]. Maize cultivation in cleared forest soils increases DOC, which is mainly composed of medium and large molecules but decreases it over time, mainly because of maize-derived carbon [67]. Moreover, temperature affects soil organic carbon, labile organic carbon fractions (microbial biomass carbon, DOC), and enzyme activity under long-term fertilisation regimes [77]. DOC may increase because of declining acid deposition and rising temperatures [78]. DOC concentrations in Central European deciduous forests are highly variable, with temperature being a key factor [79]. Organic manure treatments improve these properties and enzyme activity at various temperatures [77]. Increased substrate availability and microbial abundance, along with temperature, contribute to high rates of organic carbon pool decomposition [80]. These results are consistent with those of other studies on how maize cultivation in Thailand accelerates soil organic carbon loss owing to differences in natural 13C abundance between C3 and C4 plants [10]. This leads to higher decomposition rate constants and a decline in soil fertility, which ultimately leads to land degradation [4].
For the role of DOC in paddy soil, the percentage of labile DOC fraction determines the cumulative mineralisation of DOC within 100 days, accounting for 80.5%–91% in paddy soils and 66.3%–72.4% in upland soils [34], where the biodegradation rate is controlled by the percentage of labile DOC fraction [34].Paddy soils store more organic carbon and N than upland soils because of the higher inputs from rice, slower decomposition, and increased sesquioxide stabilisation [58]. Paddy soils are 39%–127% more efficient in soil organic carbon sequestration than upland soils, with greater differences in warmer climates [81]. Paddy soil has a greater carbon sequestration efficiency than upland soil, possibly because of its lower microbial activity [82] and greater chemical) stability [58]. Moreover, carbon accumulation in paddy soils is due to a microbial community that is well adapted to anoxic conditions but less efficient in mineralising carbon during transient oxic periods [83].
In paddy soils, soil organic matter mineralisation is influenced by low redox potential, microbial community composition, temperature, and biotic factors, whereas upland soil mineralisation is mainly regulated by bacteria [84]. Furthermore, converting uplands to paddy fields in mollisols increases soil organic carbon, decreases urease, glucosidase, and cellulose activities, and alters microbial diversity and community activity [85]. Anaerobic conditions and high moisture levels limit the fungal abundance and activity, resulting in weak priming effects. The priming effect is positively correlated with fungal abundance, which is lower in paddy soils than in upland soils [66].
The increased DOC concentrations in the paddy soil found in this study were due to carbon mineralisation under anoxic conditions, which is independent of redox conditions [12,13], with increased DOC concentrations due to desorption induced by increasing pH [86]. However, increasing DOC concentrations did not result in an equivalent increase in carbon mineralisation, possibly due to the lack of reducible iron oxide [83]. Our study demonstrated the role of DOC in SOC in conventional concentrated arable soils from northern Thailand. It is important to note that maize plantations are particularly affected by soil quality.
Effects of chemical properties of the soil and availability of basic cation on SOC retention
This study found that Ca and CEC in paddy soils enhanced soil organic carbon retention, whereas pH and CEC were positively correlated with SOC retention in upland maize soil. Na showed a negative correlation with SOC retention in both land types. Moreover, in paddy soil, higher exchangeable CEC, Ca, Mg, and Na consistently increased soil pH, but not in maize upland soil (Figure 5).
Cation exchangeable capacity (CEC): CEC is an edaphic property that can improve predictions of the response of soil C reservoirs to environmental change [87]. It is closely linked to soil organic carbon (SOC) and clay content in Brazilian soils [45]. The influence of SOC on the soil net charge emphasises the importance of agricultural management systems that preserve high levels of SOC for sustainability [45]. CEC is a more suitable predictor of soil organic carbon content than clay-size particles and is strongly linked to SOC content in top mineral soils [87]. Rice cultivation in southeast China boosts soil fertility by reducing acidity and increasing cation exchange capacity, thereby increasing organic carbon and nutrient accumulation in subsurface soils [88]. This study showed that CEC, which correlates with SOC, pH, and crucial plant nutrient content in both land types, could be considered an important indicator for assessing quality [89] and C sequestration, especially in tropical soils with intensive agriculture. SOC can be responsible for more than 80% of the CEC of highly weathered soils, such as Oxisols and Ultisols [45]. This study showed that the CEC was approximately two times lower in maize soil than in paddy soil and would further affect SOC content.
Exchangeable Na+ and Ca2+: Our study showed a negative relationship between exchangeable Na and SOC in both paddy (r = -0.07; P < 0.01) and upland maize soil (r = -0.09; P < 0.01). Consistent with other results, organic carbon and exchangeable sodium significantly influence the water-dispersible clay content in semiarid soils, which can lead to wind erosion [90]. High levels of exchangeable Na in soils can lead to lower soil SOC and affect soil chemistry, carbon and nutrient cycling, and organic matter decomposition [91]. SOC mineralisation in saline-alkaline soils is influenced by the exchangeable sodium percentage, enzyme activities, and soil organic carbon content, with salinisation inhibiting carbon sequestration more than carbon source processes [92].
Meanwhile, our research offers evidence for the advantageous effect of soil Ca2+ on the buildup of organic carbon in paddy soils but not in maize upland soils. High Ca2+ in paddy soils could affect SOC by altering soil Ca2+, which stabilises organic matter via cation bridging; however, this process is often overlooked [93,94]. The higher pH in paddy soil results in aggregates, and the carbon associated with them is more stable as soil aggregates than maize; however, the monovalent cations (i.e., K and Na) from both land types did not show significant stabilisation of carbon in the soil. Our results confirm that pH, Ca2+, and Mg2+ are involved in the chemical stability of organic carbon in arable soils. The higher pH in paddy soil resulted in aggregates, and the carbon associated with them was more stable than that in maize soil [94]. Another reason could be that besides chemical protection, physical protection from aggregates results in Ca2+ and Mg2+ acting as gathering agents to form soil aggregates [95].
Soil pH: Our study showed a correlation between pH and SOC in upland soils (r = 0.08; P < 0.01); however, pH was not related to SOC in paddy soils. Nonetheless, soil pH can influence 4.3–63.8% of SOC fluctuations, aiding in predicting future changes in SOC storage for specific land uses [96]. This suggests that the stabilisation of SOC by polyvalent cations is least effective at these pH levels [94].
The availability of N as NH4 and NO3: This study showed a positive correlation for NH4+ and SOC and NO3- and SOC only in upland soil but not in paddy soil. However, soil pH and N content significantly impacted SOC in these croplands. According to soil management approaches, mineral fertilisation can conserve resources by sequestering carbon and using inorganic N pools [39]. However, adding N can alter soil function [39], increasing organic carbon but reducing nutrient density and resilience to disturbances [14]. Such a conversion of arable cropland to grassland is a poor candidate for carbon sequestration because of reduced available soil N and low productivity [97]. However, soil carbon mineralisation is positively correlated with NH4+, NO3-, and the abundance of bacteria, fungi, methanotrophs, and nirK denitrifiers [80]. The higher concentrations of NH4+ in paddy soils likely reflect lower nitrification potential, while higher denitrification rates in paddy soils [98]. The cropping system influences fertilisation-induced changes in soil carbon chemistry, with paddy soil primarily determined by NO3- and total N, whereas upland soil is mostly explained by SOC and alkyl-C [29]. Our study showed the different effects of inorganic N availability, such as NH4+ and NO3-, on SOC in contrasting soil agroecosystems.
The relations between pH and NH4+ and NO3-: Soil pH is a key factor controlling NH4+ and organic N oxidation [99]. Our results showed a negative correlation between pH and NH4+ (P < 0.001) and NO3-(P < 0.001) in upland soils and NH4+(P < 0.001) in paddy soils (Figure 5). In maize soils, there is a negative relationship between NH4+ and pH, which is crucial for regulating autotrophic nitrification (Zhu et al., 2019) and controlling NH4+ and organic N oxidation in ecosystems, with a decrease in pH causing increased oxidation (Zhang et al., 2011). According to [99], NO3- production occurs through NH4+ and organic N oxidation in the soil. Moreover, increasing the pH of the upland soil reduces N availability. An increase in decomposed plant residue due to alkalinity, decarboxylation of organic anions, or immobilisation of nitrate by microbial biomass results in the release of hydroxyl ions [100]. In this study, paddy soils showed that positively correlated SOC and pH would result in high levels of NH4+ but not NO3-, which could be due to restricted nitrification and might be a result of excessive NH4+ [101]. In both soils, mineral fertilisers such as urea, (NH4)2SO4, and KNO3 marginally boosted the mineralisation of soil organic N, but NO3- is less immobilised in either soil [102]. Soil pH plays a crucial role in regulating N transformation, and studies have shown that nitrification does not occur at pH levels below 5. However, [103] found that pH did not influence nitrification, possibly because of microbial processes in the soil. Our study showed that soil pH was slightly acidic, and long-term N fertiliser addition increased N mineralisation, soil microbial biomass, and extracellular enzyme activities [104], especially in upland soils, which promoted NH4+ and NO3- (Figure 5). Meanwhile, in waterlogged paddy soils where nitrification was restricted, a high rate of microbial immobilisation-mineralisation turnover might lead to a lower δ15N of soil N than upland soil [105]. Therefore, in croplands, long-term soil carbon sequestration is dependent on edaphic variables such as soil pH and available N content, which are major determinants of carbon sequestration efficacy.
Effect of availability of Ca on DOC and SOC retention
Organic matter partitioning in soils is influenced by pH and calcium concentration; dissolved organic carbon concentrations increase with increasing pH and decrease with increasing calcium concentration [44]. The levels of exchangeable cations mainly control the sorption of dissolved organic carbon in salt-affected soils, and the sorption and desorption of added DOC are inversely related [106].
The role of Ca in SOC persistence has expanded from a driver of physicochemical reactions to a mediator of coupled abiotic-biotic cycling [42]. Both lands in this study received Ca from the phosphorus fertiliser, monocalcium phosphate. In paddy soils, higher Ca, increased soil C stocks, and the accumulation of SOC are due to calcium binding with organic matter [107,108]. Calcium-binding processes are also expected to be relatively unresponsive in very low-base soils and become important only with substantial increases in Ca2+ availability [108]. Soil SOC persistence is influenced by calcium (Ca) through physicochemical interactions between organic compounds and minerals [42]. This may also increase their availability to soil microorganisms, stimulating microbial activity in response to calcium addition [108]. Reduced C bioavailability owing to Ca-driven sorption or precipitation of DOC does not directly cause lower mineralisation rates in Ca-treated soils (Minick et al., 2017). However, lower DOC bioavailability is not a limiting factor [42]. Ca stabilises SOC through cation bridging, focusing on carboxyls and phenols [94]. Higher pH and Ca2+ availability can enhance the binding of DOC to metal ions, potentially leading to increased DOC loss in ecosystems during acidification recovery [108].
However, in the maize soil in this study, the lack of response to SOC level due to low Ca2+ in this soil (Figure 5b), which is a previous loss, was insufficient to significantly alter cation-SOM binding processes [108]. Therefore, Ca availability influences the mineralisation of organic matter primarily through stabilisation processes and pH effects [108].
DOC plays a key role in metal displacement in soils, with higher flow rates promoting faster metal mobilisation and lower concentrations of other ions [109]. DOC in the alkaline soils of southern Australia is higher than SOC, with farm management practices influencing DOC levels, grain yield, and DOC concentrations being inversely correlated [110,111]. In other ecosystems, decreasing Ca2+ levels contributed to increasing DOC trends [112]. Moreover, increasing the DOC in soil solutions increases Ca2+ uptake and decreases Mg2+ uptake by plants, whereas groundwater has no significant effect on these uptakes [113].
Ca-induced changes in litter microbial processing led to a cascading effect on the C and N occurring as mineral associated organic matter (MAOM). In Ca-treated soils, more litter was cycled through microbial biomass, but less MAOM was measured. At Tend, surface-adhering bacteria also consumed litter-derived MAOM. After Ca addition, the proportion of MBC derived from litter-C was significantly higher, and MAOM consisted of more microbially processed compounds [42].
Effect of availability of nutrients and DOC on SOC retention
Soil priming affects carbon metabolism and loss in soil [21] in three stages: substrate switching, positive decomposition, and negative effects [20]. DOC, Olsen P, and N availability regulate degradation [114,115]. Sufficient and optimal C:nutrient ratios would meet microbial stoichiometric requirements and stimulate the microbial co-metabolism of soil exogenous and native OC [36,38], which would affect SOC in the soil. Soil carbon is crucial for ecosystem health, and stoichiometry plays a key role in agroecosystem functions [116]. Soil microorganisms regulate carbon turnover through stoichiometric flexibility, thereby ensuring a balance between resources and microbial activity [36]. Therefore, the balance of labile carbons and nutrients in tropical agricultural soils, such as paddy and maize soils, can be explained by the ratio of nutrient availability and carbon cycling. Soil carbon and N balance in paddy soil was determined through a manipulation experiment involving N or P fertilisation [38].
Our study showed that the DOC:P (Bray II), DOC:NH4, and DOC:NO3 ratios in paddy and upland soils were positively correlated with SOC, indicating that an increase in these ratios would decrease SOC mineralisation in both land uses (Figure 7a&b). Lower ratios of DOC:NH4+, DOC:NO3-, and DOC:P (Bray II) were found in the maize soil and positively correlated with SOC retention. In paddy, the ratios of DOC:NH4+, DOC:NO3-, and DOC:P (Bray II) and P:NH4+ had a direct positive effect on SOC retention and/or increased SOC (Figure 7a). Compared with SOC, mineralisation increases exponentially with increasing DOC:NH4+ and DOC:P (Olsen) ratios [38]. Bacterial abundance and diversity are negatively related to DOC:NH4+ and DOC:P (Olsen), which have direct positive effects on SOC mineralisation [38]. Straw mineralisation increases exponentially with soil DOC:NH4+ and DOC:P(Olsen P) until reaching a maximum rate [36], and a maximum 13CO2 efflux is reached with an increase in the ratios of DOC:NH4+, DOC:P (Olsen), and microbial biomass C:N [36]. The application of mineral N and P fertilisers to maize could promote DOC and SOC mineralisation and be inversely correlated with NH4+ because of NH4 oxidation to NO3 in the upland soil. Mineral fertilisers satisfy microbial stoichiometric requirements and reduce competition [38]. Stoichiometric control of increased DOC affects native soil organic C mineralisation in paddy soils. [38] found that bacterial abundance and diversity were negatively related to DOC:NH4+-N and DOC:P (Olsen) but positively influenced SOC mineralisation, causing bacteria to maintain microbial biomass balance. Bacteria shift their community composition and interactions to acquire the necessary elements by increasing SOC mineralisation to maintain the microbial biomass balance [38]. This is because the priming effect persists over time and depends on microbial biomass, substrate C and N availability, and the decomposition stage [38].
In addition, in maize soil supplemented with mineral fertilisers, NH4+ and P enhance soil microbes and enzyme activities and would improve soil C mineralisation (Ref), meeting microbial demand for optimal C, N, and P ratios [38]. Our study showed a negative relationship between SOC and the P:NH4+ ratio, which indicates an increased P:NH4+ ratio and a decrease in SOC in maize soil. This indicates that an imbalance occurred between P and NH4+ in this soil. Maize soil showed that the relationship between P:NH4+ and retained SOC was negative (Figure 7b; r = -0.29; P < 0.001), which may not be sufficient for NH4+. A lack of NH4+-N still occurred in the upland maize soil (higher P:NH4+-N), which could then stimulate SOC mineralisation. A positive correlation was observed between the P:NH4+ and DOC:SOC ratios (r = 0.27; P < 0.001; Figure 7b and 6c; Table 4). However, this relationship (i.e., P:NH4+ ratio and DOC:SOC ratio) was inverted (a negative correlation; r = - 0.18; P < 0.001; Figure 7b) in paddy soils, where higher values of this ratio were observed. These results are consistent with the decreasing SOC in maize owing to the imbalanced availability of nutrients, as determined by PE.
High availability of C: Soil enzymes increase, suggesting that microbes utilised energy from available C for nutrient acquisition [38]. Thus, increased DOC and DOC:NH4+ ratios would decrease nutrient intake for soil microbes. Our results showed that paddy soil had increased DOC from redox and anaerobic metabolism, and catabolism was limited by the addition of mineral fertiliser (Table 1). In addition, there was a clearly higher DOC:NH4+ in paddy soils than in upland soils and also a higher DOC:P Bray (II) in paddy soils. Interestingly, paddy soil showed a compromised lower NO3-N due to anoxic conditions. This indicates that higher DOC:NH4+, DOC:NO3-, and DOC:P Bray (II) were found in paddy soils where SOC accumulation was compromised.
According to our findings, the NO3 level was negatively correlated with SOC, whereas the NH4+ level was beneficial (Figure 5a). In paddy soil, however, the excessive NH4+ availability negatively impacted plant-microbe interactions, reducing the regulation of soil microorganisms by plant-derived carbon sources [116].
Furthermore, the combination of N and P with straw application in paddy soil increased microbial growth and enzyme activity, leading to increased straw mineralisation and PE [36,38], which could explain our data on paddy soil. Because of the higher DOC in paddy soils, negative priming occurs when labile C is used instead of recalcitrant SOC, resulting in different lag phases; that is, glucose amendment allows for preferential substrate utilisation earlier, whereas lignocellulose requires depolymerisation for labile C utilisation [115]. This may have been due to the lower SOC loss in the paddy soil in this study.
The SOC content can be influenced by labile carbon inputs, which can change the PE in soils [18]. The addition of labile carbon to low-SOC soils leads to greater increases in PE, especially in low-SOC soils, but also in soils already depleted by increased C input [18] For example, subsoil organic carbon mineralisation is more sensitive to labile carbon and N addition [117], and microbial activity plays a key role in promoting mineralisation [118]. This might be due to the increased SOC loss which occurred in the maize soil in this study.
Moreover, paddy soil has a restricted mineralisation of fresh substrates and a small priming effect, promoting the accumulation of organic C, despite the presence of significant priming effects in upland soil [11]. Paddy soil ecosystems are frequently influenced by artificial factors like straw return and inorganic fertiliser application. Soil microorganisms, while typically conserved, can also be flexible and shift their elemental balance [36]. Furthermore, the size of the received residue increases and these residues release a pulse of hydrophilic DOM, dominating the soil DOM pool and degrading C [19]. The addition of straw to paddy soils regulates microbial activity [36]. Consequently, there might be no significant priming effect of fresh substrate addition on the mineralisation of native organic C in paddy soils. In contrast, the priming effect is significantly higher in upland soils [11]. Maize residue amendment can improve PE efficiency by affecting microbial biomass and community composition [20]. However, the stoichiometric control of plant residue microbial mineralisation in paddy soils remains unclear, as does their impact on soil priming [36].
This approach maintains a balance in response to resource changes, thereby ensuring a balanced microbial community [38]. The cycling of C in contrasting agroecosystems that is, paddy and maize soils, could be explained by the ratio of the availability of nutrients and C. Therefore, the availability of labile carbons such as DOC and nutrients (i.e., NH4, NO3, and P) and their stoichiometry enhanced the explanatory SOC dynamics of tropical agricultural soils. Precise techniques should involve isotopes, biomarkers, etc., and other labile carbon fractions would be sources of available C. Furthermore, soil management, such as tillage and wetting tillage, should be expanded.
5. Conclusions
The results showed that paddy soils had higher organic carbon and labile carbon fractions than maize soils. Analysis of paddy and maize soil properties showed that paddy soils had higher pH, CEC, Ca2+, Mg2+, and NH4+ levels than maize soil. Although maize soil had higher K+ and Na+ levels than paddy soil, there was no significant difference in NO3 levels between paddy and maize soils. Exchangeable Na+ showed a negative relationship with SOC in both paddy and maize soils, whereas Na+ and Mg2+ showed a negative relationship with SOC retention in maize soil. Ca2+ was not significantly related to SOC in the maize soil. A significant negative association was found between DOC:SOC, P(Bary II):NH4+, and SOC in maize soil, which may reduce the SOC content and affect soil degradation and maize yield. The decreased SOC in the upland soils may be due to residue-derived SOC. Furthermore, Ca affects SOC retention in paddy soils, whereas lower levels of DOC:NH4+-N, DOC:NO3-N, and DOC:P in maize soil compromise SOC retention.
Author Contributions
Conceptualisation, S.A. and C.C.; methodology, S.A.; software, C.C. and R.L.; validation, S.A., C.C., and R.L.; formal analysis, C.C.; investigation, S.A.; resources, S.A. and C.C.; data curation, S.A. and R.L.; writing—original draft preparation, S.A. and C.C.; writing—review and editing, S.A., C.C., and R.L.; visualisation, C.C. and R. L.; supervision, S.A.; project administration, S.A. All authors read and agreed to the published version of the manuscript.
Funding
This study received no external funding.
Informed Consent Statement
Not applicable.
Data Availability Statement
Not applicable.
Acknowledgments
We appreciate the cooperation of Maejo University and Chaing Mai University for publication.
Conflicts of Interest
The authors declare no conflicts of interest.
References
- Lal, R. Forest Soils and Carbon Sequestration. Forest Ecology and Management 2005, 220, 242–258. [Google Scholar] [CrossRef]
- Lal, R. Carbon Sequestration in Dryland Ecosystems. Environmental Management 2004, 33, 528–544. [Google Scholar] [CrossRef]
- Lal, R. Soil degradation as a reason for inadequate human nutrition. Food Security 2009, 1, 45–57. [Google Scholar] [CrossRef]
- Bruun, T.B.; de Neergaard, A.; Burup, M.L.; Hepp, C.M.; Larsen, M.N.; Abel, C.; Aumtong, S.; Magid, J.; Mertz, O. Intensification of Upland Agriculture in Thailand: Development or Degradation? Land Degradation & Development 2017, 28, 83–94. [Google Scholar] [CrossRef]
- Amnuaylojaroen, T.; Chanvichit, P.; Janta, R.; Surapipith, V. Projection of Rice and Maize Productions in Northern Thailand under Climate Change Scenario RCP8.5. Agriculture 2021, 11. [Google Scholar] [CrossRef]
- Ortiz, R.; Taba, S.; Tovar, V.H.C.; Mezzalama, M.; Xu, Y.; Yan, J.; Crouch, J.H. Conserving and Enhancing Maize Genetic Resources as Global Public Goods–A Perspective from CIMMYT. Crop Science 2010, 50, 13–28. [Google Scholar] [CrossRef]
- Trisurat, Y.; Shirakawa, H.; Johnston, J.M. Land-Use/Land-Cover Change from Socio-Economic Drivers and Their Impact on Biodiversity in Nan Province, Thailand. Sustainability 2019, 11. [Google Scholar] [CrossRef]
- Dechert, G.; Veldkamp, E.; Anas, I. Is soil degradation unrelated to deforestation? Examining soil parameters of land use systems in upland Central Sulawesi, Indonesia. Plant and Soil 2004, 265, 197–209. [Google Scholar] [CrossRef]
- Lippe, M.; Hilger, T.; Sudchalee, S.; Wechpibal, N.; Jintrawet, A.; Cadisch, G. Simulating Stakeholder-Based Land-Use Change Scenarios and Their Implication on Above-Ground Carbon and Environmental Management in Northern Thailand. Land 2017, 6. [Google Scholar] [CrossRef]
- Fujii, K.; Mitani, R.; Inagaki, Y.; Hayakawa, C.; Shibata, M.; Kosaki, T.; Ueda, M.U. Continuous maize cropping accelerates loss of soil organic matter in northern Thailand as revealed by natural 13C abundance. Plant and Soil 2022, 474, 251–262. [Google Scholar] [CrossRef]
- Wu, J.; Zhou, P.; Li, L.; Su, Y.; Yuan, H.; Syers, J.K. Restricted mineralization of fresh organic materials incorporated into a subtropical paddy soil. Journal of the Science of Food and Agriculture 2012, 92, 1031–1037. [Google Scholar] [CrossRef]
- Aumtong, S.; Chotamonsak, C.; Glomchinda, T. Study of the Interaction of Dissolved Organic Carbon, Available Nutrients, and Clay Content Driving Soil Carbon Storage in the Rice Rotation Cropping System in Northern Thailand. Agronomy 2023, 13. [Google Scholar] [CrossRef]
- Aumtong, S.; Chotamonsak, C.; Somchit, B. The increased carbon storage changes with a decrease in phosphorus availability in the organic paddy soil. Ilmu Pertanian (Agricultural Science) 2022, 7, 91. [Google Scholar] [CrossRef]
- Oldfield, E.E.; Bradford, M.A.; Wood, S.A. Global meta-analysis of the relationship between soil organic matter and crop yields. SOIL 2019, 5, 15–32. [Google Scholar] [CrossRef]
- Zomer, R.J.; Bossio, D.A.; Sommer, R.; Verchot, L.V. Global Sequestration Potential of Increased Organic Carbon in Cropland Soils. Scientific Reports 2017, 7, 15554. [Google Scholar] [CrossRef] [PubMed]
- Ramesh, T.; Bolan, N.S.; Kirkham, M.B.; Wijesekara, H.; Kanchikerimath, M.; Srinivasa Rao, C.; Sandeep, S.; Rinklebe, J.; Ok, Y.S.; Choudhury, B.U.; et al. Chapter One - Soil organic carbon dynamics: Impact of land use changes and management practices: A review. In Advances in Agronomy, Sparks, D.L., Ed.; Academic Press: 2019; Volume 156, pp. 1-107.
- Paterson, E.; Sim, A. Soil-specific response functions of organic matter mineralization to the availability of labile carbon. Global Change Biology 2013, 19, 1562–1571. [Google Scholar] [CrossRef] [PubMed]
- Jílková, V.; Jandová, K.; Kukla, J. Responses of microbial activity to carbon, nitrogen, and phosphorus additions in forest mineral soils differing in organic carbon content. Biology and Fertility of Soils 2021, 57, 513–521. [Google Scholar] [CrossRef]
- De Troyer, I.; Amery, F.; Van Moorleghem, C.; Smolders, E.; Merckx, R. Tracing the source and fate of dissolved organic matter in soil after incorporation of a 13C labelled residue: A batch incubation study. Soil Biology and Biochemistry 2011, 43, 513–519. [Google Scholar] [CrossRef]
- Qiu, Q.; Wu, L.; Ouyang, Z.; Li, B.; Xu, Y.; Wu, S.; Gregorich, E.G. Priming effect of maize residue and urea N on soil organic matter changes with time. Applied Soil Ecology 2016, 100, 65–74. [Google Scholar] [CrossRef]
- Nottingham, A.T.; Griffiths, H.; Chamberlain, P.M.; Stott, A.W.; Tanner, E.V.J. Soil priming by sugar and leaf-litter substrates: A link to microbial groups. Applied Soil Ecology 2009, 42, 183–190. [Google Scholar] [CrossRef]
- Liu, Y.; Li, C.; Cai, G.; Sauheitl, L.; Xiao, M.; Shibistova, O.; Ge, T.; Guggenberger, G. Meta-analysis on the effects of types and levels of N, P, and K fertilization on organic carbon in cropland soils. Geoderma 2023, 437, 116580. [Google Scholar] [CrossRef]
- Geisseler, D.; Scow, K. Long-term effects of mineral fertilizers on soil microorganisms – A review. Soil Biology and Biochemistry 2014, 75, 54–63. [Google Scholar] [CrossRef]
- Matsumoto, N.; Nobuntou, W.; Punlai, N.; Sugino, T.; Rujikun, P.; Luanmanee, S.; Kawamura, K. Soil carbon sequestration on a maize-mung bean field with rice straw mulch, no-tillage, and chemical fertilizer application in Thailand from 2011 to 2015. Soil Science and Plant Nutrition 2021, 67, 190–196. [Google Scholar] [CrossRef]
- Silveira, M. Dissolved organic carbon and bioavailability of N and P as indicators of soil quality. Scientia Agricola 2005, 62. [Google Scholar] [CrossRef]
- Laik, R.; Kumara, B.H.; Pramanick, B.; Singh, S.K.; Nidhi; Alhomrani, M.; Gaber, A.; Hossain, A. Labile Soil Organic Matter Pools Are Influenced by 45 Years of Applied Farmyard Manure and Mineral Nitrogen in the Wheat—Pearl Millet Cropping System in the Sub-Tropical Condition. Agronomy 2021, 11. 2021, 11. [Google Scholar] [CrossRef]
- Dou, F.G.; Wright, A.; Hons, F.M. Dissolved and Soil Organic Carbon after Long-Term Conventional and No-Tillage Sorghum Cropping. Communications in Soil Science and Plant Analysis 2008, 39, 667–679. [Google Scholar] [CrossRef]
- Li, Y.; Chen, Z.; Chen, J.; Castellano, M.J.; Ye, C.; Zhang, N.; Miao, Y.; Zheng, H.; Li, J.; Ding, W. Oxygen availability regulates the quality of soil dissolved organic matter by mediating microbial metabolism and iron oxidation. Global Change Biology 2022, 28, 7410–7427. [Google Scholar] [CrossRef]
- Li, D.; Liu, K.; Huang, Q.; Zhang, J.; Zhao, B. Different responses of soil carbon chemistry to fertilization regimes in the paddy soil and upland soil were mainly reflected by the opposite shifts of OCH and alkyl C. Geoderma 2021, 385, 114876. [Google Scholar] [CrossRef]
- Tian, Y.; Wang, X.; Luo, J.; Yu, H.; Zhang, H. Evaluation of Holistic Approaches to Predicting the Concentrations of Metals in Field-Cultivated Rice. Environmental Science & Technology 2008, 42, 7649–7654. [Google Scholar] [CrossRef]
- Kurek, M.R.; Harir, M.; Shukle, J.T.; Schroth, A.W.; Schmitt-Kopplin, P.; Druschel, G.K. Seasonal transformations of dissolved organic matter and organic phosphorus in a polymictic basin: Implications for redox-driven eutrophication. Chemical Geology 2021, 573, 120212. [Google Scholar] [CrossRef]
- Chen, M.; Li, C.; Spencer, R.G.M.; Maie, N.; Hur, J.; McKenna, A.M.; Yan, F. Climatic, land cover, and anthropogenic controls on dissolved organic matter quantity and quality from major alpine rivers across the Himalayan-Tibetan Plateau. Sci Total Environ 2021, 754, 142411. [Google Scholar] [CrossRef]
- Filep, T.; Rékási, M. Factors controlling dissolved organic carbon (DOC), dissolved organic nitrogen (DON) and DOC/DON ratio in arable soils based on a dataset from Hungary. Geoderma 2011, 162, 312–318. [Google Scholar] [CrossRef]
- Chen, X.B.; Wang, A.H.; Hu, L.N.; Huang, Y.; Li, Y.; He, X.Y.; Su, Y.R. [Response of mineralization of dissolved organic carbon to soil moisture in paddy and upland soils in hilly red soil region]. Ying Yong Sheng Tai Xue Bao 2014, 25, 752–758. [Google Scholar] [PubMed]
- Qiu, Q.; Wu, L.; Ouyang, Z.; Li, B.; Xu, Y.; Wu, S.; Gregorich, E.G. Effects of plant-derived dissolved organic matter (DOM) on soil CO2 and N2O emissions and soil carbon and nitrogen sequestrations. Applied Soil Ecology 2015, 96, 122–130. [Google Scholar] [CrossRef]
- Zhu, Z.; Ge, T.; Luo, Y.; Liu, S.; Xu, X.; Tong, C.; Shibistova, O.; Guggenberger, G.; Wu, J. Microbial stoichiometric flexibility regulates rice straw mineralization and its priming effect in paddy soil. Soil Biology and Biochemistry 2018, 121, 67–76. [Google Scholar] [CrossRef]
- Wu, Y.; Lu, S.; Zhu, Y.; Zhang, Y.; Wu, M.; Long, X.-E. Microbes in a neutral-alkaline paddy soil react differentially to intact and acid washed biochar. Journal of Soils and Sediments 2022, 22, 3137–3150. [Google Scholar] [CrossRef]
- Wei, X.; Zhu, Z.; Liu, Y.; Luo, Y.; Deng, Y.; Xu, X.; Liu, S.; Richter, A.; Shibistova, O.; Guggenberger, G.; et al. C:N:P stoichiometry regulates soil organic carbon mineralization and concomitant shifts in microbial community composition in paddy soil. Biology and Fertility of Soils 2020, 56, 1093–1107. [Google Scholar] [CrossRef]
- Srivastava, P.; Singh, R.; Bhadouria, R.; Singh, P.; Tripathi, S.; Singh, H.; Raghubanshi, A.S.; Mishra, P.K. Physical and Biological Processes Controlling Soil C Dynamics. In Sustainable Agriculture Reviews 33: Climate Impact on Agriculture, Lichtfouse; Lichtfouse, E., Ed.; Springer International Publishing: Cham, Switzerland, 2018; pp. 171–202. [Google Scholar]
- Li, N.; Li, X.; Li, S.; Guo, S.; Wan, Z.; Huang, G.; Xu, H. Impacts of Rotation-Fallow Practices on Bacterial Community Structure in Paddy Fields. Microbiology Spectrum 2022, 10, e00227–00222. [Google Scholar] [CrossRef]
- Yang, Y.; Meng, T.; Qian, X.; Zhang, J.; Cai, Z. Evidence for nitrification ability controlling nitrogen use efficiency and N losses via denitrification in paddy soils. Biology and Fertility of Soils 2017, 53, 349–356. [Google Scholar] [CrossRef]
- Shabtai, I.A.; Wilhelm, R.C.; Schweizer, S.A.; Höschen, C.; Buckley, D.H.; Lehmann, J. Calcium promotes persistent soil organic matter by altering microbial transformation of plant litter. Nature Communications 2023, 14, 6609. [Google Scholar] [CrossRef]
- Whittinghill, K.A.; Hobbie, S.E. Effects of pH and calcium on soil organic matter dynamics in Alaskan tundra. Biogeochemistry 2012, 111, 569–581. [Google Scholar] [CrossRef]
- Oste, L.A.; Temminghoff, E.J.M.; Riemsdijk, W.H.V. Solid-solution Partitioning of Organic Matter in Soils as Influenced by an Increase in pH or Ca Concentration. Environmental Science & Technology 2002, 36, 208–214. [Google Scholar] [CrossRef]
- Soares, M.R.; Alleoni, L.R.F. Contribution of Soil Organic Carbon to the Ion Exchange Capacity of Tropical Soils. Journal of Sustainable Agriculture 2008, 32, 439–462. [Google Scholar] [CrossRef]
- Ghani, A.; Dexter, M.; Carran, R.A.; Theobald, P.W. Dissolved organic nitrogen and carbon in pastoral soils: the New Zealand experience. European Journal of Soil Science 2007, 58, 832–843. [Google Scholar] [CrossRef]
- Ghani, A.; Müller, K.; Dodd, M.; Mackay, A. Dissolved organic matter leaching in some contrasting New Zealand pasture soils. European Journal of Soil Science 2010, 61, 525–538. [Google Scholar] [CrossRef]
- Nelson, D.W.; Sommers, L.E. Total Carbon, Organic Carbon, and Organic Matter. In Methods of Soil Analysis; SSSA Book Series; 1996; pp. 961-1010.
- Wade, J.; Maltais-Landry, G.; Lucas, D.E.; Bongiorno, G.; Bowles, T.M.; Calderón, F.J.; Culman, S.W.; Daughtridge, R.; Ernakovich, J.G.; Fonte, S.J.; et al. Assessing the sensitivity and repeatability of permanganate oxidizable carbon as a soil health metric: An interlab comparison across soils. Geoderma 2020, 366, 114235. [Google Scholar] [CrossRef]
- Weil, R.; Stine, M.; Gruver, J.; Samson-Liebig, S. Estimating active carbon for soil quality assessment: A simplified method for laboratory and field use. American Journal of Alternative Agriculture 2003, 18, 3–17. [Google Scholar] [CrossRef]
- McLean, E.O. Soil pH and Lime Requirement. In Methods of Soil Analysis; Agronomy Monographs; 1983; pp. 199-224.
- Keeney, D.R.; Nelson, D.W. Nitrogen—Inorganic Forms. In Methods of Soil Analysis; Agronomy Monographs; 1983; pp. 643-698.
- Chapman, H.D. Cation-Exchange Capacity. In Methods of Soil Analysis; Agronomy Monographs; 1965; pp. 891-901.
- Ge, T.; Luo, Y.; Singh, B.P. Resource stoichiometric and fertility in soil. Biology and Fertility of Soils 2020, 56, 1091–1092. [Google Scholar] [CrossRef]
- Kaiser, C.; Franklin, O.; Dieckmann, U.; Richter, A. Microbial community dynamics alleviate stoichiometric constraints during litter decay. Ecology Letters 2014, 17, 680–690. [Google Scholar] [CrossRef] [PubMed]
- Yuan, G.; Huan, W.; Song, H.; Lu, D.; Chen, X.; Wang, H.; Zhou, J. Effects of straw incorporation and potassium fertilizer on crop yields, soil organic carbon, and active carbon in the rice–wheat system. Soil and Tillage Research 2021, 209, 104958. [Google Scholar] [CrossRef]
- Kim, G.W.; Jeong, S.T.; Kim, P.J.; Gwon, H.S. Influence of nitrogen fertilization on the net ecosystem carbon budget in a temperate mono-rice paddy. Geoderma 2017, 306, 58–66. [Google Scholar] [CrossRef]
- Wei, L.; Ge, T.; Zhu, Z.; Luo, Y.; Yang, Y.; Xiao, M.; Yan, Z.; Li, Y.; Wu, J.; Kuzyakov, Y. Comparing carbon and nitrogen stocks in paddy and upland soils: Accumulation, stabilization mechanisms, and environmental drivers. Geoderma 2021, 398, 115121. [Google Scholar] [CrossRef]
- Yang, F.; Tian, J.; Meersmans, J.; Fang, H.; Yang, H.; Lou, Y.; Li, Z.; Liu, K.; Zhou, Y.; Blagodatskaya, E.; et al. Functional soil organic matter fractions in response to long-term fertilization in upland and paddy systems in South China. CATENA 2018, 162, 270–277. [Google Scholar] [CrossRef]
- Liu, J.; Gou, X.; Liu, J.; Yang, H.; Yin, D. Stocks of soil carbon, nitrogen, and phosphorus in coniferous forests on the Qilian Mountains: spatial trends and drivers. European Journal of Forest Research 2023, 142, 1113–1123. [Google Scholar] [CrossRef]
- Bansal, S.; Yin, X.; Savoy, H.J.; Jagadamma, S.; Lee, J.; Sykes, V. Long-term influence of phosphorus fertilization on organic carbon and nitrogen in soil aggregates under no-till corn–wheat–soybean rotations. Agronomy Journal 2020, 112, 2519–2534. [Google Scholar] [CrossRef]
- Zhu, H.; Chen, C.; Xu, C.; Zhu, Q.; Huang, D. Effects of soil acidification and liming on the phytoavailability of cadmium in paddy soils of central subtropical China. Environmental Pollution 2016, 219, 99–106. [Google Scholar] [CrossRef] [PubMed]
- Radmann, V.; Sousa, R.; Weinert, C.; Jordão, H.; Carlos, F. Soil solution and rice nutrition under liming and water management in a soil from Amazonian natural fields. Revista Brasileira de Ciência do Solo 2023, 47. [Google Scholar] [CrossRef]
- Fröberg, M.; Jardine, P.M.; Hanson, P.J.; Swanston, C.W.; Todd, D.E.; Tarver, J.R.; Garten, C.T. Low Dissolved Organic Carbon Input from Fresh Litter to Deep Mineral Soils. Soil Science Society of America Journal 2007, 71, 347–354. [Google Scholar] [CrossRef]
- Kögel-Knabner, I.; Amelung, W.; Cao, Z.; Fiedler, S.; Frenzel, P.; Jahn, R.; Kalbitz, K.; Kölbl, A.; Schloter, M. Biogeochemistry of paddy soils. Geoderma 2010, 157, 1–14. [Google Scholar] [CrossRef]
- Qiu, H.; Zheng, X.; Ge, T.; Dorodnikov, M.; Chen, X.; Hu, Y.; Kuzyakov, Y.; Wu, J.; Su, Y.; Zhang, Z. Weaker priming and mineralisation of low molecular weight organic substances in paddy than in upland soil. European Journal of Soil Biology 2017, 83, 9–17. [Google Scholar] [CrossRef]
- Delprat, L.; Chassin, P.; Linères, M.; Jambert, C. Characterization of dissolved organic carbon in cleared forest soils converted to maize cultivation. European Journal of Agronomy 1997, 7, 201–210. [Google Scholar] [CrossRef]
- Kalbitz, K.; Schmerwitz, J.; Schwesig, D.; Matzner, E. Biodegradation of soil-derived dissolved organic matter as related to its properties. Geoderma 2003, 113, 273–291. [Google Scholar] [CrossRef]
- Li, Z.P.; Han, C.W.; Han, F.X. Organic C and N mineralization as affected by dissolved organic matter in paddy soils of subtropical China. Geoderma 2010, 157, 206–213. [Google Scholar] [CrossRef]
- Fellman, J.B.; Hood, E.; D’Amore, D.V.; Edwards, R.T.; White, D. Seasonal changes in the chemical quality and biodegradability of dissolved organic matter exported from soils to streams in coastal temperate rainforest watersheds. Biogeochemistry 2009, 95, 277–293. [Google Scholar] [CrossRef]
- Pausch, J.; Kuzyakov, Y. Soil organic carbon decomposition from recently added and older sources estimated by δ13C values of CO2 and organic matter. Soil Biology and Biochemistry 2012, 55, 40–47. [Google Scholar] [CrossRef]
- She, R.; Yu, Y.; Ge, C.; Yao, H. Soil Texture Alters the Impact of Salinity on Carbon Mineralization. Agronomy 2021, 11. [Google Scholar] [CrossRef]
- Singh, M.; Sarkar, B.; Hussain, S.; Ok, Y.S.; Bolan, N.S.; Churchman, G.J. Influence of physico-chemical properties of soil clay fractions on the retention of dissolved organic carbon. Environmental Geochemistry and Health 2017, 39, 1335–1350. [Google Scholar] [CrossRef] [PubMed]
- Si, Y.; Xiong, L.; Chen, Y.; Zhu, J.; Xie, J.; Gao, R.; Yang, Y. Contribution of the vertical movement of dissolved organic carbon to carbon allocation in two distinct soil types under Castanopsis fargesii Franch. and C. carlesii (Hemsl.) Hayata forests. Annals of Forest Science 2018, 75, 79. [Google Scholar] [CrossRef]
- Xu, S.; Liu, X.; Li, X.; Tian, C. Soil organic carbon changes following wetland cultivation: A global meta-analysis. Geoderma 2019, 347, 49–58. [Google Scholar] [CrossRef]
- Shi, L.J.; Zheng, L.B.; Mei, X.Y.; Yu, L.Z.; Jia, Z.C. [Characteristics of soil organic carbon and total nitrogen under different land use types in Shanghai]. Ying Yong Sheng Tai Xue Bao 2010, 21, 2279–2287. [Google Scholar] [PubMed]
- Qi, R.; Li, J.; Lin, Z.; Li, Z.; Li, Y.; Yang, X.; Zhang, J.; Zhao, B. Temperature effects on soil organic carbon, soil labile organic carbon fractions, and soil enzyme activities under long-term fertilization regimes. Applied Soil Ecology 2016, 102, 36–45. [Google Scholar] [CrossRef]
- Evans, C.D.; Monteith, D.T.; Cooper, D.M. Long-term increases in surface water dissolved organic carbon: Observations, possible causes and environmental impacts. Environmental Pollution 2005, 137, 55–71. [Google Scholar] [CrossRef] [PubMed]
- Solinger, S.; Kalbitz, K.; Matzner, E. Controls on the dynamics of dissolved organic carbon and nitrogen in a Central European deciduous forest. Biogeochemistry 2001, 55, 327–349. [Google Scholar] [CrossRef]
- Song, Y.; Liu, C.; Song, C.; Wang, X.; Ma, X.; Gao, J.; Gao, S.; Wang, L. Linking soil organic carbon mineralization with soil microbial and substrate properties under warming in permafrost peatlands of Northeastern China. CATENA 2021, 203, 105348. [Google Scholar] [CrossRef]
- Chen, X.; Hu, Y.; Xia, Y.; Zheng, S.; Ma, C.; Rui, Y.; He, H.; Huang, D.; Zhang, Z.; Ge, T.; et al. Contrasting pathways of carbon sequestration in paddy and upland soils. Global Change Biology 2021, 27, 2478–2490. [Google Scholar] [CrossRef]
- Liu, K.-l.; Huang, J.; Li, D.-m.; Yu, X.-c.; Ye, H.-c.; Hu, H.-w.; Hu, Z.-h.; Huang, Q.-h.; Zhang, H.-m. Comparison of carbon sequestration efficiency in soil aggregates between upland and paddy soils in a red soil region of China. Journal of Integrative Agriculture 2019, 18, 1348–1359. [Google Scholar] [CrossRef]
- Hanke, A.; Cerli, C.; Muhr, J.; Borken, W.; Kalbitz, K. Redox control on carbon mineralization and dissolved organic matter along a chronosequence of paddy soils. European Journal of Soil Science 2013, 64, 476–487. [Google Scholar] [CrossRef]
- Qiu, H.; Ge, T.; Liu, J.; Chen, X.; Hu, Y.; Wu, J.; Su, Y.; Kuzyakov, Y. Effects of biotic and abiotic factors on soil organic matter mineralization: Experiments and structural modeling analysis. European Journal of Soil Biology 2018, 84, 27–34. [Google Scholar] [CrossRef]
- Li, X.; Zhang, H.; Sun, M.; Xu, N.; Sun, G.; Zhao, M. Land use change from upland to paddy field in Mollisols drives soil aggregation and associated microbial communities. Applied Soil Ecology 2020, 146, 103351. [Google Scholar] [CrossRef]
- Grybos, M.; Davranche, M.; Gruau, G.; Petitjean, P.; Pédrot, M. Increasing pH drives organic matter solubilization from wetland soils under reducing conditions. Geoderma 2009, 154, 13–19. [Google Scholar] [CrossRef]
- Solly, E.F.; Weber, V.; Zimmermann, S.; Walthert, L.; Hagedorn, F.; Schmidt, M.W.I. Is the content and potential preservation of soil organic carbon reflected by cation exchange capacity? A case study in Swiss forest soils. Biogeosciences Discuss. 2019, 2019, 1–32. [Google Scholar] [CrossRef]
- Zhang, M.; He, Z. Long-term changes in organic carbon and nutrients of an Ultisol under rice cropping in southeast China. Geoderma 2004, 118, 167–179. [Google Scholar] [CrossRef]
- Bandyopadhyay, S.; Maiti, S.K. Evaluation of ecological restoration success in mining-degraded lands. Environmental Quality Management 2019, 29, 89–100. [Google Scholar] [CrossRef]
- Igwe, C.A. Clay Dispersion of Selected Aeolian Soils of Northern Nigeria in Relation to Sodicity and Organic Carbon Content. Arid Land Research and Management 2001, 15, 147–155. [Google Scholar] [CrossRef]
- Wong, V.N.L.; Greene, R.S.B.; Dalal, R.C.; Murphy, B.W. Soil carbon dynamics in saline and sodic soils: a review. Soil Use and Management 2010, 26, 2–11. [Google Scholar] [CrossRef]
- Wang, S.; Tang, J.; Li, Z.; Liu, Y.; Zhou, Z.; Wang, J.; Qu, Y.; Dai, Z. Carbon Mineralization under Different Saline—Alkali Stress Conditions in Paddy Fields of Northeast China. Sustainability 2020, 12. [Google Scholar] [CrossRef]
- Feng, W.; Jiang, J.; Lin, L.; Wang, Y. Soil calcium prompts organic carbon accumulation after decadal saline-water irrigation in the Taklamakan desert. Journal of Environmental Management 2023, 344, 118421. [Google Scholar] [CrossRef] [PubMed]
- Rowley, M.C.; Grand, S.; Verrecchia, É.P. Calcium-mediated stabilisation of soil organic carbon. Biogeochemistry 2018, 137, 27–49. [Google Scholar] [CrossRef]
- Pihlap, E.; Steffens, M.; Kögel-Knabner, I. Initial soil aggregate formation and stabilisation in soils developed from calcareous loess. Geoderma 2021, 385, 114854. [Google Scholar] [CrossRef]
- Liao, K.; Wu, S.; Zhu, Q. Can Soil pH Be Used to Help Explain Soil Organic Carbon Stocks? CLEAN – Soil, Air, Water 2016, 44, 1685–1689. [Google Scholar] [CrossRef]
- Gosling, P.; van der Gast, C.; Bending, G.D. Converting highly productive arable cropland in Europe to grassland: –a poor candidate for carbon sequestration. Scientific Reports 2017, 7, 10493. [Google Scholar] [CrossRef]
- Cai, Z. Ammonium transformation in paddy soils affected by the presence of nitrate. Nutrient Cycling in Agroecosystems 2002, 63, 267–274. [Google Scholar] [CrossRef]
- Zhang, J.; Zhu, T.; Cai, Z.; Müller, C. Nitrogen cycling in forest soils across climate gradients in Eastern China. Plant and Soil 2011, 342, 419–432. [Google Scholar] [CrossRef]
- Bertrand, I.; Delfosse, O.; Mary, B. Carbon and Nitrogen Mineralization in Acidic, Limed and Calcareous agricultural soils: Apparent and Actual effects. Soil Biology & Biochemistry - SOIL BIOL BIOCHEM 2007, 39, 276–288. [Google Scholar] [CrossRef]
- Lan, T.; Han, Y.; Roelcke, M.; Nieder, R.; Car, Z. Sources of nitrous and nitric oxides in paddy soils: Nitrification and denitrification. Journal of Environmental Sciences 2014, 26, 581–592. [Google Scholar] [CrossRef] [PubMed]
- Wickramasinghe, K.N.; Rodgers, G.A.; Jenkinson, D.S. Transformations of nitrogen fertilizers in soil. Soil Biology and Biochemistry 1985, 17, 625–630. [Google Scholar] [CrossRef]
- Booth, M.S.; Stark, J.M.; Rastetter, E. CONTROLS ON NITROGEN CYCLING IN TERRESTRIAL ECOSYSTEMS: A SYNTHETIC ANALYSIS OF LITERATURE DATA. Ecological Monographs 2005, 75, 139–157. [Google Scholar] [CrossRef]
- Ali, S.; Liu, K.; Ahmed, W.; Jing, H.; Qaswar, M.; Kofi Anthonio, C.; Maitlo, A.A.; Lu, Z.; Liu, L.; Zhang, H. Nitrogen Mineralization, Soil Microbial Biomass and Extracellular Enzyme Activities Regulated by Long-Term N Fertilizer Inputs: A Comparison Study from Upland and Paddy Soils in a Red Soil Region of China. Agronomy 2021, 11. [Google Scholar] [CrossRef]
- Lim, S.-S.; Kwak, J.-H.; Lee, K.-S.; Chang, S.X.; Yoon, K.-S.; Kim, H.-Y.; Choi, W.-J. Soil and plant nitrogen pools in paddy and upland ecosystems have contrasting δ15N. Biology and Fertility of Soils 2015, 51, 231–239. [Google Scholar] [CrossRef]
- Setia, R.; Rengasamy, P.; Marschner, P. Effect of exchangeable cation concentration on sorption and desorption of dissolved organic carbon in saline soils. Science of The Total Environment 2013, 465, 226–232. [Google Scholar] [CrossRef]
- Rowley, M.C.; Nico, P.S.; Bone, S.E.; Marcus, M.A.; Pegoraro, E.F.; Castanha, C.; Kang, K.; Bhattacharyya, A.; Torn, M.S.; Peña, J. Association between soil organic carbon and calcium in acidic grassland soils from Point Reyes National Seashore, CA. Biogeochemistry 2023, 165, 91–111. [Google Scholar] [CrossRef]
- Minick, K.J.; Fisk, M.C.; Groffman, P.M. Soil Ca alters processes contributing to C and N retention in the Oa/A horizon of a northern hardwood forest. Biogeochemistry 2017, 132, 343–357. [Google Scholar] [CrossRef]
- Zhao, L.Y.L.; Schulin, R.; Nowack, B. Cu and Zn mobilization in soil columns percolated by different irrigation solutions. Environmental Pollution 2009, 157, 823–833. [Google Scholar] [CrossRef] [PubMed]
- Li, M.; Wang, J.; Guo, D.; Yang, R.; Fu, H. Effect of land management practices on the concentration of dissolved organic matter in soil: A meta-analysis. Geoderma 2019, 344, 74–81. [Google Scholar] [CrossRef]
- McDonald, G.K.; Tavakkoli, E.; Cozzolino, D.; Banas, K.; Derrien, M.; Rengasamy, P. A survey of total and dissolved organic carbon in alkaline soils of southern Australia. Soil Research 2017, 55, 617–629. [Google Scholar] [CrossRef]
- Kerr, J.G.; Eimers, M.C. Decreasing soil water Ca2+ reduces DOC adsorption in mineral soils: Implications for long-term DOC trends in an upland forested catchment in southern Ontario, Canada. Science of The Total Environment 2012, 427-428, 298–307. [Google Scholar] [CrossRef] [PubMed]
- Sapek, B. Relationship between dissolved organic carbon and calcium and magnesium in soil water phase and their uptake by meadow vegetation / Zależność miedzy rozpuszczalnym węglem organicznym (RWO) w fazie wodnej gleby a stężeniem w niej wapnia i magnezu oraz ich pobraniem z plonem roślinności łąkowej. Journal of Water and Land Development 2013, 19. [Google Scholar] [CrossRef]
- Mooshammer, M.; Wanek, W.; Hämmerle, I.; Fuchslueger, L.; Hofhansl, F.; Knoltsch, A.; Schnecker, J.; Takriti, M.; Watzka, M.; Wild, B.; et al. Adjustment of microbial nitrogen use efficiency to carbon:nitrogen imbalances regulates soil nitrogen cycling. Nature Communications 2014, 5, 3694. [Google Scholar] [CrossRef] [PubMed]
- Aye, N.S.; Butterly, C.R.; Sale, P.W.G.; Tang, C. Interactive effects of initial pH and nitrogen status on soil organic carbon priming by glucose and lignocellulose. Soil Biology and Biochemistry 2018, 123, 33–44. [Google Scholar] [CrossRef]
- Wei, X.; Li, X.; Jia, X.; Shao, M. Accumulation of soil organic carbon in aggregates after afforestation on abandoned farmland. Biology and Fertility of Soils 2013, 49, 637–646. [Google Scholar] [CrossRef]
- Tian, Q.; Yang, X.; Wang, X.; Liao, C.; Li, Q.; Wang, M.; Wu, Y.; Liu, F. Microbial community mediated response of organic carbon mineralization to labile carbon and nitrogen addition in topsoil and subsoil. Biogeochemistry 2016, 128, 125–139. [Google Scholar] [CrossRef]
- Whitman, T.; DeCiucies, S.; Hanley, K.; Enders, A.; Woolet, J.; Lehmann, J. Microbial Community Shifts Reflect Losses of Native Soil Carbon with Pyrogenic and Fresh Organic Matter Additions and Are Greatest in Low-Carbon Soils. Applied and Environmental Microbiology 2021, 87, e02555–02520. [Google Scholar] [CrossRef] [PubMed]
Figure 1.
The representative sampling site of maize (as upland soil) and paddy plantations and the topography of the study site.
Figure 1.
The representative sampling site of maize (as upland soil) and paddy plantations and the topography of the study site.
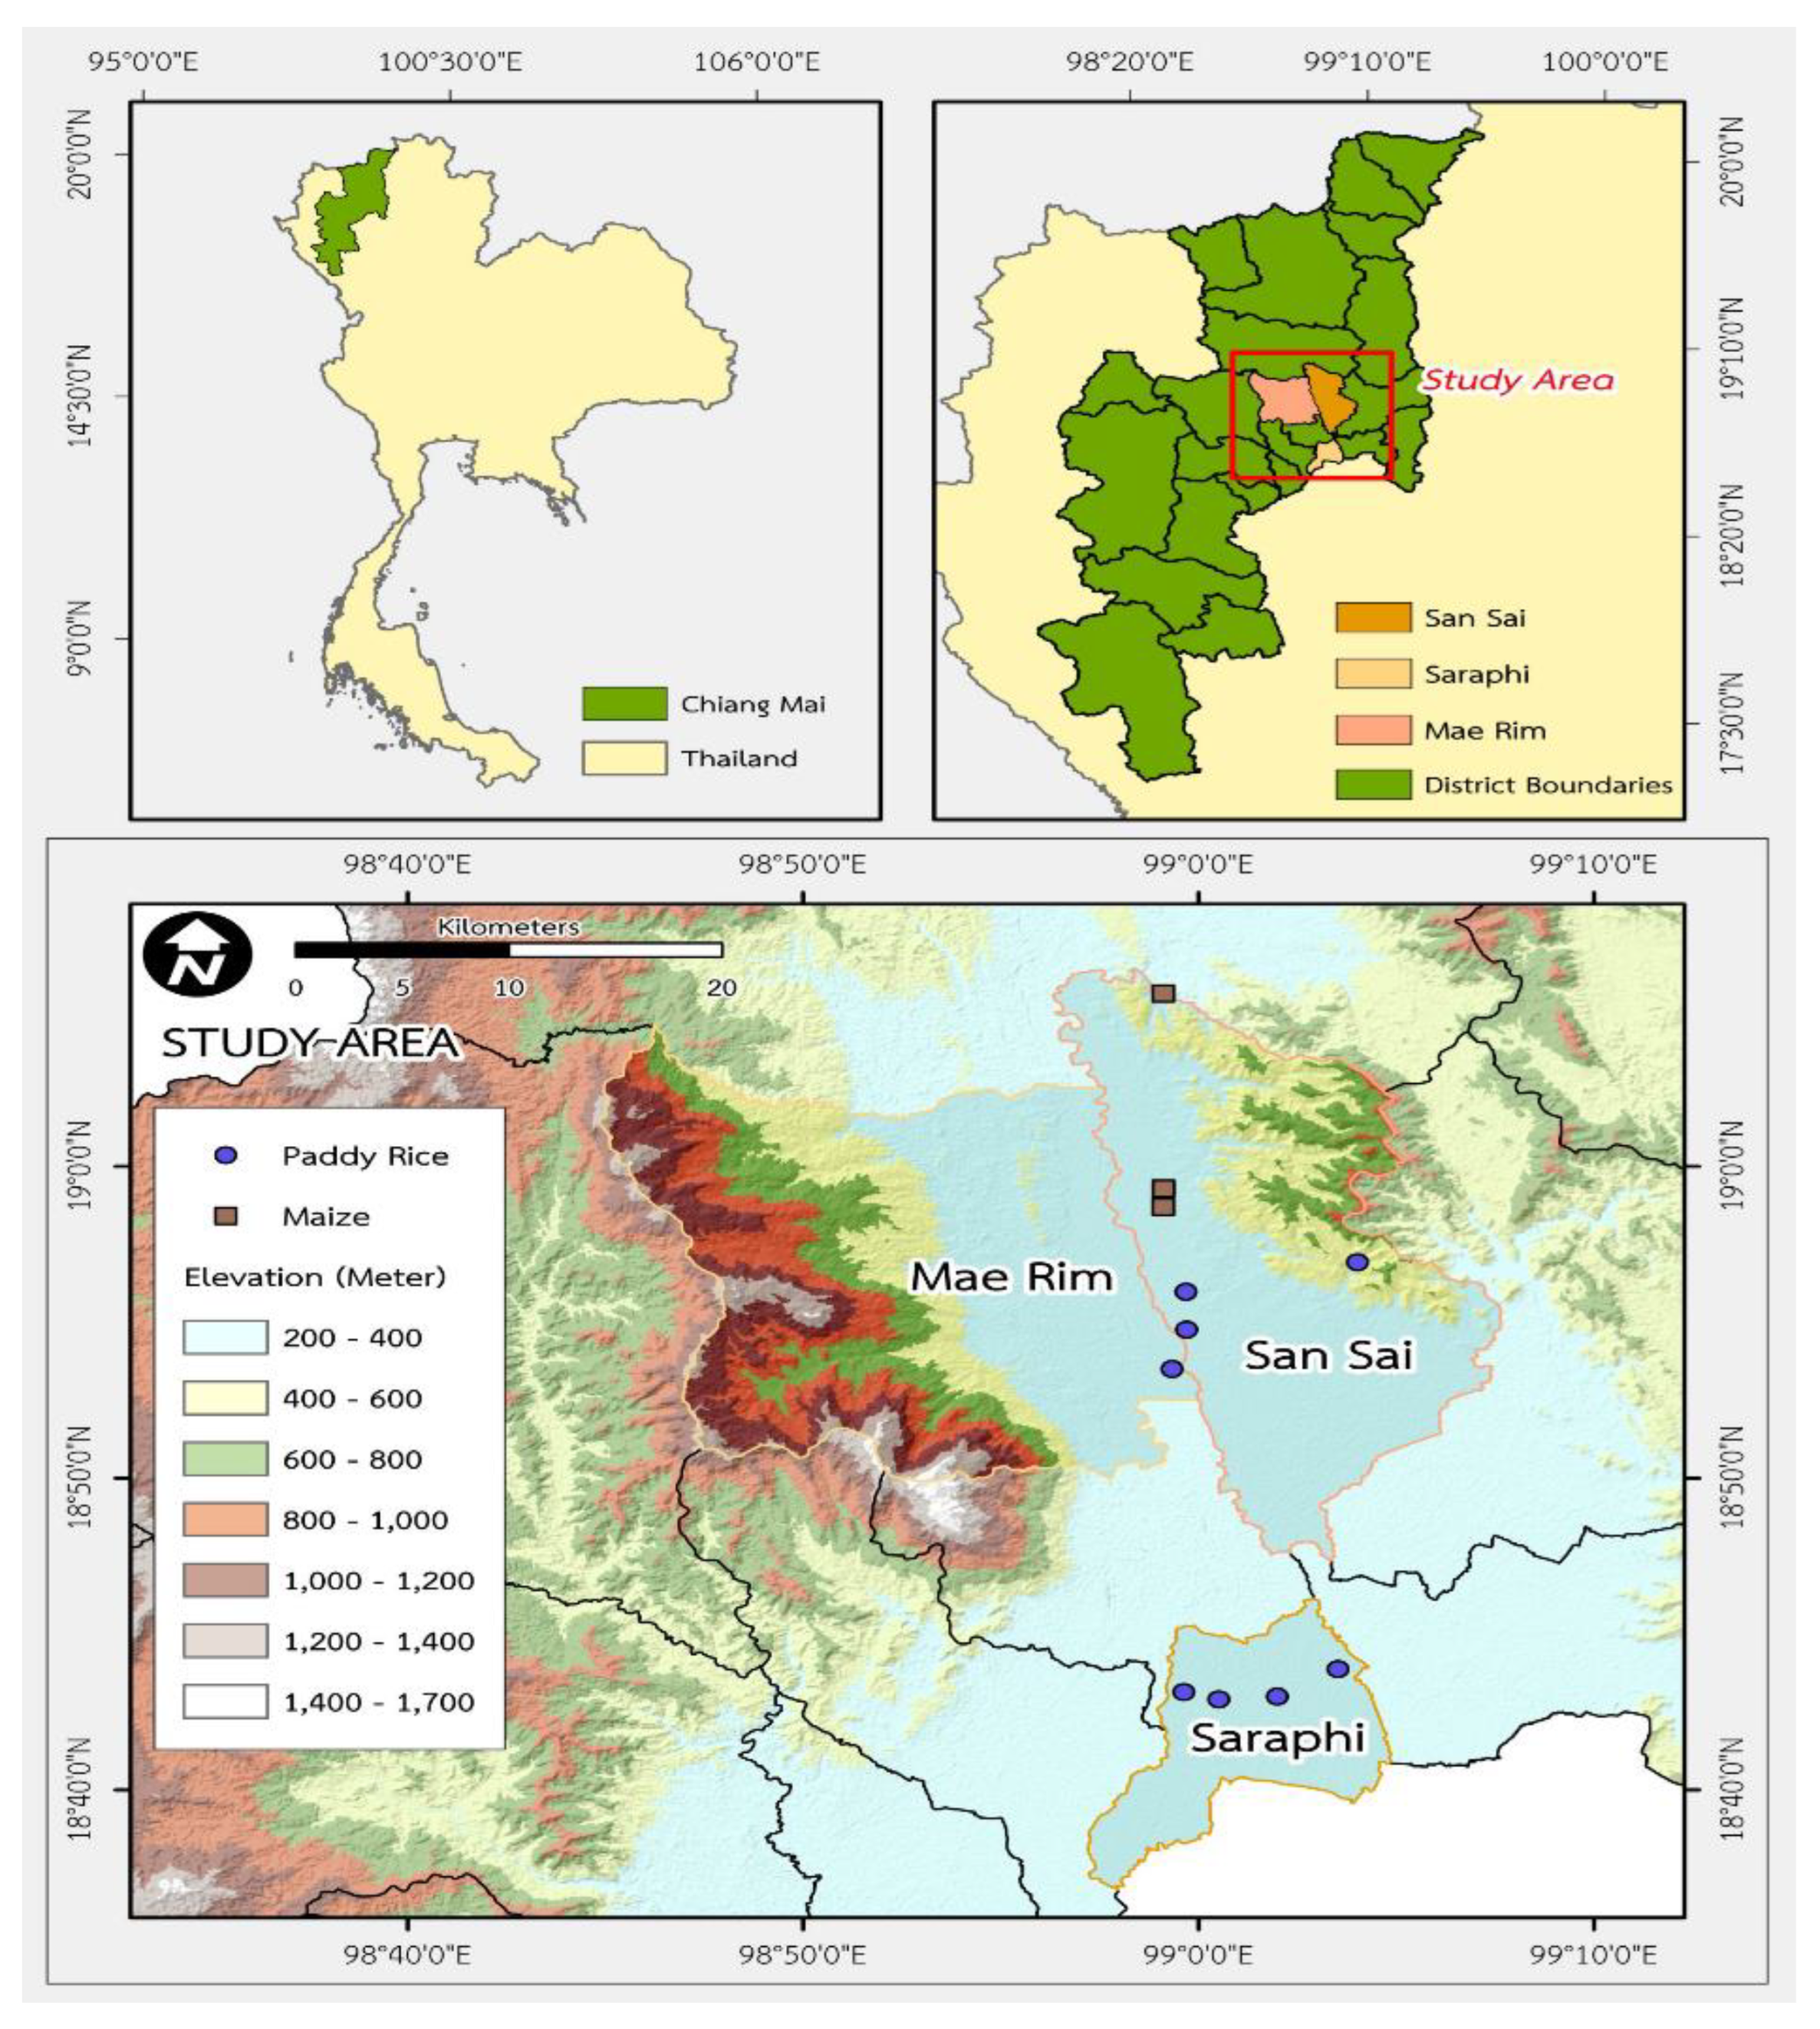
Figure 2.
The representative soil sample of maize and paddy soils used in this study.
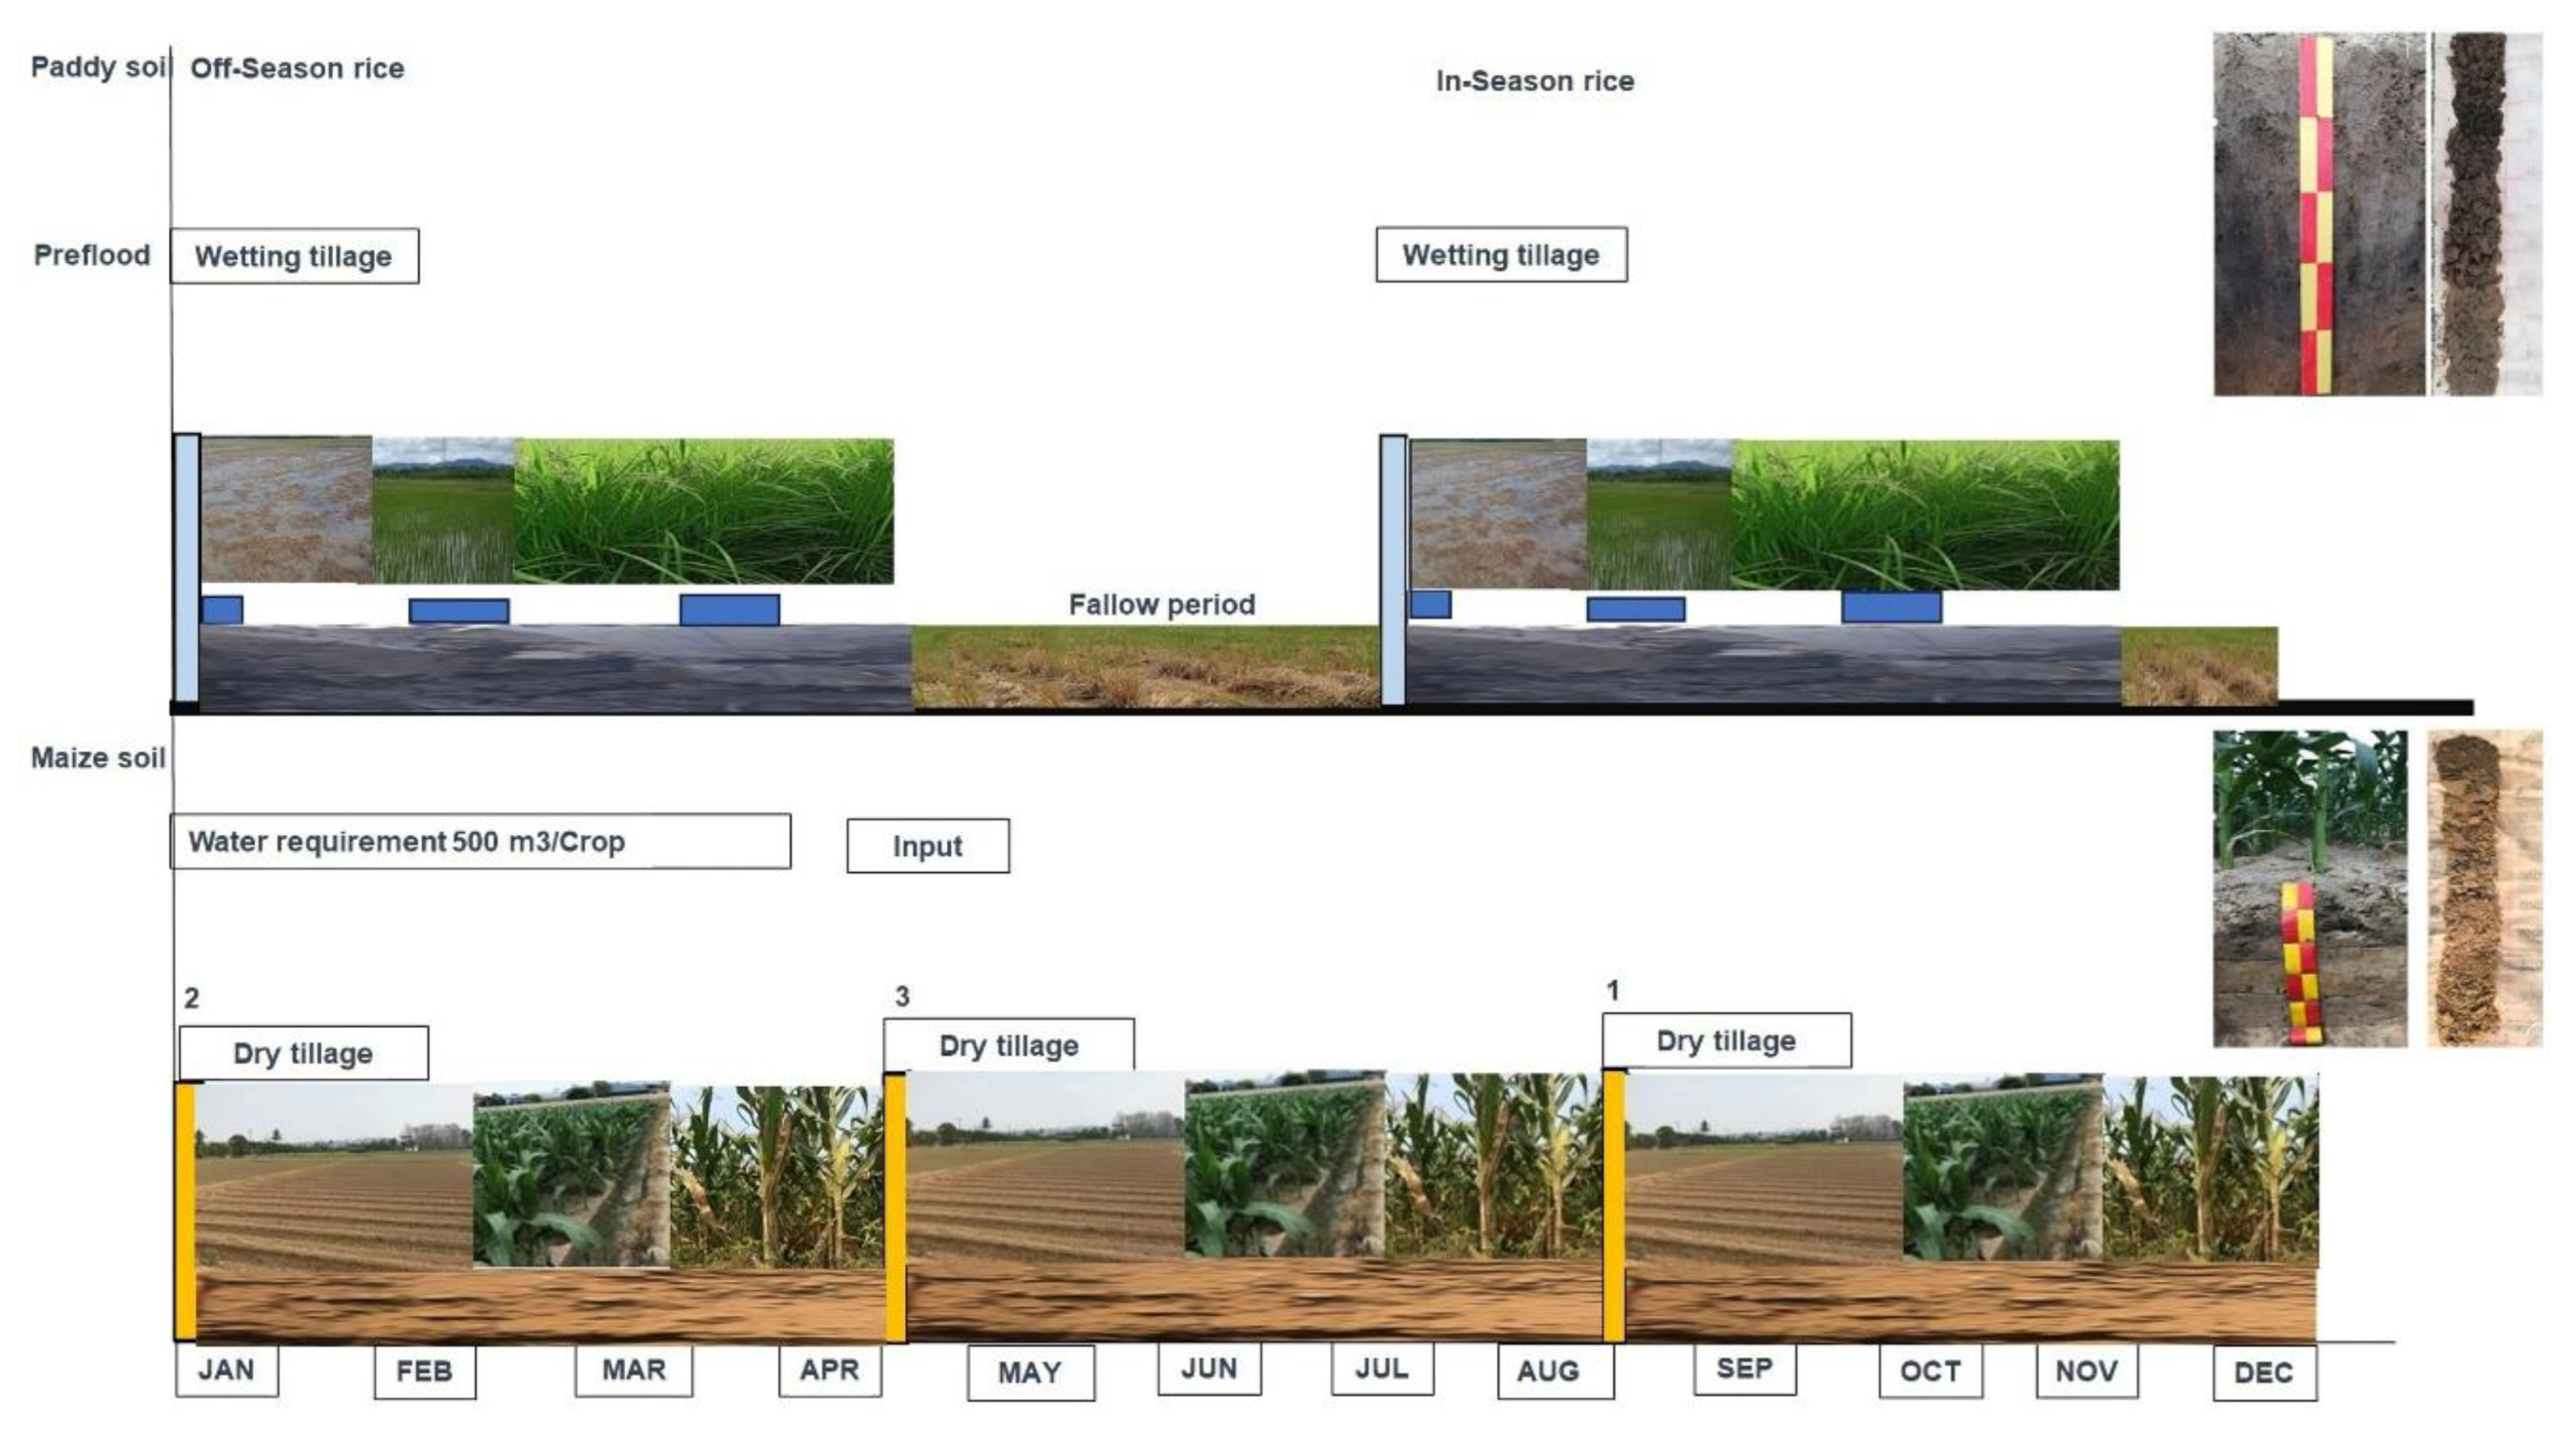
Figure 3.
The SOC (a) and DOC (b) of paddy and maize soils. *P <0.05. The bars represent the standard error of the mean (SEM). Black bars, paddy soil; Red bar, maize soil.
Figure 3.
The SOC (a) and DOC (b) of paddy and maize soils. *P <0.05. The bars represent the standard error of the mean (SEM). Black bars, paddy soil; Red bar, maize soil.
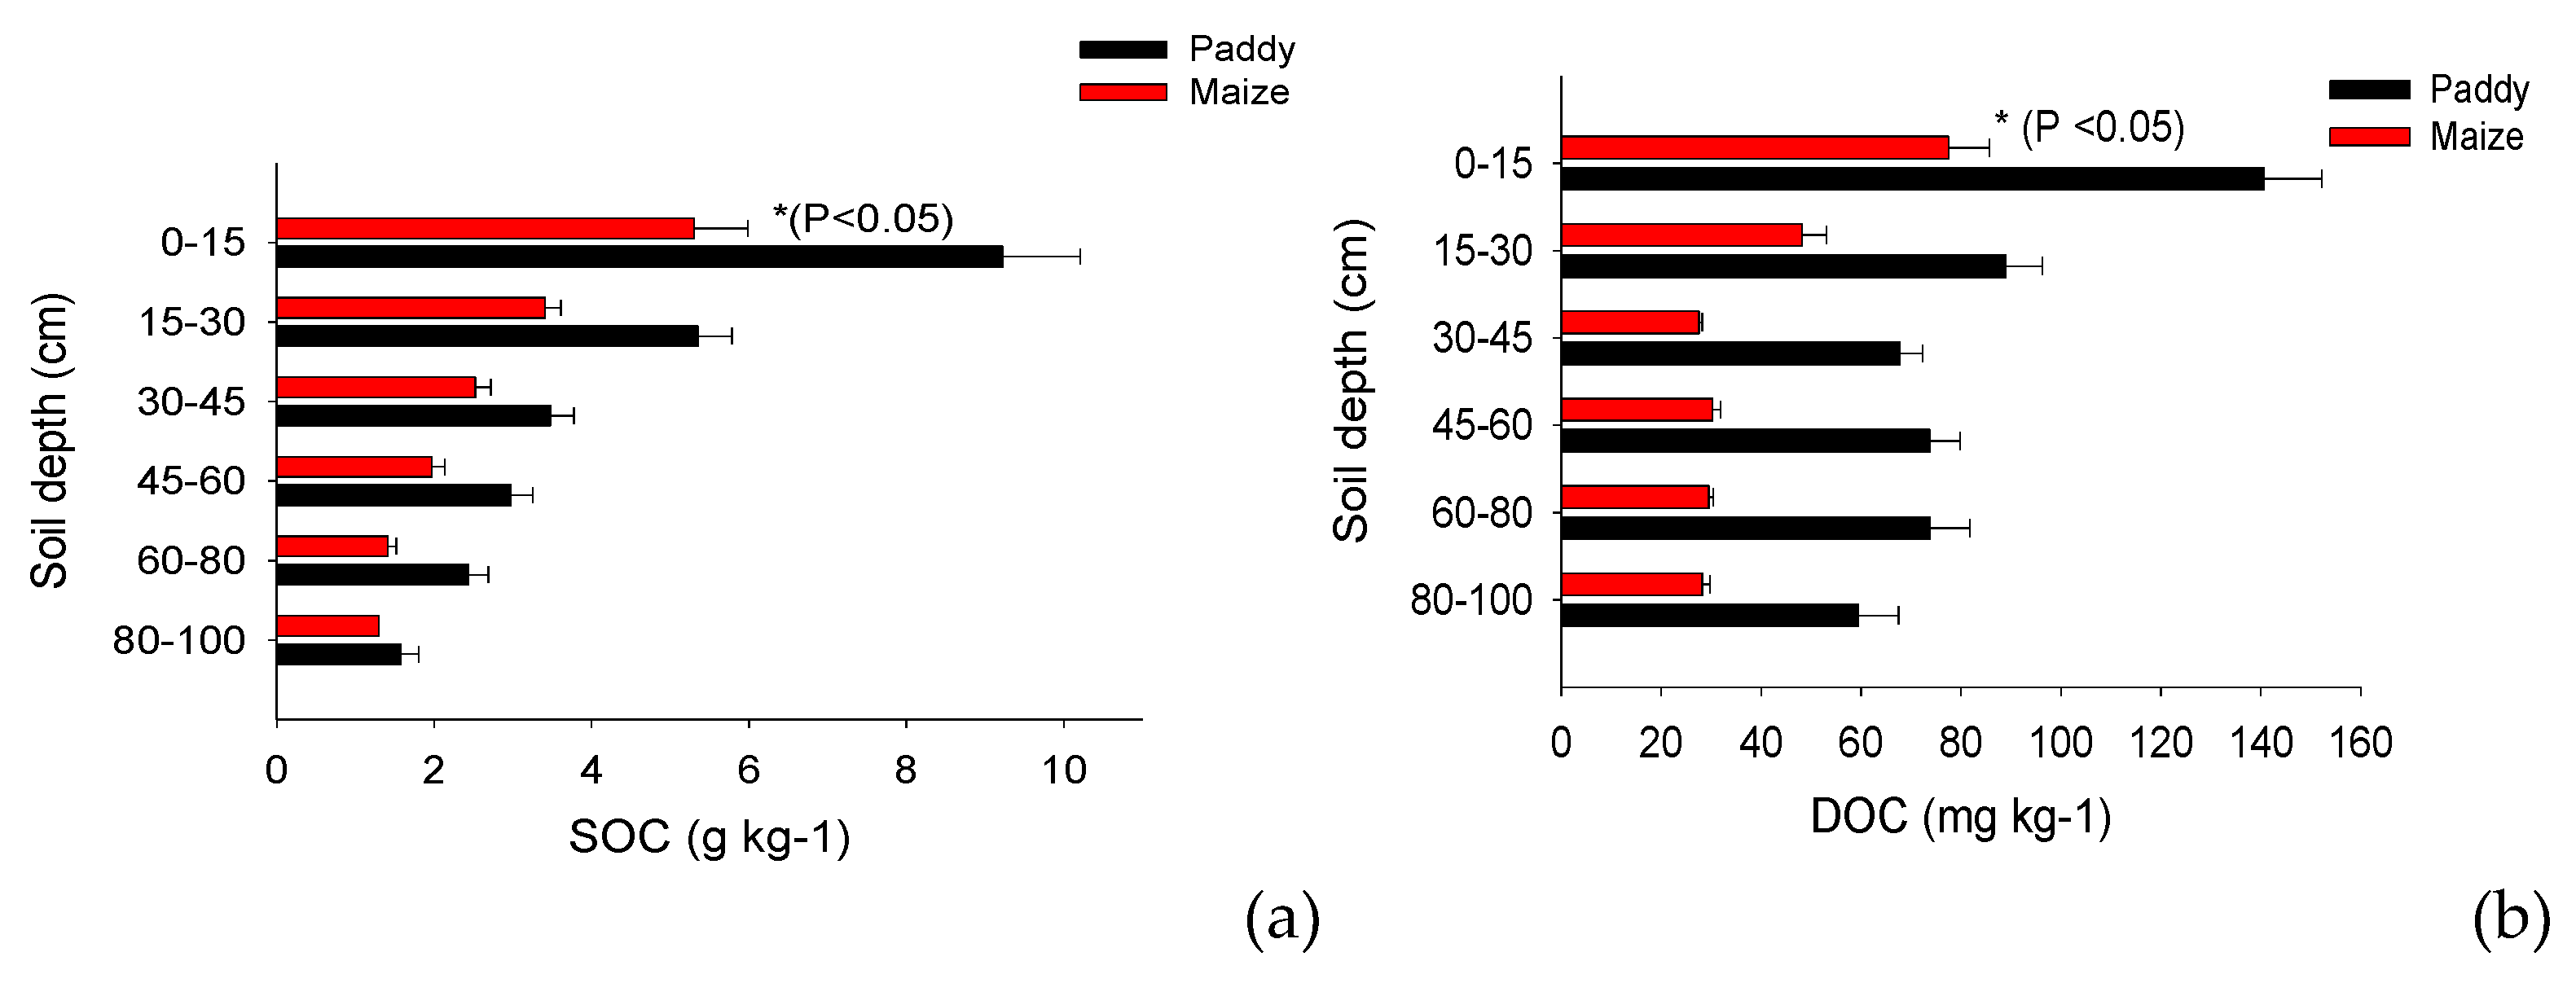
Figure 4.
Principal covariances analysis of DOC as the labile carbon fractions and SOC from paddy and maize soils. SOC, soil organic carbon; POXC, permanganate-oxidisable carbon; WSC, water-soluble carbon; and HWSC, hot water-soluble carbon. Blue dots, maize soil; pink dots, paddy soil.
Figure 4.
Principal covariances analysis of DOC as the labile carbon fractions and SOC from paddy and maize soils. SOC, soil organic carbon; POXC, permanganate-oxidisable carbon; WSC, water-soluble carbon; and HWSC, hot water-soluble carbon. Blue dots, maize soil; pink dots, paddy soil.
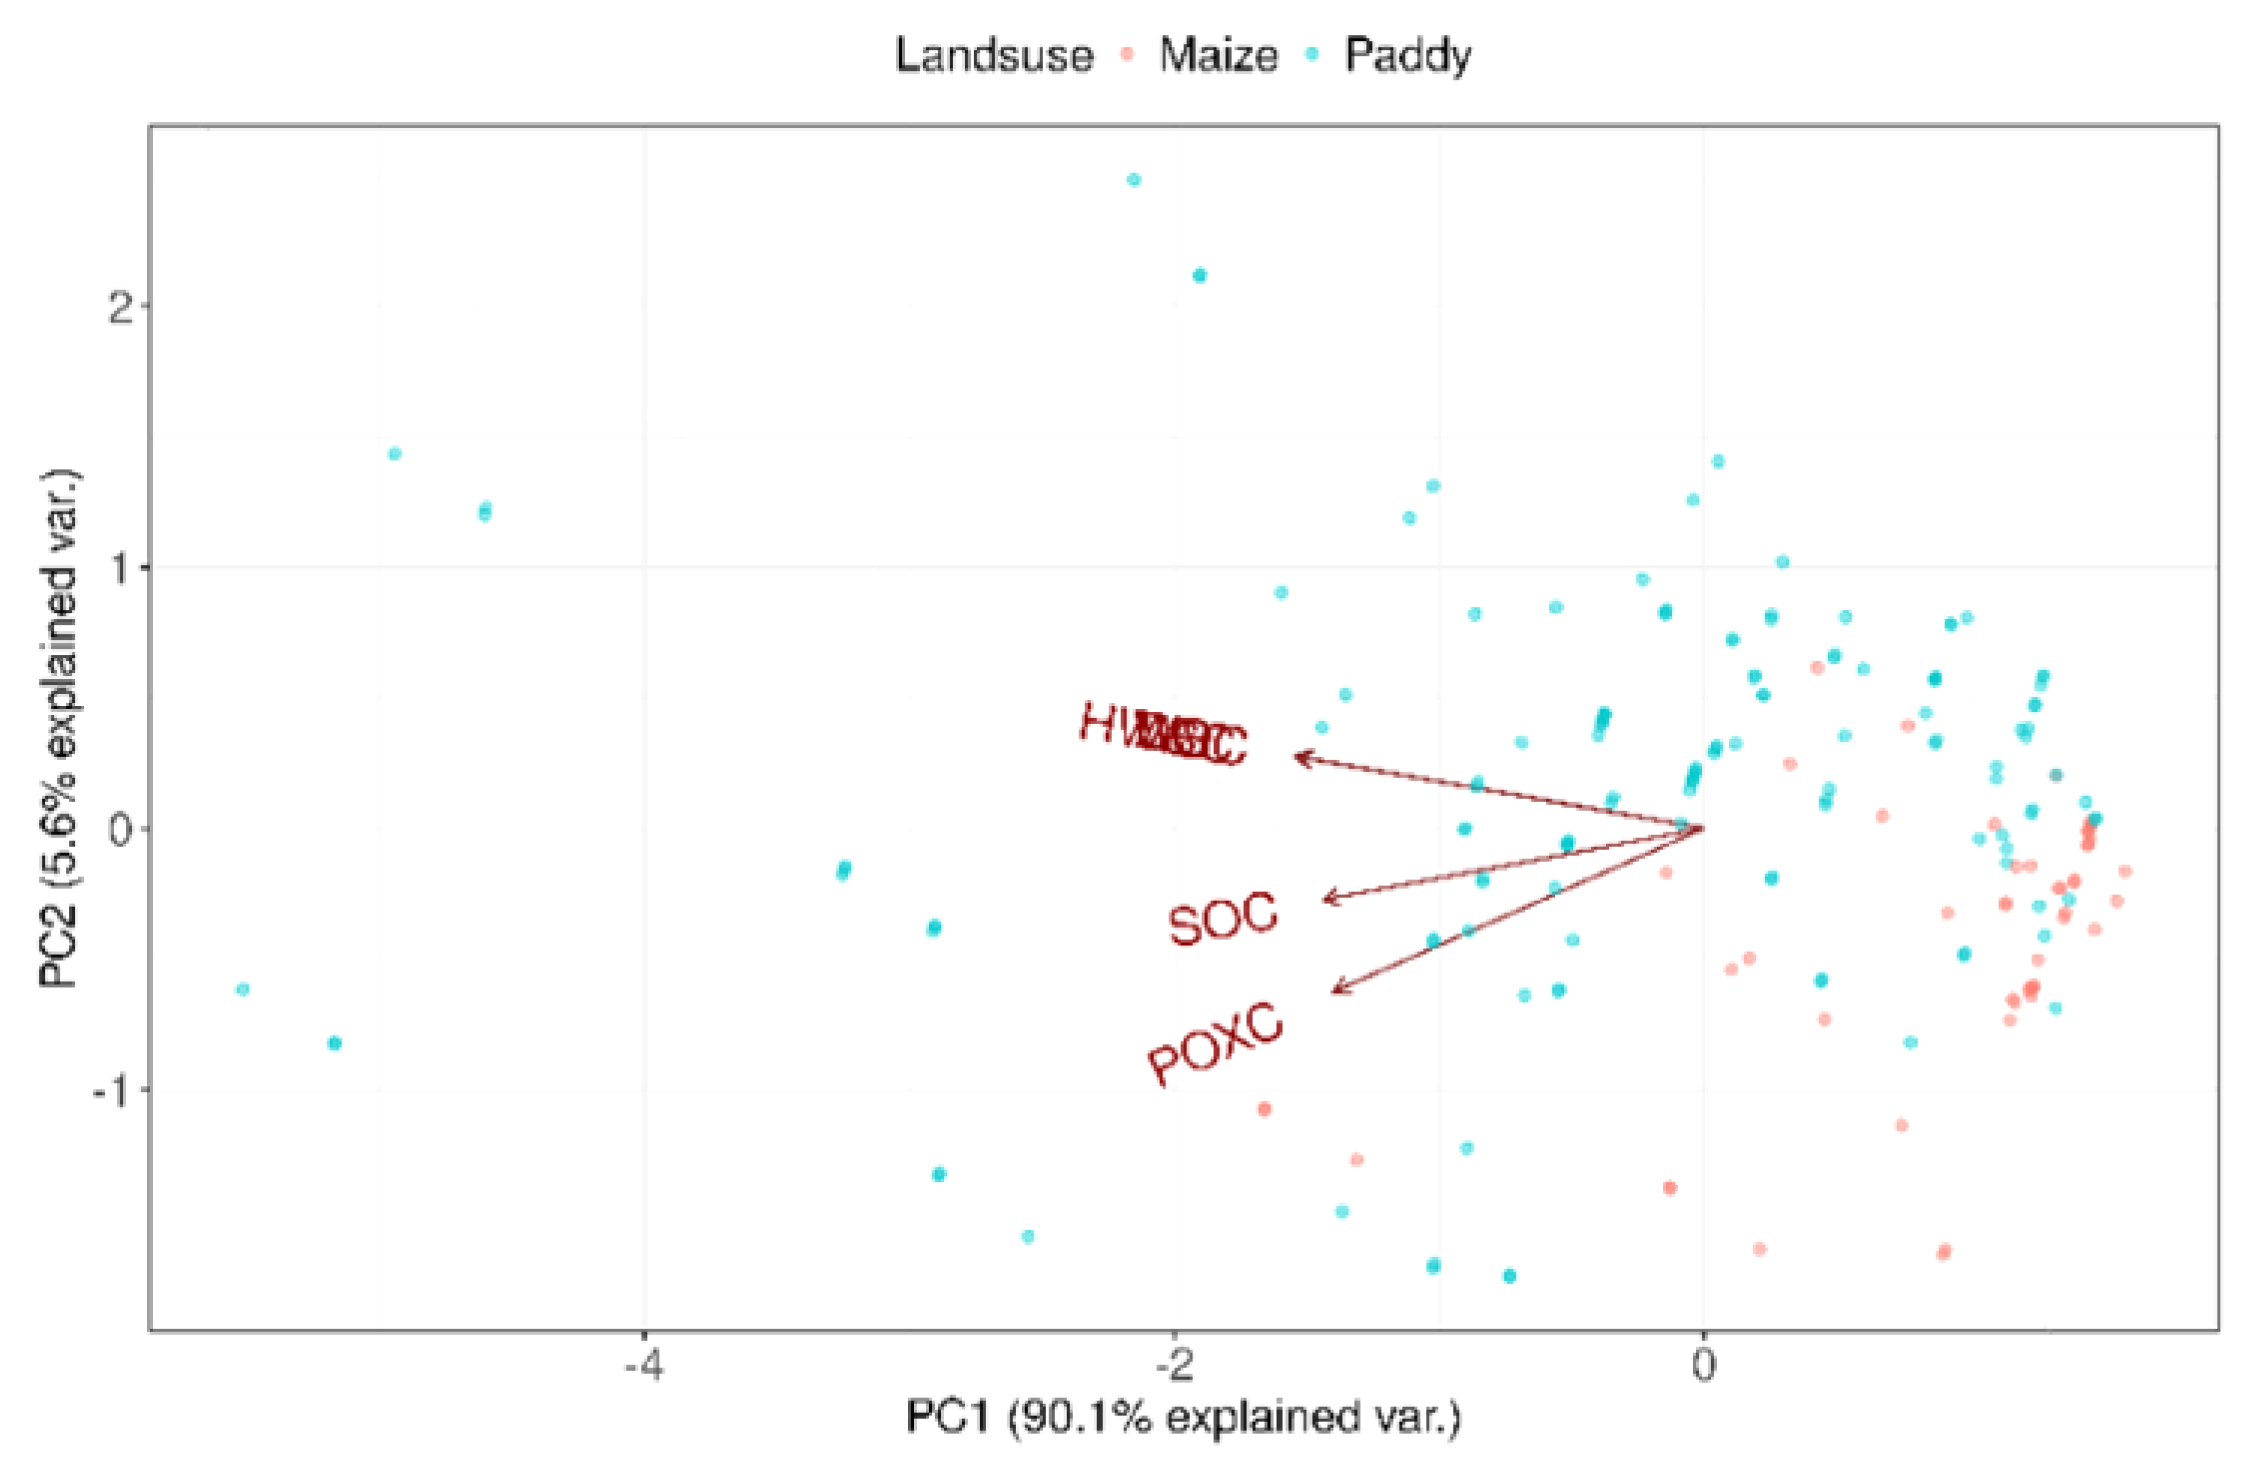
Figure 5.
The heat map of the correlation coefficient between the availability of nutrients and SOC level. Paddy soil (a) and maize soil (b). Note: pH= soil:water (1:1); Available P by Bray II (mg kg-1); K+, Na+, Ca2+, and Mg2+ = Exchange K+, Na+, Ca2+, and Mg2+, respectively; CEC by pH 7 NH4AOc, NH4+-N = NH4+; N (mg kg-1) by K2SO4 solution measured at 660 nm; NO3 = NO3-N (mg kg-1) by 2.0 N KCl solution, and measured at 520 nm; * P < 0.05; ** P < 0.01; *** P < 0.001.
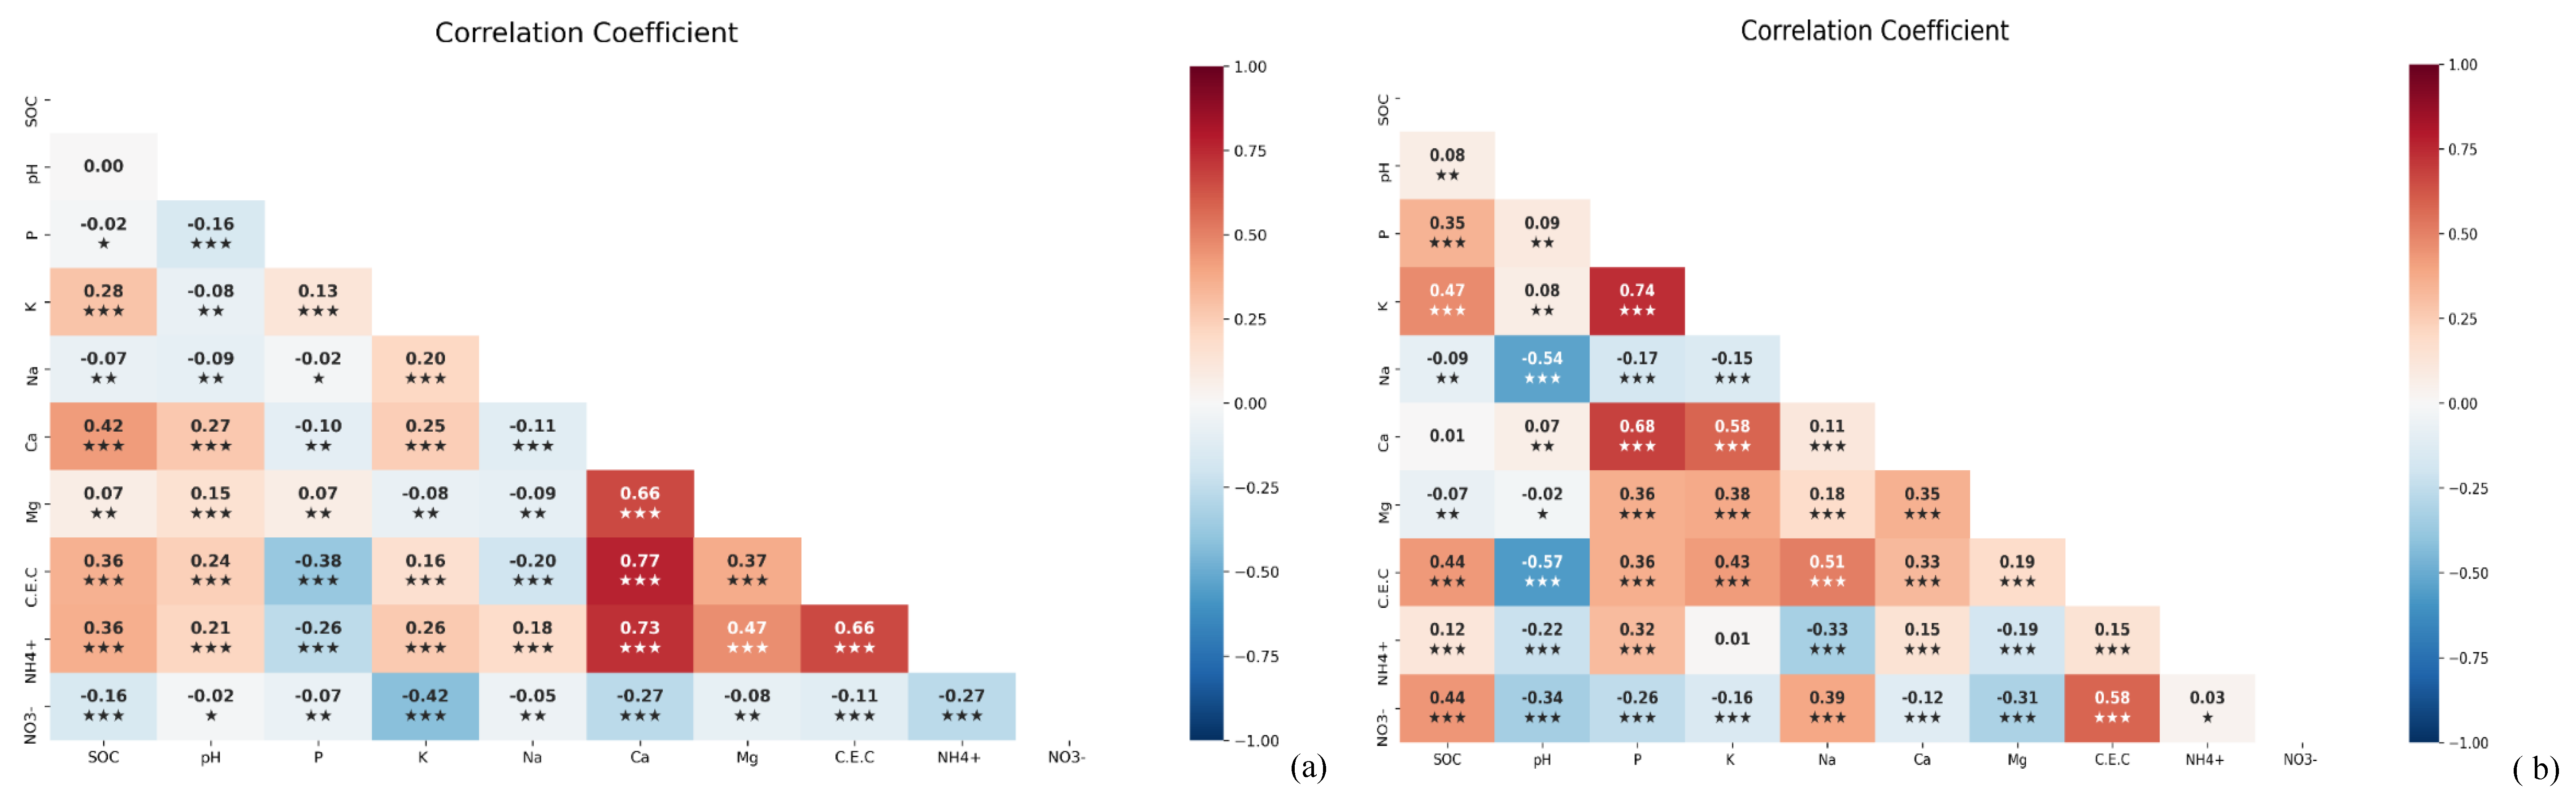
Figure 6.
The distribution of DOC:nutrient availability ratio of paddy and maize soils across soil depths. Note: *P < 0.05. DOC:P = DOC (mg kg-1)/available P by Bray II (mg kg-1; DOC:NO3- = DOC (mg kg-1)/NO3-N (mg kg-1); DOC:NH4+ = DOC (mg kg-1)/NH4+ N (mg kg-1); P/NH4 = P by Bray II (mg kg-1)/NH4 (mg kg-1); DOC:Ca2+ = DOC (mg kg-1)/exchange Ca 2+ (mg kg-1); DOC:Mg2+ = DOC (mg kg-1)/exchange Mg2+ (mg kg-1); DOC:SOC = DOC (mg kg-1)/SOC (mg kg-1). DOC, dissolved organic carbon; SOC, soil organic carbon.
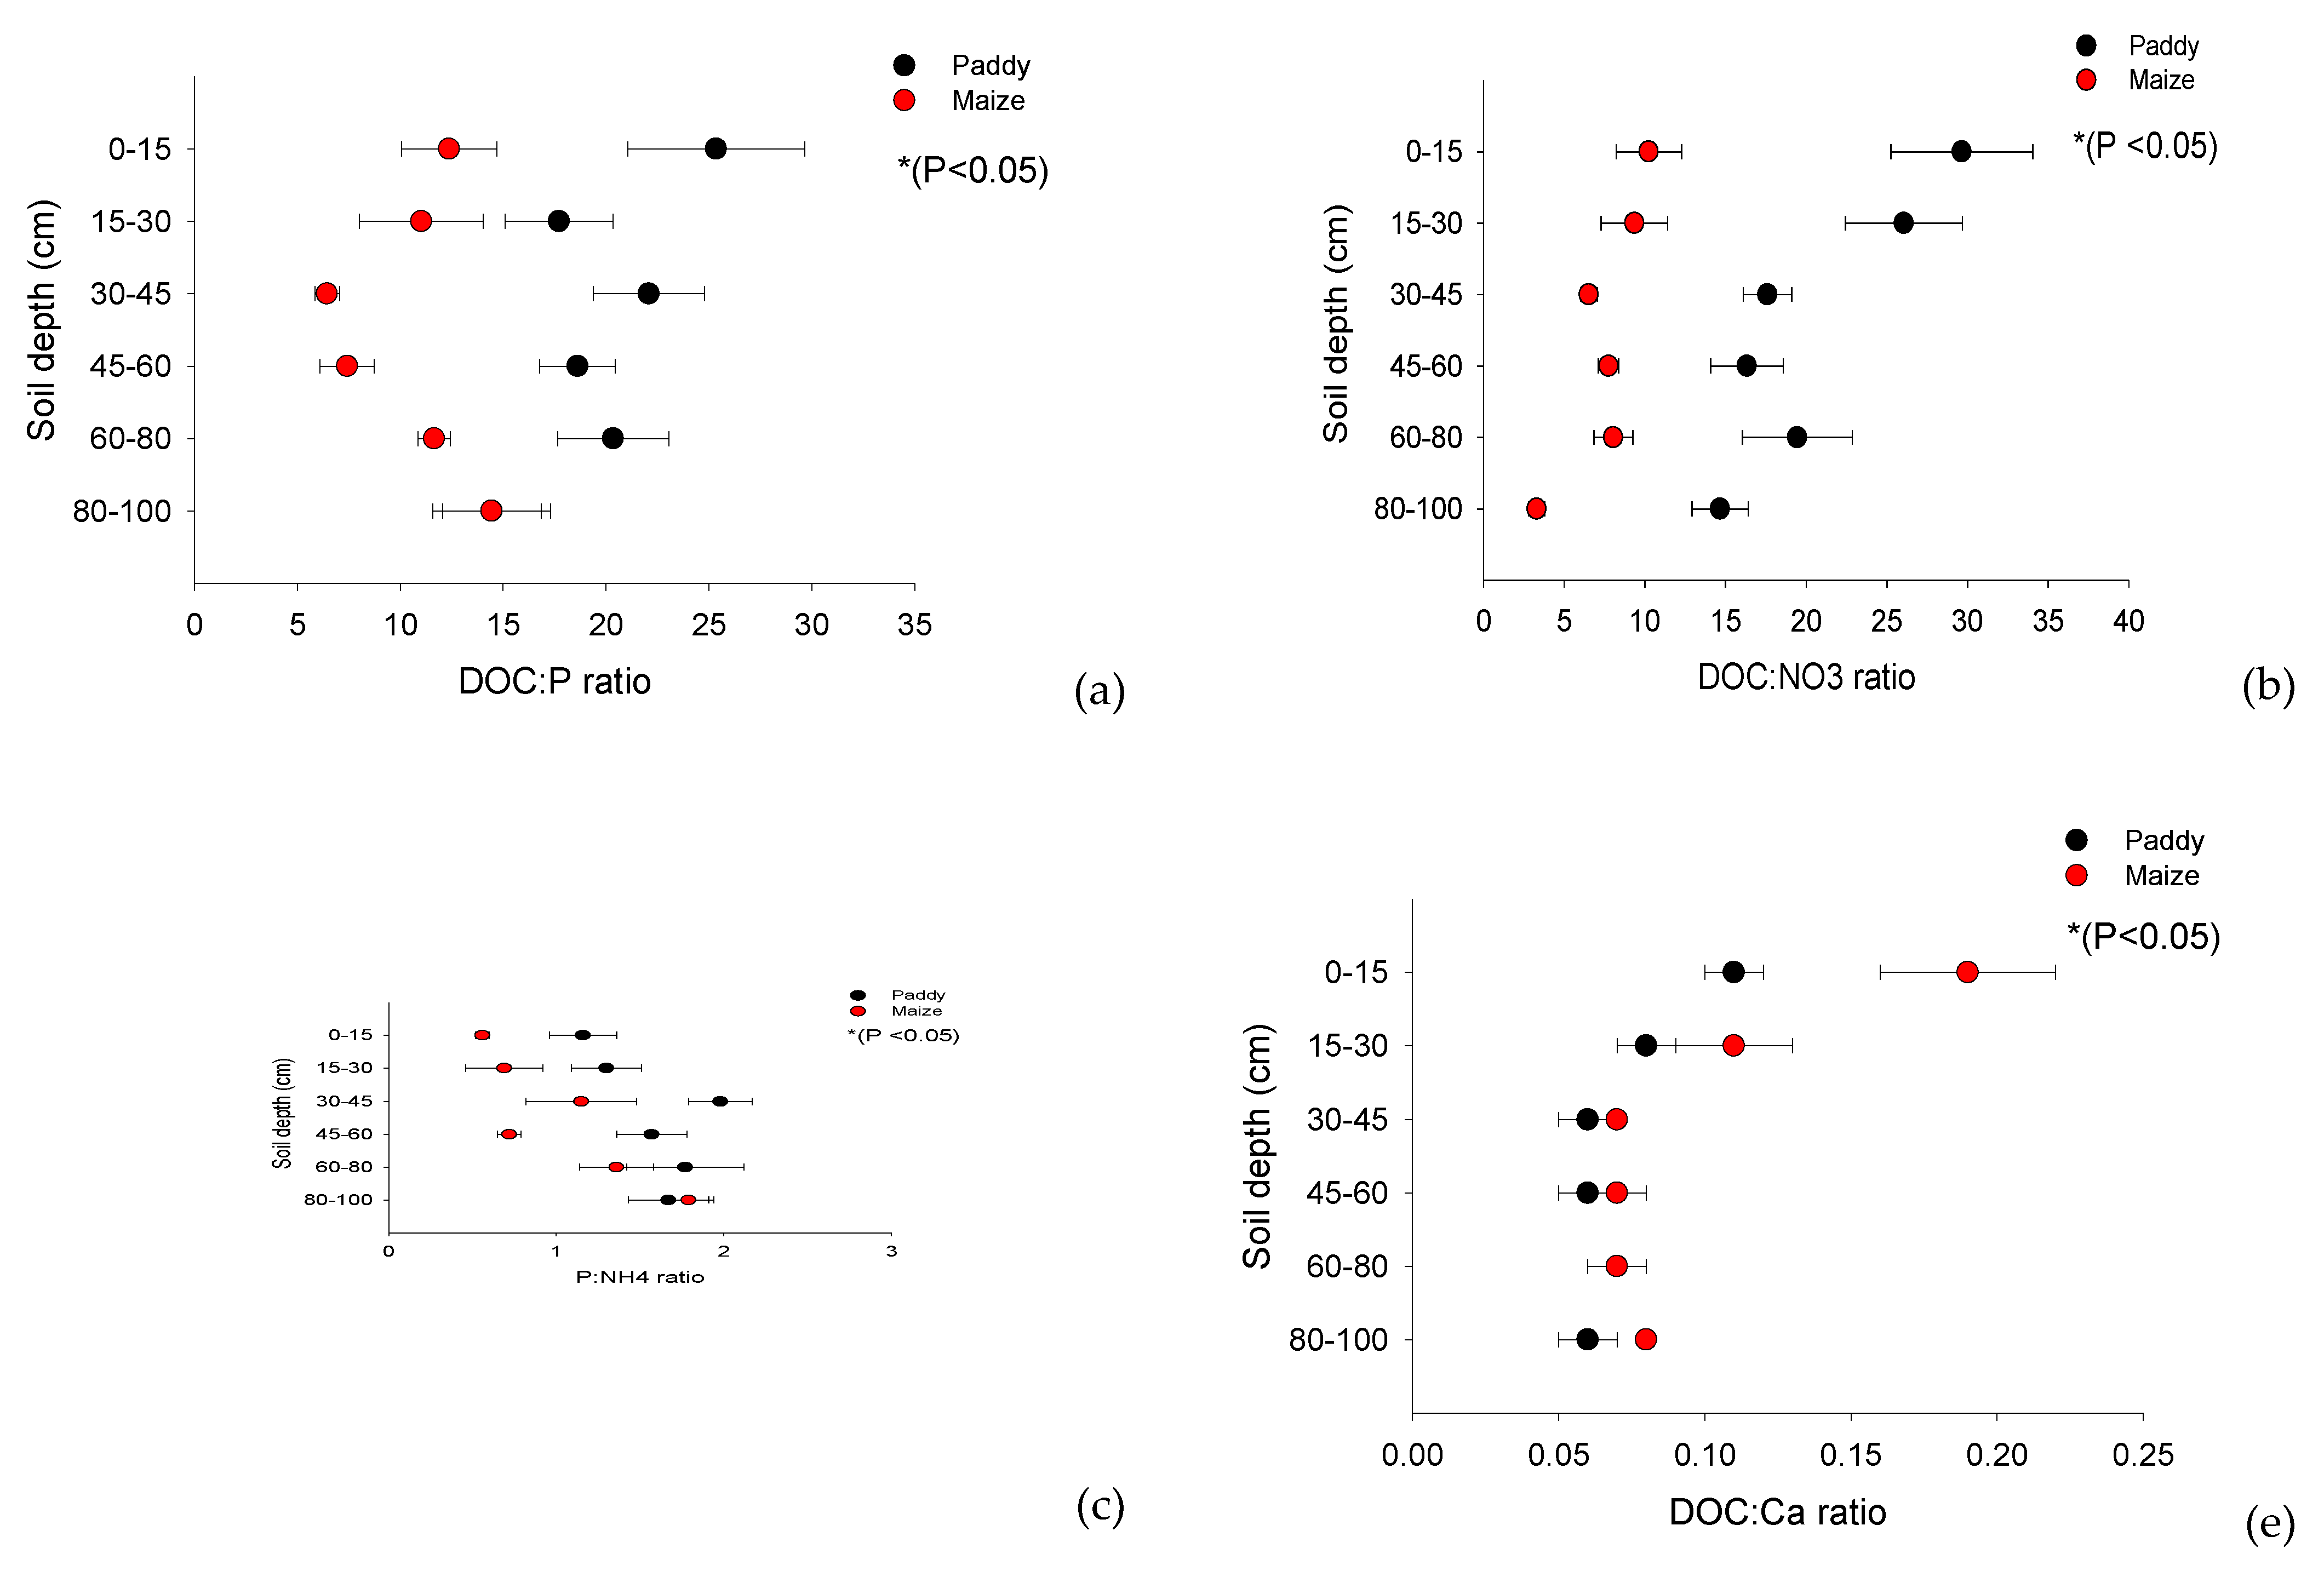
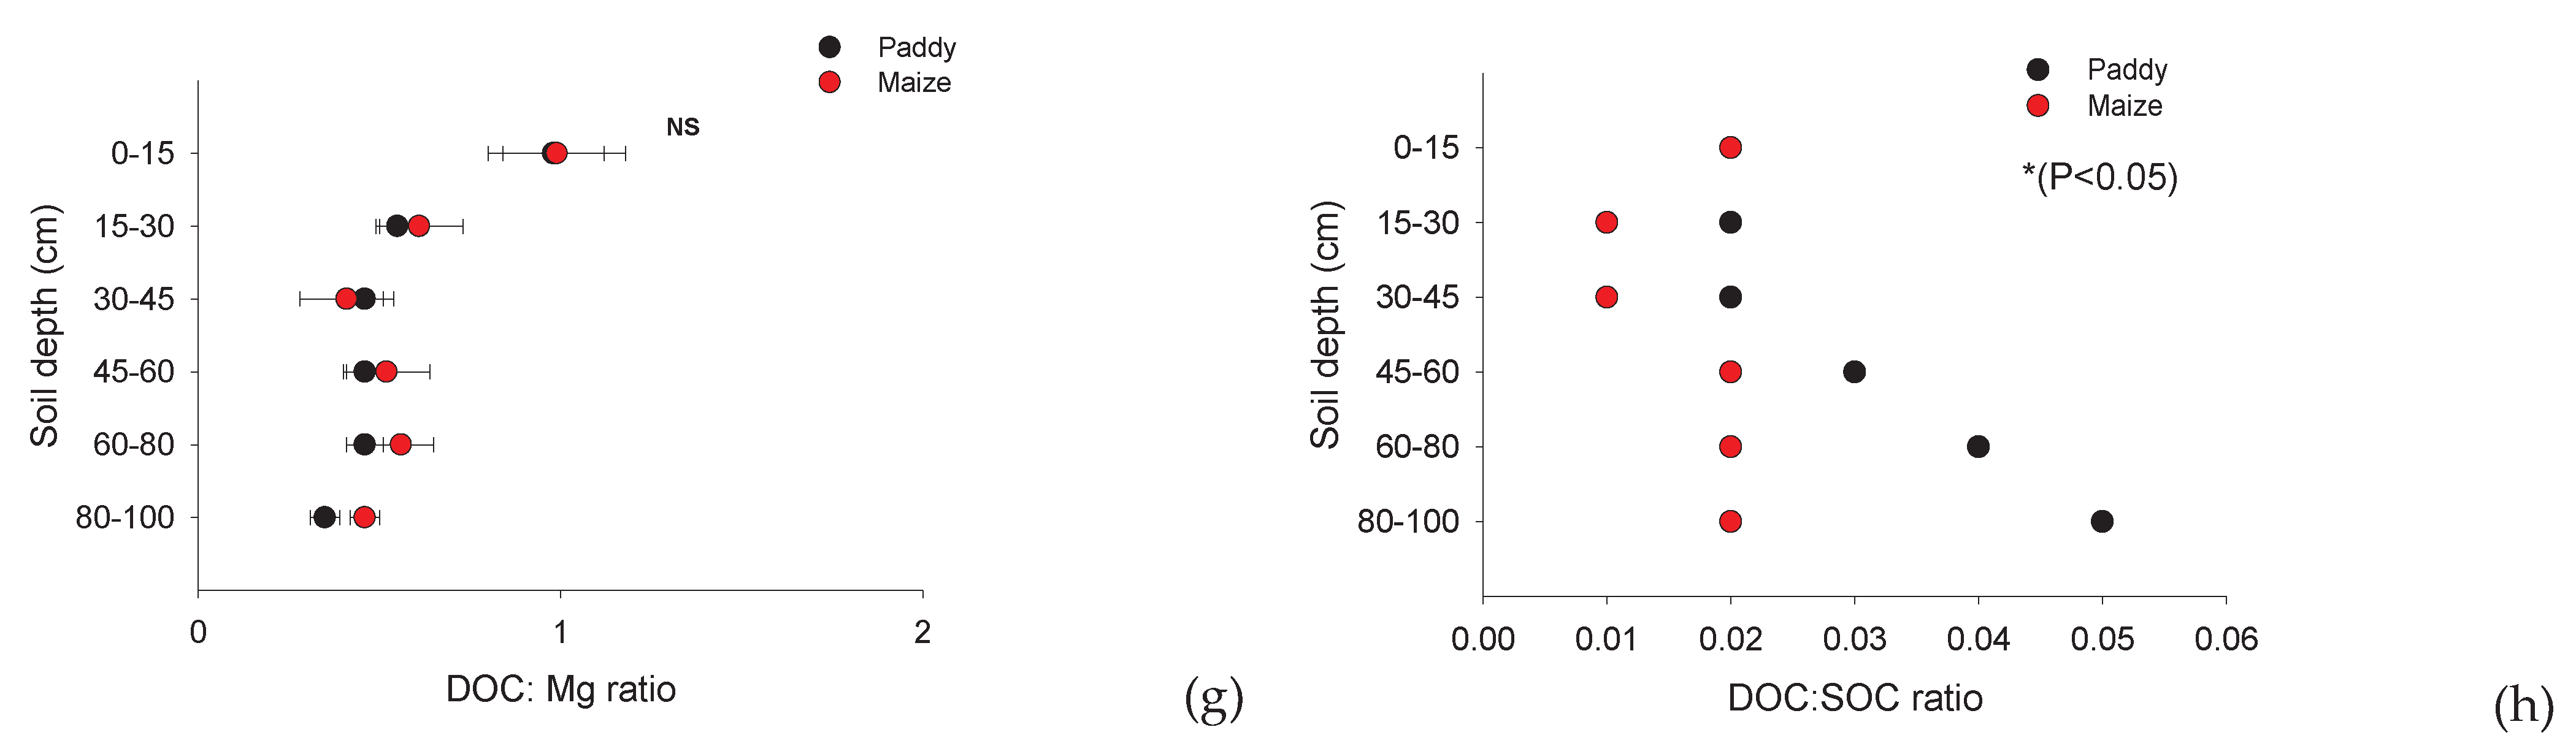
Figure 7.
The heat map of correlation coefficient (r) between DOC: nutrients ratio and SOC level. Paddy soil (a) and maize soil (b). DOC:P = DOC (mg kg-1)/available P by Bray II (mg kg-1; DOC:NO3- = DOC (mg kg-1)/NO3-N (mg kg-1); DOC:NH4+ = DOC (mg kg-1)/NH4+ N (mg kg-1); P/NH4 = P by Bray II (mg kg-1)/NH4 (mg kg-1); DOC:Ca2+ = DOC (mg kg-1)/exchange Ca 2+ (mg kg-1); DOC:Mg2+ = DOC (mg kg-1)/exchange Mg2+ (mg kg-1); DOC:SOC = DOC (mg kg-1)/SOC (mg kg-1). DOC, dissolved organic carbon; SOC, soil organic carbon; *P < 0.05; **P < 0.01; ***P < 0.001.
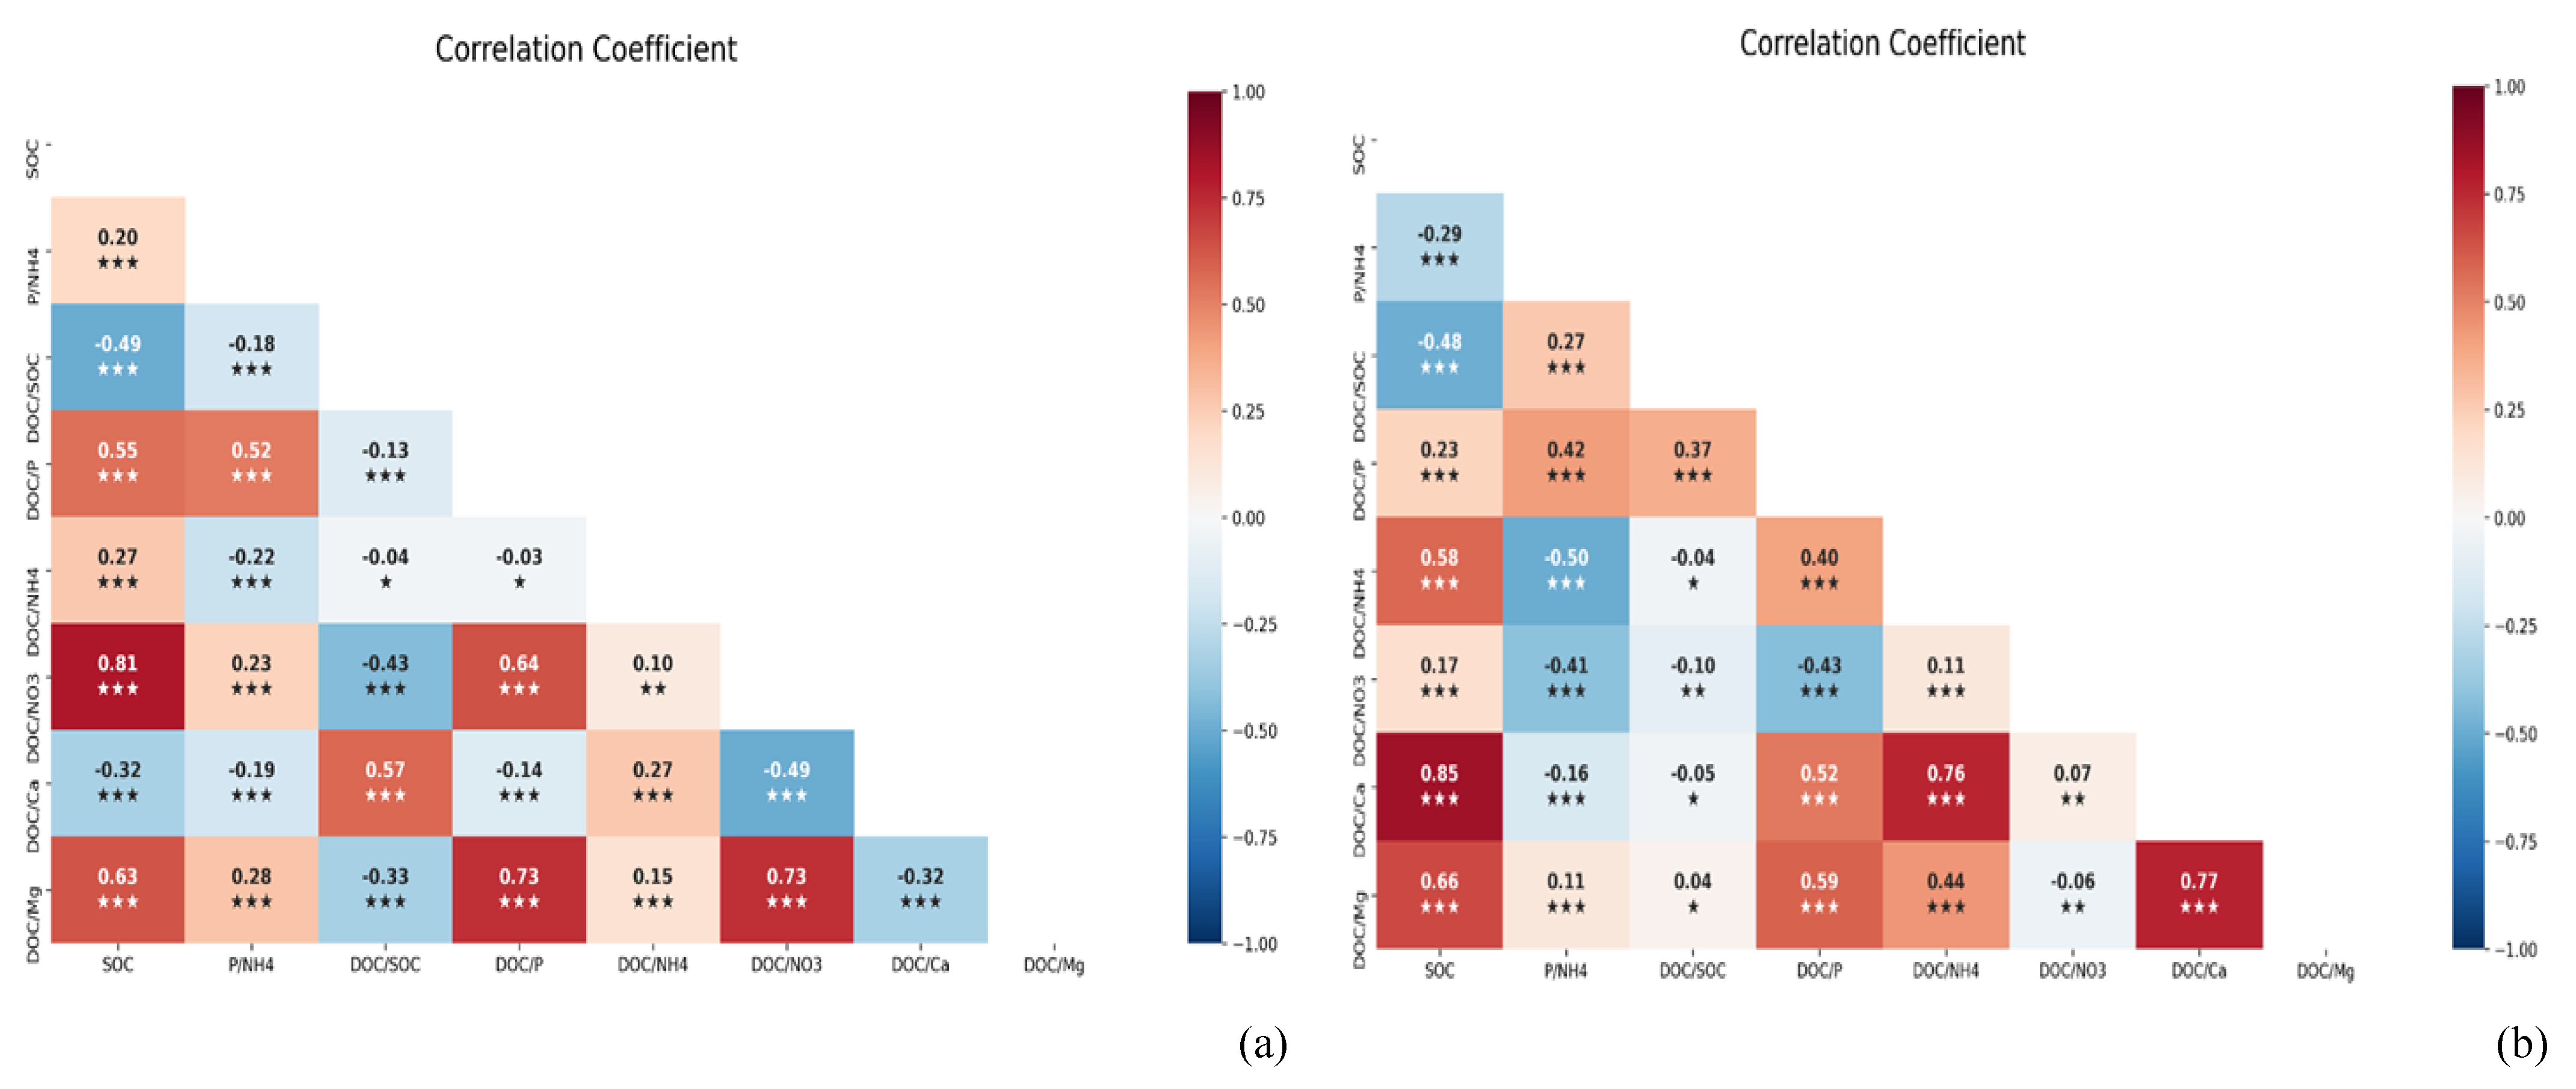

Table 1.
Comparing the soil management between paddy soil and maize soil used in this study.
| Soil management | paddy soil | maize soil |
| Number of sites (n) | 8 | 3 |
| Geophysical of landscape (elevation) | Lowland (200-400 ASL) | Lowland (200-400 ASL) |
| Age (year) | 20 | 20 |
| Tillage intensity | Wetting tillage and puddled | Dry tillage and bedding |
| Irrigation | Rainfed and waterlog/paddy soil/wet and dry | Rainfed/upland condition |
| Planting intensity(time year) | 1-2 time year-1 | 3 time year-1 |
| Mineral fertilisation | mean (size) #,min- max (size) # | mean (size),min-max (size) |
| N (Kg ha -1year-1) | 61 (Low), 23-96 (Low) | 104 (Intermediate),70-137, (Intermediate) |
| P2O5 (Kg ha-1 year-1) | 27 (Intermediate), 0-56 (Low to Intermediate) | 39 (Intermediate), 0-62, (Low- Intermediate) |
| K2O (Kg ha-1 year-1) | 9 (Low), 0-26 (Low) | 18.3 (Low), 0-50 (Low) |
| N:P:K (size) # | Low: Intermediate: Low | Intermediate: Intermediate: Low |
| Crop residues management | Leave root and straw residues in the plot and plough them into the soil. | Leave maize straw residue in the plot and plough it into the soil. |
Note:# Categorised the size of the mineral fertiliser: distinguishing between low (<100, 20, and 50 kg ha -1 year -1), intermediate (100–300, 20–60, and 50–150 kg ha -1 year -1), and high (>300, 60, and 150 kg ha -1 year -1) levels of N, P, and K, respectively, to explain the categories of mineral fertiliser intensity of the effect size with regard to the effects of fertilisation quantity [22].
Table 2.
The mean soil carbon and labile carbon fractionation of the long-term maize and paddy soils across soil depth.
Table 2.
The mean soil carbon and labile carbon fractionation of the long-term maize and paddy soils across soil depth.
| Soil depth | POXC | WSC | HWSC | |||
| (g kg-1) | (mg kg-1) | (mg kg-1) | ||||
| Paddy(n=8) | ||||||
| 0-15 | 1.05 | (0.07) | 66.45 | (5.73) | 74.25 | (5.73) |
| 15-30 | 0.63 | (0.07) | 41.20 | (3.48) | 47.75 | (3.88) |
| 30-45 | 0.42 | (0.05) | 31.20 | (2.04) | 36.50 | (2.75) |
| 45-60 | 0.39 | (0.04) | 33.70 | (2.84) | 40.00 | (3.28) |
| 60-80 | 0.34 | (0.04) | 34.20 | (3.82) | 39.50 | (4.32) |
| 80-100 | 0.30 | (0.05) | 25.80 | (4.03) | 33.60 | (4.03) |
| Mean | 0.52A | (0.06) | 38.76A | (3.66) | 45.27A | (4.00) |
| Soil depth Maize(n=3) | ||||||
| 0-15 | 0.81 | (0.07) | 34.87 | (4.06) | 42.67 | (4.06) |
| 15-30 | 0.39 | (0.07) | 20.20 | (2.45) | 28.00 | (2.45) |
| 30-50 | 0.25 | (0.02) | 12.20 | (1.00) | 15.33 | (1.05) |
| 50-60 | 0.25 | (0.02) | 16.20 | (2.24) | 14.00 | (1.00) |
| 60-80 | 0.21 | (0.02) | 16.87 | (1.20) | 12.67 | (0.67) |
| 80-100 | 0.14 | (0.00) | 16.20 | (1.55) | 12.00 | (0.00) |
| Mean | 0.34B | (0.03) | 19.42B | (2.08) | 20.78B | (1.54) |
Note: The differences in upper case within a column indicate significant differences in land use type (P < 0.05). POXC, permanganate-oxidisable carbon; WSC, water-soluble carbon; HWSC, water-soluble carbon. Numbers in parentheses are standard errors of the mean (SEM).
Table 3.
The comparison of soil chemical properties from paddy and maize soils across soil depths.
| pH | P | K | Na | Ca | Mg | CEC | NH4+-N | NO3--N | ||||||||||
| <-------------- ---------------------------------------------- (mg kg-1)----------------------------------------------> | cmol(+) kg-1 | <---------- (mg kg-1)--------> | ||||||||||||||||
| Paddy (n=8) | ||||||||||||||||||
| 0-15 | 6.82 | (0.17) | 7.34 | (0.63) | 88.41 | (2.44) | 145.76 | (7.34) | 1484.33 | (157.87) | 175.46 | (17.38) | 9.7 | (0.84) | 6.54 | (0.69) | 6.17 | (0.61) |
| 15-30 | 6.77 | (0.09 | 7.28 | (1.05) | 60.20 | (4.26) | 148.93 | (9.03) | 1499.63 | (167.40) | 205.41 | (25.42) | 10.0 | (0.91) | 6.23 | (0.74) | 4.76 | (0.63) |
| 30-45 | 6.99 | (0.08 | 3.92 | (0.33) | 60.55 | (5.43) | 155.53 | (11.33) | 1489.03 | (174.52) | 210.83 | (27.72) | 10.0 | (0.96) | 6.94 | (0.63) | 4.27 | (0.38) |
| 45-60 | 7.43 | (0.22 | 4.77 | (0.50) | 69.29 | (4.71) | 137.83 | (10.09) | 1423.80 | (156.79) | 208.29 | (24.31) | 9.6 | (0.86) | 6.33 | (0.82) | 5.17 | (0.31) |
| 60-80 | 6.95 | (0.15 | 5.28 | (0.83) | 66.14 | (5.81) | 129.95 | (10.22) | 1265.41 | (159.99) | 212.25 | (27.06) | 8.8 | (0.88) | 5.84 | (0.77) | 6.93 | (1.55) |
| 80-100 | 6.72 | (0.23 | 6.07 | (1.17) | 66.43 | (6.76) | 158.33 | (10.62) | 1371.58 | (161.79) | 194.00 | (24.20) | 9.3 | (0.89) | 7.02 | (1.02) | 5.66 | (1.18) |
| Mean | 6.95A | (0.16) | 5.77ns | (0.75) | 68.50B | (4.90) | 146.05B | (9.77) | 1422.30A | (163.06) | 201.04A | (24.35) | 9.6A | (0.33) | 6.48A | (0.78) | 5.49ns | (0.78) |
| Maize (n=3) | ||||||||||||||||||
| 0-15 | 5.66 | (0.38) | 9.34 | (2.16) | 122.83 | (7.45) | 203.38 | (8.04) | 428.11 | (34.30) | 90.28 | (9.85) | 4.1 | (0.23) | 4.81 | (0.89) | 9.70 | (1.61) |
| 15-30 | 6.37 | (0.40) | 7.25 | (1.44) | 100.71 | (21.01) | 209.75 | (6.29) | 456.00 | (31.02) | 102.25 | (15.35) | 4.3 | (0.25) | 2.81 | (0.36) | 9.70 | (3.07) |
| 30-50 | 6.97 | (0.27) | 4.51 | (0.33) | 70.57 | (12.25) | 194.43 | (4.66) | 427.31 | (13.87) | 125.64 | (24.12) | 4.2 | (0.14) | 4.33 | (0.92) | 4.39 | (0.28) |
| 50-60 | 6.12 | (0.28) | 5.00 | (0.77) | 88.25 | (20.26) | 203.68 | (5.76) | 455.08 | (32.87) | 95.31 | (22.62) | 4.2 | (0.26) | 3.36 | (0.42) | 4.01 | (0.28) |
| 60-80 | 5.96 | (0.28) | 2.59 | (0.12) | 49.46 | (3.52) | 203.25 | (3.59) | 401.39 | (18.17) | 72.06 | (15.11) | 3.6 | (0.13) | 3.66 | (0.74) | 4.26 | (0.57) |
| 80-100 | 5.96 | (0.44) | 2.41 | (0.47) | 43.31 | (1.07) | 192.33 | (3.38) | 377.79 | (15.64) | 62.96 | (3.62) | 3.4 | (0.10) | 3.98 | (0.52) | 9.47 | (1.30) |
| Mean | 6.17B | (0.34) | 5.18ns | (0.88) | 79.19A | (10.93) | 201.14A | (5.28) | 424.28B | (24.31) | 91.41B | (15.11) | 4.0B | (0.54) | 3.83B | (0.64) | 6.92 | (1.18) |
Upper-case letters within a column indicate significant differences between the land-use types (P < 0.05). pH= soil:water (1:1); Available P by Bray II (mg kg-1); K+, Na+, Ca2+, and Mg2+ = Exchange K+, Na+, Ca2+, and Mg2+, respectively; CEC by pH 7 NH4AOc, NH4+-N = NH4+; N (mg kg-1) by K2SO4 solution measured at 660 nm; NO3 = NO3-N (mg kg-1) by 2.0 N KCl solution, and measured at 520 nm; The numbers in parenthesis are the standard errors of the mean (SEM).
Table 4.
The ratio between DOC and the amount of nutrients in paddy and maize soils.
| DOC:P | DOC:NO3 | P:NH4 | DOC:NH4 | DOC:Ca | DOC:Mg | DOC:SOC | ||||||||
| Paddy (n=8) | ||||||||||||||
| 0-15 | 25.36 | (4.31) | 29.65 | (4.40) | 1.16 | (0.20) | 25.86 | (2.87) | 0.11 | (0.01) | 0.98 | (0.14) | 0.02 | (0.00) |
| 15-30 | 17.72 | (2.63) | 26.06 | (3.62) | 1.30 | (0.21) | 18.90 | (2.32) | 0.08 | (0.01) | 0.55 | (0.05) | 0.02 | (0.00) |
| 30-45 | 22.09 | (2.70) | 17.60 | (1.50) | 1.98 | (0.19) | 11.34 | (1.10) | 0.06 | (0.01) | 0.46 | (0.05) | 0.02 | (0.00) |
| 45-60 | 18.62 | (1.84) | 16.33 | (2.25) | 1.57 | (0.21) | 16.57 | (2.52) | 0.06 | (0.01) | 0.46 | (0.05) | 0.03 | (0.00) |
| 60-80 | 20.35 | (2.70) | 19.45 | (3.41) | 1.77 | (0.35) | 15.08 | (1.46) | 0.07 | (0.01) | 0.46 | (0.05) | 0.04 | (0.00) |
| 80-100 | 14.46 | (2.40) | 14.67 | (1.74) | 1.67 | (0.24) | 11.27 | (1.56) | 0.06 | (0.01) | 0.35 | (0.04) | 0.05 | (0.01) |
| Mean | 19.77A | (2.76) | 20.63A | (2.82) | 1.58A | (0.23) | 16.50ns | (1.97) | 0.07B | (0.01) | 0.54ns | (0.07) | 0.03A | (0.00) |
| Maize (n=3) | ||||||||||||||
| 0-15 | 12.38 | (2.32) | 10.25 | (2.03) | 0.56 | (0.04) | 21.58 | (4.07) | 0.19 | (0.03) | 0.99 | (0.19) | 0.02 | (0.00) |
| 15-30 | 11.03 | (3.01) | 9.36 | (2.06) | 0.69 | (0.23) | 18.17 | (1.93) | 0.11 | (0.02) | 0.61 | (0.12) | 0.01 | (0.00) |
| 30-50 | 6.44 | (0.60) | 6.53 | (0.52) | 1.15 | (0.33) | 8.70 | (1.51) | 0.07 | (0.00) | 0.41 | (0.13) | 0.01 | (0.00) |
| 50-60 | 7.42 | (1.31) | 7.76 | (0.63) | 0.72 | (0.07) | 10.02 | (1.16) | 0.07 | (0.01) | 0.52 | (0.12) | 0.02 | (0.00) |
| 60-80 | 11.65 | (0.78) | 8.05 | (1.20) | 1.36 | (0.22) | 10.66 | (1.67) | 0.07 | (0.00) | 0.56 | (0.09) | 0.02 | (0.00) |
| 80-100 | 14.44 | (2.86) | 3.31 | (0.49) | 1.79 | (0.15) | 7.77 | (1.09) | 0.08 | (0.00) | 0.46 | (0.04) | 0.02 | (0.00) |
| Mean | 10.56B | (1.81) | 7.54B | (1.15) | 1.04B | (0.17) | 12.82ns | (1.91) | 0.10A | (0.01) | 0.59ns | (0.12) | 0.02B | (0.00) |
Note: Upper case within a column indicate significant differences between land-use type (P < 0.05). DOC:P = DOC (mg kg-1)/available P by Bray II (mg kg-1; DOC:NO3- = DOC (mg kg-1)/NO3-N (mg kg-1); DOC:NH4+ = DOC (mg kg-1)/NH4+ N (mg kg-1); P/NH4 = P by Bray II (mg kg-1)/NH4 (mg kg-1); DOC:Ca2+ = DOC (mg kg-1)/exchange Ca 2+ (mg kg-1); DOC:Mg2+ = DOC (mg kg-1)/exchange Mg2+ (mg kg-1); DOC:SOC = DOC (mg kg-1)/SOC (mg kg-1). DOC, dissolved organic carbon; SOC, soil organic carbon. Numbers in parentheses are standard errors of the mean (SEM).
Disclaimer/Publisher’s Note: The statements, opinions and data contained in all publications are solely those of the individual author(s) and contributor(s) and not of MDPI and/or the editor(s). MDPI and/or the editor(s) disclaim responsibility for any injury to people or property resulting from any ideas, methods, instructions or products referred to in the content. |
© 2024 by the authors. Licensee MDPI, Basel, Switzerland. This article is an open access article distributed under the terms and conditions of the Creative Commons Attribution (CC BY) license (http://creativecommons.org/licenses/by/4.0/).
Copyright: This open access article is published under a Creative Commons CC BY 4.0 license, which permit the free download, distribution, and reuse, provided that the author and preprint are cited in any reuse.


