Preprint
Article

The Influence of Geometry on the Energy Capture of a Point Absorber Wave Energy Converter in the Coast of Mexico

Altmetrics

Downloads

138

Views

64

Comments

0

A peer-reviewed article of this preprint also exists.

Submitted:

23 February 2024

Posted:

23 February 2024

You are already at the latest version

Alerts
Abstract
The wave energy converter (WEC) technology constantly develops new designs and models. To encourage its development within the energy sector, research is required to improve current designs and create durable and effective devices. However, it is also crucial to investigate the suitability of a WEC to a site-specific sea condition as this can impact its optimal power absorption and constructability. This study evaluates and compares the efficiency of a heaving buoy with varied geometries in one of the most energetic places along the Mexican coast. A statistical analysis of the wave climate on the coast of Ensenada during the last 42 years is performed to define the conditions to which the device is subjected. The location of the WEC in shallow waters is chosen using a computational model which solves the modified mild slope equation in its elliptic shape. The heaving buoy floater is studied using three distinct geometries: a semi-sphere, a cylinder, and a proposed rounded semi-rectangle. The hydrodynamic response of the three geometries is then analysed in the frequency and time domain using ANSYS AQWA. The hydrodynamic study involves the assessment of the floating body dynamics, exerted forces, the power absorbed as well as the suitability of the proposed power take-off (PTO) system. Findings reveal that the proposed geometry absorbs the most energy, with an annual power of 135.11 MW, and that the transmission PTO design is appropriate for this type of technology.
Keywords: 
Subject: Engineering  -   Other

1. Introduction

To meet the constantly increasing human demand for electricity, a transition from fossil fuel energy systems to renewable energy technologies is required. This led to the signing of the Paris Agreement in 2016, where more than 126 countries and regions have committed to improving resilience to climate change and reducing greenhouse gas emissions [1]. Considering this, several technologies have been developed to take advantage of energy sources such as wind, solar, hydroelectric, geothermal, oceanic and biomass. Among these renewable energy sources, marine renewable energy (MRE) is a plentiful and promising resource for achieving this goal [2].
The MRE's principal sources are thermal gradient, waves, tidal/currents and salinity gradient, which cover 53%, 36%, 9% and 2%, respectively, of the worldwide marine energy installed capacity [3,4]. Neil and Hashemi [5] estimated that the use of ocean renewables will continue to consistently increase and they are projected to contribute to 748 GW of the global energy supply by 2050. In this sense, one of the densest marine energy sources per area unit is wave energy [6], which can be exploited on a large scale since the infrastructure required is moderate in size, and costs of installation and maintenance can be shared with already existing marine structures. As a result, this energy source has the potential to be more economically profitable than other MRE sources [7].
Wave energy is estimated to be available on a worldwide scale for about 29,500 TWh per year [8] and each wavefront is considered with the potential to transmit, on average, between 10 and 15 kW/m [9,10]. Like most of the planet's resources, wave energy is also unevenly distributed, so areas subject to regular winds are those with the greatest energy potential, which is why the extratropical regions of both semi-spheres (30-60°) have the highest wave power, reaching over 60 kW/m; however, it decreases as latitude approaches the equatorial region, where values are less than 10 kW/m [11]. For example, on the coasts of Mexico, which is the focus of our study, wave energy is highly variable; in the Gulf, it is less than 10 kW/m, while in the Pacific, it is 10-20 kW/m [12], with the western part of the Baja California peninsula displaying the greatest power availability [13].
Over the last two decades, a large variety of wave energy converters (WECs) has been designed and prototyped [14]; WECs can be classified based on their location [15] (onshore, nearshore, offshore), size and orientation with respect to the incoming wave [16], the working principle [17] (pressure differential WECs [18], overtopping WECs [19], floating WECs [20]), power take-off system, PTO, (air turbines [21], hydraulic systems [22], linear generators [23], mechanic [24]). Some examples of these technologies are the Oscillating Water Column (OWC) device (LIMPET [25], Sakata [26], REWEC3 [27], Mutriku [28] and Mighty Whale [29]); the overtopping devices (TAPCHAN [30] and Wave Dragon [31]); and oscillating bodies (IPS buoy [32], AquaBuoy [33], Pelamis [34], SEAREV [35], AWS [36] and Oyster [37]). According to all the above-mentioned examples, the price of a WEC rises as it becomes bigger. Therefore, the geometry optimization of the system has a significant role in the design process to produce an economically feasible system. So far, one of the most promising WEC designs under technical and economic examination is the point absorber (PA). It comprises a floater body with relatively small dimensions in comparison to the incidence wavelength and a support system that can include mooring cables attached to the seabed or bottom-mounted structures. A heaving PA is a wave energy device in which the heave motion due to the wave-body interaction is absorbed by the power take-off (PTO) system that converts mechanical power from heave action into electrical power. Some examples of the PA-WEC are Wavestar [38], SeaBased [39], Wavebob [40] and Aquabuoy [41].
Researchers have worked for decades to improve the extracted power from the PA-WEC using analytical, numerical, and experimental approaches. For instance, optimization research on PA-WEC was conducted by Budal and Falnes [42]. Goggins et al. [43] presented a methodology for optimizing the structural geometric configuration of a floating WEC, which considers the average annual wave energy spectrum of its design location. Shi et al. [44] investigated the optimization design of a conical-bottom WEC considering the PTO system. Regarding geometry and shape, McCabe [45] presented a systematic method of optimization to improve capture efficiency using a genetic algorithm; the result is a system that oscillates in the range of the prevailing wave frequencies producing the maximum possible motion amplitudes and power [46]. Different works have been presented for the geometry optimization of a PA. However, since these studies are site-specific, their findings may not be applicable elsewhere, such as throughout the Mexican coast. Therefore, an analysis according to the selected zone in Mexico is presented here.
The main objective of this research is to assess the performance of three geometries of a floating-type point absorber WEC in Ensenada, Baja California, Mexico. The device behaviour will be numerically simulated in the frequency and time domains, from which the extractive capacity of each buoy and the response of a proposed mechanical PTO will be quantified.

2. Materials and Methods

2.1. Problem Definition

Figure 1a and Figure 1b show the plan and profile views of the diagram of the WEC proposed in this work. Waves are considered to propagate from left to right on the continental shelf with height H an incident angle θ, the water depth h(x,y) is variable and depends on the location. In the reference system, the x-axis is positive to the right, while the z-axis is positive upwards, and the origin is located in the centre of gravity of the buoy at static equilibrium (without waves). In this study, it is assumed that the bottom is impermeable with a length of LI on its horizontal projection and width of LII.
The WEC to be analysed is classified as a floating oscillating body (buoy); which has a volume, V, and is coupled to a lever arm, whose length is r=AB, which will activate a mechanical system. The PTO system is located at a height d2 above the mean sea level (MSL) and is also anchored to the bottom with a structure at a depth ha. The angle formed between the lever arm and the upper surface of the floating body is θi. The interaction of the waves with the buoy produces an angular degree of freedom, θ0(t), that is time-dependent and is considered relative to the initial conditions of the system. Finally, the buoy and the diffracted incident waves interaction forms an angle β.

2.2. Maritime Climate

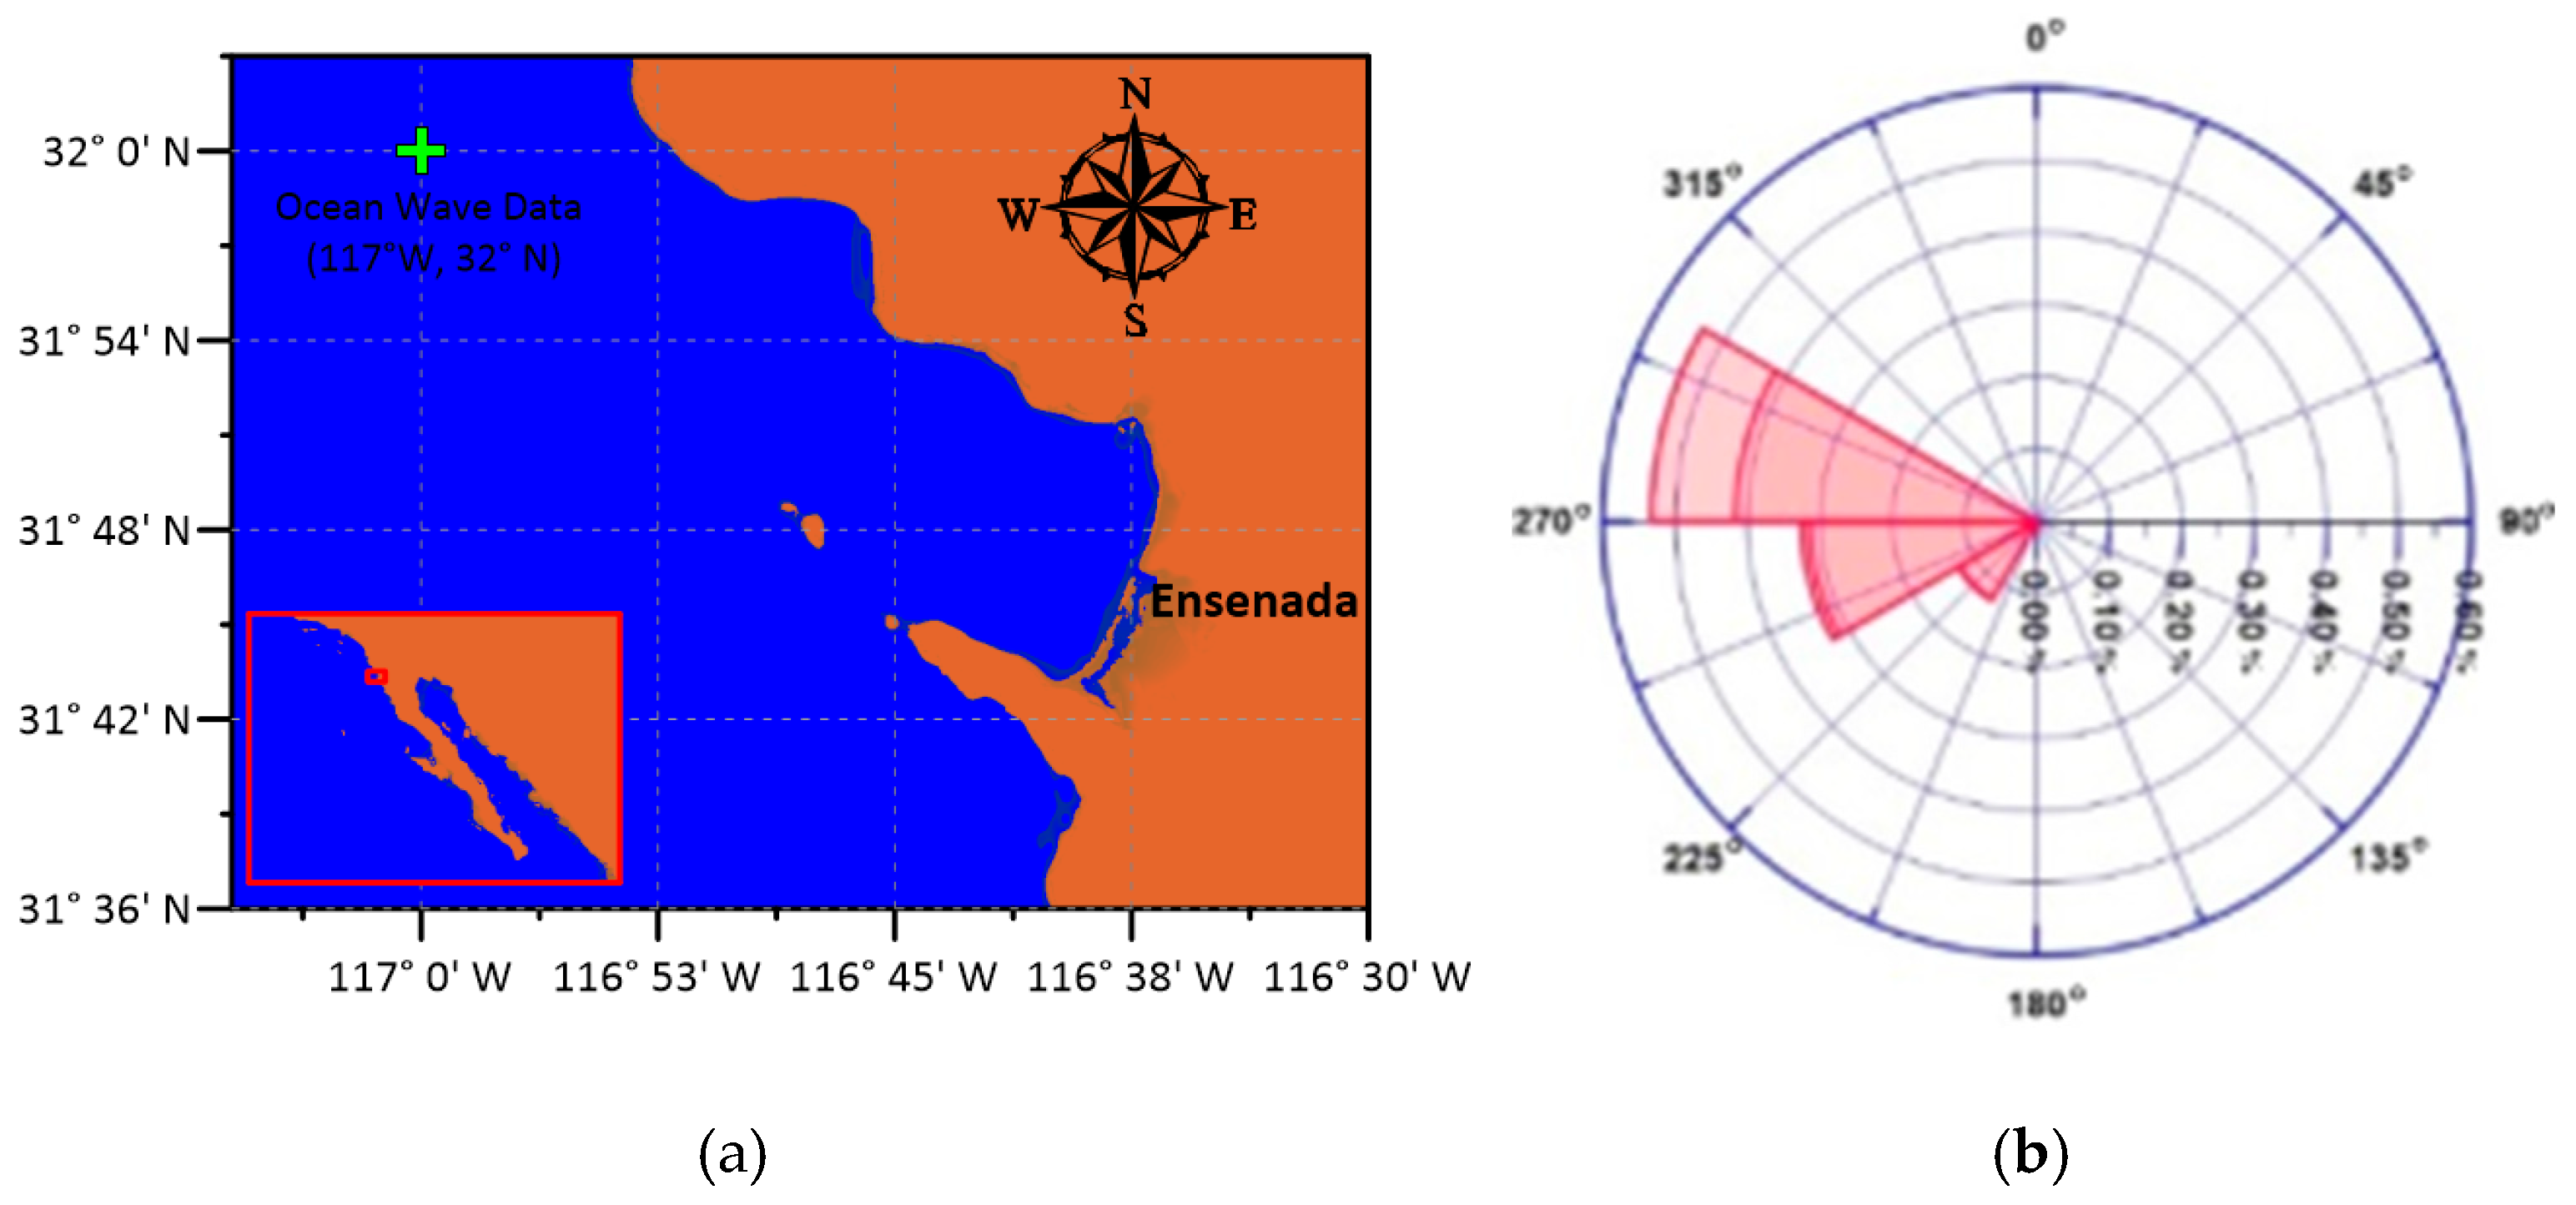
In terms of wave energy, the most active area in Mexico is on the Pacific Coast's Baja California peninsula (Figure 2). This was obtained by using wave data from the European Centre for Medium-Range Weather Forecasts Re-Analysis version 5 (ERA5) for the period 1979-2021. The ERA5 point nearest to Ensenada's shore is located at 117.0° W, 32.0° N, Figure 2a. This dataset provides hourly data on significant wave height, mean period, and wave direction. The time series analysis reveals that the wave direction extends 52% from WNW, as shown in Figure 2b, which depicts the yearly wave rise.
The characteristic values of the significant wave height, Hs, and mean period, Tm, are shown in Table 1 for an annual and seasonal basis. It can be observed that the winter has the largest Hs and Tm, indicating that the waves are more energetic during this period.
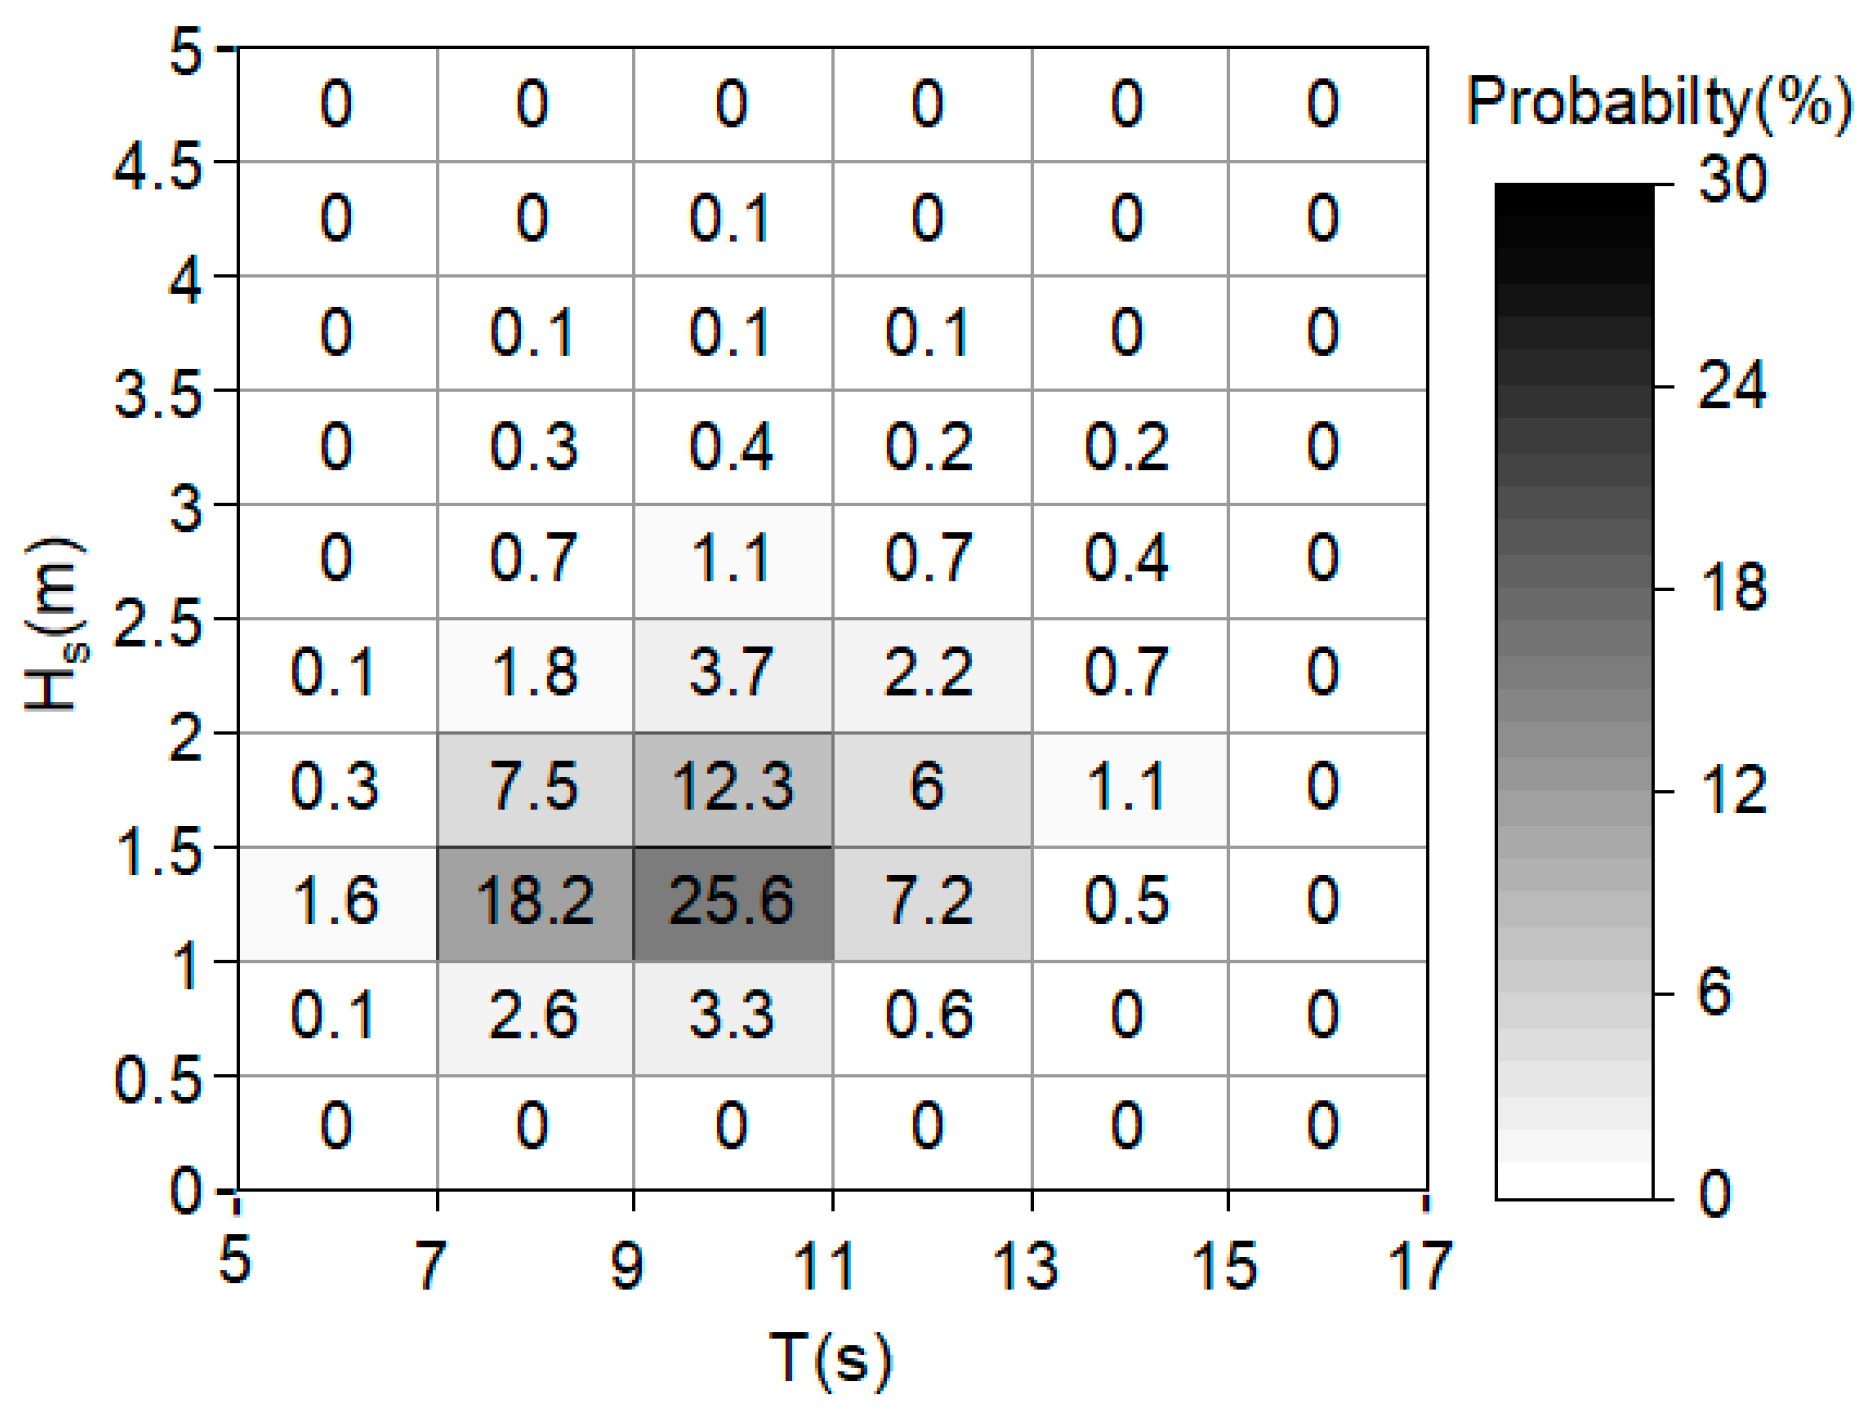
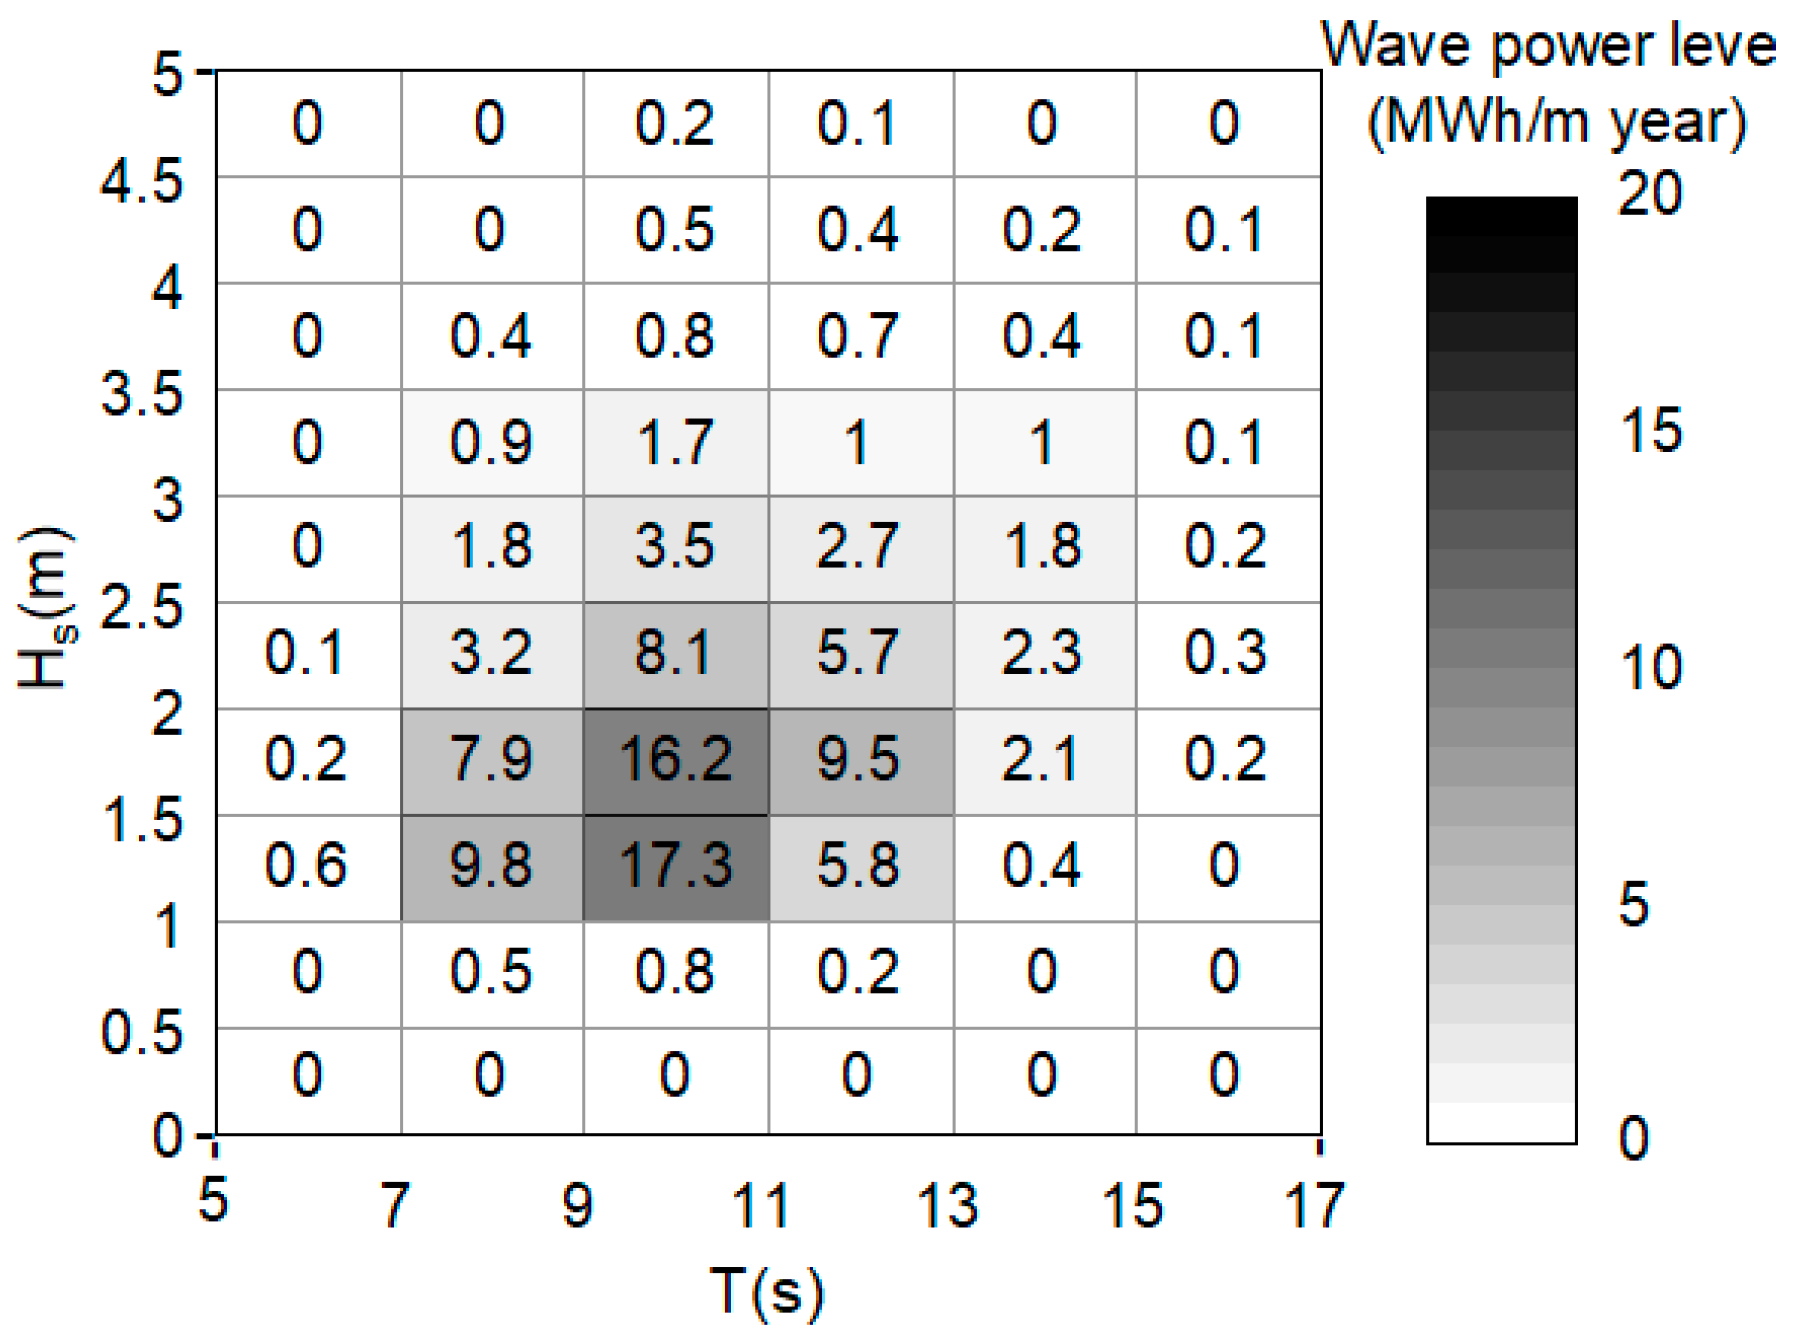
The wave statistics on the Ensenada coast are presented in terms of their annual joint probability distribution (JPD) in Figure 3. There is a predominance of mean periods between 9 and 11 s whereas for Hs these are for 1.0 and 1.5 m with 25.6% occurrence. Furthermore, most wave heights are between 0.5 and 2.5 m, with only 1.5% of waves exceeding 3 m in height. The predominant waves have frequencies between 7 and 13 s with an occurrence of 94.8%. Furthermore, Figure 4 illustrates a combined scatter and energy diagram to visualize the composition of the wave energy resource in terms of wave heights and periods. The numerical values and the colour scale represent the annual wave power level (in MWh/m year). The most energetic zones are found between periods 7 and 13 s, with an Hs between 1 and 13 m, with values greater than 1.7 MWh/m year, the most energetic conditions are found between periods 9 and 11 with a Hs 1 and 2 m, reaching the maximum values ​​of 17.3 and 16.2 MWh/m year, which aims for the device to have its maximum efficiency in this area.
Additionally, the period averaged energy, E, travelling in a wave per unit area of sea surface can be computed directly from the hindcast data as follows [47]:
E = ρ g H s 2 / 16
where ρ is the density of the fluid; and g is the acceleration due to gravity. On the other hand, the wave power level, P, per unit width can be given as follows:
P = ρ g 2 H s 2 T e / ( 64   π )
with Te representing the energy period. The measured sea states are often specified in terms of either the mean period or peak period (Tp). When the mean period Tm is known, one potential approach to estimate Te can be as follows:
T e = α T m
where the coefficient α depends on the frequency spectrum model, which was assumed to be equal to 1 [48].
Equation (2) is a deep-water approximation and has been used in this study to describe the wave power for the nearshore region of Ensenada. By considering an average significant height Hs= 2.04 m and a wave energy period Te = Tm = 10.27 s, see Table 1, and applying equation (2), the resultant wave power per unit width is approximately 20.84 kW/m.

2.3. Hydrodynamics of the System

In the preliminary hydrodynamic modelling of the WECs, it is typically assumed that the hydrodynamic forces of the floating body are those obtained from the linear diffraction theory, i.e., viscous effects are neglected and only potential forces are considered. Thus, the response of a single floating body is generally described using a mass-spring system. Assuming a linear system with 6 degrees of freedom, the equations of motion for this analysis can be represented as follows:
j = 1 6 M k j + A k j x j ¨ + B k j x j ˙ + C k j x j = F k             k = 1,2 , , 6
where k and j denote the hydrodynamic properties in the k-mode because of the motion in the j-mode; Mkj is the mass of the structure; Akj, Bkj and Ckj are the added mass, damping and hydrostatic restoring matrices, respectively; and Fk represents the other external forces in the kth mode. A detailed discussion on the linear diffraction theory can be found in Newman [49].
The primary mechanism for the energy extraction of the proposed point absorber is the heave motion; thus, at this preliminary stage, only the heave motion of the floater is considered. Therefore, the motion equation can be given by:
M + A 33 x 3 ¨ + B 33 x 3 ˙ + C 33 x 3 = F 3 t
where M is the mass of the system; A33, B33 and C33 are the added mass, damping and hydrostatic matrices, respectively, in the heave direction; and F3 is the external force on the body in the heave direction. It should be emphasised that, in addition to wave excitation and mooring forces, external forces may comprise other forces such as mechanical forces (e.g., PTO forces).

2.4. PTO Mechanism

The suggested device is designed to take advantage of the arm movement conversion (Figure 1), which is activated by the oscillating movement of the buoy with a unidirectional gearbox and a flywheel that is described as follows:
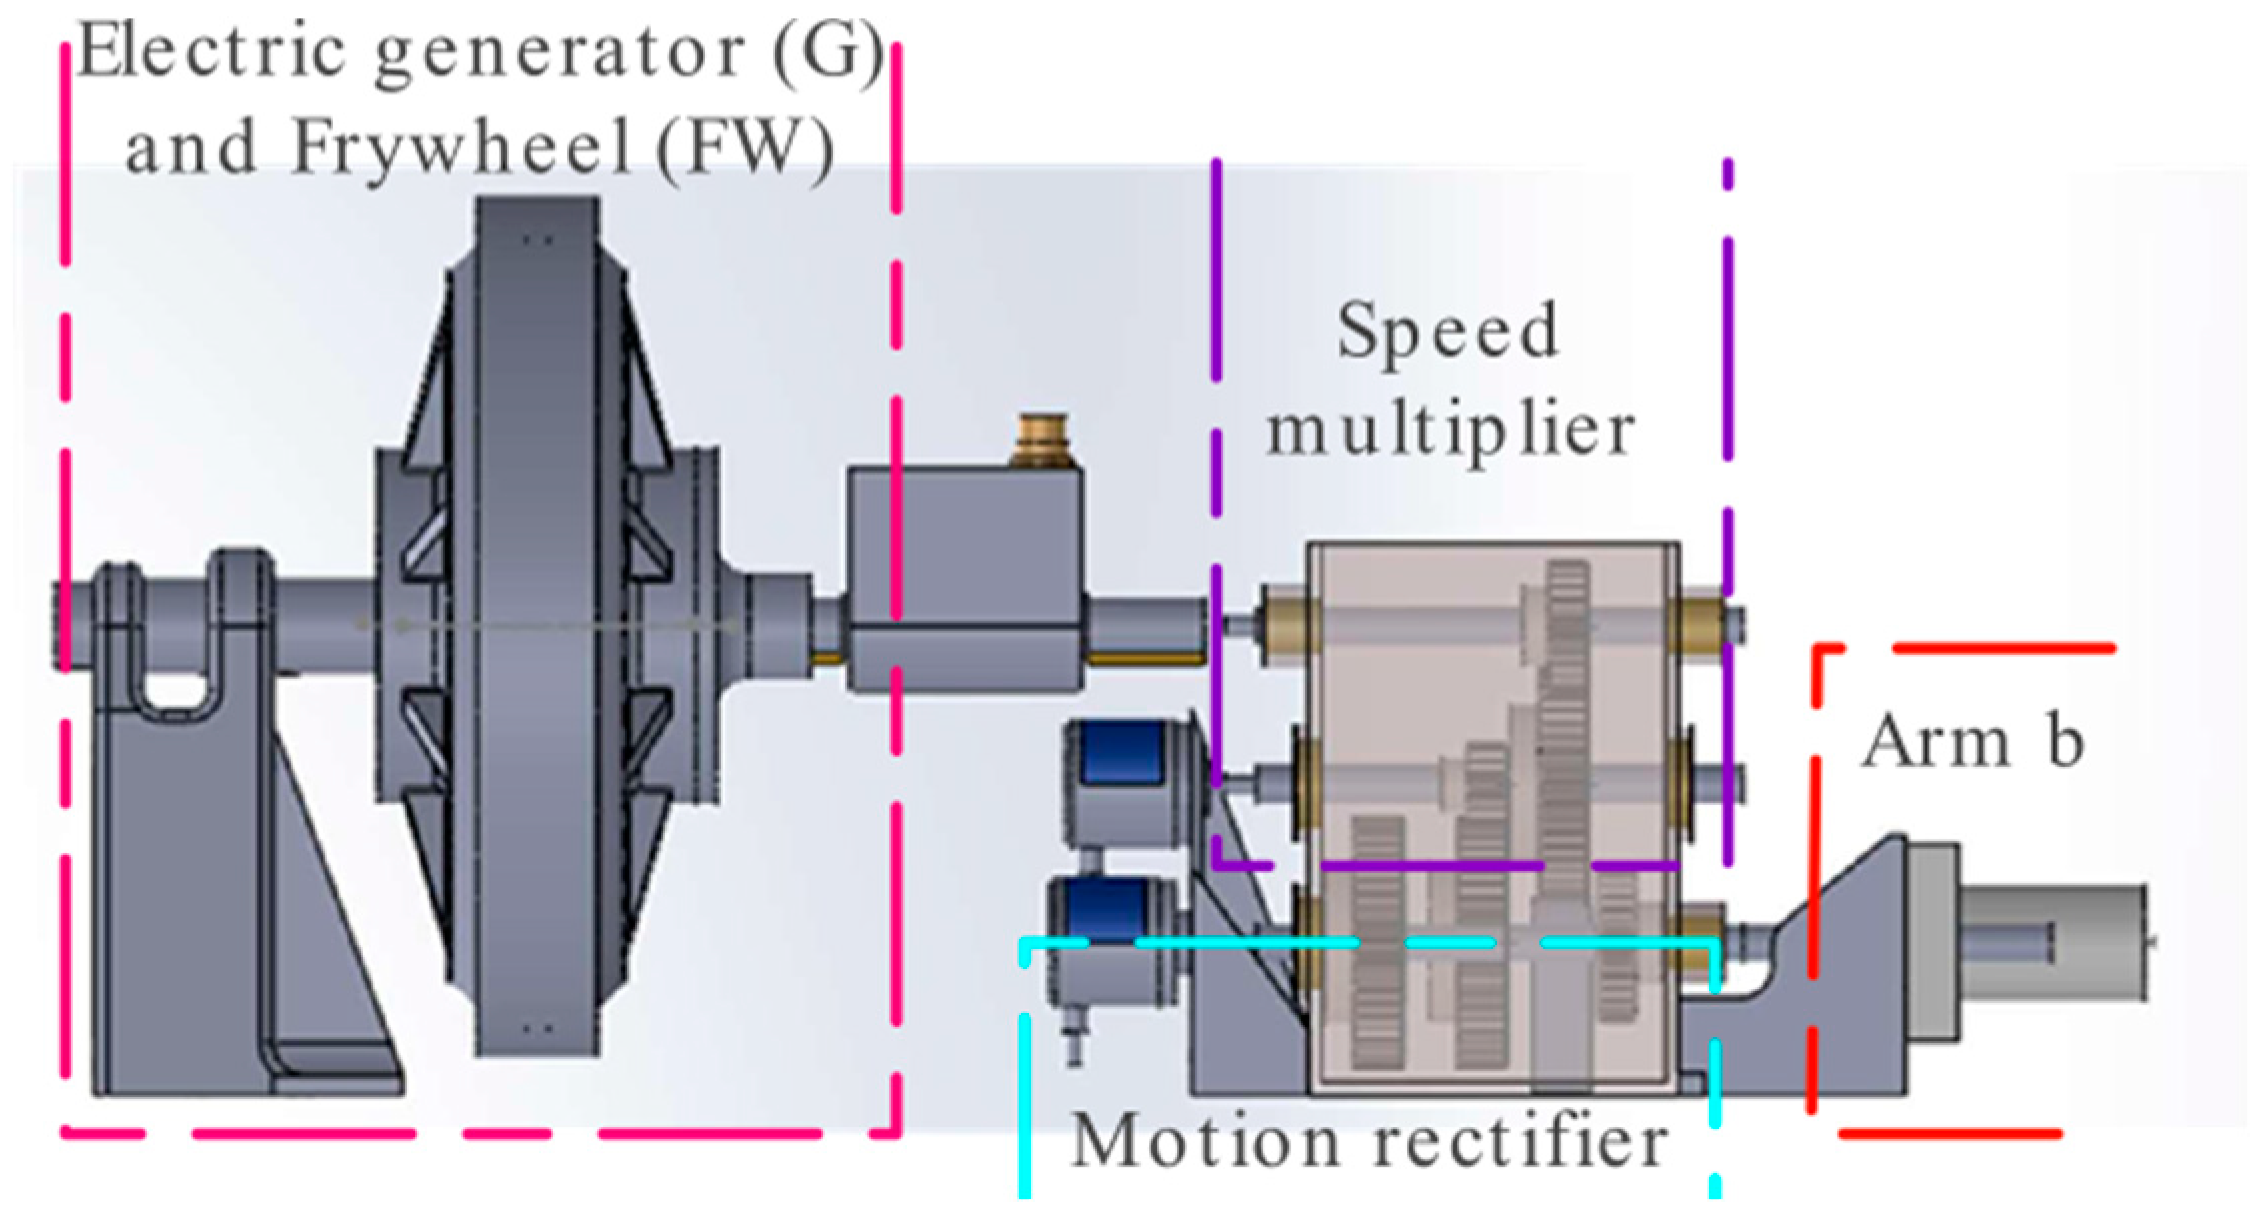
The buoy drives the alternating movement of arm r at a low speed. However, from this mechanism, a high speed and rotational movement must be obtained to generate electricity. To achieve this kind of motion, an arrangement of mechanical elements from the arm r to the electric generator G was designed, see Figure 5. This is made up of the following elements: a swing arm r: three unidirectional clutches (UC); a gear train to multiply speed (MG); a flywheel (FW); and an electric generator (G). Each of these elements has its respective components such as supports, wedges, bearings, and casings, among others.
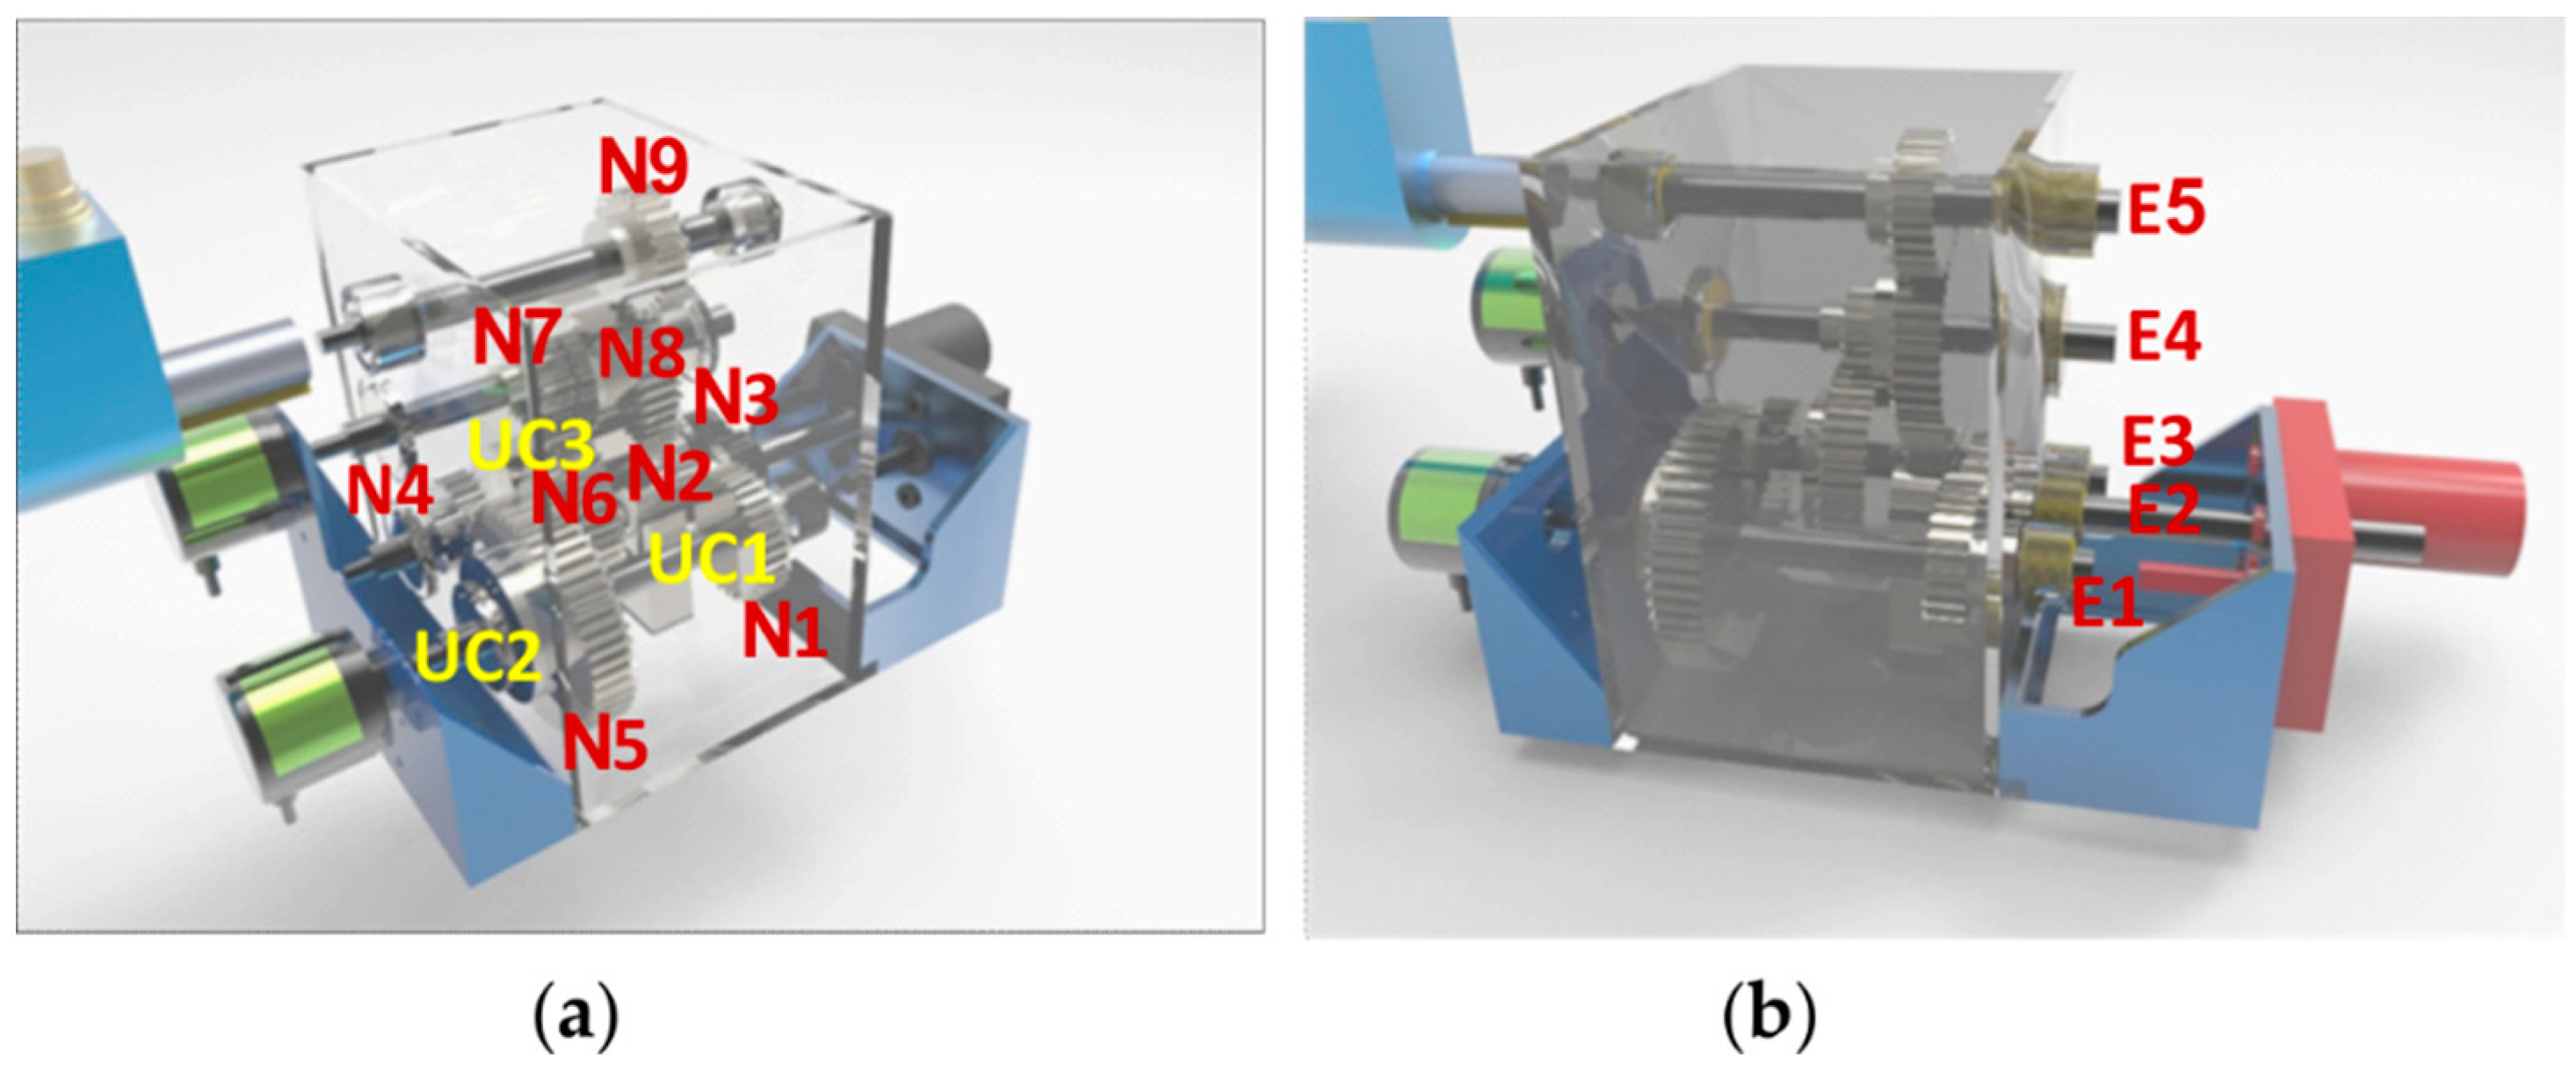
The first stage of the design is based on a mechanism that increases the speed ratio to 1:2. In addition, it completely rectifies the movement by making use of the buoy's rise and fall through arm r, with two unidirectional clutch bearings UC1 and UC2, located respectively inside gears N1 and N5, as well as gears N2, N3, N4 and shafts 1, 2, 3, see Figure 6a. UCs are used since they take advantage of rotation in only one direction. To be more specific, as the buoy rises, arm r connects with shaft 1 (E1), which UC1 activates, turning gear N1 in a clockwise direction. This then drives shaft 2 (E2) through gears N2 and N3, which in turn moves N4 and N5, respectively, and in this movement N5 deactivates UC2 so that it does not transmit power, allowing the buoy to benefit from the upward movement. When the floating body falls, the energy is sent to E1, which rotates counter-clockwise, engaging UC2, thus N5 will transmit power to E2 through N4, causing UC1 to detach and N1 will not transmit power. Thus, the reciprocating movement of the E1 input is corrected in this arrangement to a unidirectional clockwise movement in the E2, which acts as the input to the MG speed multiplier and corresponds to the second section of the design. Once the rotation is restricted to one direction, the rotations for the generator must be multiplied, which is why the operation of the box is verified, and an arrangement of gears from E2 to the generator with gears N6, N7, N8, and N9 with a 1:5 ratio is presented. Therefore, from E1 to the generator there is a speed ratio (Rv) of 1:10. Another clutch bearing, UC3, is installed in gear 6 to keep the inertia flywheel at a more consistent speed for the generator and to decouple it from the transmission when the input speed is low.
It should be emphasised that the proper ratio for the stage of multiplying the revolutions has not yet been established; this will rely on the wave conditions in the region of interest, the power to be gained, and the generator. Furthermore, a flywheel is installed within MG, which is essentially a mechanical energy storage device on axle 5 (E5) in conjunction with N9 whose function is to maintain a more constant speed in the electrical generator G. According to the rationale, when the buoy reaches the lowest position on the vertical axis that it can reach, it begins to rise at a speed equal to zero with maximum acceleration until it reaches a point higher where the same conditions exist and begin its fall to return to the lowest point. The speeds and accelerations fluctuate spatially and temporally as the buoy moves up and down, which is transmitted to the E1 where the angular speed is not constant due to the changing motions of the buoy; for this reason, FW is used. Figure 6 shows the profile drawing of the mechanism with the arrangement of the elements described.
WECs such as the Wavestar and Eco Wave Power feature a similar architecture as the proposed here. Their operation principle is based on floating bodies that move articulated oscillating arms to a ground base, but their PTO systems are more complex and expensive. There are based on sliding pistons, hydraulic systems, or linear generators, whereas the proposed device here avoids energy transformation into an intermediate stage of pneumatic or hydraulic power.

PTO Dynamics

The PTO will amplify the movement with a speed ratio, Rv. For this study, three cases are compared, the first one when there is no clutch bearing, then with two clutch bearings and the last one with three clutch bearings and a flywheel. Once the angular displacement, θ0(t), at the PTO input is known, the dynamics can be analysed for each case. Equations (6)-(9) show how each velocity and position are determined
ω 0 = θ 0 ˙ t ,
ω 1 = θ 1 ˙ t   a n d   θ 1 = R V θ 0 t ,
ω 2 = θ 1 ˙ t   a n d   θ 2 = 0 t ω 2 d t ,
ω 3 = max ω max j , 2 + α t , ω 2 a n d   θ 3 = 0 t ω 3 d t ,
where ω and θ, correspond to the speed and temporal position, respectively. The subscripts 0, 1, 2 and 3 indicate the entrance to the PTO, the first, second and third cases analysed, respectively. The term α is the flywheel angular acceleration, t is the time, ωmax(j),2 is the local maximum speed of ω2 and j indicates the corresponding maximum value.

2.5. WEC Modeling

Given the WEC shown in Figure 1, it is necessary to create a computer model representation of the device. There are different methods to define the device geometry [50]. In this paper, a solid model approach is chosen using SolidWorks 2018 to specify the geometry.
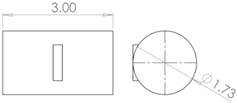
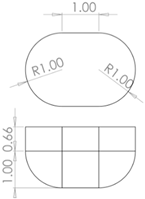
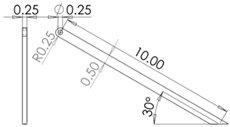
For this study, three types of floating bodies are analysed, the first one is a semi-spheres, followed by a horizontal cylinder and finally the rounded semi-rectangle which hereinafter will be referred to as the proposed design. The PTO and the pile are considered as one body. Each of the three geometries studied has a width of 3 m and a volume of V=7.06 m3, with the following dimensions: r=10 m, d2=5.5 m, ha=5 m, θ=30° and β=0°. It should be mentioned that the value of ha was carefully selected to reduce the computational domain and energy zone to WEC. The geometry of the pile will be circular with a diameter of 1 m and with a concrete density that is 2400 kg/m3. Both the buoy and the arm will be considered to have a uniform density of 470 kg/m3. Table 2 shows the dimensions of each element involved.
The buoy and the arm are joined and treated as one element, as are the pile and the PTO. By using SolidWorks, the physical properties of the geometry are obtained; these are the centre of gravity, the moment of inertia, volume, surface, and weight. Moreover, the origin of coordinates x and y is at the centre of mass of the semi-sphere buoy in initial conditions while the z-axis is at the mean water level. The physical properties of the semi sphere-arm, cylinder-arm, proposed geometry-arm and pile-PTO are described in Table 3.
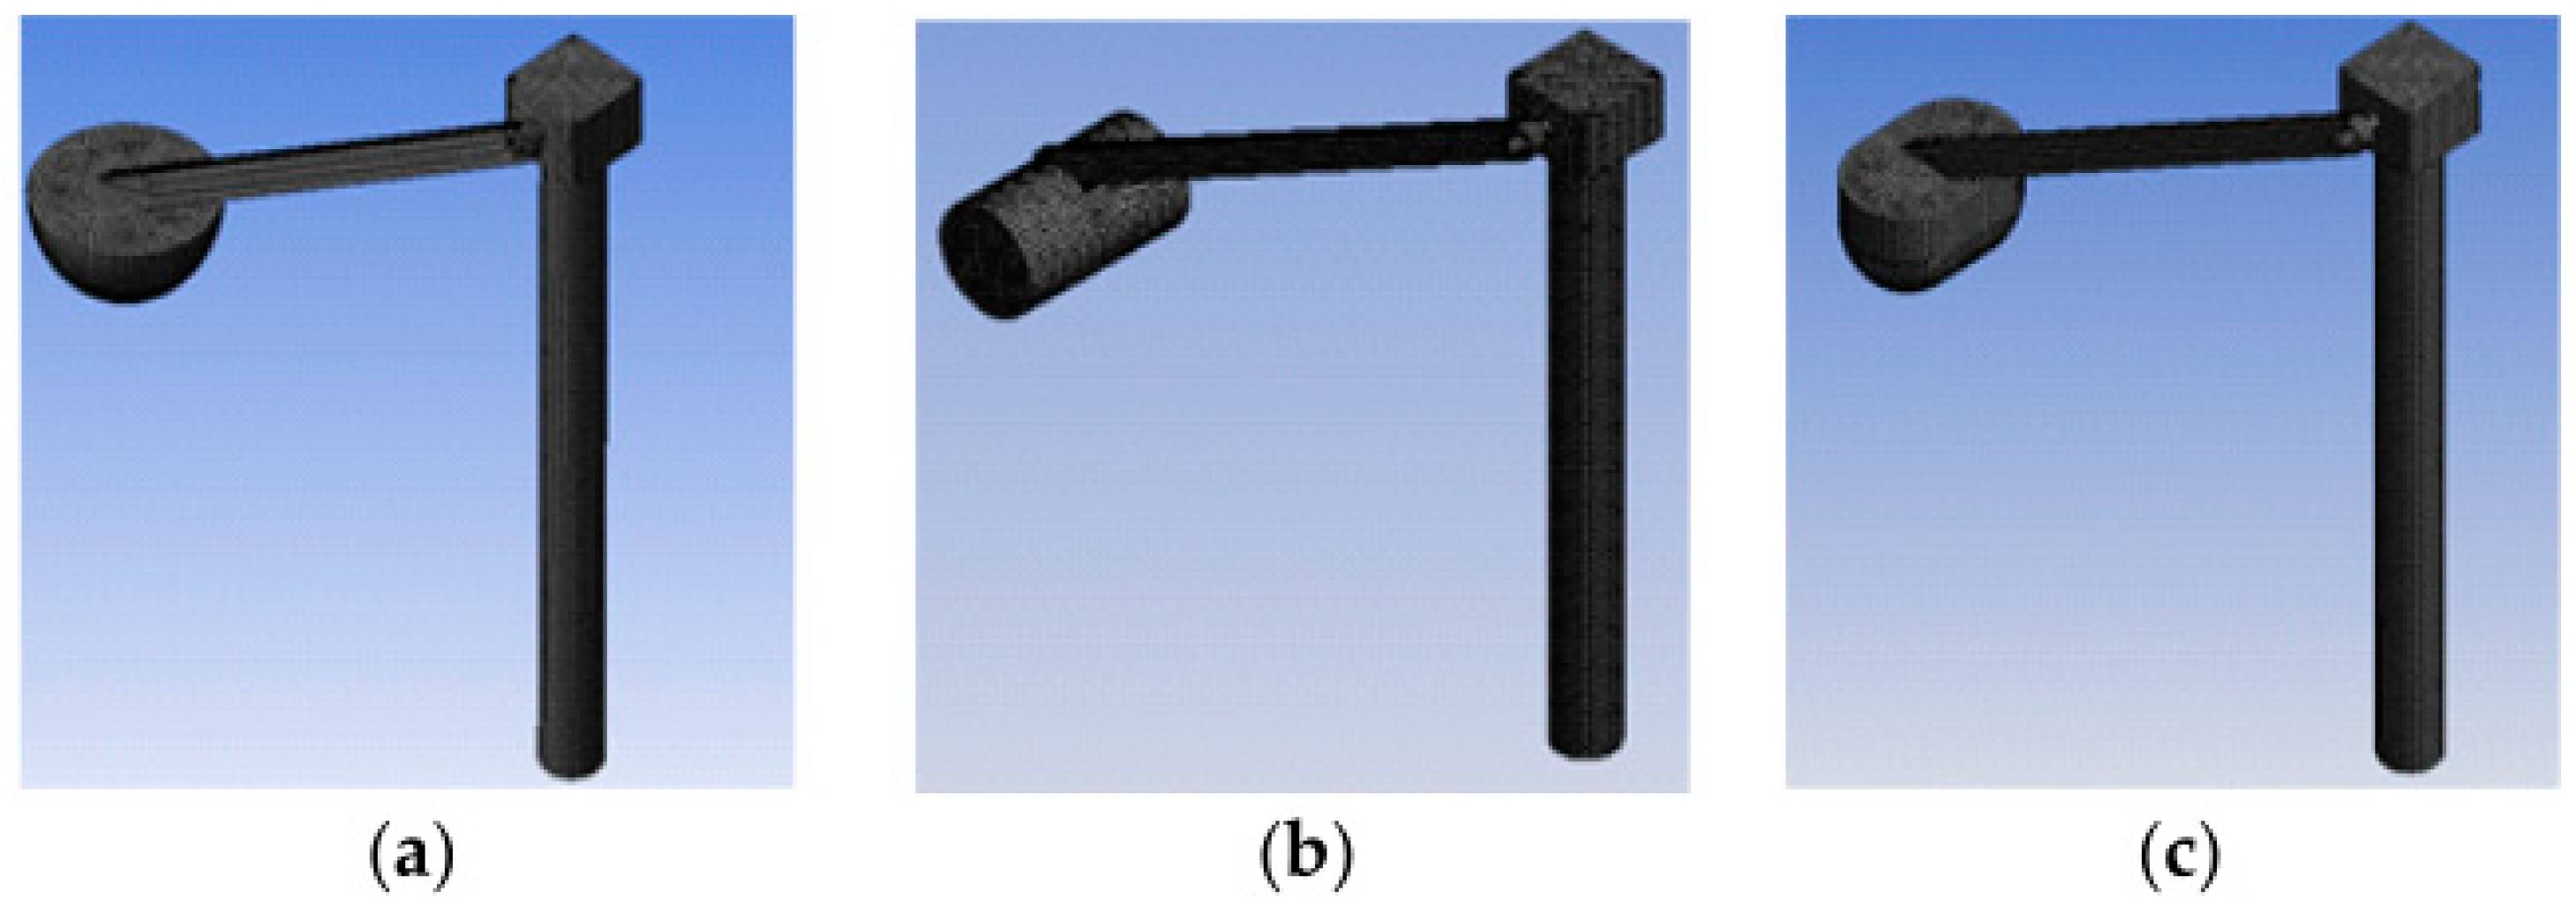
To analyse the behaviour of the WEC in the frequency domain, the Hydrodynamic Diffraction module of ANSYS AQUA was used. To carry out this type of simulation, the properties of the mass of the bodies are configured in the centre of gravity of each body. The model mesh had a maximum element size of 0.2 m, with 6220, 6109 and 5982 nodes for the semi-sphere, cylinder and the proposed geometry, respectively. Figure 7 shows the final meshed for each analyzed geometry.
The supporting pile was defined as a fixed structure, and the connection between the PTO and the arm was configured as a hinge so that the arm can rotate around the connection point with coordinates (8.6, 0.0, 5.5) m. Because it is exposed to the system's functioning, the arm-buoy was described as a free-moving body. The frequency-domain was configured in an interval of 0.05-0.5 Hz, β=0°; the depth and wave conditions, Table 1, were determined according to the selected study area.

3. Results

3.1. Study Area

As mentioned previously, the wave data was obtained for deep waters at 32.5 km from the community of Sauzal, in the municipality of Ensenada (116°41'4.22" W, 31°52'59.72" N). It is not necessary to do a wave propagation from that specific point since the disturbances in deep waters are minimal. Therefore, the domain was reduced to that shown in Figure 8 which has a dimension of 8 x 10 km. The WAPO (WAve Propagation On the coast) numerical model was used. This tool propagates a monochromatic wave train over a variable sea bottom [51], preferably in shallow and intermediate waters, and solves the modified mild slope equation in its elliptic shape. Thus, this model is capable of reproducing wave phenomena such as refraction, diffraction, shoaling, reflection and dissipation of energy induced by the bottom friction and the beach [52].
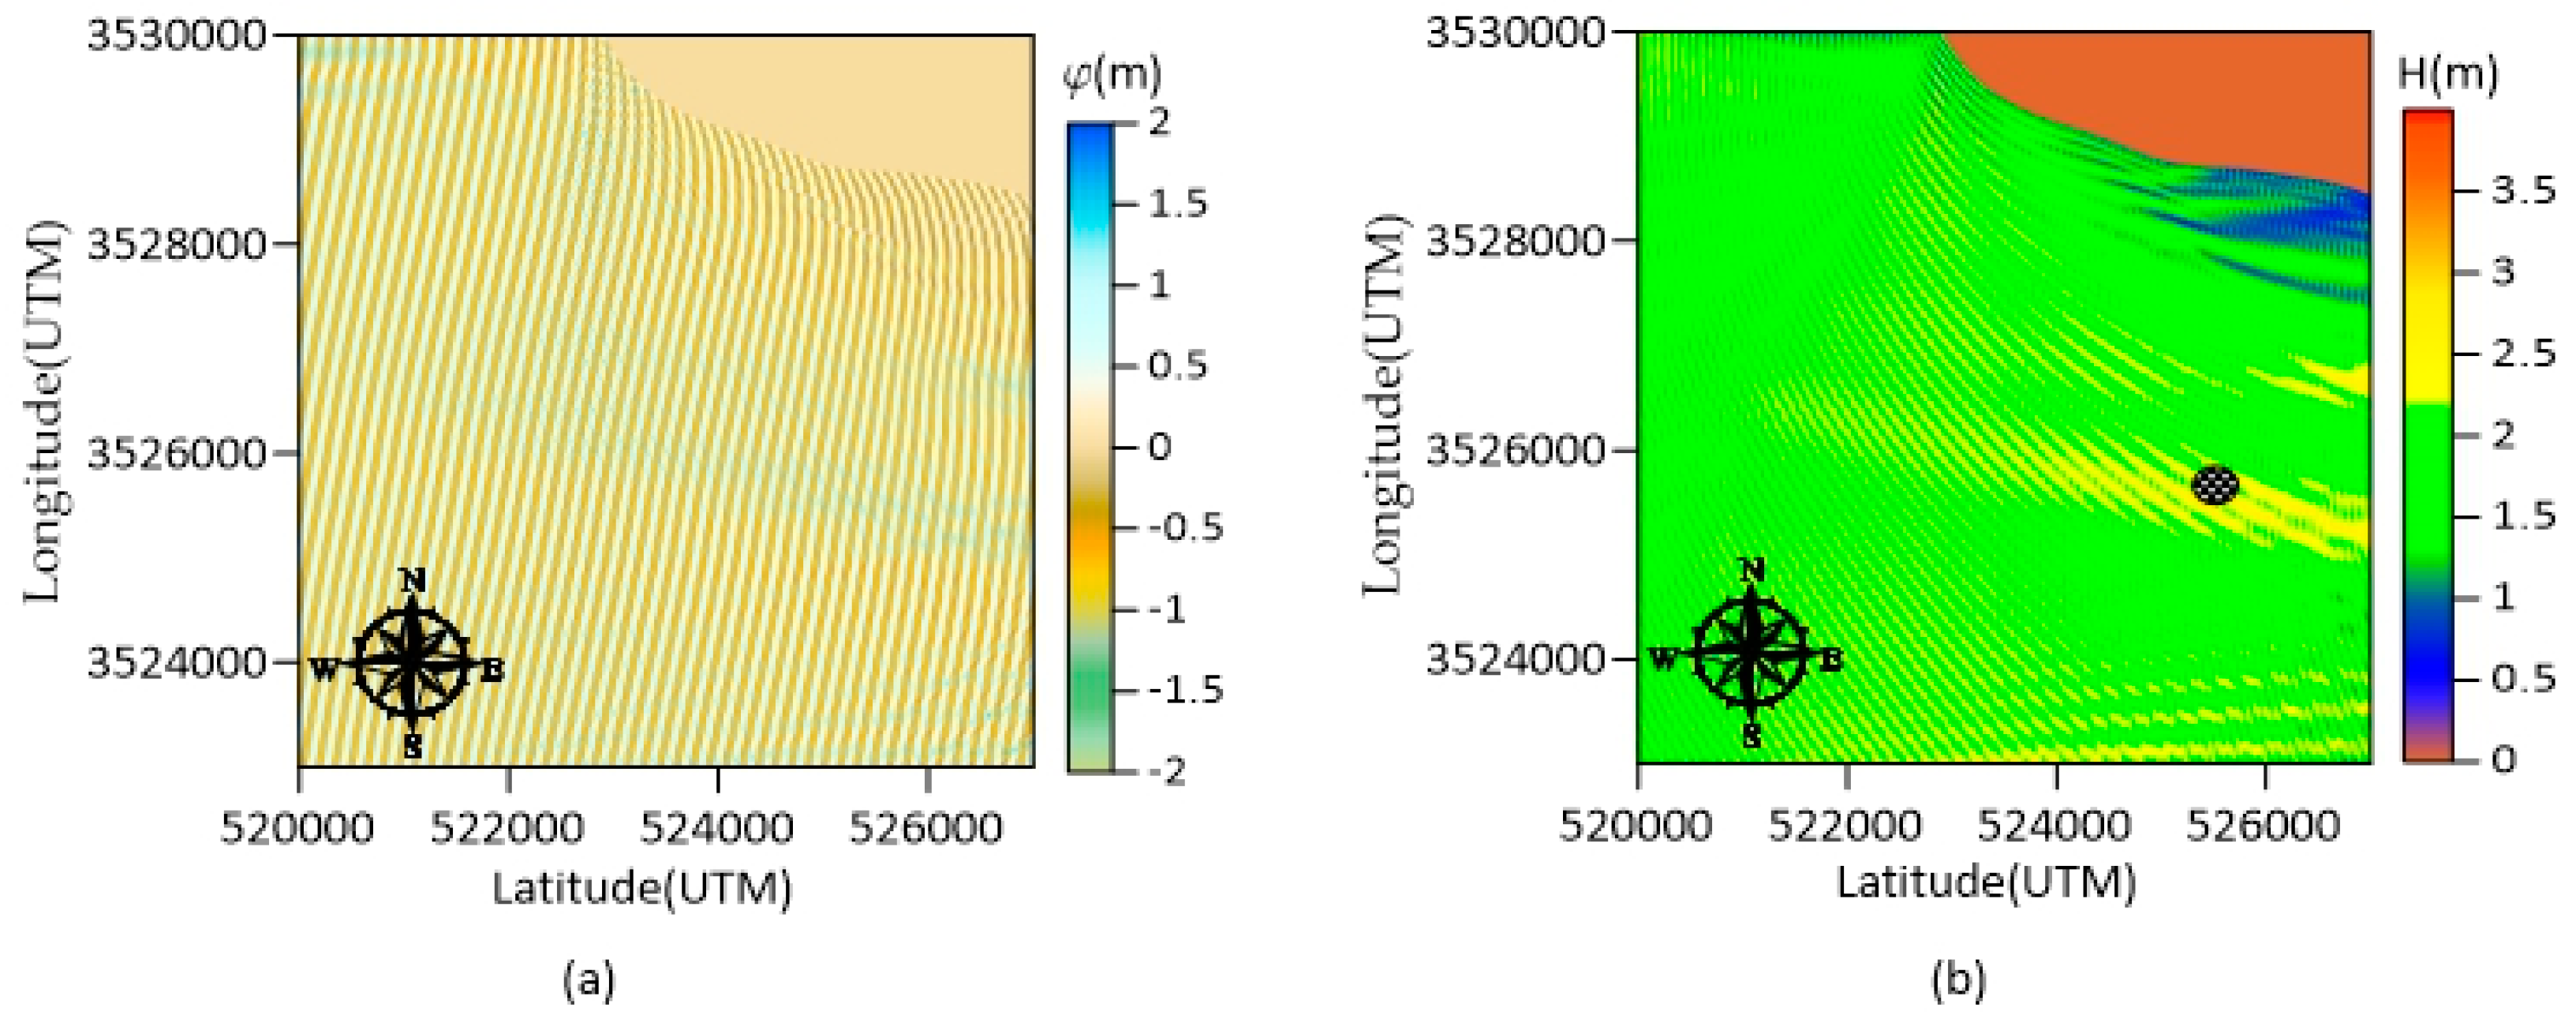
For locating the WEC, it is recommended to be placed close to the coast and in shallow waters. Thus, a place that meets these criteria and with high energy available will be chosen. The numerical input wave conditions were collected from the yearly statistical analysis, these are: Hs=2.03 m, Tm=10.27 s, and WNW direction (-11.25° with respect to the west), a non-reflective beach and a grid of 1001x801 nodes were used. Figure 9a and b show the results obtained for the free surface and wave height, respectively. The coordinates UTM (526000 E, 3256000 N) are selected to analyse the device in a water depth of 30 m and a wave height of 2.2 m, which is a highly energetic area.

3.2. Frequency-domain analysis

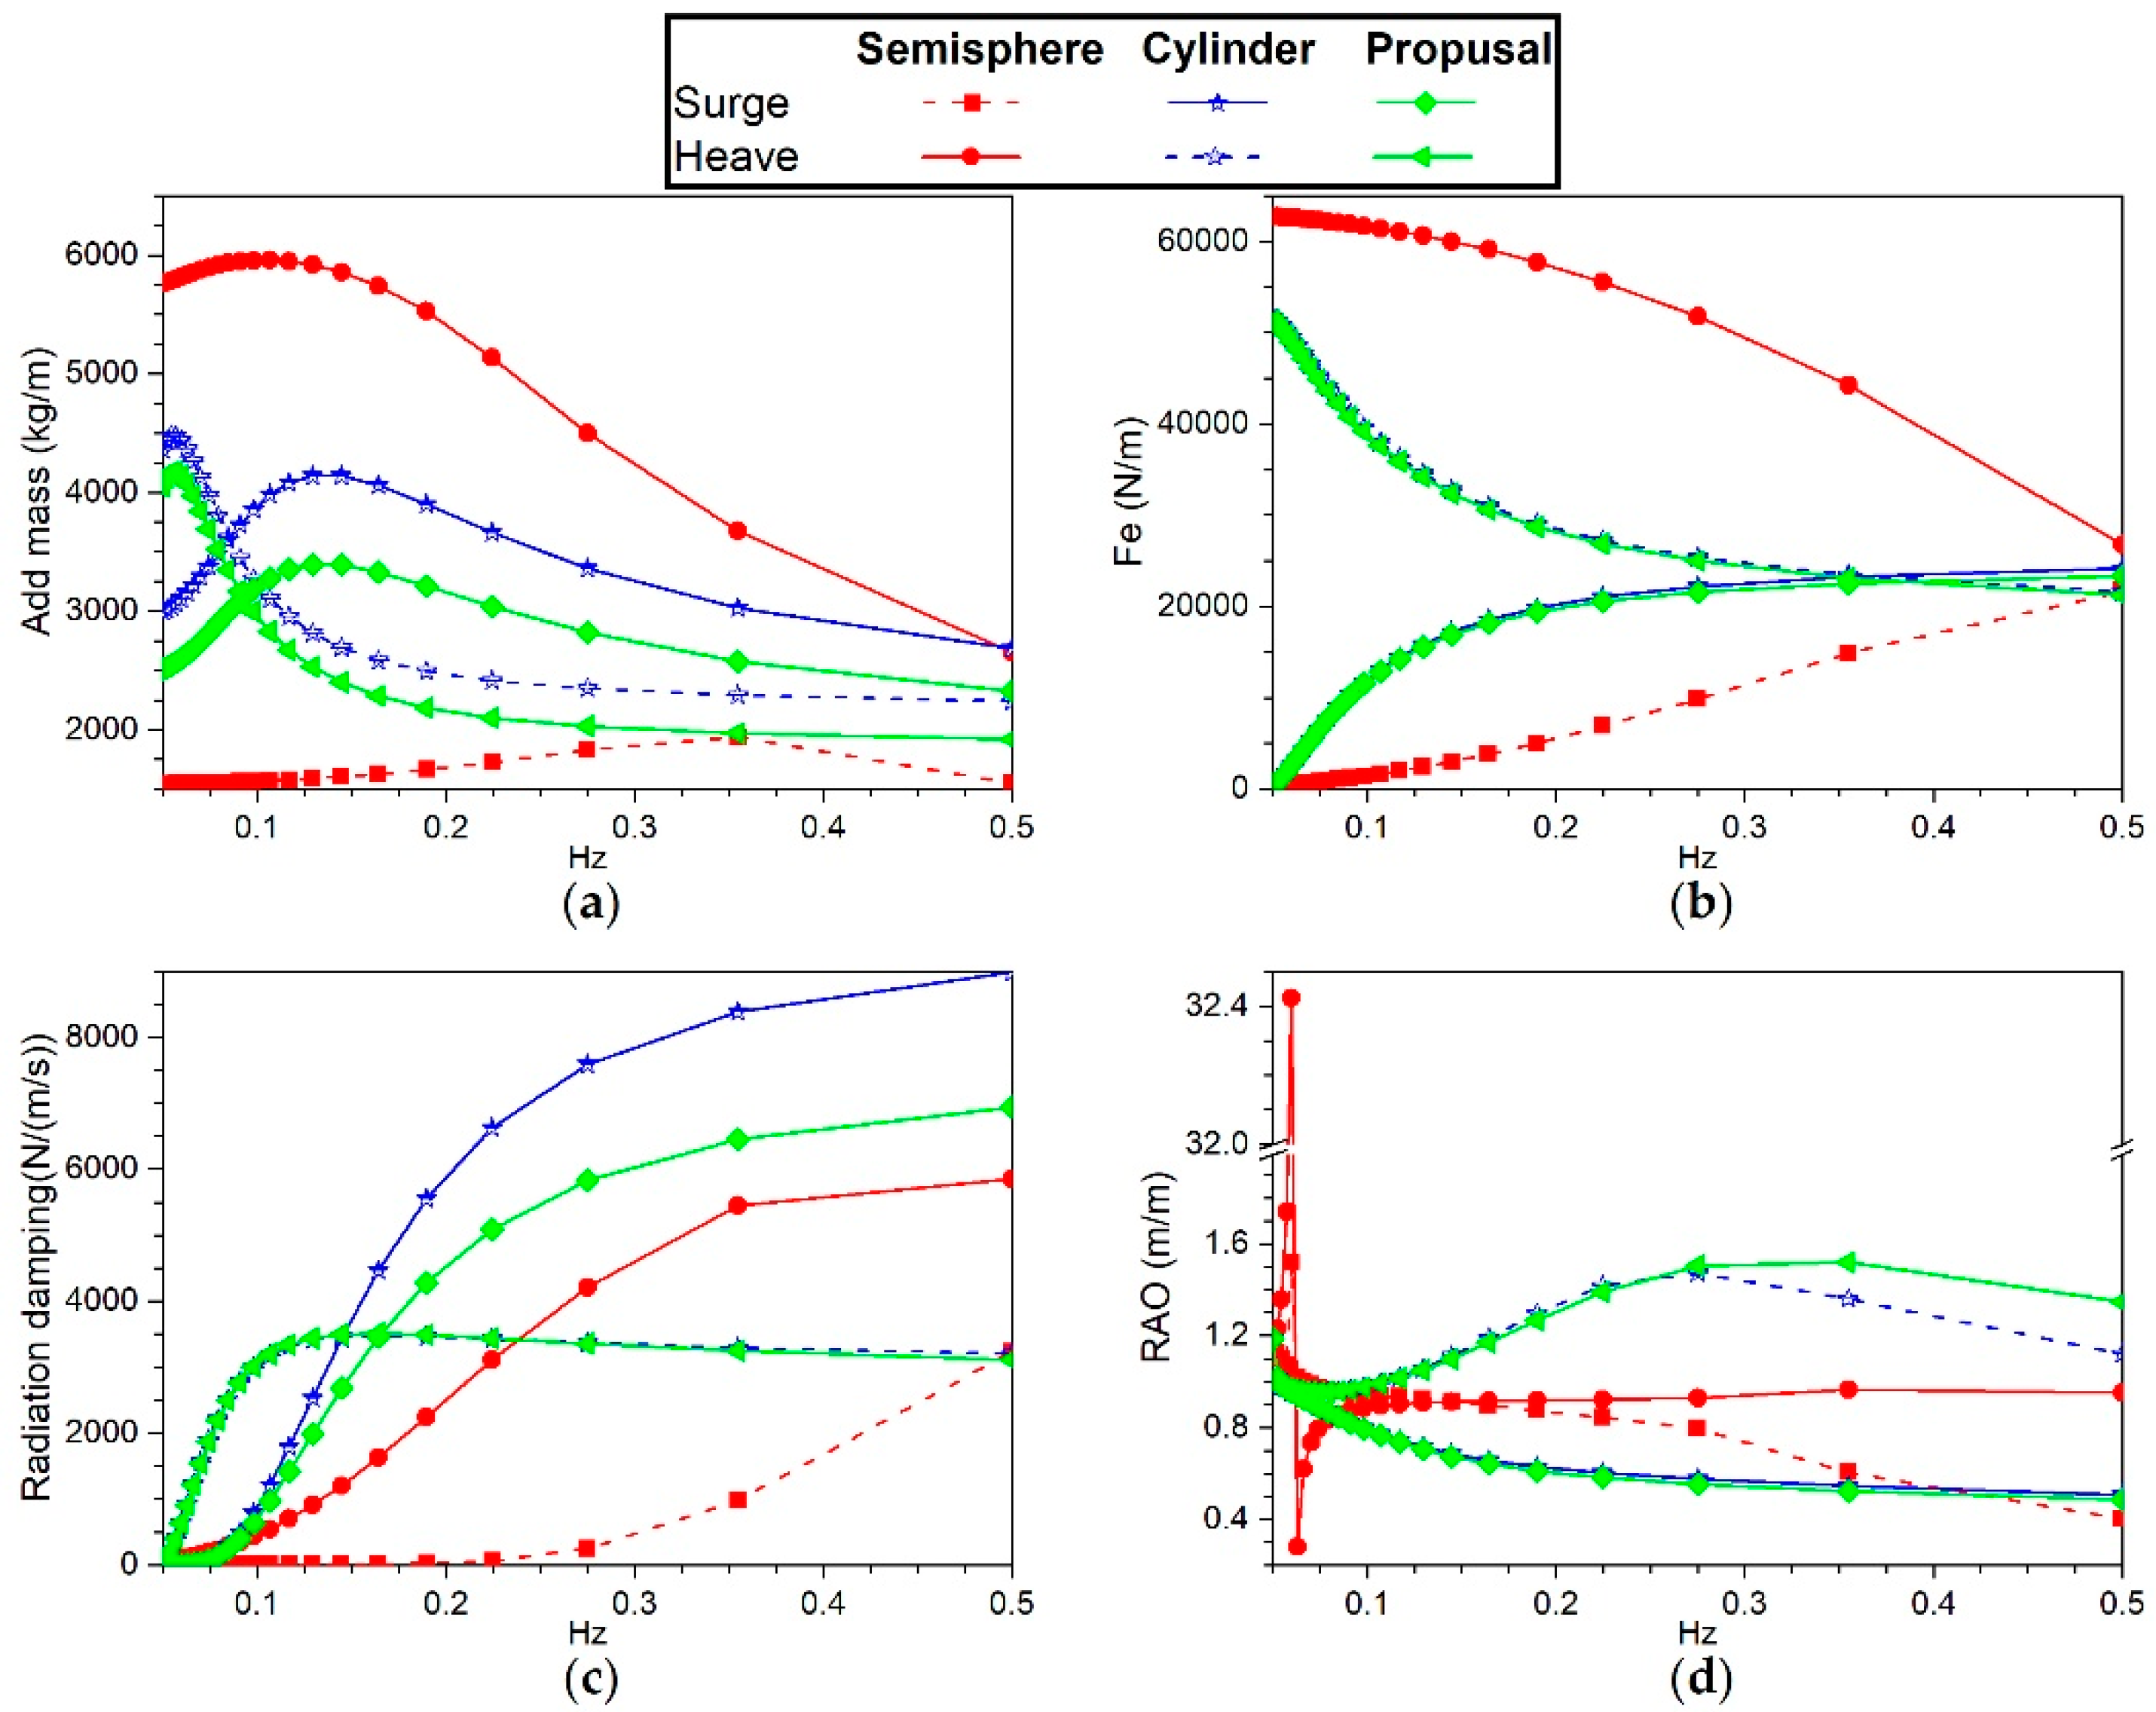
Figure 10 shows the numerical results obtained with ANSYS AQUA 19.2 for the three floating bodies analysed. Figure 10a corresponds to the variation of the added mass with respect to the analysed frequency of 0.05-0.5 Hz with a constant bathymetry of ha=30 m. It can be observed that the value of the added mass of the three bodies for the heave and surge movements reach a maximum value and then decreases as period increases. For the heave motion, the maximum value of the semi-sphere is 5955 kg/m at ω=0.107 Hz, followed by the cylinder 4476 kg/m with ω=0.054 Hz and then the proposed geometry with a value of 4170 kg/m with ω=0.057 Hz. The added mass physically represents an additional force that resists the movement; the intended outcome is that the value of this mass is as low as possible. In this sense, it can be observed that the proposed geometry provides less resistance to the movement. In addition, Figure 10a shows that for the heave motion of three geometries, high values of the frequency may lead to better device performance.
Figure 10b represents the variation of the excitation force throughout the frequency; it is observed that as the frequency decreases, the heave motion increases while the surge decreases. In addition, the semi-sphere reaches values ​​without significant changes from ω=0.125 Hz, while the other two geometries show similar behaviour. It is important to point out that this force is related to the amplitude of the wave; for this reason, it has units of N/m. It can be inferred that for high periods, the Froude-Krylov force is stronger, causing an increase in the vertical movement of the buoy and, as a result, in the angle within the x-y plane. This causes the translation speed to be greater than or equal to the electrical power generated.
Figure 10c illustrates the behaviour of the hydrodynamic damping coefficient. It can be seen that the coefficients of the semi-sphere decrease as the period increases. As the period increases for the cylinder and proposed geometry, the heave motion increases and eventually achieves a maximum value at ω=0.164 Hz before decreasing again, whereas the surge motion has almost the same behaviour in these two geometries. Therefore, this type of device would be recommended for long periods.
Finally, Figure 10d shows the response amplitude operator (RAO) of the buoy through the z-axis. It can be observed that the semi-sphere performs best at short wave periods, whilst the other two devices perform best at long periods. Point absorbers work best when the incident wave frequency matches their natural frequency, which for these geometries is around 0.056-0.061 Hz for the semi-sphere and 0.25-0.33 Hz for the other two.

3.3. Analysis in the time domain

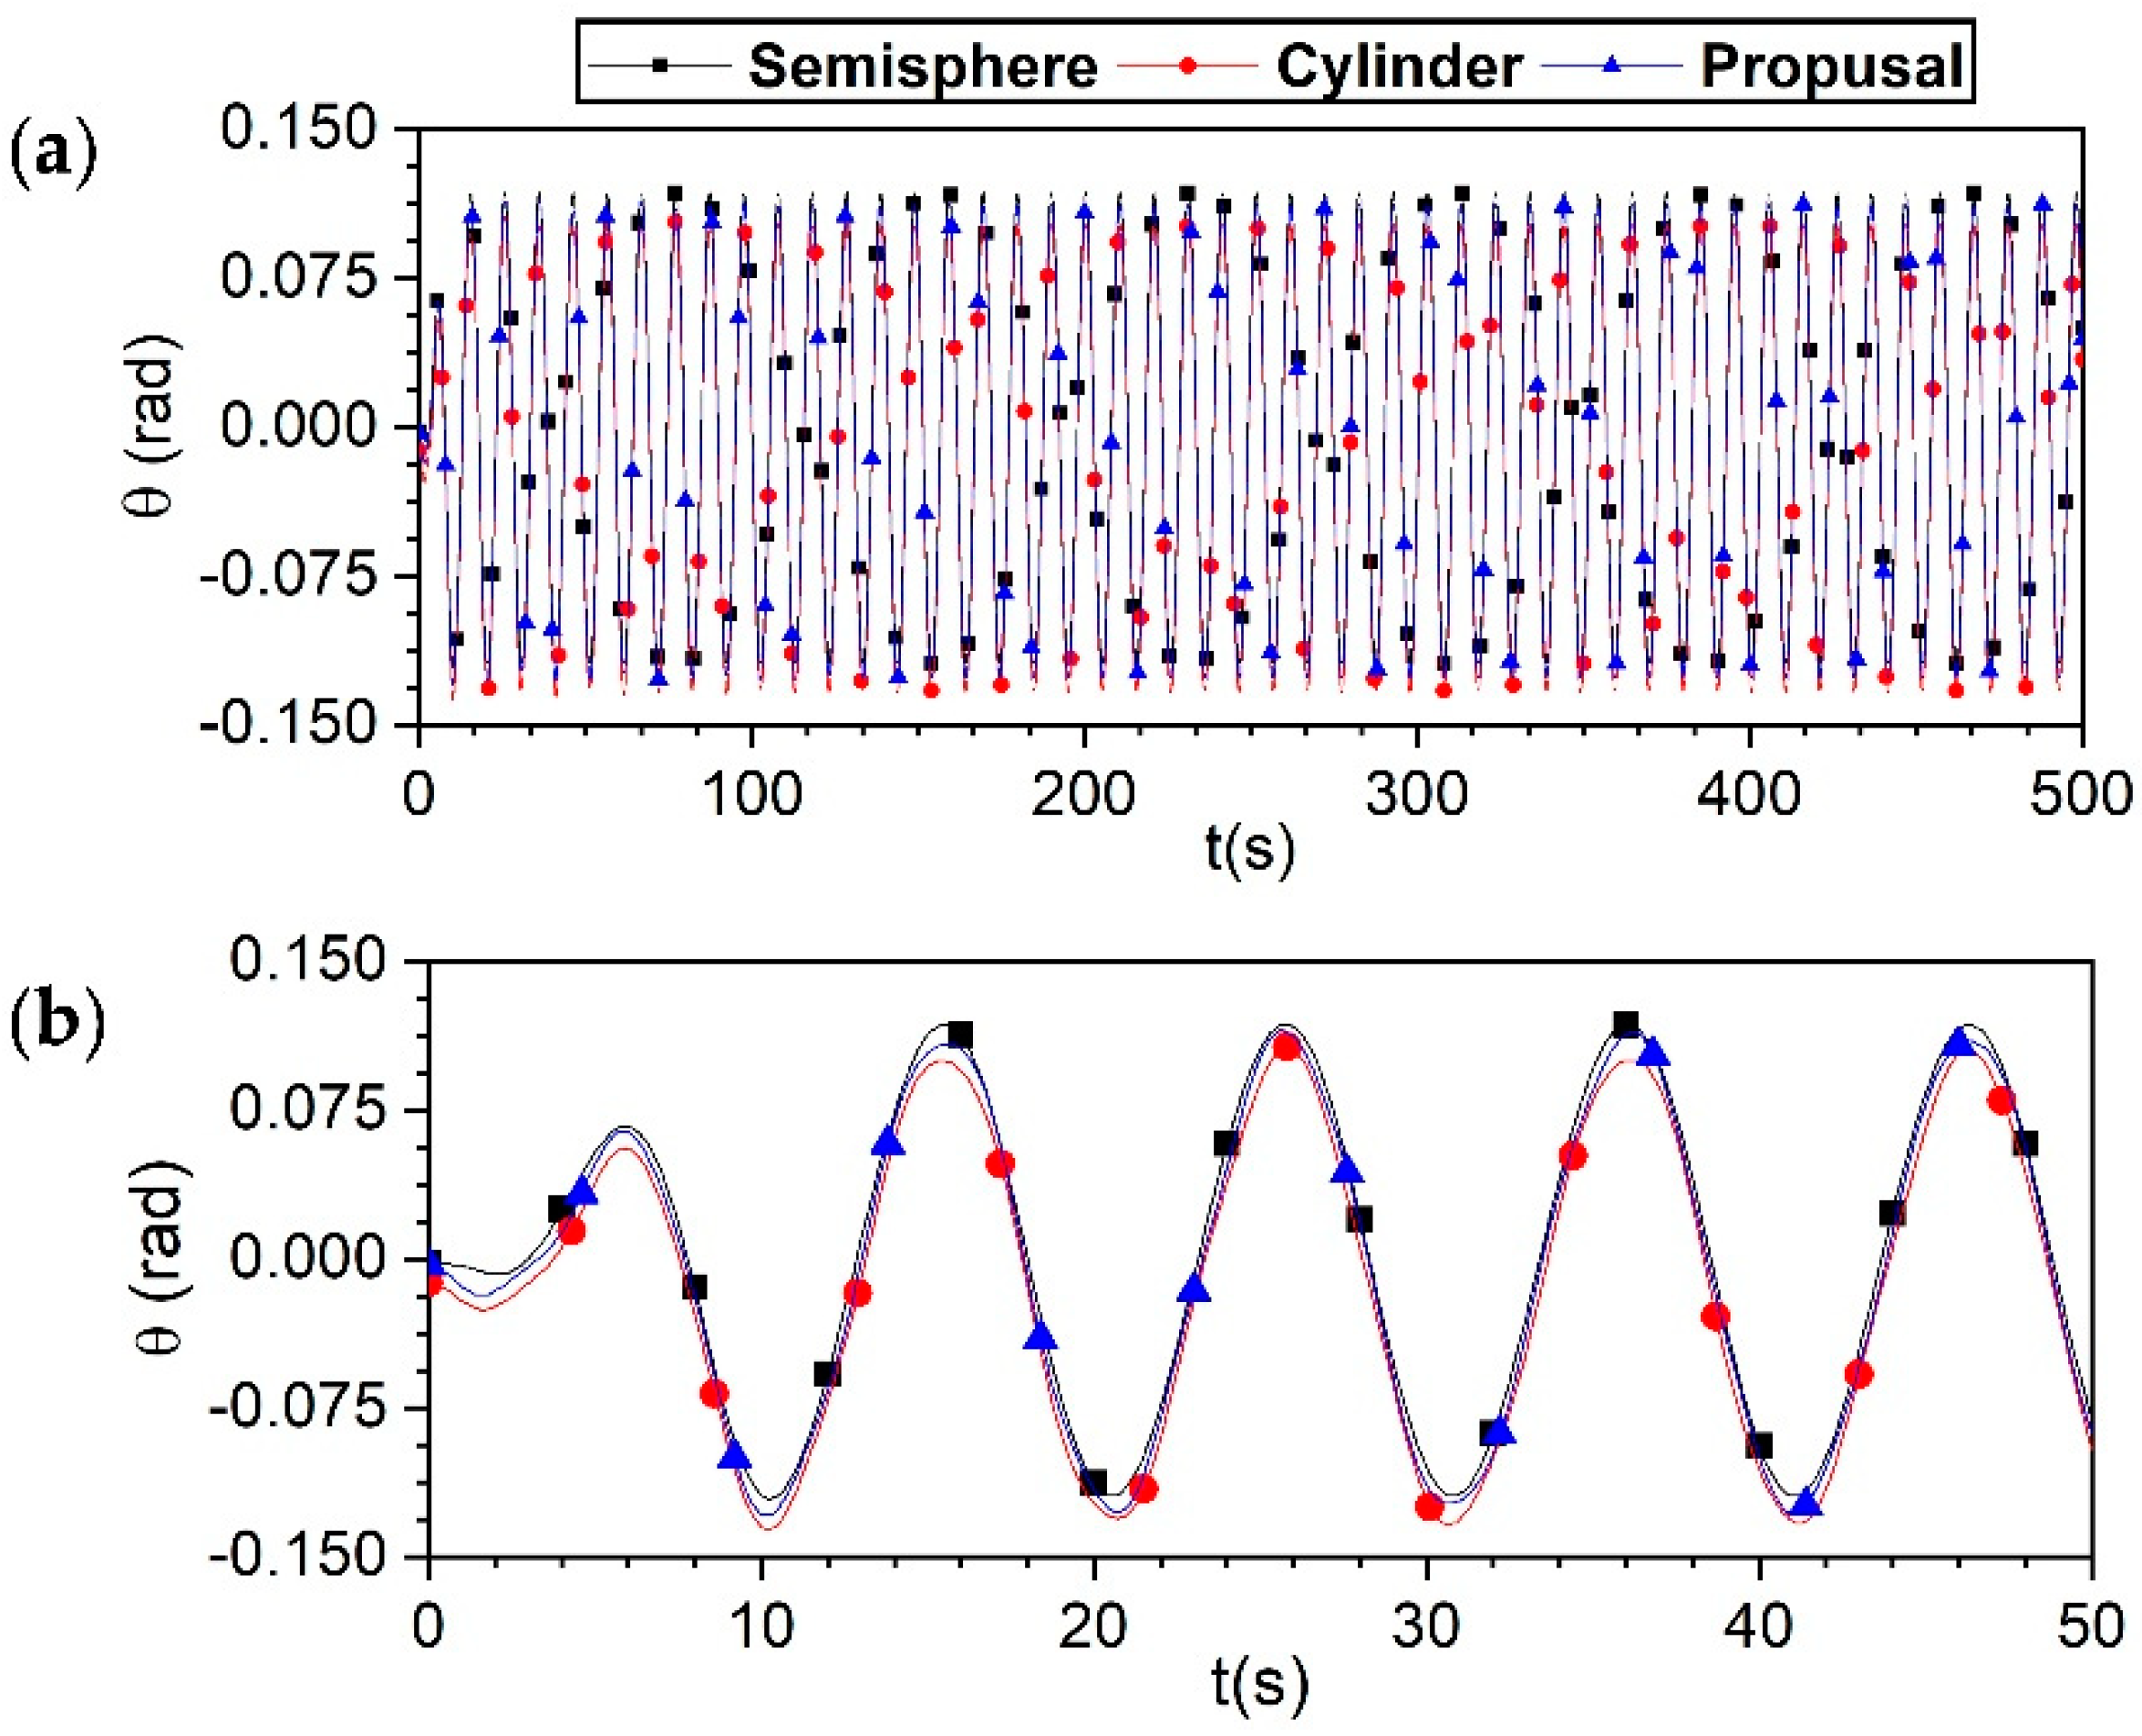
In this subsection, the findings of the hydrodynamic response in the time domain obtained by ANSYS AQWA 19.2 are provided. In these simulations, a duration of 500 s is considered for the analysis and comparison between the three geometries. The wave conditions were set to Hs = 2.2 m and T=10.27 s and β=0°. The first simulation enables the analysis of the system's behaviour under the influence of a second-order Stokes wave [53], with FPTO=0, a time step of ∆t=0.01 s, LI=50 m and LII=50 m. From the movement of the centre of mass, it is possible to determine the angular displacement in the rotation axis D. Figure 11a depicts the temporal evolution of the angular motion transmitted to the PTO for the three geometries investigated during the whole simulation duration, whereas Figure 11b depicts the first 50 seconds of simulation. It is observed that the angular displacement in the wave troughs and crests is larger for the semi-sphere geometry, while the cylinder has the opposite tendency, and the proposed geometry maintains an intermediate movement between these two. Furthermore, for the three figures it can be seen that when a crest occurs, it has more angular displacement than the trough since it does not have a damping effect from the water movement when ascending.
To determine the instantaneous power, equations (10) and (11) are used with the data in Figure 11:
P=Fv
F=m(g+a)
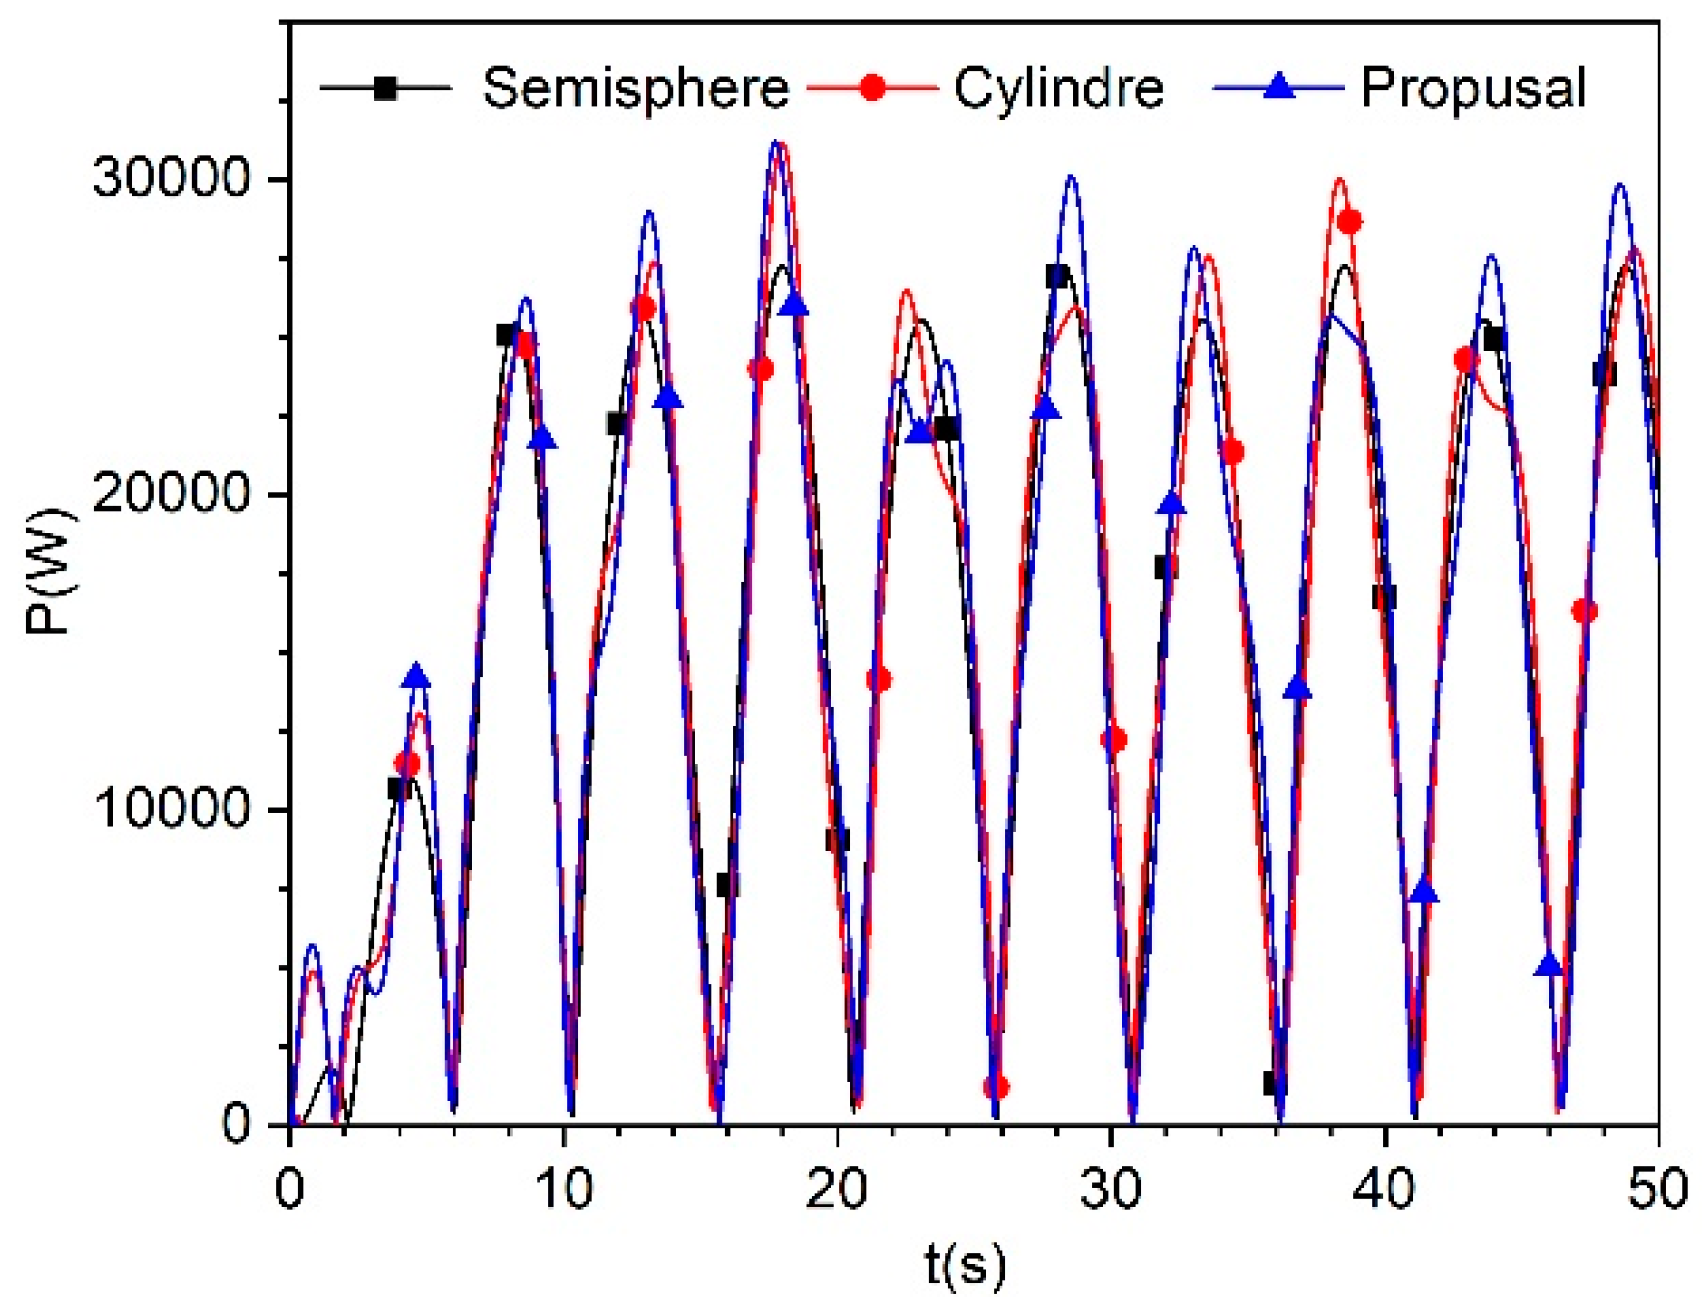
where P is the power, F the force of the body, v the speed, g the gravity and a the instantaneous acceleration. The behaviour of the power absorbed over time is then obtained for the analysed bodies represented in Figure 12 for the first 50 s. It can be seen that the absorbed power is variable over time, so it is necessary to determine a representative value. The average power achieved for the half sphere, cylinder, and proposed geometry was 14.98 kW, 15.8 kW, and 16.87 kW, respectively.
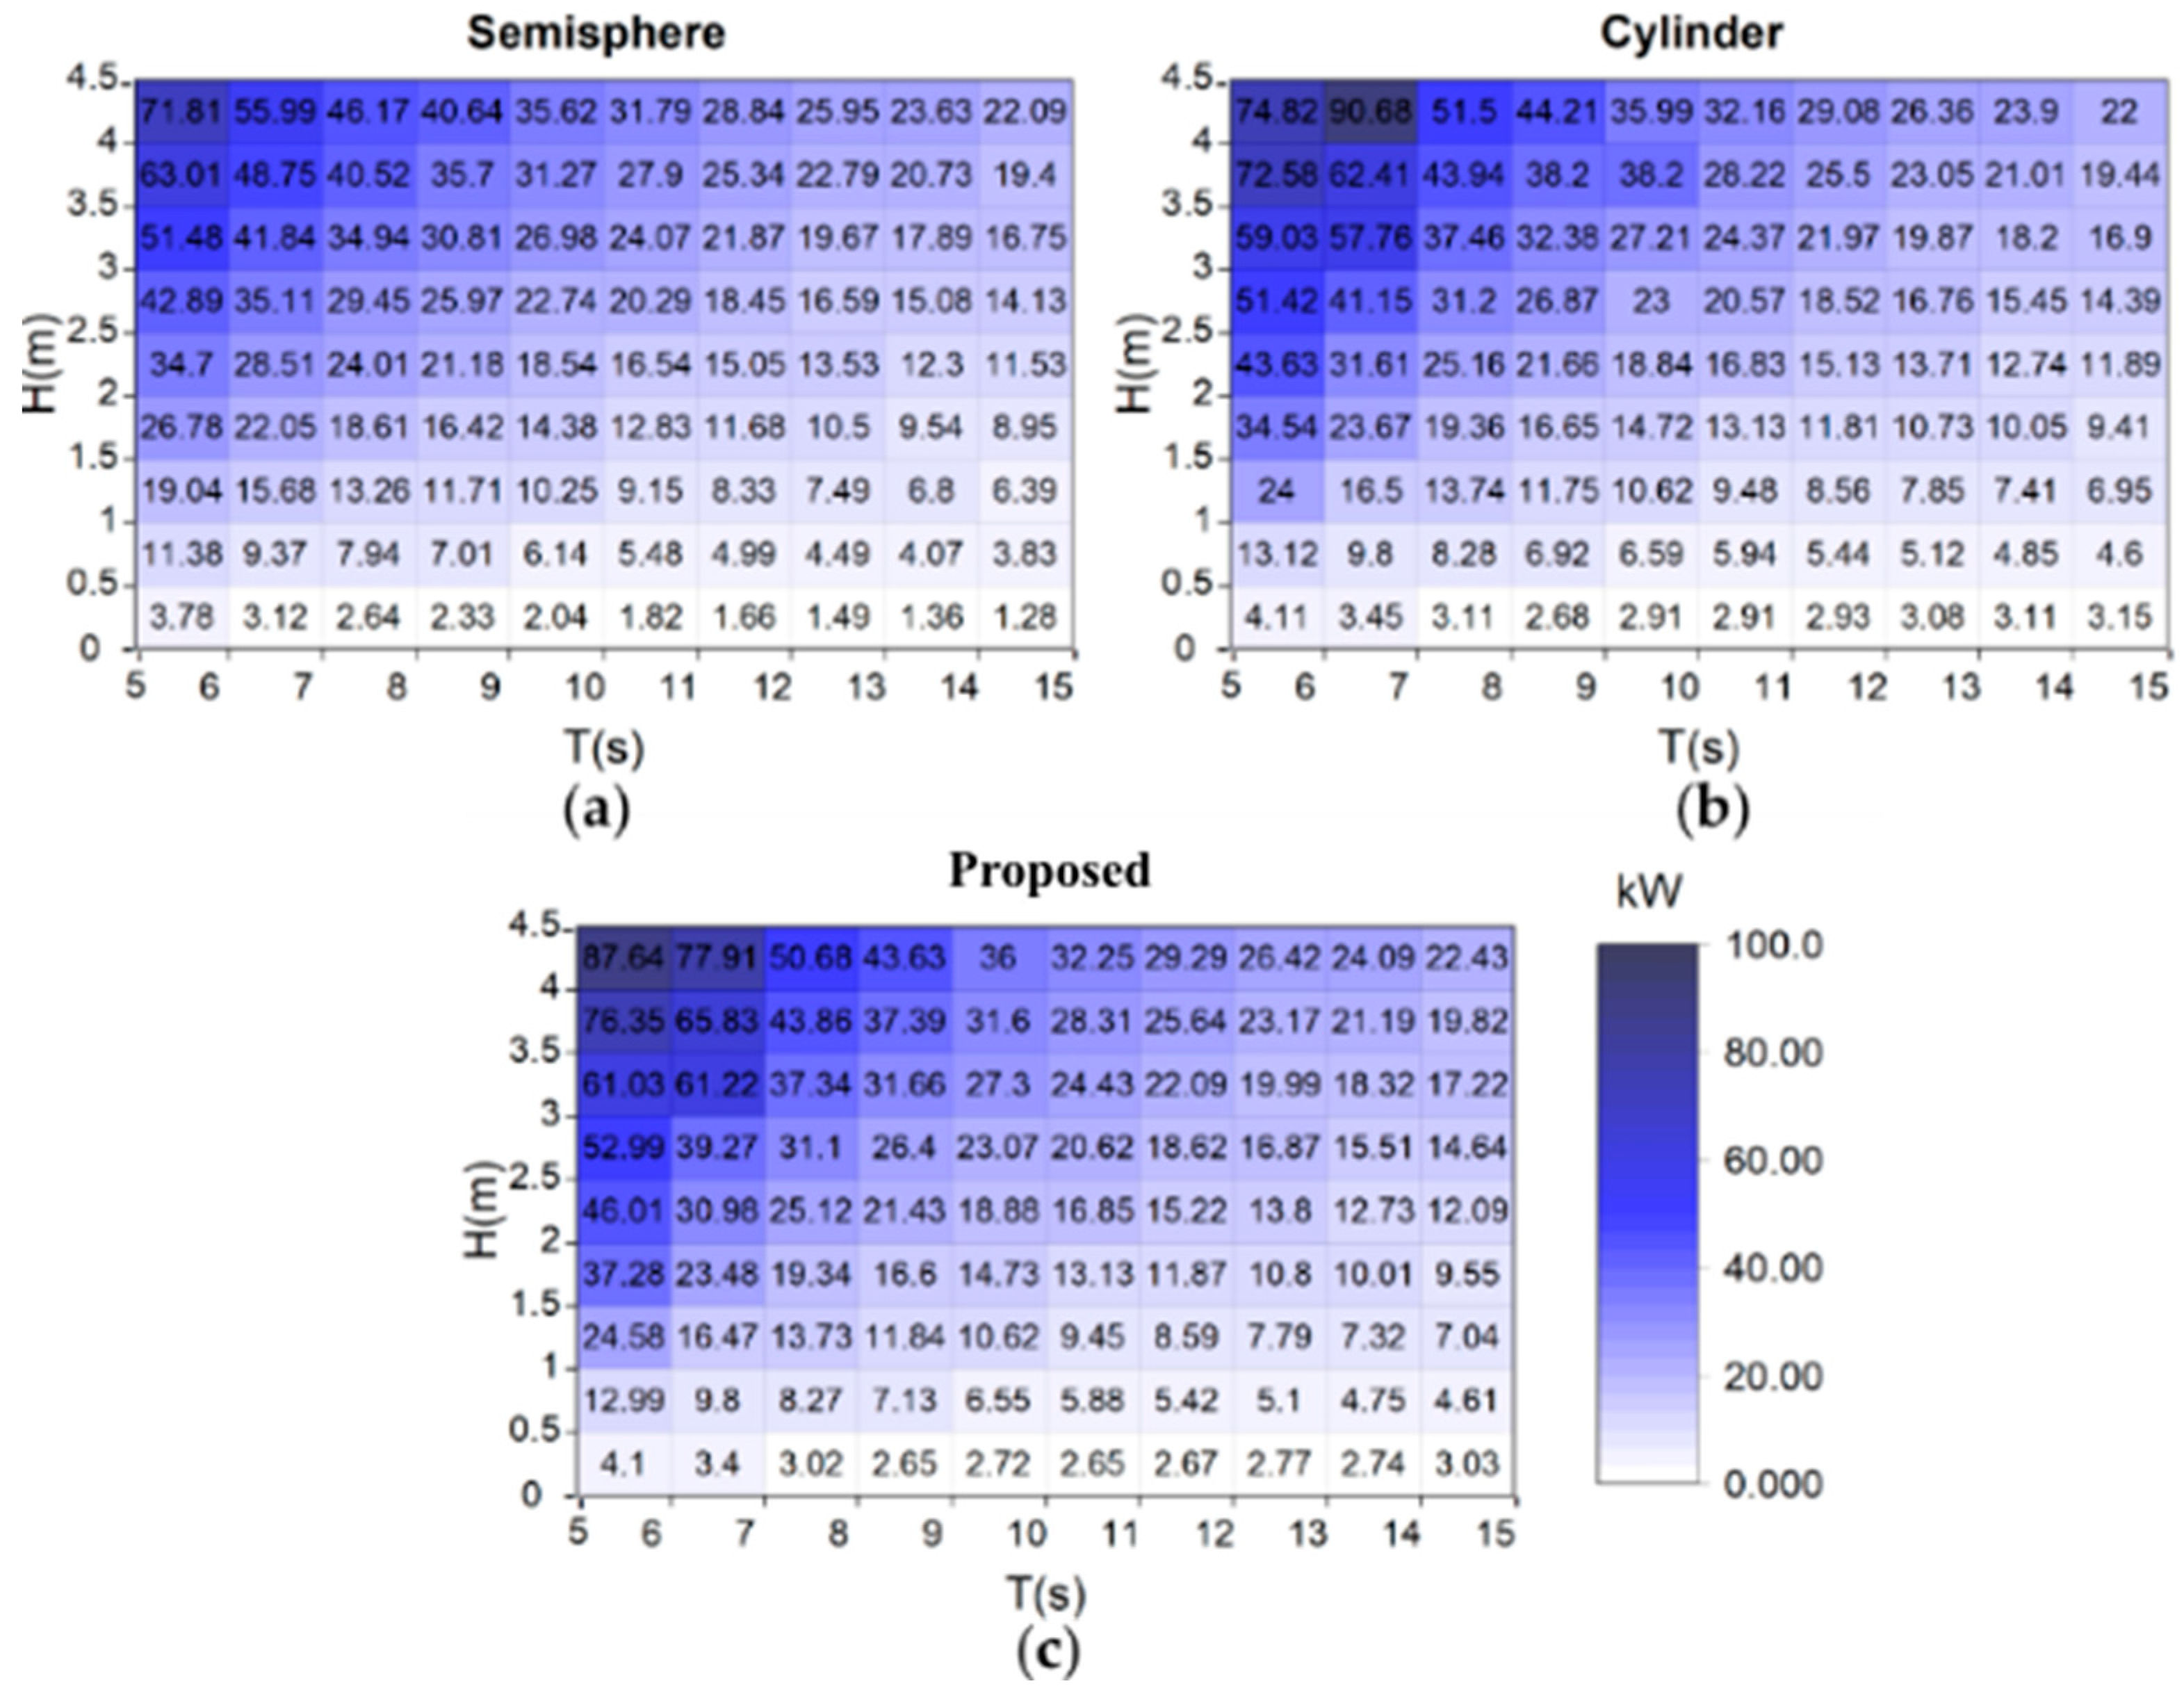
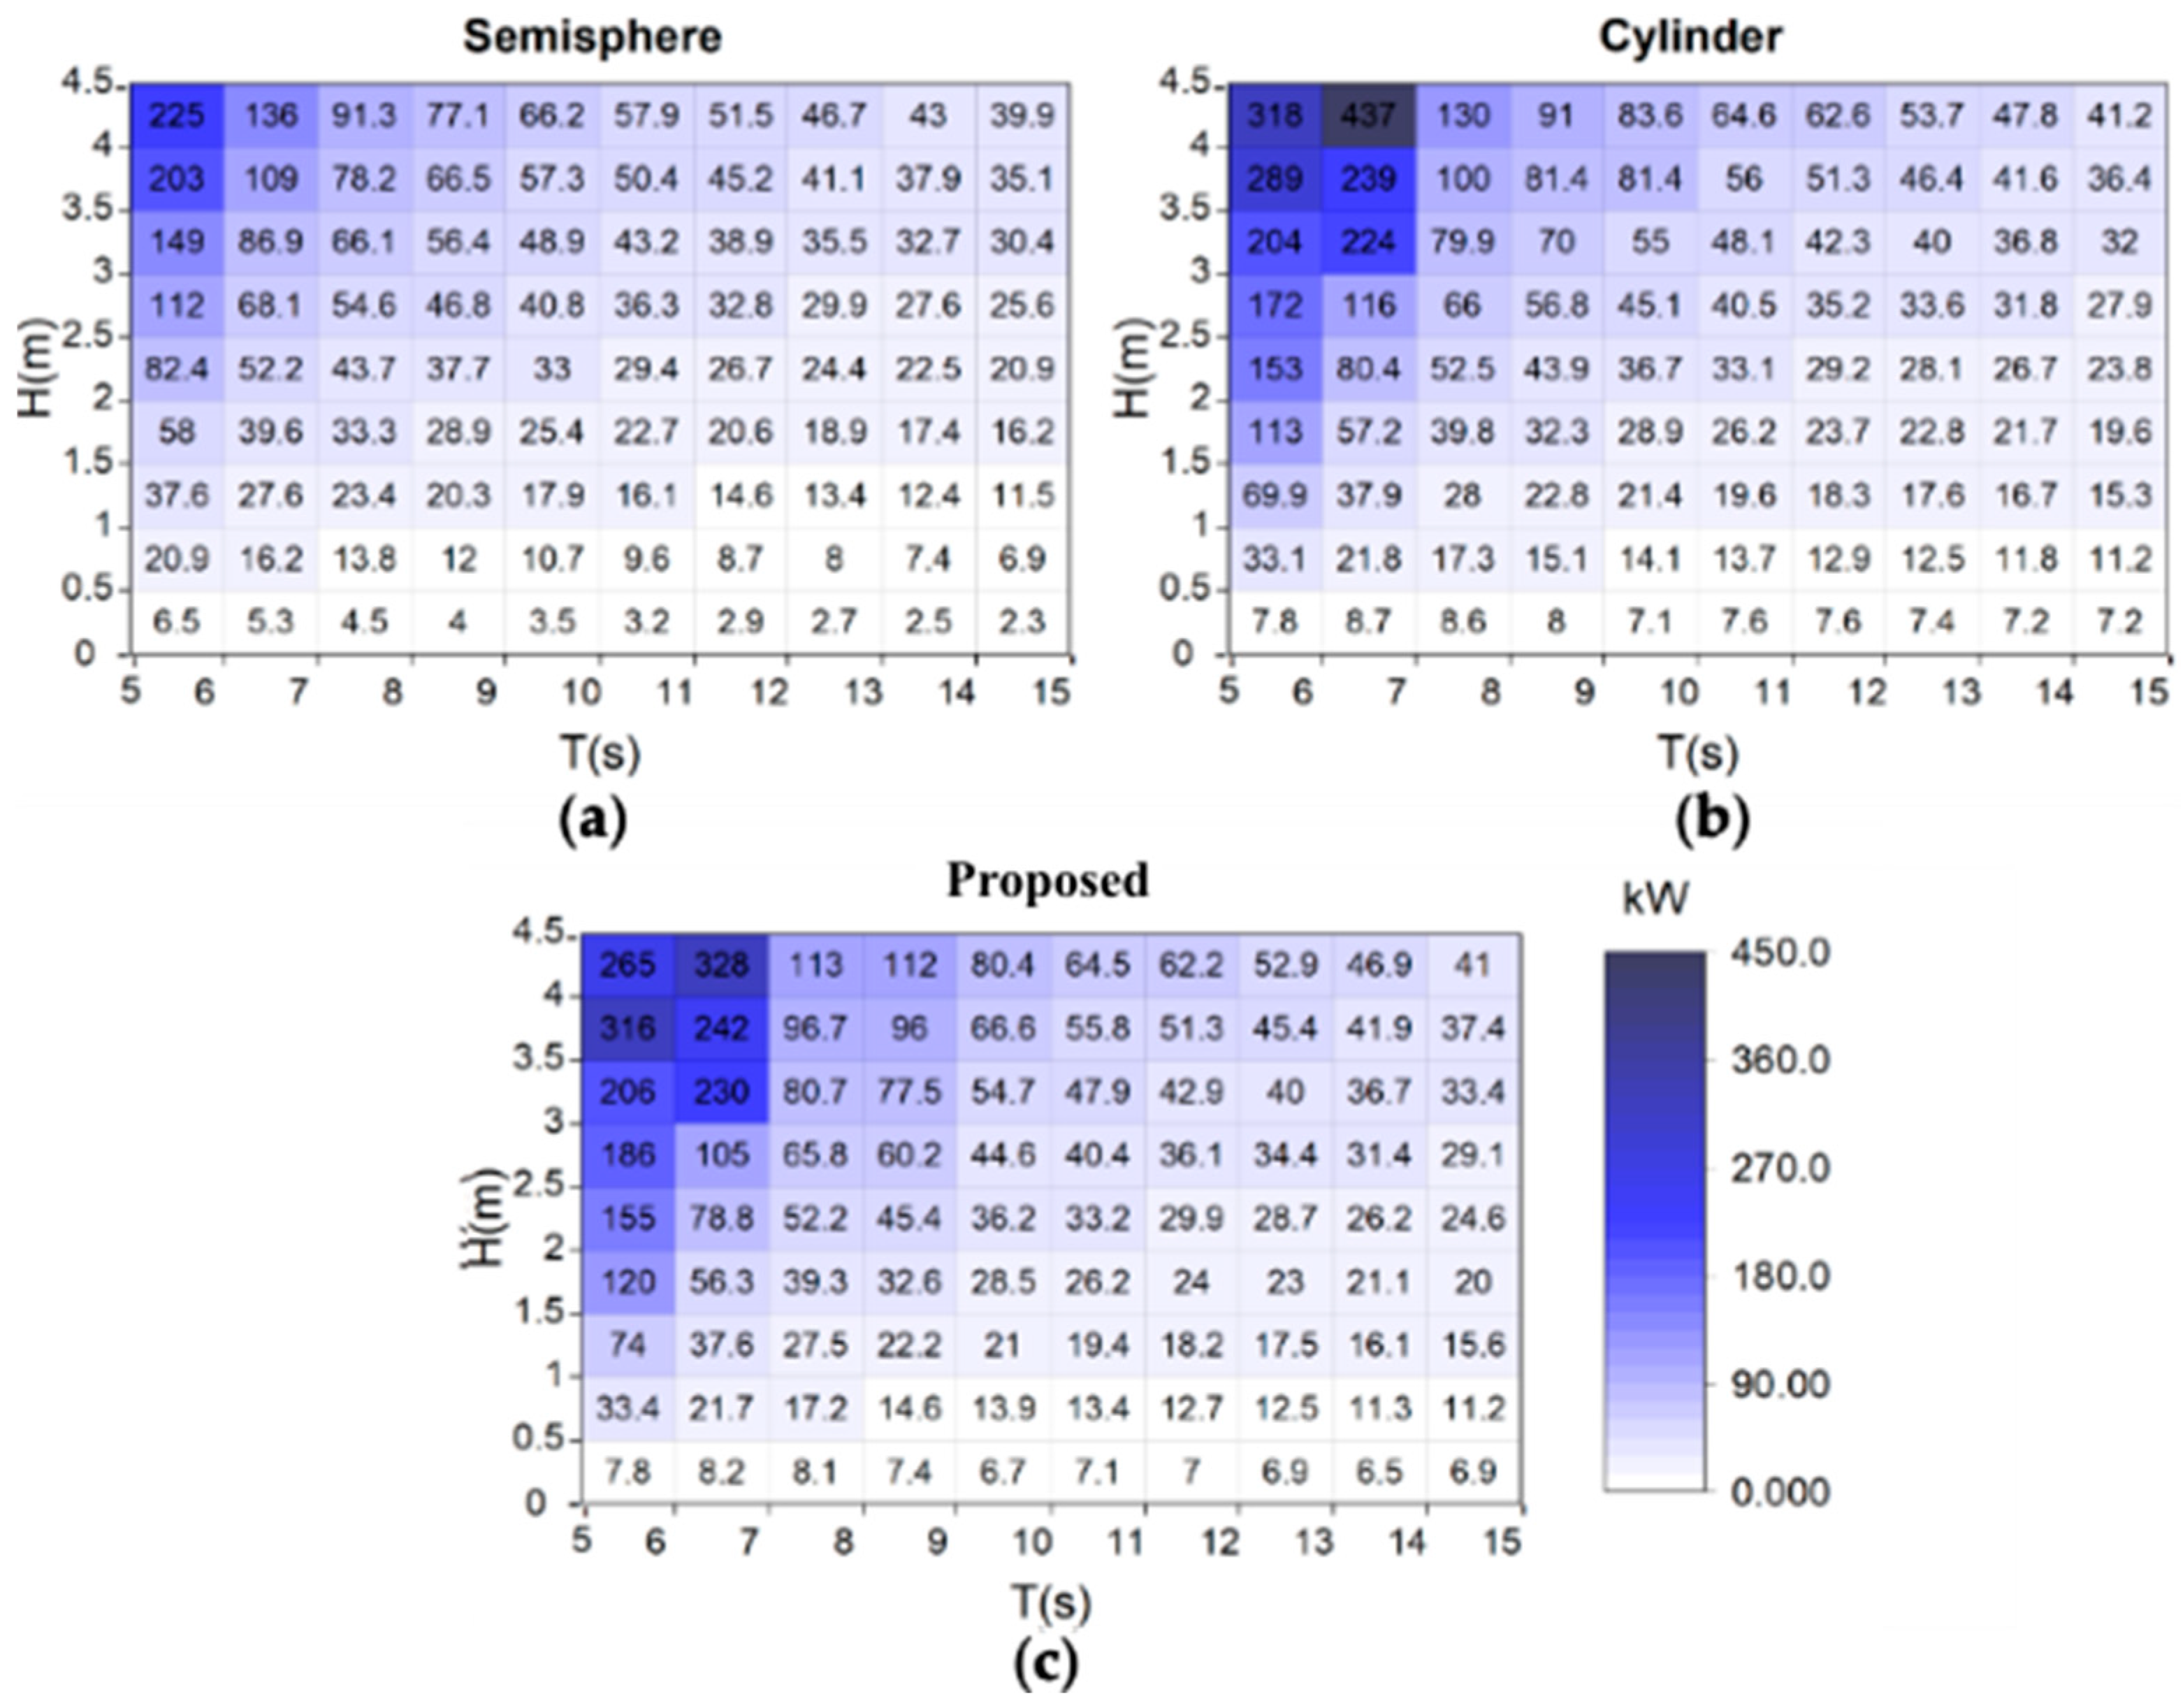
Figure 13 and Figure 14 show the matrices of the average and maximum power, respectively, of the three analysed geometries. These figures show the periods from 5 to 15 s with different wave heights in the range of 0 to 4.5 m with β=0°. For the three geometries it can be observed that for wave heights less than 0.5 m, the absorbed energy is less than 4.11 and 8.7 kW, for the mean and maximum average power, respectively. The greatest powers are found for periods of 5-7 s and wave heights greater than 3 m. For the average power, the one with the highest value is the cylinder with 90.68 kW, followed by the proposed geometry of 87.64 kW and finally the semi-spheres with 71.81 kW. The maximum power follows the same order but with the following values 437.7, 328 and 225.6 kW.
Table 4 compares the average power of each geometry analysed for different conditions. The first condition is for the significant wave height Hs, the next one is for the average power matrix (Figure 13) and the third one corresponds to more frequent wave conditions. It is seen that for the three cases the one that absorbs more power is the proposed geometry, followed by the cylinder and finally the semi-sphere. The average power for Hs with the proposed geometry is 10.88% larger than that of the semi-sphere. In the average power matrix, the proposed geometry increases 2.16 kW with respect to the semi-sphere and finally, for the average of the most recurrent conditions, the proposed geometry gives 1% and 2.71% more power than the semi-sphere and the cylinder, respectively.
Table 5 shows the seasonally significant wave height, the associated wave period and the average power generated, in kWh, of each geometry analysed according to Figure 13. It is observed that the most energetic sea condition occurs in winter, followed by autumn, spring and finally summer. However, the season of the year with the highest production in autumn, followed by winter, and finally spring and summer with the lowest generation. The percentage difference between autumn and spring is 15.02%, 14.33% and 14.39%, while for winter and spring is 4.65%, 2.78% and 2.32% for the three analysed geometries semi-sphere, cylinder and the proposed one, respectively. Furthermore, this table illustrates the energy output throughout the year, and that of the three geometries presented, the one that can collect the most energy is the one proposed, followed by the cylinder, and lastly the semi-sphere. The same occurs in the annual power, having an annual difference of 2.59 MW between the proposed geometry and the semi-sphere.
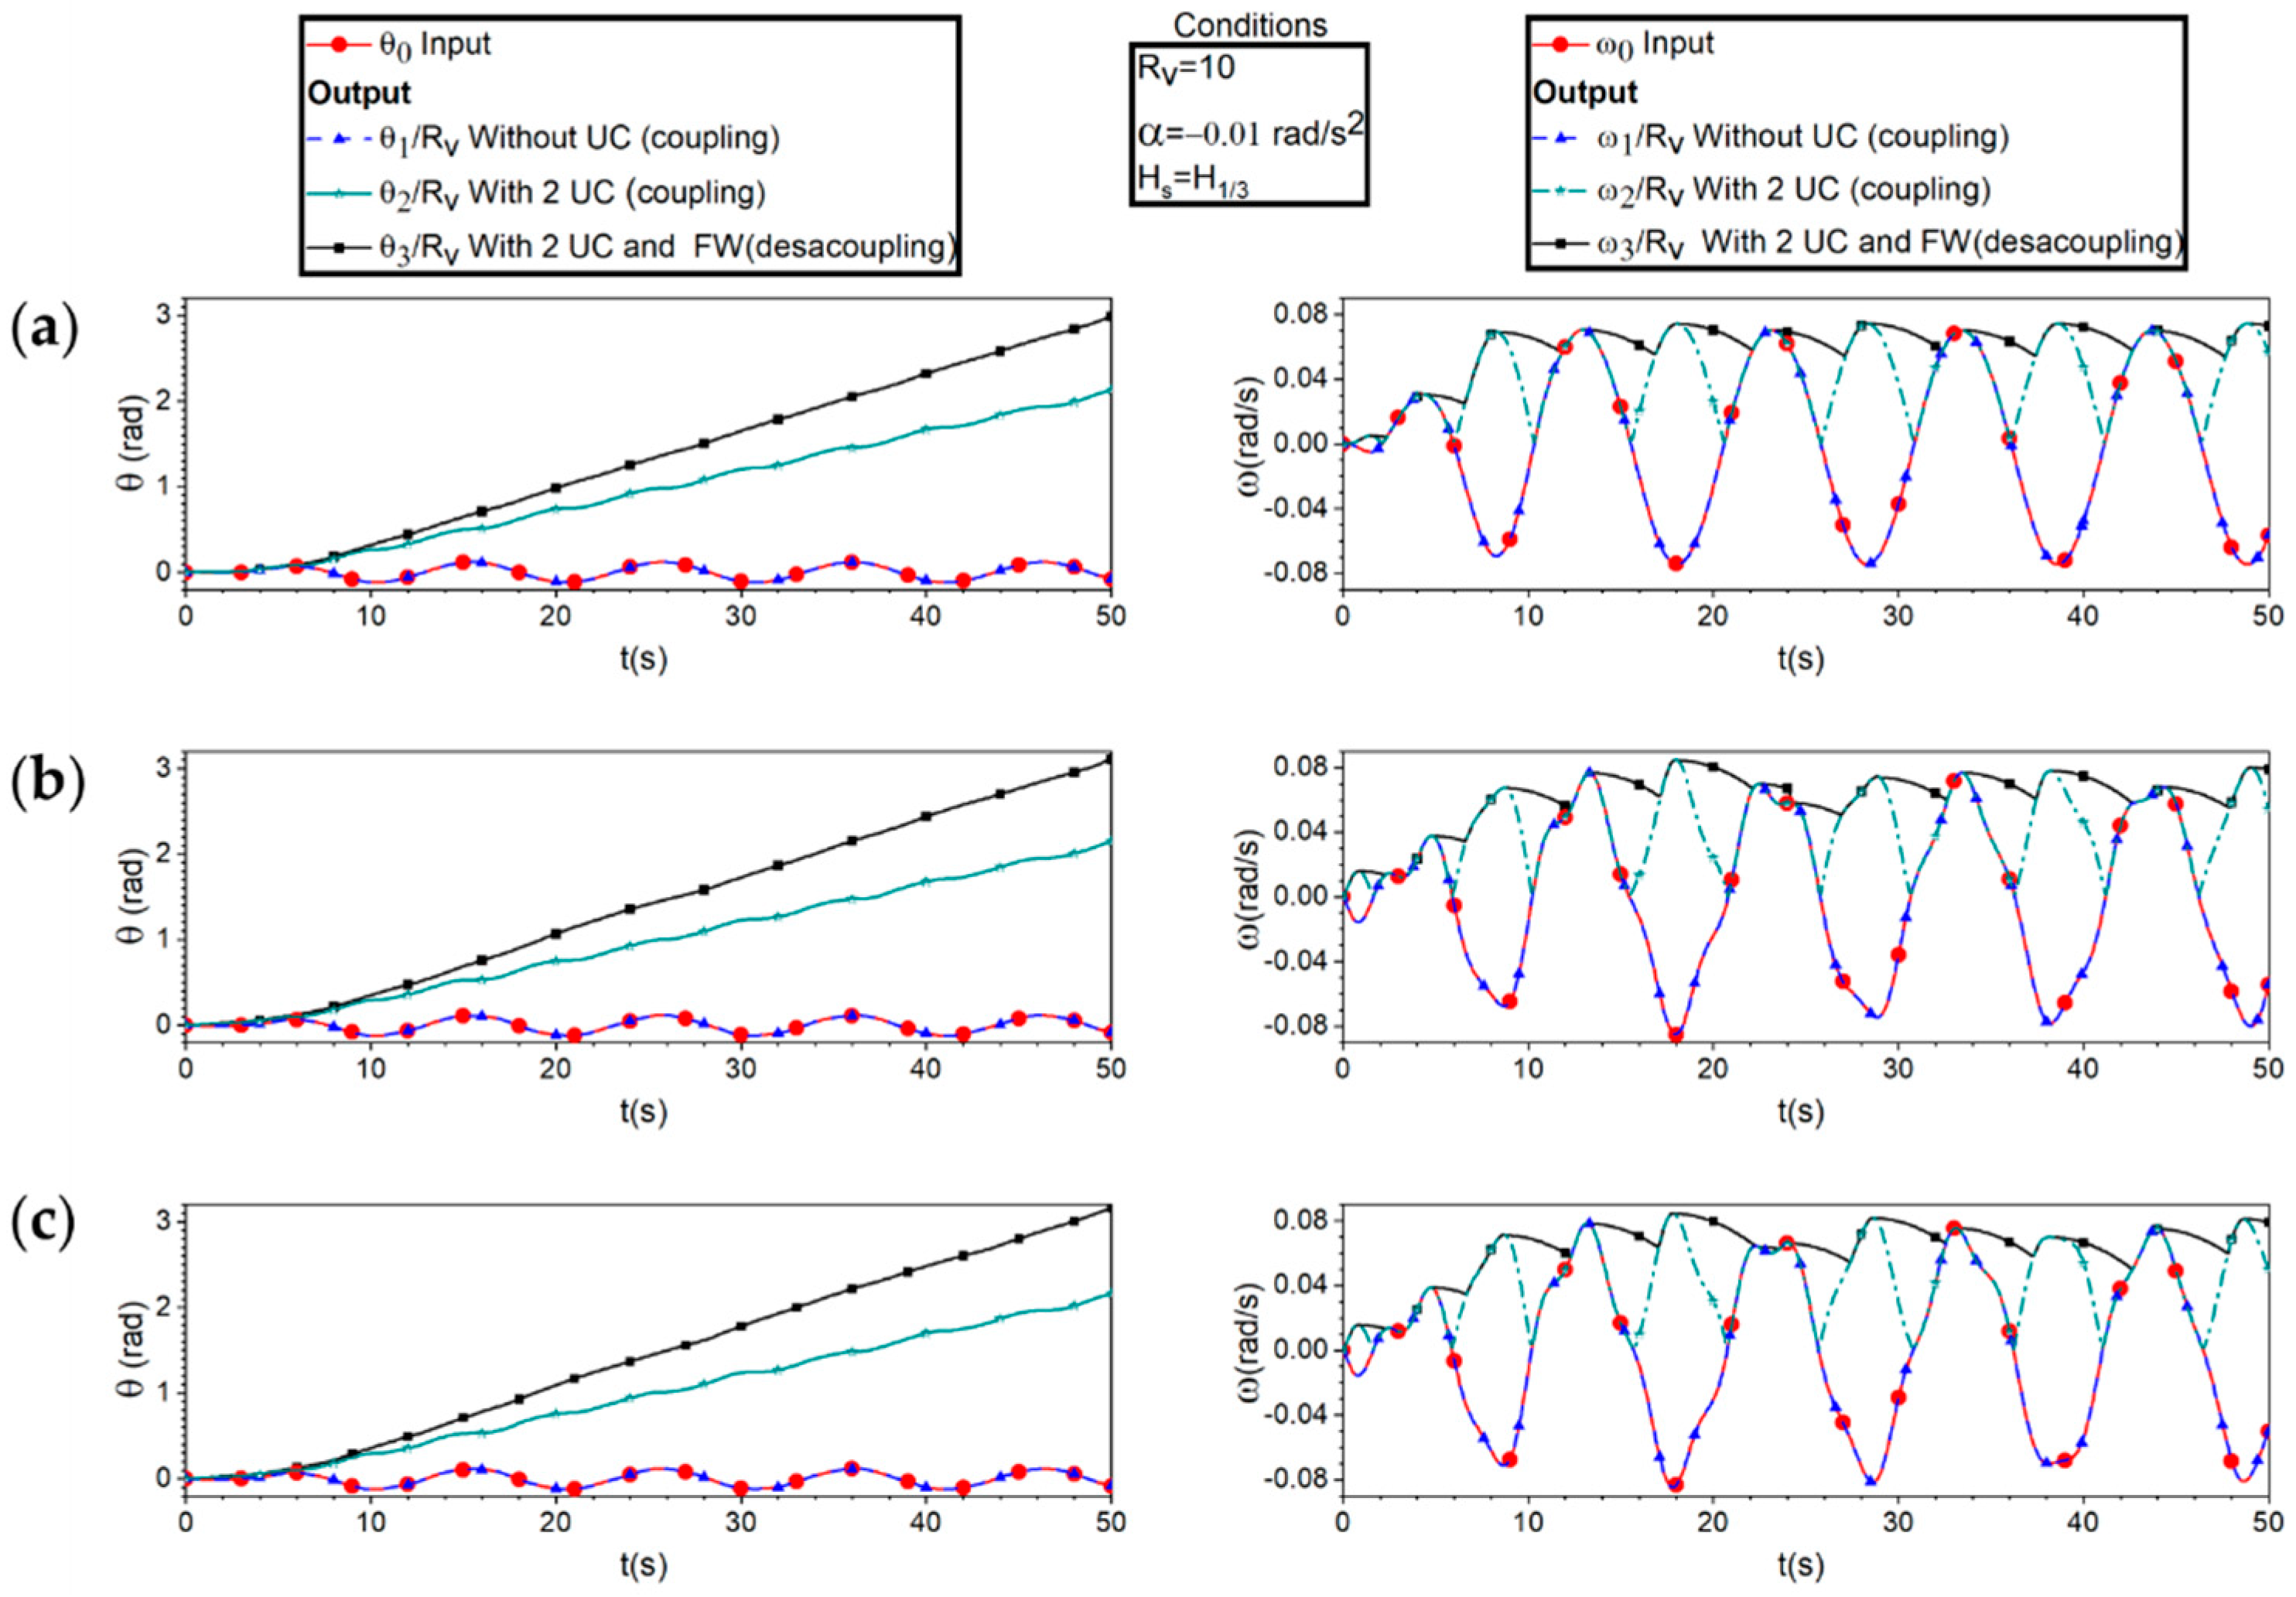
Once the dynamics at the PTO inputs are known (Figure 6), the transmission designed for the three studied floats is evaluated by applying Equations (6)-(9), with a speed ratio RV=10, α=-0.01 rad/s2and the conditions of Hs at 33.33%, Table 1. The results are shown in Figure 15 and only the first 50 s of the simulation are shown. The left column corresponds to positions and the second to angular velocities. These last two variables are compared to the input and three output cases; the first output is without UC and is coupled, the second with two UCs and is also coupled, and the third is with three UCs and is uncoupled. In general, it can be seen that in the first case, only the gearbox serves to increase the rotation speed, so that at the PTO output it has almost the same behaviour, but with RV amplified as much as the position and angular velocities oscillate. This could be a disadvantage for the generator that it will have to constantly change the direction of the magnetic fields.
One advantage of the second situation when ω≥0 is that ω will only be positive and the generator will always be moving in a single direction, causing the position to progressively grow. For the last case, a UC has a flywheel that absorbs movement in the form of kinetic energy, which is employed so that when the PTO speed begins to decrease, the flywheel may be uncoupled and the generator is continued going, and this does not exceed ω =0. As a result, the final proposal will be examined in greater depth in this study, as it is the most ideal for keeping the electric generator going, which translates into relatively constant electric energy, further information can be found at [54].
Of the three geometries, the first to reach its steady-state was the semi-sphere at 20 s, then the proposed geometry at 110 s, and finally the cylinder. In the transient stage, the velocities fluctuate between 0.054-0.076, 0.053-0.084 and 0.05-0.084 rad/s, while in the steady-state they range between 0.056-0.076, 0.052-0.074 and 0.053-0.077 rad/s, for the studied semi-spheres, cylinder, and proposed geometry, respectively.
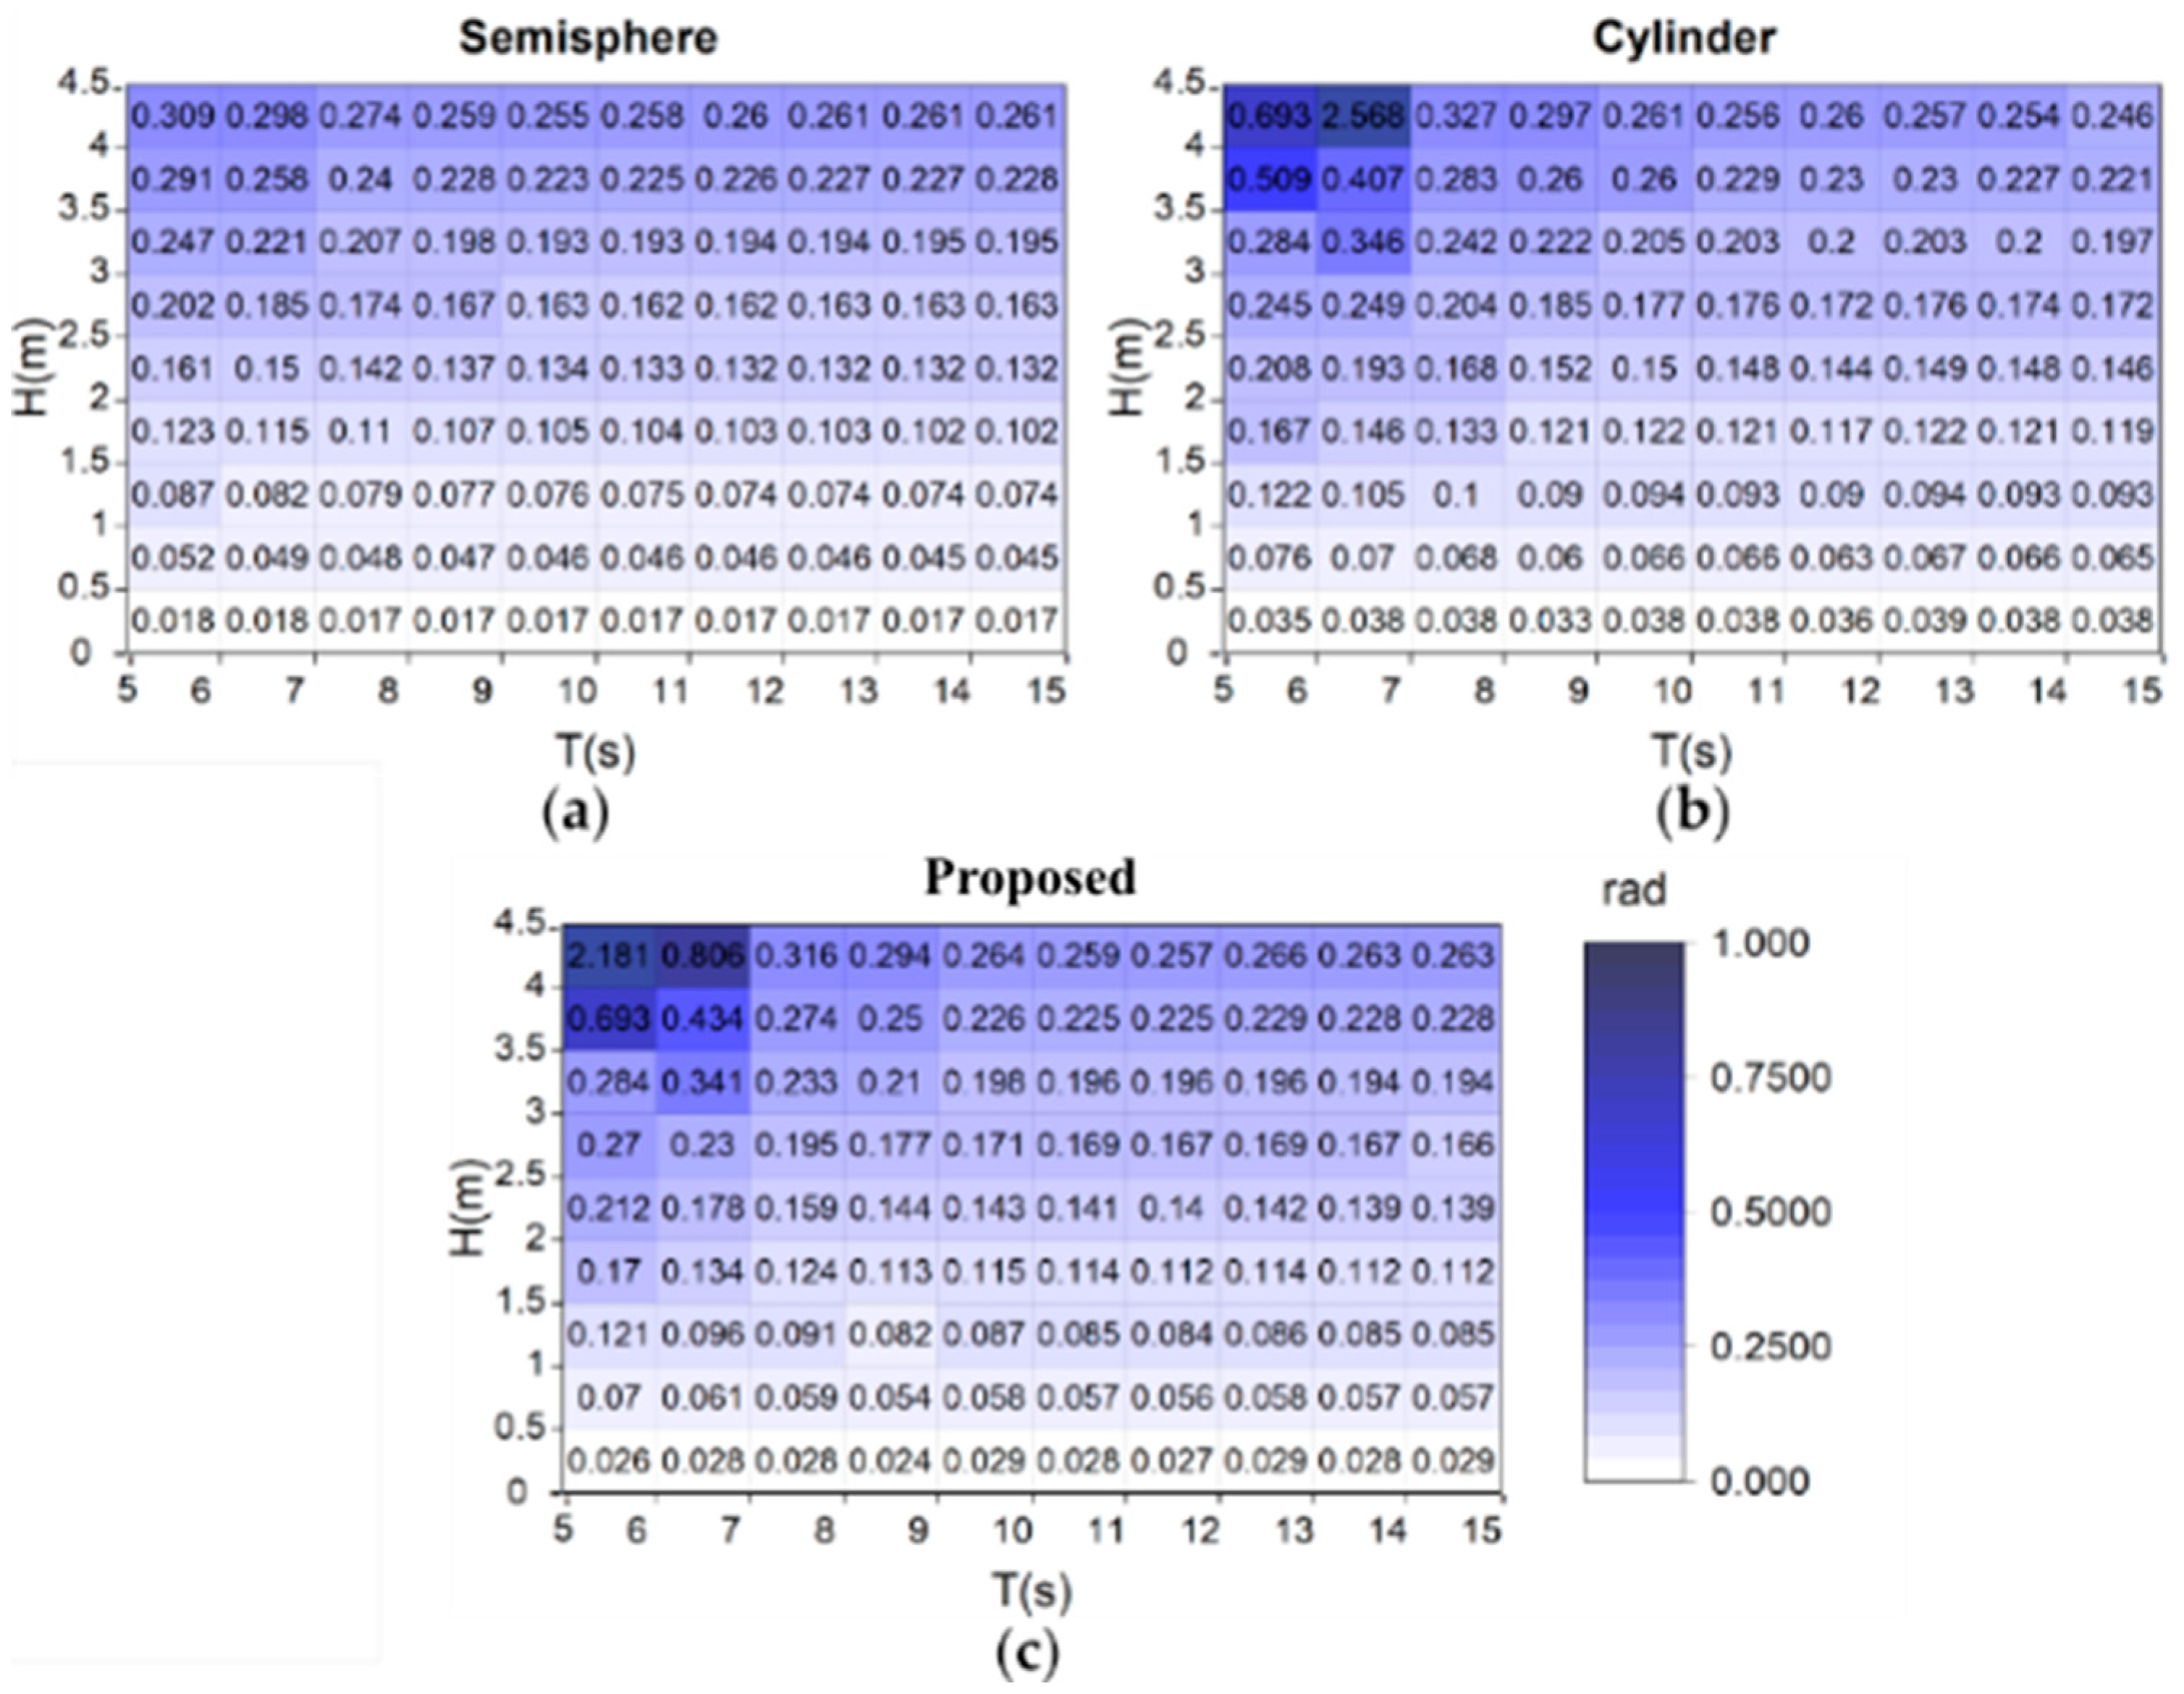
Figure 16 shows the matrix of the maximum angular displacement, in the range of T= 5-15 s and H ranging from 0-4.5 m and divided into intervals of 1 s and 0.5 m, respectively. The following trends are generally observed in the three study cases: for small wave heights less than 0.5 m, the displacement is minimal no matter the wave period, and as the height increases, the angle also increases. Furthermore, for H>1 m it is observed that as the period increases, the movement is reduced, with the greatest displacement taking place when H>3 m and T=5-7 s. In this regard, the semi-spheres has the smallest displacement movement (0.017 rad) while the cylinder has the highest (2.556 rad). In Figure 16a, which corresponds to the semi-spheres, its smallest values occur at H<0.5 m when T>7 s, while the highest occurs at H>4 m between 6-7 s.
Figure 16b shows the maximum angular displacement matrix of the cylinder. Here, it is observed that the angles range between 0.038-2.56 rad and that the maximum angle significantly increases compared to the rest of the values, so it can be inferred that it is close to resonance at T=6-7 s and H=4-4.5 m. Figure 16c shows the maximum angular displacement matrix for the proposed geometry. This figure shows that the values range between 0.026-2.18 rad, with the largest angle close to the resonance between H=4-4.5 m and T=5-6 s. Furthermore, by comparing the three geometries, the one with the greatest angular movement is the cylinder with 0.148 rad, followed by the proposed design with 4.7% less and finally the semi-spheres with a difference of 0.015 rad. Thus, the one with the greatest angular movement is the cylinder.
Finally, Table 6 shows the maximum angular displacements in each season of the year for the analysed WECs obtained from Figure 16, as well as the annual average of that movement. The one that presents the greatest movements in the four seasons of the year is the cylinder, followed by the proposed geometry and finally the semi-sphere. It is also observed autumn is where the maximum values are presented for the three geometries with values of 0.148, 0.143 and 0.133 rad. Regarding the annual average values, there is a difference between the cylinder and the semi-sphere and the proposed geometry of 12.84% and 8.21%, respectively. These displacement values aid in the right selection of the electric generator, specifically knowing at what revolutions it must function.

4. Conclusions

The performance of three different floating body geometries for a point absorber WEC was studied under the wave conditions at Ensenada, Baja California, Mexico. Two of the geometries were conventional (semi-sphere and cylinder), while the third was proposed for this research.
The initial analysis was done in the frequency domain, analysing the system's primary forces such as added mass, excitation force, radiation damping, and RAO. It was found that in short wave periods the waves are more interesting from the energy harvesting point of view, since the three geometries absorbed a greater amount of energy, with the semi-sphere reaching resonance between wave periods of 16.5 to 17.5 s.
The second analysis was done in the time domain, which allowed us to adequately test different sea states and thus see the WEC dynamics together with the force available at each instant of time. When comparing the three geometries analysed, it was found that the most efficient is the proposed one, which resulted in 12.6% more efficiency than the semi-sphere and 6.7% more than the cylinder. Furthermore, using the WEC temporal data, the dynamics of the PTO transmission could be evaluated, and it can be stated that the mechanical transmission proposed is a good option for wave-type energy converters whose dynamics are exposed to the oscillatory movement of waves. For the proposed geometry, there is only one output direction, and at low speeds, the mechanism can decouple such that the flywheel continues to move owing to the stored energy, resulting in a more stable rotational movement for the flywheel generator.
The season where the greatest energy capture occurs in autumn, followed by winter, spring and finally summer. When estimating the annual production of electrical energy, 132.52, 134.83 and 135.11 MWh were obtained for the cylinder, semi-sphere and the proposed one, respectively, with a difference of 2591 kWh between the largest and smallest collector. Taking into account all of the variables and evaluations, the point absorber WEC with the proposed floating shape performed the best.

Author Contributions

Conceptualization, A.M.F. and A.A.M.R.; methodology, A.M.F.; software, A.M.F. and R.S.C.; validation, A.M.F. and R.S.C.; formal analysis, A.M.F., A.A.M.R. and R.S.C.; investigation, A.M.F., A.A.M.R. and R.S.C.; writing— original draft preparation A.M.F. and A.A.M.R.; writing—review and editing A.M.F., A.A.M.R., R.S.C. and E.G.M.B. All authors have read and agreed to the published version of the manuscript.

Funding

This research was funded by the Fondo Sectorial CONACYT-SENER-Sustentabilidad energética, project 249795. This is a contribution of the Centro Mexicano de Innovación en Energía del Océano (CEMIE-Océano).

Data Availability Statement

Not applicable.

Acknowledgments

This study was developed under the framework of CEMIE-Océano (Mexican Centre for Innovation in Ocean Energy). Project FSE-2014-06-249795 financed by CONACYT-SENER- Sustentabilidad Energética. The authors are grateful to GII-II-UNAM project “Sostenibilidad del caribe mexicano: cambiando debilidades en fortalezas”

Conflicts of Interest

The authors declare no conflict of interest.

References

  1. 1. Falkner, R. The Paris Agreement and the new logic of international climate politics. International Affairs 2016, 92, 1107-1125. [CrossRef]
  2. 2. Poullikkas, A. Technology prospects of wave power systems. Electronic Journal of Energy & Environment 2014, 2, 47-69.
  3. 3. Hernández-Fontes, J.V.; Felix, A.; Mendoza, E.; Cueto, Y.R.; Silva, R. On the marine energy resources of Mexico. J. Mar. Sci. Eng. 2019, 7, 191. [CrossRef]
  4. 4. Quitoras, M.R.D.; Abundo, M.L.S.; Danao, L.A.M. A techno-economic assessment of wave energy resources in the Philippines. Renewable and Sustainable Energy Reviews 2018, 88, 68-81. [CrossRef]
  5. 5. Neill, S.P.; Hashemi, M.R. Fundamentals of ocean renewable energy: generating electricity from the sea; Academic Press: 2018.
  6. 6. Mork, G.; Barstow, S.; Kabuth, A.; Pontes, M.T. Assessing the global wave energy potential. In Proceedings of the International Conference on Offshore Mechanics and Arctic Engineering, 2010; pp. 447-454.
  7. 7. Ilyas, A.; Kashif, S.A.; Saqib, M.A.; Asad, M.M. Wave electrical energy systems: Implementation, challenges and environmental issues. Renewable and Sustainable Energy Reviews 2014, 40, 260-268. [CrossRef]
  8. 8. Jacobson, P.T.; Hagerman, G.; Scott, G. Mapping and assessment of the United States ocean wave energy resource; Electric Power Research Institute: 2011.
  9. 9. Kempener, R.; Neumann, F. Tidal energy technology brief. International Renewable Energy Agency (IRENA) 2014, 1-34.
  10. 10. Sannasiraj, S.; Sundar, V. Assessment of wave energy potential and its harvesting approach along the Indian coast. Renewable Energy 2016, 99, 398-409. [CrossRef]
  11. 11. Gleizon, P.; Campuzano, F.; Carracedo, P.; Martinez, A.; Goggins, J.; Atan, R.; Nash, S. Wave energy resources along the European Atlantic coast. In Marine renewable energy; Springer: 2017; pp. 37-69.
  12. 12. Cornett, A.M. A global wave energy resource assessment. In Proceedings of the The Eighteenth international offshore and polar engineering conference, 2008.
  13. 13. Mustapa, M.A.; Yaakob, O.; Ahmed, Y.M.; Rheem, C.-K.; Koh, K.; Adnan, F.A. Wave energy device and breakwater integration: A review. Renewable and Sustainable Energy Reviews 2017, 77, 43-58. [CrossRef]
  14. 14. López, I.; Andreu, J.; Ceballos, S.; De Alegría, I.M.; Kortabarria, I. Review of wave energy technologies and the necessary power-equipment. Renewable and sustainable energy reviews 2013, 27, 413-434. [CrossRef]
  15. 15. Folley, M.; Whittaker, T. Analysis of the nearshore wave energy resource. Renewable energy 2009, 34, 1709-1715. [CrossRef]
  16. 16. Drew, B.; Plummer, A.R.; Sahinkaya, M.N. A review of wave energy converter technology. 2009. [CrossRef]
  17. 17. Lagoun, M.; Benalia, A.; Benbouzid, M.H. Ocean wave converters: State of the art and current status. In Proceedings of the 2010 IEEE International Energy Conference, 2010; pp. 636-641.
  18. 18. Polinder, H.; Damen, M.; Gardner, F. Design, modelling and test results of the AWS PM linear generator. European Transactions on Electrical Power 2005, 15, 245-256. [CrossRef]
  19. 19. Kofoed, J.P.; Frigaard, P.; Friis-Madsen, E.; Sørensen, H.C. Prototype testing of the wave energy converter wave dragon. Renewable energy 2006, 31, 181-189. [CrossRef]
  20. 20. Chozas, J.F.; Kramer, M.; Sørensen, H.; Kofoed, J.P. Combined Production Of A Full-Scale Wave Converter and a Full-Scale Wind Turbine: a Real Case Study. In Proceedings of the 4th International Conference on Ocean Energy, 2012.
  21. 21. Brito-Melo, A.; Gato, L.; Sarmento, A. Analysis of Wells turbine design parameters by numerical simulation of the OWC performance. Ocean Engineering 2002, 29, 1463-1477. [CrossRef]
  22. 22. Henderson, R. Design, simulation, and testing of a novel hydraulic power take-off system for the Pelamis wave energy converter. Renewable energy 2006, 31, 271-283. [CrossRef]
  23. 23. Polinder, H.; Damen, M.E.; Gardner, F. Linear PM generator system for wave energy conversion in the AWS. IEEE transactions on energy conversion 2004, 19, 583-589. [CrossRef]
  24. 24. Albert, A.; Berselli, G.; Bruzzone, L.; Fanghella, P. Mechanical design and simulation of an onshore four-bar wave energy converter. Renewable Energy 2017, 114, 766-774. [CrossRef]
  25. 25. Heath, T.; Whittaker, T.J.; Boake, C. The design, construction and operation of the LIMPET wave energy converter (Islay, Scotland)[Land Installed Marine Powered Energy Transformer]. 2001.
  26. 26. Takahashi, S.; Nakada, H.; Ohneda, H.; Shikamori, M. Wave power conversion by a prototype wave power extracting caisson in Sakata port. In Coastal Engineering 1992; 1993; pp. 3440-3453.
  27. 27. Arena, F.; Romolo, A.; Malara, G.; Fiamma, V.; Laface, V. The first full operative U-OWC plants in the port of Civitavecchia. In Proceedings of the International Conference on Offshore Mechanics and Arctic Engineering, 2017; p. V010T009A022.
  28. 28. Torre-Enciso, Y.; Ortubia, I.; De Aguileta, L.L.; Marqués, J. Mutriku wave power plant: from the thinking out to the reality. In Proceedings of the Proceedings of the 8th European wave and tidal energy conference, Uppsala, Sweden, 2009; pp. 319-329.
  29. 29. Wu, B.; Chen, T.; Jiang, J.; Li, G.; Zhang, Y.; Ye, Y. Economic assessment of wave power boat based on the performance of “Mighty Whale” and BBDB. Renewable and Sustainable Energy Reviews 2018, 81, 946-953. [CrossRef]
  30. 30. Whittaker, T.; Collier, D.; Folley, M.; Osterried, M.; Henry, A.; Crowley, M. The development of Oyster—a shallow water surging wave energy converter. In Proceedings of the Proceedings of the 7th European wave and tidal energy conference, 2007; pp. 11-14.
  31. 31. Tedd, J.; Kofoed, J.P. Measurements of overtopping flow time series on the Wave Dragon, wave energy converter. Renewable Energy 2009, 34, 711-717. [CrossRef]
  32. 32. Falcão, A.F.; Cândido, J.J.; Justino, P.A.; Henriques, J.C. Hydrodynamics of the IPS buoy wave energy converter including the effect of non-uniform acceleration tube cross section. Renewable energy 2012, 41, 105-114. [CrossRef]
  33. 33. Wacher, A.; Nielsen, K. Mathematical and numerical modeling of the AquaBuOY wave energy converter. Mathematics-in-industry case studies. 2010, 2, 16-33.
  34. 34. Dalton, G.J.; Alcorn, R.; Lewis, T. Case study feasibility analysis of the Pelamis wave energy convertor in Ireland, Portugal and North America. Renewable Energy 2010, 35, 443-455. [CrossRef]
  35. 35. Ruellan, M.; BenAhmed, H.; Multon, B.; Josset, C.; Babarit, A.; Clement, A. Design methodology for a SEAREV wave energy converter. IEEE Transactions on Energy Conversion 2010, 25, 760-767. [CrossRef]
  36. 36. Wu, F.; Zhang, X.P.; Ju, P.; Sterling, M.J. Optimal control for AWS-based wave energy conversion system. IEEE Transactions on Power Systems 2009, 24, 1747-1755. [CrossRef]
  37. 37. Cameron, L.; Doherty, R.; Henry, A.; Doherty, K.; Van’t Hoff, J.; Kaye, D.; Naylor, D.; Bourdier, S.; Whittaker, T. Design of the next generation of the Oyster wave energy converter. In Proceedings of the 3rd international conference on ocean energy, 2010; p. 1e12.
  38. 38. Marquis, L.; Kramer, M.; Frigaard, P. First power production figures from the wave star roshage wave energy converter. In Proceedings of the Proceedings of the 3rd International Conference on Ocean Energy (ICOE-2010), Bilbao, Spain, 2010; pp. 1-5.
  39. 39. Chatzigiannakou, M.A.; Dolguntseva, I.; Leijon, M. Offshore deployments of wave energy converters by seabased industry AB. J. Mar. Sci. Eng. 2017, 5, 15. [CrossRef]
  40. 40. Weber, J.; Mouwen, F.; Parish, A.; Robertson, D. Wavebob—research & development network and tools in the context of systems engineering. In Proceedings of the Proc. Eighth European Wave and Tidal Energy Conference, Uppsala, Sweden, 2009; pp. 416-420.
  41. 41. Weinstein, A.; Fredrikson, G.; Parks, M.; Nielsen, K. AquaBuOY-the offshore wave energy converter numerical modeling and optimization. In Proceedings of the Oceans' 04 MTS/IEEE Techno-Ocean'04 (IEEE Cat. No. 04CH37600), 2004; pp. 1854-1859.
  42. 42. Budal, K.; Falnes, J. Wave power conversion by point absorbers: A Norwegian project. International Journal of Ambient Energy 1982, 3, 59-67. [CrossRef]
  43. 43. Goggins, J.; Finnegan, W. Shape optimisation of floating wave energy converters for a specified wave energy spectrum. Renewable Energy 2014, 71, 208-220. [CrossRef]
  44. 44. Shi, H.; Han, Z.; Zhao, C. Numerical study on the optimization design of the conical bottom heaving buoy convertor. Ocean Engineering 2019, 173, 235-243. [CrossRef]
  45. 45. McCabe, A. Constrained optimization of the shape of a wave energy collector by genetic algorithm. Renewable energy 2013, 51, 274-284. [CrossRef]
  46. 46. Shadman, M.; Estefen, S.F.; Rodriguez, C.A.; Nogueira, I.C. A geometrical optimization method applied to a heaving point absorber wave energy converter. Renewable energy 2018, 115, 533-546. [CrossRef]
  47. 47. Falnes, J.; Perlin, M.J.A.M.R. Ocean waves and oscillating systems: Linear interactions including wave-energy extraction. 2003, 56, B3.
  48. 48. Hagerman, G. Southern New England wave energy resource potential. Proceedings of the Building Energy 2001.
  49. 49. Newman, J.N. Marine hydrodynamics; The MIT press: 2018.
  50. 50. ANSYS. ANSYS AQWA theory manual, release 18.2. 2017.
  51. 51. Silva, R.; Mendoza, E.; Losada, M.J.O.e. Modelling linear wave transformation induced by dissipative structures—Regular waves. 2006, 33, 2150-2173. [CrossRef]
  52. 52. Polinder, H.; Scuotto, M. Wave energy converters and their impact on power systems. In Proceedings of the 2005 International Conference on Future Power Systems, 2005; pp. 9 pp.-9.
  53. 53. Dean, R.G.; Dalrymple, R.A. Water wave mechanics for engineers and scientists; World Scientific Publishing Company: 1991; Volume 2.
  54. 54. Alejandro, M.F.; Israel, H.H.J.; Ayrton, M.R.; Medina, M.B.E.G.; Rodolfo, S.C. Dinámica de una caja de velocidad unidireccional para un convertidor de energía undimotriz.
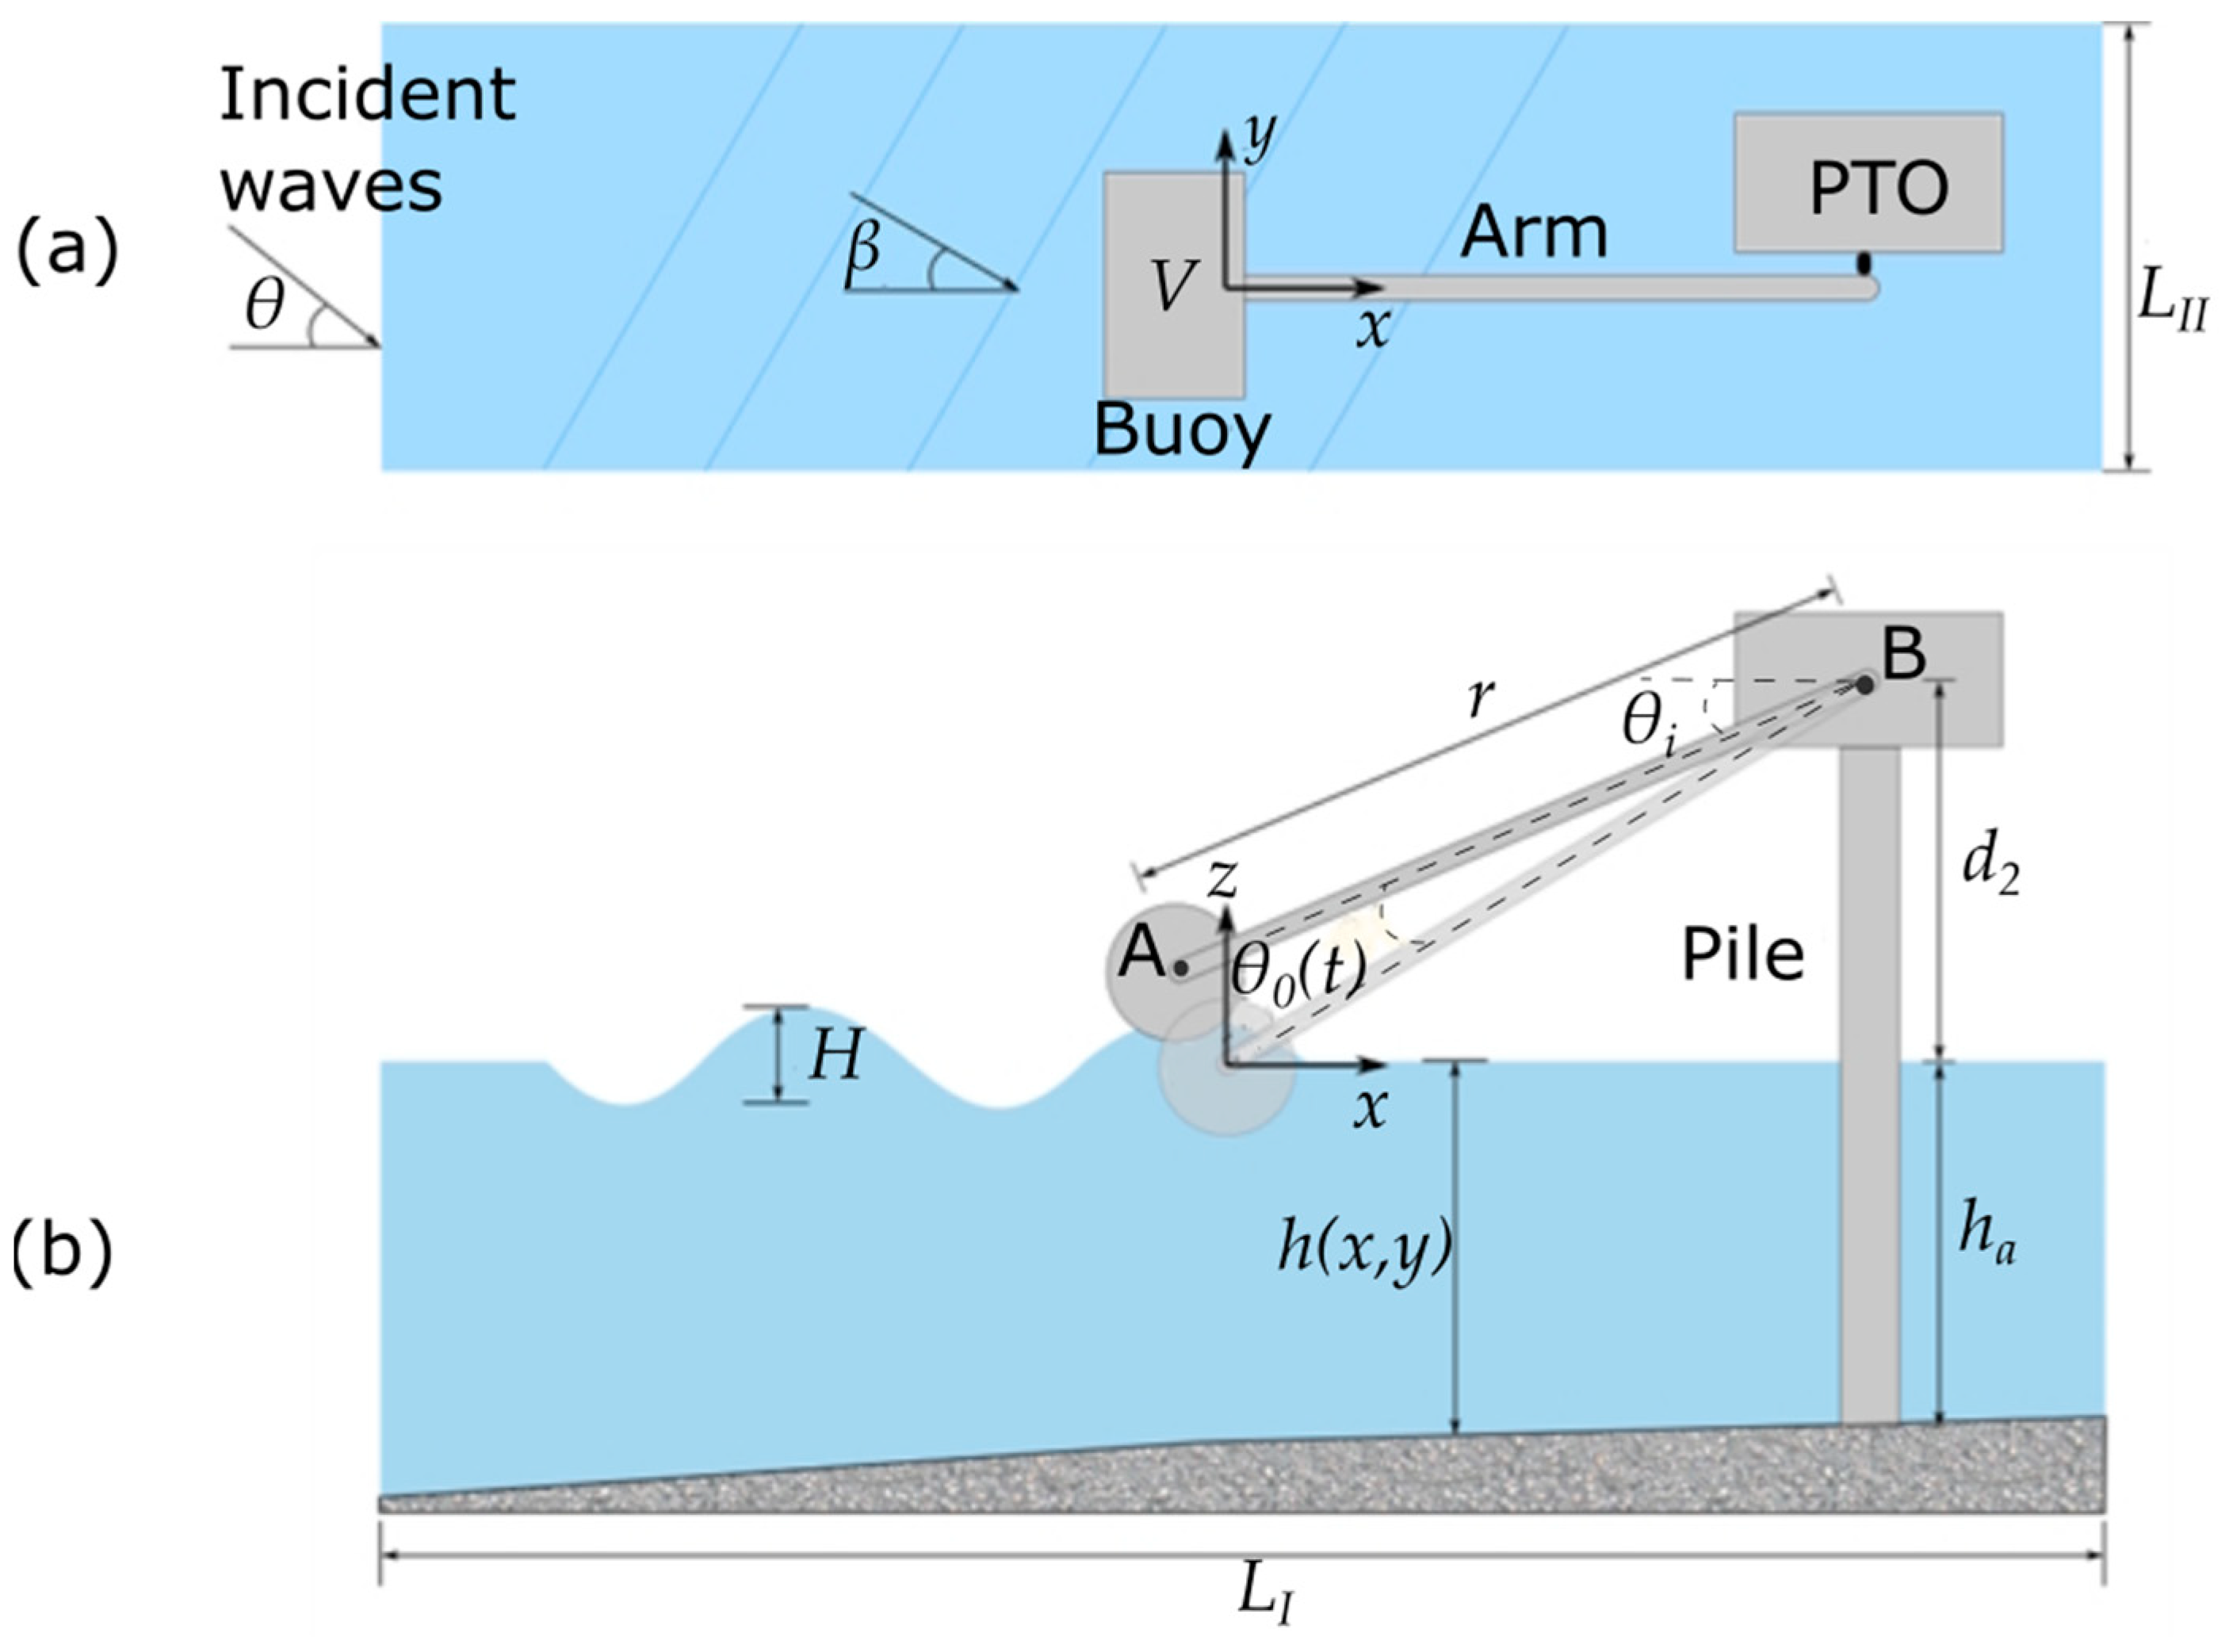
Figure 1. Schematic diagram of the physical model; (a) plan and (b) profile views.
Preprints 99676 g001
Figure 2. (a) Geographical location of the study site and the wave data point; (b) annual wave rose.
Preprints 99676 g002
Figure 3. Joint probability distribution (%) for the nearshore region of Ensenada (117° W, 32° N).
Preprints 99676 g003
Figure 4. Combined scatter and energy diagram: the colours denote the annual wave power level (MWh/m year), and the numbers indicate the probability occurrence per year (%) in terms of significant wave height and peak period.
Preprints 99676 g004
Figure 5. Side view of the unidirectional gearbox with flywheel and its stages.
Preprints 99676 g005
Figure 6. (a) Arrangement of gear elements and unidirectional clutch bearings and (b) Location of the axles.
Preprints 99676 g006
Figure 7. Meshing of the computational model for the analysed geometries: (a) the semi sphere, (b) the cylinder and (c) the proposed geometry.
Preprints 99676 g007
Figure 8. Numerical domain for wave propagation and location of the WEC.
Preprints 99676 g008
Figure 9. Wave propagation: (a) free surface and (b) local wave height.
Preprints 99676 g009
Figure 10. Frequency-domain analysis of the three bodies studied: (a) the added mass, (b) excitation force, (c) radiation damping and (d) response amplitude operator (RAO).
Preprints 99676 g010
Figure 11. Angular displacement of the lever arm for the three geometries analysed, simulated time: (a) 500 and (b) first 50 seconds. .
Preprints 99676 g011
Figure 12. Instantaneous power against time for the three geometries studied.
Preprints 99676 g012
Figure 13. Average power matrices with variable wave periods and wave heights for (a) the semi-spheres, (b) the cylinder and (c) the proposed geometry.
Preprints 99676 g013
Figure 14. Maximum power matrices with different wave periods and wave heights for (a) the semi-spheres, (b) the cylinder and (c) the proposed geometry.
Preprints 99676 g014
Figure 15. Angular positions and speed in the first 50 seconds from the PTO input and the three cases analysed at the transmission output; (a) semi-sphere, (b) cylinder and (c) proposed geometry.
Preprints 99676 g015
Figure 16. Maximum angular displacement matrix over T=5-15 s, with different wave heights H=0-4.5 m for (a) the semi-sphere, (b) the cylinder and (c) the proposed geometry.
Preprints 99676 g016
Table 1. Characteristic values of the waves in each season of the year and annual.
Annual Spring Summer Autumn Winter
% Hs Tm Hs Tm Hs Tm Hs Tm Hs Tm
50 1.85 10.10 1.82 9.45 1.44 9.32 1.89 10.49 2.17 10.92
33.33 2.04 10.27 1.97 9.47 1.51 9.41 2.08 10.58 2.40 11.03
10 2.60 10.55 2.41 9.52 1.70 9.74 2.64 10.65 3.05 11.20
1 3.72 10.86 3.29 9.46 2.07 10.68 3.69 10.72 4.26 11.38
Table 2. Dimensions of each part of the wave energy converter (WEC).
Geometry [m]
Semi sphere Cylinder
Preprints 99676 i001 Preprints 99676 i002
Proposed Arm
Preprints 99676 i003 Preprints 99676 i004
Pile
Preprints 99676 i005
Table 3. Physical properties of the semi sphere-arm, cylinder-arm, proposed geometry-arm and pile-power take-off (PTO).
Geometry
Parameter Semi sphere-Arm Cylinder-Arm Proposed geometry-Arm Pile-PTO
Volume [m3] 8.32 8.34 8.31 10.11
Mass [kg] 3914 3920 3910 24287
Surface area [m2] 36.92 36.9 35.74 42.11
Centre of gravity[m]
x-axis -0.657 0.653 0.701 8.59
y-axis 0.0 0.0 0.0 1.12
z-axis 0.752 0.443 0.411 1.34
Moment of inertia [kg/m2]
Ixx 10450 10511 9574 386335
Iyy 25353 24156 23951 2149103
Izz 17899 18635 18035 1828260
Table 4. Comparison of the average power obtained by the three geometries at different conditions.
Geometry
Condition Semi sphere Cylinder Proposed
Hs 14.98 kW 15.80 kW 16.87 kW
Average power matrix 19.85 kW 21.91 kW 22.01 kW
Average of the most recurrent conditions 15.06 kW 16.12 kW 16.16 kW
Table 5. Average and generated power by season of the year and annual of the geometries studied.
Semi-sphere Cylinder Proposed geometry
Season Hs(m) T(s) Avg. (kWh) Generated (MW) Avg. (kWh) Generated (MW) Avg. (kWh) Generated (MW)
Spring 1.97 9.47 14.38 31.57 14.72 32.32 14.73 32.34
Summer 1.51 9.41 14.38 31.57 14.72 32.32 14.73 32.34
Autunm 2.08 10.58 16.54 36.32 16.83 36.95 16.85 37.00
Winter 2.4 11.03 15.05 33.04 15.13 33.22 15.22 33.42
Annual power (MW) 132.52 134.83 135.11
Table 6. Comparison of the average power of the three geometries at different conditions.
Semi sphere Cylinder Proposed
Season H(m) T(s) Maximum angular displacement (rad)
Spring 1.97 9.47 0.105 0.122 0.115
Summer 1.51 9.41 0.105 0.122 0.115
Autunm 2.08 10.58 0.133 0.148 0.143
Winter 2.4 11.03 0.132 0.144 0.141
Average 0.11875 0.134 0.1285
Disclaimer/Publisher’s Note: The statements, opinions and data contained in all publications are solely those of the individual author(s) and contributor(s) and not of MDPI and/or the editor(s). MDPI and/or the editor(s) disclaim responsibility for any injury to people or property resulting from any ideas, methods, instructions or products referred to in the content.
Copyright: This open access article is published under a Creative Commons CC BY 4.0 license, which permit the free download, distribution, and reuse, provided that the author and preprint are cited in any reuse.
Prerpints.org logo

Preprints.org is a free preprint server supported by MDPI in Basel, Switzerland.

Subscribe

© 2024 MDPI (Basel, Switzerland) unless otherwise stated