Submitted:
21 February 2024
Posted:
25 February 2024
You are already at the latest version
Abstract
Keywords:
1. Introduction
2. Materials and Methods
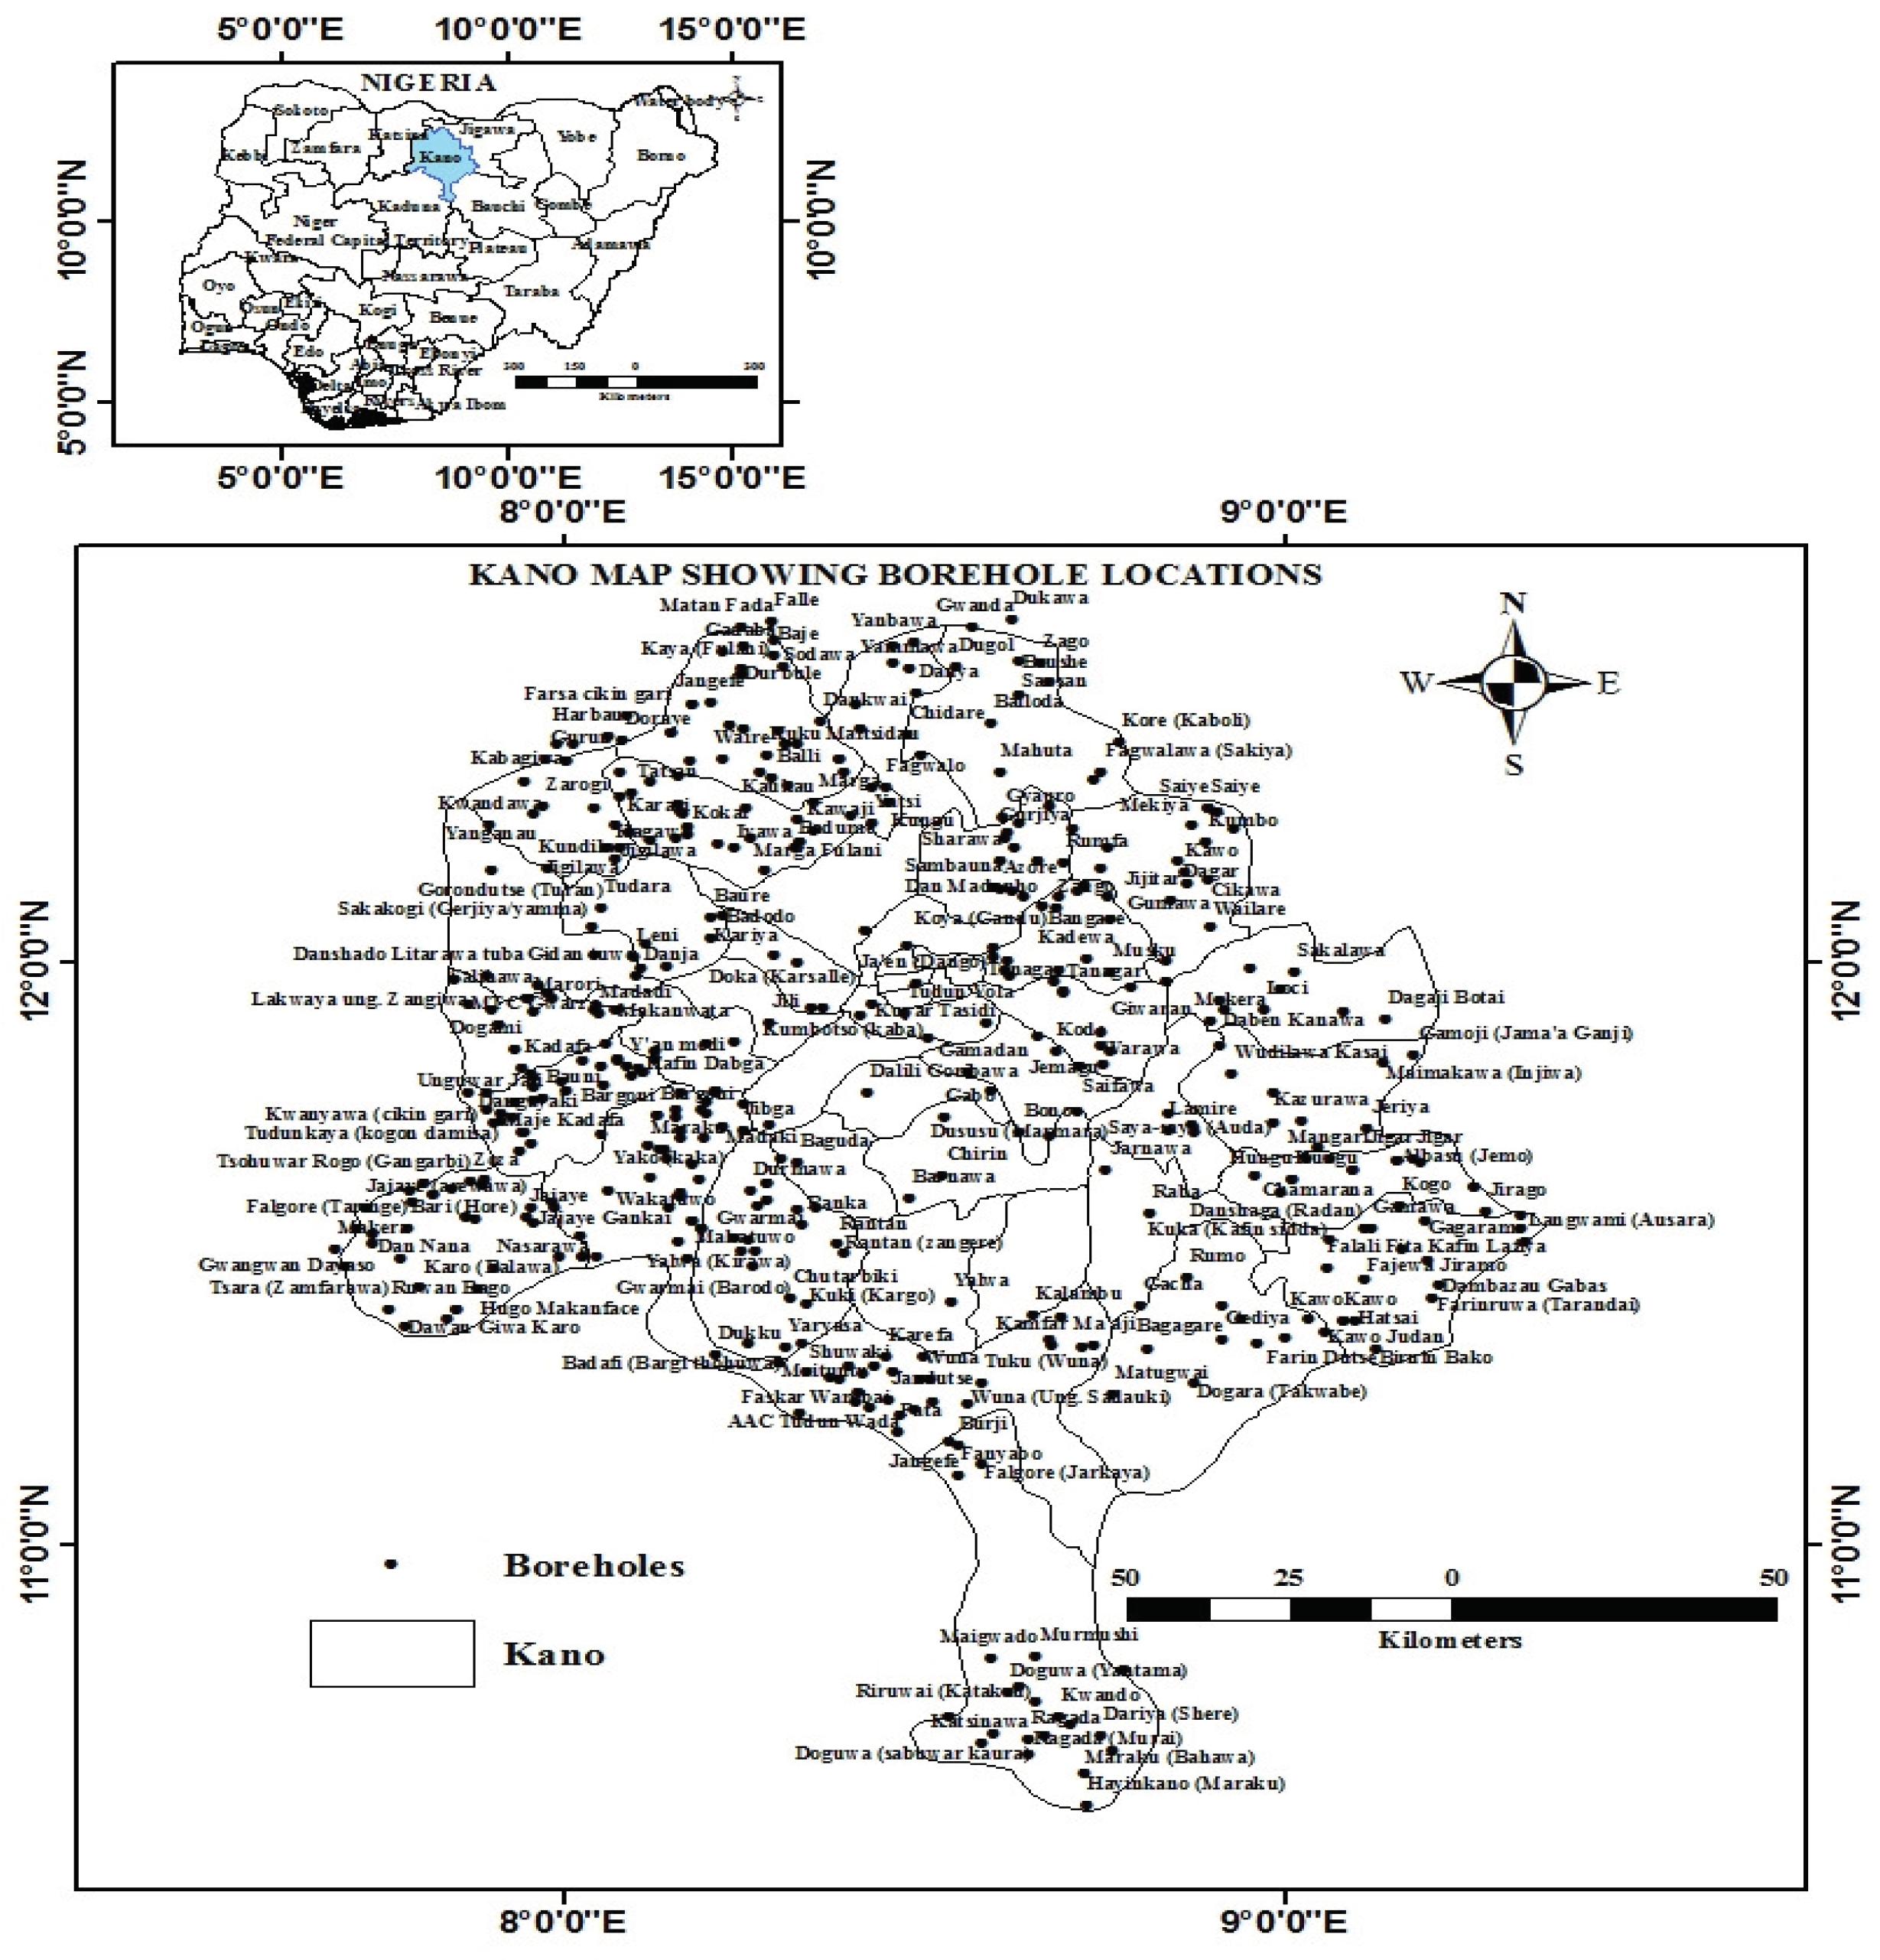
2.1. Study Area
2.2. Data Collction
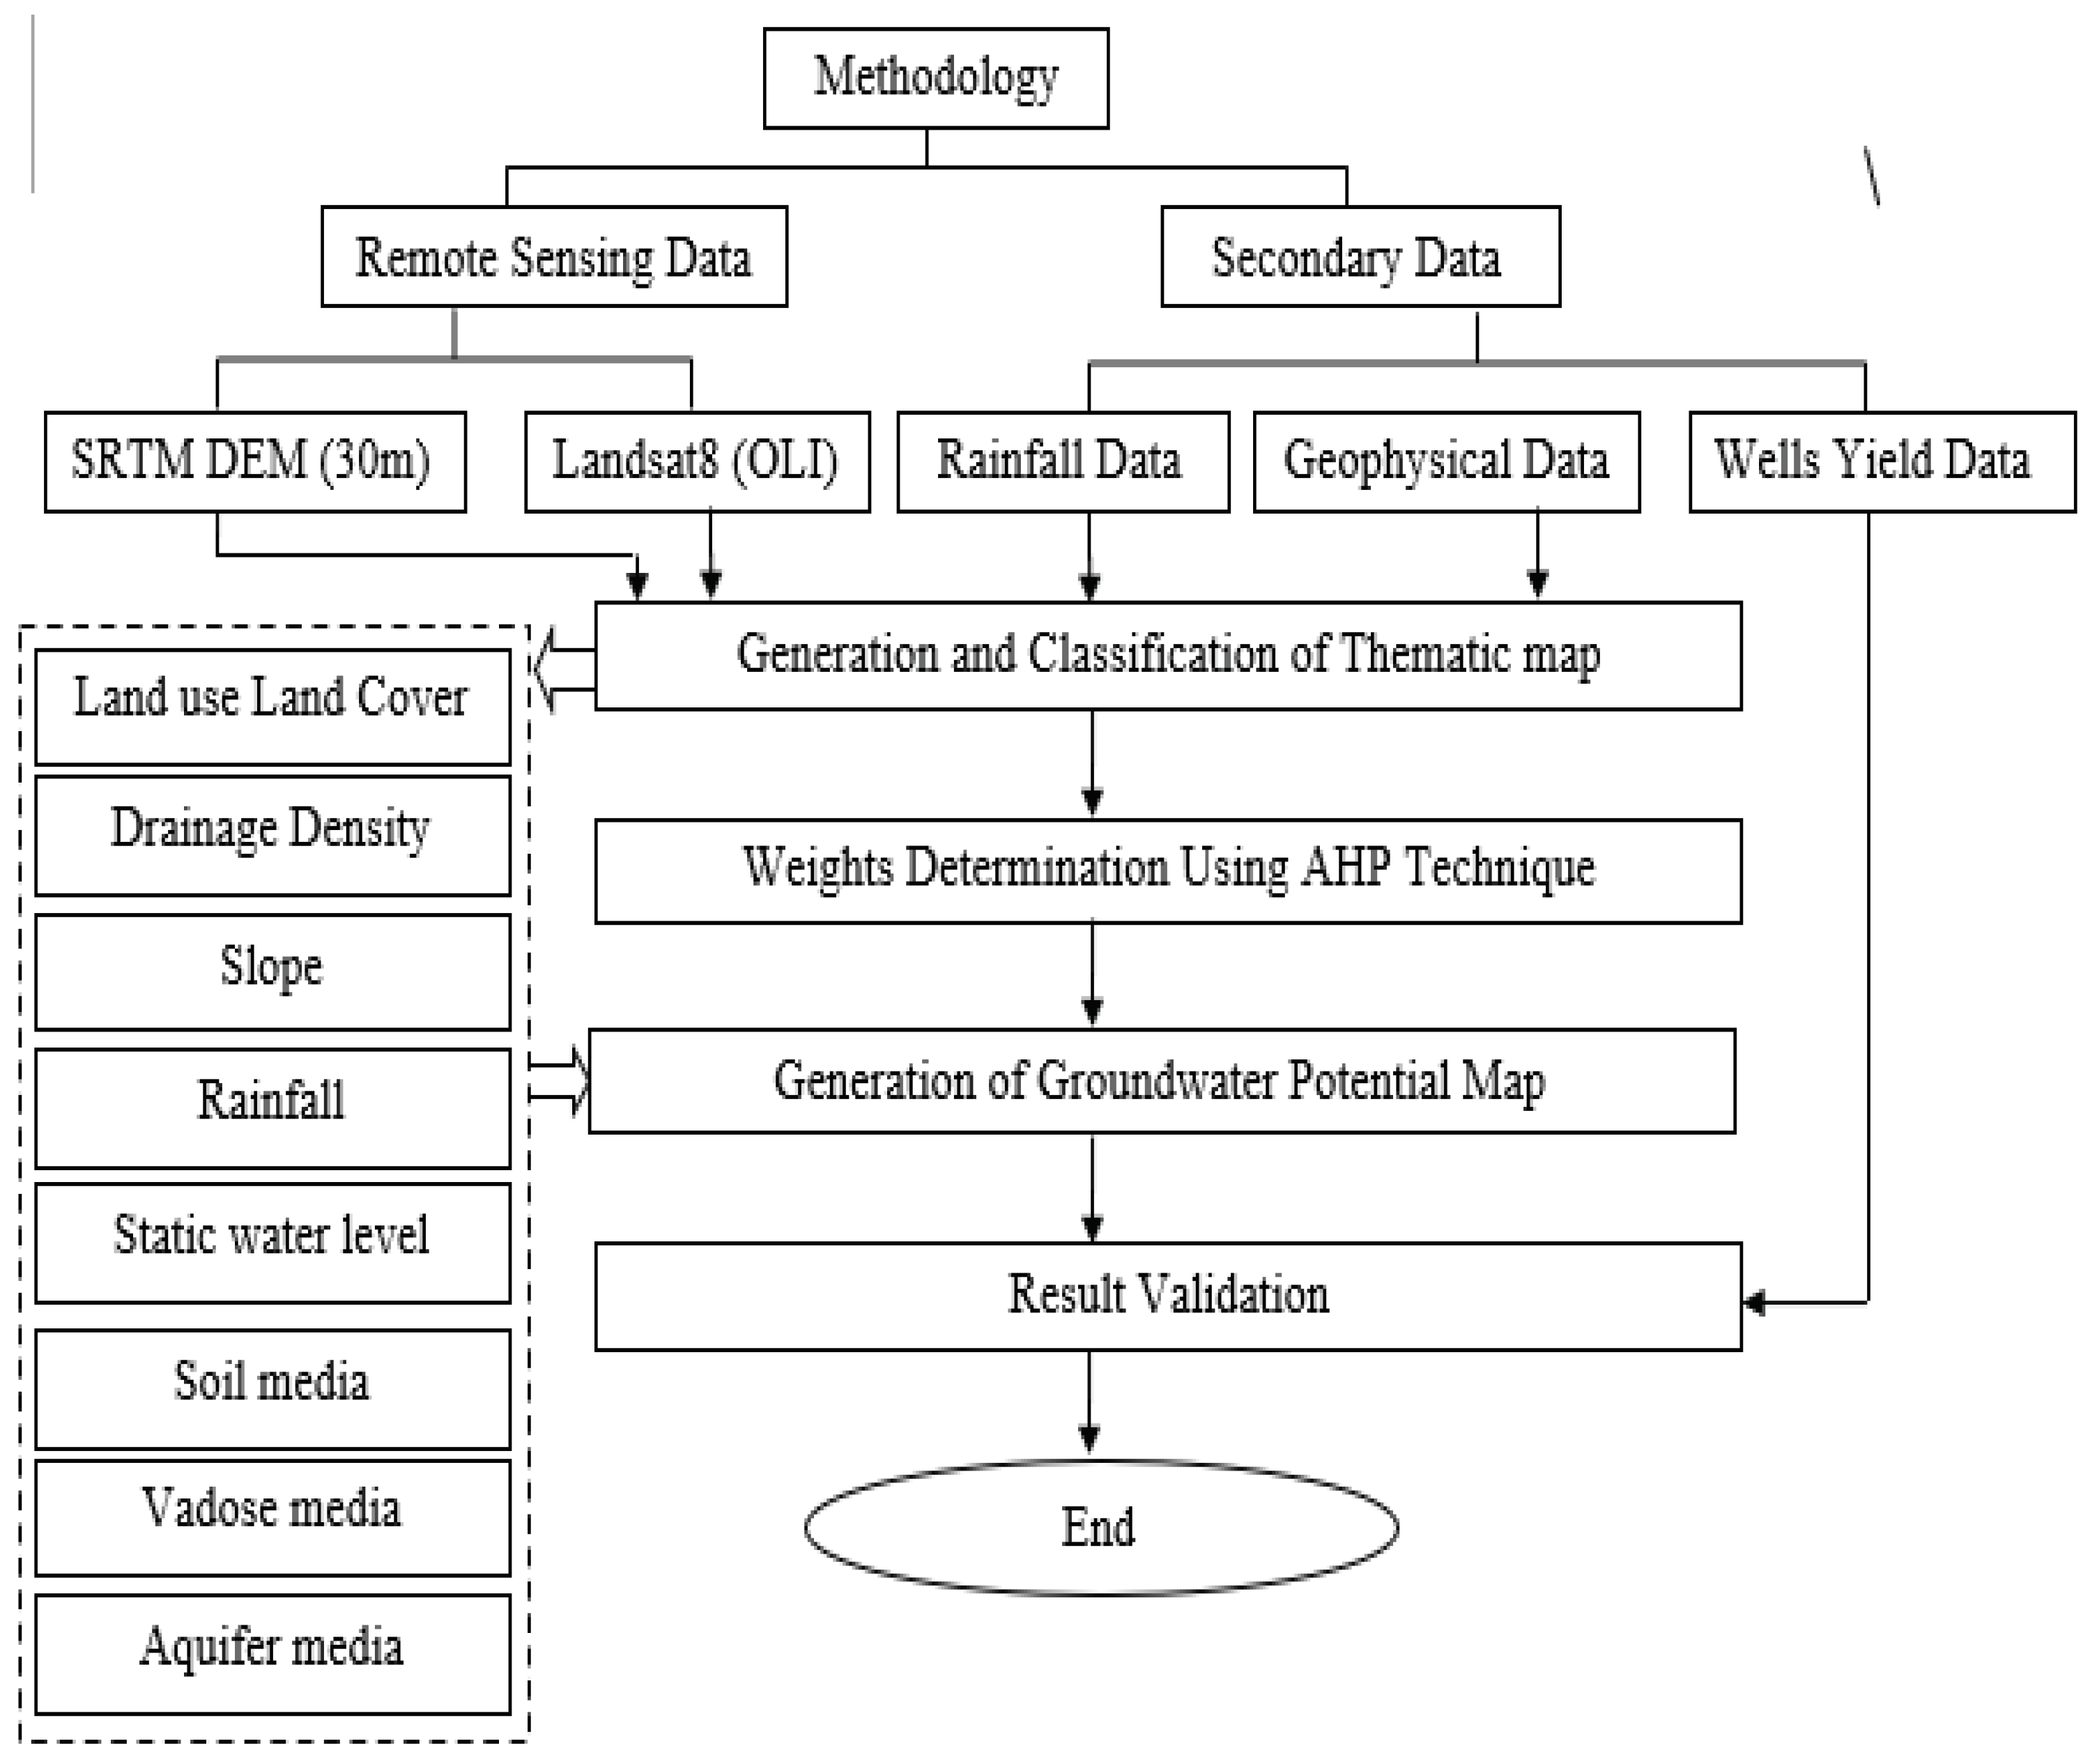
2.3. Data Processing
2.4. Analytic Hierarchy Process (AHP)
3. Results
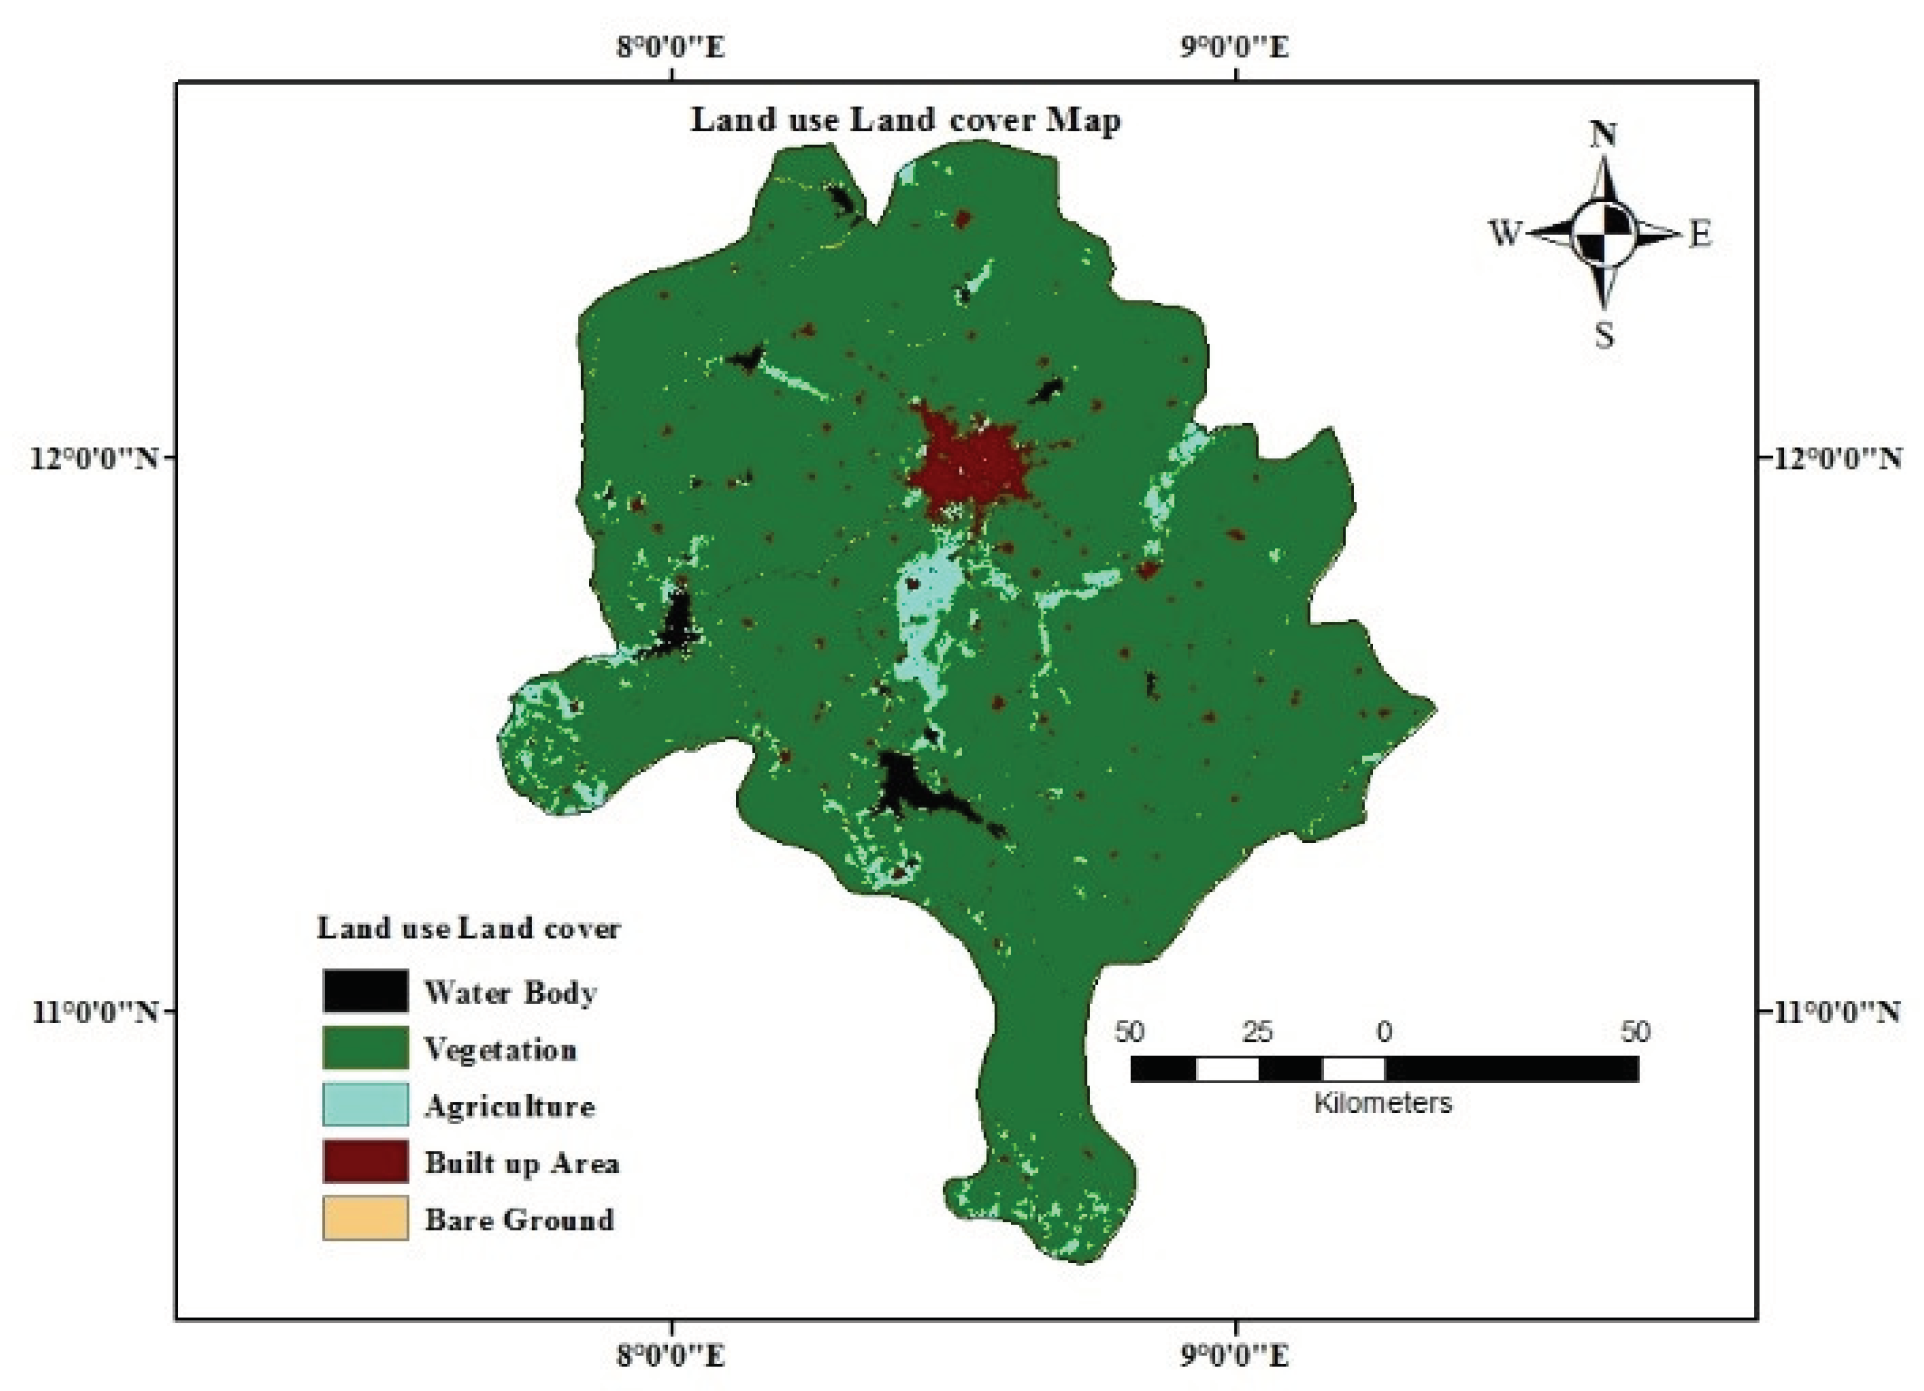
3.1. LULC
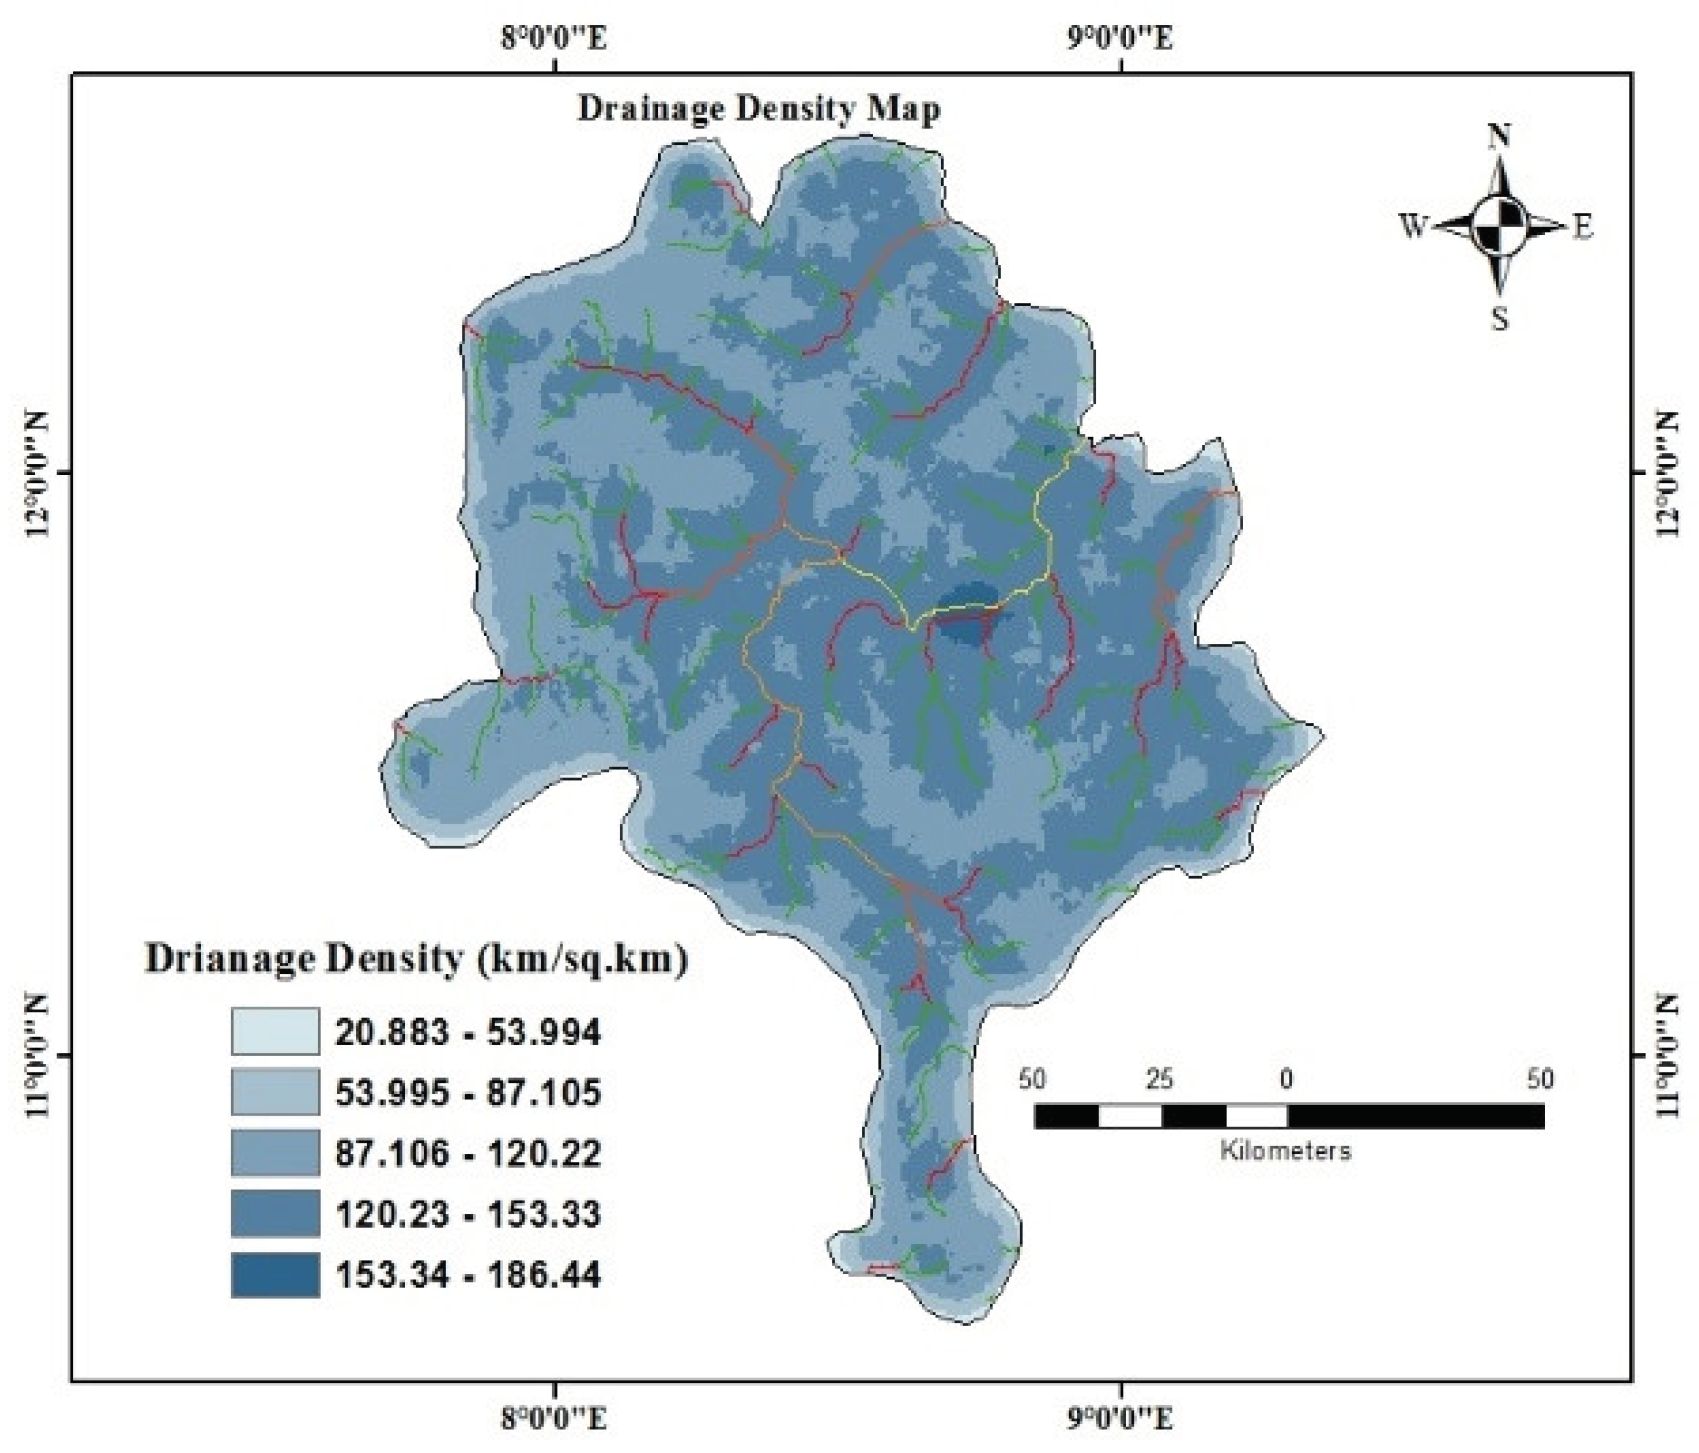
3.2. Drainage Density
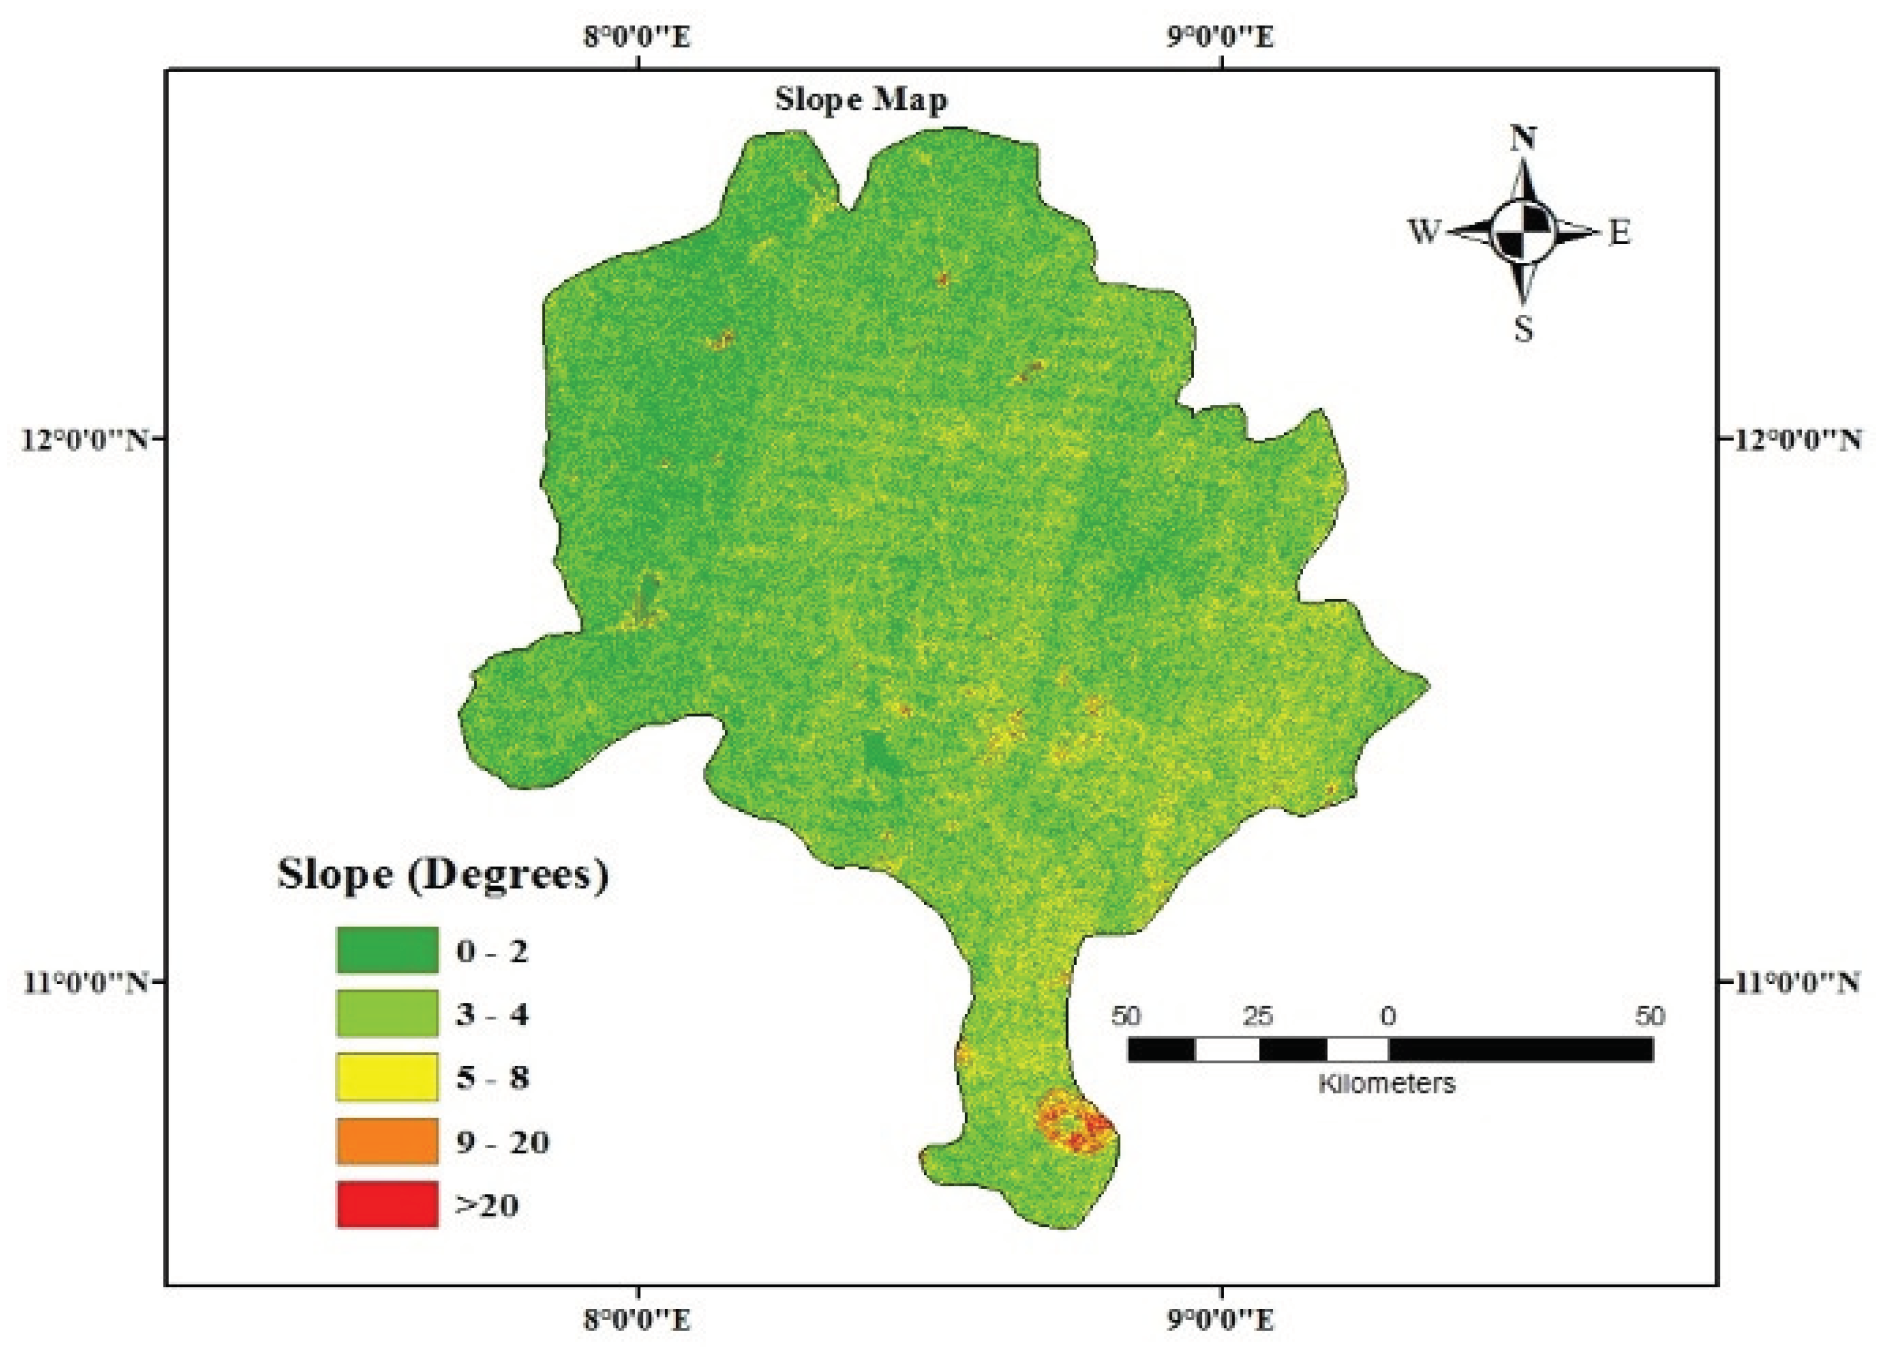
3.3. Slope
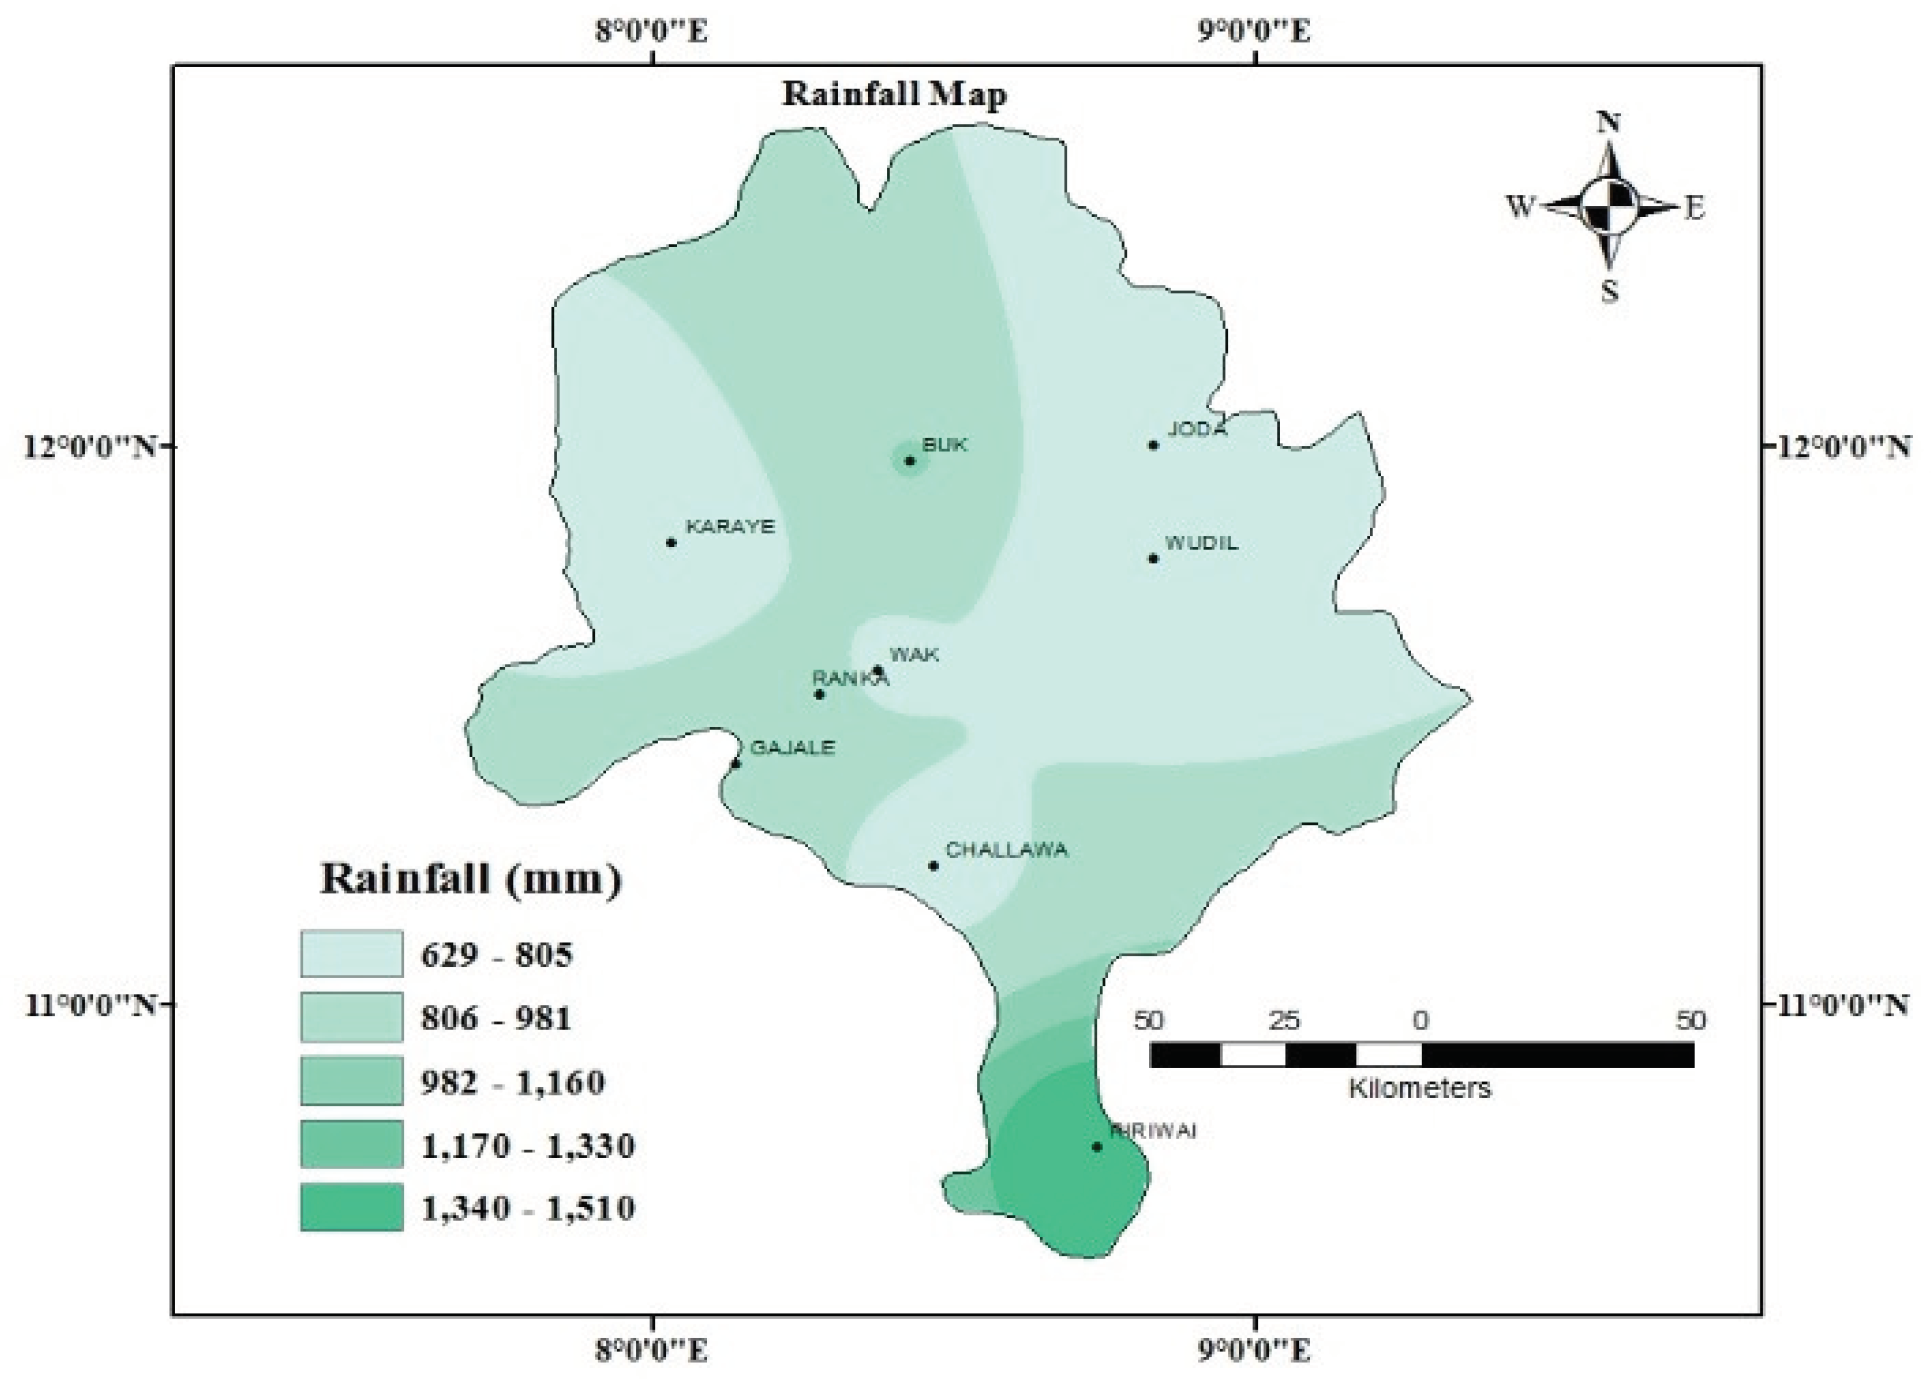
3.4. Rainfall
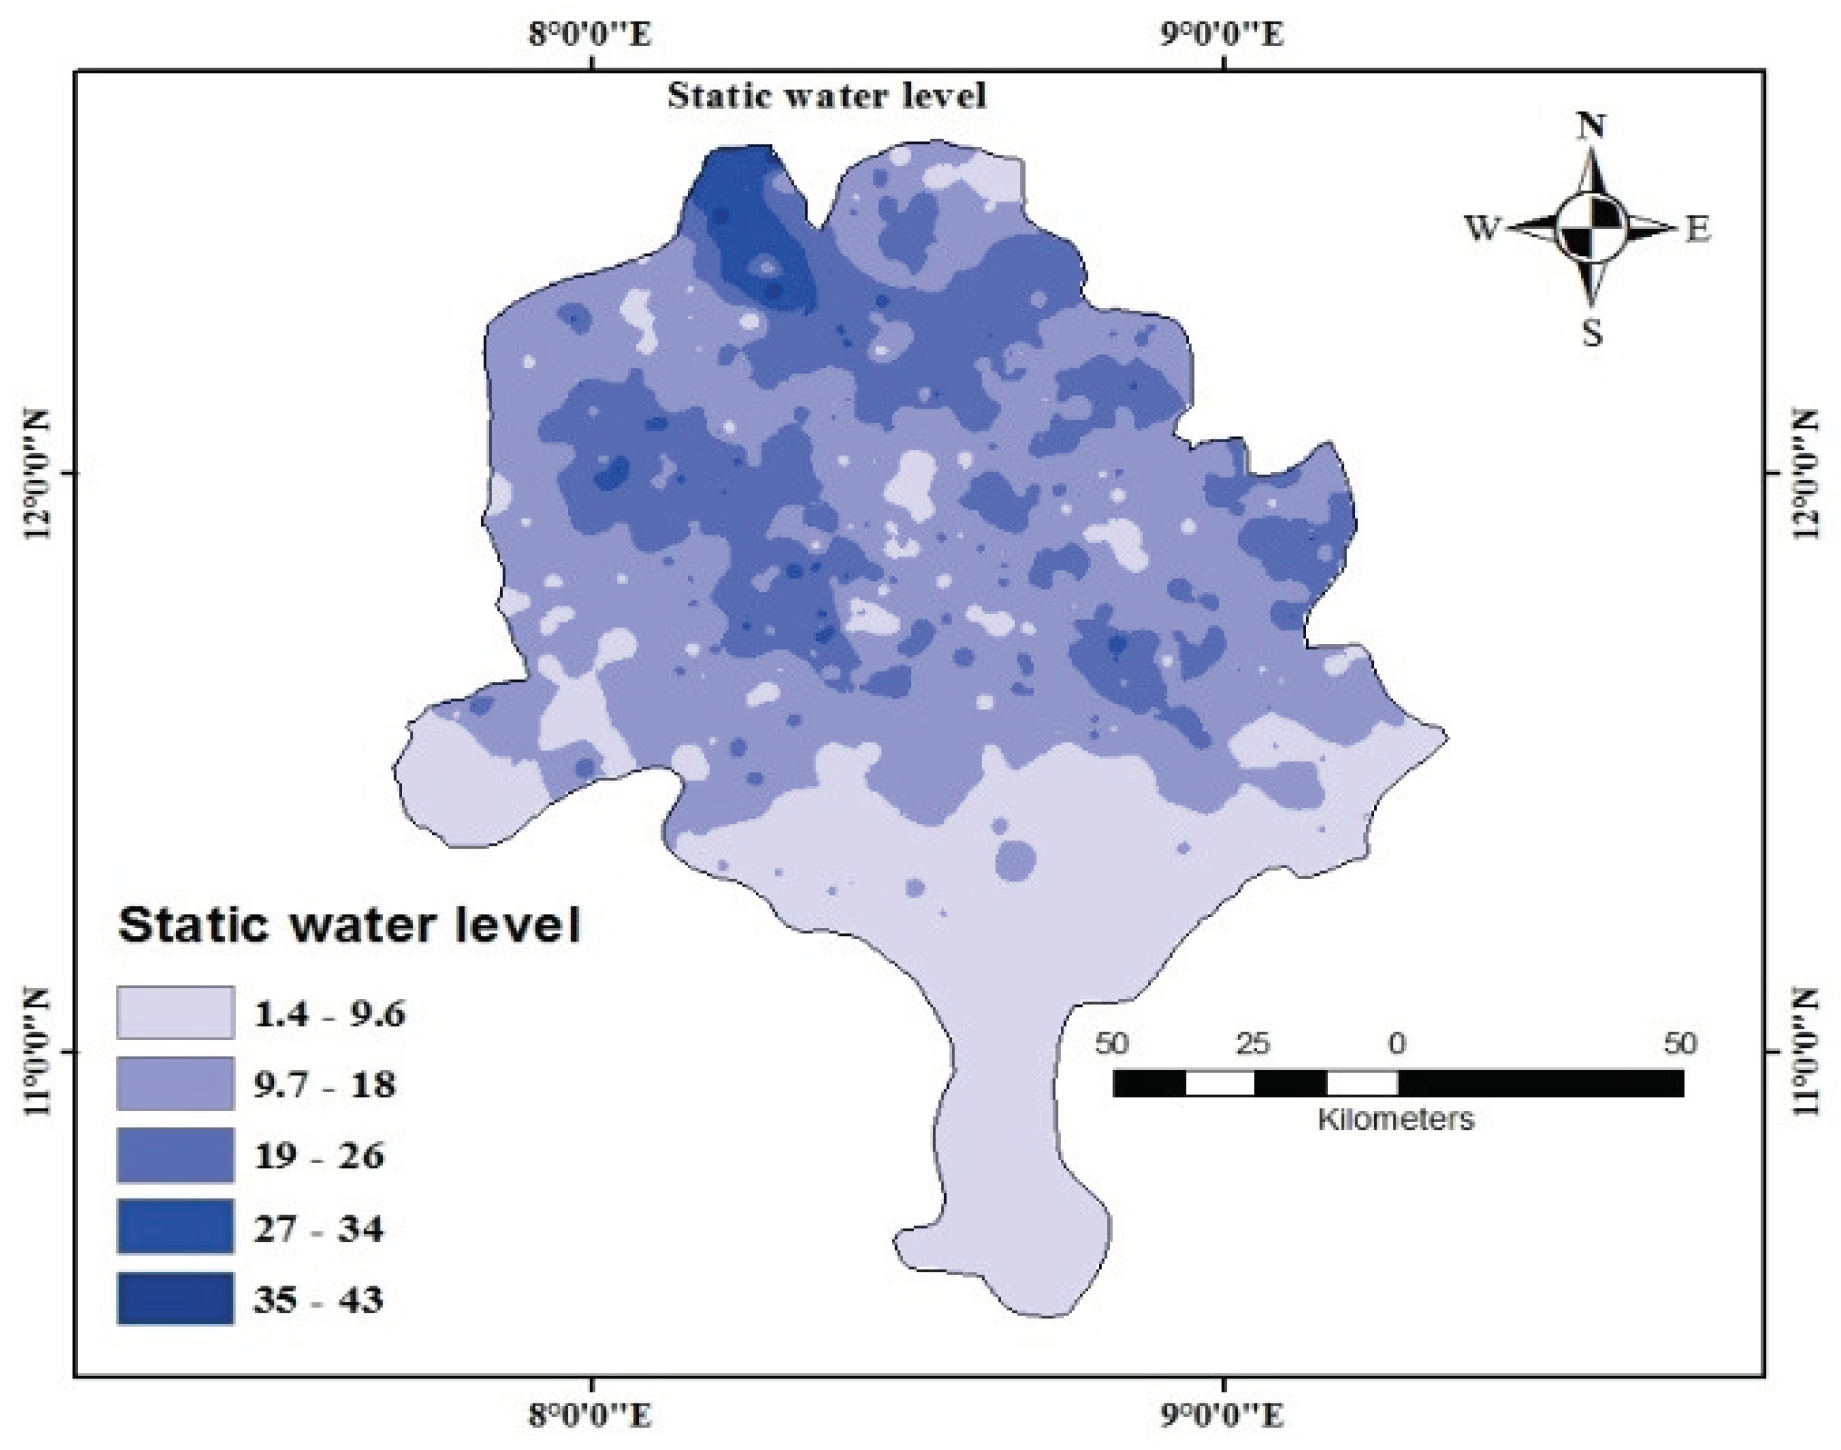
3.5. Static Water Level
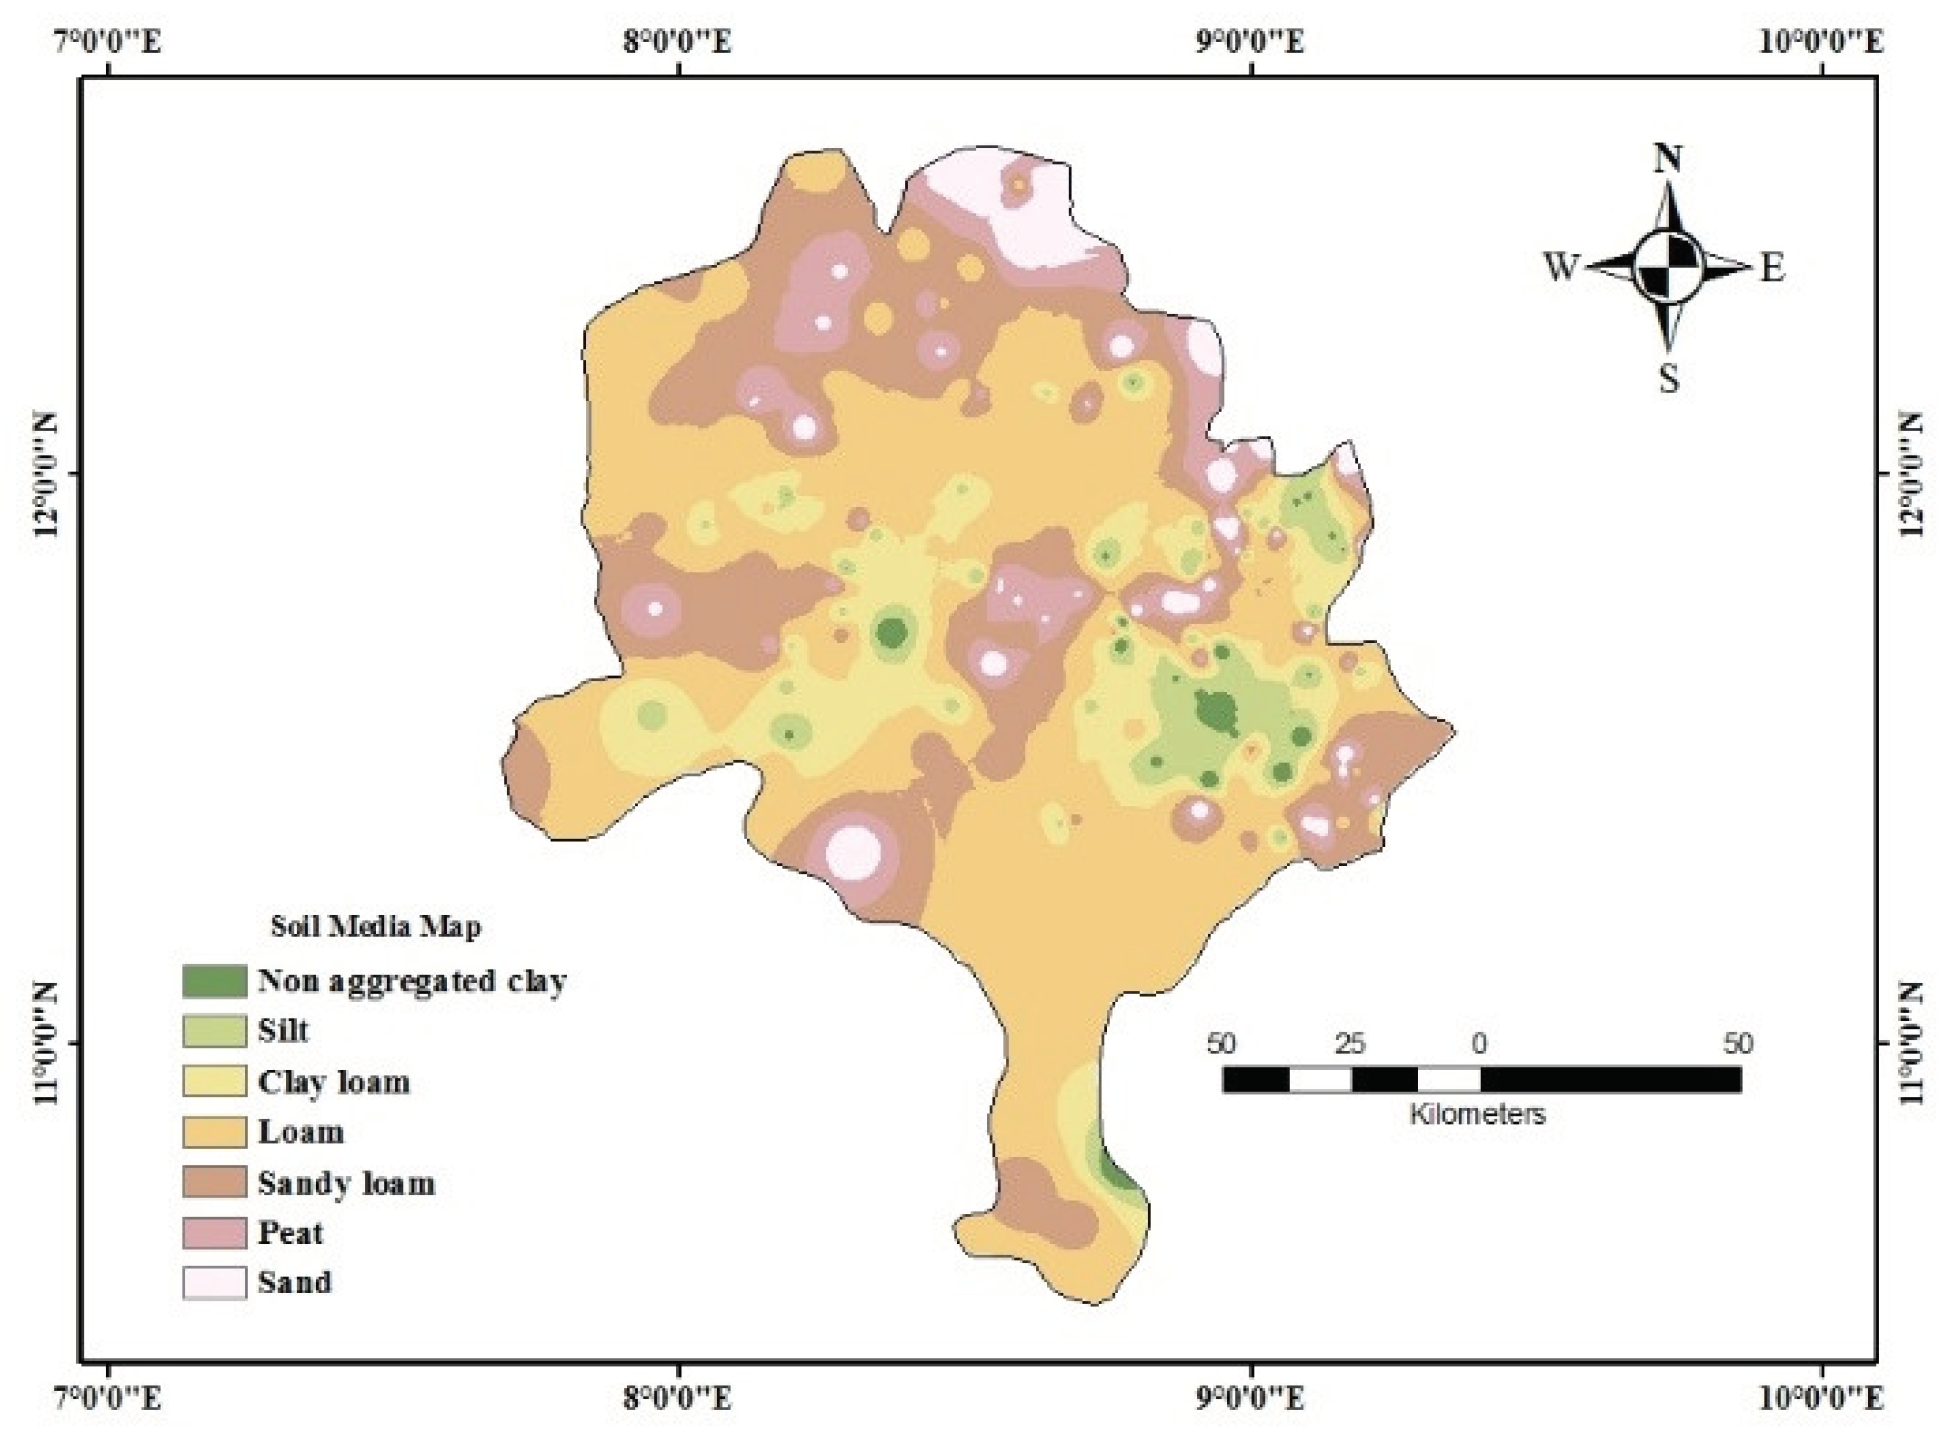
3.6. Soil Media
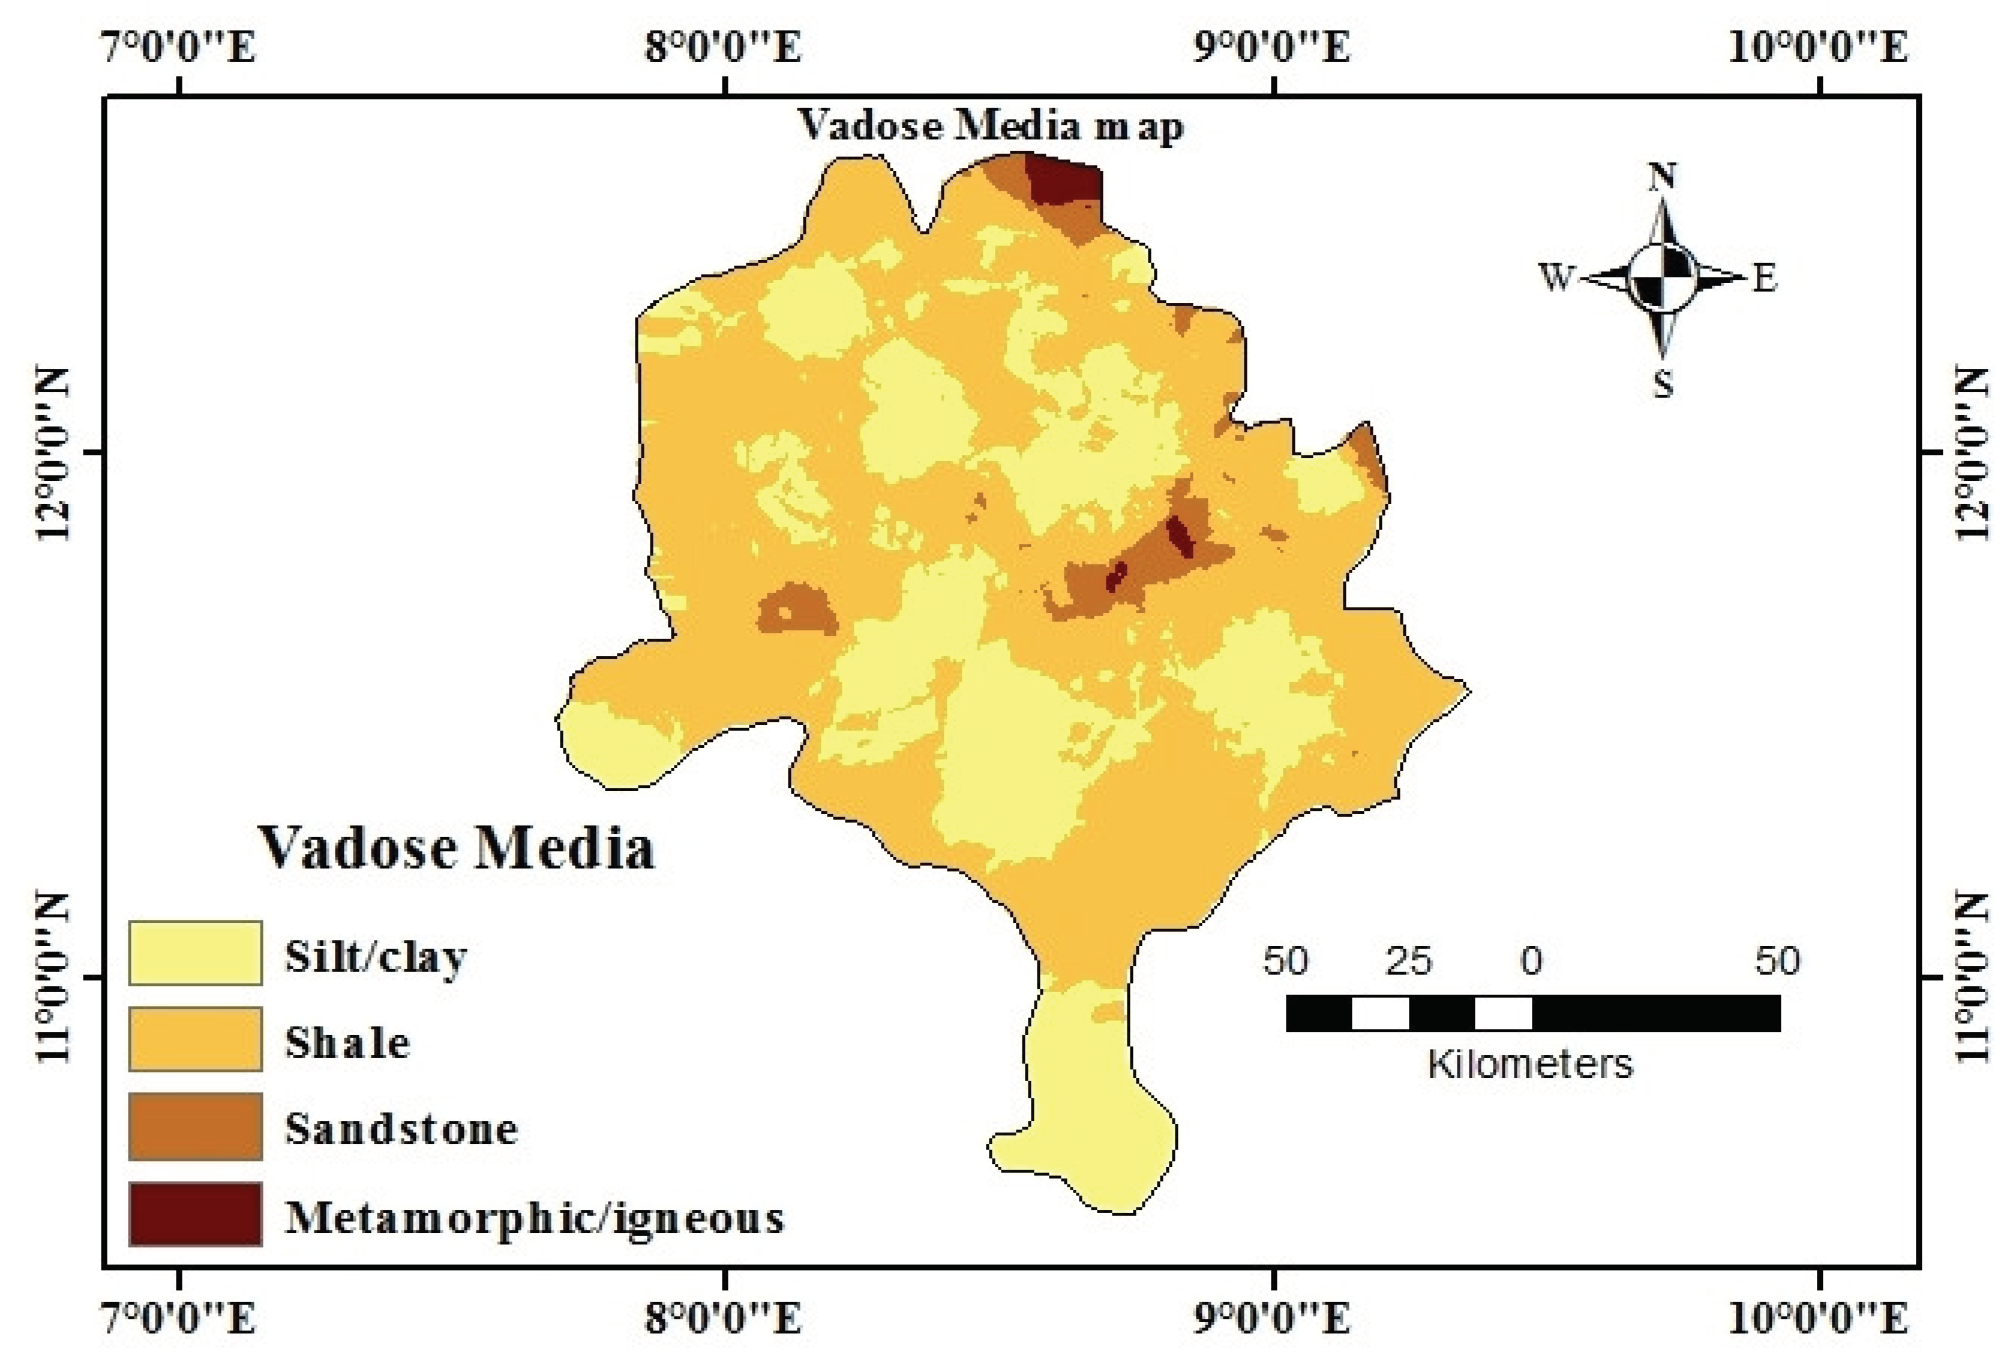
3.7. Vadose Media
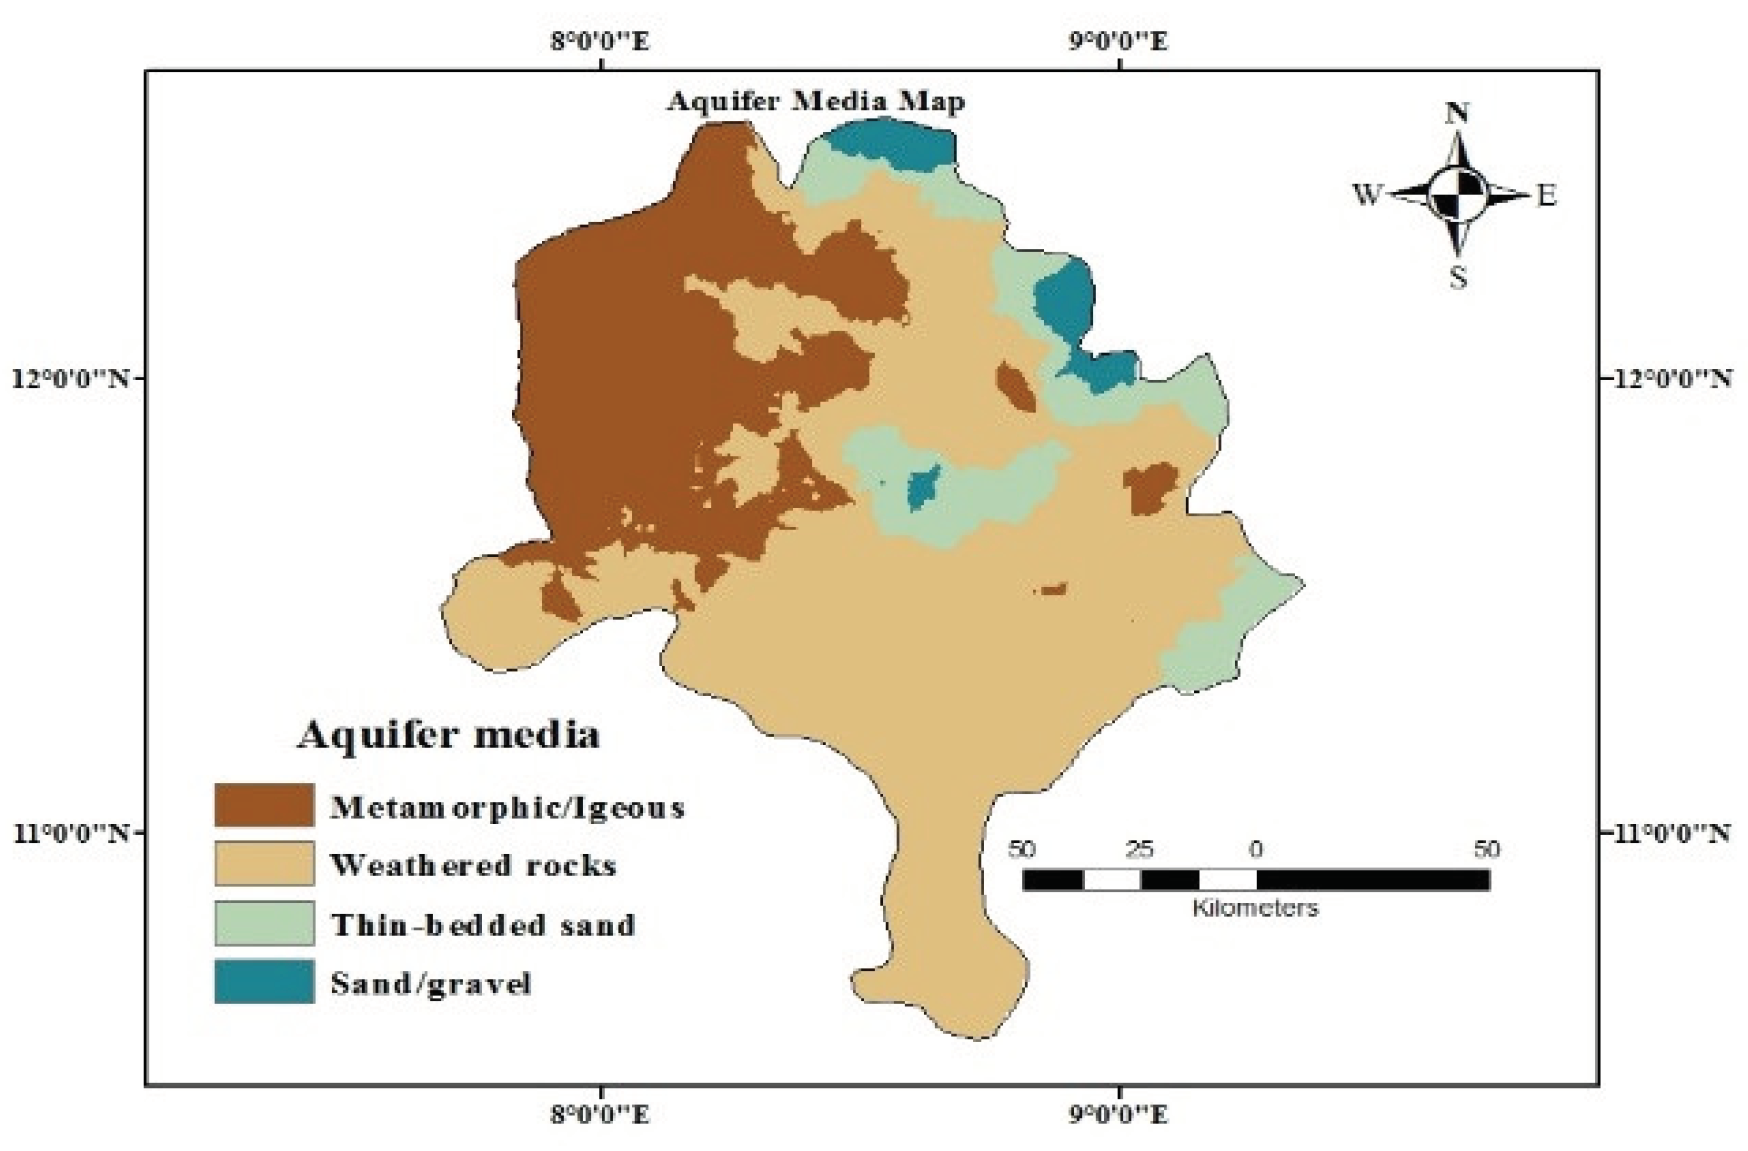
3.8. Aquifer Media
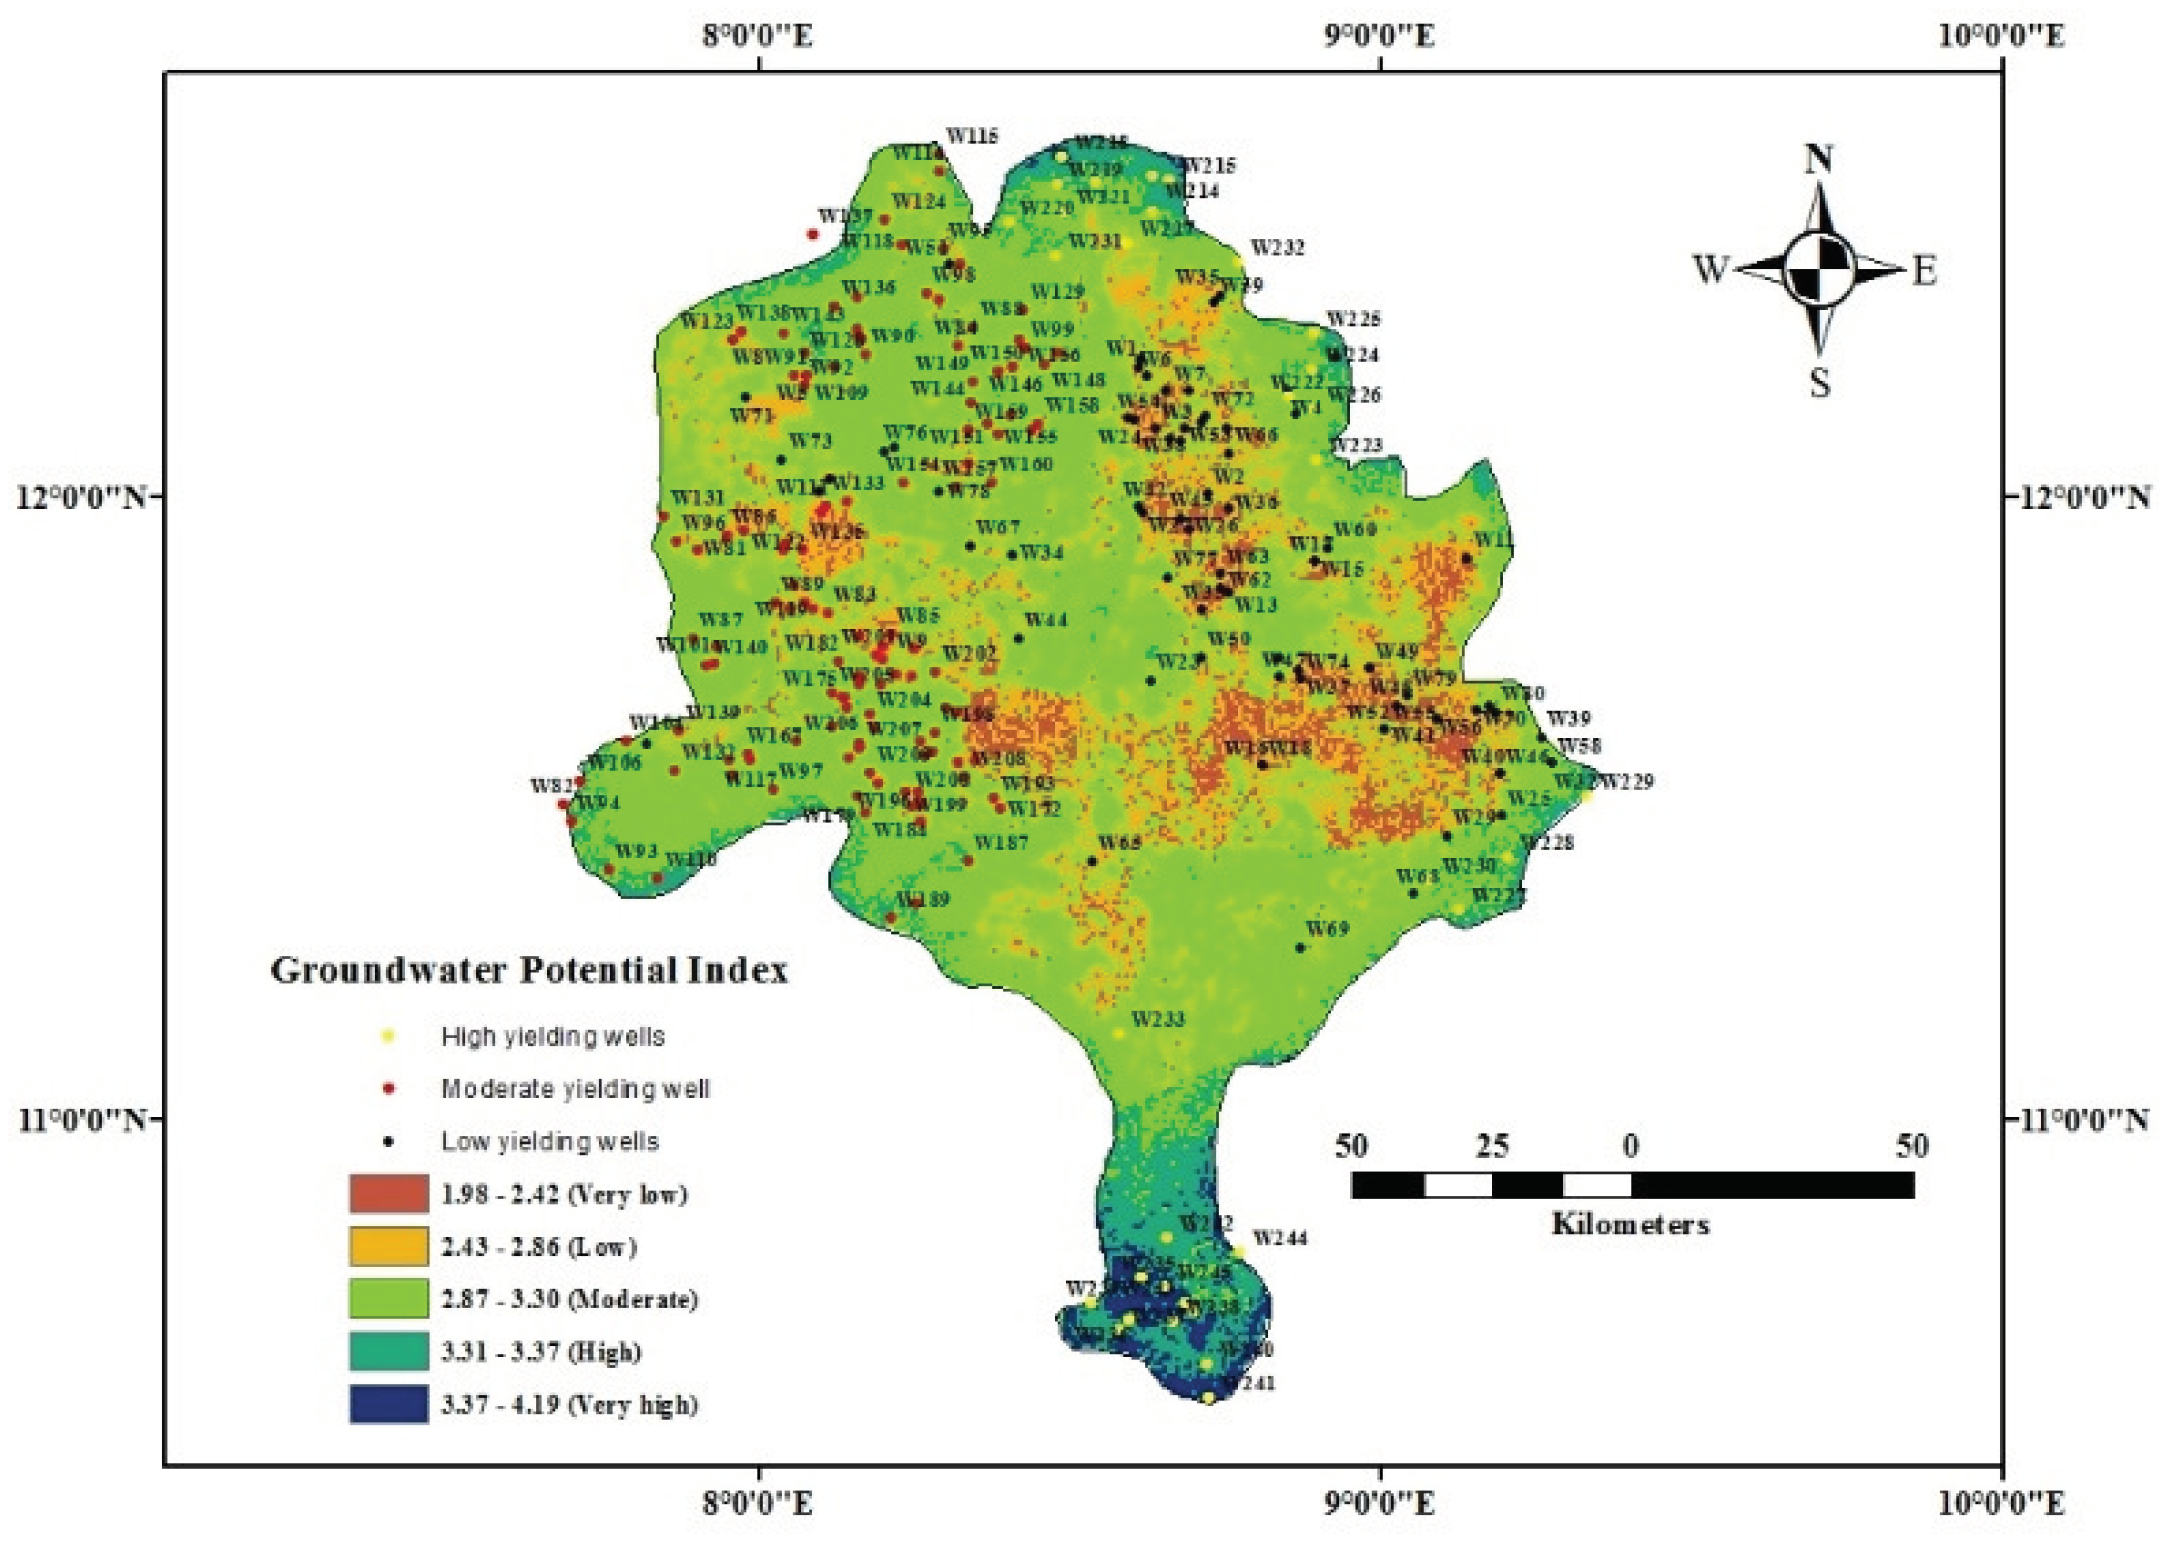
3.9. GWP Map
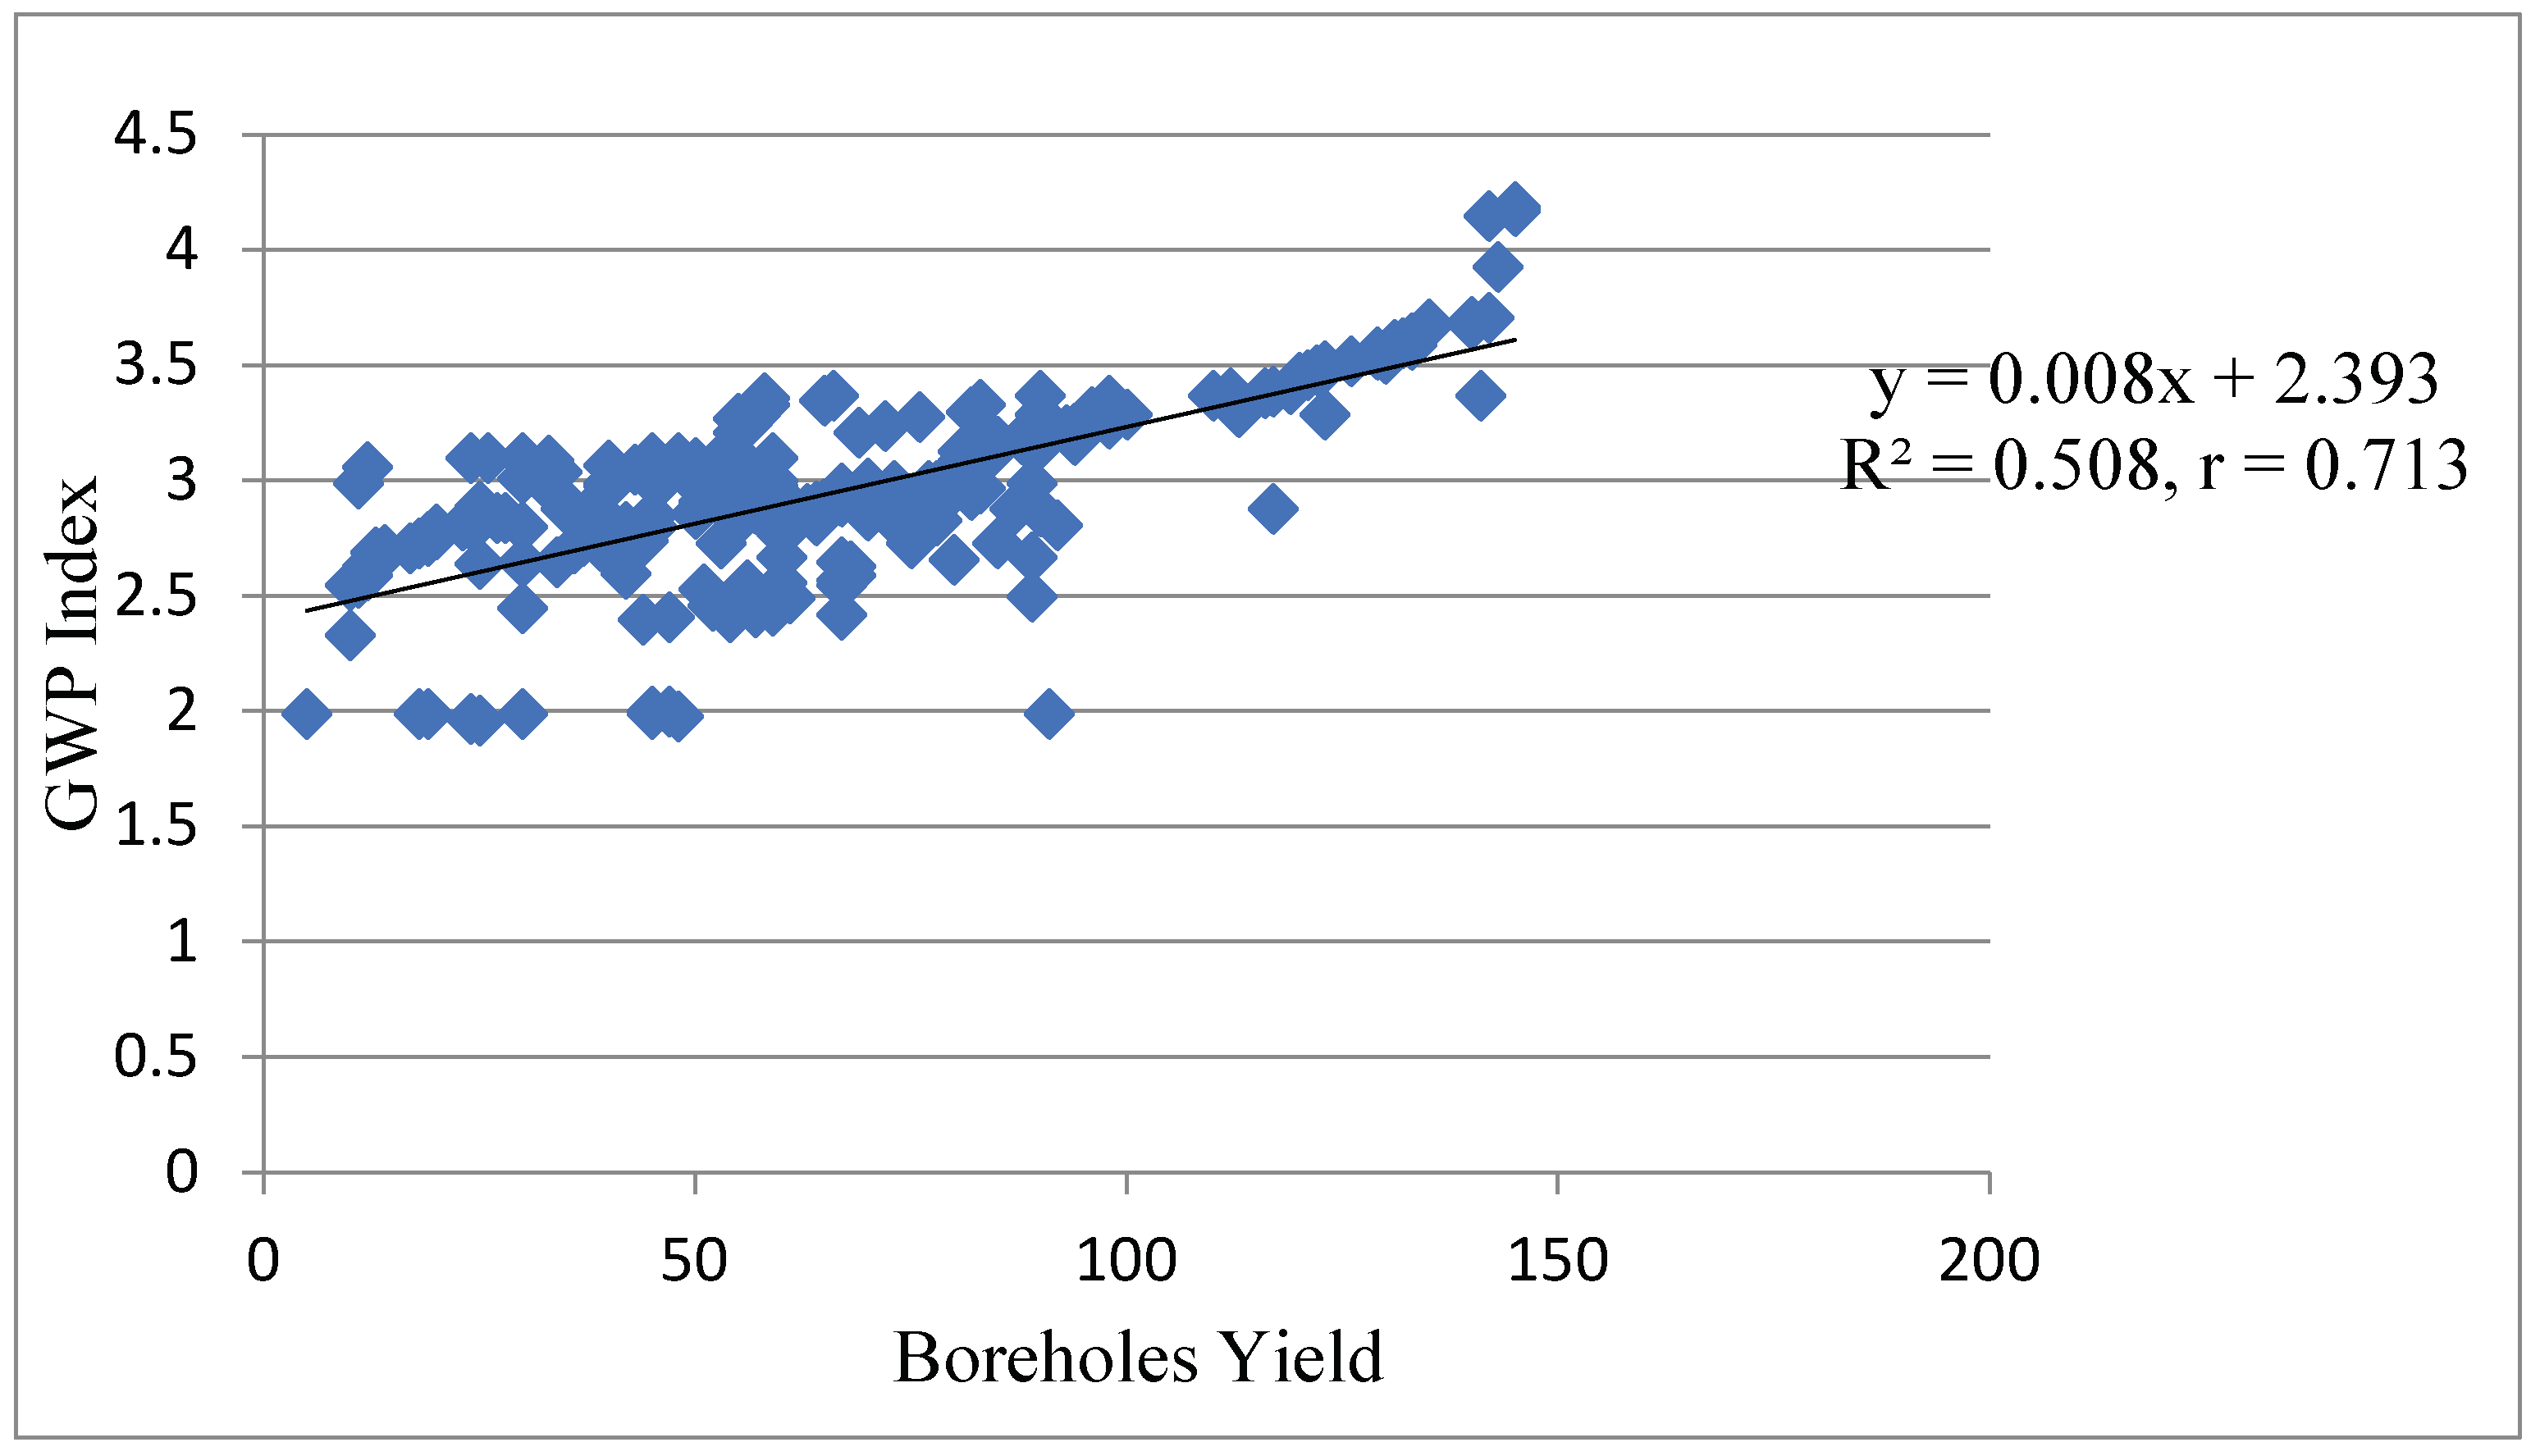
3.10. Model Accuracy
3.11. Model Validation
4. Discussion
5. Conclusions
Author Contributions
Funding
Institutional Review Board Statement
Data Availability Statement
Acknowledgments
Conflicts of Interest
References
- Griggs, D., Stafford-Smith, M., Gaffney, O., Rockström, J., Öhman, M.C., Shyamsundar, P., Steffen, W., et al. Policy: Sustainable development goals for people and planet, Nature, 2013, 495(7441), p. 305. [CrossRef]
- Akujieze, C.N., Coker, S. and Oteze, G., Groundwater in Nigeria–a millennium experience–distribution, practice, problems and solutions, Hydrogeology Journal, 2003, 11(2), pp. 259–274. [CrossRef]
- Dan’azumi, S. and Bichi, M.H. Industrial pollution and implication on source of water supply in Kano, Nigeria, Intern. J. of Engineering & Technology, 2010, 10(1), pp. 101–109.
- Roy, S., Hazra, S., Chanda, A. and Das, S. Assessment of groundwater potential zones using multi-criteria decision-making technique: a micro-level case study from red and lateritic zone (RLZ) of West Bengal, India, Sustainable Water Resources Management, 2020, 6(1), pp. 1–14. [CrossRef]
- Tarhule, A. Status of Groundwater Use, Exploration, and Policy, in Nigeria, National Groundwater Association Summit, 2007, Abuja, Nigeria.
- Abdullateef, L., Tijani, M.N., Nuru, N.A., John, S. and Mustapha, A. Assessment of groundwater recharge potential in a typical geological transition zone in Bauchi, NE-Nigeria using remote sensing/GIS and MCDA approaches, Heliyon, 2021, 7(4), p. e06762. [CrossRef]
- Rahmati, O., Samani, A.N., Mahdavi, M., Pourghasemi, H.R. and Zeinivand, H. Groundwater potential mapping at Kurdistan region of Iran using analytic hierarchy process and GIS, Arabian Journal of Geosciences, 2015, 8(9), pp. 7059–7071. [CrossRef]
- Jha, M.K., Chowdary, V.M. and Chowdhury, A. Groundwater assessment in Salboni Block, West Bengal (India) using remote sensing, geographical information system and multi-criteria decision analysis techniques, Hydrogeology Journal, 2010, 18(7), pp. 1713–1728. [CrossRef]
- Madrucci, V., Taioli, F. and de Araújo, C.C. Groundwater favorability map using GIS multicriteria data analysis on crystalline terrain, Sao Paulo State, Brazil, Journal of Hydrology, 2008, 357(3–4), pp. 153–173. [CrossRef]
- Cabrera, J.S. and Lee, H.S. Flood-prone area assessment using GIS-based multi-criteria analysis: a case study in Davao Oriental, Philippines”, Water, 2019, 11(11), p. 2203. [CrossRef]
- Nithya, C.N., Srinivas, Y, Magesh, Kaliraj, N.S. Assessment of groundwater potential zones in Chittar basin, Southern India using GIS based AHP technique, Remote Sensing Applications: Society and Environment, 2019, 15, 100248. [CrossRef]
- Ifediegwu, S.I., Nnebedum, D.O. and Nwatarali, A.N. Identification of groundwater potential zones in the hard and soft rock terrains of Kogi State, North Central Nigeria: an integrated GIS and remote sensing techniques, SN Applied Sciences, 2019, 1(10), pp. 1–15. [CrossRef]
- Kamaraj, P; Jothimani, M; Panda, B; Sabarathinam, C. Mapping of groundwater potential zones by integrating remote sensing, geophysics, GIS, and AHP in a hard rock terrain, Urban Climate, 2023, 51, 101610. [CrossRef]
- Ally, MA; Yan, J; Bennett, G; Lyimo, N.N; Mayunga, S.D. Assessment of groundwater potential zones using remote sensing and GIS-based fuzzy analytical hierarchy process (F-AHP) in Mpwapwa District, Dodoma, Tanzania, Geosystems and Geoenvironment, 2024, 3(1), 100232, ISSN 2772-8838. [CrossRef]
- Razandi, Y., Pourghasemi, H.R., Neisani, N.S. et al. Application of analytical hierarchy process, frequency ratio, and certainty factor models for groundwater potential mapping using GIS. Earth Sci Inform 2015, 8, 867–883. [CrossRef]
- Kaur, L.; Rishi, M.S.; Singh, G.; Thakur, S.N. Groundwater potential assessment of an alluvial aquifer in Yamuna sub-basin (Panipat region) using remote sensing and GIS techniques in conjunction with analytical hierarchy process (AHP) and catastrophe theory (CT). Ecol Indic, 2019, 110, 105850. [CrossRef]
- Shekar, P.R; Mathew, A. Assessing groundwater potential zones and artificial recharge sites in the monsoon-fed Murredu river basin, India: An integrated approach using GIS, AHP, and Fuzzy-AHP, Groundwater for Sustainable Development, 2023, 23, 100994. [CrossRef]
- Aluko, O.E. and Igwe, O. An integrated geomatics approach to groundwater potential delineation in the Akoko-Edo Area, Nigeria, Environmental Earth Sciences, 2017, 76(6), p. 240. [CrossRef]
- Fashae, O.A., Tijani, M.N., Talabi, A.O. and Adedeji, O.I. Delineation of groundwater potential zones in the crystalline basement terrain of SW-Nigeria: an integrated GIS and remote sensing approach, Applied Water Science, (2014), 4(1), pp. 19–38. [CrossRef]
- Ifediegwu, S. I. Assessment of groundwater potential zones using GIS and AHP techniques: a case study of the Lafia district, Nasarawa State, Nigeria. Applied Water Science, 2022, 12(1). [CrossRef]
- Igwe, O., Ifediegwu, S.I. and Onwuka, O.S. Determining the occurrence of potential groundwater zones using integrated hydro-geomorphic parameters, GIS and remote sensing in Enugu State, Southeastern, Nigeria”, Sustainable Water Resources Management, 2020, 6, pp. 1–14. [CrossRef]
- Pinto, D., Shrestha, S., Babel, M.S. and Ninsawat, S. Delineation of groundwater potential zones in the Comoro watershed, Timor Leste using GIS, remote sensing and analytic hierarchy process (AHP) technique, Applied Water Science, 2017, 7(1), pp. 503–519. [CrossRef]
- Guru, B., Seshan, K. and Bera, S. (2017), Frequency ratio model for groundwater potential mapping and its sustainable management in cold desert, India, Journal of King Saud University-Science, 2017, 29(3), pp. 333–347. [CrossRef]
- Bala, A.E., Eduvie, O.M. and Byami, J. Borehole depth and regolith aquifer hydraulic characteristics of bedrock types in Kano area, Northern Nigeria, African J. of Env. Science and Tech, 2011, 5(3), pp. 228–237.
- Hamza, S.M., Ahsan, A., Imteaz, M.A., Ghazali, A.H. and Mohammed, T.A. GIS-based FRASTIC model for pollution vulnerability assessment of fractured-rock aquifer systems, Environmental Earth Sciences, 2017, 76(5), p. 197. [CrossRef]
- NPC (National Population Commission). Report on the population of Kano, 2023, Nigerian Population Commission Report. https://citypopulation.de/en/nigeria/admin/NGA020__kano/.
- Tukur, A I; Nabegu, AB; Umar, DA; Olofin, EA (2018) Sulaiman, WNA. Hydrology, 2018, 5(1). [CrossRef]
- Mukherjee, P., Singh, C.K. and Mukherjee, S. Delineation of groundwater potential zones in arid region of India—a remote sensing and GIS approach”, Water Resources Management, 2012, 26(9), pp. 2643–2672. [CrossRef]
- Saaty TL The analytic hierarchy process. McGraw-Hill, New York, 1980.
- Kaliraj, S., Chandrasekar, N. and Magesh, N.S. (2014), “Identification of potential groundwater recharge zones in Vaigai upper basin, Tamil Nadu, using GIS-based analytical hierarchical process (AHP) technique”, Arabian Journal of Geosciences, 2014, 7(4), pp. 1385–1401. [CrossRef]
- Singh, A., Panda, S.N., Kumar, K.S. and Sharma, C.S. Artificial groundwater recharge zones mapping using remote sensing and GIS: a case study in Indian Punjab, Environmental Management, 2013, 52(1), pp. 61–71. [CrossRef]
- Jaiswal, R.K., Mukherjee, S., Krishnamurthy, J. and Saxena, R. Role of remote sensing and GIS techniques for generation of groundwater prospect zones towards rural development–an approach”, Intern J. of Remote Sensing, 2003, 24(5), pp. 993–1008. [CrossRef]
- Hamza, S.M., Ahsan, A. and Sulaiman, W.N.A. GIS-Based Spatial Analysis Accurately Predicts Alluvial Well Depletion and Effectively Establishes Relationship between Aquifer Parameters, 8 International Conference on Water Resources and Arid Environments (ICWRAE 8): 449-460 22-24 January 2019, Riyadh, Saudi Arabia. 24 January.
- Chung, C.-J.F. and Fabbri, A.G. Validation of spatial prediction models for landslide hazard mapping, Natural Hazards, 2003, 30(3), pp. 451–472. [CrossRef]
- UN Water. A United Nations country report on SDG No. 6. Accessed from https://www.sdg6data.org/en/country-or-area/nigeria on 17/02/2024, 2022.
| Parameters | P1 | P2 | P3 | P4 | P5 | P6 | P7 | P8 | Weight |
|---|---|---|---|---|---|---|---|---|---|
| LULC (P1) | 1.00 | 0.33 | 0.33 | 0.25 | 0.50 | 1.00 | 0.33 | 0.50 | 4.24 |
| Drainage Density (P2) 3.00 | 1.00 | 0.50 | 0.50 | 3.00 | 3.00 | 1.00 | 2.00 | 14.0 | |
| Slope (P3) | 3.00 | 2.00 | 1.00 | 0.50 | 3.00 | 3.00 | 2.00 | 2.00 | 16.5 |
| Rainfall (P4) | 4.00 | 2.00 | 2.00 | 1.00 | 3.00 | 3.00 | 2.00 | 2.00 | 19.0 |
| Static water level (P5) | 2.00 | 0.33 | 0.33 | 0.33 | 1.00 | 2.00 | 0.50 | 0.50 | 6.99 |
| Soil media (P6) | 1.00 | 0.33 | 0.33 | 0.33 | 0.50 | 1.00 | 0.33 | 0.33 | 4.15 |
| Vadose media (P7) | 3.00 | 1.00 | 0.50 | 0.50 | 2.00 | 3.00 | 1.00 | 2.00 | 13.0 |
| Aquifer media (P8) | 2.00 | 0.50 | 0.50 | 0.50 | 2.00 | 3.00 | 0.50 | 1.00 | 10.0 |
| Sum | 19.0 | 7.49 | 5.49 | 3.91 | 15.0 | 19.0 | 7.66 | 8.53 | 86.08 |
| Parameters | P1 | P2 | P3 | P4 | P5 | P6 | P7 | P8 | Weight |
|---|---|---|---|---|---|---|---|---|---|
| LULC (P1) | 0.053 | 0.044 | 0.060 | 0.064 | 0.033 | 0.053 | 0.043 | 0.049 | 0.049 |
| Drainage Density (P2) | 0.158 | 0.134 | 0.091 | 0.128 | 0.200 | 0.158 | 0.131 | 0.194 | 0.149 |
| Slope (P3) | 0.158 | 0.267 | 0.182 | 0.128 | 0.200 | 0.158 | 0.261 | 0.194 | 0.194 |
| Rainfall (P4) | 0.2110.267 | 0.364 | 0.256 | 0.200 | 0.158 | 0.261 | 0.194 | 0.239 | |
| Static water level (P5) | 0.105 | 0.044 | 0.060 | 0.084 | 0.067 | 0.105 | 0.065 | 0.049 | 0.073 |
| Soil media (P6) | 0.053 | 0.044 | 0.060 | 0.084 | 0.033 | 0.053 | 0.043 | 0.032 | 0.051 |
| Vadose media(P7) | 0.158 | 0.134 | 0.091 | 0.128 | 0.133 | 0.158 | 0.131 | 0.194 | 0.141 |
| Aquifer media (P8) | 0.105 | 0.067 | 0.091 | 0.128 | 0.133 | 0.158 | 0.065 | 0.097 | 0.106 |
| Sum | 1.001 | 1.001 | 1.000 | 1.000 | 1.000 | 0.981 | 1.000 | 1.003 | 1.002 |
| Parameters | Sub classes | Ranks () | Weight () | Area (km2) | Area (%) |
| LULC | Water body | 5 | 0.049 | 317 | 1.58 |
| Vegetation | 4 | 18285 | 90.83 | ||
| Agriculture | 4 | 909 | 4.5 | ||
| Built up area | 3 587 2.92 | ||||
| Bare ground | 2 | 33 | 0.17 | ||
| Drainage | |||||
| Density (km/km2) | 20.883 – 53.994 | 5 | 0.149 | 130.0 | 0.65 |
| 53.995 – 87.105 | 4 | 10260 50.95 | |||
| 87.106 – 120.22 | 3 | 7828 | 38.90 | ||
| 120.23 – 153.33 | 2 | 1693 | 8.41 | ||
| 153.34 – 186.44 | 1 | 220.0 | 1.09 | ||
| Slope (Degrees) | (0 - 2) | 5 | 0.194 | 8949 | 44.45 |
| (3 - 4) | 4 | 9058 | 45.00 | ||
| (5 - 8) | 3 | 1879 | 9.37 | ||
| (9 - 20) | 2 | 195 | 0.97 | ||
| (>20) | 1 | 50 | 0.25 | ||
| Rainfall (mm) | 1340 – 1510 | 5 | 0.239 | 748 | 3.70 |
| 170 – 1330 | 4 | 295 | 1.48 | ||
| 982 – 1160 | 3 | 276 | 1.37 | ||
| 806 – 981 | 2 | 8825 | 43.85 | ||
| 629 – 805 | 1 | 9987 | 49.60 | ||
| Static water level (m) | 1.4 – 9.6 | 5 | 0.073 | 6358 | 31.6 |
| 9.7 – 18 | 4 | 9103 | 45.2 | ||
| 19 – 26 | 3 | 4187 | 20.8 | ||
| 27 – 34 | 2 | 463 | 2.30 | ||
| 35 – 43 | 1 | 20 | 0.10 | ||
| Soil media | Sand | 5 | 0.051 | 184 | 0.92 |
| Sandy loam | 4 | 1018 | 5.06 | ||
| Peat | 4 | 2664 | 13.2 | ||
| Loam | 3 | 8968 | 44.6 | ||
| Silt | 2 | 4756 | 23.6 | ||
| Clay loam | 2 | 1736 | 8.62 | ||
| Non aggregated clay | 1 | 805 | 4.0 | ||
| Vadose media | Sandstone | 4 | 0.141 | 824 | 4.0 |
| Metamorphic/igneous | 3 | 175 | 0.87 | ||
| Shale | 3 | 12422 | 61.7 | ||
| Silt/clay | 2 | 6710 | 33.33 | ||
| Aquifer media | Sand/gravel | 5 | 0.106 | 613 | 3.0 |
| Thin-bedded sand | 4 | 218911.0 | |||
| Metamorphic/igneous | 3 | 5647 | 28.0 | ||
| Weathered rock | 3 | 1682 | 58.0 |
| S/No | Boreholes ID | Classification (l/min) | Category |
|---|---|---|---|
| 1 | W1 - W80 | <50 | Low |
| 2 | W81 – W209 | 50 – 100 | Moderate |
| 3 | W210– W245 | >100 | High |
Disclaimer/Publisher’s Note: The statements, opinions and data contained in all publications are solely those of the individual author(s) and contributor(s) and not of MDPI and/or the editor(s). MDPI and/or the editor(s) disclaim responsibility for any injury to people or property resulting from any ideas, methods, instructions or products referred to in the content. |
© 2024 by the authors. Licensee MDPI, Basel, Switzerland. This article is an open access article distributed under the terms and conditions of the Creative Commons Attribution (CC BY) license (http://creativecommons.org/licenses/by/4.0/).


