
Submitted:
23 February 2024
Posted:
23 February 2024
You are already at the latest version
Abstract
Dry periods and drought are inherent natural occurrences. However, due to the increasing pressures of global warming and climate change, these events become more frequent and severe on a global scale. These phenomena can be traced with various indicators and related indices proposed by various scholars. In general, drought risk assessment is done by modelling these indicators and determining the drought occurrence probabilities. The proposed adaptation introduces the "Kaplan-Meier Estimator," a non-parametric statistic traditionally used in medical contexts to estimate survival functions from lifetime data. The study aims to repurpose this methodology to assess drought risk by treating past droughts as "events" and evaluating the Standardized Precipitation Index (SPI) and Standardized Precipitation Evapotranspiration Index (SPEI) and map these results for a better understanding of the drought risks within larger spatial scales such as a river basin. The adapted method provides the probability of non-occurrence, with inverted results indicating the likelihood of drought occurrence. As a case study, the method is applied to SPI and SPEI values at different time steps (3, 6, and 12 months) across 27 meteorological stations in the Gediz River Basin, located in Western Turkey—a region anticipated to be profoundly affected by global climate change. The results are represented as the generated drought risk maps and curves, which indicate that (i) drought risks increase as the considered period extends, (ii) drought risks decrease as the utilized indicator timescales increase, (iii) locally plotted drought curves indicate higher drought risks as their initial slope get steeper. The method used enables the generation of historical evidence based spatially distributed drought risk maps which expose more vulnerable areas within the river basin.
Keywords:
Kaplan-Meier estimator
; Drought Risk Assessment
; SPI
; SPEI
1. Introduction
Drought, a recurring and multifaceted phenomenon, is a widely studied actual topic which is a complex interplay between atmospheric, land, and water resource systems [1,2,3]. It manifests through prolonged periods of below-average precipitation, leading to depleted soil moisture, reduced surface water availability, and cascading impacts across various sectors [4]. Its negative impacts are far-reaching, including agricultural losses, water and food insecurity, economic instability, mass migrations, and environmental degradation [5].
In order to develop strategies and approaches to mitigate the effects of drought and provide water security, firstly the concept of drought in the examined case study is defined in its current state [5,6,7]. This is expressed by drought indicators based on the historical timeseries of water sources such as precipitation, streamflow, etc. Drought indicators help us to define quantitative or qualitative parameters of the system for the evaluation of drought monitoring and prediction [8,9]. These tools then eventually may serve decision-makers in developing policies against the adverse effects of droughts.
The study uses two of the most widely used drought indicators; the Standardized Precipitation Index (SPI) [10] and its climatic water balance variant, the Standardized Precipitation-Evapotranspiration Index (SPEI) [11] to evaluate the droughts experienced in the study area. Due to their low data requirements, ease of calculation and interpretation, and flexible natures, SPI and SPEI have been a staple for drought studies [12,13,14,15,16].
While the drought indicators may define the states of the hydrologic systems, drought risk assessment is the crucial step for informed decision-making [17], targeting drought interventions [18], enhanced preparedness [19], resilience of the hydrologic systems [20], risk reduction and cost-benefit analysis [21], and sustainable development and climate change adaptation [22]. However, defining drought risk is an abundantly discussed topic, as there are newly introduced concepts such as critical drought severity, singular drought, and within-period drought [23]. Although these discussions are useful for our understanding of complex concepts of drought and its risk, the presented study offers a more practical method that requires less data for the determination of drought risk, which is important considering scarce data availability on the global scale.
In that regard, the Kaplan-Meier estimator has been used in the evaluation of the SPI/SPEI drought indicators, which was originally introduced by Kaplan and Meier in 1958 [24] and is a widely used method for analyzing survival-data in medical science, that is the calculated value of human patients’ survivability probability after a certain applied treatment. The Kaplan-Meier estimator’s popularity stems from its key attributes such as its nonparametric nature, its direct translation of observed data into a survival curve, censored data handling, and statistical robustness. The study uses the Kaplan-Meier estimator based on the constructive interaction that every wet period ends with a following dry period, which can be considered as the limit of the wet period. Determining the survival curve of the study area based on the SPI and SPEI values would then indicate the survival of the wet periods. An inverse calculation defines the survival probabilities of the dry periods, or simply the drought risks.
Assessment of drought risk has a variety of approaches and applications around the globe where researchers usually monitor drought risk as a combination of some sub-indicators both around the globe [25,26,27,28], and in national boundaries [29,30,31,32]. The study supports these approaches as the adapted methodology can be used with other drought indicators.
This study’s objective is to explore the drought risks associated with the meteorological station data within the designated study area, by extrapolating the spatial distribution between these stations to generate comprehensive drought risk maps across different periods. The research introduces an innovative approach to assess drought risks within the examined region, aiming to assist decision-makers in prioritizing, evaluating, and formulating relevant policies.
Conversely, it is crucial to acknowledge certain limitations of the study, that primarily revolve around the availability of temporal and spatial data, as well as the precision and accuracy of extrapolated drought risk values due to the resolution of data representation.
2. Materials and Methods
2.1. Study Area and Data Selection
The study area is the Gediz River Basin (GRB) located in Western Turkey and shown in Figure 1 and has over sixty meteorological stations in and around its boundaries, however, some of the stations lack reliable data as some others are too close to each other causing repeated information. Data availability, a common challenge globally, is one of the primary driving factors in choosing the proper stations to represent the study area in time and space dimensions. Out of sixty-eight meteorological stations considered around GRB, 27 were selected according to their data availability and spatial location aiming homogeny in data representation. The basin substantially changed in the 90s era due to anthropogenic activities and climate change related pressures. Thus, the declining water resources and increasing urban and industrial demands raise concerns for water quality and quantity. Determining and projecting potential future droughts is a valuable tool in decision-making and planning for the basin [33].
Station records range between the years 1924 and 2013 but the majority of the data is available between the 1960s and late 1990s (Table S1). The missing data among selected stations were imputed by the R software according to linear regression. The R software is a free and open-source programming language and software environment for statistical computing and graphics. The package “MICE” was used in the data imputation process [34].
2.2. SPI/SPEI Calculations
The SPI is computed by the cumulative precipitation over k months, defined as the accumulation periods, fitted to a parametric statistical distribution from which probabilities are transformed to the standard normal distribution. The SPEI is determined in the same manner with a nuance which is the cumulative climatic water balance, defined as the difference between precipitation and the Potential Evapotranspiration (PET). The PET described in this study has been calculated according to the Hargreaves equation [35], which actually calculates reference evapotranspiration (ET0) but is considered equivalent [36]. Determined probabilities are then converted to the standard normal distribution to generate the final drought index values. Equations for SPI and SPEI are given below,
where Pi is the total precipitation of the station on the i-th month, Pm is the mean precipitation, and σx is the standard deviation of the analyzed precipitation series.
For the calculation of SPEI, the difference (Di) between precipitation (P) and PET for the month (i) is given in Equation 3.
The calculated D values are accumulated at different time scales as follows:
where k is the timescale (months) of the aggregation and n is the calculation month.
The probability density function of a Log-log distribution is given as:
where α, β and γ are scale, shape and origin parameters respectively for γ > D <∞. The probability distribution function for the D series is then given as:
With f(x) the SPEI can be obtained as the standardized values of F(x) according to the method of Abramowitz et al. (1965) [37]:
where P is the probability of exceeding a determined Di value and is given as P=1-f(x) while the constants are:
The SPI and SPEI values for the 3-, 6-, and 12-month accumulation periods were calculated for the selected stations by the “SPEI package” of the R software. Timescales selected as 3, 6, and 12 months as shorter timescales are generally used as indicators for reduced soil moisture and flow in relatively small tributaries of a river, and longer timescales are commonly used as indicators for reduced streamflow and reservoir storage. They can be used as indicators of different types of droughts.
2.3. Adaption and Adoption of Kaplan-Meier Estimator for Drought Risk Assessment
The calculated values of SPI and SPEI are classified as wet and dry states (Table 1). The transitioning of wet state to dry state or drought occurrence indicates the “events” described by Kaplan-Meier [24]. The study is based on this synergy where the drought occurrences are named “events”. Thus, applying the Kaplan-Meier or “Product-Limit” estimator would produce the product limit or the survivability of the wet periods (in this case months).
where ti is the time at which a dry state occurs; ni is the total number of wet states at the time ti and di is the number of dry states that occurred at time ti.
Since dry states can occur consecutively, the adapted method also includes the following dry state occurrences in the same wet period. This provides additional knowledge about the occurrence probabilities of the following dry states, not just the initial one, e.g., Ahmetli station has 32 wet periods but 44 recorded dry states. Including every dry state into the equation requires an update on the description of ni, which now can explain as “number of dry states hasn’t happened yet at the time ti” or “number of unrealized dry states”.
The result S(ti) indicates the probability of a wet period lasting longer than ti or the “event” not taking place at the time ti, on a drought risk perspective 1-S(t) would describe the probability of “event” taking place or the drought occurrence risk, DR(t) (Table 2).
3. Results and Discussion
The drought risks of the 27 meteorological stations according to the 3-, 6, and 12-month SPI/SPEI values and the adapted Kaplan-Meier Estimator method, are calculated (Table S2-217). According to the results, 3-, 6-, and 12-month drought risk values for each station have been integrated with the stations locations via ArcGIS software. Local SPI/SPEI drought risk values were then plotted as the drought risk maps by using ArcGIS. Point values extrapolated via the “SPLINE” tool of ArcGIS (Figure 2, Figure 3, Figure 4, Figure 5, Figure 6 and Figure 7).
The plotted drought risk maps present the drought risk possibility after a 3-, 6-, or 12-month period according to SPI or SPEI values of 3-, 6-, or 12-month timescales (Figure 2, Figure 3, Figure 4, Figure 5, Figure 6 and Figure 7). While the lower drought risk percentages are represented by colder colour tones (blue-green), higher risk percentages are represented by warmer colour tones (red-orange). As demonstrated, an array of visual results provided as tools for decision-making for various levels of decision-makers and stakeholders. As the density of given information to end-users and decision makers may be confusing due to their complex nature, spatially distributed maps are helpful tools to demonstrate vulnerable hotspots for different time scales to aid comprehension of drought risks by stakeholders and decision makers. It must be noted that the drought risk maps are generated based on a specific case; for instance, a request for drought risk mapping for the next cultivation season will require a shorter time scale of a chosen drought index such as SPI, but when the presentation of climate change effect is a necessity, another drought risk mapping based on SPEI for a longer planning activity may be the preference of a decision maker institution obliged for the implementation of policies and preventive measures.
Produced drought risk maps can be interpreted both in comparison and on point value. For instance, in Figure 2, Ahmetli station represents higher drought risks compared to the other locations around it, but specifically according to the SPI-3, there is a 36%, 61% and 85% risk that Ahmetli will experience drought in the next 3, 6 and 12 months, respectively.
In general, each of the results plotted and shown in Figure 2, Figure 3, Figure 4, Figure 5, Figure 6 and 7 indicate that, as the period of the inquired drought risk increases, the drought risk also increases. This is due to the fact that as the inquiry period increases, it is more likely that the months considered as “dry” are also included into the calculations. It is also observed that as the timescales of the calculated SPI or SPEI values increase, drought risks decrease. As the timescales of the SPI or SPEI increases, the accumulated values tend to represent an average and thus the extreme events such as floods or droughts are inclined to diminish.
Conversely, a comparison between the SPI and SPEI drought risk maps indicate that for most of the study area the observed results are consistent, other than slight differences due to added information of PET by the SPEI.
While drought risk maps help to capture the general idea and condition of the study area, drought risk curves can be also used to focus on specific locations, such Lake Marmara in Gediz case. Drought risk curves of Lake Marmara derived from SPI (Figure 8a) and SPEI (Figure 8c) values and demonstrated below, validates historical records of regional droughts experienced by local farmers at first-hand. Situated in the centre of the GRB, Lake Marmara suffers from droughts severely and drought risks exponentially increases on shorter periods, which indicates occurrence of drought are often in the region regarding all of the SPI and SPEI timescales. Conversely, in comparison to Lake Marmara, SPI and SPEI drought curves of Salihli station, which is a relatively wetter location, reveals a decreasing risk of a drought considering the slopes of the probability curves (Figure 8b, d).
The presented study undertakes the adaptation of the Kaplan-Meier Survivability Estimator method for the purpose of regional drought risk analysis. There is a certain amount of other studies on the subject where the researchers estimate drought risk either with other statistical methods such as Average Recurrence Interval [38], Likelihood of impact occurrence [3], or the correlation between drought indices and their impacts [39] examining the timeseries of a/several drought index/indices or as an index combination of drought hazard and vulnerability [40]. Although most of these studies involve complex calculation processes with rich data requirements, the results represent the related study areas on a coarser level of resolution [41,42].
However, the presented study suggests a simpler but an efficient approach. First, the proposed methodology enables an easy computation of probabilities and can be applied to various drought indices. The previous studies examining agricultural drought risk only through SPI also have the potential for underestimating the agricultural drought risk under global climate change [42,43,44]. Consequently, the study has a potential as a flexible tool that can be used in diverse studies. Second, the generated drought risk maps, which can be produced in high resolution (<30m) depending on the data availability, are emphasized for their substantial value to stakeholders. Owing to their accessible and interpretable nature, both technical and non-technical stakeholders can comprehend and evaluate the provided maps. This holds value as conflicts among stakeholders are often rooted back to lack of comprehension of technical nuances, which may not be immediately apparent to non-technical counterparts. Furthermore, high resolution maps can also provide more information on drought risk for the plots of individual farmers.
The utility of drought risk maps extends to decision-makers, aiding in the identification of high-risk areas within the examined region. This information, when demonstrated in terms of spatial and temporal considerations, enables the formulation of targeted preventive measures, including but not limited to local irrigation rotations, adjustments in crop patterns, and investments in irrigation infrastructure. The applicability of such comparative analyses extends not only within the studied region but also to neighbouring areas extending from river basins to national and international boundaries.
Moreover, the study underscores the value of drought curves in understanding localized drought risk trends. These curves offer a comprehensive perspective compared to drought risk maps, particularly for focal points of significance and hotspots like degraded wetlands.
The specific outcomes of the study are enumerated as follows: firstly, an observed increase in drought risk with the extension of the inquiry period, a rationale attributed to the inclusion of more months during typically dry periods; secondly, a decrease in drought risk as the timescale of the SPI or SPEI calculation increases, owing to the cumulative effect that tends to average out extremes; thirdly, consistent results in plotted SPI and SPEI drought risk maps across most of the study area, with slight variations attributed to the incorporation of potential evapotranspiration (PET) by SPEI; and finally, the identification of high drought risk areas through drought curves characterized by steeper initial slopes.
4. Summary and Conclusions
The integration of the Kaplan-Meier Estimator method into drought risk assessment is yielding practical and visually informative tools for diverse decision-makers and stakeholders, ranging from individual farmers to larger-scale farming enterprises and governmental bodies and municipalities.
This tool offers easy probability calculations and applies to various drought indices, making it a flexible tool. Importantly, the generated drought risk maps are valuable for stakeholders due to their clear and accessible nature, bridging the gap between technical and non-technical understanding. These spatially distributed drought risk maps also aid decision-makers, and water-managers in exposing more vulnerable areas of the river basin based on historical evidence, enabling targeted interventions like irrigation management and infrastructure investment. Additionally, the study highlights the value of drought curves for understanding localized trends, providing a deeper perspective for specific hotspots like degraded wetlands. The low data requirement of the selected drought indicators, the method’s adaptability to other drought indicators, and the easy-to-understand visual representation of the results make this adaptation promising and extend its applicability beyond the studied region, informing neighboring areas and potentially influencing national and international water management strategies.
On the other hand, it must be also underlined that the proposed methodology has its limitations mostly due to data availability, and accuracy of the fictitious values that extrapolated between stations. The utilized SPI/SPEI timescales (3-, 6-, and 12-month) while inquiring the drought risks can be optimized in future studies to focus on a specific aim supported by the in-situ measurements or records of historical droughts such as detecting short-term extreme droughts that can be lost due to accumulation of indicator values on longer timescales. Same methodology can be followed with the longer timescales for detecting longer, persisting droughts with lower magnitudes. Moreover, characteristics of the drought curves such as the slope or angle of the initial section of the curve, etc., can be classified into post-defined sub-categories such as the wet and dry states.
Supplementary Materials
The following supporting information can be downloaded at the website of this paper posted on Preprints.org., Table S1: Data availability of the selected 27 meteorological stations; Table S2-217: Kaplan-Meier Estimator, drought risk calculations for all 27 meteorological stations.
Funding
This research was carried out within the MARA-MEDITERRA project that has received funding from the Horizon 2020 European Union Funding for Research & Innovation under the Partnership for Research and Innovation in the Mediterranean Area Programme (PRIMA) Grant Agreement No. 2121 and its sister project UNIMED that has received funding from TUBITAK-MCST Joint R&I Call, which is also supported by PRIMA. The APC was funded by the MARA-MEDITERRA Project.
Institutional Review Board Statement
Not applicable.
Data Availability Statement
The data presented in this study are available on request from the corresponding author.
Conflicts of Interest
The authors declare no conflict of interest.
References
- Hao:, Z.; Singh, V.P. Drought characterization from a multivariate perspective: A review. Journal of Hydrology 2015, 527, 668–678. [Google Scholar] [CrossRef]
- Ojha, S.S.; Singh, V.; Roshni, T. Comparison of meteorological drought using SPI and SPEI. Civ. Eng. J 2021, 7, 2130–2149. [Google Scholar] [CrossRef]
- Blauhut, V.; Gudmundsson, L.; Stahl, K. Towards pan-European drought risk maps: quantifying the link between drought indices and reported drought impacts. Environmental Research Letters 2015, 10(1), 014008. [Google Scholar] [CrossRef]
- Dai, A. (2011) Drought under global warming: a review, Wiley Interdisciplin. Rev.: Clim. Change 2011, 2, 45–65. [Google Scholar] [CrossRef]
- Mishra, A.K.; Singh, V.P. A review of drought concepts. Journal of hydrology 2010, 391(1-2), 202-216. [CrossRef]
- Haile, G.G.; Tang, Q.; Li, W.; Liu, X.; Zhang, X. Drought: Progress in broadening its understanding. Wiley Interdisciplin. Rev.: Water 2020, 7(2), e1407. [Google Scholar] [CrossRef]
- AghaKouchak, A.; Mirchi, A.; Madani, K.; Baldassarre, G. D.; Nazemi, A.; Alborzi, A.; Anjileli, H.; Azarderakhsh, M.; Chiang, F.; Hassanzadeh, E.; Huning, L.S.; Mallakpour, I.; Martinez, A.; Mazdiyasni, O.; Moftakhari, H.; Norouzi, H.; Sadegh, M.; Sadeqi, D.; Van Loon, A.F.; Wanders, N. Anthropogenic Drought: Definition, Challenges, and Opportunities. Reviews of Geophysics 2021, 59(2), e2019RG000683. [Google Scholar] [CrossRef]
- Feng, P.; Wang, B.; Li Liu, D.; Yu, Q. Machine learning-based integration of remotely-sensed drought factors can im-prove the estimation of agricultural drought in South-Eastern Australia. Agricultural Systems 2019, 173, 303–316. [Google Scholar] [CrossRef]
- Meza, I.; Siebert, S.; Döll, P.; Kusche, J.; Herbert, C.; Eyshi Rezaei, E.; Nouri, H.; Gerdener, H.; Popat, E.; Frischen, J.; Naumann, G.; Vogt, J.V.; Walz, Y.; Sebesvari, Z.; Hagenlocher, M. Global-scale drought risk assessment for agricultural systems. Nat. Hazards Earth Syst. Sci. 2020, 20, 695–712. [Google Scholar] [CrossRef]
- McKee, T.B.; Doesken, N.J.; Kleist, J. The relationship of drought frequency and duration to time scales. In Proceedings of the 8th Conference on Applied Climatology, American Meteorological Society Anaheim, USA, 12-17 January 1993. [Google Scholar]
- Vicente-Serrano, S.M.; Beguería, S.; López-Moreno, J.I. A multiscalar drought index sensitive to global warming: the standardized precipitation evapotranspiration index. Journal of climate 2010, 23(7), 1696–1718. [Google Scholar] [CrossRef]
- Pei, Z.; Fang, S.; Wang, L.; Yang, W. Comparative Analysis of Drought Indicated by the SPI and SPEI at Various Timescales in Inner Mongolia, China. Water 2020, 12(7), 1925. [Google Scholar] [CrossRef]
- Kamruzzaman, M.; Almazroui, M.; Salam, M.A.; et al. Spatiotemporal drought analysis in Bangladesh using the standardized precipitation index (SPI) and standardized precipitation evapotranspiration index (SPEI). Sci Rep 2022, 12, 20694. [Google Scholar] [CrossRef]
- Liu, C.; Yang, C.; Yang, Q.; et al. Spatiotemporal drought analysis by the standardized precipitation index (SPI) and standardized precipitation evapotranspiration index (SPEI) in Sichuan Province, China. Sci Rep 2021, 11, 1280. [Google Scholar] [CrossRef]
- Tirivarombo, S.; Osupile, D.; Eliasson, P. Drought monitoring and analysis: Standardised Precipitation Evapotranspiration Index (SPEI) and Standardised Precipitation Index (SPI). Physics and Chemistry of the Earth, Parts A/B/C. [CrossRef]
- Fuchs, B.A.; Svoboda, M.D.; Wilhite, D.A.; Hayes, H.J. Drought indices for drought risk assessment in a changing climate. In Handbook of Engineering Hydrology. Eslamian, S. Ed.; CRC Press: Boca Raton, FL, USA, 2014; pp. 217–231. [Google Scholar]
- Mens, M.J.P.; van Rhee, G.; Schasfoort, F.; Kielen, N. Integrated drought risk assessment to support adaptive policymaking in the Netherlands. Nat. Hazards Earth Syst. Sci. 2022, 22, 1763–1776. [Google Scholar] [CrossRef]
- Goodwin, D.; Holman, I.; Sutcliffe, C.; Salmoral, G.; Pardthaisong, L.; Visessri, S.; Ekkawatpanit, C.; Rey, D. The contribution of a catchment-scale advice network to successful agricultural drought adaptation in Northern Thailand. Phil. Trans. R. Soc. A. 2022, 380, 2021029320210293. [Google Scholar] [CrossRef]
- Solh, M.; van Ginkel, M. Drought preparedness and drought mitigation in the developing world׳s drylands. Weather and Climate Extremes 2014, 3, 62–66. [Google Scholar] [CrossRef]
- Smith, S.M.; Edwards, E.C. Water storage and agricultural resilience to drought: historical evidence of the capacity and institutional limits in the United States. Environ. Res. Lett. 2021, 16, 124020. [Google Scholar] [CrossRef]
- Mutenje, M.J.; Farnworth, C.R.; Stirling, C.; Thierfelder, C.; Mupangwa, W.; Nyagumbo, I. A cost-benefit analysis of cli-mate-smart agriculture options in Southern Africa: Balancing gender and technology. Ecological Economics 2019, 163, 126–137. [Google Scholar] [CrossRef]
- Nhemachena, C.; Nhamo, L.; Matchaya, G.; Nhemachena, C.R.; Muchara, B.; Karuaihe, S.T.; Mpandeli, S. Climate Change Impacts on Water and Agriculture Sectors in Southern Africa: Threats and Opportunities for Sustainable Development. Water 2020, 12, 2673. [Google Scholar] [CrossRef]
- Cavus, Y.; Aksoy, H. Critical drought severity/intensity-duration-frequency curves based on precipitation deficit. Journal of Hydrology 2020, 584, 124312. [Google Scholar] [CrossRef]
- Kaplan, E. L.; Meier, P. Nonparametric estimation from incomplete observations. Journal of the American Statistical Association 1958, 53(282), 457–481. [Google Scholar] [CrossRef]
- Vogt, J.V.; Naumann, G.; Masante, D.; Spinoni, J.; Cammalleri, C.; Erian, W.; Pischke, F.; Pulwarty, R.; Barbosa, P. Drought Risk Assessment. A conceptual Framework. EUR 29464 EN, Publications Office of the European Union, Luxembourg, 2018. ISBN 978-92-79-97469-4. [CrossRef]
- Nasrollahi, M.; Khosravi, H.; Moghaddamnia, A.; et al. Assessment of drought risk index using drought hazard and vulnerability indices. Arab J Geosci 2018, 11, 606. [Google Scholar] [CrossRef]
- Nikolova, N.; Micu, D. M; Dumitrescu, A; Radeva, K.; Paraschiv, M.; Cheval, S.; Todorov, L. A SPEI-Based Approach to Drought Hazard, Vulnerability and Risk Analysis in the Lower Danube River Region. In Lower Danube River, Negm, A., Zaharia, L., Ioana-Toroimac, G. Eds.; Springer, Cham. [CrossRef]
- Li, Q.; Chen, L.; Xu, Y. Drought risk and water resources assessment in the Beijing-Tianjin-Hebei region, China. Science of The Total Environment 2022, 832, 154915. [Google Scholar] [CrossRef] [PubMed]
- Danandeh Mehr, A.; Sorman, A.U.; Kahya, E.; Afshar, M.H. Climate change impacts on meteorological drought using SPI and SPEI: case study of Ankara, Turkey, Hydrological Sciences Journal 2020, 65(2), 254-268. [CrossRef]
- Dikici, M.; Aksel, M. Comparison of SPI, SPEI and SRI drought indices for Seyhan Basin. International Journal of Electronics Mechanical and Mechatronics Engineering 2019, 9(4), 1751–1762. [Google Scholar]
- Dikici, M. Drought analysis with different indices for the Asi Basin (Turkey). Sci Rep 2020, 10, 20739. [Google Scholar] [CrossRef]
- Soydan Oksal, N.G. Comparative analysis of the influence of temperature and precipitation on drought assessment in the Marmara region of Turkey: an examination of SPI and SPEI indices. Journal of Water and Climate Change 2023, 14(9), 3096–3111. [Google Scholar] [CrossRef]
- Kumar, V.; Del Vasto- Terrientes, L.; Valls, A.; Schuhmacher, M. Adaptation strategies for water supply management in a drought prone Mediterranean river basin: Application of outranking method. Science of the Total Environment 2016, 540, 344–357. [Google Scholar] [CrossRef] [PubMed]
- Van Buuren, S.; Groothuis-Oudshoorn, K. mice: Multivariate Imputation by Chained Equations in R. Journal of Statistical Software 2011, 45(3), 1–67. [Google Scholar] [CrossRef]
- Hargreaves, G.H. Defining and Using Reference Evapotranspiration. Journal of Irrigation and Drainage Engineering 1994, 120(6), 1132–1139. [Google Scholar] [CrossRef]
- Trabucco, A.; Zomer, R.J. Global aridity index and potential evapotranspiration (ET0) climate database v2. Figshare, 2019, e. [CrossRef]
- Abramowitz, M.; Stegun, I.A. Handbook of Mathematical Functions, with Formulas, Graphs, and Mathematical Tables. US Government printing office: Washington D.C., USA, 1968; pp. 1046.
- Hui-Mean, F.; Yusop, Z.; Yusof, F. Drought analysis and water resource availability using standardised precipitation evapotranspiration index. Atmospheric Research 2018, 201, 102–115. [Google Scholar] [CrossRef]
- Wang, Y.; Lv, J.; Hannaford, J.; Wang, Y.; Sun, H.; Barker, L.J.; Ma, M.; Su, Z.; Eastman, M. (2020). Linking drought indices to impacts to support drought risk assessment in Liaoning province, China. Natural Hazards and Earth System Sciences. [CrossRef]
- Zeng, Z.; Wu, W.; Li, Z.; Zhou, Y.; Guo, Y.; Huang, H. Agricultural drought risk assessment in Southwest China. Water 2019, 11(5), 1064. [Google Scholar] [CrossRef]
- Hao, L.; Zhang, X.; Liu, S. Risk assessment to China’s agricultural drought disaster in county unit. Nat. Hazards 2012, 61, 785–801. [Google Scholar] [CrossRef]
- He, B.; Wu, J.; Lu, A.; Cui, X.; Zhou, L.; Liu, M.; Zhao, L. Quantitative assessment and spatial characteristic analysis of agricultural drought risk in China. Nat. Hazards 2013, 66, 155–166. [Google Scholar] [CrossRef]
- Zhang, Q.; Sun, P.; Li, J.; Xiao, M.; Singh, V.P. Assessment of drought vulnerability of the Tarim River basin, Xinjiang, China. Theor. Appl. Climatol. 2015, 121, 337–347. [Google Scholar] [CrossRef]
- Azam, M.; Maeng, S.J.; Kim, H.S.; Murtazaey, A. Copula-based stochastic simulation for regional drought risk assessment in South Korea. Water 2018, 10, 359. [Google Scholar] [CrossRef]
Figure 1.
Gediz River Basin and selected meteorological stations.
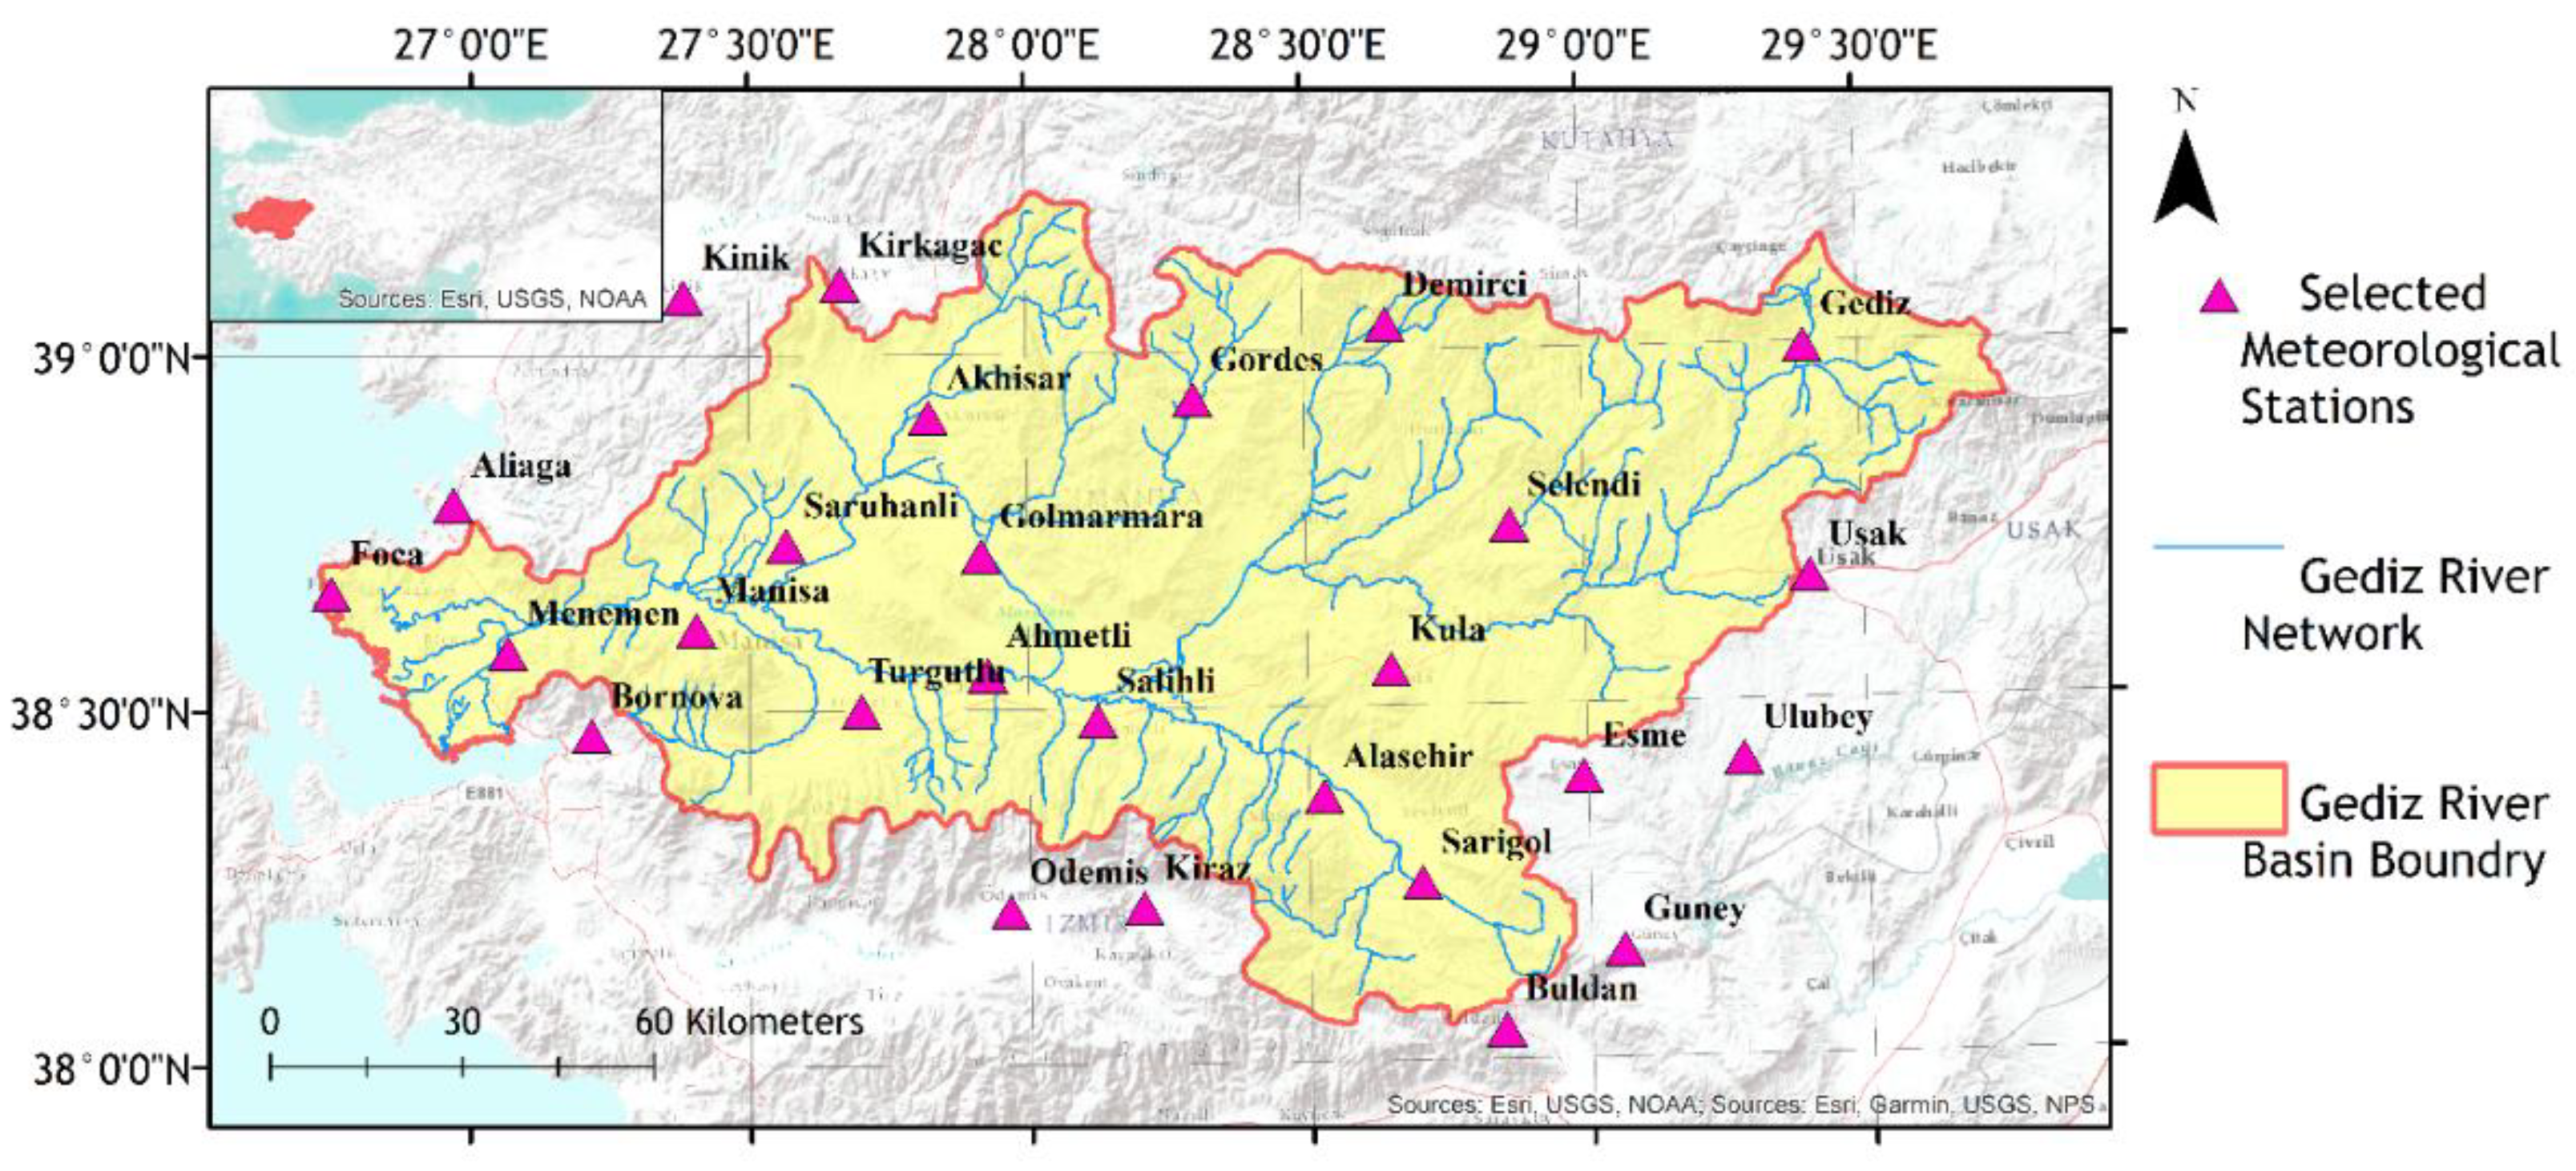
Figure 2.
Drought risk maps of; (a) 3-month, (b) 6-month, and (c) 12-month periods according to SPI-3.
Figure 2.
Drought risk maps of; (a) 3-month, (b) 6-month, and (c) 12-month periods according to SPI-3.
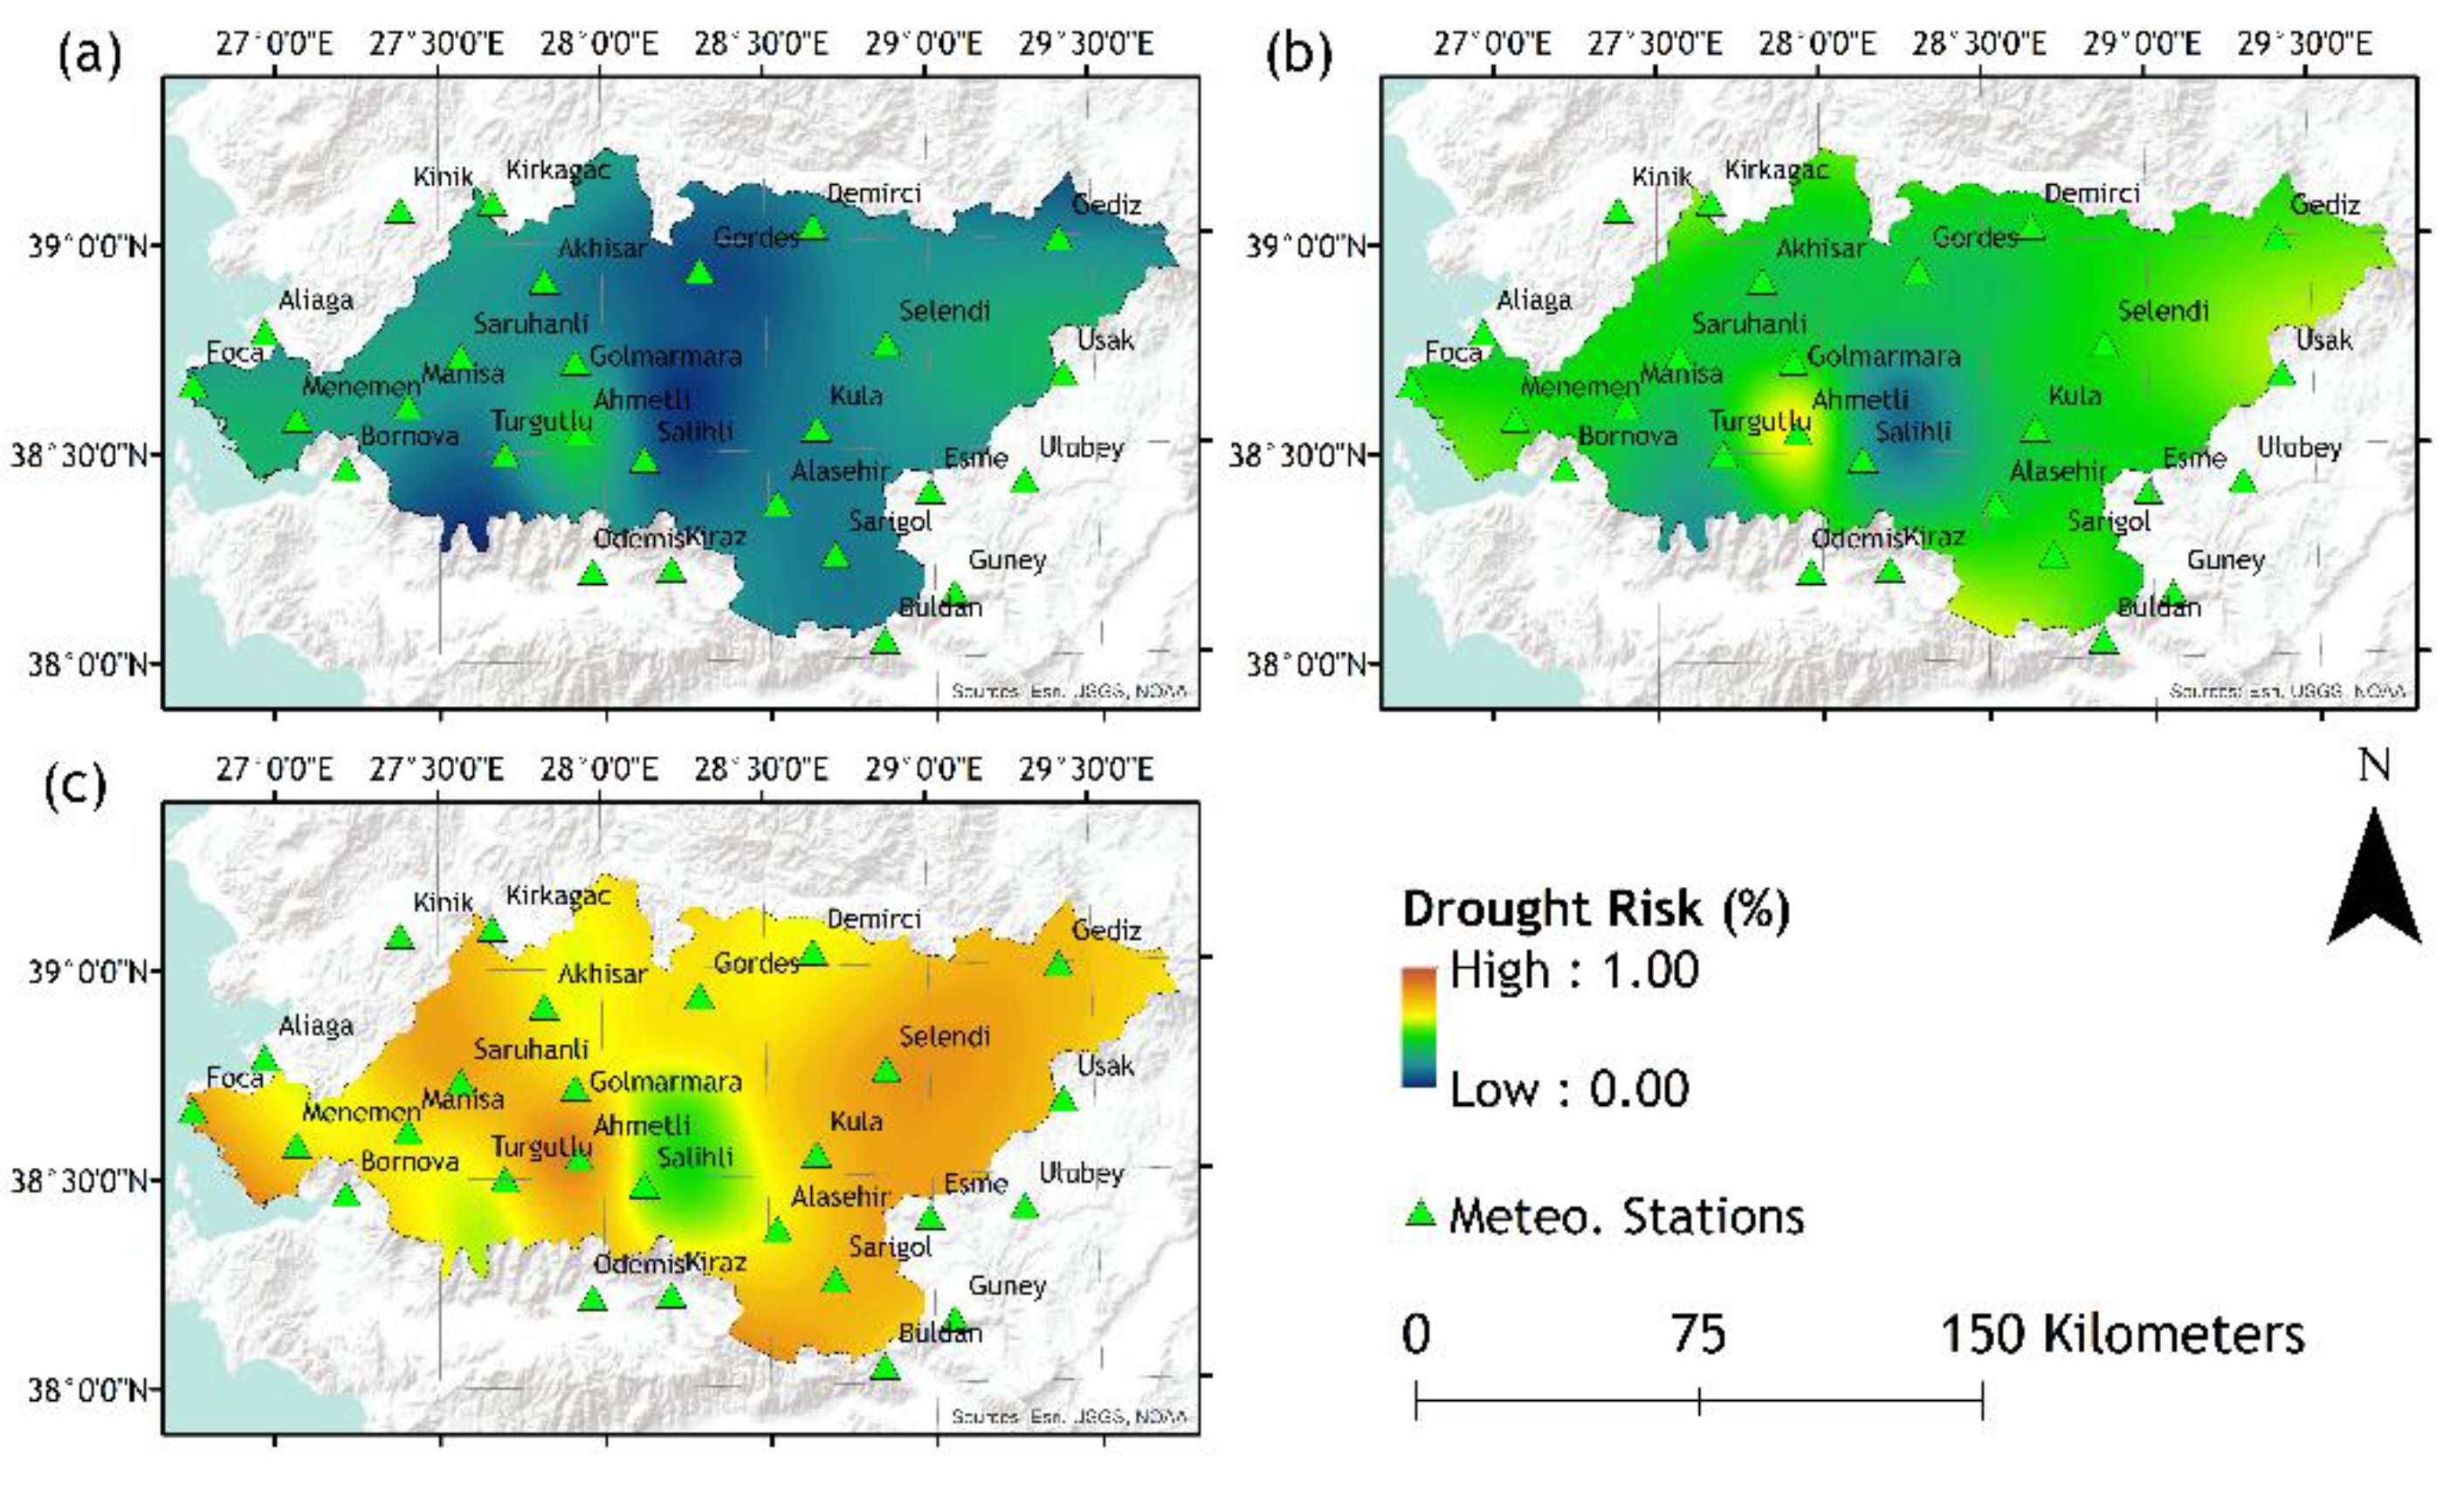
Figure 3.
Drought risk maps of; (a) 3-month, (b) 6-month, and (c) 12-month periods according to SPI-6.
Figure 3.
Drought risk maps of; (a) 3-month, (b) 6-month, and (c) 12-month periods according to SPI-6.
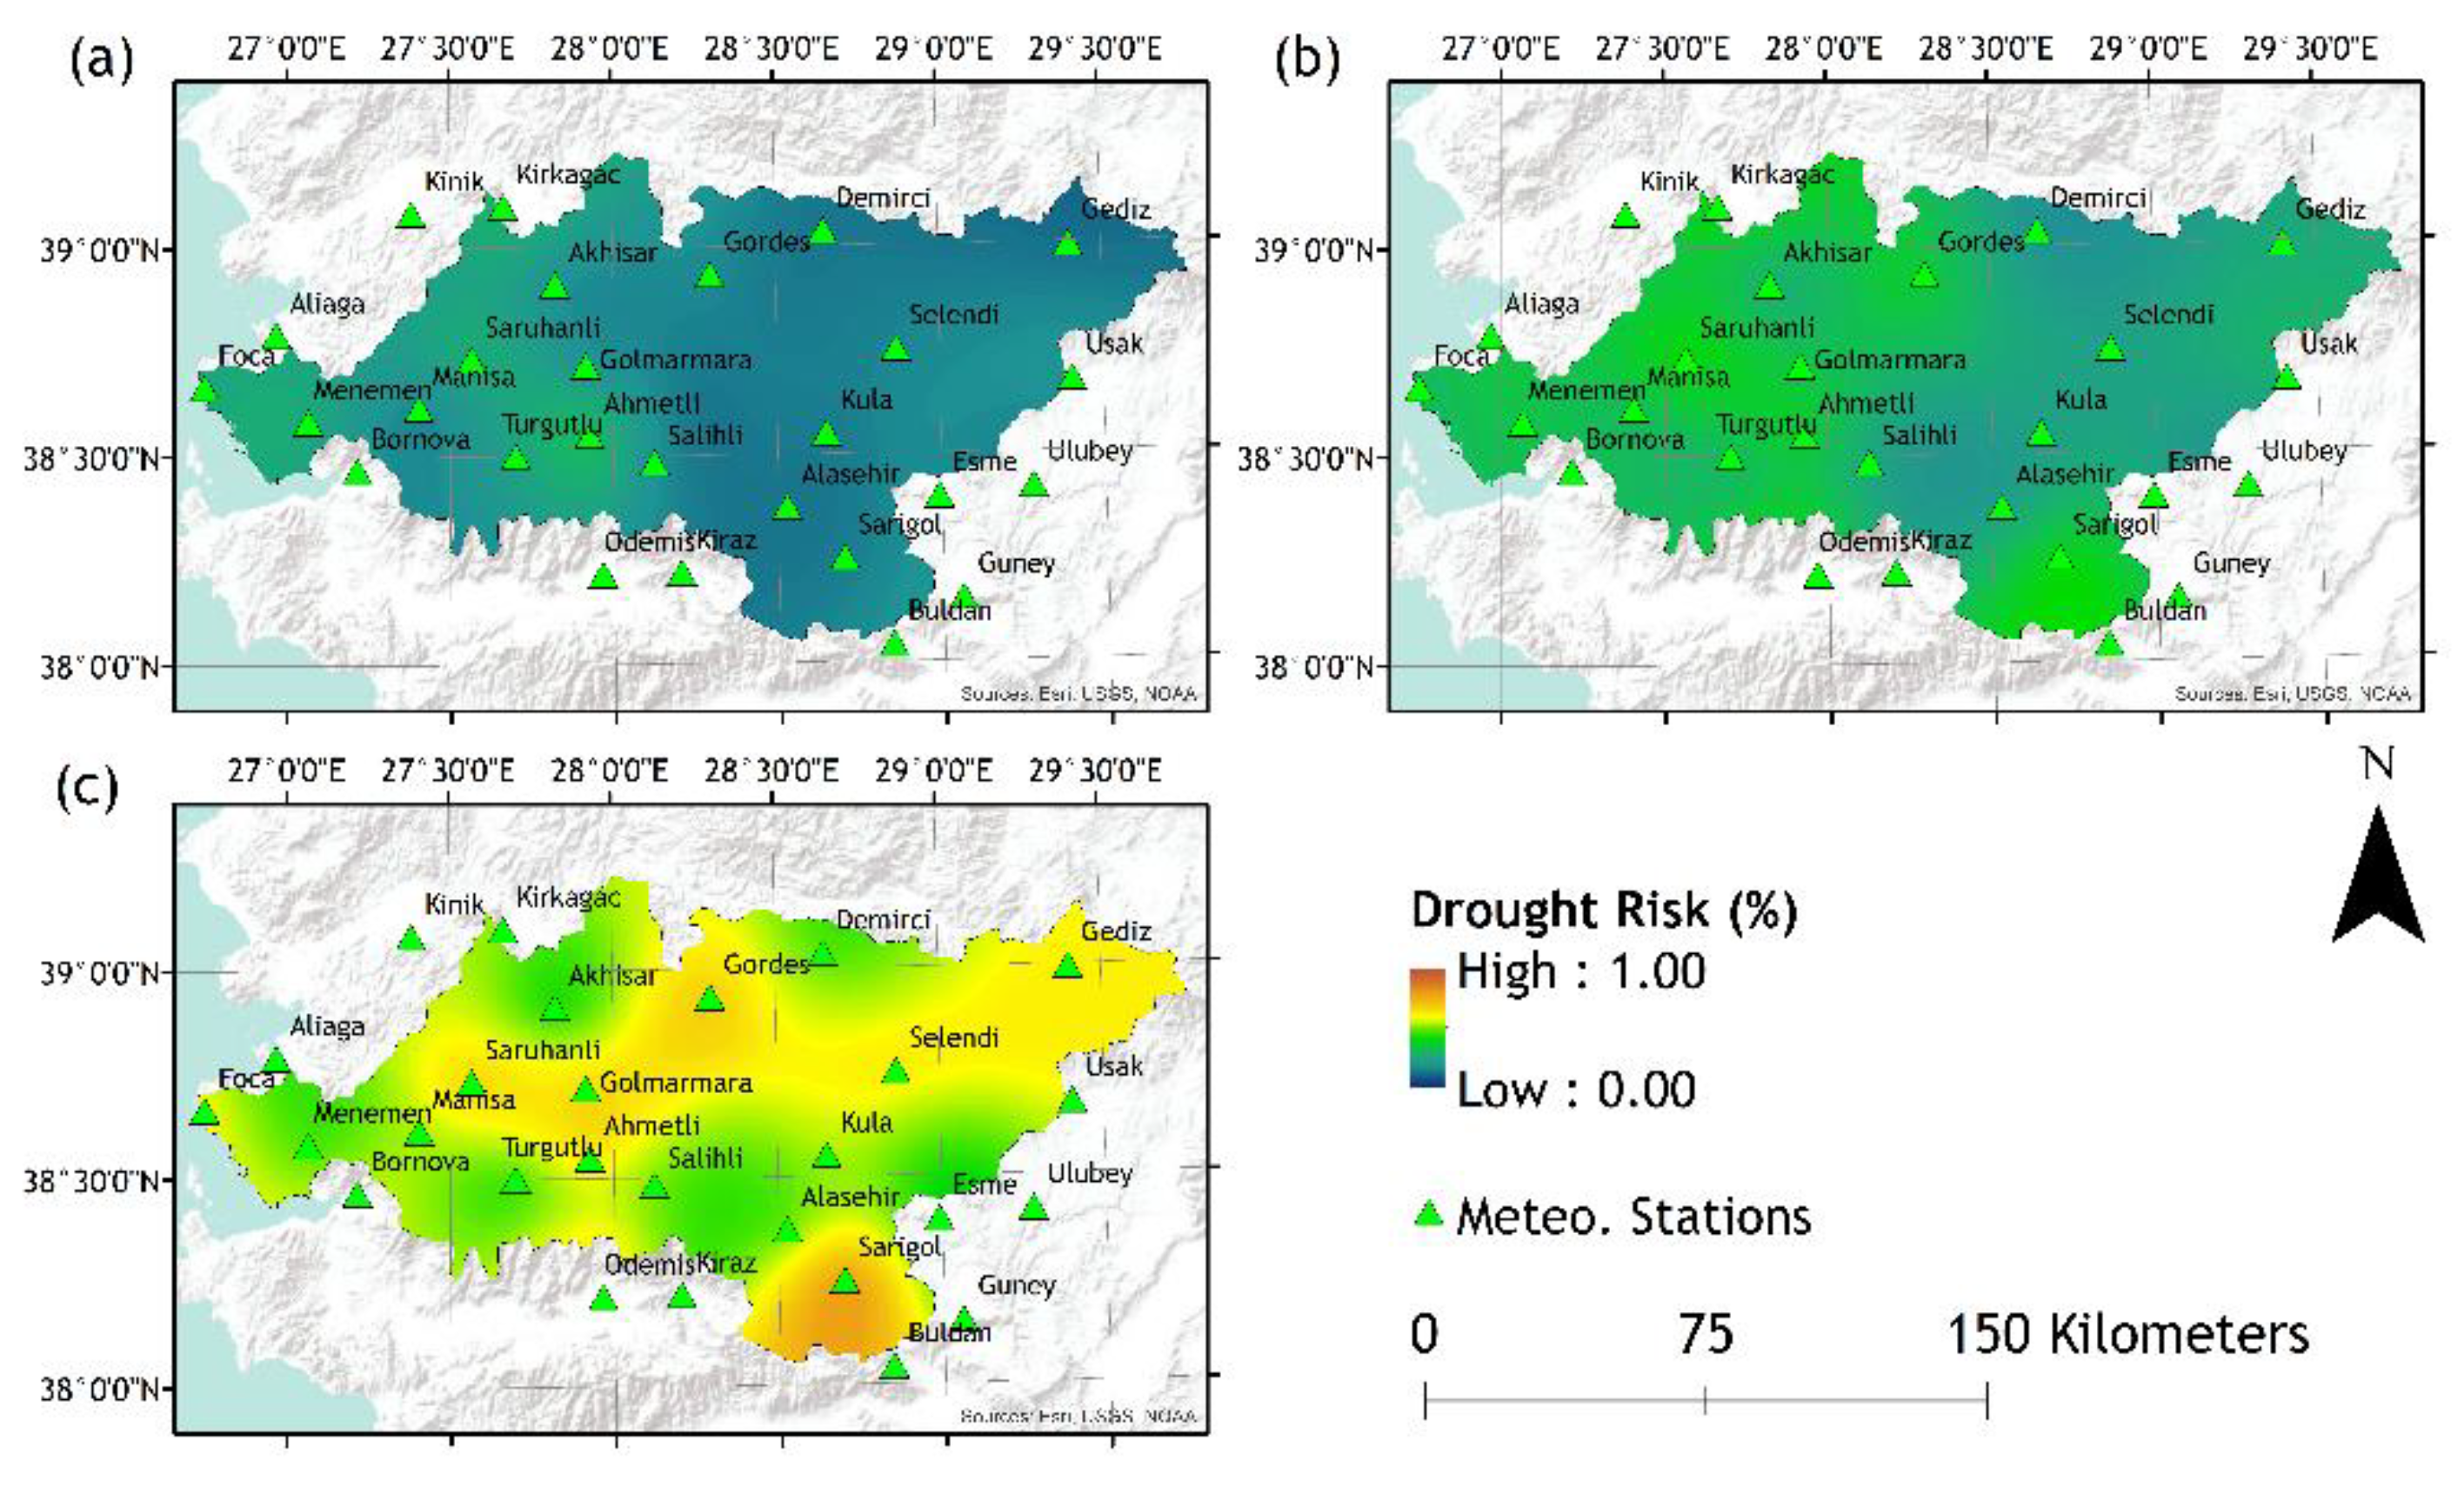
Figure 4.
Drought risk maps of; (a) 3-month, (b) 6-month, and (c) 12-month periods according to SPI-12.
Figure 4.
Drought risk maps of; (a) 3-month, (b) 6-month, and (c) 12-month periods according to SPI-12.
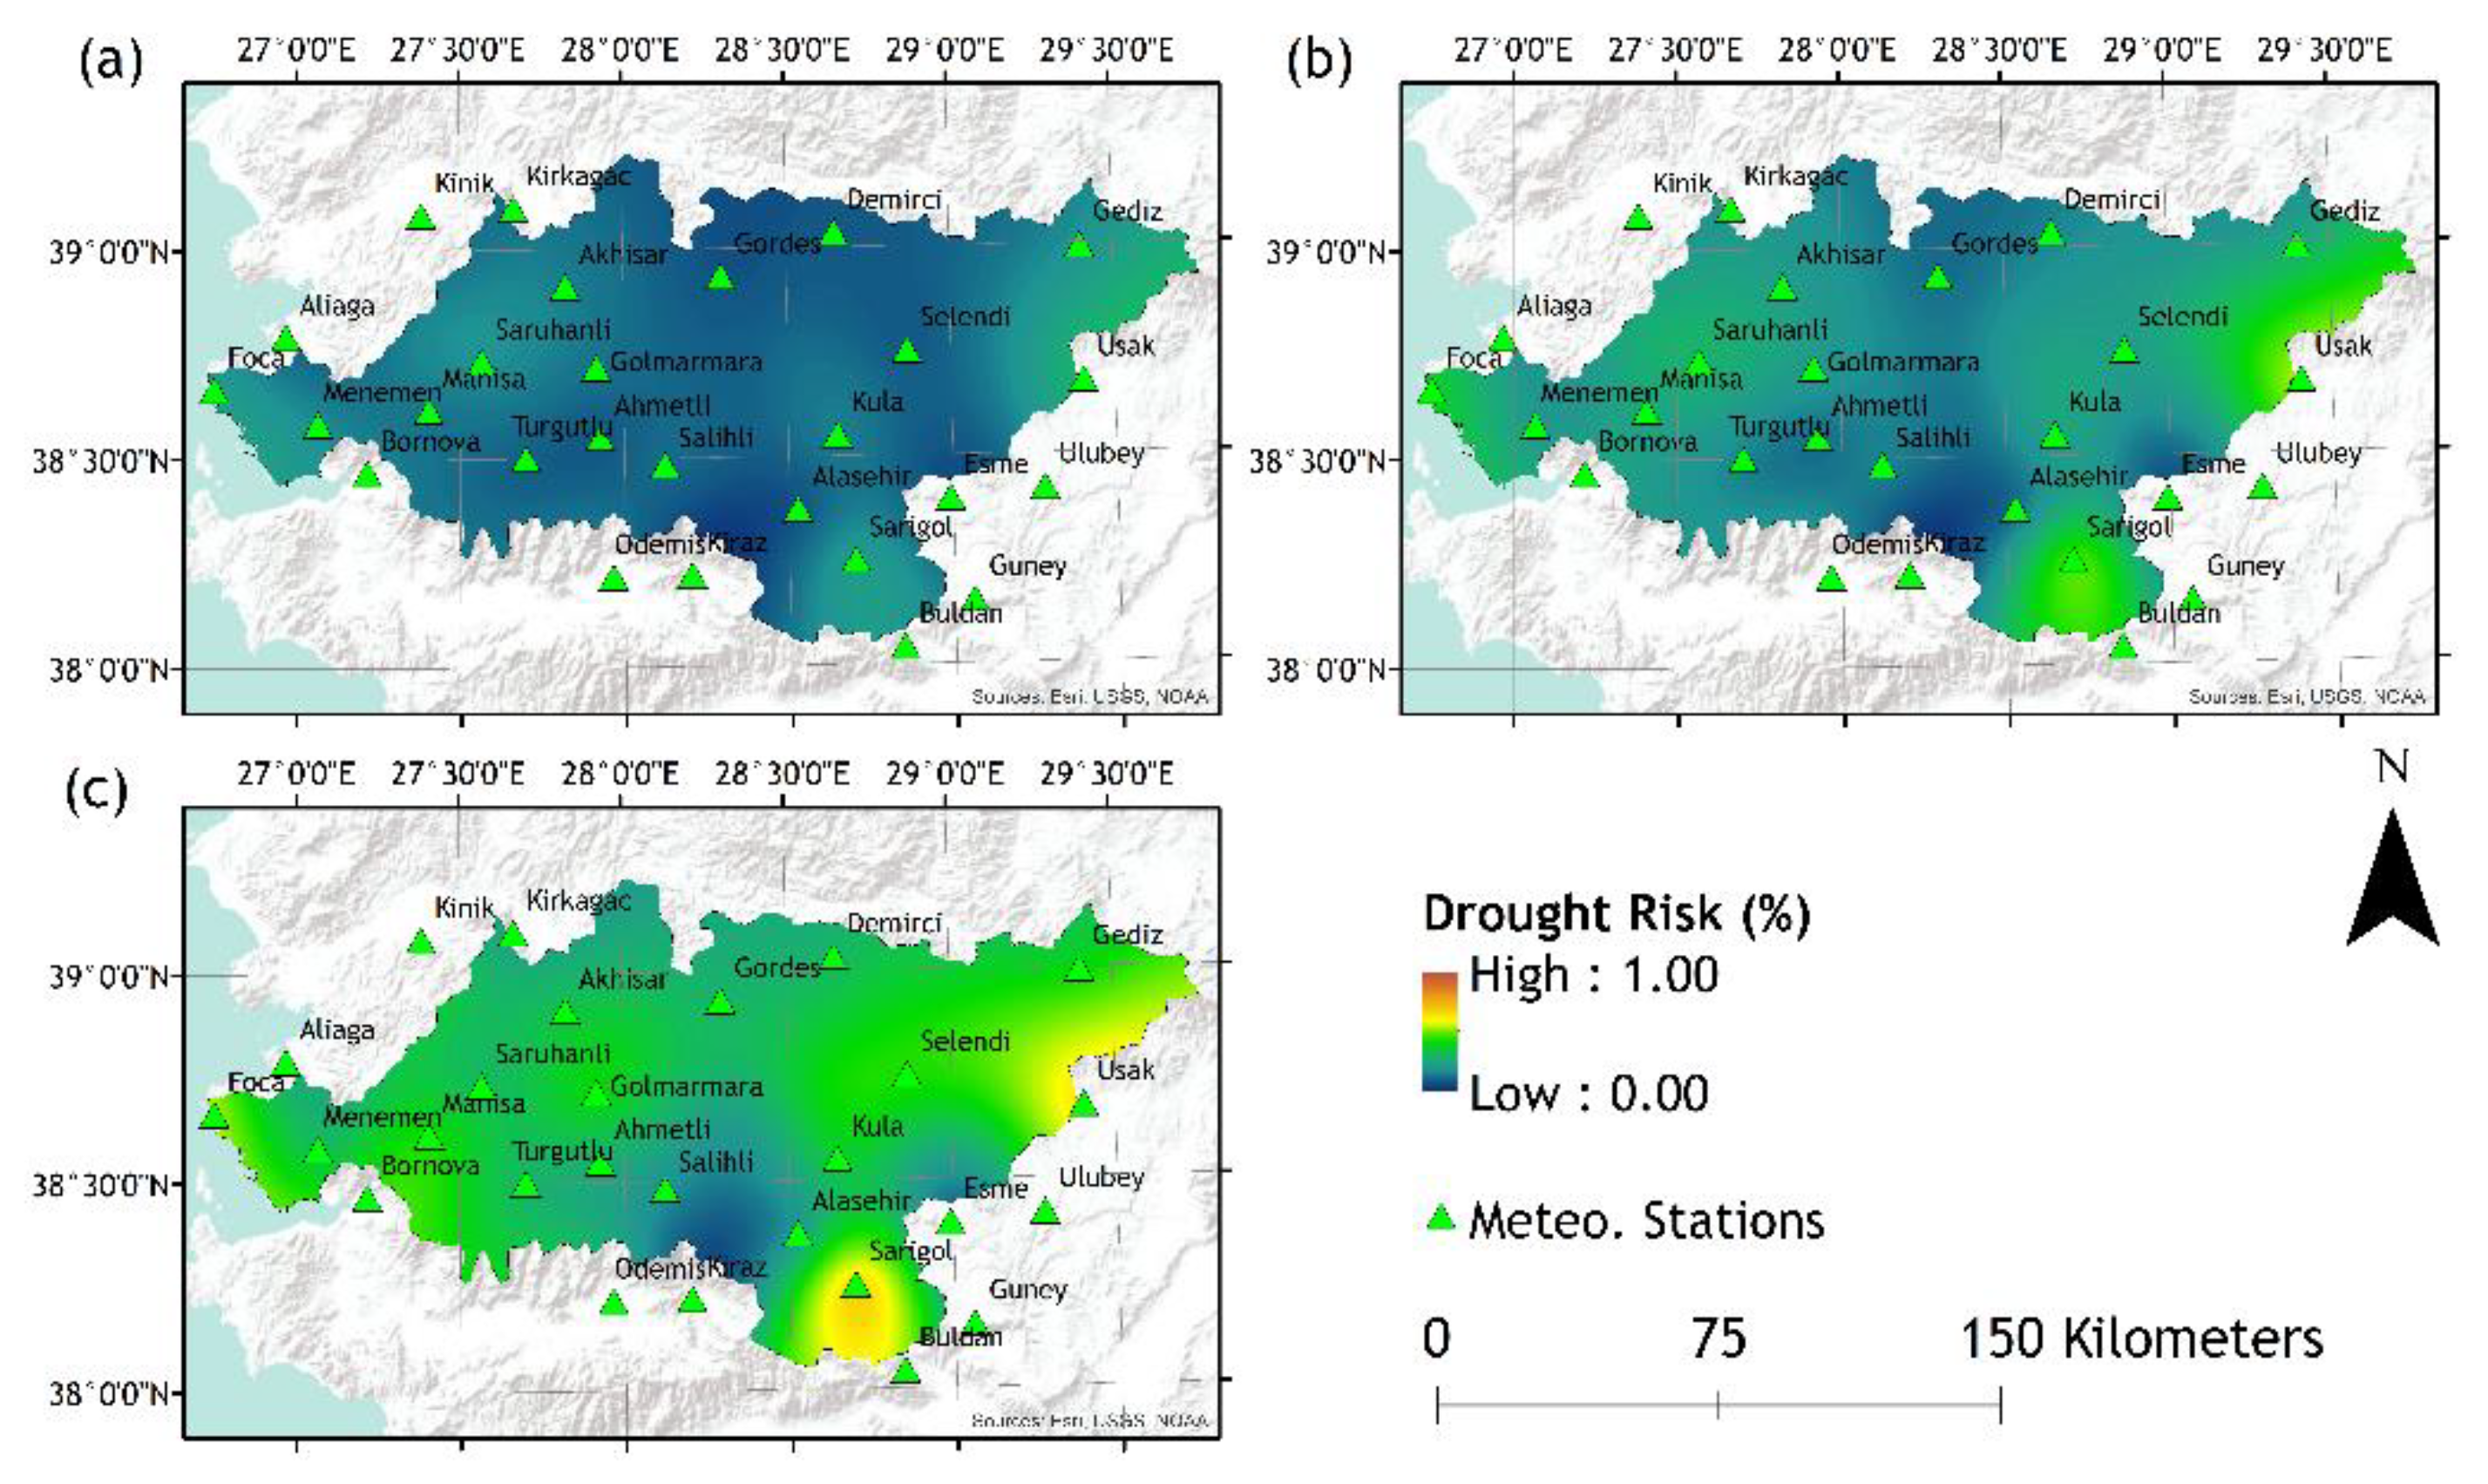
Figure 5.
Drought risk maps of; (a) 3-month, (b) 6-month, and (c) 12-month periods according to SPEI-3.
Figure 5.
Drought risk maps of; (a) 3-month, (b) 6-month, and (c) 12-month periods according to SPEI-3.
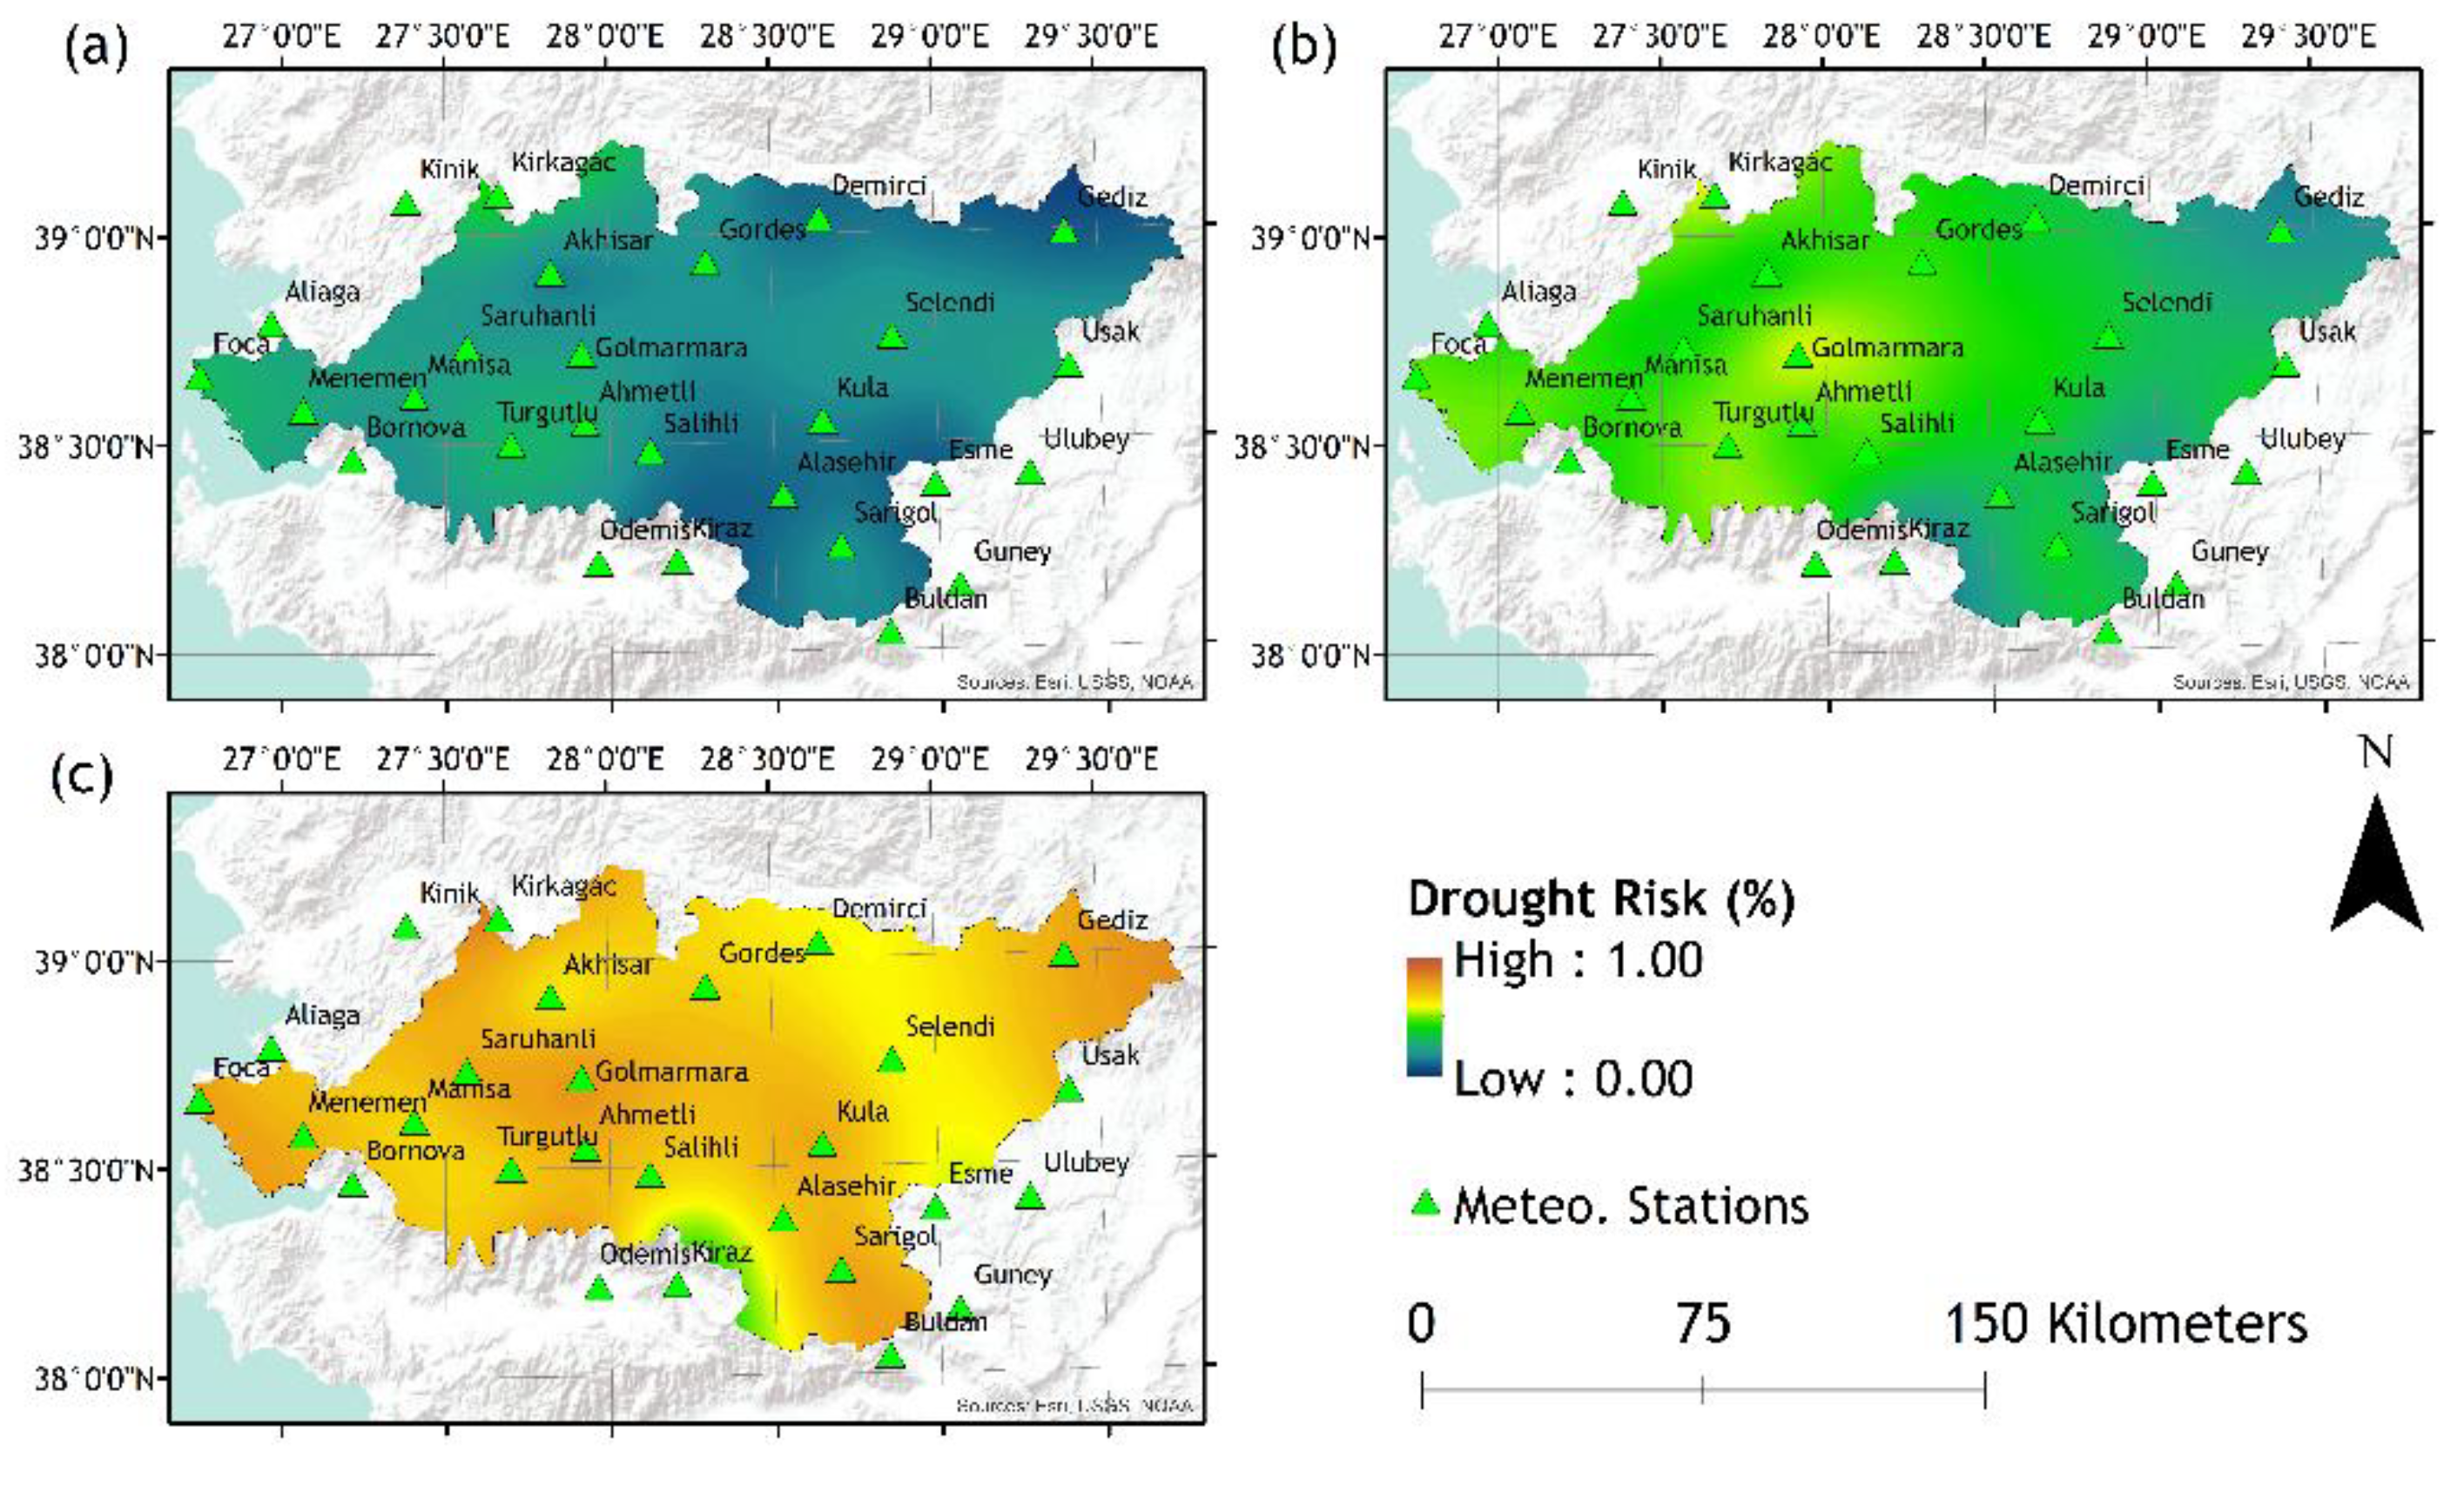
Figure 6.
Drought risk maps of; (a) 3-month, (b) 6-month, and (c) 12-month periods according to SPEI-6.
Figure 6.
Drought risk maps of; (a) 3-month, (b) 6-month, and (c) 12-month periods according to SPEI-6.
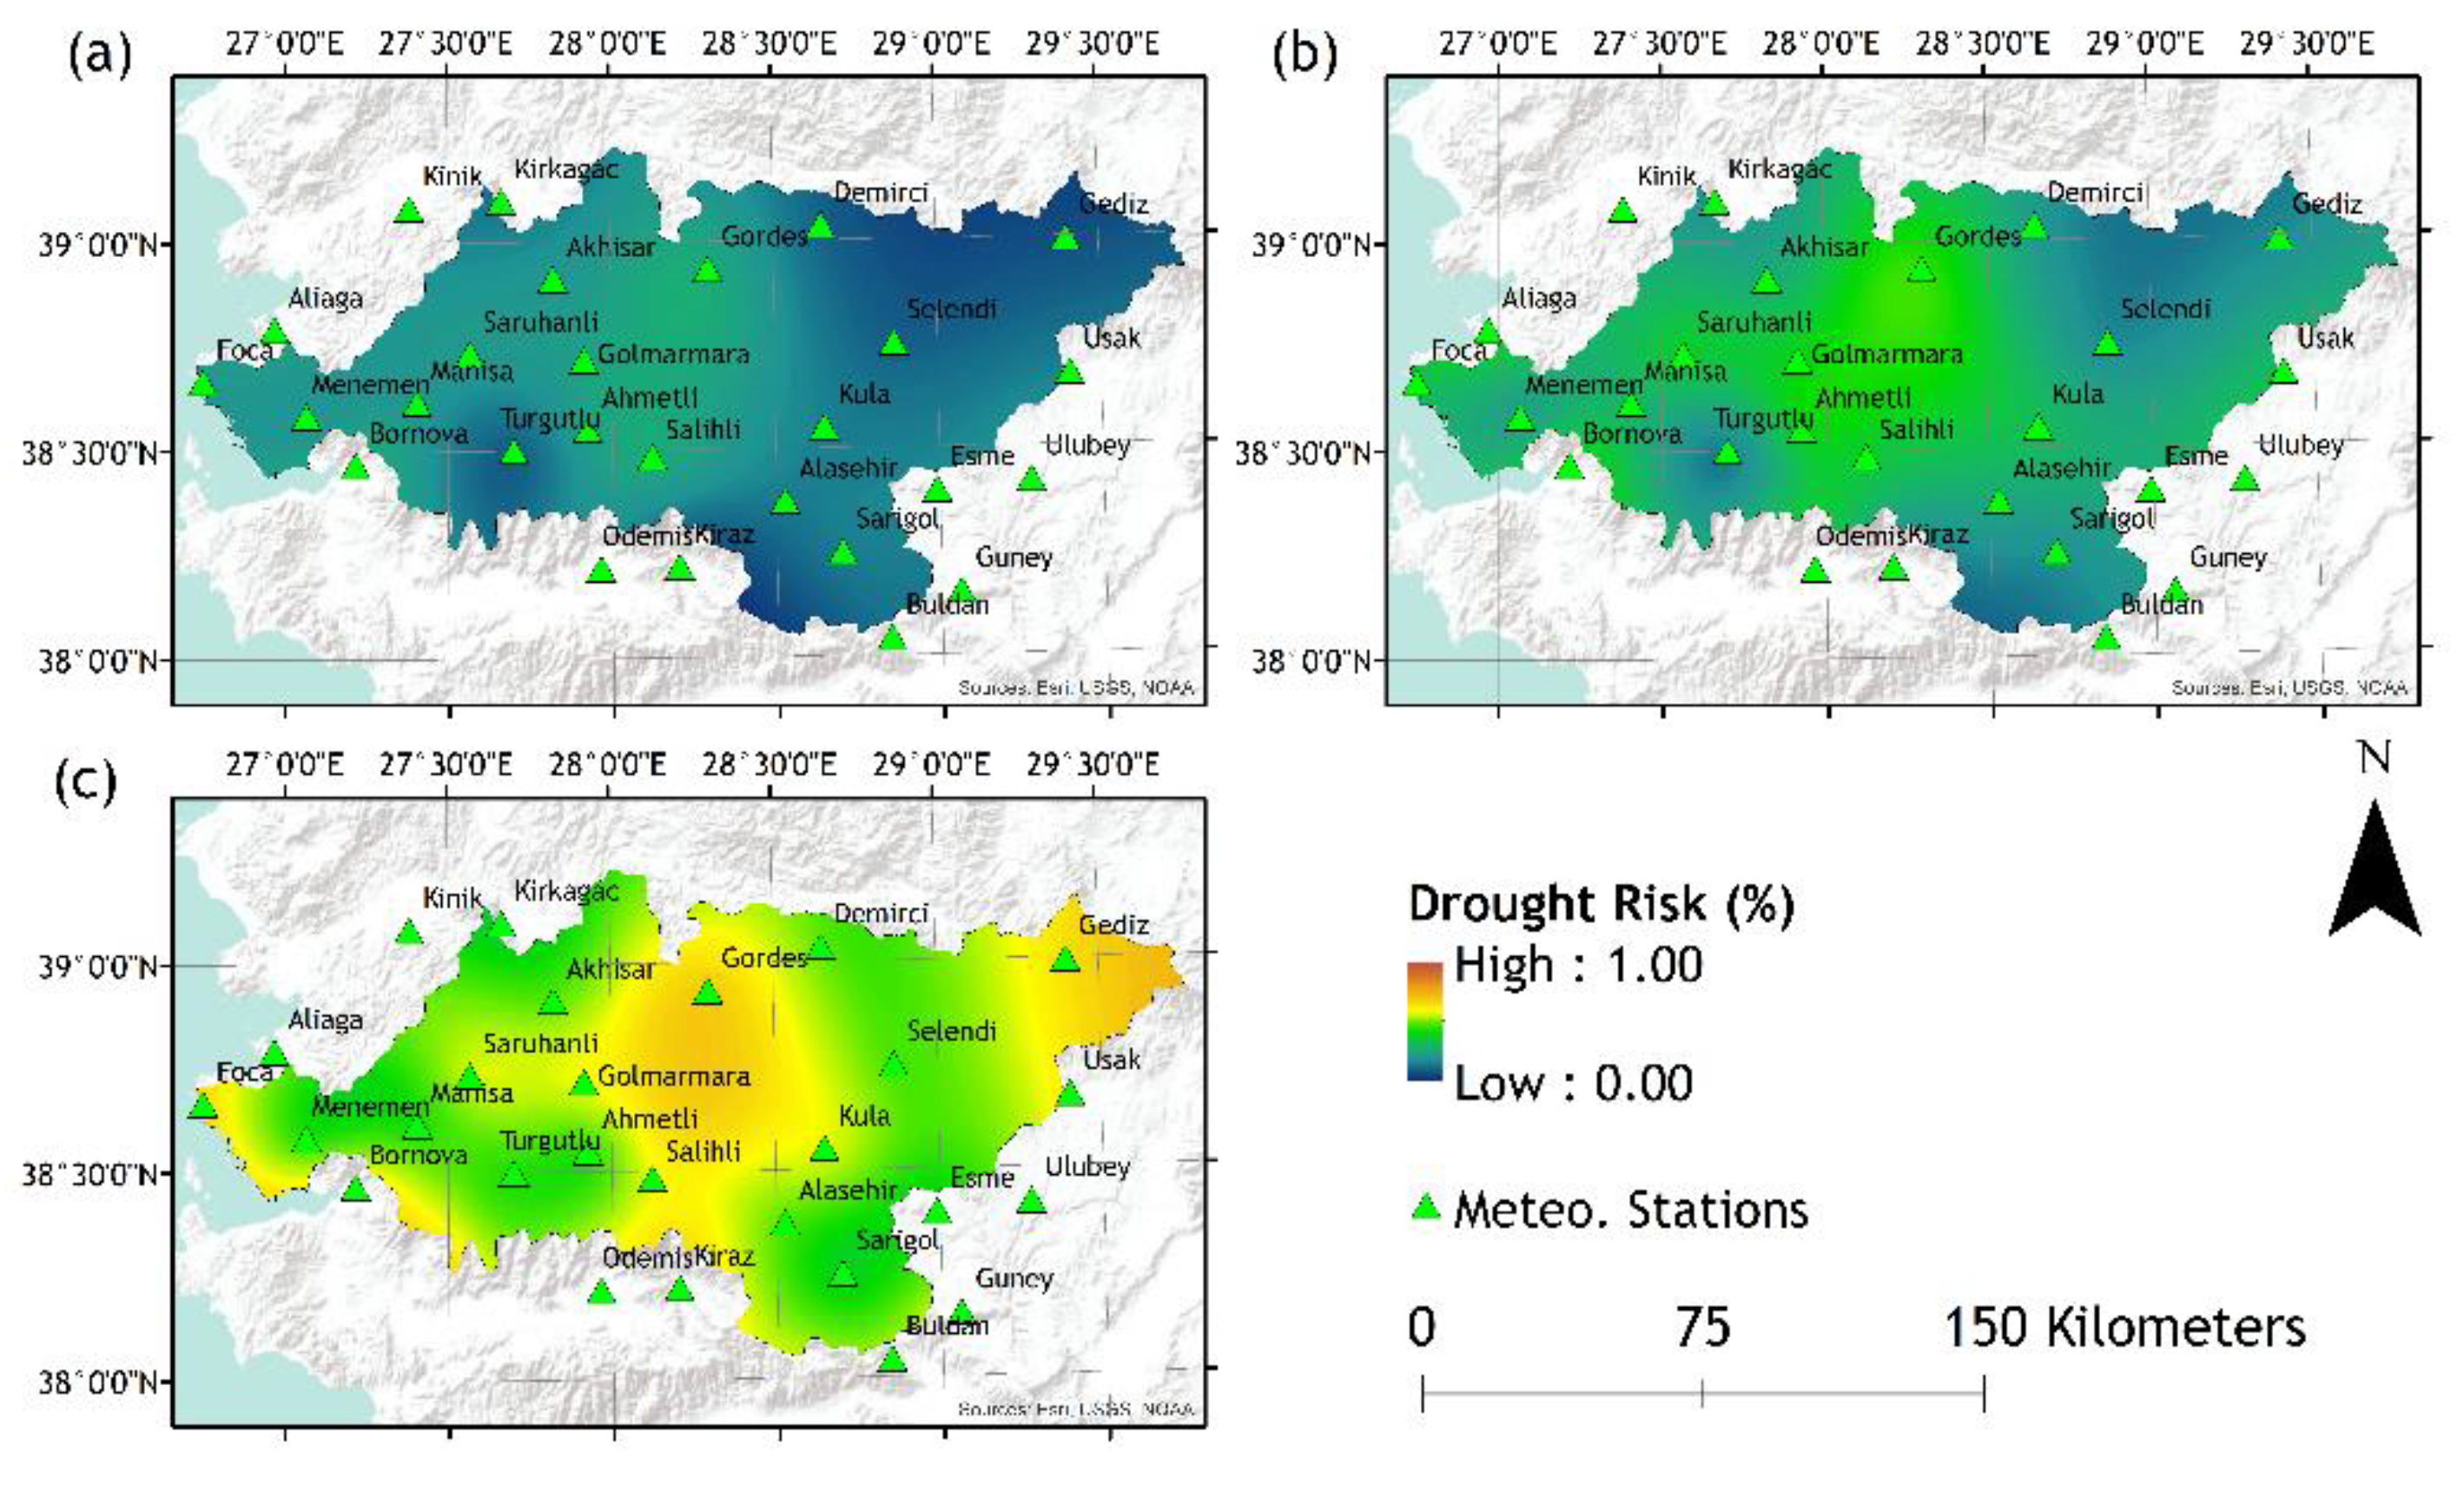
Figure 7.
Drought risk maps of; (a) 3-month, (b) 6-month, and (c) 12-month periods according to SPEI-12.
Figure 7.
Drought risk maps of; (a) 3-month, (b) 6-month, and (c) 12-month periods according to SPEI-12.
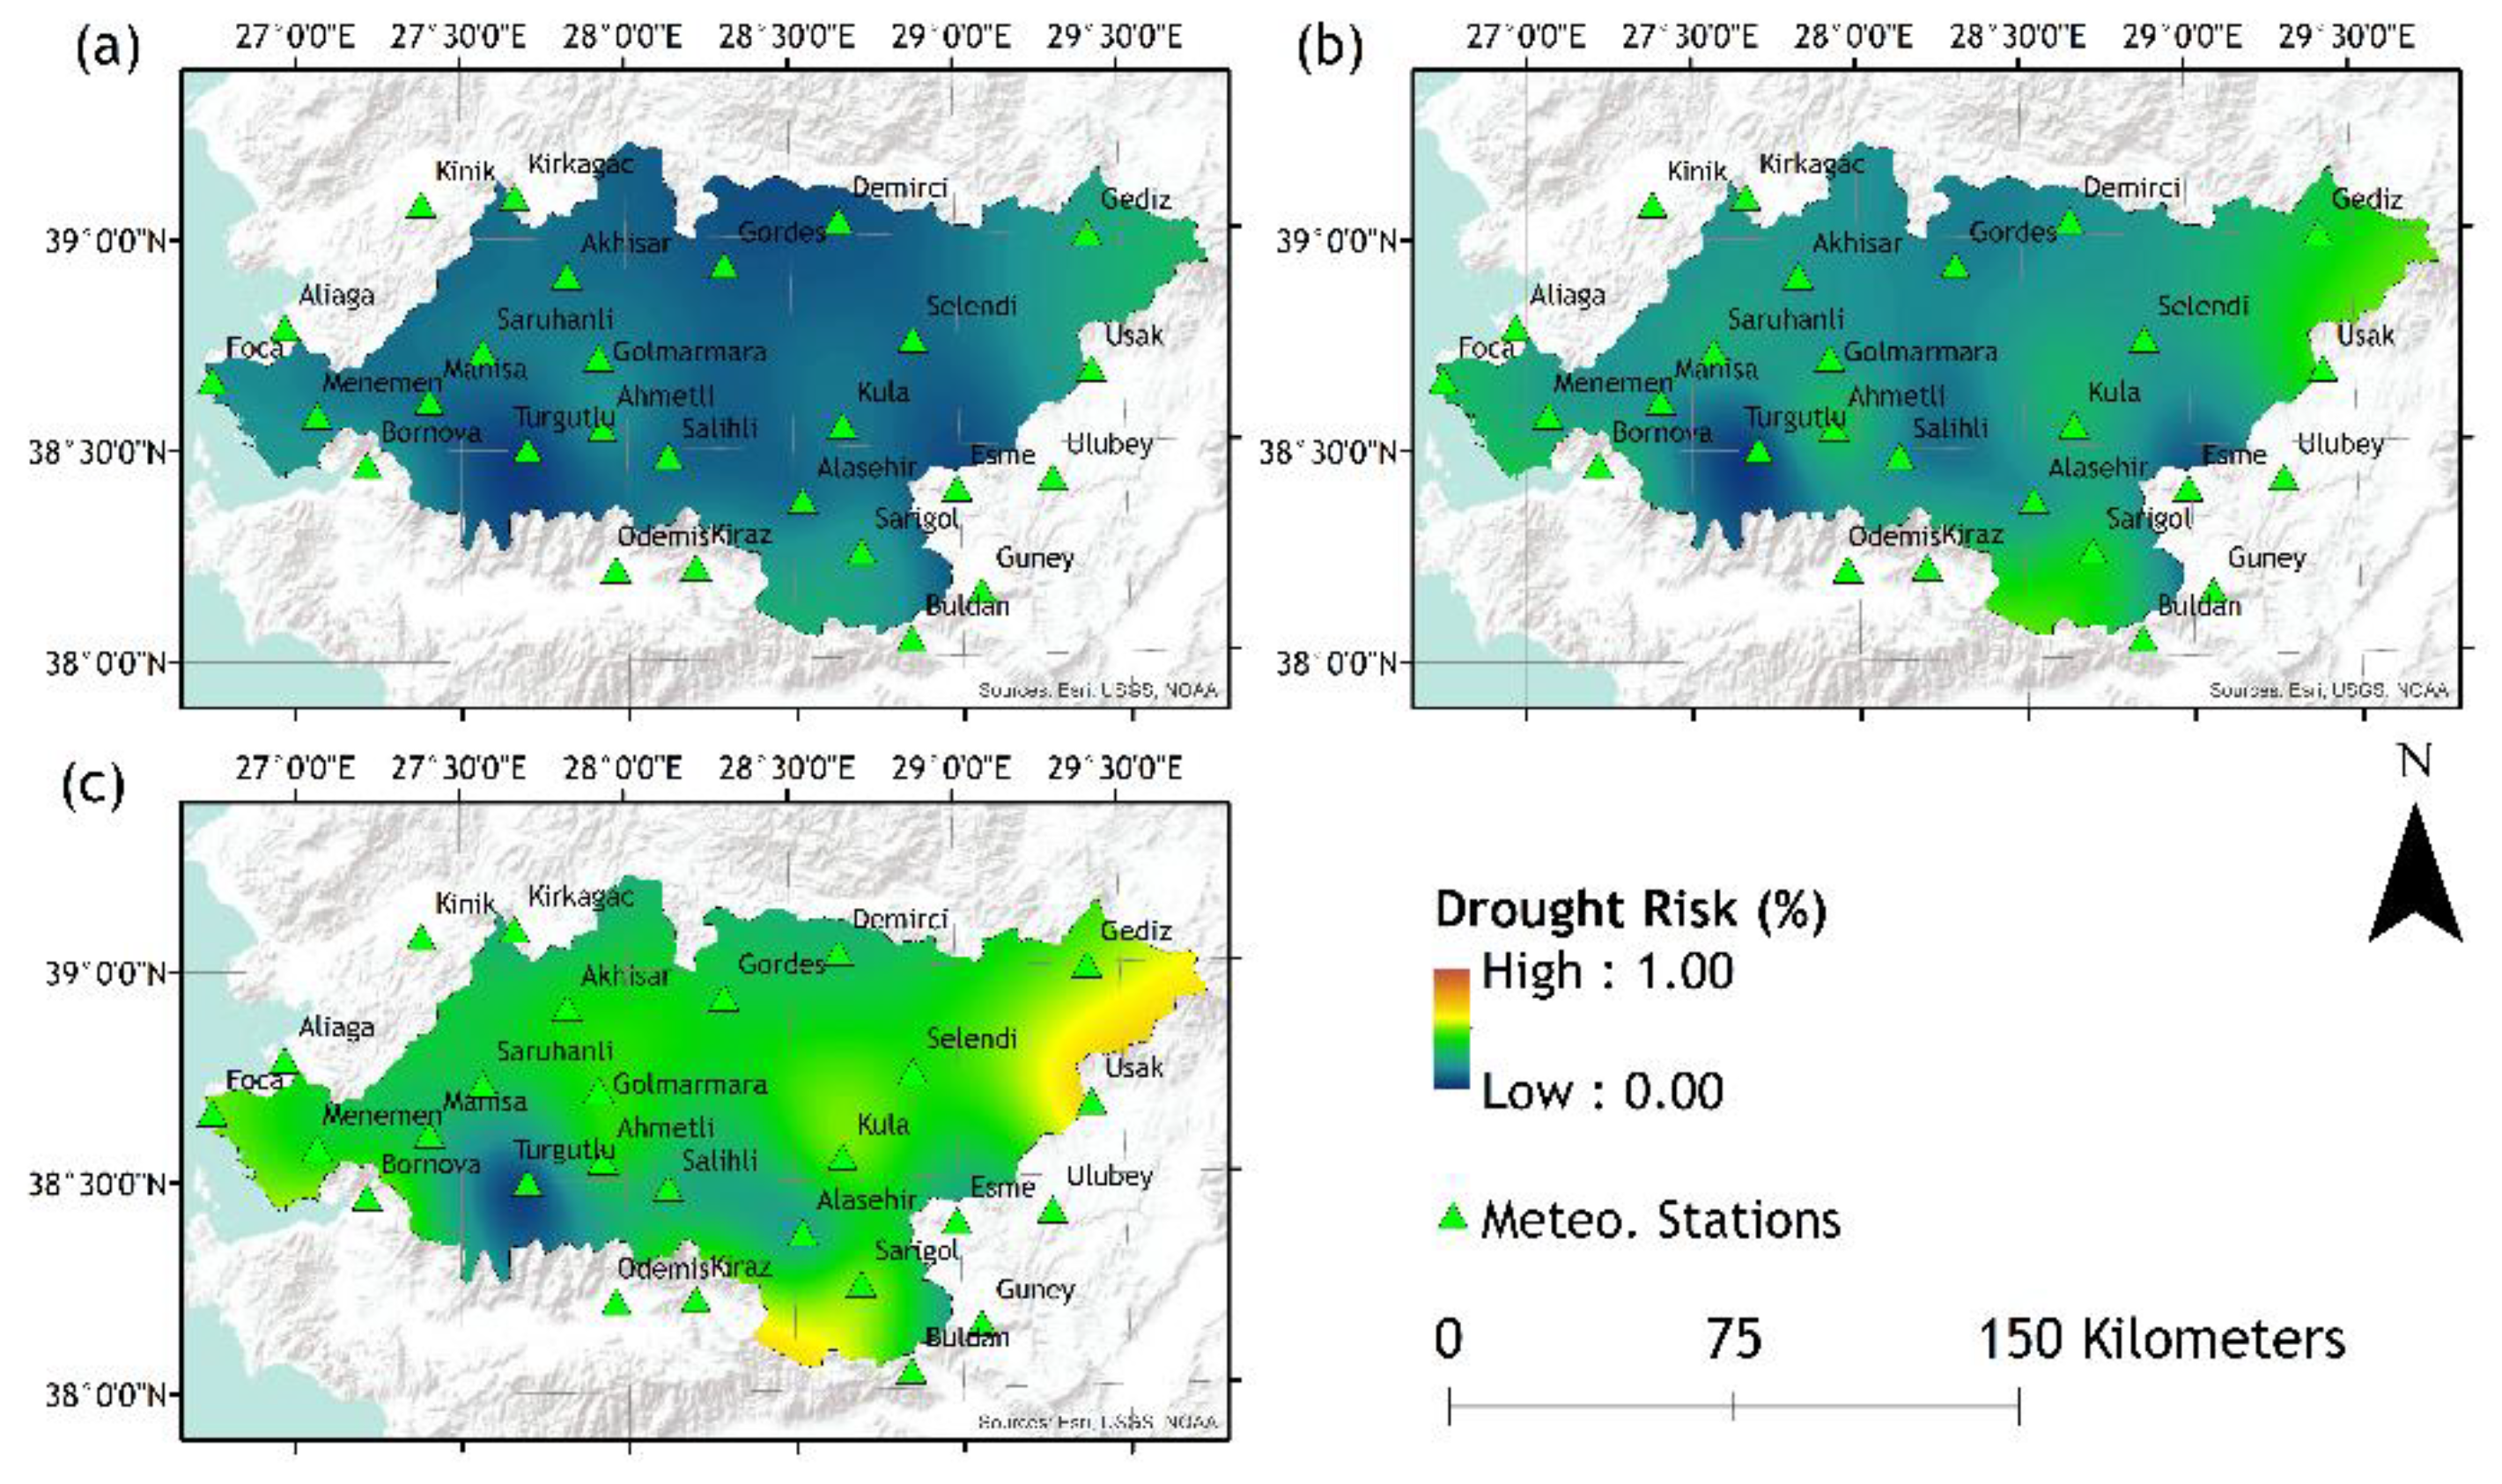
Figure 8.
Drought risk curves of Lake Marmara (Golmarmara) and Salihli station according to (a, b) SPI and (c, d) SPEI.
Figure 8.
Drought risk curves of Lake Marmara (Golmarmara) and Salihli station according to (a, b) SPI and (c, d) SPEI.
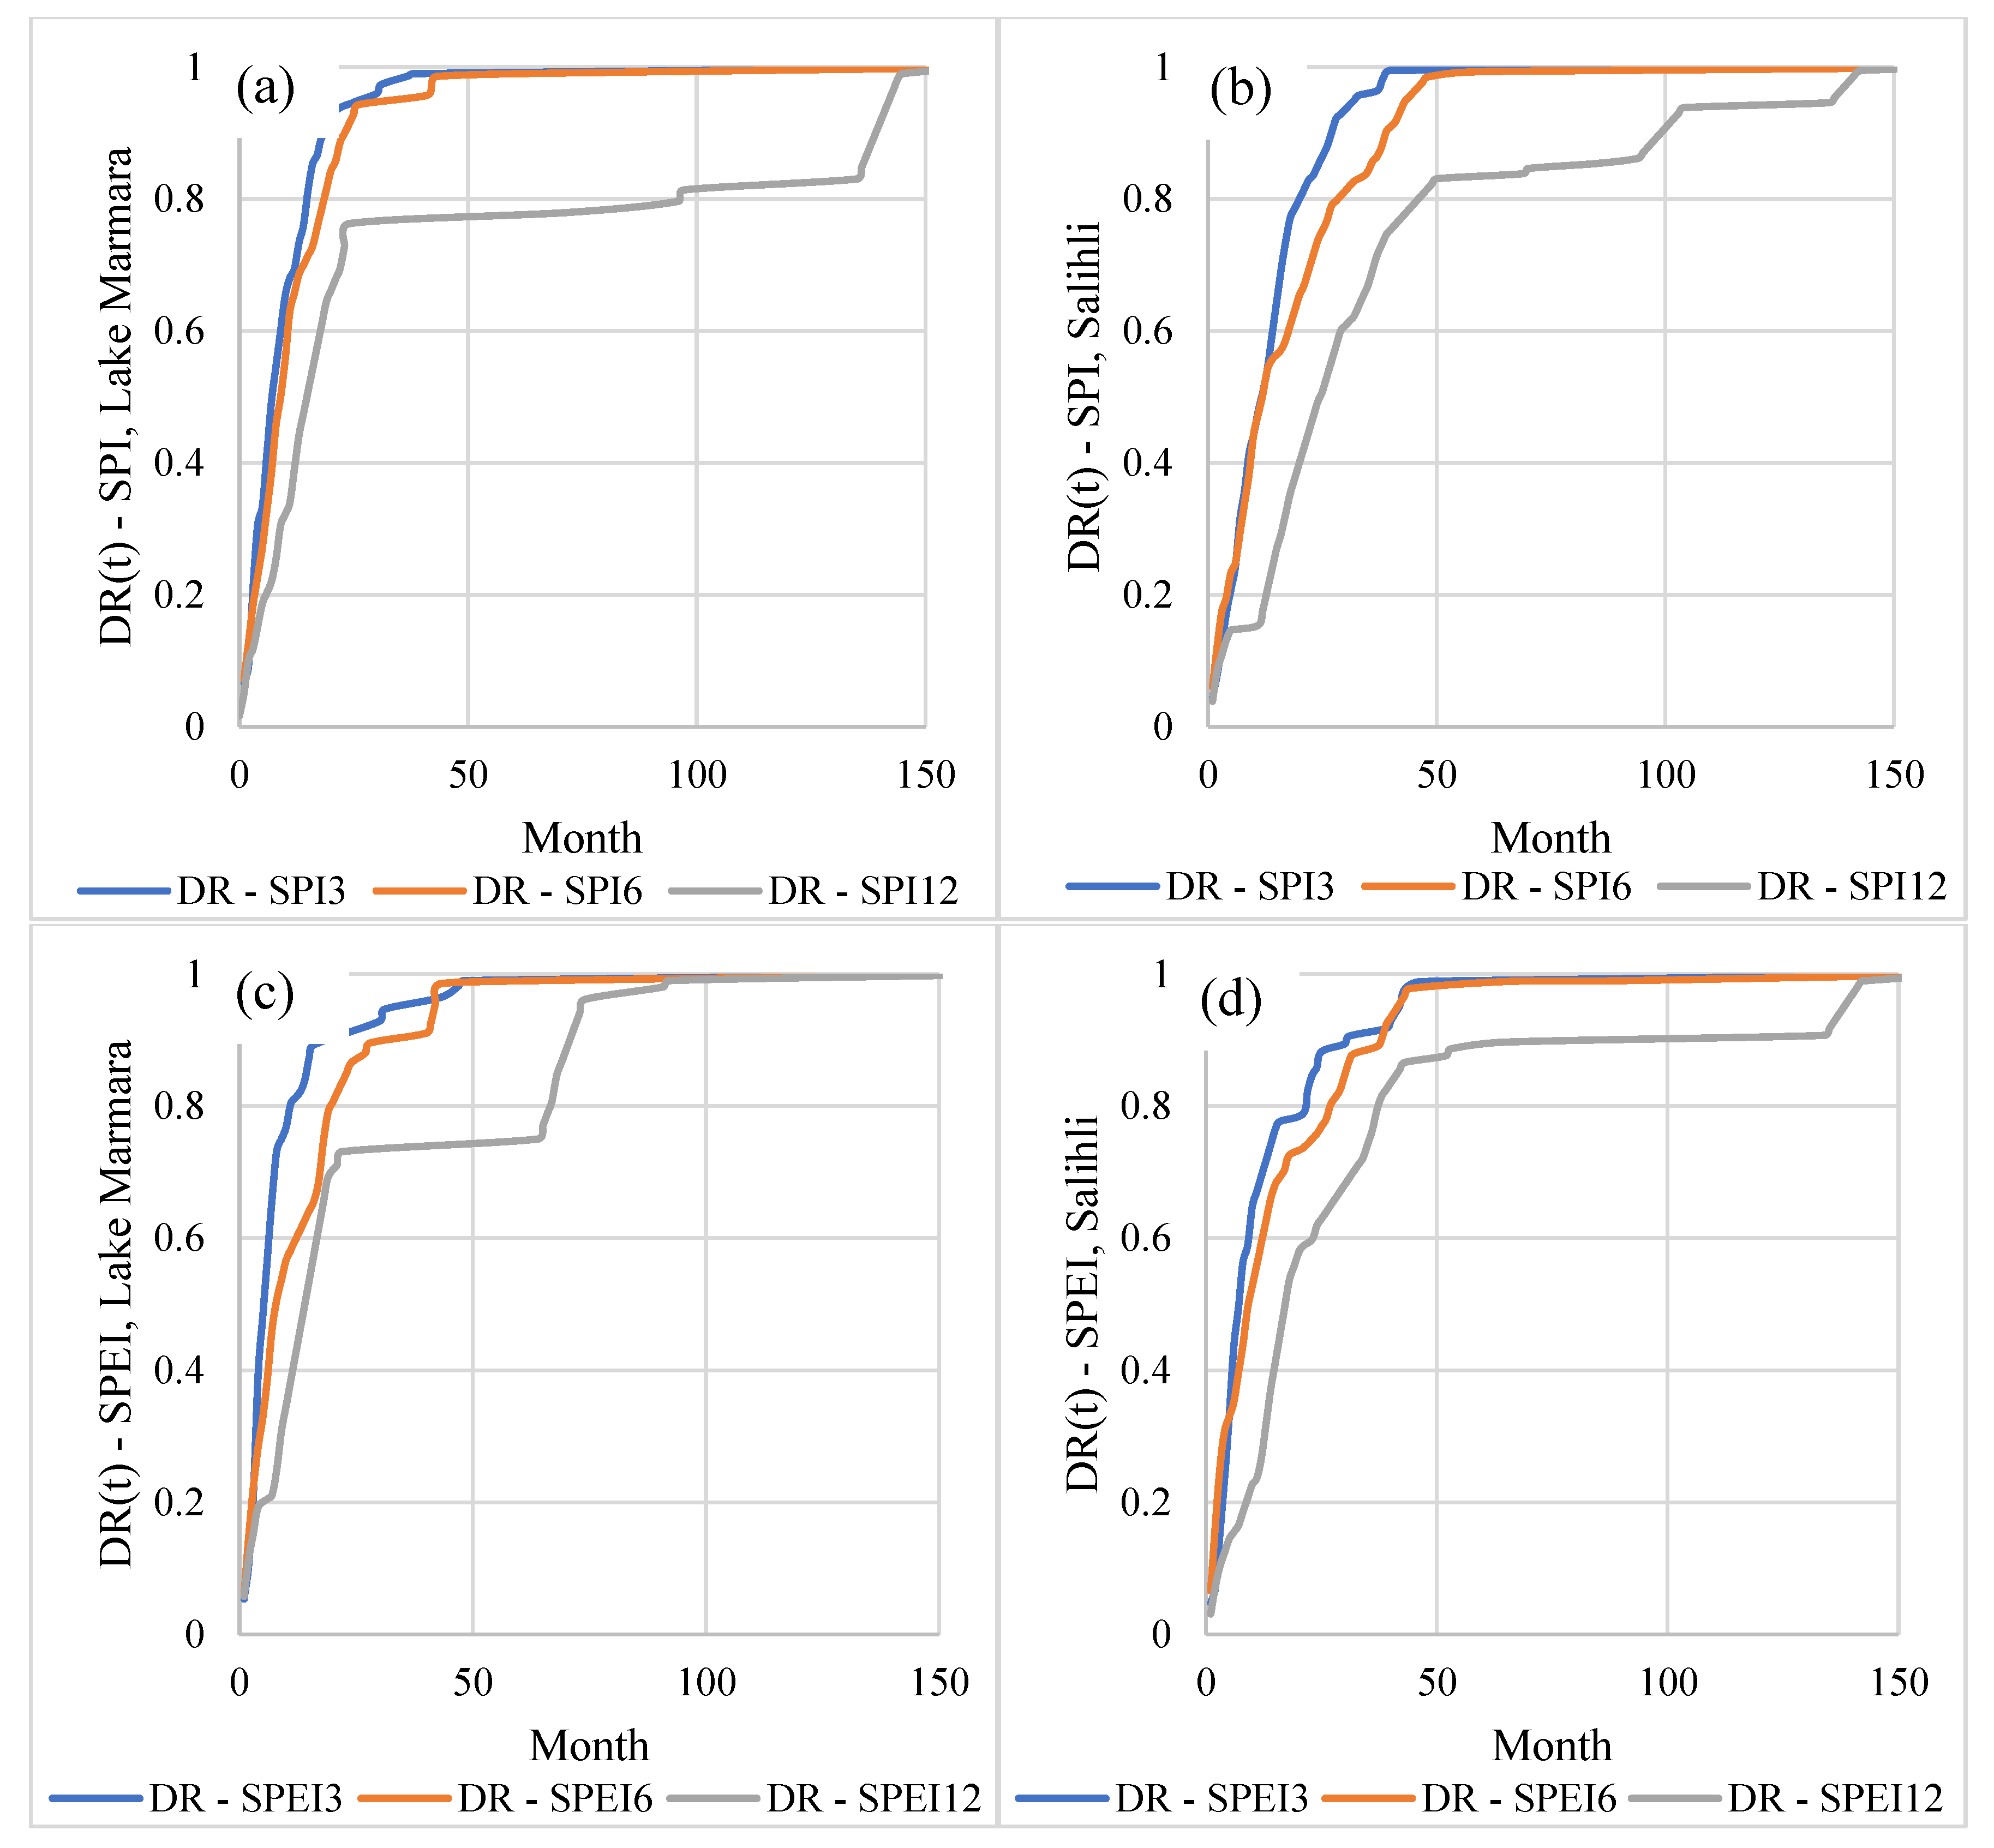

Table 1.
SPI/SPEI classification scale.
| SPI/SPEI values | Description of state |
|---|---|
| SPI/SPEI < -2 | Extreme drought |
| -2 < SPI/SPEI < -1.5 | Severe drought |
| -1.5 < SPI/SPEI < -1 | Moderate drought |
| -1 < SPI/SPEI < 1 | Near normal |
| 1 < SPI/SPEI < 1.5 | Moderately wet |
| 1.5 < SPI/SPEI < 2 | Severely wet |
| SPI/SPEI > 2 | Extremely wet |
Table 2.
Recorded dry states in Ahmetli station between 1966-1988.
| Time (month) | No. Unrealized dry states ri |
No. Dry states realized di |
Kaplan-Meier (t) |
Drought Risk (DR(t)) |
|---|---|---|---|---|
| 1 | 44 | 5 | 0.886 | 0.114 |
| 2 | 39 | 5 | 0.773 | 0.227 |
| 3 | 34 | 6 | 0.636 | 0.364 |
| 4 | 28 | 6 | 0.500 | 0.500 |
| 5 | 22 | 3 | 0.432 | 0.568 |
| 6 | 19 | 2 | 0.386 | 0.614 |
| 7 | 17 | 2 | 0.341 | 0.659 |
| 8 | 15 | 4 | 0.250 | 0.750 |
| 9 | 11 | 2 | 0.205 | 0.796 |
| 10 | 9 | 2 | 0.159 | 0.841 |
| 14 | 7 | 1 | 0.136 | 0.847 |
| 15 | 6 | 1 | 0.114 | 0.852 |
| 17 | 5 | 1 | 0.091 | 0.864 |
| 18 | 4 | 1 | 0.068 | 0.886 |
| 24 | 3 | 1 | 0.046 | 0.909 |
| 25 | 2 | 1 | 0.023 | 0.932 |
| 27 | 1 | 1 | 0 | 0.955 |
Disclaimer/Publisher’s Note: The statements, opinions and data contained in all publications are solely those of the individual author(s) and contributor(s) and not of MDPI and/or the editor(s). MDPI and/or the editor(s) disclaim responsibility for any injury to people or property resulting from any ideas, methods, instructions or products referred to in the content. |
© 2024 by the authors. Licensee MDPI, Basel, Switzerland. This article is an open access article distributed under the terms and conditions of the Creative Commons Attribution (CC BY) license (https://creativecommons.org/licenses/by/4.0/).
Copyright: This open access article is published under a Creative Commons CC BY 4.0 license, which permit the free download, distribution, and reuse, provided that the author and preprint are cited in any reuse.


