Submitted:
23 February 2024
Posted:
26 February 2024
You are already at the latest version
Abstract
Keywords:
1. Introduction
2. Results and discussion
3. Materials and Methods
4. Conclusions
Supplementary Materials
Author Contributions
Funding
Data Availability Statement
Conflicts of Interest
References
- Swain, S.M.; Shastry, M.; Hamilton, E. Targeting HER2-Positive Breast Cancer: Advances and Future Directions. Nat Rev Drug Discov 2023, 22, 101–126. [Google Scholar] [CrossRef] [PubMed]
- Giordano, S.H.; Temin, S.; Davidson, N.E. Systemic Therapy for Patients with Advanced Human Epidermal Growth Factor Receptor 2-Positive Breast Cancer: ASCO Clinical Practice Guideline Update Summary. J Oncol Pract 2018, 14, 501–504. [Google Scholar] [CrossRef] [PubMed]
- Hudis, C.A. Trastuzumab - Mechanism of Action and Use in Clinical Practice. New England Journal of Medicine 2007, 357, 39–51. [Google Scholar] [CrossRef] [PubMed]
- De Mattos-Arruda, L.; Cortes, J. Use of Pertuzumab for the Treatment of HER2-Positive Metastatic Breast Cancer. Adv Ther 2013, 30, 645–658. [Google Scholar] [CrossRef] [PubMed]
- Von Minckwitz, G.; Procter, M.; De Azambuja, E.; Zardavas, D.; Benyunes, M.; Viale, G.; Suter, T.; Arahmani, A.; Rouchet, N.; Clark, E.; et al. Adjuvant Pertuzumab and Trastuzumab in Early Her2-Positive Breast Cancer. New England Journal of Medicine 2017, 377, 122–131. [Google Scholar] [CrossRef]
- Jagosky, M.; Tan, A.R. Combination of Pertuzumab and Trastuzumab in the Treatment of Her2-Positive Early Breast Cancer: A Review of the Emerging Clinical Data. Breast Cancer: Targets and Therapy 2021, 13, 393–407. [Google Scholar] [CrossRef]
- Liu, X.; Fang, Y.; Li, Y.; Li, Y.; Qi, L.; Wang, X. Pertuzumab Combined with Trastuzumab Compared to Trastuzumab in the Treatment of HER2-Positive Breast Cancer: A Systematic Review and Meta-Analysis of Randomized Controlled Trials. Front Oncol 2022, 12, 894861. [Google Scholar] [CrossRef]
- Baselga, J.; Cortés, J.; Kim, S.-B.; Im, S.-A.; Hegg, R.; Im, Y.-H.; Roman, L.; Pedrini, J.L.; Pienkowski, T.; Knott, A.; et al. Pertuzumab plus Trastuzumab plus Docetaxel for Metastatic Breast Cancer. New England Journal of Medicine 2012, 366, 109–119. [Google Scholar] [CrossRef]
- Swain, S.M.; Baselga, J.; Kim, S.-B.; Ro, J.; Semiglazov, V.; Campone, M.; Ciruelos, E.; Ferrero, J.-M.; Schneeweiss, A.; Heeson, S.; et al. Pertuzumab, Trastuzumab, and Docetaxel in HER2-Positive Metastatic Breast Cancer. New England Journal of Medicine 2015, 372, 724–734. [Google Scholar] [CrossRef]
- Krop, I.E.; Modi, S.; LoRusso, P.M.; Pegram, M.; Guardino, E.; Althaus, B.; Lu, D.; Strasak, A.; Elias, A. Phase 1b/2a Study of Trastuzumab Emtansine (T-DM1), Paclitaxel, and Pertuzumab in HER2-Positive Metastatic Breast Cancer. Breast Cancer Research 2016, 18, 34. [Google Scholar] [CrossRef]
- Miller, K.D.; Diéras, V.; Harbeck, N.; Andre, F.; Mahtani, R.L.; Gianni, L.; Albain, K.S.; Crivellari, D.; Fang, L.; Michelson, G.; et al. Phase IIa Trial of Trastuzumab Emtansine with Pertuzumab for Patients with Human Epidermal Growth Factor Receptor 2-Positive, Locally Advanced, or Metastatic Breast Cancer. Journal of Clinical Oncology 2014, 32, 1437–1444. [Google Scholar] [CrossRef]
- Urruticoechea, A.; Rizwanullah, M.; Im, S.-A.; Sánchez Ruiz, A.C.; Láng, I.; Tomasello, G.; Douthwaite, H.; Crnjevic, T.B.; Heeson, S.; Eng-Wong, J.; et al. Randomized Phase III Trial of Trastuzumab plus Capecitabine with or without Pertuzumab in Patients with Human Epidermal Growth Factor Receptor 2-Positive Metastatic Breast Cancer Who Experienced Disease Progression during or after Trastuzumab-Based Therapy. Journal of Clinical Oncology 2017, 35, 3030–3038. [Google Scholar] [CrossRef]
- Rimawi, M.; Ferrero, J.-M.; De La Haba-Rodriguez, J.; Poole, C.; De Placido, S.; Osborne, C.K.; Hegg, R.; Easton, V.; Wohlfarth, C.; Arpino, G. First-Line Trastuzumab plus an Aromatase Inhibitor, with or without Pertuzumab, in Human Epidermal Growth Factor Receptor 2-Positive and Hormone Receptor-Positive Metastatic or Locally Advanced Breast Cancer (PERTAIN): A Randomized, Open-Label Phase II Trial. Journal of Clinical Oncology 2018, 36, 2826–2835. [Google Scholar] [CrossRef] [PubMed]
- Perez, E.A.; Barrios, C.; Eiermann, W.; Toi, M.; Im, Y.-H.; Conte, P.; Martin, M.; Pienkowski, T.; Pivot, X.B.; Burris, H.A.; et al. Trastuzumab Emtansine with or without Pertuzumab versus Trastuzumab with Taxane for Human Epidermal Growth Factor Receptor 2–Positive Advanced Breast Cancer: Final Results from MARIANNE. Cancer 2019, 125, 3974–3984. [Google Scholar] [CrossRef] [PubMed]
- Patel, T.A.; Ensor, J.E.; Creamer, S.L.; Boone, T.; Rodriguez, A.A.; Niravath, P.A.; Darcourt, J.G.; Meisel, J.L.; Li, X.; Zhao, J.; et al. A Randomized, Controlled Phase II Trial of Neoadjuvant Ado-Trastuzumab Emtansine, Lapatinib, and Nab-Paclitaxel versus Trastuzumab, Pertuzumab, and Paclitaxel in HER2-Positive Breast Cancer (TEAL Study). Breast Cancer Research 2019, 21, 100. [Google Scholar] [CrossRef] [PubMed]
- Swain, S.M.; Miles, D.; Kim, S.-B.; Im, Y.-H.; Im, S.-A.; Semiglazov, V.; Ciruelos, E.; Schneeweiss, A.; Loi, S.; Monturus, E.; et al. Pertuzumab, Trastuzumab, and Docetaxel for HER2-Positive Metastatic Breast Cancer (CLEOPATRA): End-of-Study Results from a Double-Blind, Randomised, Placebo-Controlled, Phase 3 Study. Lancet Oncol 2020, 21, 519–530. [Google Scholar] [CrossRef] [PubMed]
- Xu, B.; Li, W.; Zhang, Q.; Li, Q.; Wang, X.; Li, H.; Sun, T.; Yin, Y.; Zheng, H.; Feng, J.; et al. Pertuzumab, Trastuzumab, and Docetaxel for Chinese Patients with Previously Untreated HER2-Positive Locally Recurrent or Metastatic Breast Cancer (PUFFIN): Final Analysis of a Phase III, Randomized, Double-Blind, Placebo-Controlled Study. Breast Cancer Res Treat 2023, 197, 503–513. [Google Scholar] [CrossRef] [PubMed]
- Phillips, G.D.L.; Fields, C.T.; Li, G.; Dowbenko, D.; Schaefer, G.; Miller, K.; Andre, F.; Burris III, H.A.; Albain, K.S.; Harbeck, N.; et al. Dual Targeting of HER2-Positive Cancer with Trastuzumab Emtansine and Pertuzumab: Critical Role for Neuregulin Blockade in Antitumor Response to Combination Therapy. Clinical Cancer Research 2014, 20, 456–468. [Google Scholar] [CrossRef] [PubMed]
- Wang, C.; Chen, J.; Xu, X.; Hu, X.; Kong, D.; Liang, G.; Wang, X. Dual HER2 Blockade in Neoadjuvant Treatment of HER2+ Breast Cancer: A Meta-Analysis and Review. Technol Cancer Res Treat 2020, 19, 1–10. [Google Scholar] [CrossRef]
- Triantafyllidi, E.; Triantafillidis, J.K. Systematic Review on the Use of Biosimilars of Trastuzumab in HER2+ Breast Cancer. Biomedicines 2022, 10, 2045. [Google Scholar] [CrossRef]
- Waller, C.F.; Möbius, J.; Fuentes-Alburo, A. Intravenous and Subcutaneous Formulations of Trastuzumab, and Trastuzumab Biosimilars: Implications for Clinical Practice. Br J Cancer 2021, 124, 1346–1352. [Google Scholar] [CrossRef] [PubMed]
- Janjigian, Y.Y.; Bissig, M.; Curigliano, G.; Coppola, J.; Latymer, M. Talking to Patients about Biosimilars. Future Oncology 2018, 14, 2403–2414. [Google Scholar] [CrossRef] [PubMed]
- Miller, E.M.; Schwartzberg, L.S. Biosimilars for Breast Cancer: A Review of HER2-Targeted Antibodies in the United States. Ther Adv Med Oncol 2019, 11, 1–9. [Google Scholar] [CrossRef] [PubMed]
- Oda, M.; Uchiyama, S.; Noda, M.; Nishi, Y.; Koga, M.; Mayanagi, K.; Robinson, C. V; Fukui, K.; Kobayashi, Y.; Morikawa, K.; et al. Effects of Antibody Affinity and Antigen Valence on Molecular Forms of Immune Complexes. Mol Immunol 2009, 47, 357–364. [Google Scholar] [CrossRef] [PubMed]
- Wen, J.; Arakawa, T.; Wypych, J.; Langley, K.E.; Schwartz, M.G.; Philo, J.S. Chromatographic Determination of Extinction Coefficients of Non-Glycosylated Proteins Using Refractive Index (RI) and UV Absorbance (UV) Detectors: Applications for Studying Protein Interactions by Size Exclusion Chromatography with Light-Scattering, UV, and RI Detectors. Techniques in Protein Chemistry 1997, 8, 113–119. [Google Scholar] [CrossRef]
- Arakawa, T.; Wen, J. Size-Exclusion Chromatography with on-Line Light Scattering. Current protocols in protein science 2001, Chapter 20, 20.6.1-20.6.1.
- Mayer, C.L.; Snyder, W.K.; Swietlicka, M.A.; Vanschoiack, A.D.; Austin, C.R.; McFarland, B.J. Size-Exclusion Chromatography Can Identify Faster-Associating Protein Complexes and Evaluate Design Strategies. BMC Res Notes 2009, 2, 135. [Google Scholar] [CrossRef]
- Bai, Y. Detecting Protein-Protein Interactions by Gel Filtration Chromatography. In Protein-Protein Interactions: Methods and Applications: Second Edition; 2015; pp. 223–232.
- Goyon, A.; Fekete, S.; Beck, A.; Veuthey, J.-L.; Guillarme, D. Unraveling the Mysteries of Modern Size Exclusion Chromatography - the Way to Achieve Confident Characterization of Therapeutic Proteins. J Chromatogr B Analyt Technol Biomed Life Sci 2018, 1092, 368–378. [Google Scholar] [CrossRef]
- Vega, J.F.; Ramos, J.; Cruz, V.L.; Vicente-Alique, E.; Sánchez-Sánchez, E.; Sánchez-Fernández, A.; Wang, Y.; Hu, P.; Cortés, J.; Martínez-Salazar, J. Molecular and Hydrodynamic Properties of Human Epidermal Growth Factor Receptor HER2 Extracellular Domain and Its Homodimer: Experiments and Multi-Scale Simulations. Biochim Biophys Acta Gen Subj 2017, 1861, 2406–2416. [Google Scholar] [CrossRef]
- Ramos, J.; Vega, J.F.; Cruz, V.; Sanchez-Sanchez, E.; Cortes, J.; Martinez-Salazar, J. Hydrodynamic and Electrophoretic Properties of Trastuzumab/HER2 Extracellular Domain Complexes as Revealed by Experimental Techniques and Computational Simulations. Int J Mol Sci 2019, 20, 1076. [Google Scholar] [CrossRef]
- Gill, S.C.; von Hippel, P.H. Calculation of Protein Extinction Coefficients from Amino Acid Sequence Data. Anal Biochem 1989, 182, 319–326. [Google Scholar] [CrossRef]
- Pace, C.N.; Vajdos, F.; Fee, L.; Grimsley, G.; Gray, T. How to Measure and Predict the Molar Absorption Coefficient of a Protein. Protein Science 1995, 4, 2411–2423. [Google Scholar] [CrossRef]
- Cruz, V.L.; Souza-Egipsy, V.; Gion, M.; Pérez-García, J.; Cortes, J.; Ramos, J.; Vega, J.F. Binding Affinity of Trastuzumab and Pertuzumab Monoclonal Antibodies to Extracellular HER2 Domain. Int J Mol Sci 2023, 24. [Google Scholar] [CrossRef]
- Hughes-Jones, N.C.; Gorick, B.D.; Howard, J.C. The Mechanism of Synergistic Complement-Mediated Lysis of Rat Red Cells by Monoclonal IgG Antibodies. Eur J Immunol 1983, 13, 635–641. [Google Scholar] [CrossRef]
- Robak, T. The Emerging Therapeutic Role of Antibody Mixtures. Expert Opin Biol Ther 2013, 13, 953–958. [Google Scholar] [CrossRef] [PubMed]
- Raju, T.S.; Strohl, W.R. Potential Therapeutic Roles for Antibody Mixtures. Expert Opin Biol Ther 2013, 13, 1347–1352. [Google Scholar] [CrossRef] [PubMed]
- Larbouret, C.; Gros, L.; Pèlegrin, A.; Chardès, T. Improving Biologics’ Effectiveness in Clinical Oncology: From the Combination of Two Monoclonal Antibodies to Oligoclonal Antibody Mixtures. Cancers (Basel) 2021, 13, 4620. [Google Scholar] [CrossRef] [PubMed]
- Skartved, N.J.Ø.; Jacobsen, H.J.; Pedersen, M.W.; Jensen, P.F.; Sen, J.W.; Jørgensen, T.K.; Hey, A.; Kragh, M. Preclinical Pharmacokinetics and Safety of Sym004: A Synergistic Antibody Mixture Directed against Epidermal Growth Factor Receptor. Clinical Cancer Research 2011, 17, 5962–5972. [Google Scholar] [CrossRef]
- Meng, Q.; Garcia-Rodriguez, C.; Manzanarez, G.; Silberg, M.A.; Conrad, F.; Bettencourt, J.; Pan, X.; Breece, T.; To, R.; Li, M.; et al. Engineered Domain-Based Assays to Identify Individual Antibodies in Oligoclonal Combinations Targeting the Same Protein. Anal Biochem 2012, 430, 141–150. [Google Scholar] [CrossRef] [PubMed]
- Singh, P.; Roche, A.; Van Der Walle, C.F.; Uddin, S.; Du, J.; Warwicker, J.; Pluen, A.; Curtis, R. Determination of Protein-Protein Interactions in a Mixture of Two Monoclonal Antibodies. Mol Pharm 2019, 16, 4775–4786. [Google Scholar] [CrossRef] [PubMed]
- Wang, B.; Deng, R.; Hennig, S.; Badovinac Crnjevic, T.; Kaewphluk, M.; Kågedal, M.; Quartino, A.L.; Girish, S.; Li, C.; Kirschbrown, W.P. Population Pharmacokinetic and Exploratory Exposure–Response Analysis of the Fixed-Dose Combination of Pertuzumab and Trastuzumab for Subcutaneous Injection in Patients with HER2-Positive Early Breast Cancer in the FeDeriCa Study. Cancer Chemother Pharmacol 2021, 88, 499–512. [Google Scholar] [CrossRef]
- Yadav, S.; Liu, J.; Shire, S.J.; Kalonia, D.S. Specific interactions in high concentration antibody solutions resulting in high viscosity. J Pharm Sci 2010, 99(3), 1152–68. [Google Scholar] [CrossRef]
- Saito, S.; Hasegawa, J.; Kobayashi, N.; Kishi, N.; Uchiyama, S.; Fukui, K. Behavior of Monoclonal Antibodies: Relation Between the Second Virial Coefficient (B2) at Low Concentrations and Aggregation Propensity and Viscosity at High Concentrations. Pharmaceutical Research 2012, 29, 397–410. [Google Scholar] [CrossRef]
- Barnett, G. V.; Qi, W.; Amin, S.; Lewis, E.N.; Razinkov, V.I.; Kerwin, B.A.; Liu, Y.; Roberts, C.J. Structural Changes and Aggregation Mechanisms for AntiStreptavidin IgG1 at Elevated Concentration. J Phys Chem B 2015, 119, 15150−15163. [Google Scholar] [CrossRef] [PubMed]
- Jaccoulet, E.; Boccard, J.; Taverna, M.; Azevedos, A.S.; Rudaz, S.; Smadja, C. High-throughput identification of monoclonal antibodies after compounding by UV spectroscopy coupled to chemometrics analysis. Anal Bioanal Chem 2016, 408, 5915–5924. [Google Scholar] [CrossRef] [PubMed]
- Vermeer A. W. P.; Norde, W. The Thermal Stability of Immunoglobulin: Unfolding and Aggregation of a Multi-Domain Protein Biophys J 2000, 78, 394–404. [CrossRef]
- Le Basle, Y.; Chenell, P.; Tokhadze, N.; Astier, A.; Sautou, V. Physicochemical Stability of Monoclonal Antibodies: A Review. J Pharm Sci 2020, 109, 169–190. [Google Scholar] [CrossRef] [PubMed]
- Lehermayr, C.; Mahler, H.-C.; Mäder, K.; Fischer, S. Assessment of Net Charge and Protein–Protein Interactions of Different Monoclonal Antibodies. J Pharm Sci 2011, 100, 2551–2562. [Google Scholar] [CrossRef] [PubMed]
- Roberts, D.; Keeling, R.; Tracka, M.; van der Walle, C.F.; Uddin, S.; Warwicker, J.; Curtis, R. The Role of Electrostatics in Protein–Protein Interactions of a Monoclonal Antibody. Mol Pharm 2014, 11, 2475–2489. [Google Scholar] [CrossRef] [PubMed]
- Kiraga, J.; Mackiewicz, P.; Mackiewicz, D.; Kowalczuk, M.; Biecek, P.; Polak, N.; Smolarczyk, K.; Dudek, M.R.; Cebrat, S. The relationships between the isoelectric point and: length of proteins, taxonomy and ecology of organisms. BMC Genomics 2007, 8, 163. [Google Scholar] [CrossRef] [PubMed]
- Knight, C.G.; Kassen, R.; Hebestreit, H.; Rainey, P.B. Global analysis of predicted proteomes: functional adaptation of physical properties. Proc Natl Acad Sci USA 2004, 101, 8390–8395. [Google Scholar] [CrossRef]
- Wang, M.; Zhu, D.; Zhu, J.; Nussinov, R.; Ma, B. Local and Global Anatomy of Antibody-Protein Antigen Recognition. J Mol Recognit 2018, 31(5), e2693. [Google Scholar] [CrossRef]

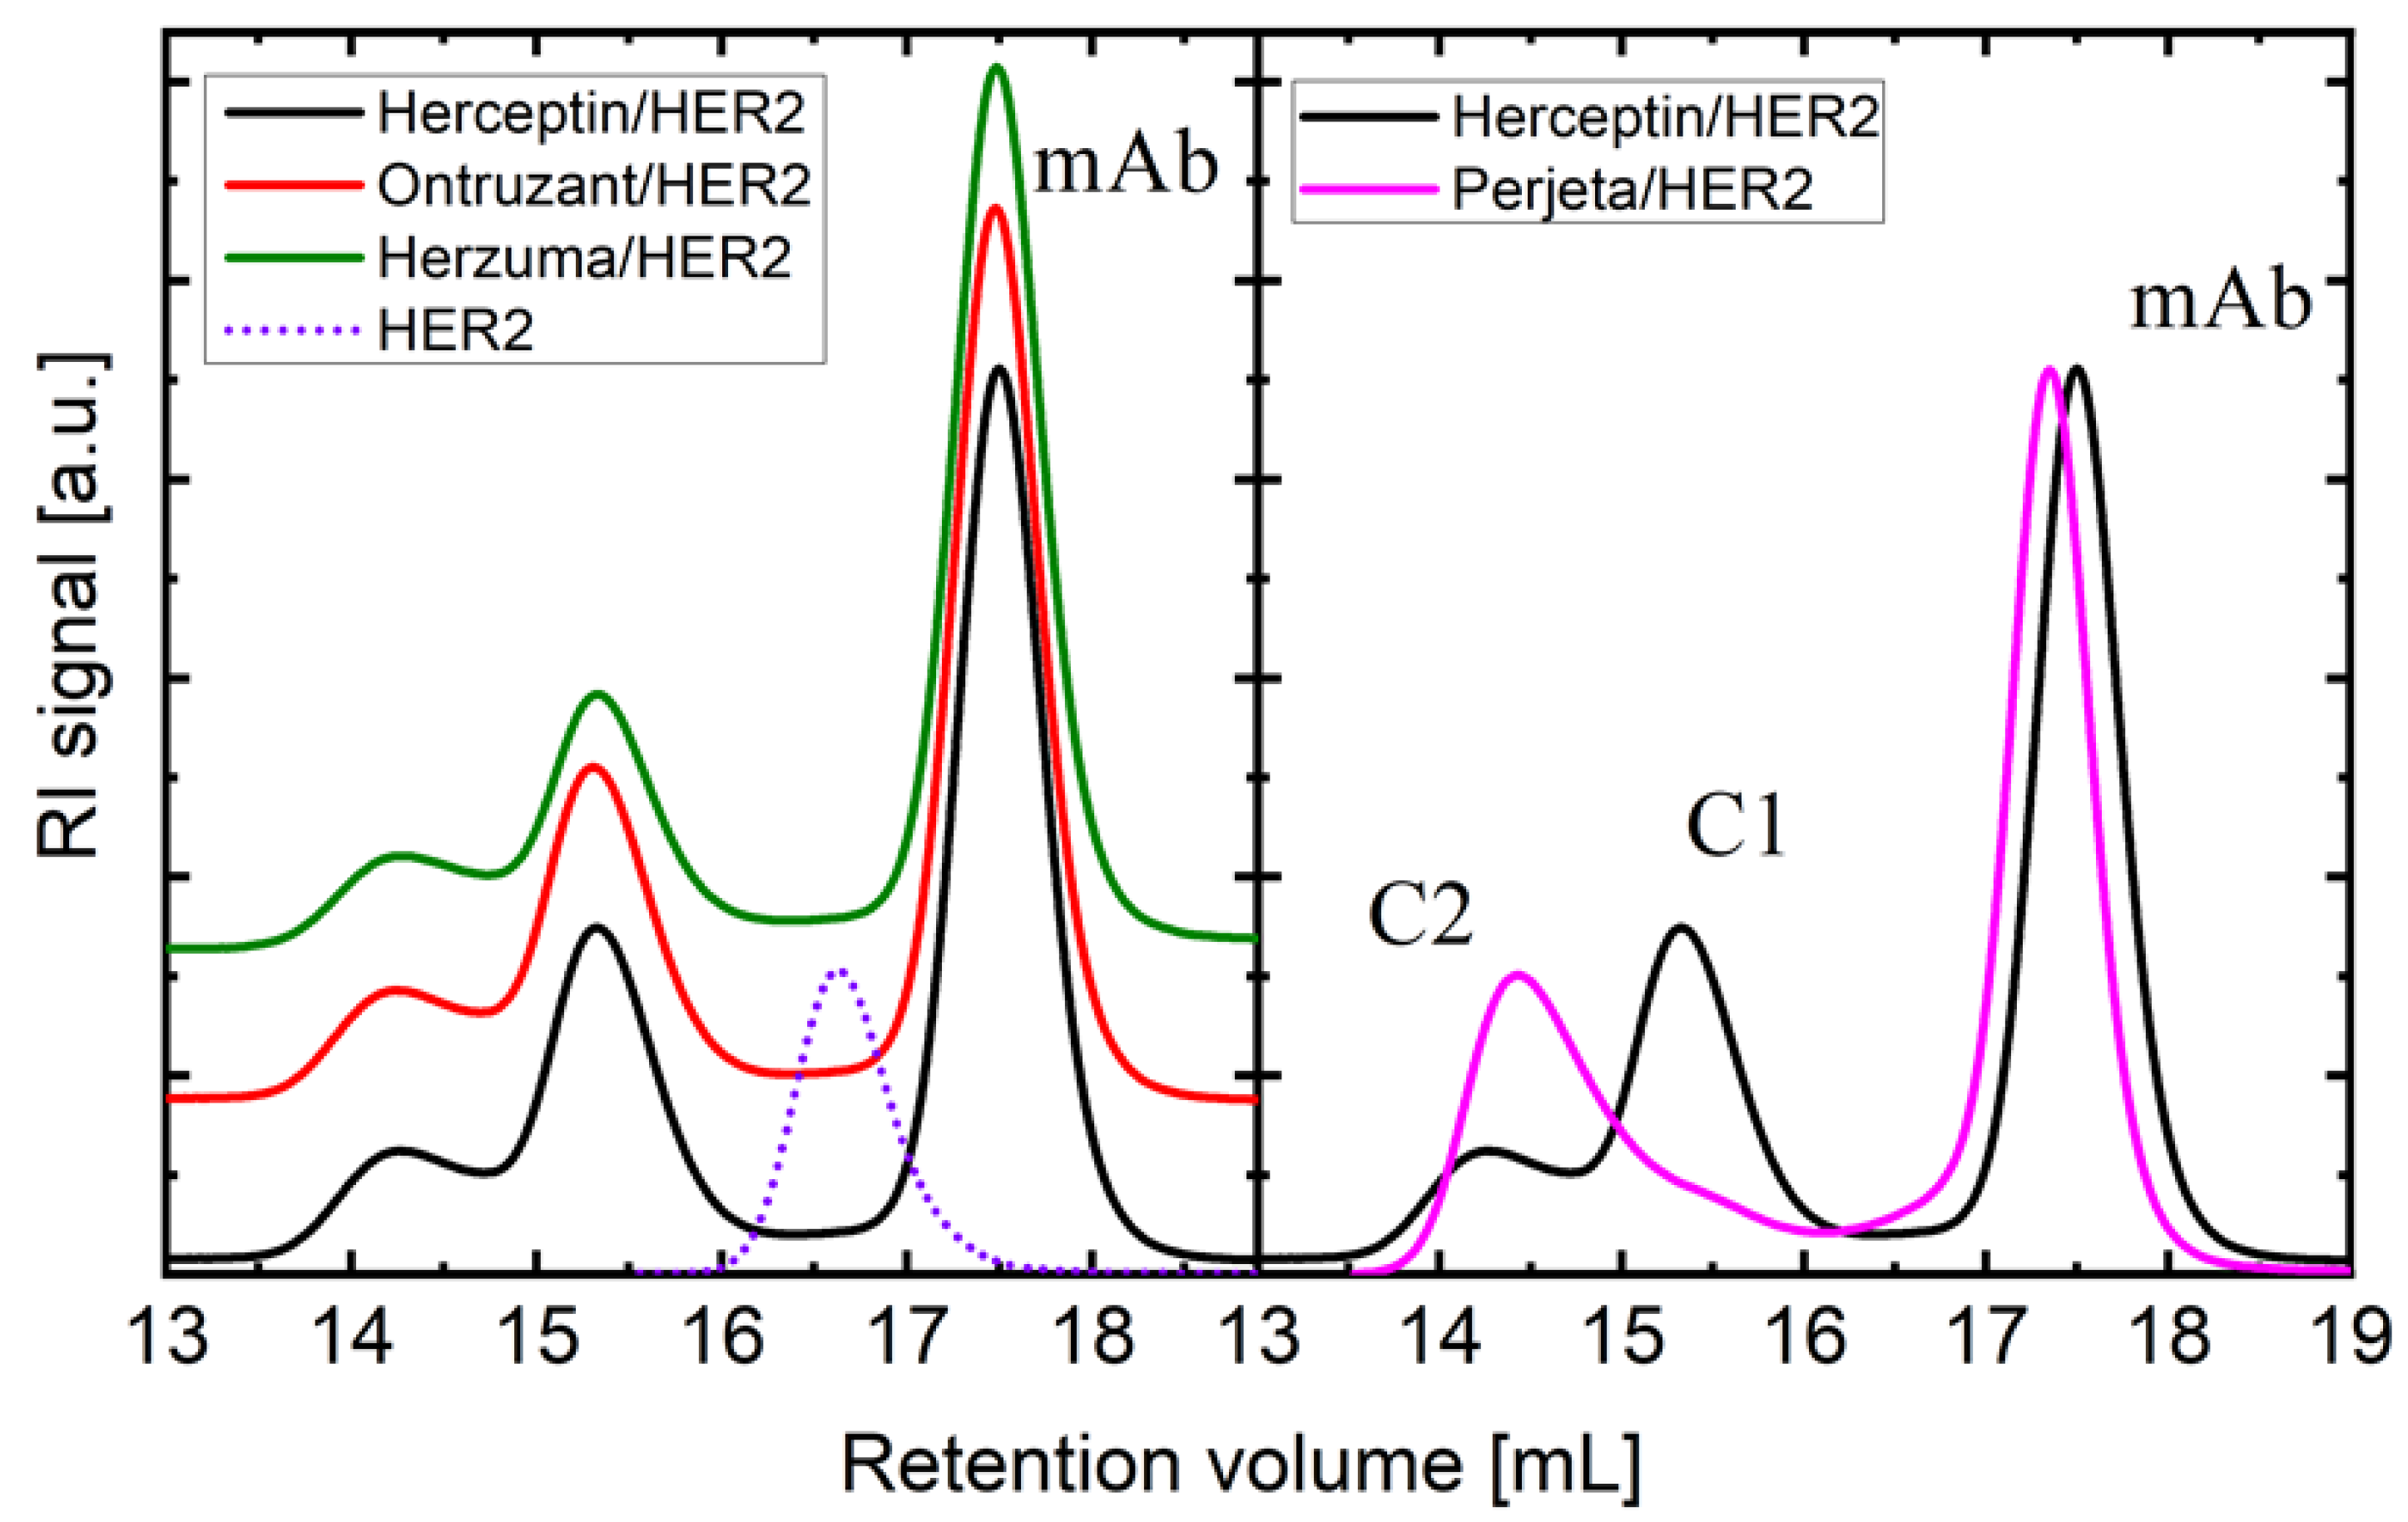
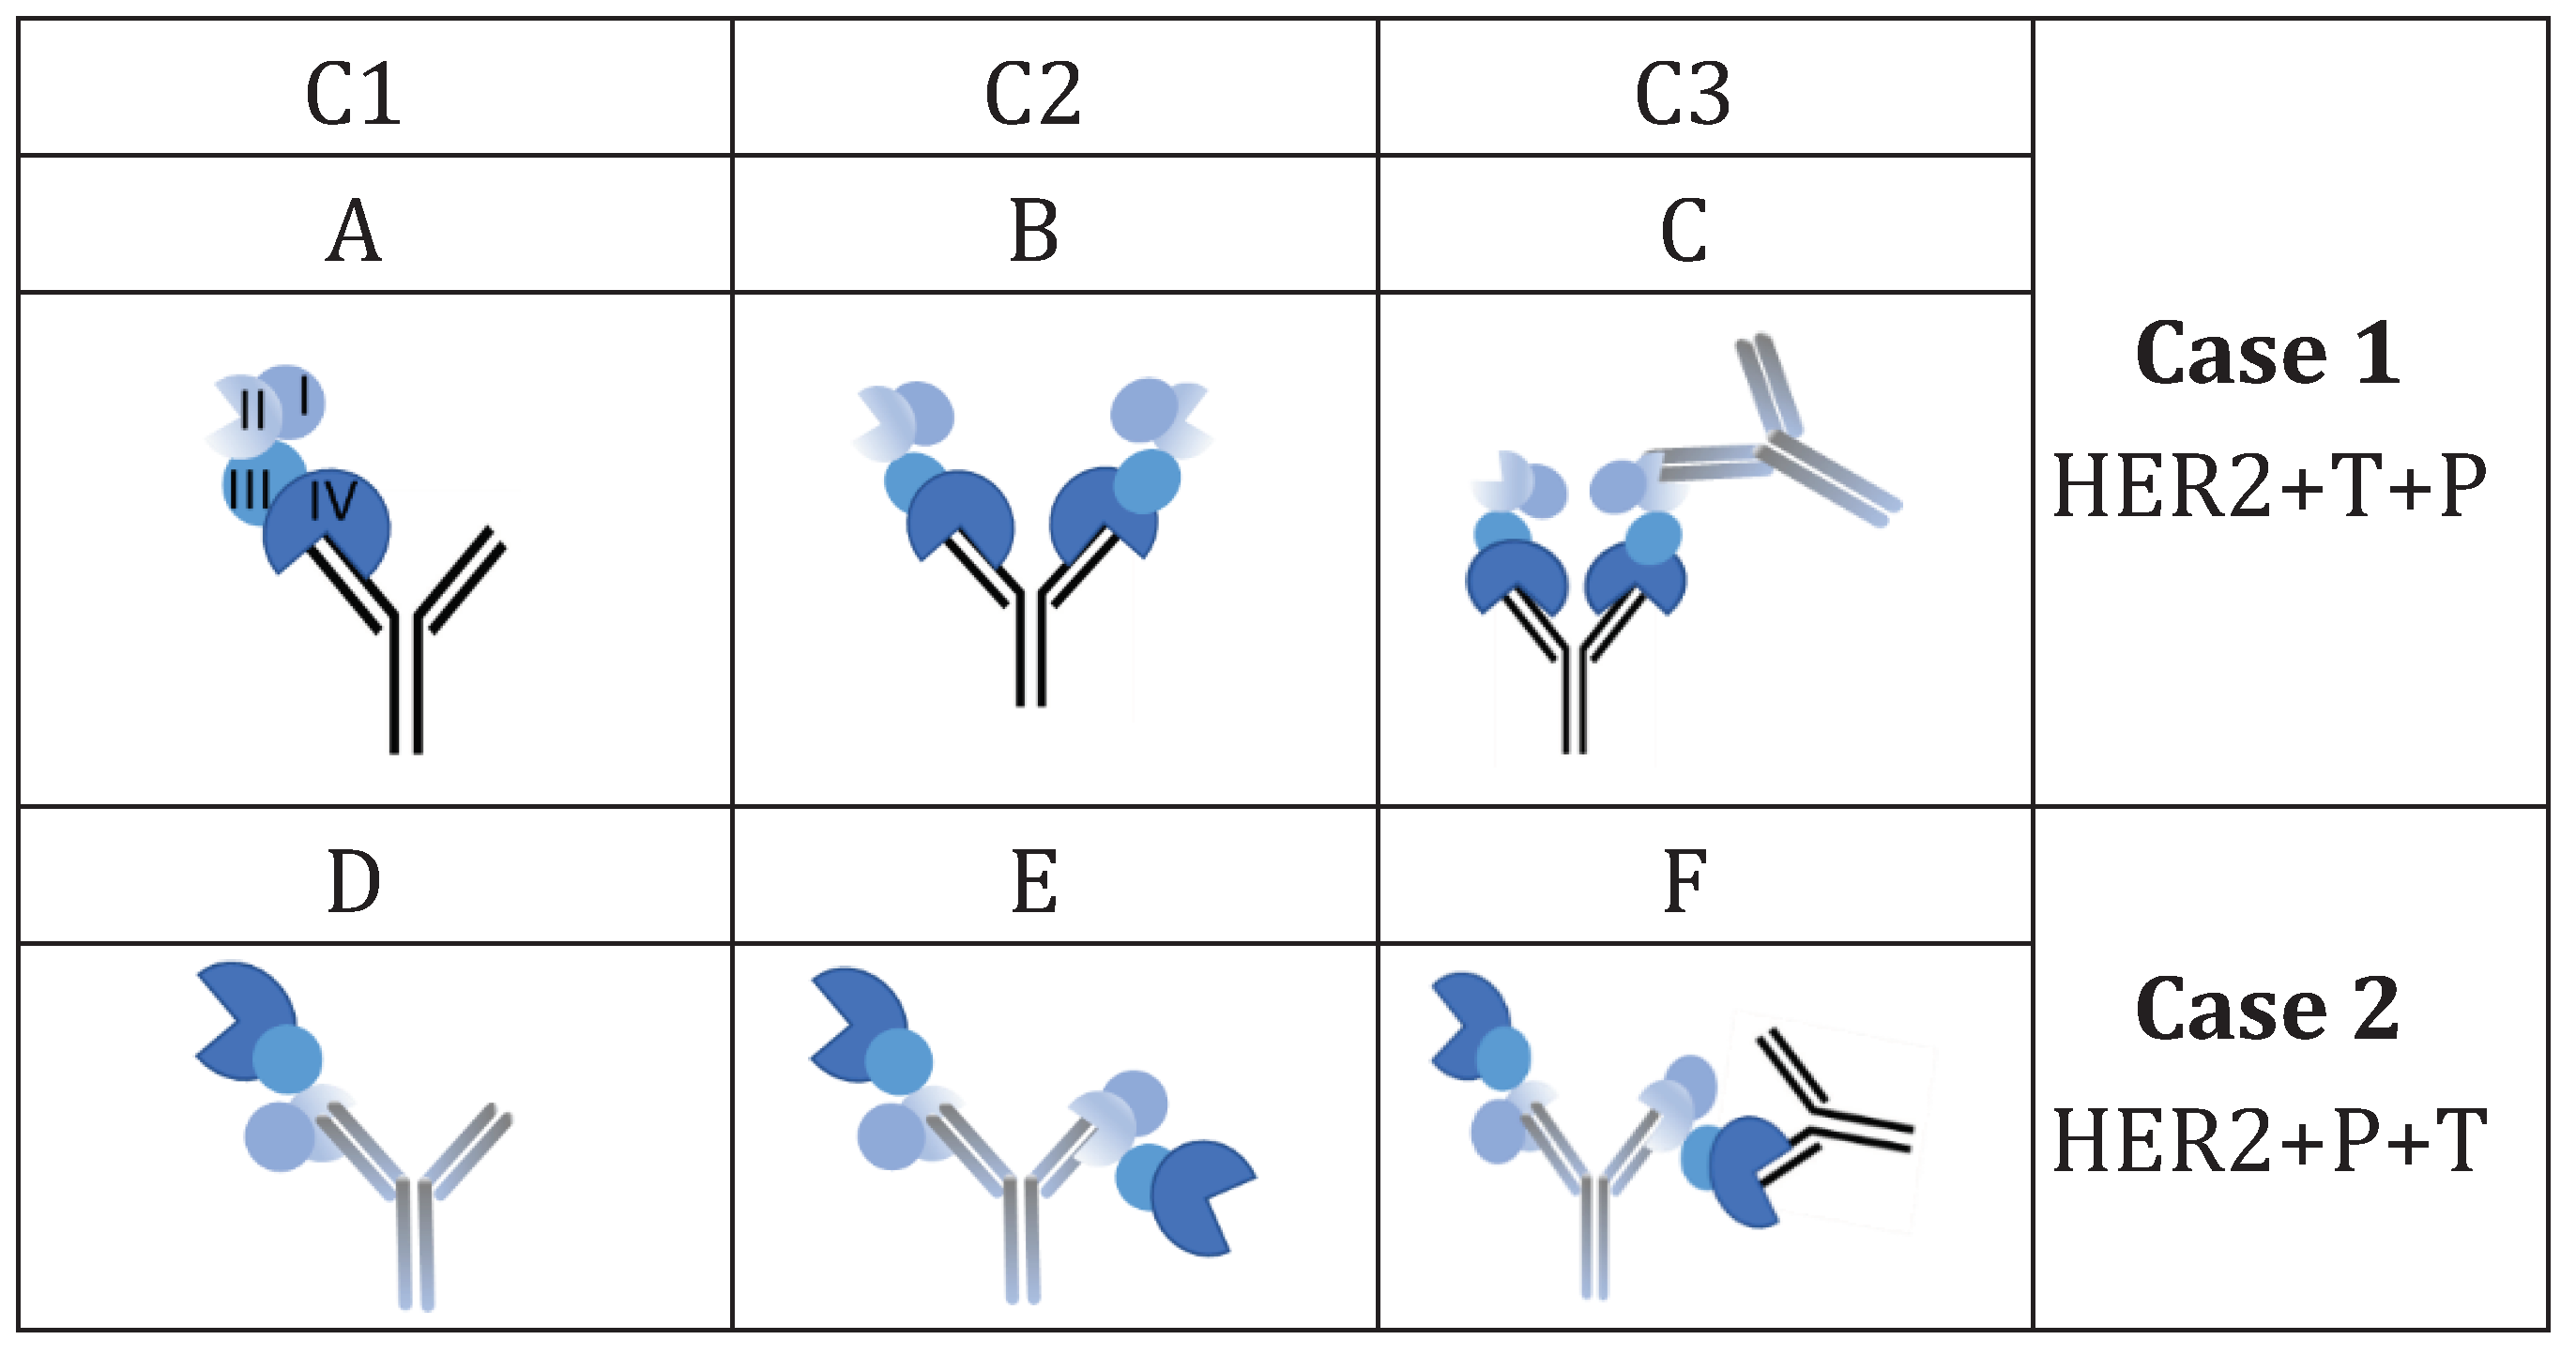
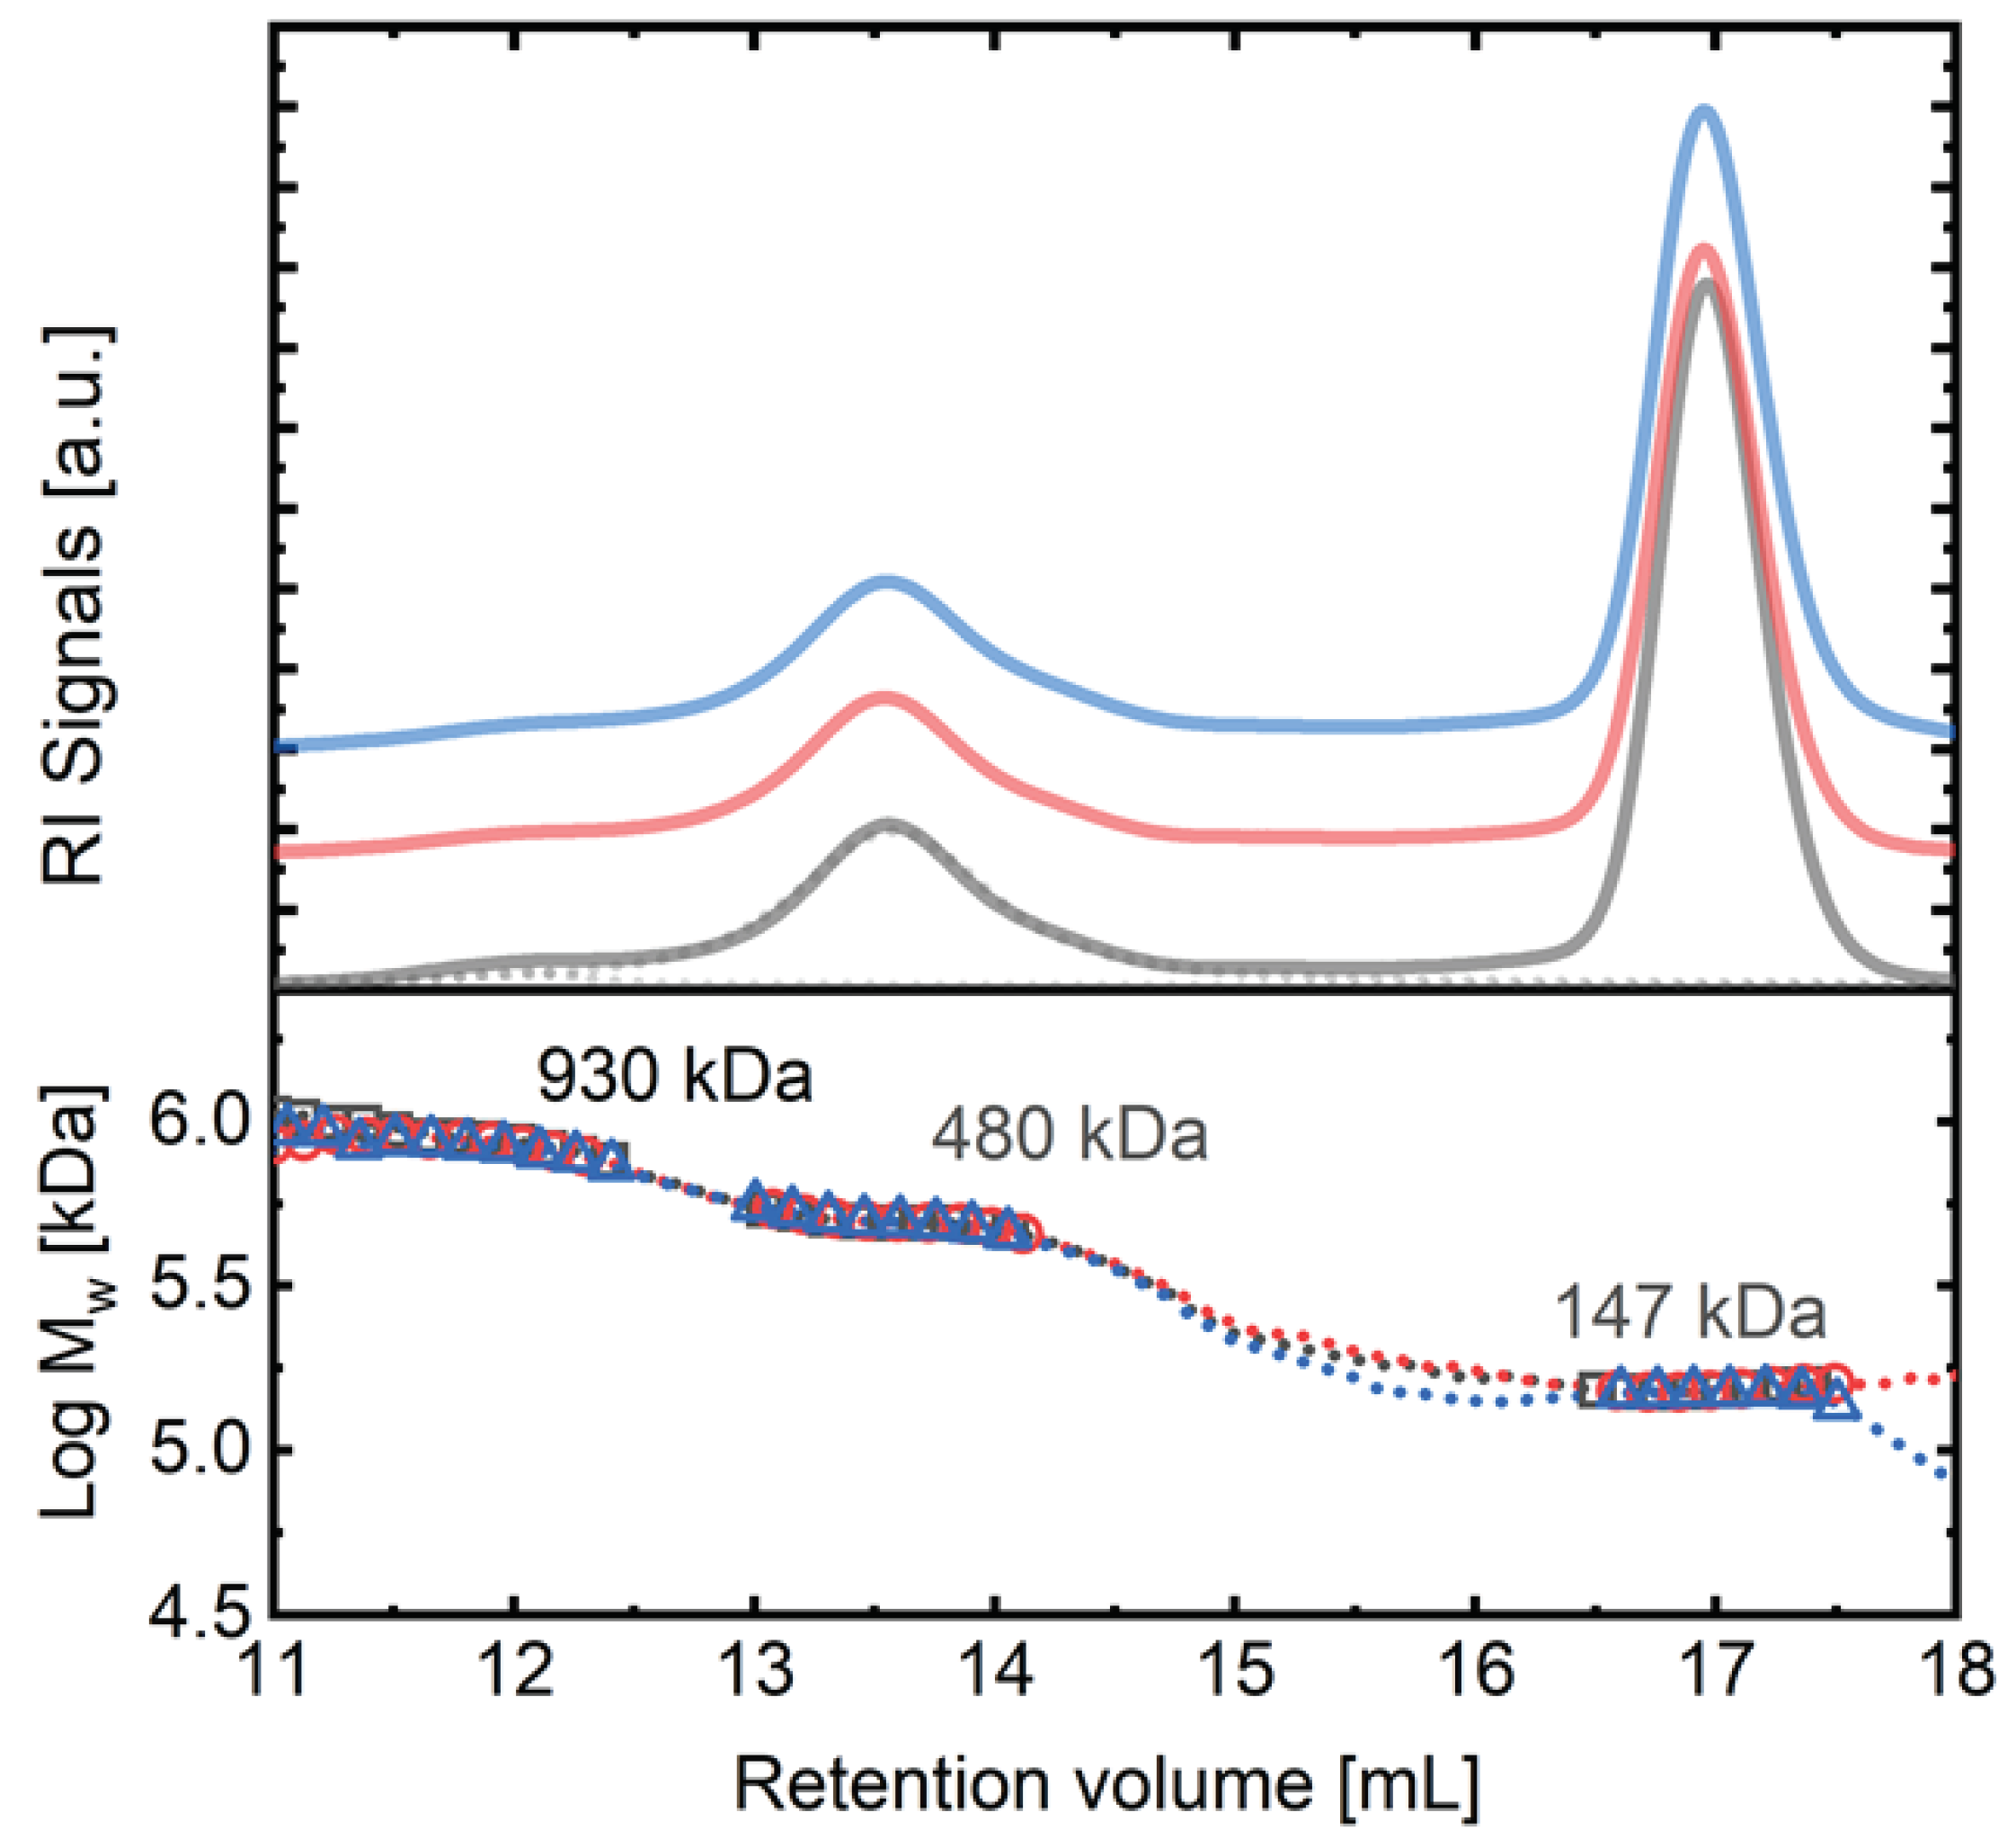
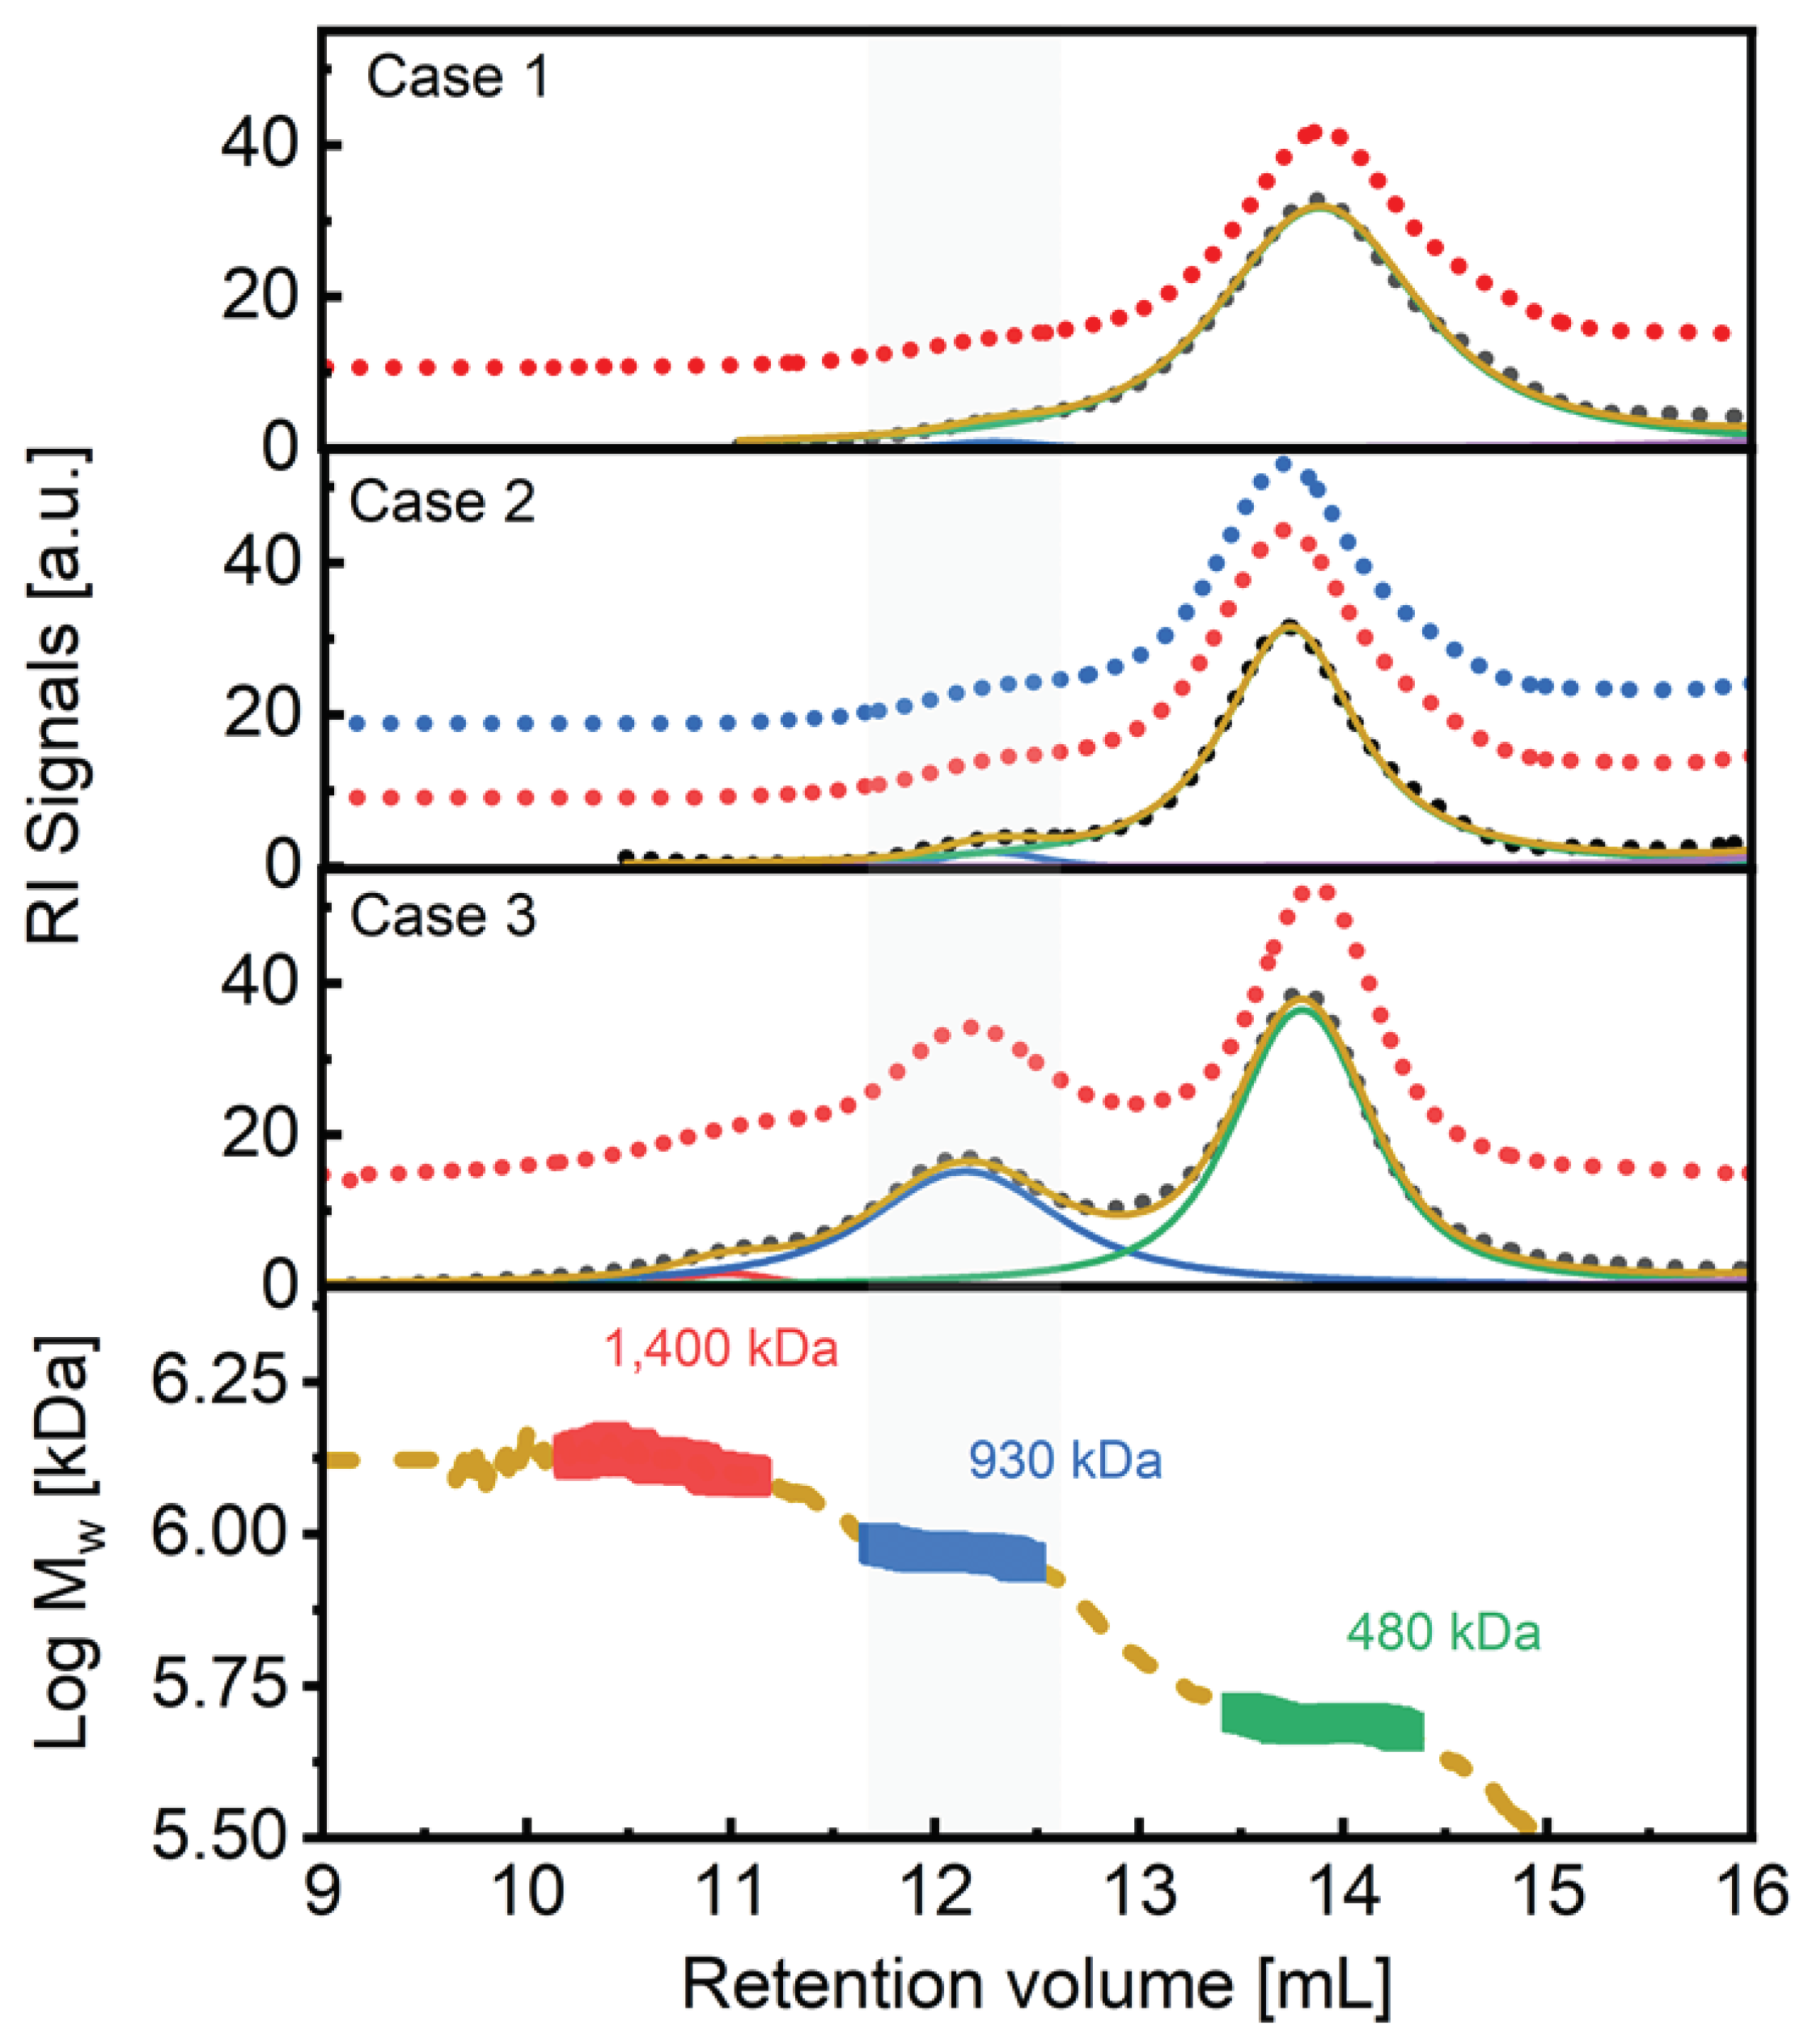
| Sample | Mw (kDa) |
[η] 102 (cm3⋅g-1) s.d. ± 0.2 |
rh (nm) s.d. ± 0.1 |
dA/dc (g-1⋅mL⋅cm-1) s.d. ± 0.02 |
|---|---|---|---|---|
| Perjeta | 147.1 ± 0.8 | 6.4 | 5.5 | 1.33 |
| Herceptin | 147.0 ± 1.6 | 6.5 | 5.5 | 1.38 |
| Herzuma | 147.9 ± 1.4 | 6.3 | 5.5 | 1.38 |
| Ontruzant | 147.7 ± 1.3 | 6.4 | 5.5 | 1.37 |
| g-eHER2 | 86.3 ± 1.0 | 6.5 | 4.4 | 0.90 |
| Sample C1/C2 |
Mw (kDa) |
[η] 102 (cm3·g-1) s.d. ± 0.2 |
rh (nm) s.d. ± 0.1 |
dA/dc (g-1⋅mL⋅cm-1) s.d. ± 0.02 |
|---|---|---|---|---|
| HRC/HER2 | 235.7/310.8 | 6.7/7.9 | 6.2/7.1 | 1.22/1.15 |
| ONT/HER2 | 237.5/313.6 | 6.9/7.7 | 6.2/7.2 | 1.23/1.14 |
| HZM/HER2 | 238.2/315.7 | 6.8/7.8 | 6.2/7.2 | 1.22/1.15 |
| C3 | Case 1: TZM/HER2/PZM | |||
| HRC/HER2/PJT | 482.5 | 8.1 | 8.5 | 1.22 |
| ONT/HER2/PJT | 483.2 | 8.2 | 8.6 | 1.22 |
| Sample C2 |
Mw (kDa) |
[η] 102 (cm3⋅g-1) s.d. ± 0.2 |
rh (nm) s.d. ± 0.1 |
dA/dc (g-1⋅mL⋅cm-1) s.d. ± 0.02 |
|---|---|---|---|---|
| PJT/HER2 | 310.0 | 8.0 | 7.4 | 1.12 |
| C3 | Case 2: PZM/HER2/TZM | |||
| PJT/HER2/HRC | 484.6 | 8.1 | 8.5 | 1.22 |
| PJT/HER2/ONT | 481.8 | 8.2 | 8.5 | 1.23 |
| PJT/HER2/HZM | 491.6 | 8.1 | 8.6 | 1.22 |
| Sample | Mw (kDa) |
[η] 102 (cm3⋅g-1) s.d. ± 0.2 |
rh (nm) s.d. ± 0.1 |
dA/dc (g-1⋅mL⋅cm-1) s.d. ± 0.02 |
|---|---|---|---|---|
| C3 | Case 3: TZM/PZM/HER2 | |||
| PJT-HRC/HER2 | 932.0/489.0 | 9.8/8.0 | 9.5/8.7 | 1.23/1.23 |
| PJT-ONT/HER2 | 945.0/489.0 | n.d./8.2 | n.d./8.8 | 1.25/1.25 |
Disclaimer/Publisher’s Note: The statements, opinions and data contained in all publications are solely those of the individual author(s) and contributor(s) and not of MDPI and/or the editor(s). MDPI and/or the editor(s) disclaim responsibility for any injury to people or property resulting from any ideas, methods, instructions or products referred to in the content. |
© 2024 by the authors. Licensee MDPI, Basel, Switzerland. This article is an open access article distributed under the terms and conditions of the Creative Commons Attribution (CC BY) license (http://creativecommons.org/licenses/by/4.0/).


