
Submitted:
26 February 2024
Posted:
27 February 2024
You are already at the latest version
Abstract
Despite past efforts towards therapeutical innovation, cancer remains a highly incident and lethal disease, with current treatments many times lacking efficiency and leading to severe side-effects. Hence, it is imperative to develop new, more efficient, and safer therapies. Bee venom has proven to have multiple and synergistic bioactivities, including antitumor effects. Nevertheless, some toxic effects have been associated with its administration. To tackle these issues, in this work, bee venom-loaded niosomes were developed, for cancer treatment. The vesicles had a small (150.4 ± 3.7 nm) and homogeneous (PDI of 0.162 ± 0.008) particle size, and revealed good therapeutic efficacy in in vitro gastric, colorectal, breast, lung, and cervical cancer models, with GI50 values between 12.37 ng/mL and 14.72 ng/mL. Additionally, they also revealed substantial anti-inflammatory activity, with an IC50 of 28.98 ng/mL, effects that have been reported to be complementary to direct antitumor activity. Finally, the niosomes' safety was assessed, both in vitro, on skin, liver and kidney cells, and ex vivo, in a HET-CAM assay, and results showed that compound encapsulation increased its safety. Hence, small and homogeneous bee venom-loaded niosomes were successfully developed, with substantial anticancer and anti-inflammatory effects, making them potentially promising primary or adjuvant cancer therapies.
Keywords:
anti-inflammatory
; anticancer
; antitumor
; bee venom
; HET-CAM
; in vitro
; nanosystems
; nanotechnology
; natural compounds
; niosomes
1. Introduction
Cancer remains one of the most incident diseases globally with high mortality rates, having been estimated to affect almost 2 billion people just in the United States of America in the year of 2023, with more than 600 thousand related deaths, and having similar incidence rates all over the world [1,2,3]. Although the fast-paced advances in medicine are today able to prolong the life of these patients, and even cure them in some cases, most common cancer therapies, such as chemotherapy, radiotherapy, immunotherapy, and surgery, are linked with poor prognosis and/or severely debilitating side-effects, such as nausea and vomiting, pain, fatigue, depression, hair loss, and immune system debilitation, which can lead to opportunistic infections due to the body’s higher vulnerability and low defenses [4,5,6]. Hence, there is an urgent need for new, more effective, and safer therapies.
Bee venom, also known as apitoxin, is a substance produced in the venom gland under the abdominal cavity of female worker bees, and it is a colorless and odorless liquid, with an acid pH between 4.5 and 5.5. It is used by these insects to defend the hive against external threats [7]. In its composition, we can find proteins like melittin, apamin, adolapin, and scapin, and enzymes such as phospholipase A2, hyaluronidase, and lysophospholipase, as well as other substances, including amino acids, carbohydrates, pheromones and minerals. Among all these compounds, melittin is the main active ingredient in bee venom, comprising 40% to 60% of its dry weight, followed by the enzyme phospholipase A2, present in 10-12% [8]. The complex chemical composition of bee venom, and the potential synergy surrounding the interaction between its compounds, assures a vast range of biological activities, capable of targeting different diseases. These biological properties include anti-inflammatory, antioxidant, antiviral, antimicrobial and antitumor properties (Figure 1) [9]. All these bioactivities could be potentially beneficial for a series of different diseases, from skin diseases, such as acne, wounds, psoriasis, or atopic dermatitis, to neurodegenerative diseases, such as Parkinson's disease, due to proven neuroprotective effects, and, of course, cancer [10] [11]. Nevertheless, while bee venom can be tolerated by the human body, it can cause some allergic reactions, as well as systemic and local inflammatory responses, other immune reactions, and anticoagulant effects, are the main drawbacks for its use as a potential therapeutic agent [8]. New strategies are needed in order to increase the safety of bee venom administration and its incorporation into nanotechnological platforms to enhance its properties, avoid degradation, and reduce the potential side effects can be the answer [12].
The use of nanotechnology for drug delivery can not only protect the drug from chemical and metabolic degradation, but also allow increased permeation through biological barriers, and enable a controlled, sustained and targeted drug delivery, hence leading to more localized therapeutic effects, and thus reduced systemic toxicity [13,14,15]. Several types of nanosystems have been developed over the years, namely nanoemulsions, micelles, polymeric nanoparticles, and lipid nanoparticles, such as liposomes, and their more recent and innovative alternatives, ethosomes, transfersomes and niosomes [16,17,18]. Niosomes are vesicular nanosystems capable of self-assembly, composed of amphiphilic molecules, such as non-ionic surfactants, which form an outer bilayered membrane, and an aqueous core [19,20]. This structure makes them highly versatile nanosystems for therapeutic application since they can deliver both hydrophobic molecules, within the bilayered membrane, and hydrophilic molecules, encapsulated within their aqueous core. Other molecules, such as cholesterol or similar lipids, can also be part of the niosomal membrane, giving them better properties, such as higher stability and deformability [21,22]. Thanks to their composition, niosomes are biodegradable and biocompatible, on account of the similarity between the lipids used for niosome production and the ones found in the human body, especially on the cellular membranes [23,24]. Additionally, when compared to their ancestors, liposomes, niosomes possess higher stability and longer shelf-life, a better capacity for controlled drug release, and lead to higher drug bioavailability [25].
Hence, given the great therapeutic potential of bee venom, and the promising properties of niosomes for increased therapeutic efficacy and safety, the purpose of the present study was to develop and characterize bee venom-loaded niosomes, for potential anticancer therapy. Their physicochemical, therapeutic and safety profiles were assessed, including particle size and polydispersity index determination, in vitro cytotoxicity and anti-inflammatory potential assessment, and in vitro and ex vivo safety evaluation.
2. Materials and Methods
2.1. Materials and Reagents
Tween® 20, cholesterol, cetyl alcohol, chloroform, sulforhodamine B, lipopolysaccharide, trypan blue, dexamethasone, trichloroacetic acid, tris(hydroxymethyl)aminomethane buffer, cytochrome C from equine heart (purity ≥ 95%), melittin (purity ≥ 85%, HPLC grade) and phospholipase A2 (activity: 1775 units/mg solid) were purchased from Sigma-Aldrich (Saint Louis, Missouri, United States of America). Apamin (purity 98.3%) was purchased from CalBiochem (San Diego, California, United States of America). Fetal bovine serum, penicillin, streptomycin, trypsin, L-glutamine, and Dulbecco’s modified Eagle’s medium (DMEM) were purchased from Gibco Invitrogen Life Technologies (California, United States of America). Formic acid (HPLC grade) and acetonitrile (HPLC grade) were obtained from Fisher Scientific (Loughborough, Leicestershire, United Kingdom). The Griess reagent system kit was bought from Promega (Madison, Wisconsin, United States of America). Ultrapure water was obtained from adequate purification systems (Ellix Essential Millipore®, Darmstadt, Germany, and TGI Pure Water Systems, Brea, California, United States of America).
2.2. Bee Venom Production and Harvesting
The bee venom used as the active compound to be encapsulated within the developed niosomes was collected between August and November of 2018 from Apis mellifera intermissa hives located in the northeast region of Morocco. To collect the bee venom, a double-face bee venom collector was used, especially developed for the purpose by the research team. The device was positioned in the hive at one of the outermost, diametrically opposed ends of the beehive, and produced mild electrical impulse shock waves on the beehive, which made the worker bees sting the glass, as a defense mechanism, leaving the bee venom deposited on it. Following the collection process, the venom was meticulously removed from the glass using a scraper and subsequently stored in pharmaceutical-grade vials. Samples were then freeze-dried, in a freeze dryer (Labconco FreeZone 4.5, Labconco Corporation, Kansas City, Missouri, USA), and kept at −20 ºC until further analysis [26].
2.3. Ultra-High-Performance Liquid Chromatography Analysis
The ultra-high-performance liquid chromatography (UHPLC) analysis was executed utilizing a Dionex Ultimate 3000 UHPLC instrument (Thermo Scientific, Waltham, Massachusetts, United States of America), featuring a diode-array detector. The chromatographic system comprised a quaternary pump, an autosampler maintained at 5 °C, a degasser, a photodiode array detector, and an automatic thermostatic column compartment. Chromatographic separation was conducted on an XSelect CSH130 C18, 100 mm × 2.1 mm id, 2.5 µm XP column (Waters, Milford, MA, USA), with a constant temperature of 30 ºC. The mobile phase consisted of 0.1% (v/v) formic acid in water and 0.1% (v/v) formic acid in acetonitrile, previously degassed and filtered. The used conditions were in accordance with previous studies [27]. Spectral data for all peaks were gathered within the range of 190–500 nm. Control and data acquisition were conducted using the Xcalibur® data system (Thermo Scientific). Cytochrome C, employed as the internal standard, was prepared in deionized water at a concentration of 25 µg/mL. For analysis, the lyophilized bee venom (3 mg) was dissolved in 10 mL of internal standard. Each sample was filtered through a 0.2 µm polytetrafluoroethylene membrane. Bee venom peptide quantification was achieved using calibration curves for apamin (at a range of 2 - 60 µg/mL, y = 0.040x + 0.055, R2 = 0.999), phospholipase A2 (at a range of 8 - 120 µg/mL, y = 0.049x − 0.356, R2 = 0.999), and melittin (at a range of 15 - 250 µg/mL, y = 0.062x + 0.029, R2 = 0.997).
2.4. Niosome Formulation Development and Characterization
For formulation preparation, the thin-film hydration method was applied (Figure 2), which is the most commonly used method for niosome production [20,28]. Firstly, the non-ionic surfactant and lipid fraction (3.5:2 molar ratio) were weighed into a round bottom flask and then dissolved in 6 mL of chloroform. The organic solvent was subsequently evaporated, in a rotary evaporator (Rotavapor R-210/215, BÜCHI, Switzerland), combined with a vacuum pump (V-700/710, BÜCHI, Switzerland), and a vacuum controller (V-850/855, BÜCHI, Switzerland), in a heating water bath (40 ºC to 60 ºC), with a rotation speed of 8 rpm, and under reduced pressure (120 mbar), for 60 minutes. After full organic solvent evaporation, a thin layer was formed on the interior of the flask, and this thin layer was then hydrated with either deionized water (6 mL) for the formulation vehicle (empty niosomes), or an aqueous compound solution (2 µg/mL) for the bee venom-loaded niosomes, under mild magnetic stirring, for 60 minutes. Although after thin-film hydration vesicles were already formed, to attain a nanometric and homogeneous particle size, the mixture was extruded (Avanti Mini-Extruder, Avanti Polar Lipids, USA) through a synthetic polycarbonate membrane with a 200 nm pore size (Avanti Polar Lipids, USA). Various extrusion cycles were performed (11, 21, 31, 41, and 51), and the particle size and polydispersity index (PDI) for every performed cycle series were subsequently measured. Particle mean hydrodynamic size and PDI of the developed formulations were measured by dynamic light scattering, using a Zetasizer apparatus (ZetaSizer Nano ZS, Malvern Instruments, Malvern, United Kingdom). Samples were diluted 40-fold in deionized water, and measured in disposable polymethyl methacrylate 12 mm square diameter cuvettes, at 25°C. All the samples were measured in triplicate and the mean and standard deviation are reported. Formulations were stored in a refrigerator at 4 °C until further characterization.
2.5. In Vitro Therapeutic Potential
2.5.1. Cytotoxic Activity
The developed formulations’ cytotoxic activity was tested in several different human cancer cell lines, namely: AGS (gastric adenocarcinoma), Caco-2 (colorectal adenocarcinoma), MCF-7 (breast adenocarcinoma), NCI-H460 (lung carcinoma), and HeLa (cervical carcinoma). For assessment of the potential toxicity of the developed formulations on non-cancerous tissues, non-tumor cell lines Vero (African green monkey kidney) and PLP2 (primary pig liver culture) were also tested. All cell lines were maintained in RPMI-1640 medium, supplemented with 10% fetal bovine serum, glutamine (2 mM), penicillin (100 U/mL), and streptomycin (100 mg/mL), except Vero cells, which were maintained in DMEM medium. The culture flasks were incubated at 37 ºC, under a 5% CO2 and high humidity atmosphere. Cells were used only upon reaching a 70 to 80% confluence.
Formulations were dissolved in water:dimethyl sulfoxide (DMSO) (1 mL; 1:1) to obtain stock solutions with a concentration of 1 μg/mL, from which successive dilutions were made, obtaining the samples at the concentrations to be tested (0.05 – 0.0008 μg/mL). Each sample (10 μL) was incubated with the cell suspension (190 μL) in 96-well microplates, for 72 hours. The microplates were incubated at 37 ºC, under a 5% CO2 and high humidity atmosphere. All cell lines were tested at a concentration of 10,000 cells/well, except for Vero cells, in which a density of 19,000 cells/well was used. Subsequently to this incubation period, plates were incubated again, for 1 hour, at 4 ºC, after the addition of previously cooled trichloroacetic acid (10% w/v; 100 μL). The plates were then washed with water and, after drying, a sulforhodamine B solution (0.057% w/v, 100 μL) was added, and then left to stand at room temperature for 30 minutes. To remove non-adhered sulforhodamine B, the plates were washed three times with an acetic acid solution (1% v/v) and left to dry. Finally, the adhered sulforhodamine B was solubilized with Tris(hydroxymethyl)aminomethane (Tris) buffer (10 mM, 200 μL), and sample absorbance was measured at a wavelength of 540 nm, in a microplate reader (ELX800 Biotek microplate reader, Bio-Tek Instruments, Inc., Winooski, VT, United States of America). The results are expressed in terms of the sample concentration with the ability to inhibit cell growth by 50% (GI50).
2.5.2. Anti-Inflammatory Activity
The anti-inflammatory activity of the developed formulations was also assessed. First, the formulations were diluted in a water:DMSO solution to obtain a final concentration of 1 μg/mL, from which successive dilutions were carried out. Final concentrations ranged from 0.05 to 0.0008 mg/mL. A RAW 264.7 mouse macrophage cell line was used (Leibniz Institute DSMZ - German Collection of Microorganisms and Cell Cultures GmbH), and grown in DMEM medium, supplemented with heat-inactivated fetal serum (10%), glutamine and antibiotics, and kept in an incubator at 37 ºC, with a 5% CO2 and highly humid atmosphere. Cells were detached with a cell scraper, and an aliquot of macrophages cell suspension (300 μL), with a cell density of 5 x 10⁵ cells/mL, and with a proportion of dead cells below 5% (according to the trypan blue exclusion test), was placed in each well. The microplate was incubated for 24 hours, in an incubator, at the previously indicated conditions, to allow for adequate cell adherence and multiplication. After that period, the cells were treated with different concentrations of the developed formulations (15 μL) and incubated for one hour, with the range of tested concentrations being between 0.05 and 0.0008 μg/mL. Stimulation was performed with the addition of 30 μL of a liposaccharide (LPS) solution (1 mL/mL) and incubation for an additional 24 hours. Dexamethasone (50 mM) was used as a positive control, and samples in the absence of LPS were used as a negative control. Quantification of nitric oxide was performed using a Griess reagent system kit (nitrophenamide, ethylenediamine, and nitrite solutions). The produced nitric oxide was determined by reading absorbances at 540 nm (ELX800 Biotek microplate reader, Bio-Tek Instruments, Inc., Winooski, VT, United States of America), on a 96-well microplate, and by comparison with a standard calibration curve. Results are depicted by a graphical representation of the percentage of inhibition of nitric oxide production versus sample concentration, and expressed in relation to the formulation concentration that causes the 50% inhibition of nitric oxide production (IC50).
2.6. Safety Assessment
2.6.1. In Vitro Safety Assessment – Cytotoxicity Evaluation on HaCaT and HFF-1 Cell Lines
To assess the safety of the developed formulations in vitro, the colorimetric sulforhodamine B assay was conducted on two human cell lines: HFF-1 (human skin fibroblasts) and HaCaT (human immortalized keratinocytes). This assay measured cell survival after treatment with the developed formulations. The cell lines were cultured in DMEM medium, supplemented with fetal bovine serum (10%), glutamine, and antibiotics (penicillin and streptomycin 1%), in an incubator at 37 °C, with a 5% CO2 atmosphere, and with saturated controlled humidity. Trypsin was used to disperse the cells from the inside of the flask where they were cultured, since these cells are adherent. The cell density for this assay was 10,000 cells per well. X-triton (1%), a detergent, served as a positive control due to its capacity to disrupt and destroy all cells. For the negative control group, only cells and medium were added (no formulation or other compound).
After the cells were dispersed by trypsin in the culture medium, centrifuged at 3000 rpm for 5 minutes, and resuspended in the medium, 10,000 cells per well were plated in a 96-well optical-bottom plate to adhere overnight. Afterwards, the bee venom-loaded niosomes and empty niosomes (formulation vehicle) samples were prepared by diluting them in water, for final concentrations equal to 0.1, 0.05, 0.025, and 0.0125 mg/mL, which were added to the plate. Samples at the exact same concentrations were also prepared for the bee venom compound solution, also by dilution with water. Each concentration level was tested in triplicate. The plates were then incubated for 48 hours at 37 °C and in a 5% CO2 atmosphere. After 48 hours, the cells were fixated with trichloroacetic acid, for 1 hour, at 4 °C. Afterwards, the liquid inside the plate was discarded, and the plate was washed 3 times with water, and left to dry. Once dried, 100 µL of sulforhodamine B was added to each well and left there for 30 minutes at room temperature. Acetic acid at 1% was used to remove the unbounded dye from the cells, and the bounded dye was dissolved with a 10 mM Tris buffer. The IC50 values were expressed as the concentration (µg/mL) of each formulation that caused 50% inhibition of cell growth. Samples were quantified by using UV-visible spectrophotometry in a microplate reader (ELX800 microplate reader, Bio-Tek Instruments, Winooski, Vermont, United States of America) at 540 nm, based on previously described methods [27,29].
2.6.2. Ex Vivo Safety Assessment – HET-CAM Test
The hen's egg-chorioallantoic membrane (HET-CAM) test method was used to assess the irritation-inducing potential of the developed formulations, upon contact with a highly sensitive biological membrane, focusing on its ability to induce toxicity in the chorioallantoic membrane of a chicken egg. This type of membrane is known to resemble the human eye, and even if the product is not intended for ocular use, the test can still be quite useful since a formulation that is reasonably safe for eye application is probably also safe for contact with most other human organs [30].
The assay was done following the Interagency Coordinating Committee on the Validation of Alternative Methods (ICCVAM) recommended test method [31]. The experimental protocol consisted on the incubation of forty Leghorn fertilized chicken eggs, for 10 days, in an automatic rotating incubator, at 37 °C and 65% humidity. To confirm the presence of an embryo, a flashlight was used against each egg. If no embryo was detected that egg would be excluded from the experiment, and not used. For each tested formulation, a total of three eggs were used. After the 10-day incubation period, the top part of the eggshells was cut open to expose the chorioallantoic membrane, so that the formulation could then be applied. Nevertheless, before formulation application, all the membranes were hydrated using a 0.9% NaCl solution, for 30 minutes. Then, three formulation drops (approximately 0.1 mL per drop, for a total of 0.3 mL of formulation) were applied to the chorioallantoic membrane of each egg [31]. The negative control group were three eggs where a 0.9% NaCl solution was applied (no reaction intended), while for the positive control group a 10% NaOH solution was applied on the membrane of three eggs (inflammatory reaction intended). The irritancy degree of each formulation was observed and monitored by the appearance of the following events: hemorrhage (bleeding of the vessels), lysis (disintegration of the vessels), and coagulation (intra and/or extra-vascular protein denaturation). The occurrence or non-occurrence of these events was observed at specific time points, namely 0.5, 2, and 5 minutes. A total score was then attributed, from 0 to 21, being the sum of the values attributed to each event and corresponding to a level of irritability (Table 1). Hence, after the 5-minute time interval, formulations were given an irritation score (IS), with the following corresponding irritation levels: an IS score between 0 and 4.9 being slightly/non-irritative; an IS score between 5 and 8.9 being moderately irritative; and an IS score between 9 and 21 being strongly irritative [31,32].
2.7. Data Analysis
For a better understanding and interpretation of the results, whenever possible statistical analysis was performed, using GraphPad Prism® (GraphPad, San Diego, CA, USA), version 8.0 software. More specifically, either a one-way ANOVA or a two-way ANOVA test was applied, with a Tukey's multiple comparisons post-test. A 95% confidence level was considered in all analysis, with a p value < 0.05 being considered statistically significant.
3. Results and Discussion
3.1. Niosomal Formulation Development and Characterization
The bee venom samples went through chemical characterization, by quantification of its major constituents (Table 2) [27]. An example of the obtained chromatogram using UHPLC is shown in Figure 3. Three main compounds were quantified, with melittin being the most abundant compound present in the sample (63%), followed by phospholipase A2 (12%), and apamin (1.2%), which is in agreement with the reported previous works [7,33].
Tween® 20, a hydrophilic non-ionic surfactant, was used to form the niosomes, with the addition of cholesterol and cetyl alcohol (1:1) as the lipidic components. It has been reported that non-ionic surfactants with HLB values above 6 require the addition of a lipidic component to correctly produce niosomes [20]. Additionally, adding cholesterol to a niosomal formulation improves the cohesion of the niosomal membrane [34], enhances membrane stability, decreases membrane fluidity, eliminates the gel-to-liquid phase transition temperature, allows better loading of hydrophilic drugs [35], and improves entrapment efficiency by filling empty spaces in the bilayer vesicle [24]. The addition of cholesterol and cetyl alcohol has also been reported to improve the overall stability of the produced niosomal structures [36].
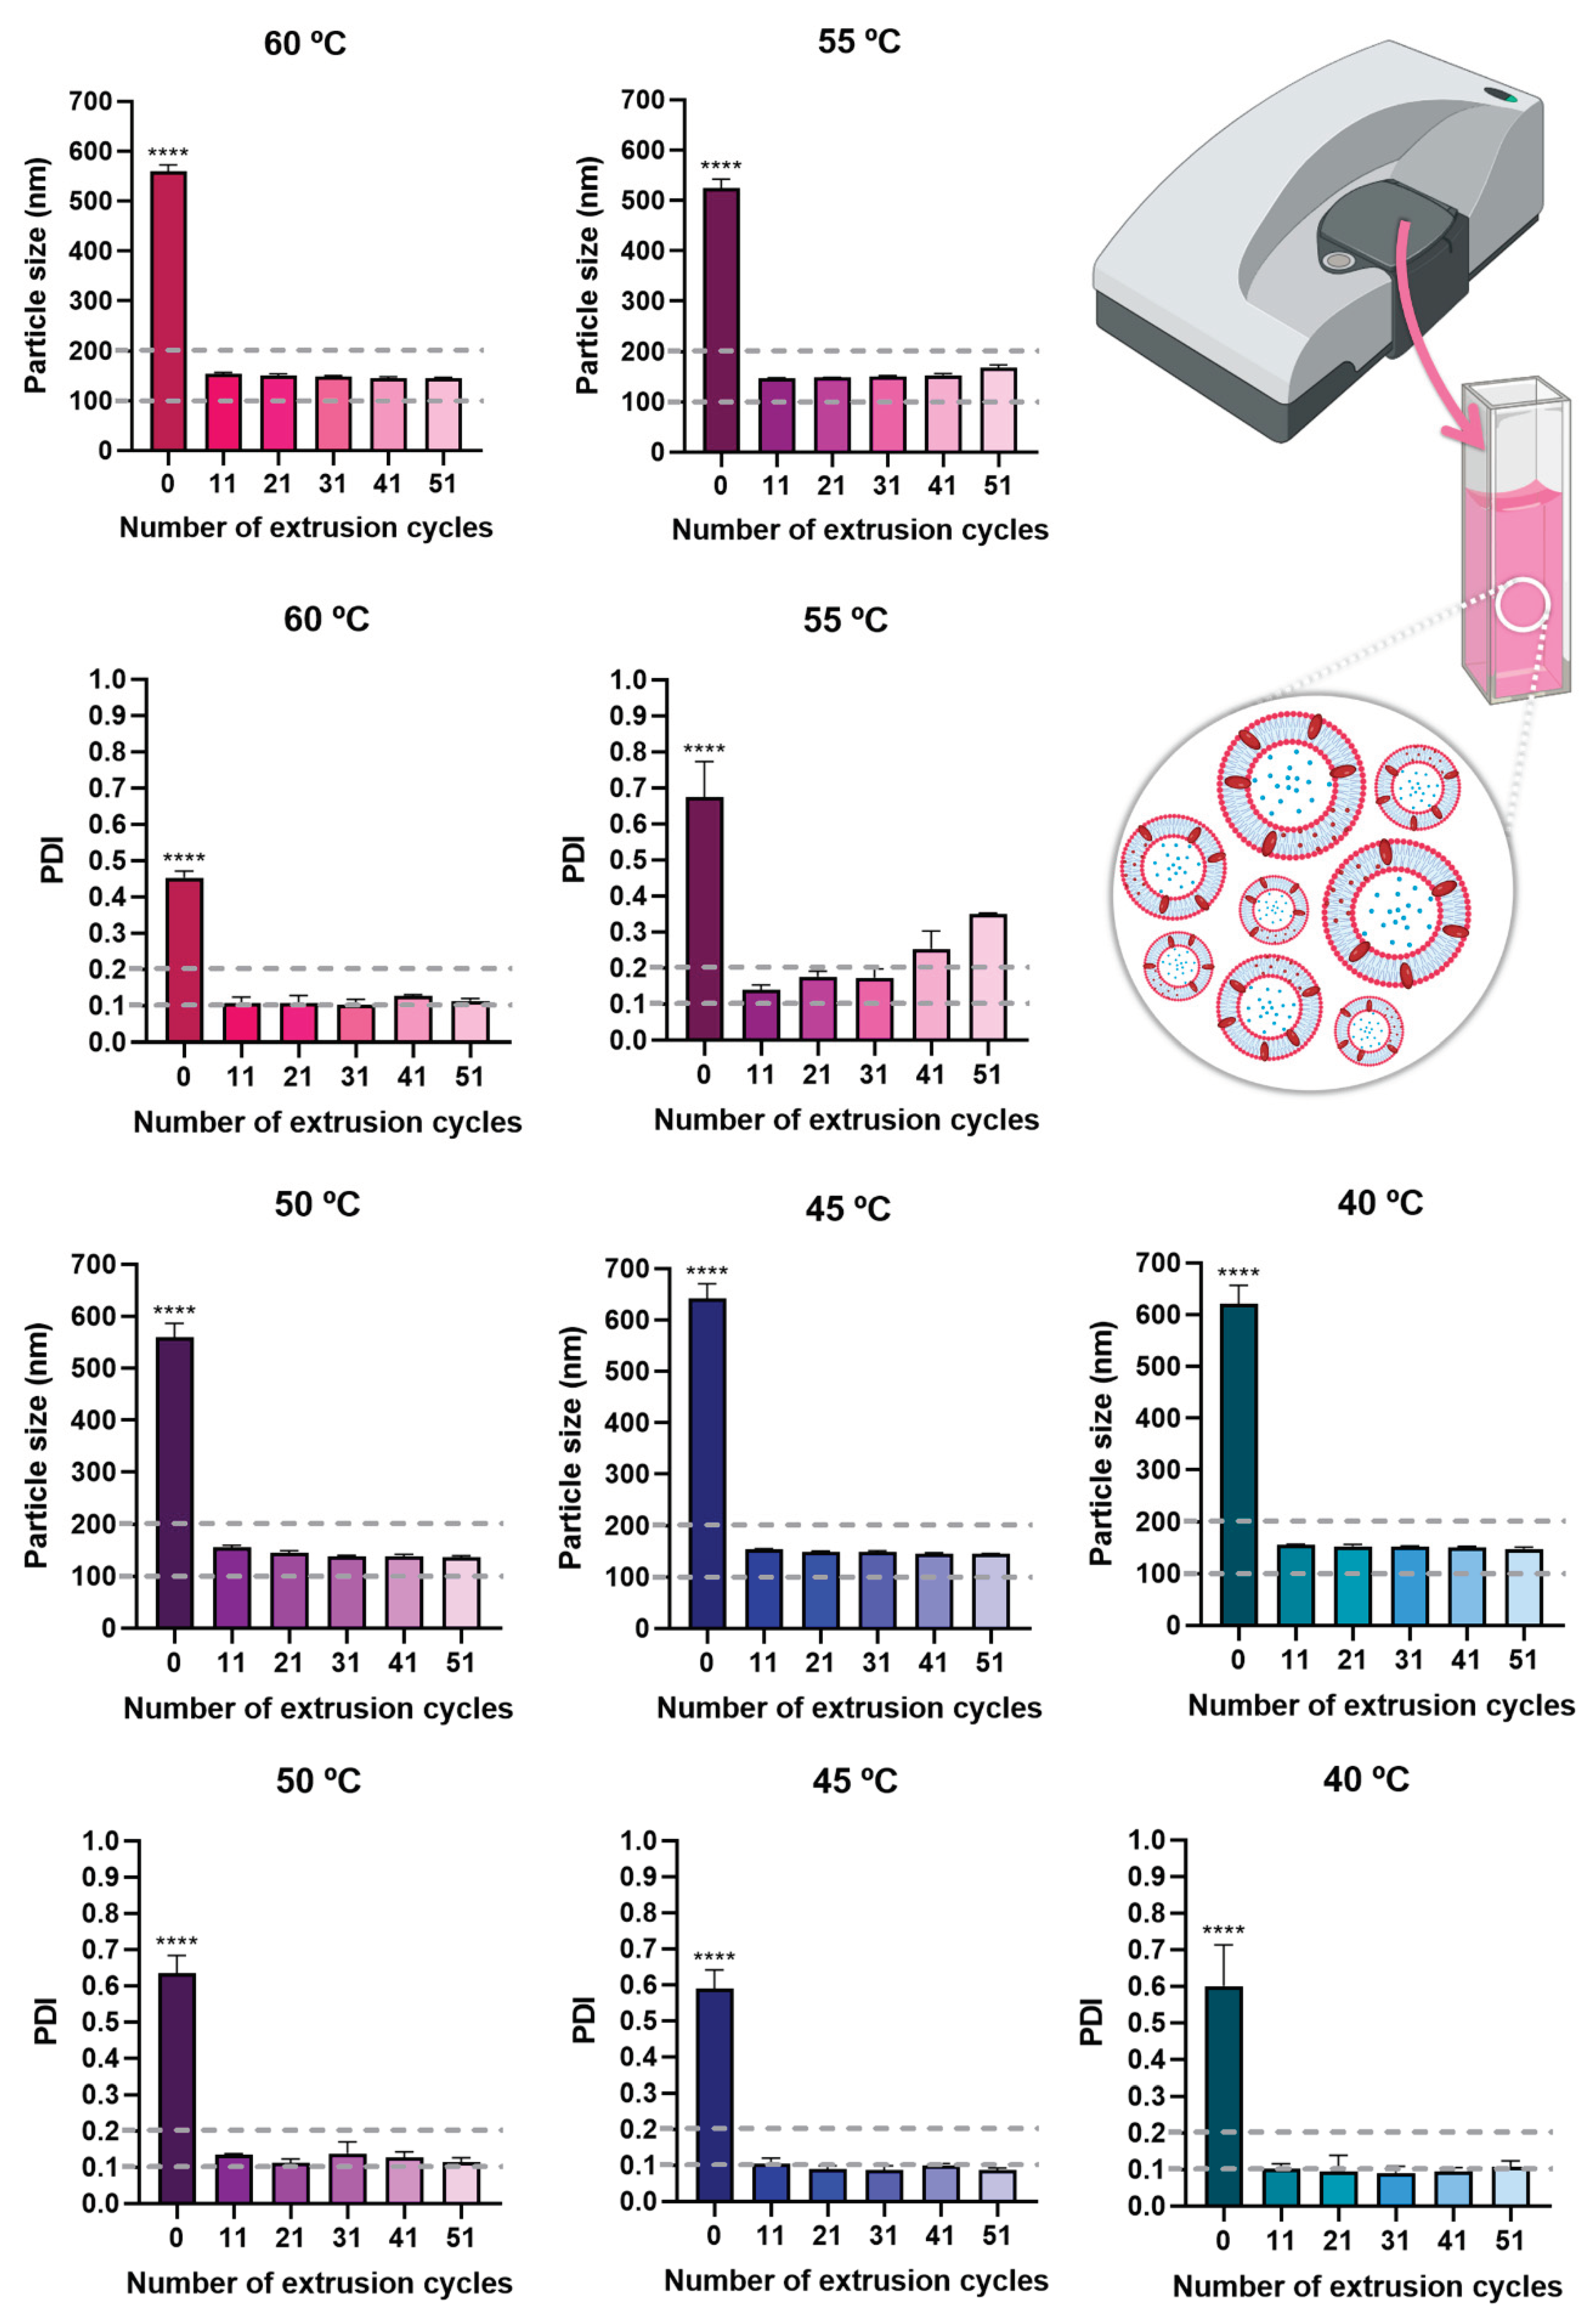
As the main composition of bee venom is proteins, these can denature at high temperatures, hence during production, an effort should be made to use the lowest temperatures possible [37]. For this reason, multiple hydration temperatures were tested, namely 40 °C, 45 °C, 50 °C, 55 °C, and 60 °C. The results showed that after extrusion, similar particle size and PDI values were obtained for all hydration temperatures (Figure 4), and hence the lowest temperature, 40 ºC, was selected. Additionally, although there was a statistically significant difference in particle size and PDI before extrusion and after extrusion (p < 0.0001, R2 0.9991, one-way ANOVA with Tukey's multiple comparisons test), all extrusion cycles originated a particle size below 200 nm, which is suitable for all kinds of administration routes, making the formulation highly versatile in what concerns potential application. PDI values were also always below 0.3, for all extrusion cycles and temperatures, and in most cases also below or equal to 0.2, making the formulations highly homogeneous [38,39,40]. Therefore, for the selected temperature, 40 °C, the number of extrusion cycles which originated the lowest particle size and PDI values was selected, being equal to 31 extrusion cycles. These niosomes were hence selected for compound encapsulation and had a particle size of 151.2 ± 1.8 nm and a PDI of 0.091 ± 0.018 (Table 3).
Once the niosomes were optimized (formulation vehicle, still no encapsulated compound), bee venom was added to the vesicles’ aqueous core, to be encapsulated at a concentration of 2 µg/mL. This concentration was selected based on previous studies, for it to be enough to have bioactivity, but not so much that would be potentially toxic. According to previous studies, when using concentrations of bee venom of 3.125 µg/mL or 5 µg/mL, a substantial decrease in healthy cells’ viability was observed, with values ranging from only around 50 to 60% [41]. Hence, a lower value was selected, to help guarantee formulation safety.
After the encapsulation of bee venom, the mean particle size was equal to 150.4 ± 3.7 nm, remaining the same as without compound encapsulation, and the PDI was equal to 0.162 ± 0.008, hence having a slight increase (as had been reported by previous studies [42]), but still being bellow 0.2, and therefore still constituting a quite homogeneous nanosystem (Table 3).

Table 3.
Particle size (nm) and PDI of empty and bee venom-loaded niosomes, after optimization (31 cycles of extrusion).
Table 3.
Particle size (nm) and PDI of empty and bee venom-loaded niosomes, after optimization (31 cycles of extrusion).
| Formulations | Bee venom concentration | Particle size (nm) | PDI |
|---|---|---|---|
| Empty niosomes (formulation vehicle) | 0 | 151.2 ± 1.8 | 0.091 ± 0.018 |
| Bee venom-loaded niosomes | 2 µg/mL | 150.4 ± 3.7 | 0.162 ± 0.008 |
PDI – polydispersity index.
Figure 4.
Particle size and PDI values of the developed niosomes (formulation vehicle), at all tested temperatures, and with a varying number of performed extrusion cycles; data is presented as mean ± standard deviation; **** p < 0.0001 and corresponds to the comparison of no extrusion with all extrusion cycles (R2 0.9991, one-way ANOVA with Tukey's multiple comparisons test).
3.2. In Vitro Cytotoxic Potential
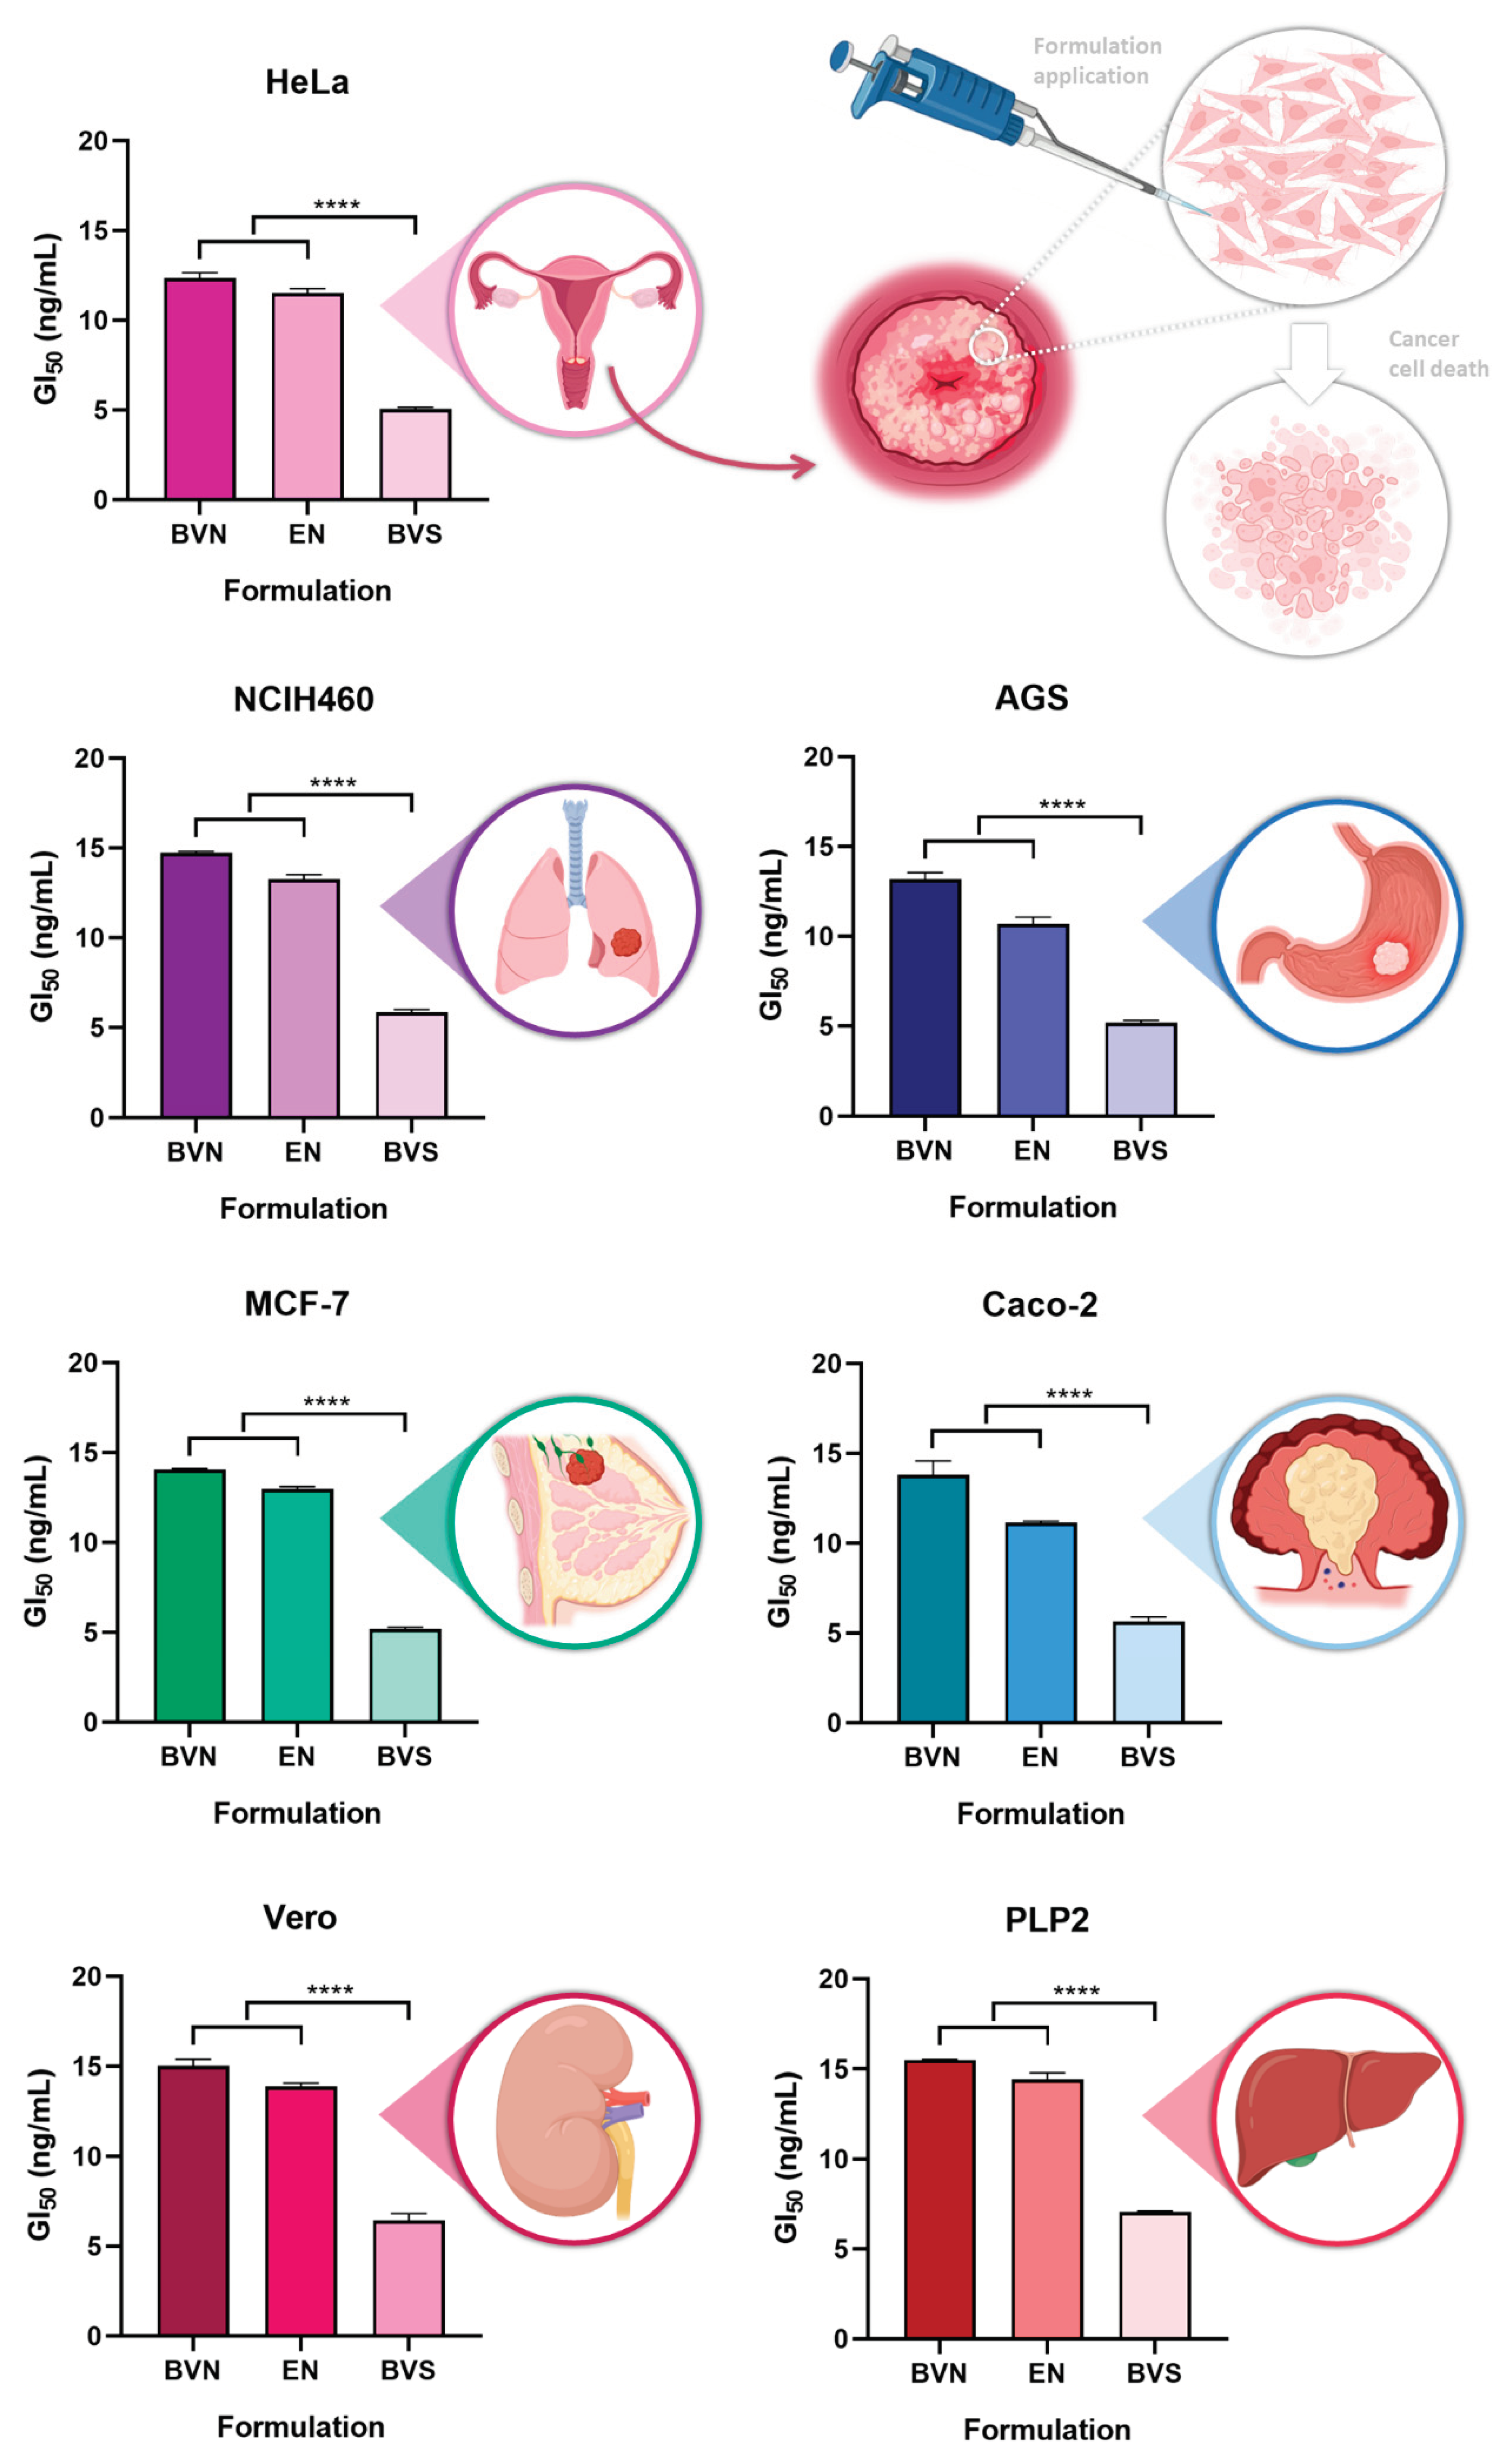
The in vitro cytotoxic potential of the developed bee venom-loaded niosomes was tested, at different concentrations, in different cell lines, with the cytotoxicity being evaluated using a sulforhodamine B colorimetric assay, in five human tumor cell lines, namely AGS (gastric adenocarcinoma), Caco-2 (colorectal adenocarcinoma), MCF-7 (breast adenocarcinoma), NCI-H460 (lung carcinoma) and HeLa (cervical carcinoma). Two non-tumor cell lines were also used, Vero (African green monkey kidney) and PLP2 (primary pig liver culture), to assess for potential systemic toxicity. Results are shown in Figure 5.
A substantial anticancer potential has been previously reported for bee venom, related to its capacity to inhibit cancer cell growth and induce apoptosis, and more specifically related to its major components melittin and phospholipase A2 [43,44]. Other studies have demonstrated that bee venom can trigger regional cellular immune reactions in lymph nodes, exerting its effects through not only apoptosis, but also lysis mechanisms and tumor cell necrosis [45,46]. Our results show that the bee venom solution had the most significant cytotoxic effect, both against the studied cancer cell lines, and the healthy cell lines, attributed to its lower GI50 values, ranging from 5.05 to 5.87 ng/mL (p < 0.0001, R2 0.9991, one-way ANOVA with Tukey's multiple comparisons test). Although this means that the bee venom solution has a higher anticancer potential while unencapsulated, it also means that it has a higher potential for toxicity in healthy tissues, hence being connected to a higher propensity for systemic side effects. Hence, compound encapsulation will reduce its potentially harmful effects in healthy cells, while still having substantial anticancer potential in tumor cell lines. Hence, when encapsulated into the niosomes, a higher targeting potential to cancer cells can be obtained, while being able to avoid destroying healthy cells.
Regarding the AGS cell line, the bee venom-loaded niosomes present a GI50 value of 13.19 ng/mL, still demonstrating a good cytotoxic potential after bee venom encapsulation. A previous study [47] has shown that melittin present in bee venom can stop AGS cell proliferation even at low concentrations. Concerning the Caco-2 cell line, the bee venom-loaded niosomes present a GI50 value of 13.82 ng/mL, thereby retaining the cytotoxic potential of bee venom after encapsulation. This anticancer activity against the Caco-2 cell line was also demonstrated in a previous study [48], where the developed nanoparticles were able to deliver the active compound to the correct target, the cancer cells. In what concerns the MCF-7 cell line, the bee venom-loaded niosomes presented a GI50 value of 14.05 ng/mL, thereby being substantially cytotoxic for this cell line as well. Bee venom has been proven to inhibit the growth of breast cancer cells even in small concentrations, as observed in previous studies [49]. For the NCIH460 cell line, the bee venom-loaded niosomes showed a GI50 value of 14.72 ng/mL, hence demonstrating good anticancer potential for this cell line too. Bee venom has also been proven to inhibit cell proliferation of NCIH460 cells in a concentration-dependent manner in prior studies [50]. Regarding the HeLa cell line, the bee venom-loaded niosomes presented a GI50 value of 12.37 ng/mL, still demonstrating a considerable cytotoxic potential even after compound encapsulation. Bee venom has also demonstrated anticancer properties in these cells previously, in a concentration-dependent manner [51].
As for previous similar studies, regarding nanosystem development for therapeutic purposes containing bee venom, a prior study where a nanoliposome was designed to encapsulate bee venom with similar concentrations was tested in some cancer cell lines, in which a cytotoxicity assay was also performed [52]. In comparison, for our study smaller concentrations of bee venom were necessary to inhibit the growth of cancer cells by 50%. Hence, overall, the obtained results showed that the developed bee venom-loaded niosomes could serve as a potential adjuvant treatment for several types of cancer, including cervical, breast, lung, stomach and colorectal carcinomas. Bee venom can be used as a therapeutic agent for cancer thanks to its complex chemical composition, and even when encapsulated into niosomes, bee venom has presented good cytotoxic properties against various cancer cells, in this case enhancing its anticancer potential by providing a controlled and sustained release of the compound, ideal for a prolonged therapeutic effect.
Figure 5.
Cytotoxic potential of the developed bee venom-loaded niosomes, compared to the empty niosomes (formulation vehicle) and bee venom solution, in several different cancer cell lines; GI50 corresponds to the formulation concentration required to inhibit cell growth by 50%; data is represented as mean ± standard deviation; **** p < 0.0001 (R2 0.9991, one-way ANOVA with Tukey's multiple comparisons test).
3.3. In Vitro Anti-Inflammatory Activity
In recent years the link between inflammation and cancer has been extensively studied, both in what concerns pathogenesis and therapeutics [53,54,55]. Inflammation has been proven to increase the chances of cancer development, promoting all stages of tumorigenesis, and not only regulating cancer development but also therapeutic responses, with chronic inflammation having an important role in both stimulating tumor progression and leading to treatment resistance [56,57,58]. Cancer cells and inflammatory cells have been proven to interact to form an inflammatory tumor microenvironment, with inflammatory factors and metabolites such as several cytokines (tumor necrosis factor (TNF)), interleukins (IL), interferons (IFN)), chemokines, growth factors, inflammasomes, leukotrienes, prostaglandins, and thromboxane have been identified as having important roles in the initiation and regulation of cancer-related inflammatory processes [56,57,59]. Additionally, inflammation has been linked to DNA damage in cancer stem-like cells, leading not only to the development of cancer, but to more aggressive forms of the disease, and also being connected to increased oxidative stress, with the generation of reactive oxygen and nitrogen species which will also damage and lead to dysfunctional lipids and proteins [60,61,62]. For these reasons, compounds with anti-inflammatory action have been studied as alternative or adjuvant treatments for all types of cancers [63,64,65].
Hence, to assess the anti-inflammatory properties of the developed bee venom-loaded niosomes, for potential synergistic effects with the non-inflammatory related anticancer potential of the formulation, the pro-inflammatory response was evaluated in the mouse macrophage cell line RAW 264.7 (Figure 6). The developed bee venom-loaded formulation was compared with the free compound (bee venom solution), and the formulation vehicle. The IC50 (concentration of the formulation required to inhibit 50% of nitric oxide production) was determined and calculated, as a demonstration of its anti-inflammatory activity.
The bee venom solution demonstrated an IC50 of 4.77 ng/mL, the lowest out of the compared formulations (p < 0.0001, R2 0.9991, one-way ANOVA with Tukey's multiple comparisons test), which is indicative of an extensive anti-inflammatory potential, and in line with previous results from the research team [26]. Additionally, this potential has been further confirmed by other past publications, where similar bee venom concentrations depicted similar anti-inflammatory properties, with its main constituent, melittin, being responsible for the majority of such effects [66,67,68]. In what concerns specific action mechanisms, in previous studies, bee venom proved to have significant anti-inflammatory effects not only by inhibiting phospholipase A, but also by decreasing pro-inflammatory cytokines IL-1β, IL-6, and IFN-γ, and chemokines CCL22 and CCL17 levels, in in vitro assays [69,70,71]. Moreover, in an in vivo model of atopic dermatitis, bee venom proved to significantly reduce IL-1β, IL-4, IL-6, IL-13, immunoglobulin E (IgE) and TNF-α levels, also leading to a reduction in the number of inflammatory cells (neutrophils, eosinophils, monocytes), and cyclooxygenase-2 (COX-2) inhibition [71,72,73]. Also in vivo, in an arthritis animal model, bee venom has proven to have anti-inflammatory effects by inhibiting IL-1β, IL-6, TNF-α and TGF-β1 levels, also having complementary antioxidant effects, with a reduction in total antioxidant status, and leading to a reduction in DNA damage [7,74]. Further supporting these in vitro and in vivo results, several clinical trials with bee venom administration to inflammatory-based diseases’ patients, such as rheumatoid arthritis, adhesive capsulitis, and pelvic inflammatory disease, have demonstrated promising outcomes, with substantial improvement of clinical symptoms and disease markers, after topical or intravenous administration [75,76,77,78]. Although specific molecular mechanisms are still in need of deeper exploration, these results have been suggested to be connected to COX-2 and prostaglandin E2 inhibition, among other mechanisms [75,79].
Furthermore, as expected, the formulation vehicle (empty niosomes) showed no substantial anti-inflammatory potential, with an IC50 value of > 50 ng/mL, the highest out of the studied formulations (p < 0.0001, R2 0.9991, one-way ANOVA with Tukey's multiple comparisons test), confirming that none of the components used in niosome composition depicts intrinsic anti-inflammatory effects. As for the bee venom-loaded niosomes, the formulation presented an IC50 of 28.98 ng/mL, which albeit higher than that obtained for the bee venom solution (p < 0.0001, R2 0.9991, one-way ANOVA with Tukey's multiple comparisons test), can still be considered a relevant anti-inflammatory effect, meaning that when encapsulated into the nanometric structures the bee venom does not lose its anti-inflammatory potential. Additionally, the higher IC50 value of the bee venom-loaded niosomes when compared to the free compound is likely related to the controlled release of the molecule from within the nanosystems, potentially leading to a sustained and prolonged therapeutic effect, which has been shown to produce enhanced bioavailability in previous studies, using similar delivery systems and compounds [80,81,82].
3.4. In Vitro Safety Assessment – Cytotoxicity Evaluation on HaCaT and HFF-1 Cell Lines
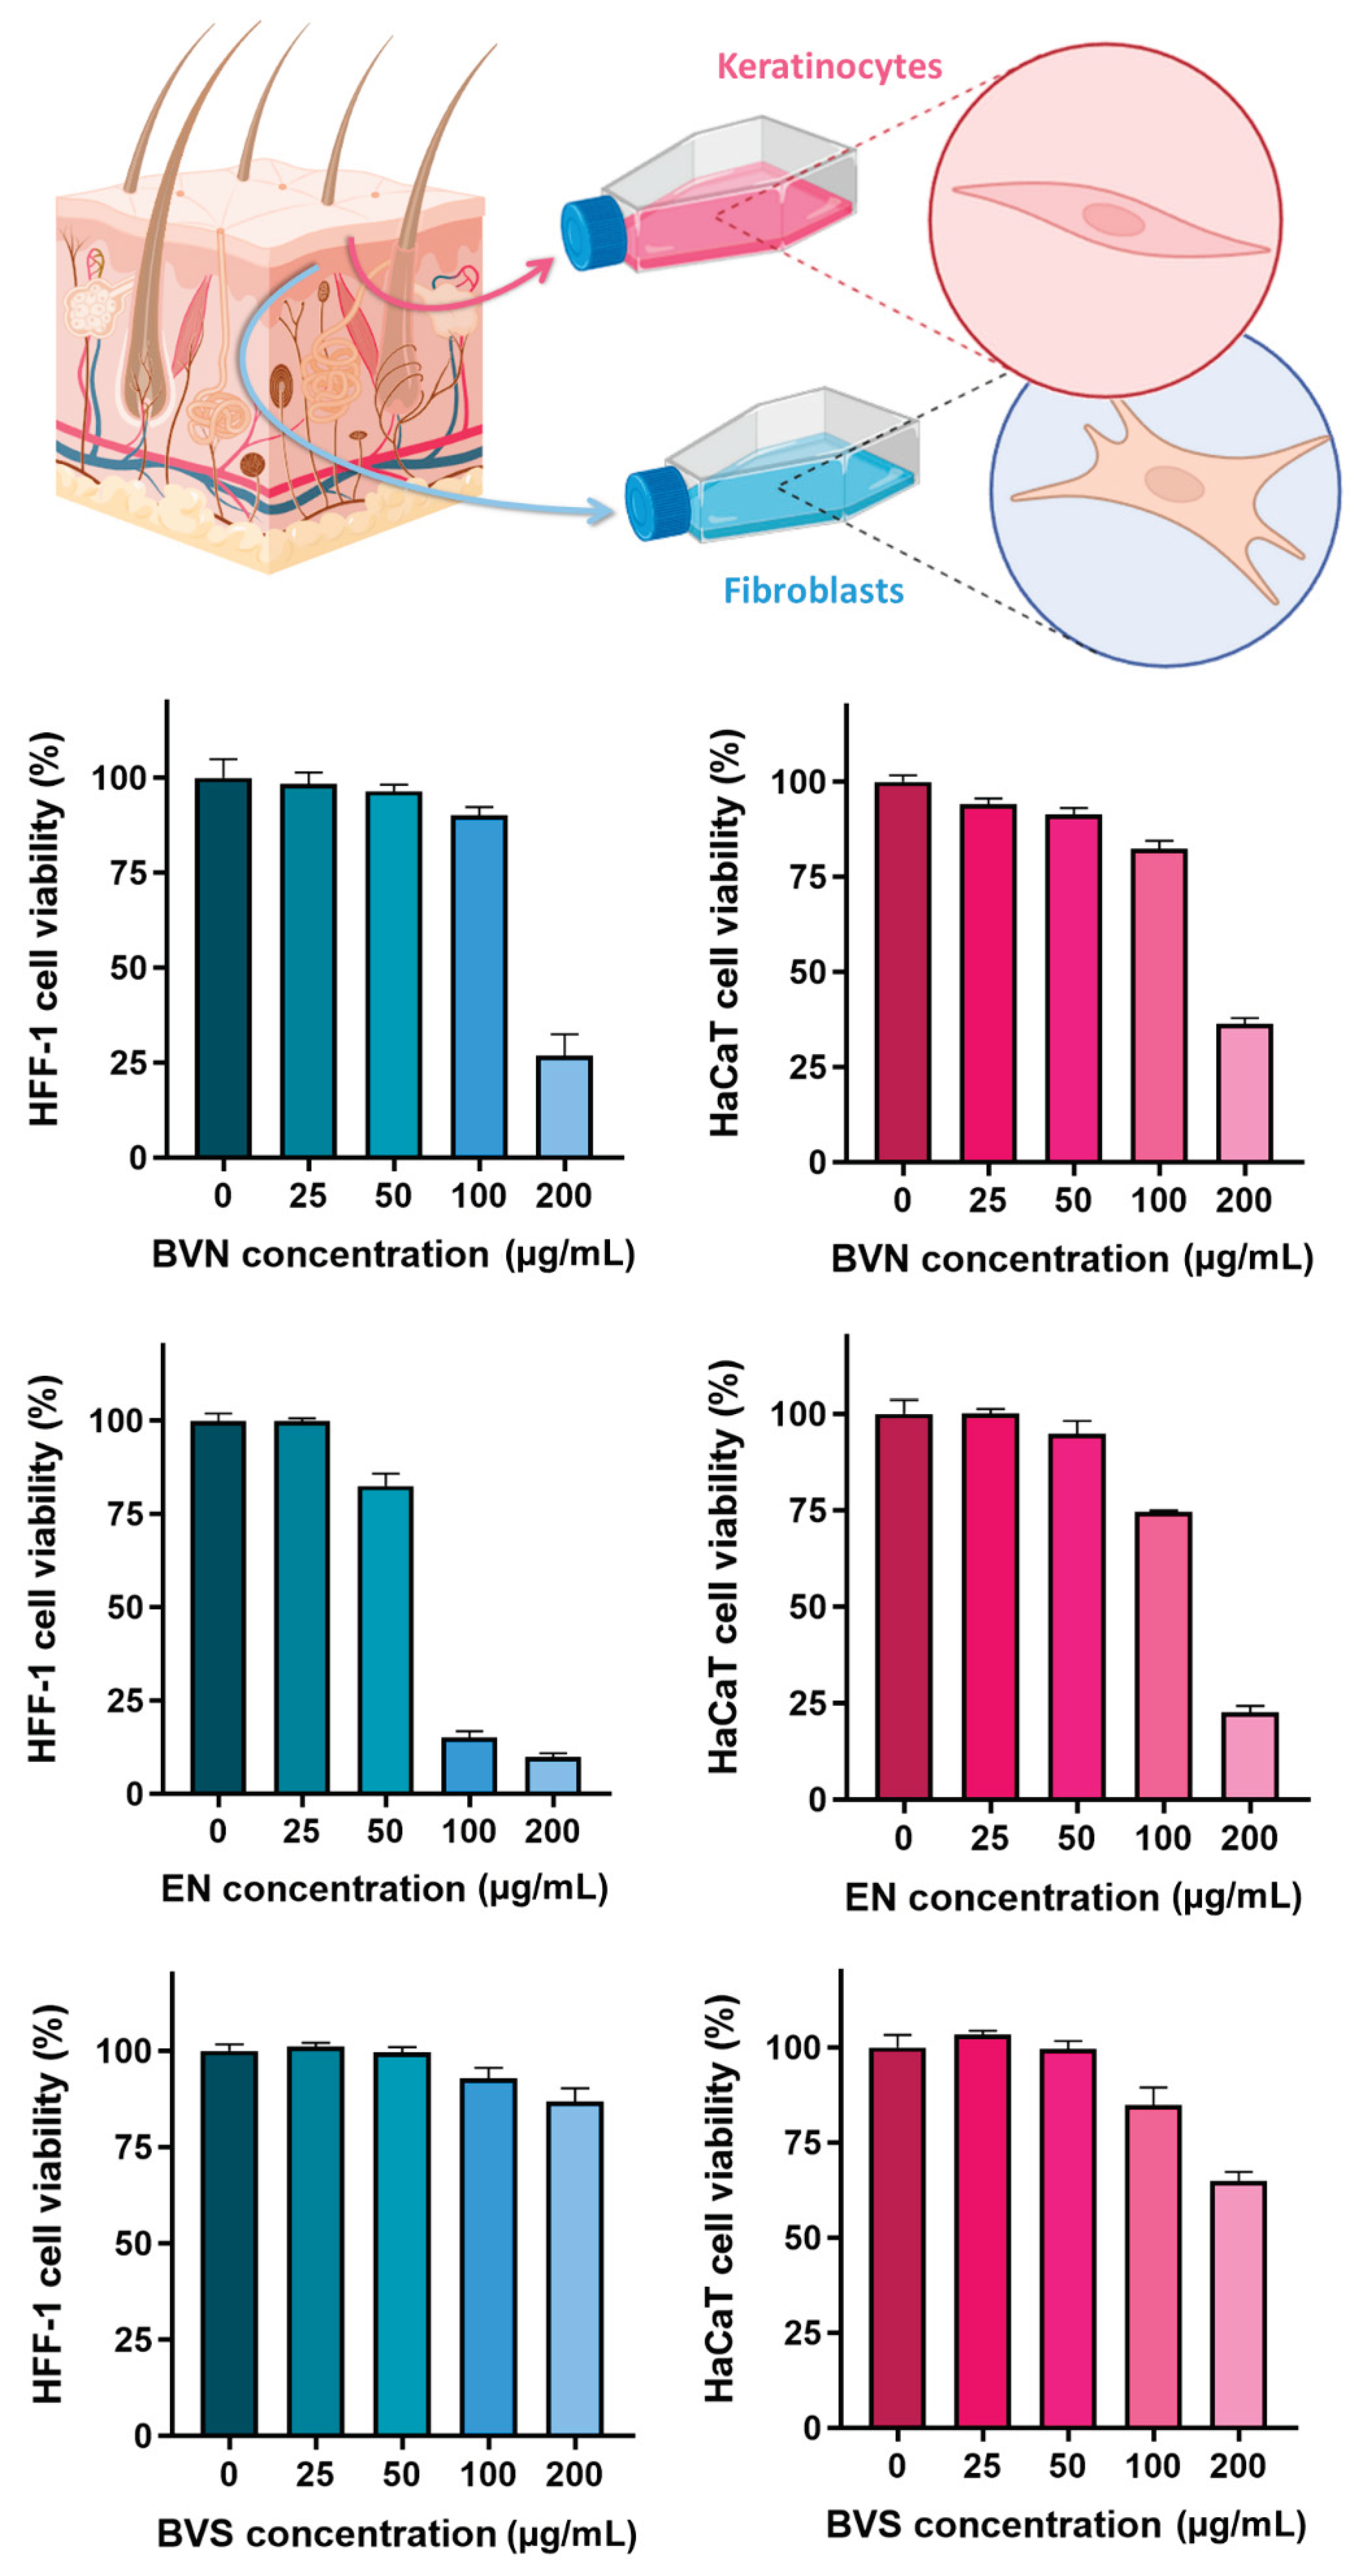
Assays evaluating formulation safety in skin cellular models have long been applied to predict potential toxicity issues, being especially relevant for intended transdermal or topical administration [83,84,85]. Hence, to evaluate the safety of the developed bee venom-loaded niosomes and compare them to the vehicle formulation (empty niosomes), and free compound (bee venom solution), a sulforhodamine B colorimetric assay was conducted, in two human skin cell lines, HaCaT (keratinocytes) and HFF-1 (fibroblasts). The results, depicted in Figure 7, showed significant differences between concentrations within the same formulation (statistical significance matrix on Table 4), and also when comparing the same concentration for different formulations (Table 5).
Overall, results show that there is a concentration-dependent safety of the developed formulations (p < 0.0001, two-way ANOVA with Tukey’s multiple comparisons’ test), with the safest concentration in both HaCaT and HFF-1 cell lines appearing to reside between 50 and 100 µg/mL. Specifically for the bee venom solution, safety appears to be related to concentrations up to 200 µg/mL in the HFF-1 cell line, but only up to 100 µg/mL in the HaCaT cell line. These results are in accordance with the ones obtained by previous studies for the HaCaT cell line [86], where cell viability tended to reduce with increasing bee venom concentrations, and with safety existing up to 100 µg/mL, and appear to be more promising than the ones reported by previous studies for the HFF-1 cell line [87], where only concentrations equal or lower than 10 µg/mL were considered safe. Additionally, IC50 values (formulation concentrations causing 50% reduction of cell viability or proliferation, Table 6) were proven to be 165.7 ± 1.0 µg/mL and 161.0 ± 1.0 µg/mL for the bee venom-loaded niosomes, 138.2 ± 1.0 µg/mL and 69.8 ± 1.0 µg/mL for the formulation vehicle, and > 200.0 µg/mL for the bee venom solution, in HaCaT and HFF-1 cells, respectively.
Furthermore, the results showed that the developed niosomes without bee venom (formulation vehicle) appear to be less safe than the bee venom-loaded niosomes, in both cell lines (p < 0.0001, two-way ANOVA with Tukey’s multiple comparisons’ test). This seemingly unexpected cytotoxicity of the empty niosomes might be related to the quantities of the excipients used to formulate them. A previous study, on polysorbate 20 (Tween 20) formulations applied on HaCaT cells, showed that at elevated concentrations cytotoxicity could be detected, also after long periods of exposure [88]. Additionally, the lesser cytotoxicity of bee venom-loaded niosomes could be due to the absorption of the hydrophilic compound to the surface of the vesicles, thereby decreasing their toxicity due to decreasing the direct contact of the formulation compounds with the cells.
Hence, overall the obtained results showed that the developed niosomes can only be administered on the skin up to certain concentrations, but since in vitro results have been reported to not always be directly related to what happens in vivo [89,90], and, even more, in a clinical context [91,92], further studies would have to be performed to assess the true safety of the developed nanocarriers. Therefore, safety was further assessed in the HET-CAM test (results shown in the following section 3.5). It is also relevant to mention that given the known severe side-effects related to the grand majority of anti-cancer therapies [93,94,95], a risk-benefit ratio would always have to be assessed if the developed formulations are proven to be of great therapeutic potential as primary or adjuvant anticancer therapies.
Figure 7.
Cell viability percentage (%) variation with increasing applied formulation concentrations (µg/mL), on HFF-1 cell line (left bar graphs, in blue), and HaCaT cell line (right bar graphs, in pink), including the developed bee venom loaded niosomes (BVN), formulation vehicle (empty niosomes, EN), and compound solution (bee venom solution, BVS); data is represented as mean ± standard deviation.
3.5. Ex Vivo Safety Assessment – HET-CAM Test
The HET-CAM test has been used for many years as a useful model to predict the potential of developed formulations to cause eye irritation, hence making the preparations that are proven to be safe after application onto the hen's eggs-chorioallantoic membranes, also potentially safe for administration through most administration routes, given that the eye is one of the most sensitive organs in the human body [30,96,97]. Hence, to evaluate the irritation degree of the developed bee venom-loaded niosomes, a HET-CAM test was conducted, with the application of 0.3 mL of each formulation (non-diluted) onto each fertilized egg’s chorioallantoic membrane. Then, during the first 5 minutes after application, the membrane was observed for vascular reactions in the blood vessels, according to the described method’s protocol [98]. Results are shown in Table 7 and Figure 8.
Results showed that, as expected, no irritability was observed when 0.9% NaCl (negative control) was applied, and strong irritability was observed when 0.1 N NaOH (positive control) was applied. Furthermore, and in accordance with the results obtained from the in vitro cytotoxicity assays (section 3.2), the empty niosomes showed a strongly irritative degree, with an IS value of 14, and caused hemorrhage 5 minutes after formulation application [Figure 8b)]. Again, just like in the in vitro assays, the unexpectedly high irritation degree of the empty niosomes could be related to its constituents, as some data has been found regarding the irritability of Tween 20 and cholesterol [99,100]. Additionally, in a previous study [101], where two different Tween 20 concentrations were tested (30% and 1%), results showed that higher concentrations of this non-ionic surfactant caused a higher irritation score than lower concentrations. Nevertheless, the bee venom-loaded niosomes had a much smaller irritative potential, with an IS value of 7.7, being half of the obtained for the empty niosomes, which indicates only a slight irritative degree, with no associated lysis or hemorrhage. Previous studies [102] have reported that bee venom, and more specifically melittin, can cause irritation in a dose-dependent manner. Hence, it seems that the bee venom concentrations used in the developed nanocarrier’s composition appear to be safe. Moreover, and once again, the much lower IS obtained with the bee venom-loaded niosomes, when compared to the empty niosomes, could be due to the adsorption of some of the compound onto the vesicles’ outer membrane, making the direct contact between the chorioallantoic membrane and the niosomes more reduced, and hence lowering the potential for irritation.
Therefore, since the bee venom-loaded niosomes showed hen’s eggs-chorioallantoic membranes with normal blood vessels, with no lysis or other vascular reactions, and an overall low IS, the developed nanocarrier appears to have a reasonable safety profile. Nevertheless, again, additional tests are needed to confirm these results, to find the safest and, yet, most therapeutically effective concentrations of the developed formulation, with the assessment of a risk-benefit ratio being necessary to confirm the true value of the developed nanocarriers as primary or adjuvant anticancer therapies.
4. Conclusion
An innovative nanotechnological anticancer platform was successfully developed. The developed bee venom-loaded niosomes revealed small nanometric and homogeneous particle size, therapeutic efficacy in several in vitro cancer models, including breast, cervical, lung, gastric, and colorectal cell lines, and complementary anti-inflammatory potential, which has been proven to indirectly contribute to further synergistic anticancer effects. The developed formulations showed to improve bee venom administration safety, in in vitro and ex vivo models. Although further studies will clarify the true potential of the developed bee venom-loaded niosomes, these findings are promising regarding both formulation safety and bioactivity, making them potentially promising alternatives for primary or adjuvant cancer treatment.
Author Contributions
Conceptualization, F.V., A.C.P.-S. and P.M.; methodology, P.C.P., A.C.P.-S., R.C.C., A.R.S., M.J.S. and S.I.F.; validation, P.C.P., F.V., A.C.P.-S., M.V.-B. and S.I.F.; formal analysis, M.B.P., P.C.P., F.V., A.C.P.-S., R.C.C., A.R.S. and M.J.S.; investigation, M.B.P., P.C.P. and P.M.; resources, F.V., A.C.P.-S., P.M. and S.I.F.; data curation, M.B.P, P.C.P., R.C.C., A.R.S., M.J.S. and S.I.F.; writing—original draft preparation, M.B.P., P.C.P. and A.C.P.-S.; writing—review and editing, P.C.P., F.V., A.C.P.-S., P.M., M.V.-B. and S.I.F.; supervision, P.C.P., F.V., A.C.P.-S. and S.I.F.; project administration, F.V., A.C.P.-S. and P.M.; funding acquisition, F.V. and A.C.P.-S.. All authors have read and agreed to the published version of the manuscript.
Funding
The present study was supported by the Research and Development Project grant 2022.05270.PTDC, national funds FCT/MCTES (PIDDAC), CIMO funds (UIDB/00690/2020 and UIDP/00690/2020) and SusTEC funds (LA/P/0007/2021), supported by Fundação para a Ciência e a Tecnologia I.P. (FCT, Portugal). The authors are also grateful to Fundação para a Ciência e a Tecnologia I.P. (FCT, Portugal) for contracts’ financial support through the institutional scientific employment program-contract for Soraia I. Falcão and Ricardo C. Calhelha.
Acknowledgements
The authors thank Iouraouine El Mehdi for the bee venom sample collection.
Informed Consent Statement
Not applicable.
Data Availability Statement
Not applicable.
Conflicts of Interest
The authors declare no conflict of interest.
Abbreviations
COX-2 - cyclooxygenase-2; DMEM - Dulbecco’s modified Eagle’s medium; DMSO - dimethyl sulfoxide; IC50 - formulation concentration that causes a 50% inhibition of nitric oxide production/cell growth; IS – internal standard; GI50 - sample concentration with the ability to inhibit cell growth by 50%; HET-CAM - hen's egg-chorioallantoic membrane; ICCVAM - Interagency Coordinating Committee on the Validation of Alternative Methods; IFN – interferons; IgE - immunoglobulin E; IL – interleukins; IS - irritation score; LPS – liposaccharide; PDI - polydispersity index; TNF - tumor necrosis factor; Tris - Tris(hydroxymethyl)aminomethane; UHPLC - ultra-high-performance liquid chromatography.
References
- Siegel, R.L.; Miller, K.D.; Wagle, N.S.; Jemal, A. Cancer Statistics, 2023. CA Cancer J Clin 2023, 73, 17–48. [Google Scholar] [CrossRef]
- Malvezzi, M.; Santucci, C.; Boffetta, P.; Collatuzzo, G.; Levi, F.; La Vecchia, C.; Negri, E. European Cancer Mortality Predictions for the Year 2023 with Focus on Lung Cancer. Annals of Oncology 2023, 34, 410–419. [Google Scholar] [CrossRef]
- Brown, J.S.; Amend, S.R.; Austin, R.H.; Gatenby, R.A.; Hammarlund, E.U.; Pienta, K.J. Updating the Definition of Cancer. Molecular Cancer Research 2023, 21, 1142–1147. [Google Scholar] [CrossRef] [PubMed]
- Devlin, E.J.; Denson, L.A.; Whitford, H.S. Cancer Treatment Side Effects: A Meta-Analysis of the Relationship Between Response Expectancies and Experience. J Pain Symptom Manage 2017, 54, 245–258. [Google Scholar] [CrossRef] [PubMed]
- Mazzotti, E.; Antonini Cappellini, G.C.; Buconovo, S.; Morese, R.; Scoppola, A.; Sebastiani, C.; Marchetti, P. Treatment-Related Side Effects and Quality of Life in Cancer Patients. Supportive Care in Cancer 2012, 20, 2553–2557. [Google Scholar] [CrossRef]
- Nurgali, K.; Jagoe, R.T.; Abalo, R. Adverse Effects of Cancer Chemotherapy: Anything New to Improve Tolerance and Reduce Sequelae? Front Pharmacol 2018, 9. [Google Scholar] [CrossRef]
- Wehbe, R.; Frangieh, J.; Rima, M.; El Obeid, D.; Sabatier, J.-M.; Fajloun, Z. Bee Venom: Overview of Main Compounds and Bioactivities for Therapeutic Interests. Molecules 2019, 24, 2997. [Google Scholar] [CrossRef] [PubMed]
- Pascoal, A.; Estevinho, M.M.; Choupina, A.B.; Sousa-Pimenta, M.; Estevinho, L.M. An Overview of the Bioactive Compounds, Therapeutic Properties and Toxic Effects of Apitoxin. Food Chem. Toxicol. 2019, 134. [Google Scholar] [CrossRef]
- Carpena, M.; Nuñez-Estevez, B.; Soria-Lopez, A.; Simal-Gandara, J. Bee Venom: An Updating Review of Its Bioactive Molecules and Its Health Applications. Nutrients 2020, 12, 1–27. [Google Scholar] [CrossRef]
- Ahmed-Farid, O.A.; Taha, M.; Bakeer, R.M.; Radwan, O.K.; Hendawy, H.A.M.; Samaan, A.; Yousef, E. Effects of Bee Venom and Dopamine-Loaded Nanoparticles on Reserpine-Induced Parkinson’s Disease Rat Model. Sci Rep 2021, 11. [Google Scholar] [CrossRef]
- El-Didamony, S.E.; Kalaba, M.H.; El-Fakharany, E.M.; Sultan, M.H.; Sharaf, M.H. Antifungal and Antibiofilm Activities of Bee Venom Loaded on Chitosan Nanoparticles: A Novel Approach for Combating Fungal Human Pathogens. World J Microbiol Biotechnol 2022, 38. [Google Scholar] [CrossRef]
- El-Wahed, A.A.A.; Khalifa, S.A.M.; Elashal, M.H.; Musharraf, S.G.; Saeed, A.; Khatib, A.; Tahir, H.E.; Zou, X.; Naggar, Y. Al; Mehmood, A.; et al. Cosmetic Applications of Bee Venom. Toxins (Basel) 2021, 13. [Google Scholar] [CrossRef] [PubMed]
- Afzal, O.; Altamimi, A.S.A.; Nadeem, M.S.; Alzarea, S.I.; Almalki, W.H.; Tariq, A.; Mubeen, B.; Murtaza, B.N.; Iftikhar, S.; Riaz, N.; et al. Nanoparticles in Drug Delivery: From History to Therapeutic Applications. Nanomaterials 2022, 12, 4494. [Google Scholar] [CrossRef] [PubMed]
- Abdel-Mageed, H.M.; AbuelEzz, N.Z.; Radwan, R.A.; Mohamed, S.A. Nanoparticles in Nanomedicine: A Comprehensive Updated Review on Current Status, Challenges and Emerging Opportunities. J Microencapsul 2021, 38, 414–436. [Google Scholar] [CrossRef] [PubMed]
- Yusuf, A.; Almotairy, A.R.Z.; Henidi, H.; Alshehri, O.Y.; Aldughaim, M.S. Nanoparticles as Drug Delivery Systems: A Review of the Implication of Nanoparticles’ Physicochemical Properties on Responses in Biological Systems. Polymers (Basel) 2023, 15, 1596. [Google Scholar] [CrossRef] [PubMed]
- Raghu, P.K.; Bansal, K.K.; Thakor, P.; Bhavana, V.; Madan, J.; Rosenholm, J.M.; Mehra, N.K. Evolution of Nanotechnology in Delivering Drugs to Eyes, Skin and Wounds via Topical Route. Pharmaceuticals 2020, 13, 1–30. [Google Scholar] [CrossRef]
- Pires, P.C.; Paiva-Santos, A.C.; Veiga, F. Liposome-Derived Nanosystems for the Treatment of Behavioral and Neurodegenerative Diseases: The Promise of Niosomes, Transfersomes, and Ethosomes for Increased Brain Drug Bioavailability. Pharmaceuticals 2023, 16, 1424. [Google Scholar] [CrossRef] [PubMed]
- Abd El-Alim, S.H.; Kassem, A.A.; Basha, M.; Salama, A. Comparative Study of Liposomes, Ethosomes and Transfersomes as Carriers for Enhancing the Transdermal Delivery of Diflunisal: In Vitro and in Vivo Evaluation. Int J Pharm 2019, 563, 293–303. [Google Scholar] [CrossRef]
- Moghtaderi, M.; Sedaghatnia, K.; Bourbour, M.; Fatemizadeh, M.; Salehi Moghaddam, Z.; Hejabi, F.; Heidari, F.; Quazi, S.; Farasati Far, B. Niosomes: A Novel Targeted Drug Delivery System for Cancer. Medical Oncology 2022, 39, 240. [Google Scholar] [CrossRef]
- Chen, S.; Hanning, S.; Falconer, J.; Locke, M.; Wen, J. Recent Advances in Non-Ionic Surfactant Vesicles (Niosomes): Fabrication, Characterization, Pharmaceutical and Cosmetic Applications. Eur. J. Pharm. Biopharm. 2019, 144, 18–39. [Google Scholar] [CrossRef]
- Sharma, S.; Garg, A.; Agrawal, R.; Chopra, H.; Pathak, D. A Comprehensive Review on Niosomes as a Tool for Advanced Drug Delivery. Pharm. Nanotechnol. 2023, 11. [Google Scholar] [CrossRef] [PubMed]
- Yasamineh, S.; Yasamineh, P.; Ghafouri Kalajahi, H.; Gholizadeh, O.; Yekanipour, Z.; Afkhami, H.; Eslami, M.; Hossein Kheirkhah, A.; Taghizadeh, M.; Yazdani, Y.; et al. A State-of-the-Art Review on the Recent Advances of Niosomes as a Targeted Drug Delivery System. Int. J. Pharm. 2022, 624, 121878. [Google Scholar] [CrossRef] [PubMed]
- Kuotsu, K.; Karim, K.; Mandal, A.; Biswas, N.; Guha, A.; Chatterjee, S.; Behera, M. Niosome: A Future of Targeted Drug Delivery Systems. J. Adv. Pharm. Technol. Res. 2010, 1, 374. [Google Scholar] [CrossRef]
- Azeem, A.; Anwer, Md.K.; Talegaonkar, S. Niosomes in Sustained and Targeted Drug Delivery: Some Recent Advances. J. Drug Target 2009, 17, 671–689. [Google Scholar] [CrossRef] [PubMed]
- Mawazi, S.M.; Ann, T.J.; Widodo, R.T. Application of Niosomes in Cosmetics: A Systematic Review. Cosmetics 2022, 9. [Google Scholar] [CrossRef]
- Mehdi, I. El; Falcão, S.I.; Harandou, M.; Boujraf, S.; Calhelha, R.C.; Ferreira, I.C.F.R.; Anjos, O.; Campos, M.G.; Vilas-Boas, M. Chemical, Cytotoxic, and Anti-Inflammatory Assessment of Honey Bee Venom from Apis Mellifera Intermissa. Antibiotics 2021, 10. [Google Scholar] [CrossRef] [PubMed]
- Sobral, F.; Sampaio, A.; Falcão, S.; Queiroz, M.J.R.P.; Calhelha, R.C.; Vilas-Boas, M.; Ferreira, I.C.F.R. Chemical Characterization, Antioxidant, Anti-Inflammatory and Cytotoxic Properties of Bee Venom Collected in Northeast Portugal. Food Chem. Toxicol. 2016, 94, 172–177. [Google Scholar] [CrossRef]
- Abdelkader, H.; Alani, A.W.G.; Alany, R.G. Recent Advances in Non-Ionic Surfactant Vesicles (Niosomes): Self-Assembly, Fabrication, Characterization, Drug Delivery Applications and Limitations. Drug Deliv. 2014, 21, 87–100. [Google Scholar] [CrossRef]
- Vichai, V.; Kirtikara, K. Sulforhodamine B Colorimetric Assay for Cytotoxicity Screening. Nat. Protoc. 2006, 1, 1112–1116. [Google Scholar] [CrossRef]
- Steiling, W.; Bracher, M.; Courtellemont, P.; de Silva, O. The HET–CAM, a Useful In Vitro Assay for Assessing the Eye Irritation Properties of Cosmetic Formulations and Ingredients. Toxicol. Vitr. 1999, 13, 375–384. [Google Scholar] [CrossRef] [PubMed]
- ICCVAM-Recommended Test Method Protocol: Hen’s Egg Test-Chorioallantoic Membrane (HET-CAM) Test Method; 2010;
- Palmeira-de-Oliveira, R.; Monteiro Machado, R.; Martinez-de-Oliveira, J.; Palmeira-de-Oliveira, A. Testing Vaginal Irritation with the Hen’s Egg Test-Chorioallantoic Membrane Assay. ALTEX 2018, 35, 495–503. [Google Scholar] [CrossRef] [PubMed]
- Kim, W. Bee Venom and Its Sub-Components: Characterization, Pharmacology, and Therapeutics. Toxins (Basel) 2021, 13. [Google Scholar] [CrossRef] [PubMed]
- Manconi, M.; Vila, A.; Sinico, C.; Figueruelo, J.; Molina, F.; Fadd, A. Theoretical and Experimental Evaluation of Decypolyglucoside Vesicles as Potential Drug Delivery Systems; Vol. 16;
- Abd-Elbary, A.; El-laithy, H.M.; Tadros, M.I. Sucrose Stearate-Based Proniosome-Derived Niosomes for the Nebulisable Delivery of Cromolyn Sodium. Int J Pharm 2008, 357, 189–198. [Google Scholar] [CrossRef] [PubMed]
- Vankayala, J.S.; Battula, S.N.; Kandasamy, R.; Mariya, G.A.; Franklin, M.E.E.; Pushpadass, H.A.; Naik, L.N. Surfactants and Fatty Alcohol Based Novel Nanovesicles for Resveratrol: Process Optimization, Characterization and Evaluation of Functional Properties in RAW 264.7 Macrophage Cells. J. Mol. Liq. 2018, 261, 387–396. [Google Scholar] [CrossRef]
- Fersht, A.R. Denaturation (Proteins). In Brenner’s Encyclopedia of Genetics: Second Edition; Elsevier Inc., 2013; pp. 302–303 ISBN 9780080961569.
- Zhang, S.; Wang, C. Effect of Stirring Speed on Particle Dispersion in Silica Synthesis. Nano-Struct. Nano-Objects 2023, 35, 100994. [Google Scholar] [CrossRef]
- Danaei, M.; Dehghankhold, M.; Ataei, S.; Hasanzadeh Davarani, F.; Javanmard, R.; Dokhani, A.; Khorasani, S.; Mozafari, M. Impact of Particle Size and Polydispersity Index on the Clinical Applications of Lipidic Nanocarrier Systems. Pharmaceutics 2018, 10, 57. [Google Scholar] [CrossRef] [PubMed]
- Aldayel, T.S.; M. Badran, M.; H. Alomrani, A.; AlFaris, N.A.; Z. Altamimi, J.; S. Alqahtani, A.; A. Nasr, F.; Ghaffar, S.; Orfali, R. Chitosan-Coated Solid Lipid Nanoparticles as an Efficient Avenue for Boosted Biological Activities of Aloe Perryi: Antioxidant, Antibacterial, and Anticancer Potential. Molecules 2023, 28, 3569. [Google Scholar] [CrossRef]
- de Roodt, A.R.; Lanari, L.C.; Lago, N.R.; Bustillo, S.; Litwin, S.; Morón-Goñi, F.; Gould, E.G.; van Grootheest, J.H.; Dokmetjian, J.C.; Dolab, J.A.; et al. Toxicological Study of Bee Venom (Apis Mellifera Mellifera) from Different Regions of the Province of Buenos Aires, Argentina. Toxicon 2020, 188, 27–38. [Google Scholar] [CrossRef]
- Yousefpoor, Y.; Amani, A.; Divsalar, A.; Mousavi, S.E.; Shakeri, A.; Sabzevari, J.T. Anti-Rheumatic Activity of Topical Nanoemulsion Containing Bee Venom in Rats. Eur. J. Pharm. Biopharm. 2022, 172, 168–176. [Google Scholar] [CrossRef]
- Oršolić, N. Bee Venom in Cancer Therapy. Cancer and Metastasis Reviews 2012, 31, 173–194. [Google Scholar] [CrossRef]
- Duarte, D.; Falcão, S.I.; El Mehdi, I.; Vilas-Boas, M.; Vale, N. Honeybee Venom Synergistically Enhances the Cytotoxic Effect of CNS Drugs in HT-29 Colon and MCF-7 Breast Cancer Cell Lines. Pharmaceutics 2022, 14, 511. [Google Scholar] [CrossRef]
- Premratanachai, P.; Chanchao, C. Review of the Anticancer Activities of Bee Products. Asian Pac. J. Trop. Biomed. 2014, 4, 337–344. [Google Scholar] [CrossRef]
- Kwon, N.-Y.; Sung, S.-H.; Sung, H.-K.; Park, J.-K. Anticancer Activity of Bee Venom Components against Breast Cancer. Toxins (Basel) 2022, 14, 460. [Google Scholar] [CrossRef]
- Mahmoodzadeh, A.; Zarrinnahad, H.; Bagheri, K.P.; Moradia, A.; Shahbazzadeh, D. First Report on the Isolation of Melittin from Iranian Honey Bee Venom and Evaluation of Its Toxicity on Gastric Cancer AGS Cells. J. Chin. Med. Assoc. 2015, 78, 574–583. [Google Scholar] [CrossRef] [PubMed]
- Alfaleh, M.A.; Fahmy, O.; Al-Rabia, M.W.; Abourehab, M.A.S.; Ahmed, O.A.A.; Fahmy, U.A.; H. Alsulimani, H.; Badr-Eldin, S.M.; Aldawsari, H.M.; Aldhabi, B.M.; et al. Hybrid Nanoparticulate System of Fluvastatin Loaded Phospholipid, Alpha Lipoic Acid and Melittin for the Management of Colon Cancer. Sci. Rep. 2022, 12. [Google Scholar] [CrossRef] [PubMed]
- Lischer, K.; Sitorus, S.R.A.; Guslianto, B.W.; Avila, F.; Khayrani, A.C.; Sahlan, M. Anti-Breast Cancer Activity on MCF-7 Cells of Melittin from Indonesia’s Apis Cerana: An In Vitro Study. Asian Pac. J. Cancer Prev. 2021, 22, 3913–3919. [Google Scholar] [CrossRef]
- Choi, K.E.; Hwang, C.J.; Gu, S.M.; Park, M.H.; Kim, J.H.; Park, J.H.; Ahn, Y.J.; Kim, J.Y.; Song, M.J.; Song, H.S.; et al. Cancer Cell Growth Inhibitory Effect of Bee Venom via Increase of Death Receptor 3 Expression and Inactivation of NF-Kappa B in NSCLC Cells. Toxins (Basel) 2014, 6, 2210–2228. [Google Scholar] [CrossRef] [PubMed]
- Borojeni, S.K.; Zolfagharian, H.; Babaie, M.; Javadi, I. Cytotoxic Effect of Bee (A. Mellifera) Venom on Cancer Cell Lines. J. Pharmacopunct. 2021, 23, 212–219. [Google Scholar] [CrossRef]
- Abd El-Gawad, A.; Kenawy, M.A.; El-Messery, T.M.; Hassan, M.E.; El-Nekeety, A.A.; Abdel-Wahhab, M.A. Fabrication and Characterization of Bee Venom-Loaded Nanoliposomes: Enhanced Anticancer Activity against Different Human Cancer Cell Lines via the Modulation of Apoptosis-Related Genes. J. Drug Deliv. Sci Technol 2023, 84. [Google Scholar] [CrossRef]
- Liu, X.; Yin, L.; Shen, S.; Hou, Y. Inflammation and Cancer: Paradoxical Roles in Tumorigenesis and Implications in Immunotherapies. Genes Dis. 2023, 10, 151–164. [Google Scholar] [CrossRef]
- Sohrab, S.S.; Raj, R.; Nagar, A.; Hawthorne, S.; Paiva-Santos, A.C.; Kamal, M.A.; El-Daly, M.M.; Azhar, E.I.; Sharma, A. Chronic Inflammation’s Transformation to Cancer: A Nanotherapeutic Paradigm. Molecules 2023, 28, 4413. [Google Scholar] [CrossRef] [PubMed]
- Afify, S.M.; Hassan, G.; Seno, A.; Seno, M. Cancer-Inducing Niche: The Force of Chronic Inflammation. Br J Cancer 2022, 127, 193–201. [Google Scholar] [CrossRef] [PubMed]
- Zhao, H.; Wu, L.; Yan, G.; Chen, Y.; Zhou, M.; Wu, Y.; Li, Y. Inflammation and Tumor Progression: Signaling Pathways and Targeted Intervention. Signal Transduct. Target. Ther. 2021, 6, 263. [Google Scholar] [CrossRef] [PubMed]
- Greten, F.R.; Grivennikov, S.I. Inflammation and Cancer: Triggers, Mechanisms, and Consequences. Immunity 2019, 51, 27–41. [Google Scholar] [CrossRef] [PubMed]
- Coussens, L.M.; Werb, Z. Inflammation and Cancer. Nature 2002, 420, 860–867. [Google Scholar] [CrossRef] [PubMed]
- Multhoff, G.; Molls, M.; Radons, J. Chronic Inflammation in Cancer Development. Front. Immunol. 2012, 2. [Google Scholar] [CrossRef]
- Murata, M. Inflammation and Cancer. Environ Health Prev Med 2018, 23, 50. [Google Scholar] [CrossRef]
- Grivennikov, S.I.; Greten, F.R.; Karin, M. Immunity, Inflammation, and Cancer. Cell 2010, 140, 883–899. [Google Scholar] [CrossRef]
- Arfin, S.; Jha, N.K.; Jha, S.K.; Kesari, K.K.; Ruokolainen, J.; Roychoudhury, S.; Rathi, B.; Kumar, D. Oxidative Stress in Cancer Cell Metabolism. Antioxidants 2021, 10, 642. [Google Scholar] [CrossRef]
- Zhang, Q.; Zhu, B.; Li, Y. Resolution of Cancer-Promoting Inflammation: A New Approach for Anticancer Therapy. Front Immunol 2017, 8. [Google Scholar] [CrossRef]
- Lai, H.; Liu, Y.; Wu, J.; Cai, J.; Jie, H.; Xu, Y.; Deng, S. Targeting Cancer-Related Inflammation with Non-Steroidal Anti-Inflammatory Drugs: Perspectives in Pharmacogenomics. Front Pharmacol 2022, 13. [Google Scholar] [CrossRef]
- Kolawole, O.R.; Kashfi, K. NSAIDs and Cancer Resolution: New Paradigms beyond Cyclooxygenase. Int J Mol Sci 2022, 23, 1432. [Google Scholar] [CrossRef]
- Jang, H.S.; Kim, S.K.; Han, J.B.; Ahn, H.J.; Bae, H.; Min, B. Il Effects of Bee Venom on the Pro-Inflammatory Responses in RAW264.7 Macrophage Cell Line. J Ethnopharmacol 2005, 99, 157–160. [Google Scholar] [CrossRef]
- Moon, D.O.; Park, S.Y.; Lee, K.J.; Heo, M.S.; Kim, K.C.; Kim, M.O.; Lee, J.D.; Choi, Y.H.; Kim, G.Y. Bee Venom and Melittin Reduce Proinflammatory Mediators in Lipopolysaccharide-Stimulated BV2 Microglia. Int Immunopharmacol 2007, 7, 1092–1101. [Google Scholar] [CrossRef]
- Khalil, A.; Elesawy, B.H.; Ali, T.M.; Ahmed, O.M. Bee Venom: From Venom to Drug. Molecules 2021, 26. [Google Scholar] [CrossRef] [PubMed]
- Kocyigit, A.; Guler, E.M.; Kaleli, S. Anti-Inflammatory and Antioxidative Properties of Honey Bee Venom on Freund’s Complete Adjuvant-Induced Arthritis Model in Rats. Toxicon 2019, 161, 4–11. [Google Scholar] [CrossRef] [PubMed]
- An, H.; Kim, J.; Kim, W.; Gwon, M.; Gu, H.M.; Jeon, M.J.; Han, S.; Pak, S.C.; Lee, C.; Park, I.S.; et al. Therapeutic Effects of Bee Venom and Its Major Component, Melittin, on Atopic Dermatitis in Vivo and in Vitro. Br J Pharmacol 2018, 175, 4310–4324. [Google Scholar] [CrossRef]
- Shi, P.; Xie, S.; Yang, J.; Zhang, Y.; Han, S.; Su, S.; Yao, H. Pharmacological Effects and Mechanisms of Bee Venom and Its Main Components: Recent Progress and Perspective. Front Pharmacol 2022, 13. [Google Scholar] [CrossRef]
- Lee, Y.J.; Oh, M.J.; Lee, D.H.; Lee, Y.S.; Lee, J.; Kim, D.-H.; Choi, C.-H.; Song, M.J.; Song, H.S.; Hong, J.T. Anti-Inflammatory Effect of Bee Venom in Phthalic Anhydride-Induced Atopic Dermatitis Animal Model. Inflammopharmacology 2020, 28, 253–263. [Google Scholar] [CrossRef] [PubMed]
- Kim, W.-H.; An, H.-J.; Kim, J.-Y.; Gwon, M.-G.; Gu, H.; Jeon, M.; Kim, M.-K.; Han, S.-M.; Park, K.-K. Anti-Inflammatory Effect of Melittin on Porphyromonas Gingivalis LPS-Stimulated Human Keratinocytes. Molecules 2018, 23, 332. [Google Scholar] [CrossRef] [PubMed]
- Billingham, M.E.J.; Morley, J.; Hanson, J.M.; Shipolini, R.A.; Vernon, C.A. An Anti-Inflammatory Peptide from Bee Venom. Nature 1973, 245, 163–164. [Google Scholar] [CrossRef] [PubMed]
- Jang, S.; Kim, K.H. Clinical Effectiveness and Adverse Events of Bee Venom Therapy: A Systematic Review of Randomized Controlled Trials. Toxins (Basel) 2020, 12, 558. [Google Scholar] [CrossRef] [PubMed]
- Aufschnaiter, A.; Kohler, V.; Khalifa, S.; Abd El-Wahed, A.; Du, M.; El-Seedi, H.; Büttner, S. Apitoxin and Its Components against Cancer, Neurodegeneration and Rheumatoid Arthritis: Limitations and Possibilities. Toxins (Basel) 2020, 12, 66. [Google Scholar] [CrossRef] [PubMed]
- You, D.; Kwon, Y. The Effect of Bee Venom Pharmacopuncture Therapy on the Condition of Different Concentration in Rheumatoid Arthritis Rat Model. Int J Cardiol 2011, 152, S109–S110. [Google Scholar] [CrossRef]
- Sharaf, S.E.; Alsanosi, S.; Alzahrani, A.R.; Al-Ghamdi, S.S.; Sharaf, S.E.; Ayoub, N. Knowledge, Attitude, and Practice of Bee Venom Acupuncture Therapy on Rheumatoid Arthritis Among Patients in Saudi Arabia. Int J Gen Med 2022, Volume 15, 1171–1183. [Google Scholar] [CrossRef]
- Lee, J.-D.; Park, H.-J.; Chae, Y.; Lim, S. An Overview of Bee Venom Acupuncture in the Treatment of Arthritis. Evid. -Based Complement. Altern. Med. 2005, 2, 79–84. [Google Scholar] [CrossRef] [PubMed]
- Hamishehkar, H.; Rahimpour, Y.; Kouhsoltani, M. Niosomes as a Propitious Carrier for Topical Drug Delivery. Expert Opin Drug Deliv 2013, 10, 261–272. [Google Scholar] [CrossRef]
- Rajera, R.; Nagpal, K.; Singh, S.K.; Mishra, D.N. Niosomes: A Controlled and Novel Drug Delivery System. Biol Pharm Bull 2011, 34, 945–953. [Google Scholar] [CrossRef]
- Teeranachaideekul, V.; Parichatikanond, W.; Junyaprasert, V.B.; Morakul, B. Pumpkin Seed Oil-Loaded Niosomes for Topical Application: 5α-Reductase Inhibitory, Anti-Inflammatory, and In Vivo Anti-Hair Loss Effects. Pharmaceuticals 2022, 15, 930. [Google Scholar] [CrossRef]
- Planz, V.; Lehr, C.-M.; Windbergs, M. In Vitro Models for Evaluating Safety and Efficacy of Novel Technologies for Skin Drug Delivery. Journal of Controlled Release 2016, 242, 89–104. [Google Scholar] [CrossRef]
- Cruz, A.M.; Gonçalves, M.C.; Marques, M.S.; Veiga, F.; Paiva-Santos, A.C.; Pires, P.C. In Vitro Models for Anti-Aging Efficacy Assessment: A Critical Update in Dermocosmetic Research. Cosmetics 2023, 10, 66. [Google Scholar] [CrossRef]
- Welss, T.; Basketter, D.A.; Schröder, K.R. In Vitro Skin Irritation: Facts and Future. State of the Art Review of Mechanisms and Models. Toxicology in Vitro 2004, 18, 231–243. [Google Scholar] [CrossRef] [PubMed]
- Kim, J.Y.; Lee, W.R.; Kim, K.H.; An, H.J.; Chang, Y.C.; Han, S.M.; Park, Y.Y.; Pak, S.C.; Park, K.K. Effects of Bee Venom against Propionibacterium Acnes-Induced Inflammation in Human Keratinocytes and Monocytes. Int J Mol Med 2015, 35, 1651–1656. [Google Scholar] [CrossRef] [PubMed]
- Aburayan, W.S.; Alajmi, A.M.; Alfahad, A.J.; Alsharif, W.K.; Alshehri, A.A.; Booq, R.Y.; Alsudir, S.A.; Alsulaihem, F.M.; Bukhary, H.A.; Badr, M.Y.; et al. Melittin from Bee Venom Encapsulating Electrospun Fibers as a Potential Antimicrobial Wound Dressing Patches for Skin Infections. Pharmaceutics 2022, 14. [Google Scholar] [CrossRef] [PubMed]
- Rinaldi, F.; Del Favero, E.; Rondelli, V.; Pieretti, S.; Bogni, A.; Ponti, J.; Rossi, F.; Di Marzio, L.; Paolino, D.; Marianecci, C.; et al. Ph-Sensitive Niosomes: Effects on Cytotoxicity and on Inflammation and Pain in Murine Models. J Enzyme Inhib Med Chem 2017, 32, 538–546. [Google Scholar] [CrossRef] [PubMed]
- Lu, Y.; Kim, S.; Park, K. In Vitro–in Vivo Correlation: Perspectives on Model Development. Int J Pharm 2011, 418, 142–148. [Google Scholar] [CrossRef] [PubMed]
- Qiu, Y.; Duan, J.Z. In Vitro/In Vivo Correlations. In Developing Solid Oral Dosage Forms; Elsevier, 2017; pp. 415–452.
- Chain, A.S.Y.; Sturkenboom, M.C.J.M.; Danhof, M.; Pasqua, O.E. Della Establishing in Vitro to Clinical Correlations in the Evaluation of Cardiovascular Safety Pharmacology. Drug Discov. Today Technol. 2013, 10, e373–e383. [Google Scholar] [CrossRef]
- Rath, S.; Kanfer, I. In Vitro–In Vivo Correlations (IVIVC) for Predicting the Clinical Performance of Metronidazole Topical Creams Intended for Local Action. Pharmaceutics 2023, 15, 268. [Google Scholar] [CrossRef]
- Arunachalam, S.S.; Shetty, A.P.; Panniyadi, N.; Meena, C.; Kumari, J.; Rani, B.; Das, P.; Kumari, S. Study on Knowledge of Chemotherapy’s Adverse Effects and Their Self-Care Ability to Manage - The Cancer Survivors Impact. Clin Epidemiol Glob Health 2021, 11, 100765. [Google Scholar] [CrossRef]
- Anand, U.; Dey, A.; Chandel, A.K.S.; Sanyal, R.; Mishra, A.; Pandey, D.K.; De Falco, V.; Upadhyay, A.; Kandimalla, R.; Chaudhary, A.; et al. Cancer Chemotherapy and beyond: Current Status, Drug Candidates, Associated Risks and Progress in Targeted Therapeutics. Genes Dis. 2023, 10, 1367–1401. [Google Scholar] [CrossRef]
- Lustberg, M.B.; Kuderer, N.M.; Desai, A.; Bergerot, C.; Lyman, G.H. Mitigating Long-Term and Delayed Adverse Events Associated with Cancer Treatment: Implications for Survivorship. Nat Rev Clin Oncol 2023, 20, 527–542. [Google Scholar] [CrossRef] [PubMed]
- Rivero, M.N.; Lenze, M.; Izaguirre, M.; Pérez Damonte, S.H.; Aguilar, A.; Wikinski, S.; Gutiérrez, M.L. Comparison between HET-CAM Protocols and a Product Use Clinical Study for Eye Irritation Evaluation of Personal Care Products Including Cosmetics According to Their Surfactant Composition. Food and Chemical Toxicology 2021, 153, 112229. [Google Scholar] [CrossRef] [PubMed]
- Dahl, J.E. Potential of Dental Adhesives to Induce Mucosal Irritation Evaluated by the HET–CAM Method. Acta Odontol Scand 2007, 65, 275–283. [Google Scholar] [CrossRef] [PubMed]
- Eiras, F.; Amaral, M.H.; Silva, R.; Martins, E.; Lobo, J.M.S.; Silva, A.C. Characterization and Biocompatibility Evaluation of Cutaneous Formulations Containing Lipid Nanoparticles. Int J Pharm 2017, 519, 373–380. [Google Scholar] [CrossRef] [PubMed]
- Mohammadi, M.; Elahimehr, Z.; Mahboobian, M.M. Acyclovir-Loaded Nanoemulsions: Preparation, Characterization and Irritancy Studies for Ophthalmic Delivery. Curr Eye Res 2021, 46, 1646–1652. [Google Scholar] [CrossRef] [PubMed]
- Abdelkader, H.; Ismail, S.; Hussein, A.; Wu, Z.; Al-Kassas, R.; Alany, R.G. Conjunctival and Corneal Tolerability Assessment of Ocular Naltrexone Niosomes and Their Ingredients on the Hen’s Egg Chorioallantoic Membrane and Excised Bovine Cornea Models. Int J Pharm 2012, 432, 1–10. [Google Scholar] [CrossRef]
- de Araujo Lowndes Viera, L.M.; Silva, R.S.; da Silva, C.C.; Presgrave, O.A.F.; Boas, M.H.S.V. Comparison of the Different Protocols of the Hen’s Egg Test-Chorioallantoic Membrane (HET-CAM) by Evaluating the Eye Irritation Potential of Surfactants. Toxicology in Vitro 2022, 78. [Google Scholar] [CrossRef]
- Somwongin, S.; Chantawannakul, P.; Chaiyana, W. Antioxidant Activity and Irritation Property of Venoms from Apis Species. Toxicon 2018, 145, 32–39. [Google Scholar] [CrossRef]
Figure 1.
Schematic representation of beehive derived compounds, including a photograph of the beehive at Polytechnic Institute of Bragança’s apiary, Bragança, Portugal (produced with Biorender).
Figure 1.
Schematic representation of beehive derived compounds, including a photograph of the beehive at Polytechnic Institute of Bragança’s apiary, Bragança, Portugal (produced with Biorender).
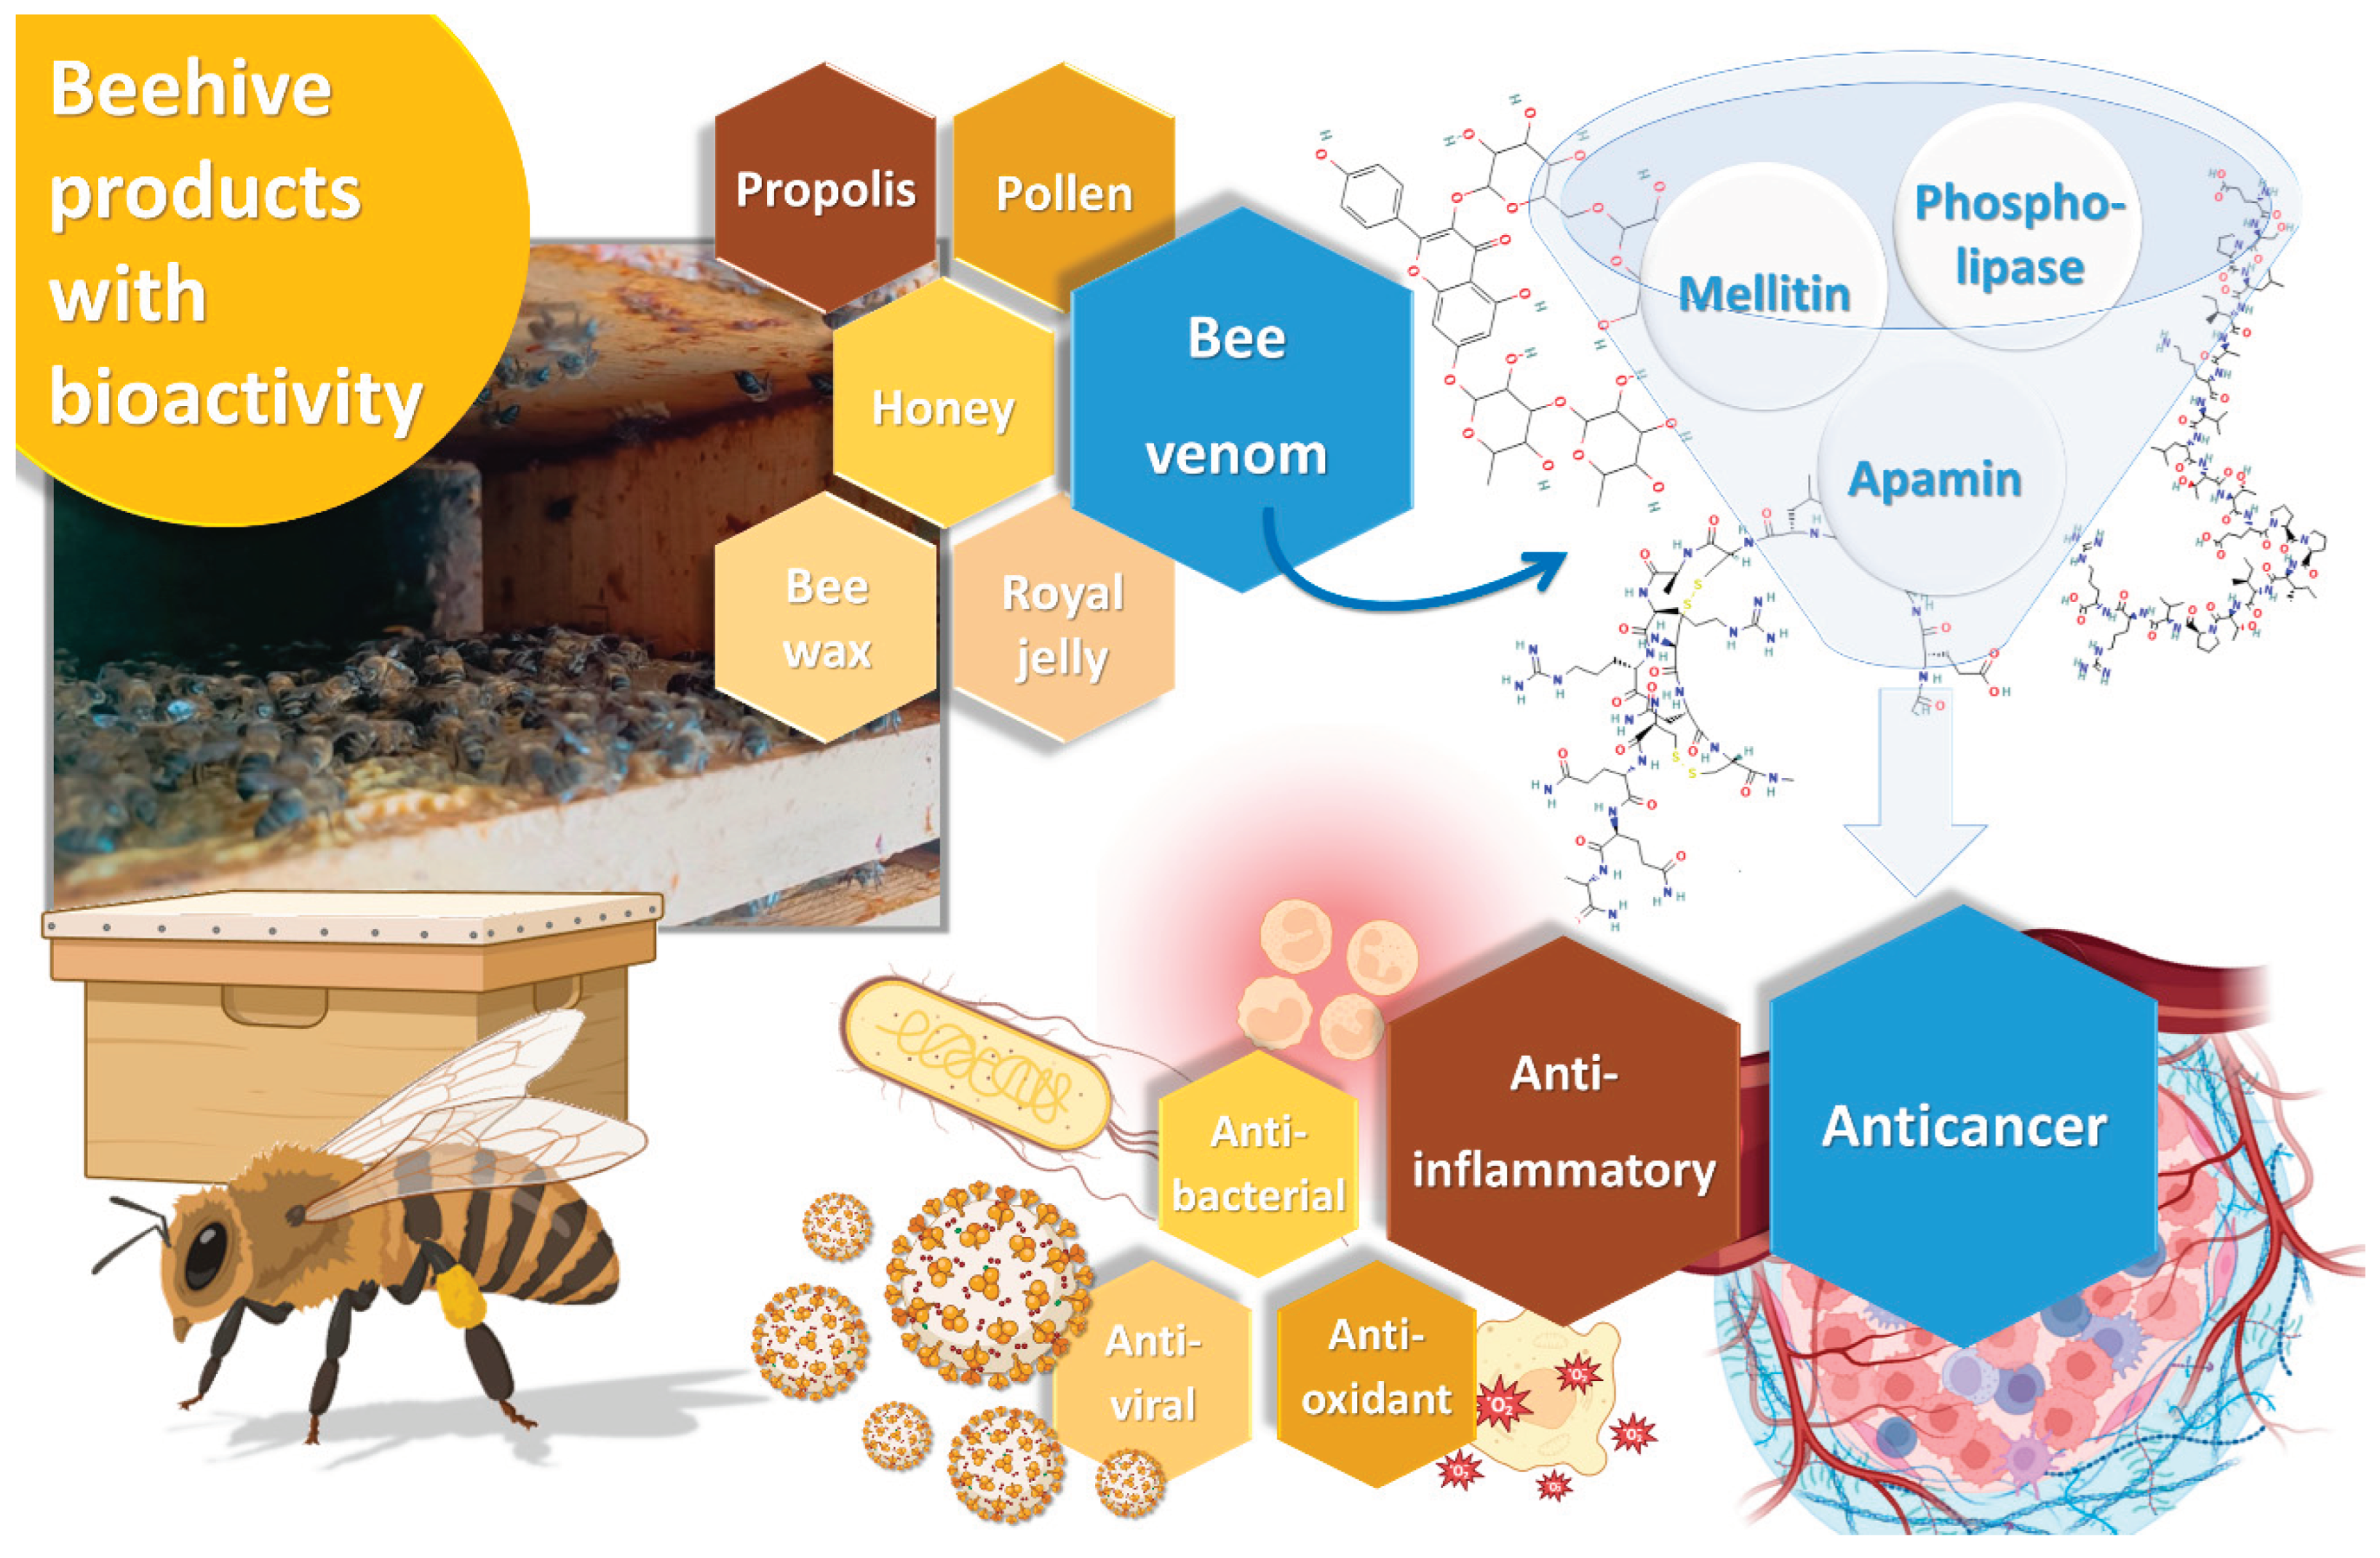
Figure 2.
Schematic illustration of niosome composition and production, using the thin-film hydration method, followed by extrusion through a nanometric pore membrane (produced with Biorender).
Figure 2.
Schematic illustration of niosome composition and production, using the thin-film hydration method, followed by extrusion through a nanometric pore membrane (produced with Biorender).
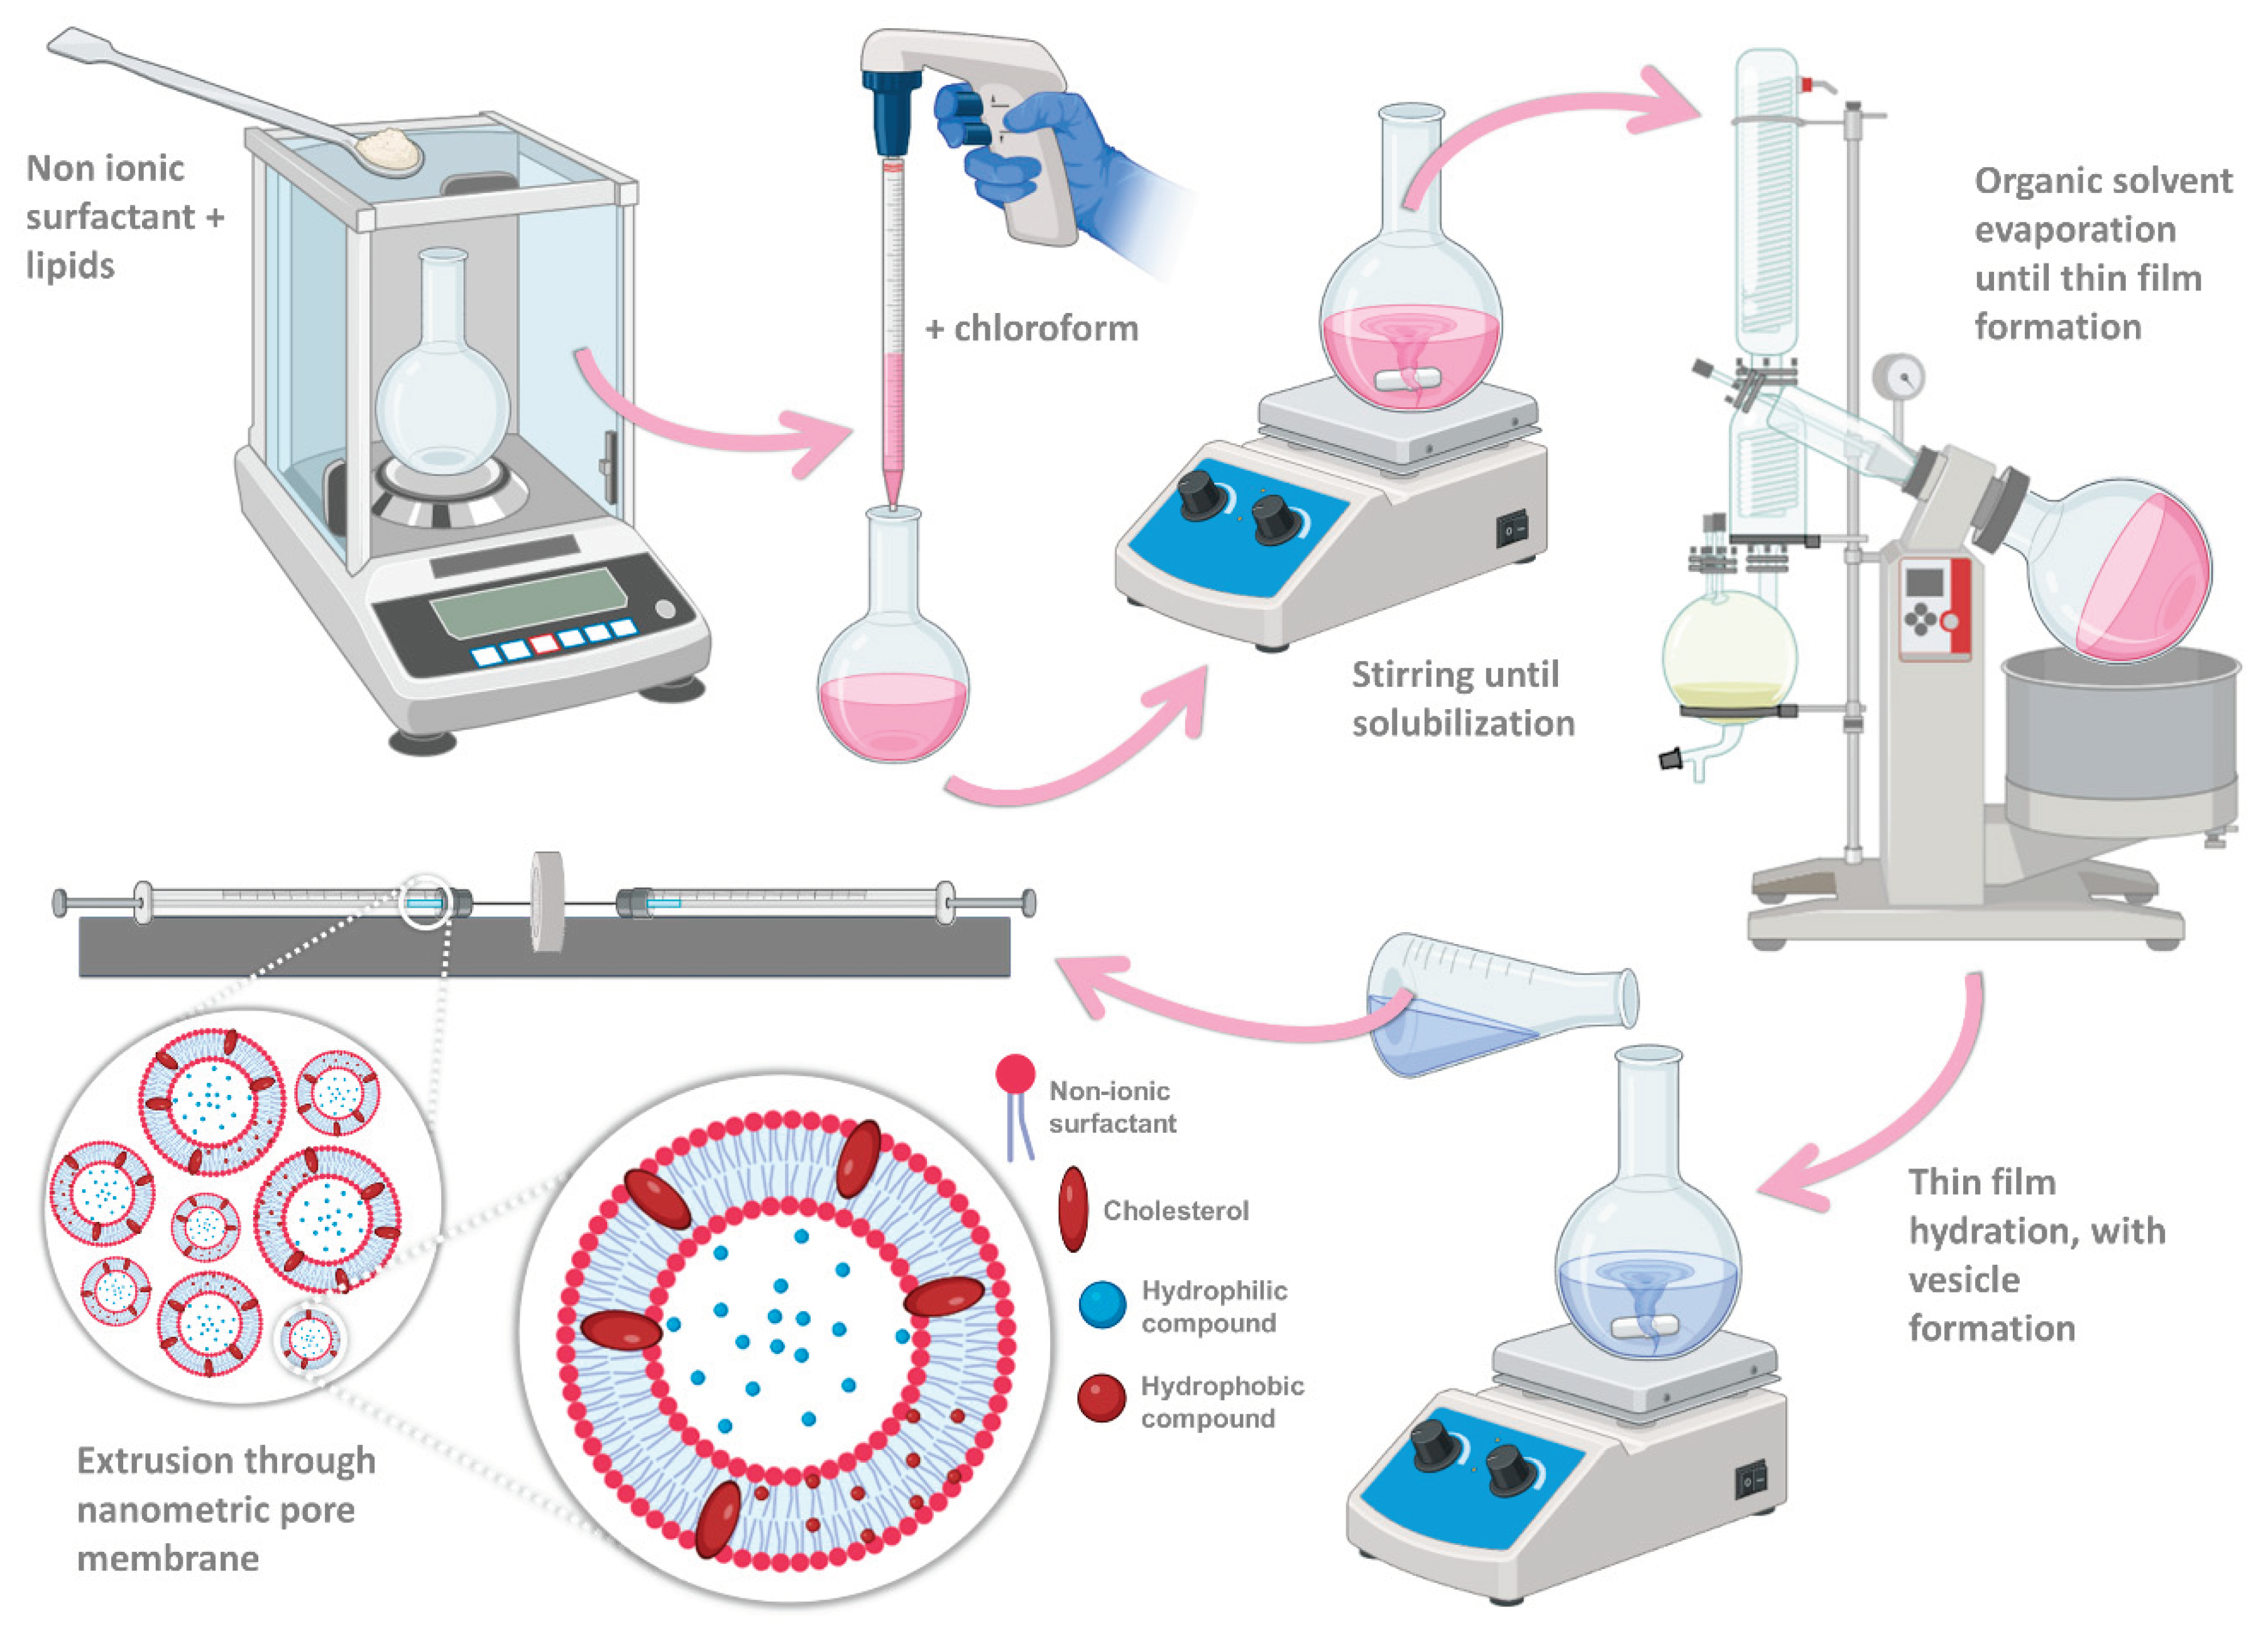
Figure 3.
Example chromatogram after UHPLC analysis of the bee venom sample, at 220 nm. IS – internal standard (cytochrome C, 25 µg/mL); UHPLC - ultra-high-performance liquid chromatography.
Figure 3.
Example chromatogram after UHPLC analysis of the bee venom sample, at 220 nm. IS – internal standard (cytochrome C, 25 µg/mL); UHPLC - ultra-high-performance liquid chromatography.
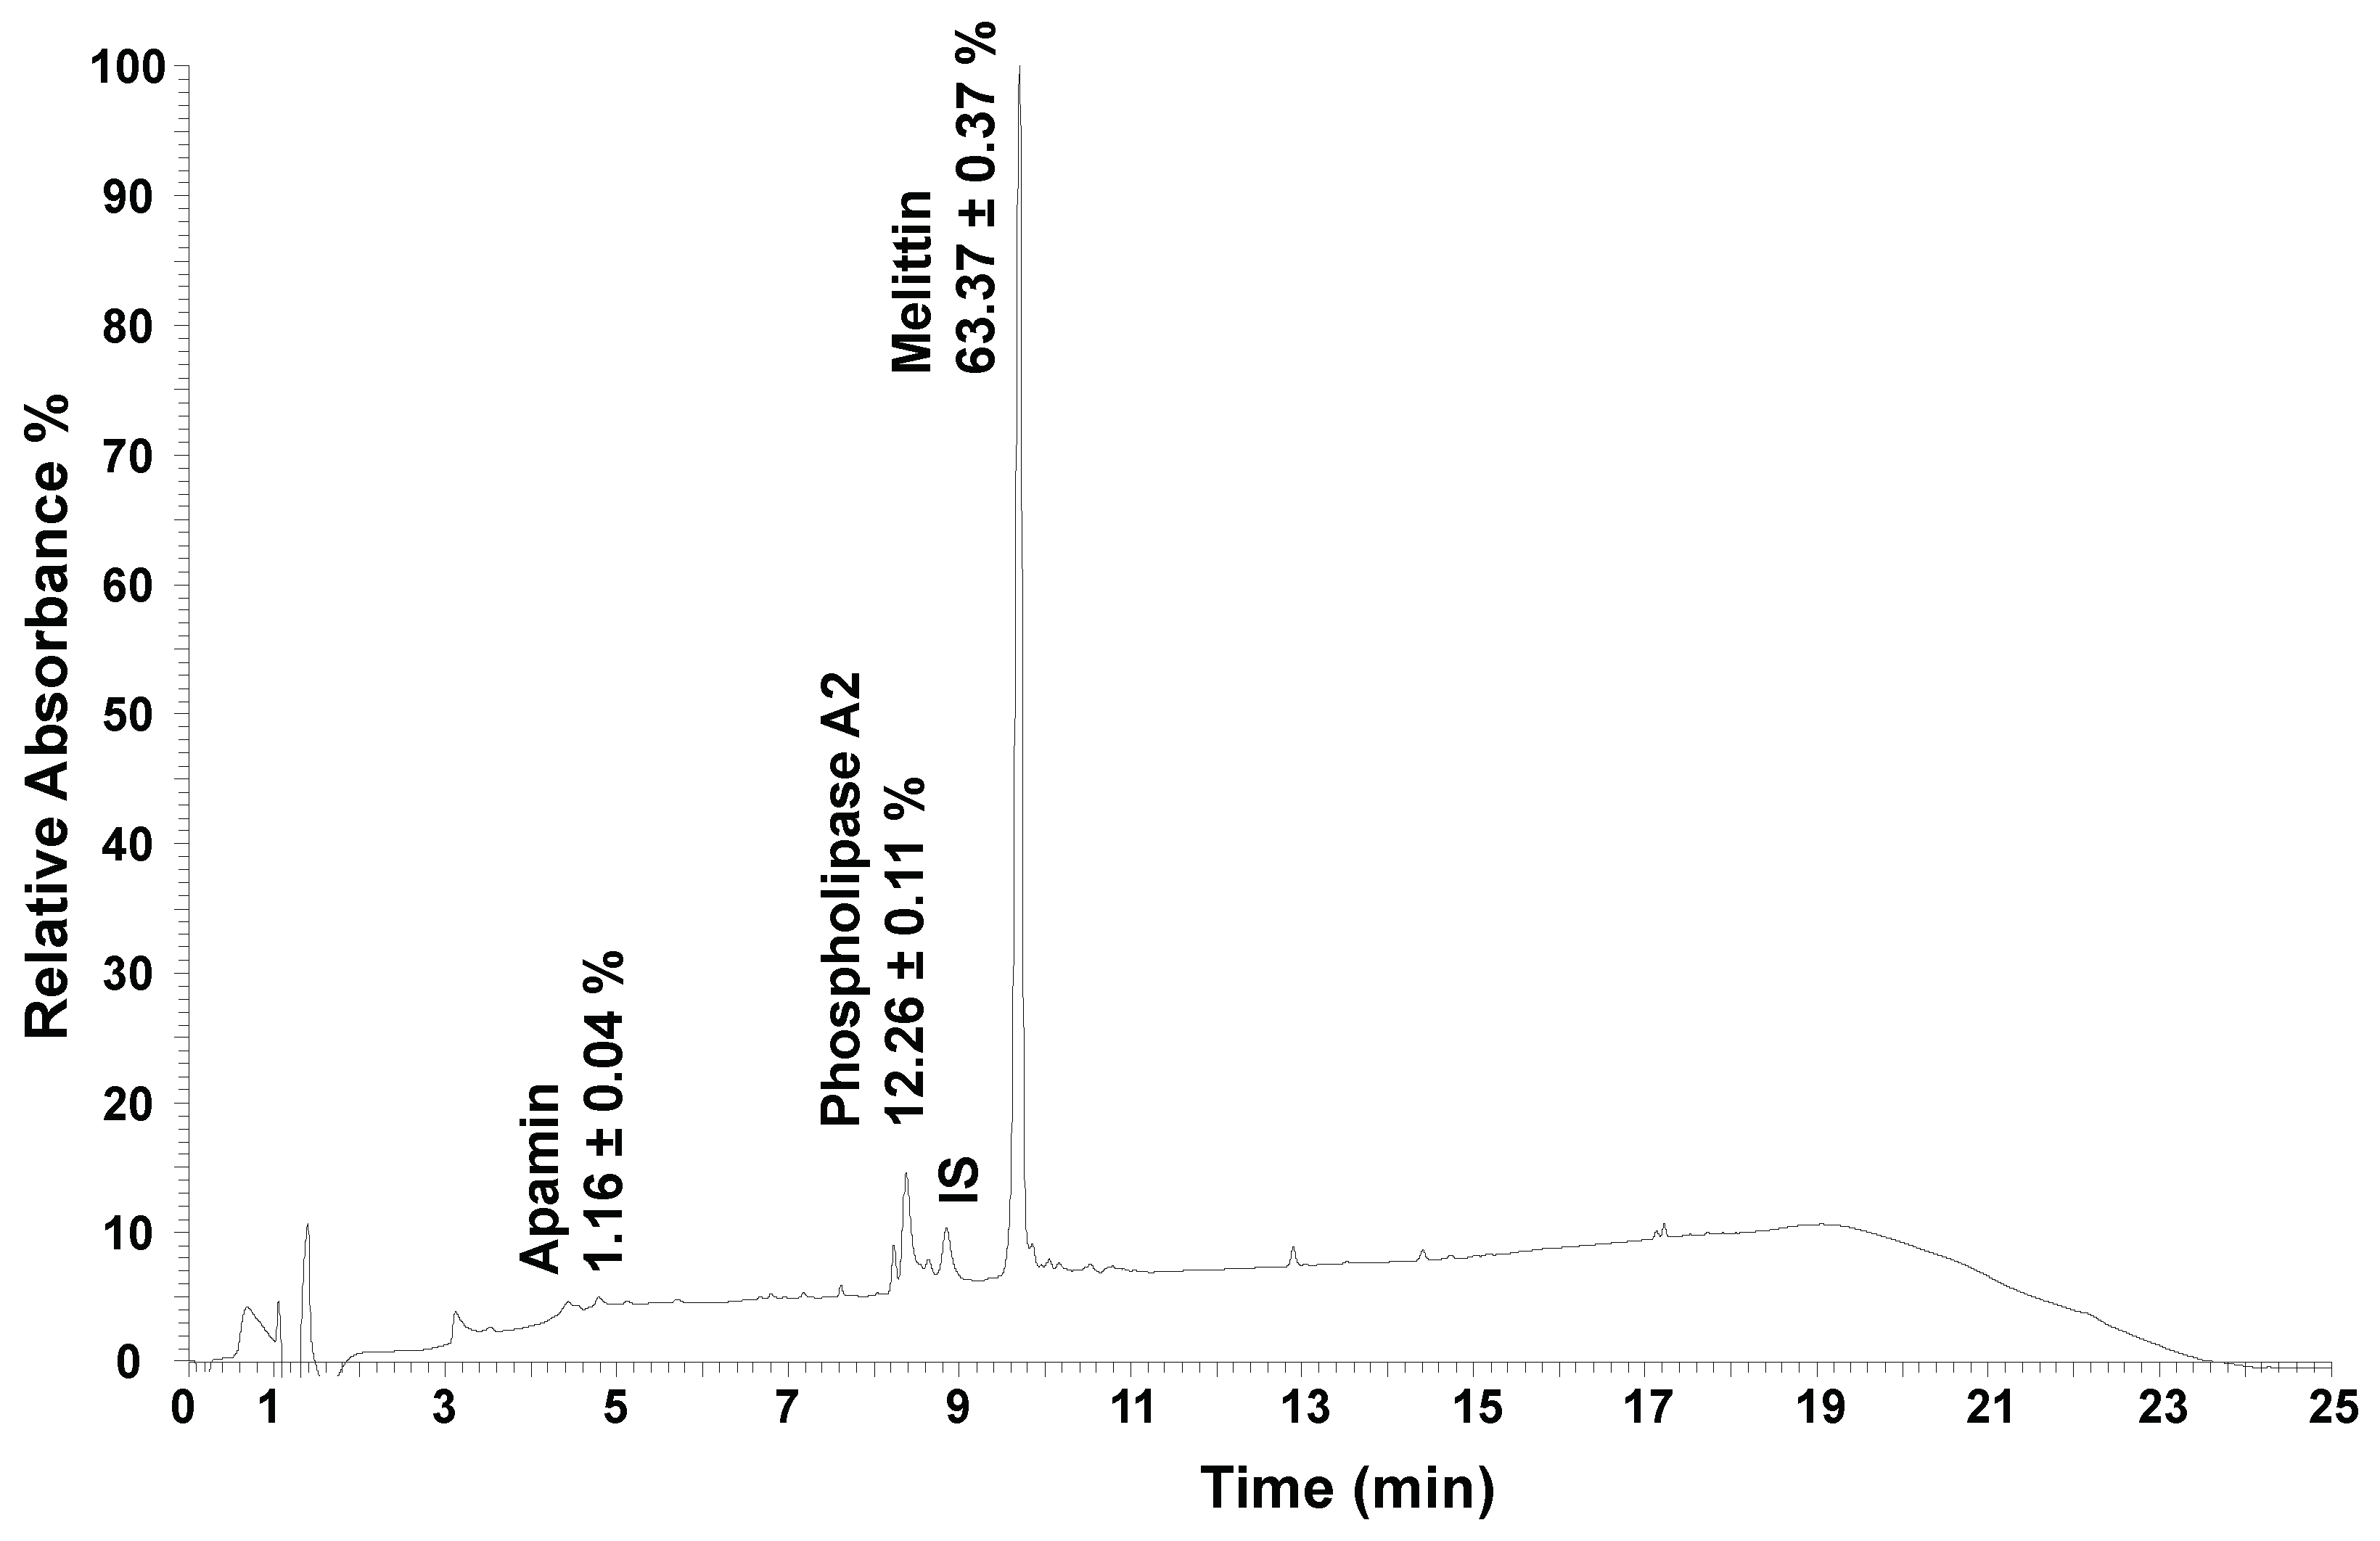
Figure 6.
Anti-inflammatory potential of the developed bee venom-loaded niosomes (BVN), compared to the free compound (bee venom solution, BVS), and the formulation vehicle (empty niosomes, EN), evaluated in a mouse macrophage cell line (RAW 264.7); IC50 values are depicted, and correspond to formulation concentrations providing 50% of inhibition of nitric oxide production; data is represented as mean ± standard deviation; **** p < 0.0001 (schematic representation produced with Biorender).
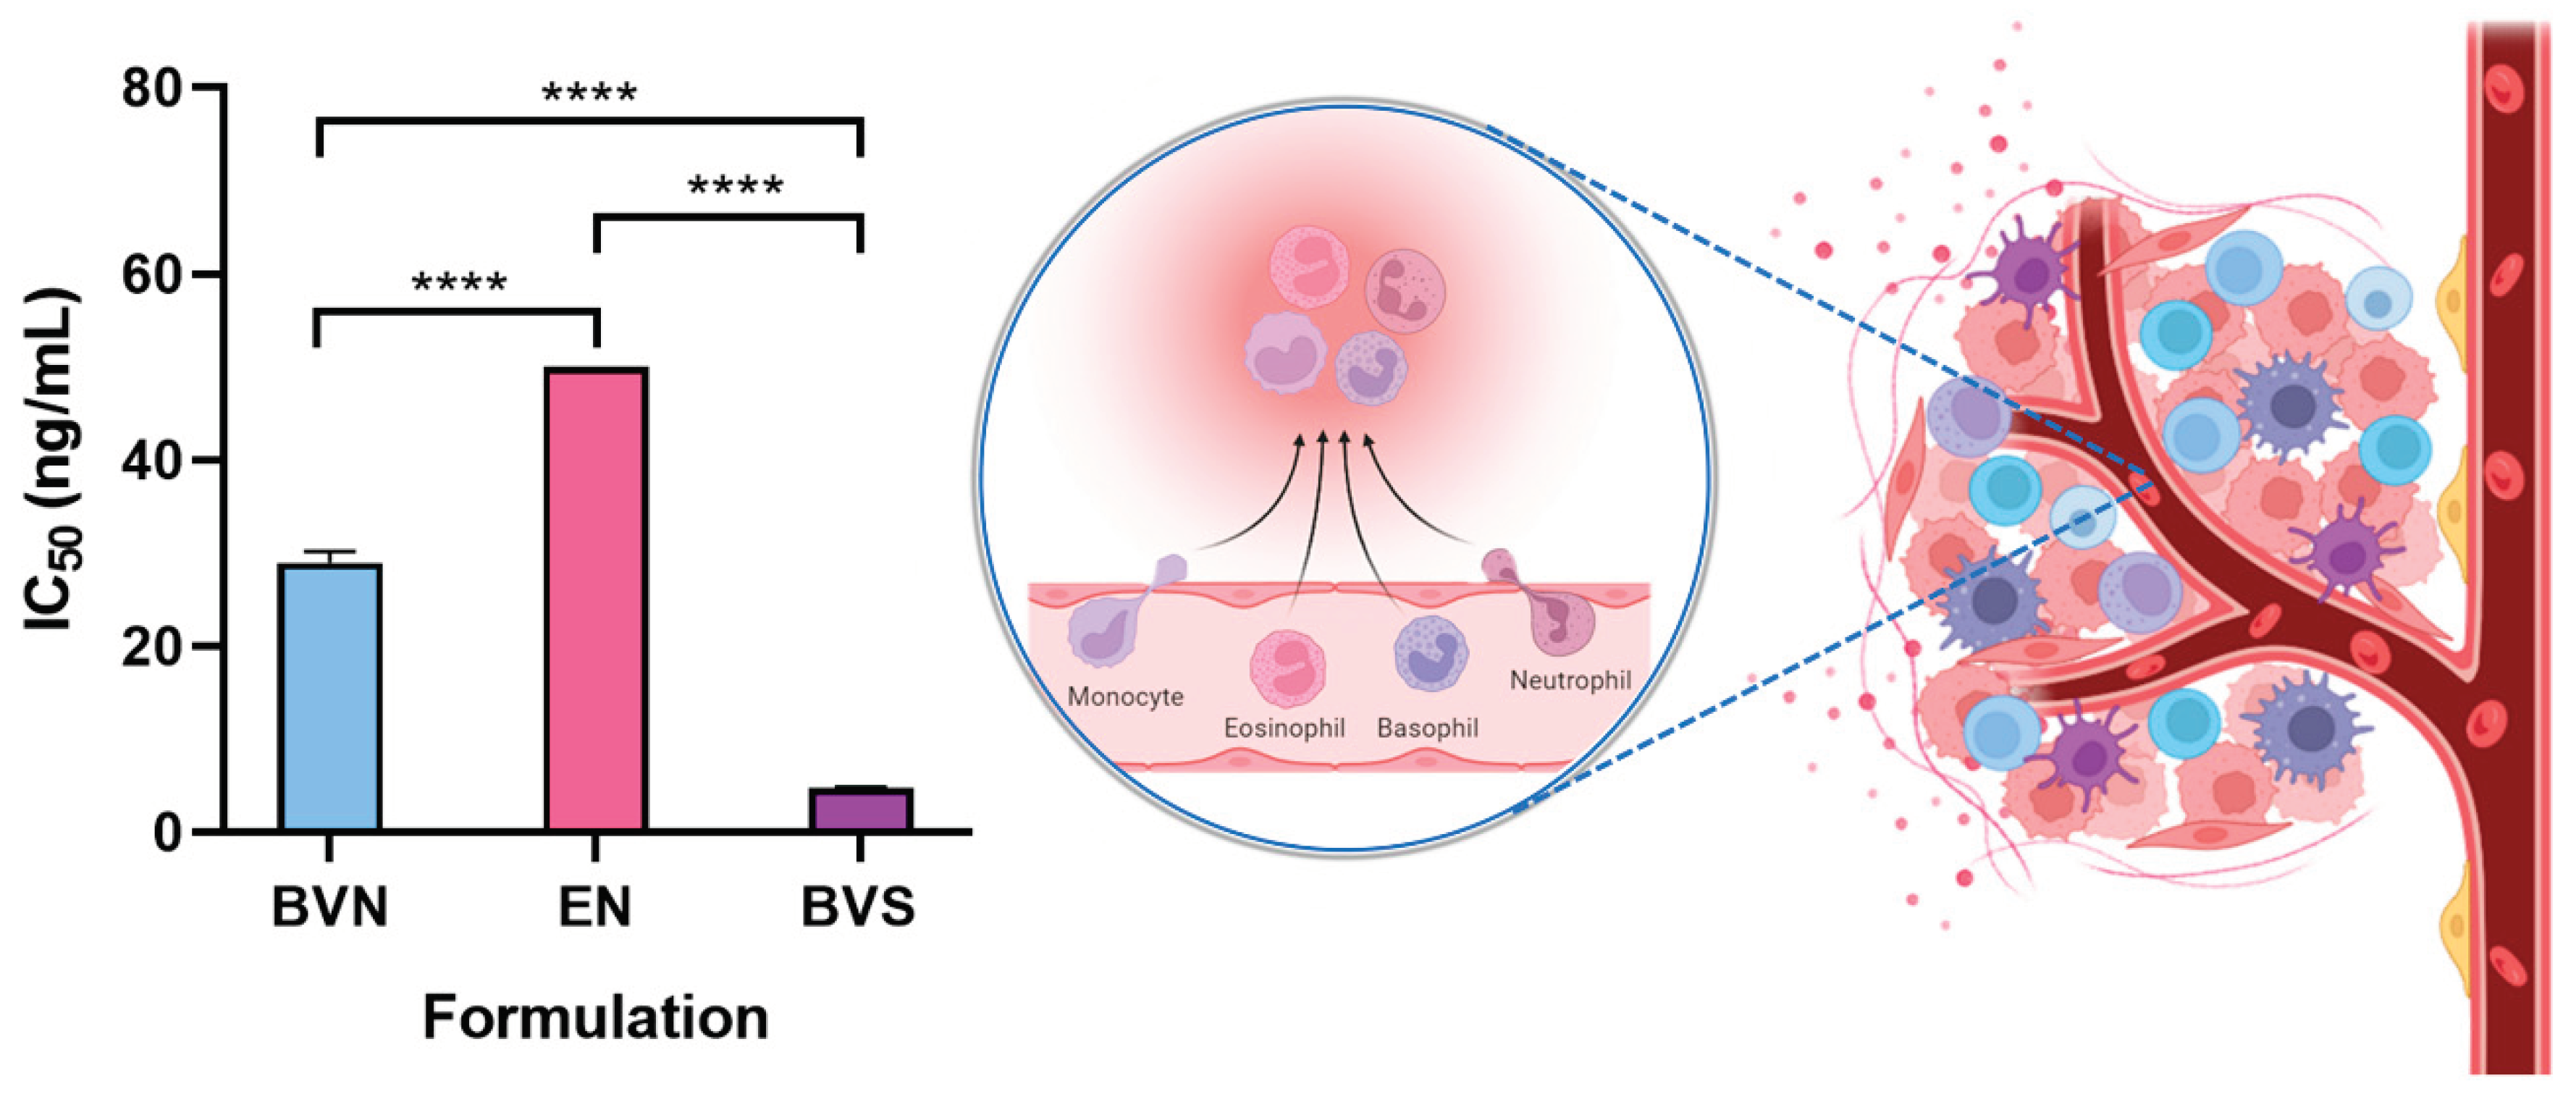
Figure 8.
HET-CAM assay schematic representation, and photographs of the hen's eggs-chorioallantoic membranes after formulation application, either the developed bee venom-encapsulated niosomes [a)], or the formulation vehicle [empty niosomes, b)].
Figure 8.
HET-CAM assay schematic representation, and photographs of the hen's eggs-chorioallantoic membranes after formulation application, either the developed bee venom-encapsulated niosomes [a)], or the formulation vehicle [empty niosomes, b)].
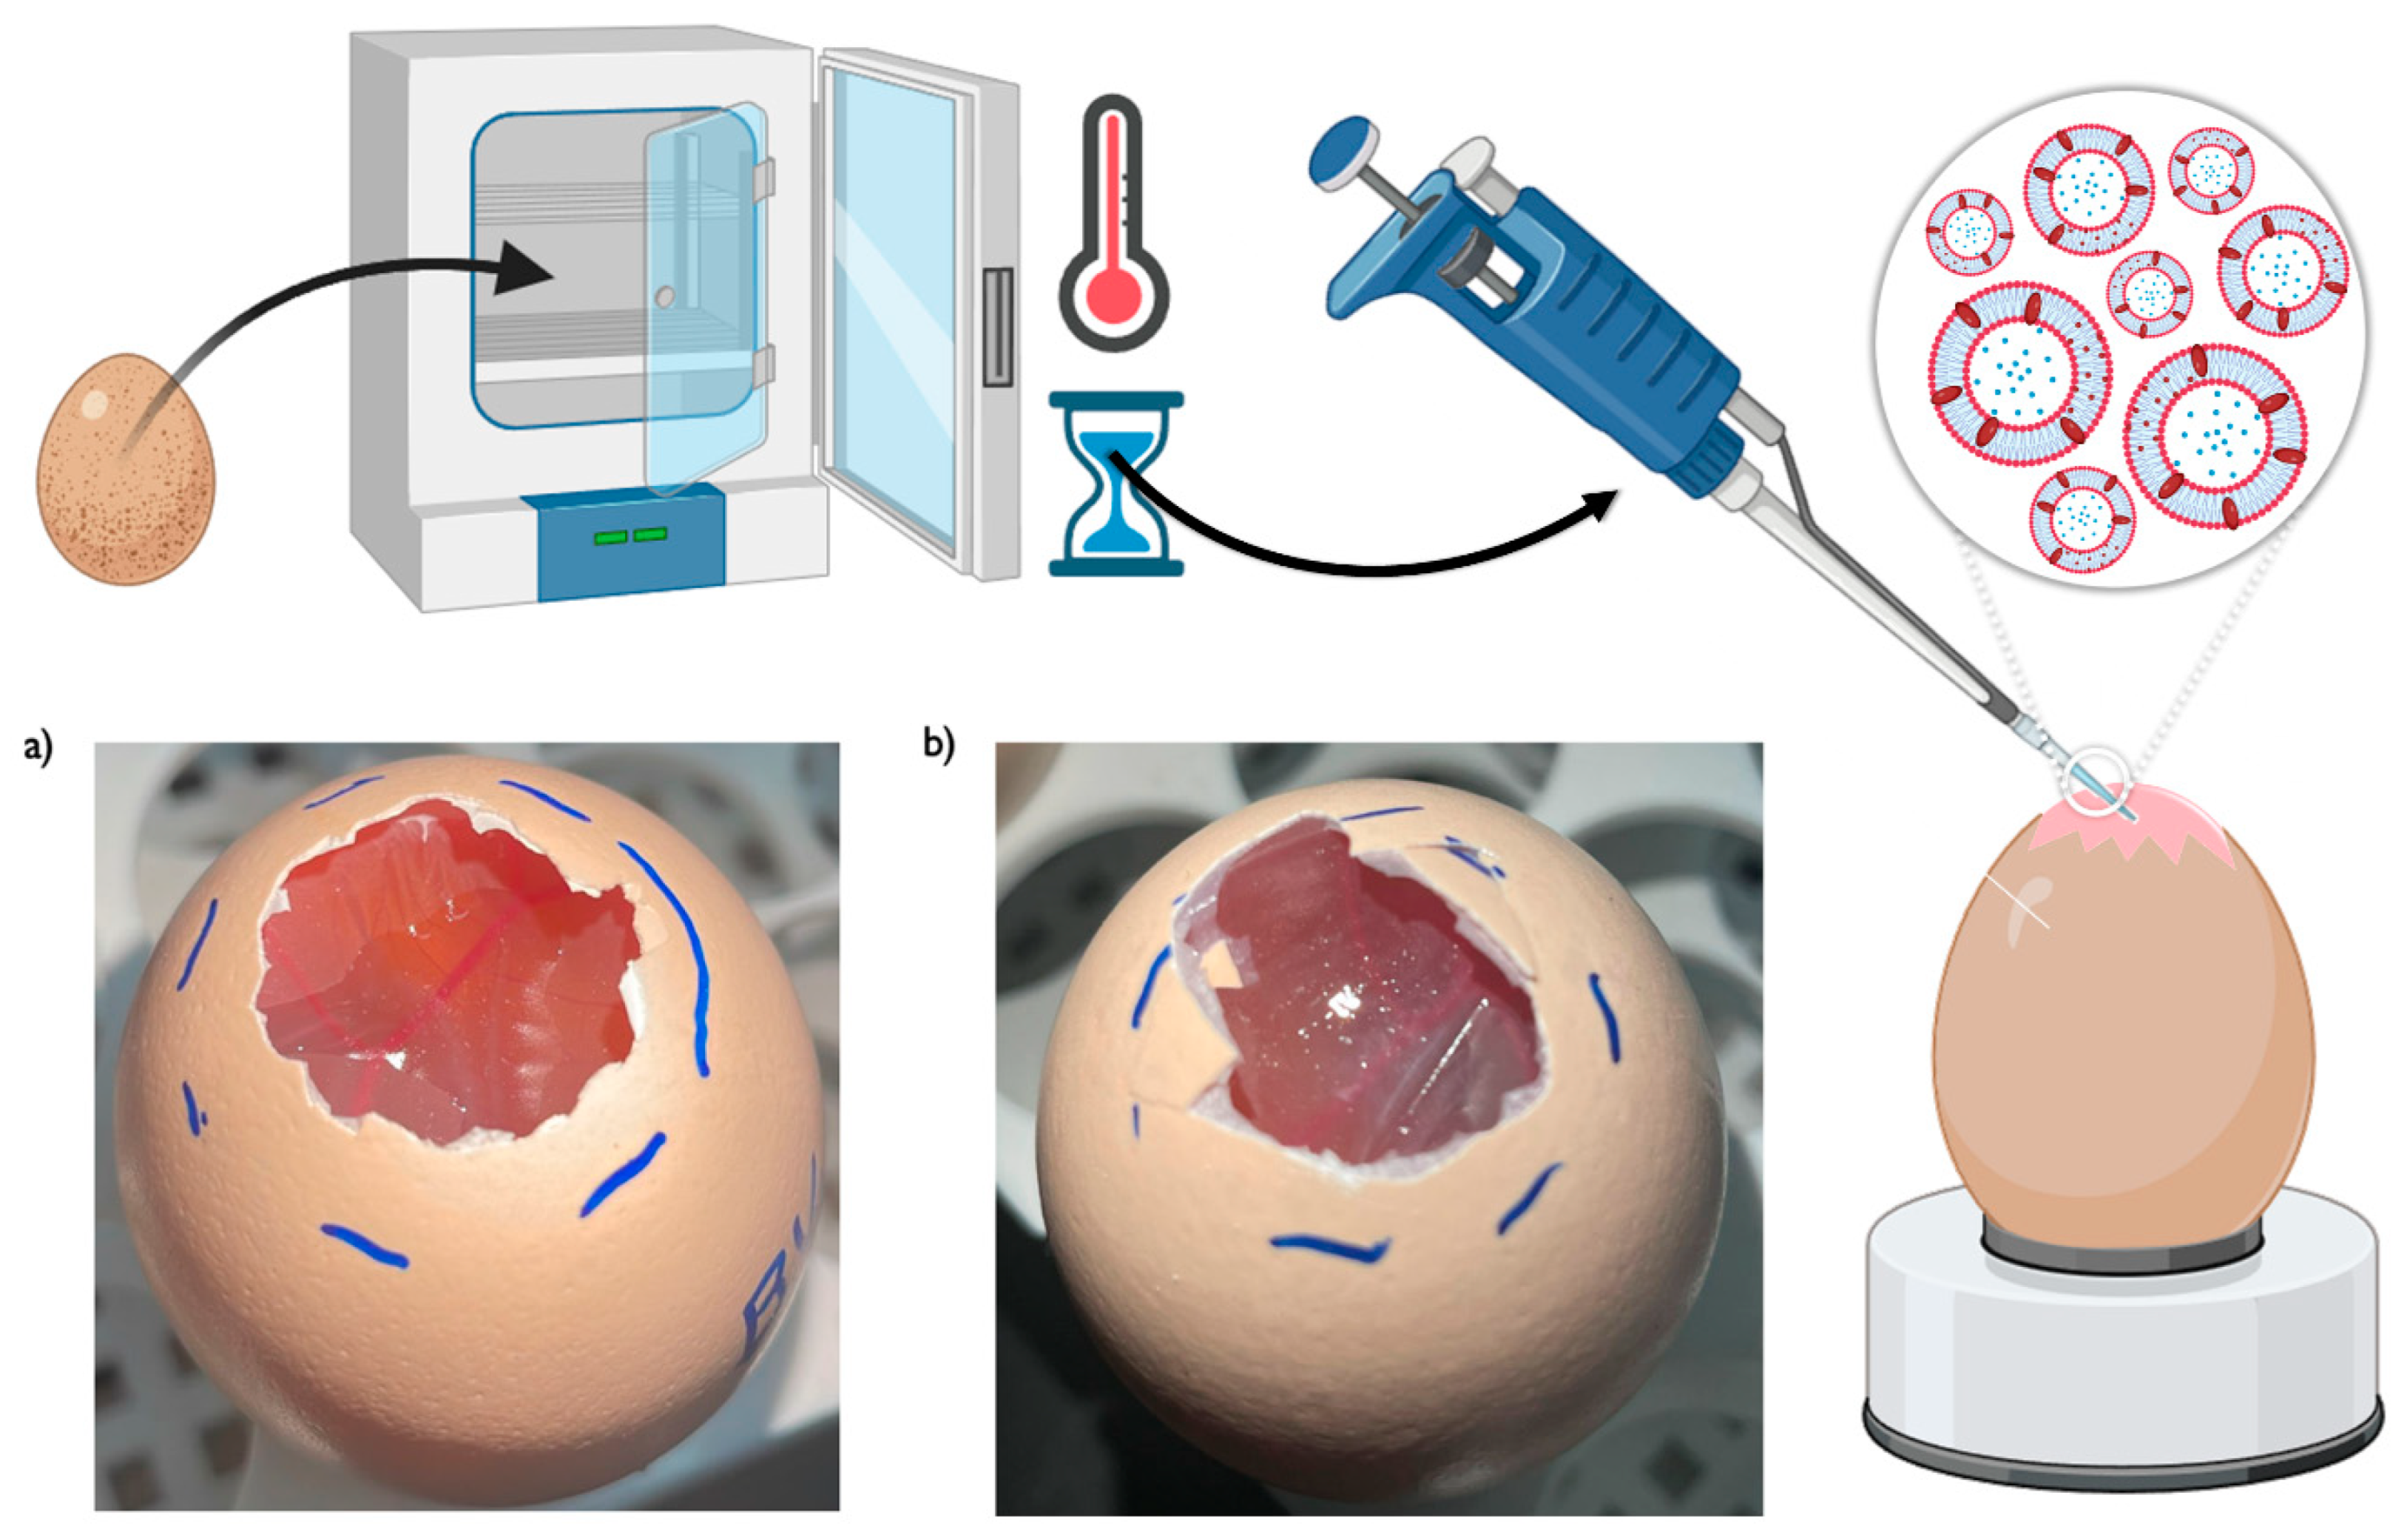
Table 1.
Numerical time-dependent scoring scheme for the HET-CAM test method.
| Effect | Score | ||
|---|---|---|---|
| 0.5 min | 2 min | 5 min | |
| Lysis | 5 | 3 | 1 |
| Hemorrhage | 7 | 5 | 3 |
| Coagulation | 9 | 7 | 5 |
Table 2.
Chemical characterization of the bee venom encapsulated within the developed niosomes, or solubilized within the produced compound solution, performed by UHPLC analysis. Major compounds are presented, with values corresponding to the amount present in each analyzed sample (µg/mL).
Table 2.
Chemical characterization of the bee venom encapsulated within the developed niosomes, or solubilized within the produced compound solution, performed by UHPLC analysis. Major compounds are presented, with values corresponding to the amount present in each analyzed sample (µg/mL).
| Compounds | Bee venom solution (300 µg/mL) | Bee venom-loaded niosomes (2 µg/mL) | Correspondent percentage (%) |
|---|---|---|---|
| Melittin | 193.43 | 1.29 | 63 |
| Phospholipase A2 | 37.52 | 0.25 | 12 |
| Apamin | 3.61 | 0.024 | 1.2 |
UHPLC - ultra-high-performance liquid chromatography.
Table 4.
Significance matrix of the HaCaT and HFF-1 cell viability assay results (depicted in Figure 7), comparing the viability percentage variation with concentration variation within each studied formulation, for each cell type. The presented values correspond to p values, after the application of one-way ANOVA with Tukey’s multiple comparisons’ test.
| HFF-1 cells | HaCaT cells | ||||||||||
| Bee venom-loaded niosomes | Bee venom-loaded niosomes | ||||||||||
| Concentration (µg/mL) | 0 | 25 | 50 | 100 | 200 | Concentration (µg/mL) | 0 | 25 | 50 | 100 | 200 |
| Overall | < 0.0001 | Overall | < 0.0001 | ||||||||
| 0 | - | NS | NS | 0.0352 | < 0.0001 | 0 | - | 0.0025 | < 0.0001 | < 0.0001 | < 0.0001 |
| 25 | - | - | NS | NS | < 0.0001 | 25 | - | - | NS | < 0.0001 | < 0.0001 |
| 50 | - | - | - | NS | < 0.0001 | 50 | - | - | - | 0.0002 | < 0.0001 |
| 100 | - | - | - | - | < 0.0001 | 100 | - | - | - | - | < 0.0001 |
| 200 | - | - | - | - | - | 200 | - | - | - | - | - |
| Empty niosomes | Empty niosomes | ||||||||||
| Concentration (µg/mL) | 0 | 25 | 50 | 100 | 200 | Concentration (µg/mL) | 0 | 25 | 50 | 100 | 200 |
| Overall | < 0.0001 | Overall | < 0.0001 | ||||||||
| 0 | - | NS | < 0.0001 | < 0.0001 | < 0.0001 | 0 | - | NS | NS | < 0.0001 | < 0.0001 |
| 25 | - | - | < 0.0001 | < 0.0001 | < 0.0001 | 25 | - | - | NS | < 0.0001 | < 0.0001 |
| 50 | - | - | - | < 0.0001 | < 0.0001 | 50 | - | - | - | < 0.0001 | < 0.0001 |
| 100 | - | - | - | - | 0.0392 | 100 | - | - | - | - | < 0.0001 |
| 200 | - | - | - | - | - | 200 | - | - | - | - | - |
| Bee venom solution | Bee venom solution | ||||||||||
| Concentration (µg/mL) | 0 | 25 | 50 | 100 | 200 | Concentration (µg/mL) | 0 | 25 | 50 | 100 | 200 |
| Overall | < 0.0001 | Overall | < 0.0001 | ||||||||
| 0 | - | NS | NS | 0.0003 | < 0.0001 | 0 | - | NS | NS | < 0.0001 | < 0.0001 |
| 25 | - | - | NS | 0.0002 | < 0.0001 | 25 | - | - | NS | < 0.0001 | < 0.0001 |
| 50 | - | - | - | 0.0021 | < 0.0001 | 50 | - | - | - | < 0.0001 | < 0.0001 |
| 100 | - | - | - | - | 0.0087 | 100 | - | - | - | - | < 0.0001 |
| 200 | - | - | - | - | - | 200 | - | - | - | - | - |
NS – not significant (statistical significance).
Table 5.
Significance matrix of the HaCaT and HFF-1 cell viability assay results (depicted in Figure 7), comparing the viability percentage variation between studied formulations, for the same concentrations, for each cell type. The presented values correspond to p values, after application of two-way ANOVA with Tukey’s multiple comparisons’ test.
| HFF-1 cells | HaCaT cells | ||||||||||
| Bee venom-loaded niosomes vs empty niosomes | Bee venom-loaded niosomes vs empty niosomes | ||||||||||
| Overall | 0 µg/mL | 25 µg/mL | 50 µg/mL | 100 µg/mL | 200 µg/mL | Overall | 0 µg/mL | 25 µg/mL | 50 µg/mL | 100 µg/mL | 200 µg/mL |
| < 0.0001 | 0.0037 | 0.0104 | 0.0025 | < 0.0001 | < 0.0001 | < 0.0001 | 0.0058 | < 0.0001 | 0.0015 | NS | < 0.0001 |
| Bee venom-loaded niosomes vs bee venom solution | Bee venom-loaded niosomes vs bee venom solution | ||||||||||
| Overall | 0 µg/mL | 25 µg/mL | 50 µg/mL | 100 µg/mL | 200 µg/mL | Overall | 0 µg/mL | 25 µg/mL | 50 µg/mL | 100 µg/mL | 200 µg/mL |
| < 0.0001 | < 0.0001 | < 0.0001 | < 0.0001 | < 0.0001 | < 0.0001 | < 0.0001 | < 0.0001 | < 0.0001 | < 0.0001 | < 0.0001 | < 0.0001 |
| Empty niosomes vs bee venom solution | Empty niosomes vs bee venom solution | ||||||||||
| Overall | 0 µg/mL | 25 µg/mL | 50 µg/mL | 100 µg/mL | 200 g/mL | Overall | 0 µg/mL | 25 µg/mL | 50 µg/mL | 100 µg/mL | 200 µg/mL |
| < 0.0001 | < 0.0001 | < 0.0001 | < 0.0001 | < 0.0001 | < 0.0001 | < 0.0001 | 0.0004 | 0.0001 | < 0.0001 | < 0.0001 | < 0.0001 |
NS – not significant (statistical significance).
Table 6.
Cell viability of the developed bee venom-loaded niosomes, formulation vehicle (empty niosomes), and compound solution (bee venom solution), evaluated in HaCaT and HFF-1 cell lines, and represented by the calculated IC50 value.
Table 6.
Cell viability of the developed bee venom-loaded niosomes, formulation vehicle (empty niosomes), and compound solution (bee venom solution), evaluated in HaCaT and HFF-1 cell lines, and represented by the calculated IC50 value.
| Cell viability (IC50, µg/mL) | ||
|---|---|---|
| HFF-1 cells | HaCaT cells | |
| Bee venom-loaded niosomes | 165.7 ± 1.0 | 161.0 ± 1.0 |
| Empty niosomes | 138.2 ± 1.0 | 69.8 ± 1.00 |
| Bee venom solution | > 200.0 | > 200.0 |
IC50 value corresponds to formulation concentrations causing 50% reduction of cell viability or proliferation; data is represented as mean ± standard deviation of tested formulations.
Table 7.
HET-CAM results after application of the developed bee venom-loaded niosomes or formulation vehicle (empty niosomes), with respective positive (0.1 N NaOH) and negative (0.9% NaCl) controls, on hen's eggs-chorioallantoic membranes, and represented by the calculated average irritation score (IS) ± standard deviation, and visible vascular reactions and overall irritation degree.
| Formulation | Average IS | Standard deviation | Vascular reactions following treatment | Irritation degree |
|---|---|---|---|---|
| Bee venom-loaded niosomes | 7.7 | 0.47 | No lysis | Slightly irritative |
| Empty niosomes | 14 | 0 | Hemorrhage | Strongly irritative |
| 0.9% NaCl | 0.00 | - | None | Non-irritant |
| 0.1 N NaOH | 19.00 | - | Lysis and hemorrhage | Strongly irritative |
IS – irritation score.
Disclaimer/Publisher’s Note: The statements, opinions and data contained in all publications are solely those of the individual author(s) and contributor(s) and not of MDPI and/or the editor(s). MDPI and/or the editor(s) disclaim responsibility for any injury to people or property resulting from any ideas, methods, instructions or products referred to in the content. |
© 2024 by the authors. Licensee MDPI, Basel, Switzerland. This article is an open access article distributed under the terms and conditions of the Creative Commons Attribution (CC BY) license (http://creativecommons.org/licenses/by/4.0/).
Copyright: This open access article is published under a Creative Commons CC BY 4.0 license, which permit the free download, distribution, and reuse, provided that the author and preprint are cited in any reuse.


