
Submitted:
27 February 2024
Posted:
28 February 2024
You are already at the latest version
Abstract
Livestock farming plays a crucial role in agriculture and is important in meeting people's needs for a better life in the new era. However, due to China's "double carbon" target, the development of animal husbandry has been affected by the level of carbon emissions. To study the spatial dis-tribution and dynamic evolution of livestock carbon emissions in Shandong Province, we used panel data from 16 prefecture-level cities in Shandong Province from 2001 to 2022 to determine the spatial differentiation of livestock carbon emissions in Shandong Province and their dynamic evolution by combining spatial and non-parametric estimation methods based on livestock carbon emissions and livestock emission intensity measured by city. The results of the study show that the distribution of carbon emissions from animal husbandry in Shandong Province is in a "dis-persed-aggregated" pattern, and the intensity of carbon emissions shows a gradual downward trend, with a ladder-like distribution characterized by high in the west and low in the east. Through the analysis of the dynamic evolution of nuclear density, we observe that the regional differences of animal husbandry carbon emissions in Shandong Province are expanding, showing the characteristics of polarization. The difference of carbon emissions in the peninsula is gradually narrowing, and the phenomenon of polarization is weakening. The carbon emissions of animal husbandry in the central and western regions of Shandong are polarized.
Keywords:
animal husbandry
; carbon emission
; spatial differentiation
; dynamic evolution
1. Introduction
Increasing anthropogenic greenhouse gas (GHG) emissions and their impact on the global climate pose a major challenge to the global environment [1]. According to 2022 emission estimates from the Global Atmospheric Research Emissions Database (EDGAR 7th Edition), global greenhouse gas emissions increased by 1.4% compared to 2021, reaching 53.8 Gt CO2 equivalent. These figures are 2.3% higher than the 52.6 Gt CO2 equivalent emissions recorded in 2019 [2]. To address climate change, China has set a solemn goal of "peaking carbon dioxide emissions by 2030 and aiming for carbon neutrality by 2060". Promoting carbon neutrality is the key to sustainable development, and reducing greenhouse gas emissions is the fundamental way to achieve carbon neutrality. Modern agriculture meets people's most basic material needs. At the same time, a large number of chemical production materials and livestock and poultry manure, mainly CH4 from ruminant gastrointestinal fermentation and CH4 and N2O from livestock and poultry manure treatment, make livestock production a major source of carbon emissions. According to the survey data in 'Huge Shadows of Livestock: Environmental Issues and Choices', the CO2 equivalent of carbon emissions from cattle, sheep, horses, camels, pigs and poultry alone account for 18% of global anthropogenic carbon emissions each year [3]. The Chinese government attaches great importance to building an ecological civilisation and is committed to reducing carbon emissions in animal husbandry and developing green and low-carbon sustainable animal husbandry. In June 2022, the National Development and Reform Commission of the Ministry of Agriculture and Rural Affairs issued the "Implementation Plan for Emission Reduction and Carbon Sequestration in Agriculture and Rural Areas" to clearly focus on six tasks, such as energy conservation and emission reduction in the plant industry, and emission reduction and carbon sequestration in animal husbandry [4]. The scheme requires the promotion of precision feeding technology, the promotion of variety improvement, the improvement of livestock and poultry yield per unit area and feed reward, and the reduction of ruminant enteric methane emission intensity. Improve the level of resource utilisation of livestock and poultry manure and reduce methane and nitrous oxide emissions from livestock and poultry manure management. Therefore, the low-carbon emission reduction of animal husbandry is very important to achieve carbon neutrality, and the high-quality green and low-carbon development of animal husbandry is imperative.
At present, the related fields of greenhouse gas emissions from animal husbandry mainly focus on the measurement, spatial and temporal characteristics and influencing factors of carbon emissions from animal husbandry. On the one hand, the measurement of carbon emissions from animal husbandry is of great importance for clarifying the sources, emissions and structural characteristics of carbon emissions from animal husbandry. Zhuang et al. and Gao et al. used the IPCC emission factor method to measure the non-CO2 greenhouse gas emissions of five types of livestock and poultry in China's animal husbandry, and the emissions of CH4 and N2O from the enteric fermentation and manure management of dairy cows and beef cattle [5,6]. Rehman A et al. used the emission factor method to study agricultural GHG emissions in Pakistan and found that GHG emissions from animal husbandry accounted for more than half of the total agricultural GHG emissions [7]. LCA is a method, based on the IPCC emission factor method, used to assess the direct or indirect environmental impacts of all outputs and inputs associated with activities, services, processes or products throughout their life cycle [8]. This method extends the calculation chain of greenhouse gas emissions and makes the calculation of greenhouse gas emissions more comprehensive. Weiss F used the LCA method to study the greenhouse gas emissions of livestock production in 27 countries of the European Union [9]. Xu et al. used LCA and the spatial Durbin model to study the impact of industrial agglomeration on carbon emissions from dairy farming [10]. Using the LCA method, Yao et al. revealed the development characteristics of carbon emissions from livestock production in China in terms of both time and space [11]. Xue et al. used LCA method to analyse and evaluate the carbon emission reduction stock of biogas-based circular economy model and traditional linear model in large-scale pig farms in Liaoning Province [12]. On the other hand, the academic community has extensively discussed the influencing factors of GHG emissions from animal husbandry. Dai et al. believe that the adjustment of agricultural structure, the increase of wealth and the growth of population are important factors for the increase of carbon emissions [13]. Cai et al. recognised that environmental and economic factors in the provinces have contributed to the decline in the intensity of greenhouse gas emissions from China's animal husbandry [14]. Hao et al. believe that the industrial structure, population and income level of farmers play an important role in promoting carbon emissions from livestock production [15].
In the context of the development of green and low-carbon animal husbandry, we found that most scholars' research mainly focused on the national level and less on provincial carbon emissions by combing the relevant literature. However, as a major animal husbandry province in China, Shandong Province ranks at the top of the country all year round. According to 2023 data, the total output of meat, eggs and milk in Shandong Province is 16.856 million tonnes, an increase of 6.62% year on year, and the total output value is 297.368 billion yuan. With the rapid development of animal husbandry, all kinds of wastes generated in the process of livestock and poultry breeding have rapidly become the main source of agricultural pollution. The environmental pollution problems have become increasingly prominent, resulting in a large amount of carbon emissions, which seriously affects the realisation of the goal of carbon neutrality. Therefore, it is of great importance to understand the spatial distribution and dynamic development of carbon emissions from animal husbandry in Shandong Province for the rational formulation of policies to reduce carbon emissions from animal husbandry. However, there are relatively few studies on the spatial distribution and dynamic evolution of livestock carbon emissions. Among them, Shi et al. used the kernel density estimation method to investigate the regional differences in animal husbandry carbon emissions and the dynamic evolution of their distribution [16]. However, there are some problems, such as insufficient research on the internal dynamics of regional livestock carbon emission distribution and strong subjectivity. Based on this, this paper uses the panel data of 16 prefecture-level cities in Shandong Province of China from 2001 to 2022, and uses the life cycle assessment method to measure the carbon emissions of animal husbandry in each prefecture-level city. Based on the spatial analysis of visualization technology and the kernel density estimation method in non-parametric method, the spatial distribution and dynamic evolution of animal husbandry carbon emissions in Shandong Province are systematically investigated, which can more rigorously and intuitively reflect the internal dynamics of regional animal husbandry carbon emission distribution.
2. Materials and Methods
2.1. Calculation of Animal Husbandry Carbon Emissions
Based on the research of Dai et al., this study classified the carbon emissions generated in the life cycle of animal husbandry into three subsystems according to the characteristics of animal husbandry production, namely, feed grain transport system, energy consumption system, and gastrointestinal fermentation and manure management system [17]. The gases of livestock carbon emissions mainly include CO2, CH4 and N2O [18]. To facilitate the calculation of carbon emissions, all carbon emissions in this study were converted to CO2-eq according to the global warming potential (GWP).

Table 1.
Carbon emission factors of gastrointestinal fermentation and manure management system of livestock and poultry.
Table 1.
Carbon emission factors of gastrointestinal fermentation and manure management system of livestock and poultry.
| Species | CH4[kg/(head. a)] | N2O [kg/(head. a)] | Reference Source | |
|---|---|---|---|---|
| Gastrointestinal fermentation | Manure management | |||
| Cattle | 52.90 | 3.31 | 0.85 | Zheng et al., (2022) [19] |
| Mule | 10.00 | 0.90 | 1.39 | Yao et al., (2017) [11] |
| Donkey | 10.00 | 0.90 | 1.39 | |
| Horse | 18.00 | 1.64 | 1.39 | |
| Pig | 1.00 | 3.50 | 0.53 | |
| Sheep | 5.00 | 0.16 | 0.33 | |
| Rabbit | 0.254 | 0.08 | 0.02 | |
| Poultry | 0.00 | 0.02 | 0.02 | |
2.1.1. Feed Grain Input System
The system includes two links: the cultivation of feed grains and the processing and transport of feed grains. Soya, maize and wheat in concentrates are the main sources of livestock and poultry feed. As roughage is a by-product of primary processing, its carbon emissions are minimal. It is therefore not included in this study. Corn, soybeans, wheat and other feed raw materials produced from crops must be processed through various processes to become feed, and the carbon emissions from this link should also be included in the boundary of the livestock system. The formula for calculating CO2 emissions from the cultivation, processing and transport of feed grains is as follows:
Where: ETZ is the CO2 emission caused by the cultivation of feed grain; ETY is the CO2 emission from feed grain processing and transportation; QT is the annual output of T-type livestock and poultry products.; t is the consumption coefficient of unit livestock and poultry products; qi is the proportion of grain in the feed formula of class i livestock and poultry. efj1 is the CO2 equivalent emission coefficient of type j grain, efj2 is the CO2 equivalent emission coefficient of type j grain processing and transportation (Table 2).
2.1.2. Energy Consumption System
The system includes two links: livestock and poultry breeding energy consumption and slaughtering and processing. In the process of raising livestock and poultry, a large amount of electricity, coal and other energy will be consumed, which will directly or indirectly cause carbon emissions [24]. The amount of CO2 produced by livestock and poultry feeding can be calculated according to the following formula:
Where: ETW is the CO2 emission caused by the energy consumption of livestock and poultry production; i is the category of livestock and poultry breeding; NAPAi is the annual production of category i livestock and poultry; costie is the electricity expenditure per head (only) of type I livestock and poultry; pricee is the unit price of electricity for livestock and poultry breeding; efe is the CO2 emission coefficient of power consumption; costic is the expenditure of coal per head ( only ) of livestock and poultry in category i; pricec is the unit price of coal for livestock and poultry breeding; efc is the CO2 emission coefficient of coal consumption (Table 2).
Energy consumption in the process of livestock and poultry slaughtering and processing also needs to be included. Livestock and poultry must be disinfected, pack-aged and processed into livestock products in order to be sold as commodities in the market. Carbon emissions will also be generated in this process. The calculation formula is as follows:
Where: ETR is the CO2 emission from livestock and poultry slaughtering and processing; QT is the annual output of T-type livestock products; MJu is the energy consumption of slaughtering and processing of animal products per unit of u; en is the calorific value of one degree of electricity; efe is the CO2 emission coefficient of power consumption (Table 2).
2.1.3. Gastrointestinal Fermentation and Feces Management System
The gastrointestinal tract of livestock and poultry plays a role under anaerobic conditions. The rumen fermentation of ruminants produces a large amount of CH4 gas, which is the main source of CH4 emissions [25]. The calculation formula of CH4 emissions from gastrointestinal fermentation of livestock and poultry is as follows:
Where: ETD is the CH4 emission from gastrointestinal fermentation of livestock and poultry; i is the category of livestock and poultry breeding; APPi is the annual average feeding amount of i-type livestock and poultry; efi1 is the CH4 emission factor of gastrointestinal fermentation of livestock and poultry (Table 1).
The degradation of livestock and poultry manure under anaerobic conditions will produce CH4 gas. At the same time, the nitrogen contained in the manure will undergo nitrification and denitrification, and the nitrogen contained in the protein in the manure will be converted into N2O gas. [26,27,28,29] Calculating the carbon emissions of the manure management system includes the following two steps.
Where: ETQ and ETK are CH4 and N2O emissions from livestock and poultry manure management system, respectively. i is the category of livestock and poultry breeding; APPi is the annual average feeding amount of i type livestock and poultry; efi2 and efi3 are CH4 and N2O emission factors of livestock manure management system (Table 1).
2.1.4. Total Animal Husbandry Carbon Emissions
According to the life cycle assessment method, the total GHG emissions from the livestock sector are calculated using the formula:
Where: ETotal is the total carbon emissions of animal husbandry life cycle measured by CO2 equivalent; ETZ, ETY, ETD, ETW and ETR represent the production of feed grain planting, feed grain processing and transportation, livestock and poultry gastrointestinal fermentation, livestock and poultry breeding energy consumption, livestock and poultry slaughtering and processing, respectively. ETQ and ETK are CH4 and N2O emissions from the fecal management system; is the global warming potential of CH4, taking 21, is the global warming potential, taking 310 [22].
2.2. Kernel Density Estimation
In this study, Stata17 software was used to study the dynamic evolution of carbon emissions from animal husbandry in Shandong Province by kernel density estimation [30]. Kernel density estimation is a non-parametric test method used to describe the distribution of variables. It does not need to establish a function form, and can use a continuous curve to describe the change of variables. The formula of kernel density estimation is as follows:
where n is the number of observed samples; h denotes bandwidth; xi represents the carbon emissions of animal husbandry in city i; k (-) represents the kernel function, that is, the weight function. When the form of the function cannot be determined, the Gaussian kernel function is superior to other kernel functions. Therefore, this paper uses the Gaussian kernel function to analyze the dynamic evolution of animal husbandry carbon emissions in Shandong Province, so as to estimate the overall distribution of animal husbandry carbon emissions. The Gaussian kernel function formula is as follows:
2.3. Data Sources
The research scope of animal husbandry in this paper includes livestock and poultry, such as pigs, cattle, sheep and poultry, which provide animal food such as meat, eggs and milk. Livestock species that provide industrial raw materials such as hair, skin, and bone are not included in the study due to missing data. The research links include the whole process of pre-production, mid-production and post-production of animal husbandry, namely, feed grain acquisition, livestock and poultry breeding, product processing and transportation. The data of cattle, pigs, sheep, poultry, milk, pork, beef, mutton, poultry and eggs were from 'Shandong Statistical Yearbook' and 'China Rural Statistical Yearbook'. The data of grain consumption, main product output, electricity cost and coal cost of each type of livestock and poultry were from 'National Agricultural Product Cost-Benefit Information Compilation'.
3. Results
3.1. Total Carbon Emissions and Spatial Distribution of Animal Husbandry in Shandong Province
On the basis of referring to the previous literature, Shandong Province is divided into three regions according to the topography, geomorphology and geographical location characteristics of various cities in Shandong Province [31]. Among them, Laiwu City was revoked in 2019 and it was placed under the jurisdiction of Jinan City. Peninsula area: roughly divided into Qingdao, Yantai, Weihai, Weifang, Rizhao and Dongying; luzhong area: roughly divided into Jinan City, Laiwu City, Tai'an City, Zibo City, Linyi City; luxi region: mainly including Liaocheng City, Dezhou City, Binzhou City, Heze City, Jining City and Zaozhuang City.
As shown in Table 3, Linyi, Weifang, Heze and Dezhou are the top five cities with the highest carbon emissions from animal husbandry in 2022. And Liaocheng, carbon emissions reached 461.31, 419.36, 411.81, 357.10 and 318.05 10kt/CO2-eq. In 2022, Weihai, Zaozhuang, Zibo, Rizhao and Tai'an ranked the last five cities in terms of total animal husbandry carbon emissions, with carbon emissions of 80.75, 82.38, 104.75, 118.42 and 150.20 10kt/CO2-eq, respectively. In general, the carbon emissions of animal husbandry in Shandong Province (city) from 2001 to 2022 showed a fluctuating downward trend, but there were big differences in the increase and decrease of carbon emissions of animal husbandry in various prefecture-level cities. Among them, the cities with a decrease in carbon emissions from animal husbandry compared to 2001 were concentrated in Jinan, Qingdao, Tai'an, Dezhou, Jining, Liaocheng and Weifang, which decreased by 0.49%, 0.43%, 0.29%, 0.26%, 0.24%, 0.23% and 0.08%, respectively.
The five representative years of 2001, 2006, 2011, 2016 and 2022 were selected to analyse the spatial distribution of animal husbandry carbon emissions in Shandong Province. As shown in Figure 1, the carbon emissions from animal husbandry in different prefecture-level cities in Shandong Province showed a "dispersion-agglomeration" distribution pattern. From 2001 to 2022, the regions with more carbon emissions from animal husbandry in Shandong Province are mainly concentrated in the peninsula and western Shandong, including Weifang, Dezhou, Heze and other prefecture-level cities, which are all areas with agriculture as the main industry. In these three cities, livestock production is highly developed, especially in pig and cattle farming. At the same time, livestock carbon emissions in Linyi City in the central region of Shandong Province have increased significantly, which means that the distribution of livestock carbon emissions shows an 'agglomeration' from 'dispersed' prefecture-level cities to the central zone. The reason for this is that, on the one hand, Shandong Province, as the main grain producing area in China, has a large proportion of carbon emissions from winter wheat and corn in the carbon emission sources of agricultural land use. This is because winter wheat and maize are the main food crops grown in Shandong Province. Their cultivated area is large, and tillage methods and fertiliser levels have a greater impact on soil carbon emissions. On the other hand, as people's living standards have improved, the demand for livestock products has increased and the scale of livestock production has continued to expand. The value of livestock production in 2022 is 4.6 times higher than in 2001, and the share of carbon emissions is also increasing. Among them, the carbon emissions of pig, poultry and other breeding are higher, resulting in a significant increase in the carbon emissions of animal husbandry in Weifang, Linyi and other cities.
3.2. Carbon Emission Intensity and Spatial Distribution of Animal Husbandry in Shandong Province
Based on the calculation of livestock carbon emissions, this paper uses livestock carbon emission intensity as an indicator to measure the level of livestock carbon emissions. It is obtained from the ratio of regional livestock carbon emissions to the region's livestock GDP (i.e. livestock GDP), i.e. the carbon emissions released per unit of GDP. Carbon emission intensity is the most direct indicator of the relationship between regional economic development and carbon emissions. In theory, the lower the carbon emission intensity, the better. It represents the reduction of the increase in carbon emissions caused by the same amount of GDP output, and also indicates that with the development of the economy, the economic structure and the level of science and technology become more and more advanced [32].
Combined with the gross value of animal husbandry in each prefecture-level city, the carbon emission intensity of animal husbandry is calculated. As shown in Table 4, the top five cities of animal husbandry carbon emission intensity in Shandong Province in 2022 are Heze, Liaocheng, Binzhou, Linyi and Dezhou, and the carbon emission intensity of animal husbandry is 1.87, 1.63, 1.57, 1.52 and 1.42 ton/ten thousand yuan, respectively. In 2022, the top five cities of livestock carbon emission intensity in Shandong Province were Tai'an, Jining, Rizhao, Jinan and Zaozhuang, and the livestock carbon emission intensity was 0.86, 0.93, 0.97, 1.12 and 1.13 ton/ten thousand yuan, respectively. In general, the carbon emission intensity of animal husbandry in Shandong Province (city) from 2001 to 2022 showed different degrees of decrease. Among them, the cities with the largest decrease in livestock carbon emission intensity compared to 2001 were Dezhou, Tai'an and Jinan, with decreases of 0.88%, 0.86% and 0.85%, respectively.
Five representative years, 2001, 2006, 2011, 2016 and 2022, were selected to analyse the spatial distribution of the carbon emission intensity of animal husbandry in Shandong Province, as shown in Figure 2. According to the carbon emission intensity of animal husbandry, all cities are divided into five categories. The comparison shows that the carbon emission intensity of animal husbandry in Shandong Province has a ladder-like distribution, characterized by high in the west and low in the east. The carbon emission intensity in western and central Shandong is significantly higher than in the peninsula. Taking 2022 as an example, the carbon emission intensity of animal husbandry in different prefecture-level cities in Shandong Province shows three obvious steps. The first tier is Heze City in the western region of Shandong Province; the second tier is mainly concentrated in most areas of western Shandong and small areas of central Shandong, including Linyi, Liaocheng, Dezhou and Binzhou. The third ladder is mainly concentrated in the peninsula area, including Yantai, Weihai, Qingdao, Rizhao and other six prefecture-level cities. Although the carbon emission intensity of animal husbandry in Shandong prefecture-level cities showed a decreasing trend from 2001 to 2022, there were large differences between cities. Compared with 2001, the carbon emission intensity of animal husbandry in western Shandong, represented by Heze, Liaocheng, Dezhou and Binzhou, and in central Shandong, represented by Linyi and Zibo, was significantly higher than the provincial average in 2022, while the carbon emission intensity of animal husbandry in most parts of the peninsula was significantly lower than the provincial average. The main reason is that high-carbon livestock production in the western region of Shandong Province is growing rapidly, while high-carbon livestock production in the peninsula region, which is one of the economically developed areas of Shandong Province, is relatively reduced. People's awareness of green environmental protection and acceptance of low-carbon green technologies are higher in areas with higher economic levels than in economically underdeveloped areas, while people's awareness of low-carbon environmental protection and acceptance of low-carbon green technologies are similar between regions and people. The difference in economic level reveals the difference in low-carbon economic transformation between regions. While the total output value of animal husbandry has increased significantly in all regions, the decrease in the carbon emission intensity of animal husbandry in central Shandong is more pronounced than in the peninsula.
3.3. Kernel Density Estimation of Animal Husbandry Carbon Emissions
According to the above formula, the kernel density estimation of animal husbandry carbon emissions in Shandong Province and Luzhong, Peninsula and Luxi regions is carried out (see Figure 3) to analyze the dynamic evolution of animal husbandry carbon emissions. Figure 3 (A) The overall evolution characteristics of the kernel density curve of animal husbandry carbon emissions in the province are as follows: (1) From 2001 to 2022, the kernel density curve of animal husbandry carbon emissions in the province moved to the right along the horizontal axis as a whole, indicating that during this period, the animal husbandry carbon emissions of cities in the province gradually decreased. (2) From the peak of the nuclear density curve of animal husbandry carbon emissions in the province, it can be seen that in these 22 years, the peak of the nuclear density curve has obviously moved upward for a certain distance. The peak is flat and wide, and the graphic changes reflect that the regional gap of animal husbandry carbon emissions in 16 cities of the province from 2001 to 2022 gradually expands with the change of time. (3) From the perspective of the number of peaks, the carbon emissions of animal husbandry in 16 cities in the province from 2001 to 2022 basically showed a 'bimodal' pattern, which reflects that although the regional differences in the carbon emissions of animal husbandry in 16 cities in the province have continued to expand during the 22 years, the differences in each city are mainly characterized by polarization.
The evolution trend of carbon emissions from animal husbandry in the peninsula region from 2001 to 2022: From Figure 3 (B), the overall evolution characteristics of the nuclear density estimation curve of animal husbandry carbon emissions in the peninsula region are as follows: (1) The centre of the nuclear density curve of animal husbandry carbon emissions from 2001 to 2022 is shifted from left to right as a whole, which reflects that animal husbandry carbon emissions in the cities of the Peninsula region have increased in the past 22 years. (2) In 2022, compared to 2001, the peak height of the core density curve as a whole has shifted significantly upwards. Compared to the base period, the width of the peak in 2022 is significantly reduced, from the 'flat wide type' in 2001 to the 'sharp narrow type' in 2022. This reflects a significant increase in the peak value of carbon emissions from livestock in cities in the Peninsula region from 2001 to 2021, but the carbon emissions gap between cities gradually decreases over time. (3) The number of peaks in 2001 was 'one main one time', showing a polarisation trend. In 2022, the shape of the nuclear density curve of animal husbandry carbon emissions changed significantly, from the double peak shape of 'one main one time' to a single peak, indicating that the difference in total animal husbandry carbon emissions in the peninsula from 2001 to 2022 gradually narrowed, and the phenomenon of polarisation weakened.The evolution trend of livestock carbon emissions in central Shandong from 2001 to 2022: It can be seen from Figure 3 (C) that the overall evolution characteristics of the nuclear density estimation curve of animal husbandry carbon emissions in the peninsula are as follows: (1) The centre of the nuclear density curve of animal husbandry carbon emissions from 2001 to 2022 shifts to the right as a whole, which reflects that in the past 22 years, the animal husbandry carbon emissions of cities in central Shandong first increased and then decreased. (2) From the perspective of peak height, the core density curve from 2001 to 2022 shows a downward trend and then an upward trend, indicating that the differences in animal husbandry carbon emissions between cities showed a fluctuating change from high to low. (3) The number of peaks in 2001 was "one main and two times", showing a three-level differentiation trend. In 2022, the core density curve of animal husbandry carbon emissions in central Shandong gradually evolved into a two-level differentiation pattern of "one main", indicating that the carbon emissions gap between cities in central Shandong widened significantly from 2001 to 2022, showing a gradual evolution from multi-level differentiation to two-level differentiation.
Figure 3 (D) shows the evolution trend of animal husbandry carbon emissions in Luxi region from 2001 to 2022: (1) From 2001 to 2022, the kernel density curve of animal husbandry carbon emissions in Luxi region shifts from right to left as a whole, which shows that the carbon emissions of each city in Luxi region have decreased. (2) From 2001 to 2016, the height of the peak showed a downward trend, rising to the highest point in 2021, indicating that the difference in animal husbandry carbon emissions of cities in the western region showed a fluctuating change from high to low. The width of the peak was significantly reduced from "flat type" to "sharp narrow type", indicating that the difference in carbon emissions between cities in the western region gradually narrowed over time. (3) The number of peaks in 2001 was one main peak, while there were double peaks in 2022, indicating that the carbon emissions of animal husbandry in western Shandong gradually showed a trend of polarisation during the study period.
4. Conclusions and Policy Recommendations
4.1. Conclusion
By measuring the carbon emissions of animal husbandry in Shandong Province from 2001 to 2022, and combining spatial and non-parametric estimation methods, this paper examines the spatial differentiation and dynamic evolution of carbon emissions from animal husbandry in Shandong Province, and draws the following conclusions:
(1) The carbon emissions of animal husbandry in Shandong Province are distributed in a 'dispersion-agglomeration' mode. From 2001 to 2022, the areas with more carbon emissions from animal husbandry in Shandong Province were mainly concentrated in the peninsula and Luxi. From the perspective of the changing trend, the carbon emission of animal husbandry in Shandong Province has gradually gathered from Weifang and other prefecture-level cities in the peninsula region to Linyi City in the central region of Shandong Province.
(2) The carbon emission intensity of animal husbandry in Shandong Province is declining. From 2001 to 2022, the carbon emission intensity of animal husbandry in Shandong showed different degrees of decline, but there were great differences among cities. Among them, the carbon emission intensity in western and central Shandong was significantly higher than that in the peninsula, and the carbon emission intensity of animal husbandry in 16 cities in Shandong showed a more obvious ladder-like distribution of 'high in the west and low in the east'.
(3) Through the analysis of the dynamic evolution of nuclear density, we observed that the regional differences in carbon emissions from animal husbandry in Shandong Province were expanding, showing the characteristics of polarization ; the differences between the cities in the peninsula area have gradually narrowed from the expansion, and the phenomenon of polarization has weakened ; the carbon emission gap between cities in the central region of Shandong has expanded significantly, showing a pattern of gradual evolution from multi-level differentiation to two-level differentiation. The carbon emissions of animal husbandry in the western region of Shandong gradually showed a trend of polarization.
4.2. Policy Proposal
Based on the above conclusions, this paper proposes the following policy recommendations to reduce the carbon emissions of animal husbandry in Shandong Province and help the country achieve the "double carbon" goal. First, clearly understand the differences in animal husbandry carbon emissions in Shandong Province and reduce animal husbandry carbon emissions. Cities with low carbon emissions should play a leading role in reducing carbon emissions, explore efficient development models, establish low-carbon breeding demonstration areas, and promote the learning and imitation of livestock and poultry breeding in surrounding cities through talent exchange, experience learning, and low-carbon breeding technology promotion. Promote the improvement of the level of livestock and poultry breeding, achieve low pollution, emission reduction, and achieve green and sustainable development of animal husbandry. Second, governments at all levels should pay more attention to the sources of differences, formulate policies in line with the actual situation in the region to promote the reduction of animal husbandry carbon emissions, strengthen animal husbandry financial support policies, promote the utilization of livestock and poultry manure and other resources, and strive to create a fair and reasonable policy environment for animal husbandry carbon emission reduction. Third, according to local conditions to promote animal husbandry carbon emission reduction The cities of Shandong Province should combine local resource endowment conditions, give full play to their comparative advantages, actively adjust the industrial structure of animal husbandry, explore the key factors affecting animal husbandry carbon emissions, and maximize animal husbandry carbon emission reduction, while achieving stable development of animal husbandry.
In this paper, the calculation of carbon emissions is restricted by the availability of data. For example, the calculation of the average cost of coal and electricity generated by cattle breeding leads to a certain deviation in the calculation results. Future research can use more accurate methods, such as using more data or conducting specific analysis based on prefecture-level city data, to obtain more accurate results; in addition, this paper does not consider other factors that cause the carbon emissions of animal husbandry in Shandong Province. These factors need to be more fully considered and improved in the next study.
Author Contributions
Conceptualization, Formal analysis, and Writing – review & editing, C.W.; Conceptualization, Methodology, Validation, Writing – original draft, and Manuscript preparation, Y.S.; Software development, Data curation, and Writing – review & editing, Y.H. and J.L.; Writing – review & editing, Y.Q. All authors have read and agreed to the published version of the manuscript.
Funding
This research did not receive any specific grant from funding agencies in the public, commercial, or not-for-profit sectors.
Institutional Review Board Statement
Not applicable.
Informed Consent Statement
Not applicable.
Data Availability Statement
The data used to support the findings of this study are available from the corresponding author upon reasonable request.
Acknowledgments
We extend our heartfelt appreciation to our mentors for their invaluable insights during each group meeting. We are also grateful to all the lab members for their contributions and engaging discussions during these sessions.
Conflicts of Interest
The authors declare that they have no known competing financial interests or personal relationships that could have appeared to influence the work reported in this paper.
References
- Fan, H.; Chen, K.; Ma, H.; He, J.; Li, H.; Yang, Z.; Wu, Q.; Zhang, C.; Zhang, S.; Huang, T.; Gao, H. Carbon footprints in pork production and consumption in China from 2005 to 2020. J. Clean. Prod. 2023, 419, 138252. [Google Scholar] [CrossRef]
- EDGAR - Emissions Database for Global Atmospheric Research. Available online: https://edgar.jrc.ec.europa.eu/report_2023 (accessed on 19 December 2023).
- Steinfeld, H.; Gerber, P.J.; Wassenaar, T.; Castel, V.; Rosales, M.; De Haan, C. Livestock’s Long Shadow: Environmental Issues and Options; FAO: Rome, Italy, 2006. [Google Scholar]
- Huo, L.; Yao, Z.; Zhao, L.; Luo, J.; Zhang, P. Current status and system construction of emission reduction and carbon sequestration standards in China's agriculture and rural areas. Trans. Chin. Soc. Agric. Env. Sci. 2023, 42, 242–251. [Google Scholar] [CrossRef]
- Zhuang, M.; Lu, X.; Caro, D.; Gao, J.; Zhang, J.; Cullen, B.; Li, Q. Emissions of non-CO2 greenhouse gases from livestock in China during 2000–2015: Magnitude, trends and spatiotemporal patterns. J Environ Manage. 2019, 242, 40–45. [Google Scholar] [CrossRef] [PubMed]
- Gao, Z.; Lin, Z.; Yang, Y.; Ma, W.; Liao, W.; Li, J.; Cao, Y.; Roelcke, M. Greenhouse gas emissions from the enteric fermentation and manure storage of dairy and beef cattle in China during 1961–2010. Environ Res. 2014, 135, 111–119. [Google Scholar] [CrossRef]
- Rehman, A.; Ma, H.; Ozturk, I.; Ahmad, M. Examining the carbon emissions and climate impacts on main agricultural crops production and land use: updated evidence from Pakistan. Environ Sci Pollut Res Int. 2022, 29, 868–882. [Google Scholar] [CrossRef]
- Cheng, M.; Yao, W. Trend prediction of carbon peak in China's animal husbandry based on the empirical analysis of 31 provinces in China. Environ. Dev. Sustain. 2022, 1–18. [Google Scholar] [CrossRef]
- Weiss, F.; Leip, A. Greenhouse gas emissions from the EU livestock sector: a life cycle assessment carried out with the CAPRI model. Agric Ecosyst Environ. 2012, 149, 124–134. [Google Scholar] [CrossRef]
- Xu, J.; Wang, J.; Wang, T.; Li, C. Impact of industrial agglomeration on carbon emissions from dairy farming—Empirical analysis based on life cycle assessmsent method and spatial durbin model. J. Clean. Prod. 2023, 406, 137081. [Google Scholar] [CrossRef]
- Yao, C.; Qian, S.; Mao, Y.; Li, Z. Decomposition of impacting factors of animal husbandry carbon emissions change and its spatial differences in China. Transac Chin Soc Agri Eng. 2017, 33, 10–9. [Google Scholar] [CrossRef]
- Xue, Y.; Luan, W.; Wang, H.; Yang, Y. Environmental and economic benefits of carbon emission reduction in animal husbandry via the circular economy: case study of pig farming in Liaoning, China. J. Clean. Prod. 2019, 238, 117968. [Google Scholar] [CrossRef]
- Dai, X.; Sun, Z.; Muller, D. Driving factors of direct greenhouse gas emissions from China’s pig industry from 1976 to 2016. J. Integr. Agric. 2021, 20, 319–329. [Google Scholar] [CrossRef]
- Cai, T.; Xia, F.; Yang, D.; Huo, J.; Zhang, Y. Decomposition of factors affecting changes in non-CO2 greenhouse gas emission intensity of China's livestock sector based on the concept of “environment–food–economy”. Sci. Total Environ. 2019, 691, 611–620. [Google Scholar] [CrossRef]
- Hao, D.; Wang, R.; Gao, C.; Song, X.; Liu, W.; Hu, G. Spatial-Temporal Characteristics and Influence Factors of Carbon Emission from Livestock Industry in China. Int. J. Environ. Res. Public Health. 2022, 19, 14837. [Google Scholar] [CrossRef]
- Shi, R.; Irfan, M.; Liu, G.; Yang, X.; Su, X. Analysis of the impact of livestock structure on carbon emissions of animal husbandry:A sustainable way to improving public health and green environment. Front. Public Health. 2022, 10, 835210. [Google Scholar] [CrossRef] [PubMed]
- Dai, X.; Li, J.; He, Y.; Wang, F. Regional equity and efficiency of carbon emissions of China's livestock industry in 2000-2020. Resources Science, 2023, 45, 62–76. [Google Scholar] [CrossRef]
- Raghavendra, B.; Malik, P.; Prasad, C. Enteric methane emission: status, mitigation and future challenges-an Indian perspective//Livestock production and climate change; CABI: Wallingford, UK, 2015; pp. 229–244. [Google Scholar] [CrossRef]
- Zheng, B.; Liang, H.; Wan, W.; Liu, Z.; Zhu, J.; Wu, Z. Spatial-temporal pattern and influencing factors of agricultural carbon emissions at the county level in Jiangxi Province of China. Trans. Chin. Soc. of Agric. Eng. 2022, 38, 70–80. [Google Scholar]
- Xie, H.; Chen, X.; Yang, M.; Zhao, H.; Zhao, M. Ecological footprint analysis of livestock products in China. Acta. Ecol. Sin. 2009, 29, 3264–3270. [Google Scholar]
- Tan, Q. Greenhouse gas emission in China's agriculture: situation and challenge. China Popul. Resour. Environ. 2011, 21, 69–75. [Google Scholar]
- Meng, X.; Cheng, G.; Zhang, J.; Wang, N.; Zhou, H. Spatial and temporal characterization of greenhouse gas emissions over the whole life cycle of animal husbandry in China. China Environ. Sci. 2014, 34, 2167–2176. [Google Scholar]
- Sun, Y.; Liu, J.; Ma, Z. Evaluation of greenhouse gas emissions from scale dairy farm1. Trans. Chin. Soc. Agric. Eng. 2010, 26, 296–301. [Google Scholar]
- Li, Y.; Wang, J.; Yang, L. Spatial and temporal characterization of agricultural carbon emissions in Hunan Province based on county scale. China Agric. Resour. Zoning 2022, 43, 75–84. [Google Scholar]
- Zhu, Z.; Wang, Y.; Yan, T.; Zhang, Z.; Wang, S.; Dong, H. Greenhouse gas emissions from livestock in China and mitigation options within the context of carbon neutrality. Front Agric Sci Eng. 2023, 0. [Google Scholar] [CrossRef]
- Misselbrook, T.; Webb, J.; Chadwick, D.; Ellis, S.; Pain, B. Gaseous emissions from outdoor concrete yards used by livestock. Atmos. Env. 2001, 35, 5331–5338. [Google Scholar] [CrossRef]
- Wang, Z.; Kong, F.; Pan, D. Analysis of spatial and temporal differences in greenhouse gas emissions from livestock industry in Jiangxi Province - Based on LCA method. J. Poyang Lake 2015, (03), 26–36. [Google Scholar]
- Chen, D.; Li, Y.; Grace, P.; Mosier, A. N2O emissions from agricultural lands: a synthesis of simulation approaches. Plant Soil 2008, 309, 169–189. [Google Scholar] [CrossRef]
- Hallin, S.; Philippot, L.; Löffler, F.; Sanford, R.; Jones, C. Genomics and ecology of novel N2O-reducing microorganisms. Trends Microbiol. 2018, 26, 43–55. [Google Scholar] [CrossRef]
- Liu, D.; Zhu, X.; Wang, Y. China's agricultural green total factor productivity based on carbon emission: an analysis of evolution trend and influencing factors. J. Clean. Prod. 2021, 278, 123692. [Google Scholar] [CrossRef]
- Cui, K. Research on the Analysis of Rural Regional Economic Differences and Coordinated Development in Shandong Province. Master’s thesis, Shandong University of Technology, Shandong, China, 2023. [Google Scholar]
- Zhao, B. Research on carbon emission measurement and spatial-temporal evolution in Henan Province. Master’s thesis, Henan University, Henan, China, 2015. [Google Scholar]
Figure 1.
Changes in total animal husbandry carbon emissions in Shandong Province in 2001,2006,2011,2016 and 2022 (10,000 tons).
Figure 1.
Changes in total animal husbandry carbon emissions in Shandong Province in 2001,2006,2011,2016 and 2022 (10,000 tons).
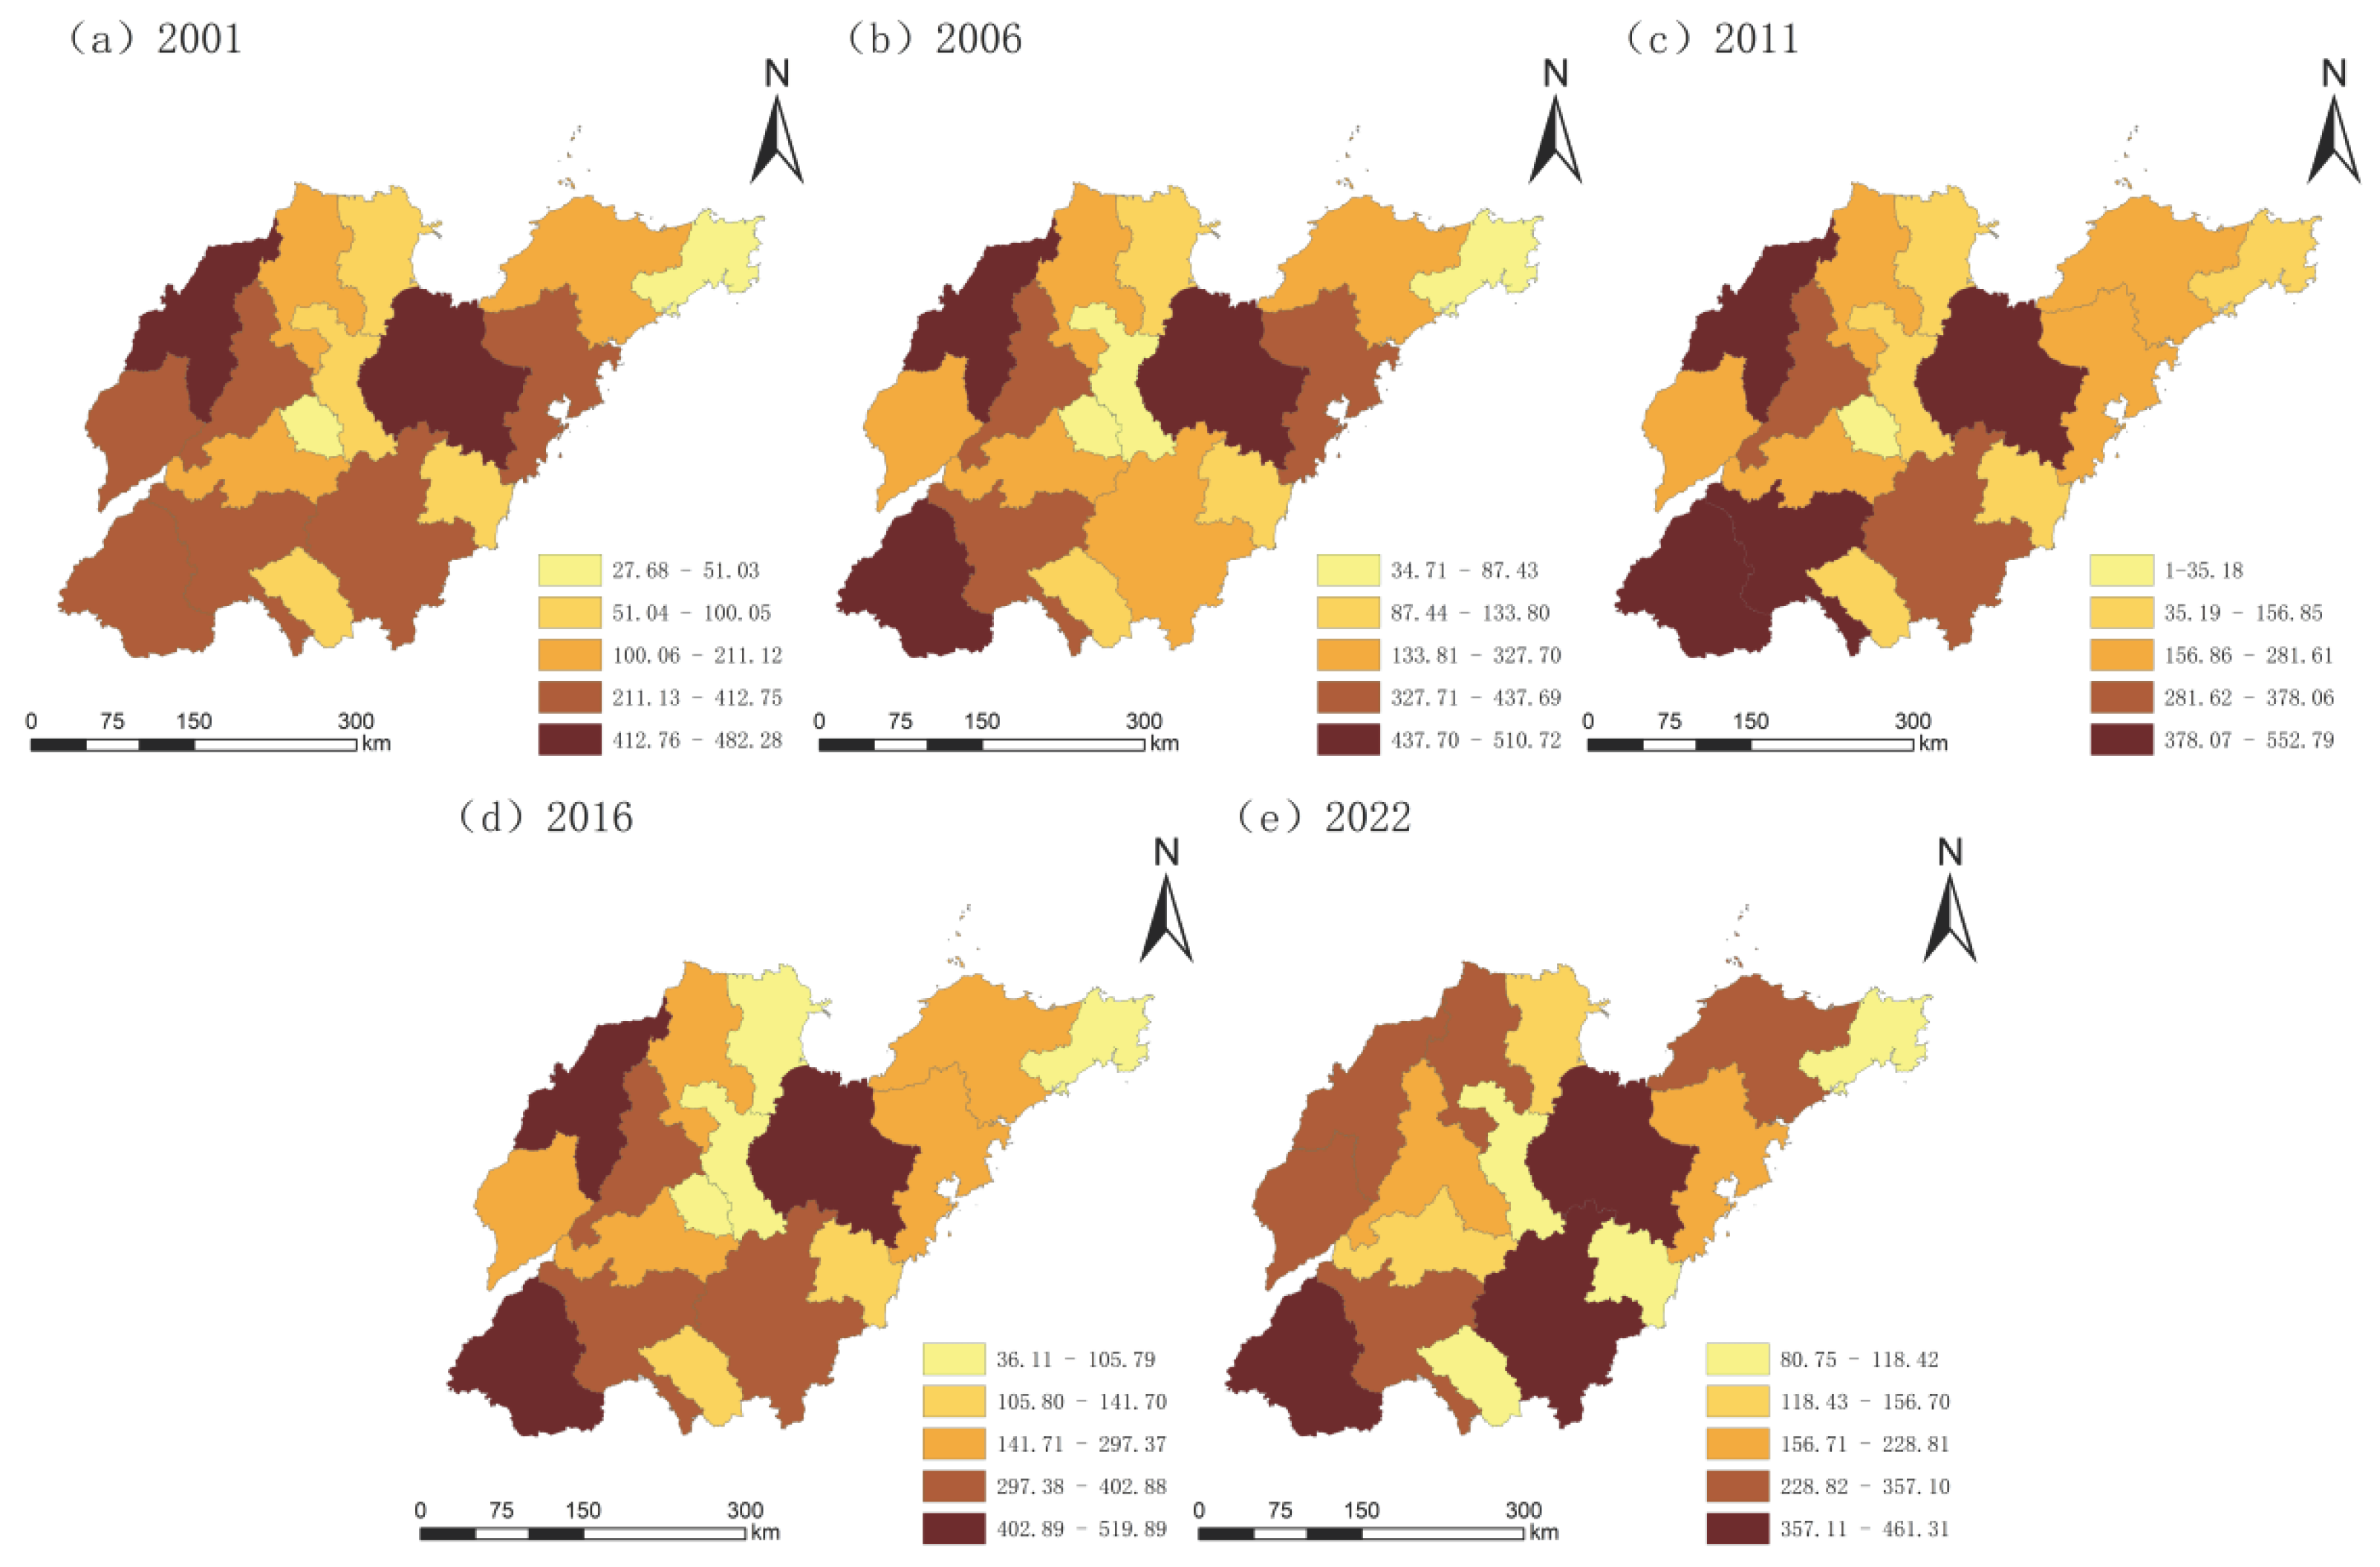
Figure 2.
Changes in carbon emission intensity of animal husbandry in Shandong Province in 2001,2006,2011,2016 and 2022 (ton/ten thousand yuan).
Figure 2.
Changes in carbon emission intensity of animal husbandry in Shandong Province in 2001,2006,2011,2016 and 2022 (ton/ten thousand yuan).
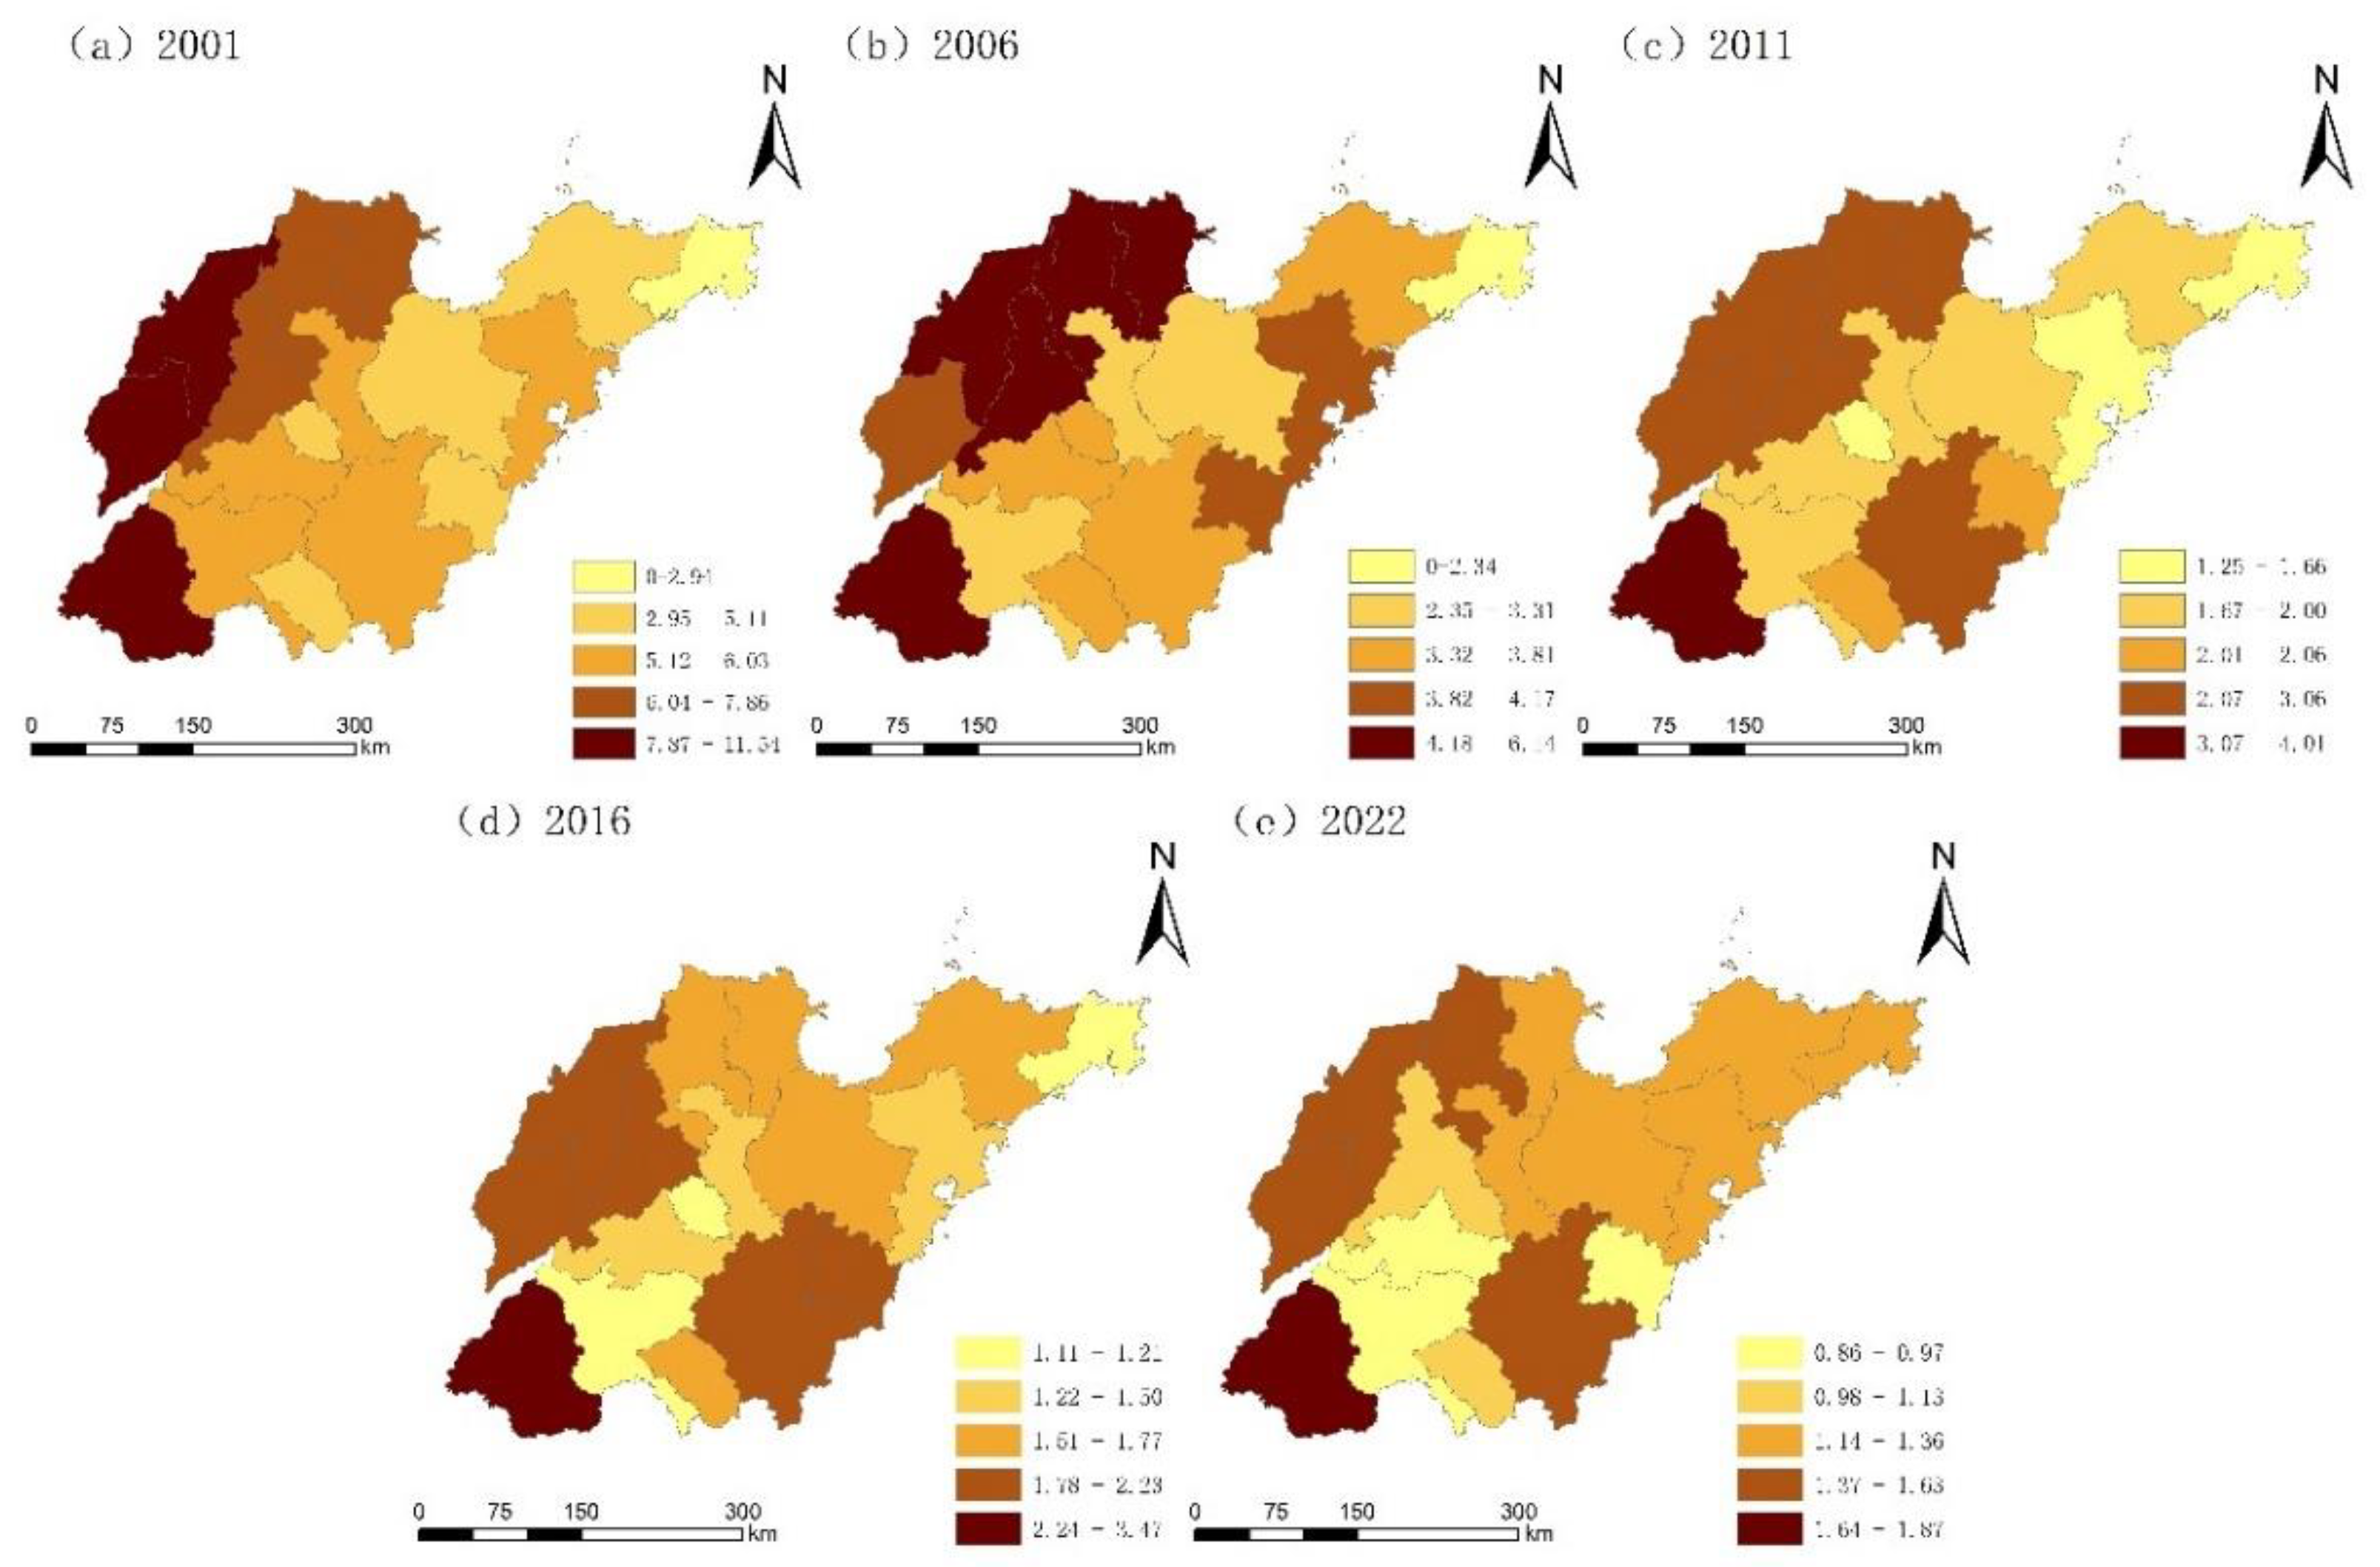
Figure 3.
Kernel density estimation of animal husbandry carbon emissions in Shandong Province and the three major regions. (A) Total area. (B) Peninsular area. (C) Luzhong area. (D) Luxi area.
Figure 3.
Kernel density estimation of animal husbandry carbon emissions in Shandong Province and the three major regions. (A) Total area. (B) Peninsular area. (C) Luzhong area. (D) Luxi area.
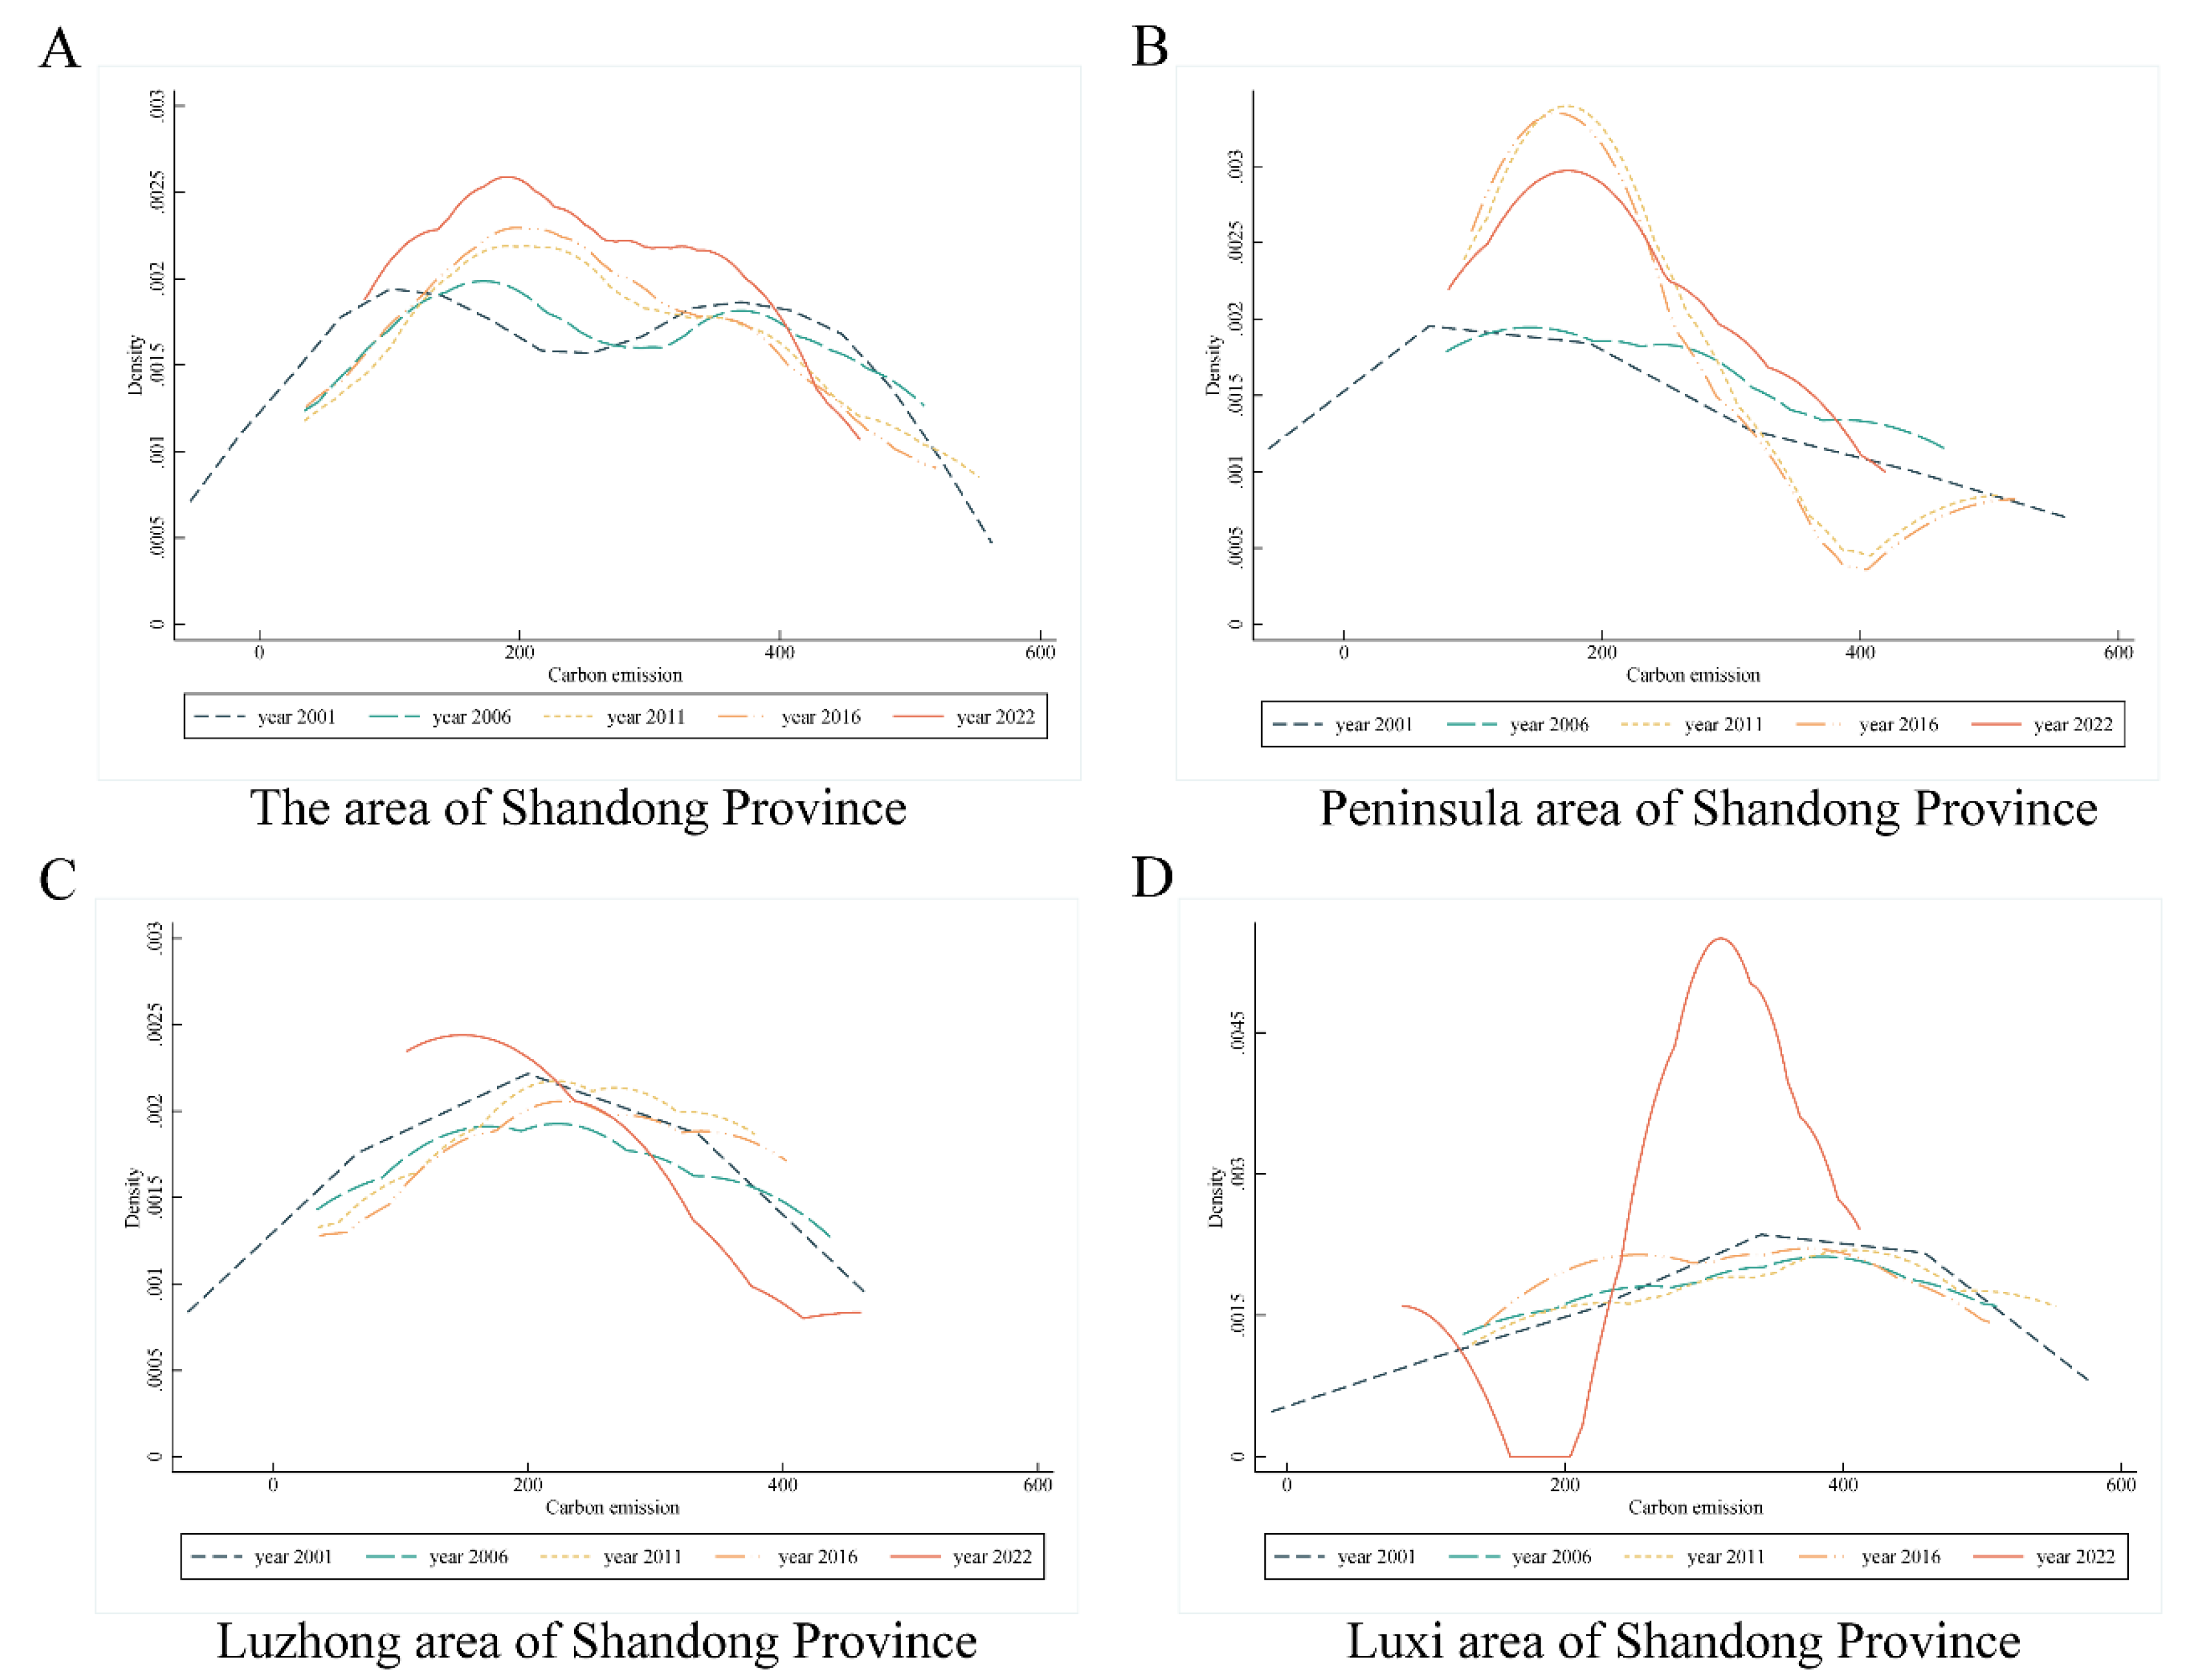
Table 2.
Carbon emission coefficients of each system boundary.
| System | Link | Symbol | Emission coefficient | Values | Unit | Reference Source |
|---|---|---|---|---|---|---|
| Feed grain input | Feed grain cultivation | efj1 | CO2-Equivalent Emission Factor of Corne |
1.50 | t/t | Xie et al., (2009) [20] |
| CO2-Equivalent Emission Factor of Wheat |
1.22 | t/t | ||||
| Feed grain transport &processing | efj2 | CO2-Equivalent Emission Factor of Corn |
0.0102 | t/t | Tan et al., (2011) [21] | |
| CO2-Equivalent Emission Factor of Soybean |
0.1013 | t/t | ||||
| CO2-Equivalent Emission Factor of Wheat |
0.0319 | t/t | ||||
| Energy consumption | Livestock and poultry rearing | efe | CO2 Emission Factor of Electricity Consumption |
0.9734 | t/MW·h | Meng et al., (2014) [22] |
| Pricee | Breeding electricity unit price | 0.4275 | CNY/KW·h | |||
| efc | Coal combustion CO2 emission factor | 1.98 | t/t | Sun et al., (2010) [23] | ||
| Pricec | Unit price of coal | 800 | CNY/t | |||
| Livestock and poultry products processing | MJu | Energy consumption for processing pork products | 3.76 | MJ/kg | Meng et al., (2014) [22] | |
| Energy consumption for processing beef products | 4.37 | MJ/kg | ||||
| Energy consumption in the processing of mutton products | 10.4 | MJ/kg | ||||
| Energy consumption in the processing of poultry meat products | 2.59 | MJ/kg | ||||
| Energy consumption in the processing of milk products | 1.12 | MJ/kg | ||||
| Energy consumption in the processing of poultry and egg products | 8.16 | MJ/kg | ||||
| e | Electric heating value | 3.60 | MJ/KW·h | - |
Table 3.
Changes in total animal husbandry carbon emissions in Shandong Province.
| Region | Total animal husbandry carbon emissions (10kt/CO2-eq) | Rate of change (%) | ||||||||
|---|---|---|---|---|---|---|---|---|---|---|
| 2001 | 2003 | 2006 | 2009 | 2011 | 2013 | 2016 | 2019 | 2022 | ||
| Jinan | 372.15 | 435.12 | 437.69 | 323.89 | 329.12 | 340.47 | 318.54 | 241.91 | 191.26 | -0.49 |
| Qingdao | 399.50 | 437.44 | 429.86 | 257.95 | 259.05 | 257.11 | 234.45 | 228.05 | 228.81 | -0.43 |
| Zibo | 100.05 | 118.60 | 87.43 | 89.05 | 102.05 | 104.77 | 92.17 | 93.60 | 104.75 | 0.05 |
| Zaozhuang | 82.23 | 102.47 | 126.48 | 119.85 | 132.89 | 137.65 | 141.70 | 89.88 | 82.38 | 0.00 |
| Dongying | 89.77 | 111.55 | 133.80 | 135.64 | 156.85 | 161.34 | 105.79 | 127.68 | 156.70 | 0.75 |
| Yantai | 160.26 | 204.80 | 254.00 | 233.67 | 237.71 | 228.98 | 252.32 | 303.99 | 283.18 | 0.77 |
| Weifang | 454.12 | 485.58 | 466.93 | 456.45 | 508.91 | 522.66 | 519.89 | 433.79 | 419.36 | -0.08 |
| Jining | 371.98 | 446.89 | 407.11 | 414.81 | 448.56 | 460.02 | 337.34 | 304.18 | 282.09 | -0.24 |
| Tai'an | 211.12 | 265.40 | 228.72 | 236.14 | 266.15 | 286.25 | 285.55 | 187.38 | 150.20 | -0.29 |
| Weihai | 51.03 | 66.64 | 79.16 | 84.02 | 92.86 | 98.84 | 98.80 | 99.26 | 80.75 | 0.58 |
| Rizhao | 93.00 | 105.07 | 109.15 | 99.04 | 116.97 | 120.90 | 135.88 | 134.30 | 118.42 | 0.27 |
| Laiwu | 27.68 | 34.65 | 34.71 | 32.65 | 35.18 | 35.74 | 36.11 | - | - | - |
| Linyi | 319.58 | 352.55 | 327.70 | 348.47 | 378.06 | 382.99 | 402.88 | 418.07 | 461.31 | 0.44 |
| Dezhou | 482.28 | 565.03 | 510.72 | 511.05 | 552.79 | 599.16 | 507.62 | 461.83 | 357.10 | -0.26 |
| Liaocheng | 412.75 | 452.02 | 282.80 | 256.68 | 281.61 | 283.84 | 297.37 | 286.66 | 318.05 | -0.23 |
| Binzhou | 204.94 | 238.03 | 230.62 | 243.24 | 279.81 | 272.12 | 236.68 | 255.66 | 290.82 | 0.42 |
| Heze | 379.49 | 477.20 | 492.95 | 451.83 | 473.92 | 500.89 | 493.79 | 541.73 | 411.81 | 0.09 |
Note: Laiwu City was incorporated into Jinan City from 2019; the change rate is the proportion of animal husbandry carbon emissions in 2022 compared with 2001.
Table 4.
Changes in carbon emission intensity of animal husbandry in Shandong Province.
| Region | Carbon emission intensity of animal husbandry (tons/ten thousand yuan) | Rate of change(%) | ||||||||
|---|---|---|---|---|---|---|---|---|---|---|
| 2001 | 2003 | 2006 | 2009 | 2011 | 2013 | 2016 | 2019 | 2022 | ||
| Jinan | 7.27 | 7.14 | 5.16 | 3.21 | 2.42 | 2.18 | 1.91 | 1.67 | 1.12 | -0.85 |
| Qingdao | 5.27 | 5.09 | 3.99 | 2.22 | 1.66 | 1.57 | 1.34 | 1.36 | 1.29 | -0.76 |
| Zibo | 5.36 | 5.22 | 2.97 | 2.56 | 2.00 | 1.86 | 1.49 | 1.54 | 1.36 | -0.75 |
| Zaozhuang | 5.11 | 4.82 | 3.64 | 3.45 | 2.06 | 1.94 | 1.67 | 1.42 | 1.13 | -0.78 |
| Dongying | 7.86 | 7.13 | 5.06 | 3.36 | 2.71 | 2.50 | 1.57 | 1.65 | 1.33 | -0.83 |
| Yantai | 4.53 | 4.62 | 3.74 | 2.60 | 1.98 | 1.79 | 1.60 | 1.59 | 1.22 | -0.73 |
| Weifang | 4.60 | 4.42 | 3.25 | 2.22 | 1.96 | 1.79 | 1.58 | 1.51 | 1.24 | -0.73 |
| Jining | 5.43 | 4.92 | 3.31 | 2.62 | 1.97 | 1.87 | 1.21 | 1.17 | 0.93 | -0.83 |
| Tai'an | 6.03 | 5.85 | 3.67 | 2.58 | 1.98 | 1.76 | 1.50 | 1.25 | 0.86 | -0.86 |
| Weihai | 2.94 | 3.12 | 2.34 | 1.67 | 1.48 | 1.31 | 1.16 | 1.45 | 1.23 | -0.58 |
| Rizhao | 5.06 | 4.92 | 4.17 | 1.97 | 2.02 | 1.91 | 1.87 | 1.58 | 0.97 | -0.81 |
| Laiwu | 5.00 | 4.93 | 3.81 | 1.50 | 1.25 | 1.25 | 1.11 | - | - | - |
| Linyi | 5.57 | 5.21 | 3.61 | 2.65 | 2.65 | 2.49 | 2.17 | 1.94 | 1.52 | -0.73 |
| Dezhou | 11.54 | 11.16 | 6.05 | 3.54 | 3.06 | 2.93 | 2.23 | 2.10 | 1.42 | -0.88 |
| Liaocheng | 9.47 | 8.76 | 3.98 | 2.83 | 2.45 | 2.34 | 2.00 | 2.00 | 1.63 | -0.83 |
| Binzhou | 7.83 | 7.29 | 5.43 | 3.23 | 2.67 | 2.28 | 1.77 | 2.22 | 1.57 | -0.80 |
| Heze | 10.05 | 9.35 | 6.14 | 4.41 | 4.01 | 3.75 | 3.47 | 3.29 | 1.87 | -0.81 |
Note: Laiwu City was incorporated into Jinan City from 2019; the change rate is the proportion of animal husbandry carbon emissions in 2022 compared with 2001.
Disclaimer/Publisher’s Note: The statements, opinions and data contained in all publications are solely those of the individual author(s) and contributor(s) and not of MDPI and/or the editor(s). MDPI and/or the editor(s) disclaim responsibility for any injury to people or property resulting from any ideas, methods, instructions or products referred to in the content. |
© 2024 by the authors. Licensee MDPI, Basel, Switzerland. This article is an open access article distributed under the terms and conditions of the Creative Commons Attribution (CC BY) license (http://creativecommons.org/licenses/by/4.0/).
Copyright: This open access article is published under a Creative Commons CC BY 4.0 license, which permit the free download, distribution, and reuse, provided that the author and preprint are cited in any reuse.


