1. Introduction
Rainfall has always been important in both historical and contemporary global situations. Rainfall is influenced by various elements, including humidity, temperature, water level, and other relevant variables [
1]. An excessive amount of rainfall has detrimental effects on crops within a certain geographical area, ultimately leading to the complete disruption of agricultural activities in that location. Heavy precipitation can lead to many natural disasters, such as floods, droughts, and cloud bursts, often triggered by intense rainfall and rapid landslides [
2]. Rainfall prediction involves anticipating long-term precipitation patterns within a specific geographical area. The ability to accurately forecast rainfall can significantly contribute to the agricultural industry's success, fostering economic growth within a nation. Ensuring the precision of rainfall measurements is crucial for mitigating the occurrence of landslides, which frequently lead to the obstruction of river channels [
3]. The variability of precipitation is a significant and intricate issue. The capability of rainfall forecasting to identify precise concealed patterns or non-linear trends in rainfall data, which are essential for achieving accurate rainfall predictions, is limited. Many rainfall forecasts proved inaccurate, resulting in substantial economic losses. The diverse climatic conditions are exerting a significant influence on the deterioration of infrastructure and the occurrence of injuries and fatalities. Hence, it is imperative to have precise rainfall forecast to anticipate the impact of weather conditions on large-scale activities [
4].
Weather forecasting is a subcategory of climate change study that predicts the state of the atmosphere at a certain time and location in the future [
5]. Rainfall prediction is a key use of weather forecasting in large-scale water-dependent operations, including food production planning and water resource management. To properly prepare and plan large-scale activities, rainfall projections must be improved, especially for accuracy and predictive performance. Machine learning has experienced significant advancements and has become a fundamental sub-discipline within the broader domain of artificial intelligence. Furthermore, it allows computers to acquire knowledge and understanding without explicit programming autonomously. Machine learning algorithms can be employed to derive significant insights from data, hence facilitating the efficient identification of phishing websites. Nevertheless, the current level of achievement remains significantly distant from attaining human-level ability. Human intervention is still required to predefine the algorithms during the initialization process of the machine. Various machine learning methodologies have been investigated in the context of rainfall prediction, focusing on diverse geographical regions, including South Africa, China, and other nations [
6,
7,
8,
9]. Various classifiers are employed for rainfall prediction, including Random Forest, Decision Tree, Support Vector Machine, K-nearest Neighbour (KNN), and Naïve Bayes [
10,
11,
12,
13,
14,
15].
Accurate trend detection and future prediction are vital. The variation in rainfall, humidity, wind speed, temperature over time, space, and aggregate can significantly impact the country's agriculture, potentially causing substantial economic setbacks [
16]. Countries like Bangladesh, with diverse landscapes, face the challenge of predicting the ever-changing weather conditions involving key parameters like wind speed, humidity, temperature, and rainfall [
17]. Therefore, rainfall trend detection and future prediction remain an important field of study for Bangladesh. The weather, including temperature, wind direction, speed, and amount of rainfall, can be predicted using machine learning algorithms [
18]. This research work uses machine learning algorithms and implements ensemble-based regression and classifier models using the Bangladesh weather dataset to perform the weather predictions, including rainfall occurrence, rainfall amount, and daily average temperature prediction. The main contributions of this work are:
To implement an ensemble-based predictive classifier to predict whether the rain will occur on a particular day.
To implement an ensemble-based predictive regressor to predict the amount of rainfall and daily average temperature.
To evaluate the performance of the ensemble-based models with the machine learning algorithms using evaluation metrics including accuracy, precision, recall and F1 score, along with the RMSE and MAE.
2. Related Work
Intelligent weather prediction techniques can provide valuable insights, enabling us to make effective decisions that save lives, time, and property. Bosu, et al. [
19] analyzed the recent changes in temperature and rainfall in different areas of Bangladesh from 1981 to 2019 using the CMIP5 dataset. In [
4], Authors examined the trends and variations in Bangladesh's inter-annual, monthly, and dry-season rainfall patterns by applying ARIMA predictions and conducting Mann-Kendall and Spearman's rho tests. Mahabub and Habib [
17] experienced with the raw dataset collected from the Bangladesh Meteorological Division (BMD), applied regression algorithms in Machine Learning (ML) models and achieved more precise results compared to traditional weather forecasting approaches. The regression algorithm-based machine learning model predicted more accurate results than traditional weather forecasting approaches [
17]. Hashim, et al. [
20] successfully predicted precipitation using wind, temperature, pressure, and relative humidity meteorological factors in the Back Propagation neural network model. Dong, et al. [
21] enhanced short-term forecasting of daily precipitation using the XGBoost model combined with multi-factor bias correction for numerical weather prediction (NWP). Paul and Roy [
22] developed a machine learning-based time series forecasting model to predict temperature any year in the future of Bangladesh.
In the past, individual classifiers such as Decision Trees (DT), Multilayer Perceptrons (MLP_, Naïve Bayes (NB), K-nearest neighbor (KNN), Neural Networks (NN), and Support Vector Machines (SVM) were used to create prediction models on pre-labeled datasets for rainfall prediction [
11,
23,
24,
25,
26]. The individual classifier faces some constraints. For instance, when the data exhibits unstructured and intricate characteristics, together with many features, the problem might be classified as non-linear. The data has a high-dimensional nature, while the dataset is quite small. Consequently, this combination of factors can result in overfitting and a lack of interpretability while training the data. Its principal downside is the primary limitation of using an individual classifier within a prediction model. The reliability of individual classifiers is comparatively lower when compared to the reliability achieved by combining numerous classifiers. To address this limitation, numerous scholars propose that Ensemble Learning techniques offer superior classification accuracy compared to individual classifiers. Ensemble learning is a machine learning methodology utilized to enhance the accuracy of predictions [
27]. Ensemble approaches are commonly considered to be the most sophisticated methodology for forecasting precipitation. These strategies enhance the predictive accuracy of a single model and aggregate their forecasts. Ensemble Learning consistently produces a robust model. Ensemble learning techniques have been successfully employed in rainfall prediction, resulting in notable improvements in prediction accuracy. This advancement in rainfall prediction can potentially mitigate the risk of substantial losses. Ensemble learning is a technique that combines the predictive capacity of numerous classifiers to provide enhanced prediction results in a given dataset [
28,
29]. The overview of related work is provided in
Table 1.
Most of the related work is using traditional machine learning models only, for a single prediction of rainfall amount, rainfall prediction, or average temperature, and using smaller datasets. However, rainfall occurrence prediction is necessary for countries like Bangladesh to mitigate challenges related to flooding. To increase the performance accuracy of the machine learning models, ensemble-based models are proposed for rainfall occurrence prediction using five machine learning techniques in this study, along with the rainfall amount, and daily average temperature prediction using ensemble based regressor using three regression algorithms.
Absolute independence among the basic classifiers is difficult to guarantee. Ensemble learning has reduced interpretability, and the predictions and explanations of the ensemble approach are challenging to anticipate. Mastering ensemble learning is challenging, as any errors made in the rainfall prediction could potentially lead to a model that exhibits worse predictive accuracy than an individual model. Hence, it is also possible for losses to occur. Two distinct types of ensemble learning methods exist: heterogeneous ensemble learning and homogeneous ensemble learning. In ensemble methods, inhomogeneous approaches involve using identical base learners on distinct subsets of samples within a given dataset [
30]. Bagging, boosting, and random forests are among the various instances that can be cited. The heterogeneous ensemble strategy involves the utilization of diverse base learners, which are constructed by either statistical methods or by aggregating the predictions of the individual base learners. Ensemble learning has emerged as a prominent approach in rainfall prediction.
3. Methodology
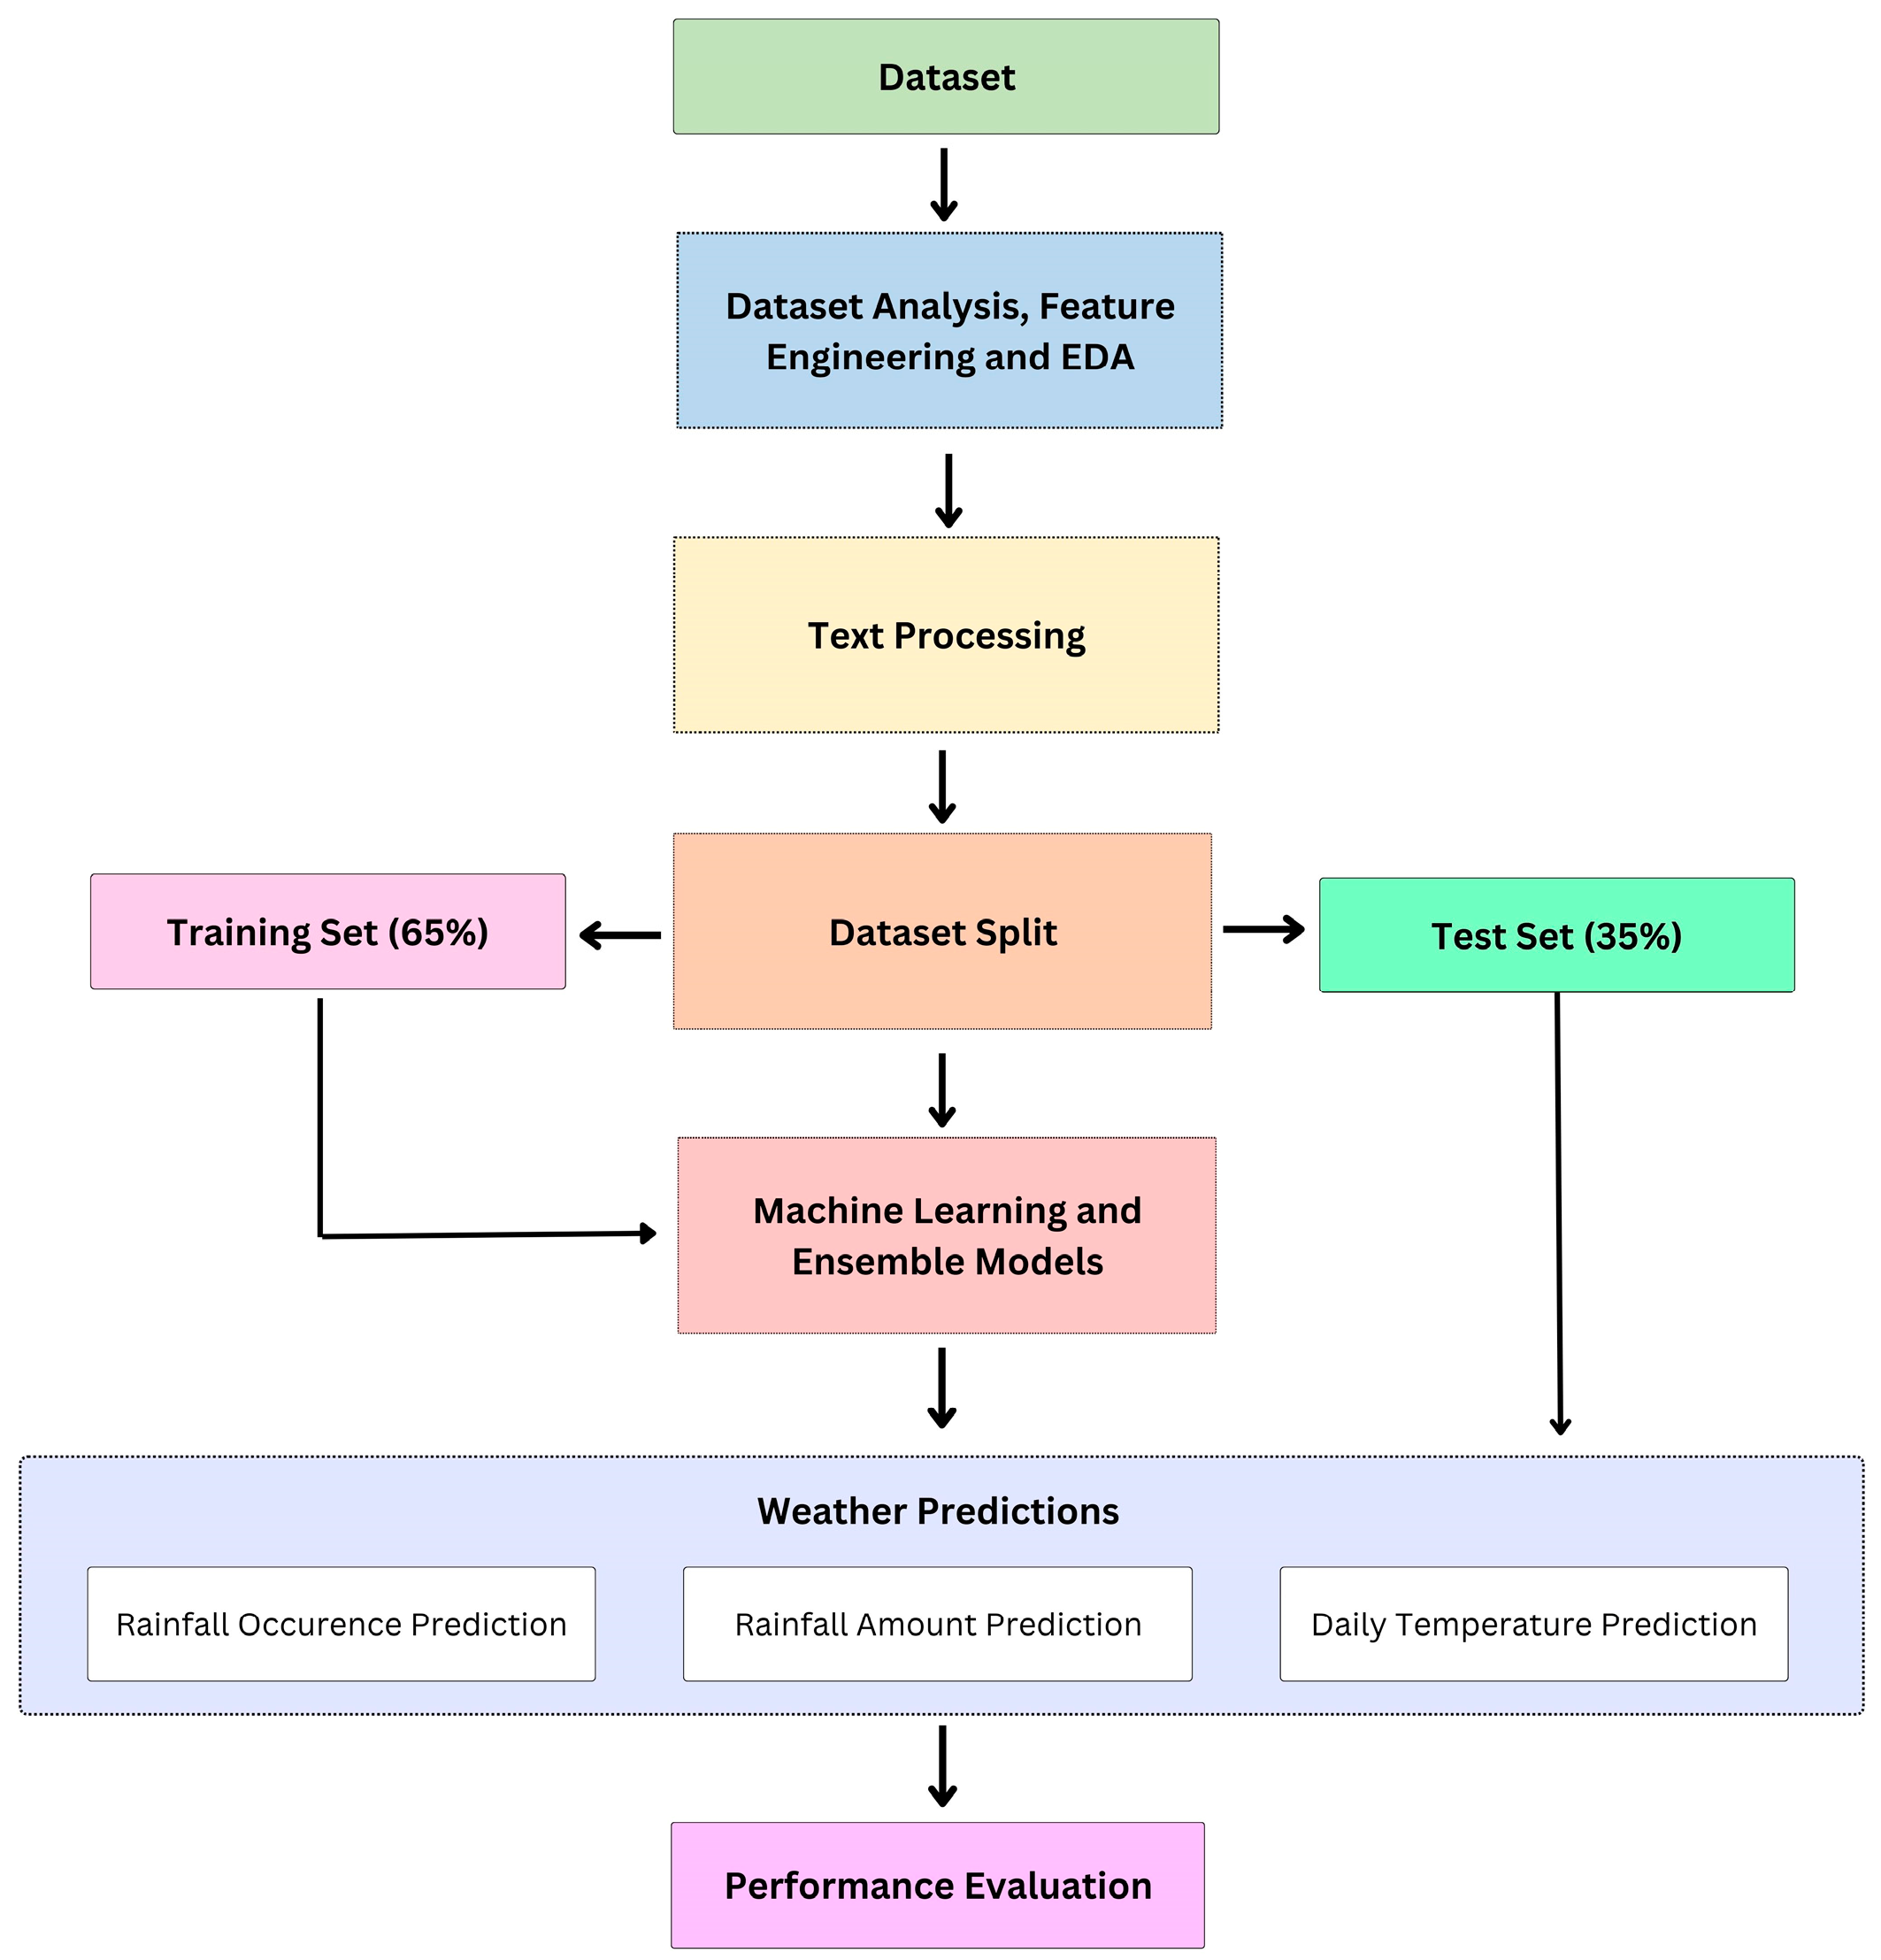
This research uses machine learning models to conduct predictive analyses of rainfall occurrence, rainfall amount prediction, and the daily average temperature prediction. These models are characterized by their unique methodologies, each possessing specific strengths and capabilities. Our approach entails the incorporation of both classification and regression algorithms, thereby encompassing a comprehensive array of techniques to address the intricacies associated with this multifaceted task effectively. The models used to predict rainfall occurrence are Logistic Regression, Decision Tree Classification, Random Forest Classification, K-Nearest Neighbors (KNN), and Support Vector Classifier (SVC). Furthermore, the regression-based algorithms used are Linear Regression, Random Forest Regression, and Support Vector Regression (SVR) for predicting rainfall amount and daily average temperature. To improve the results further, the research also implements an Ensemble classifier using the machine learning models for rain occurrence prediction and regression algorithms based on ensemble regressor for rain amount and daily average temperature prediction. The SVC is used for rainfall prediction, as the SVC performs binary classification, and the SVM is used for the rainfall amount and daily average temperature prediction, which performs regression. The methodology is shown in
Figure 1. below.
3.1. Subsection
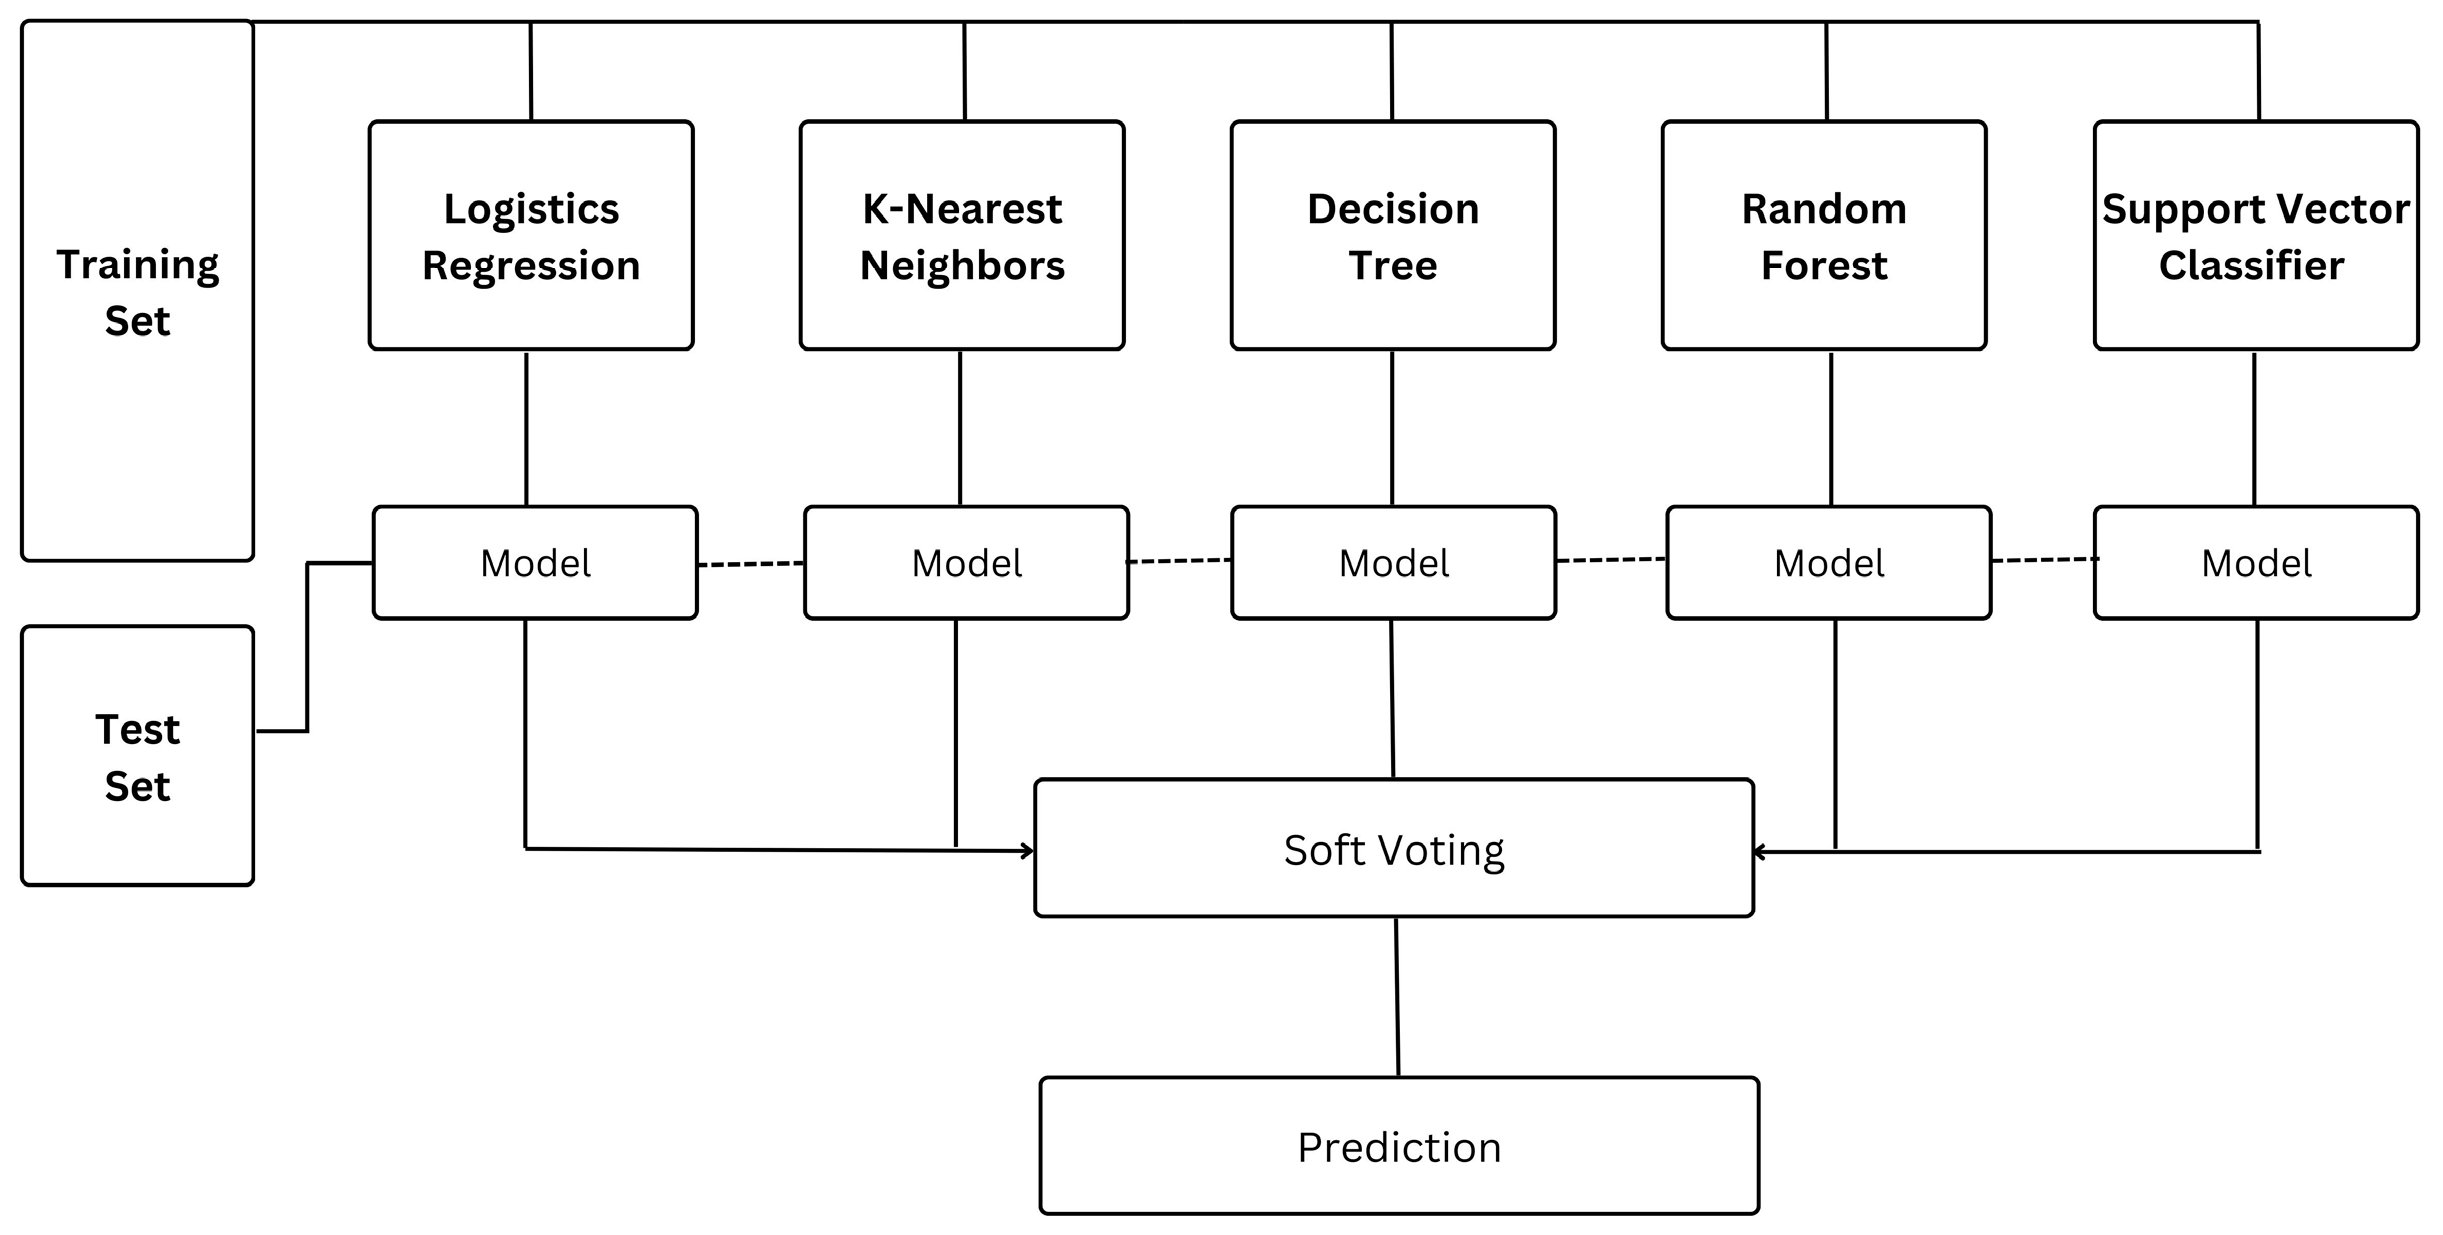
To achieve comprehensive predictions, our methodology also involves an ensemble classifier. The ensemble classifier operates on a principle of consensus and voting, embodying a collective wisdom that transcends the limitations of any single model. As the classifiers generate independent predictions, the ensemble classifier combines these predictions, leading to a dynamic and balanced output representing the entire ensemble's collective insight. Specifically, the ensemble classifier will predict rainfall occurrence based on historical data patterns. This aggregated result is achieved through intricate mechanisms prioritizing reliability, accuracy, and robustness. By cultivating harmony among the classifiers, the ensemble classifier fortifies its predictive ability and diminishes the influence of any potential outliers or biases present in the individual models. Rainfall occurrence prediction is ideally suited for classifier algorithms, such as Support Vector Classifiers, Logistic Regression, kNN, Decision Trees, and Random Forests, on account of their classification characteristics. This task classifies occurrences as rainfall or non-occurrence based on input features. Classifier algorithms are meant to generate discrete class labels in this type of situation. They can detect patterns and class boundaries, making them good rainfall predictors. Their efficient classification skills guarantee accurate rainfall forecasts, making them the best choice for this meteorological prediction task. The Ensemble-based classifier model used in this research work for Rainfall occurrence prediction is based on five machine-learning classifiers, as shown in
Figure 2.
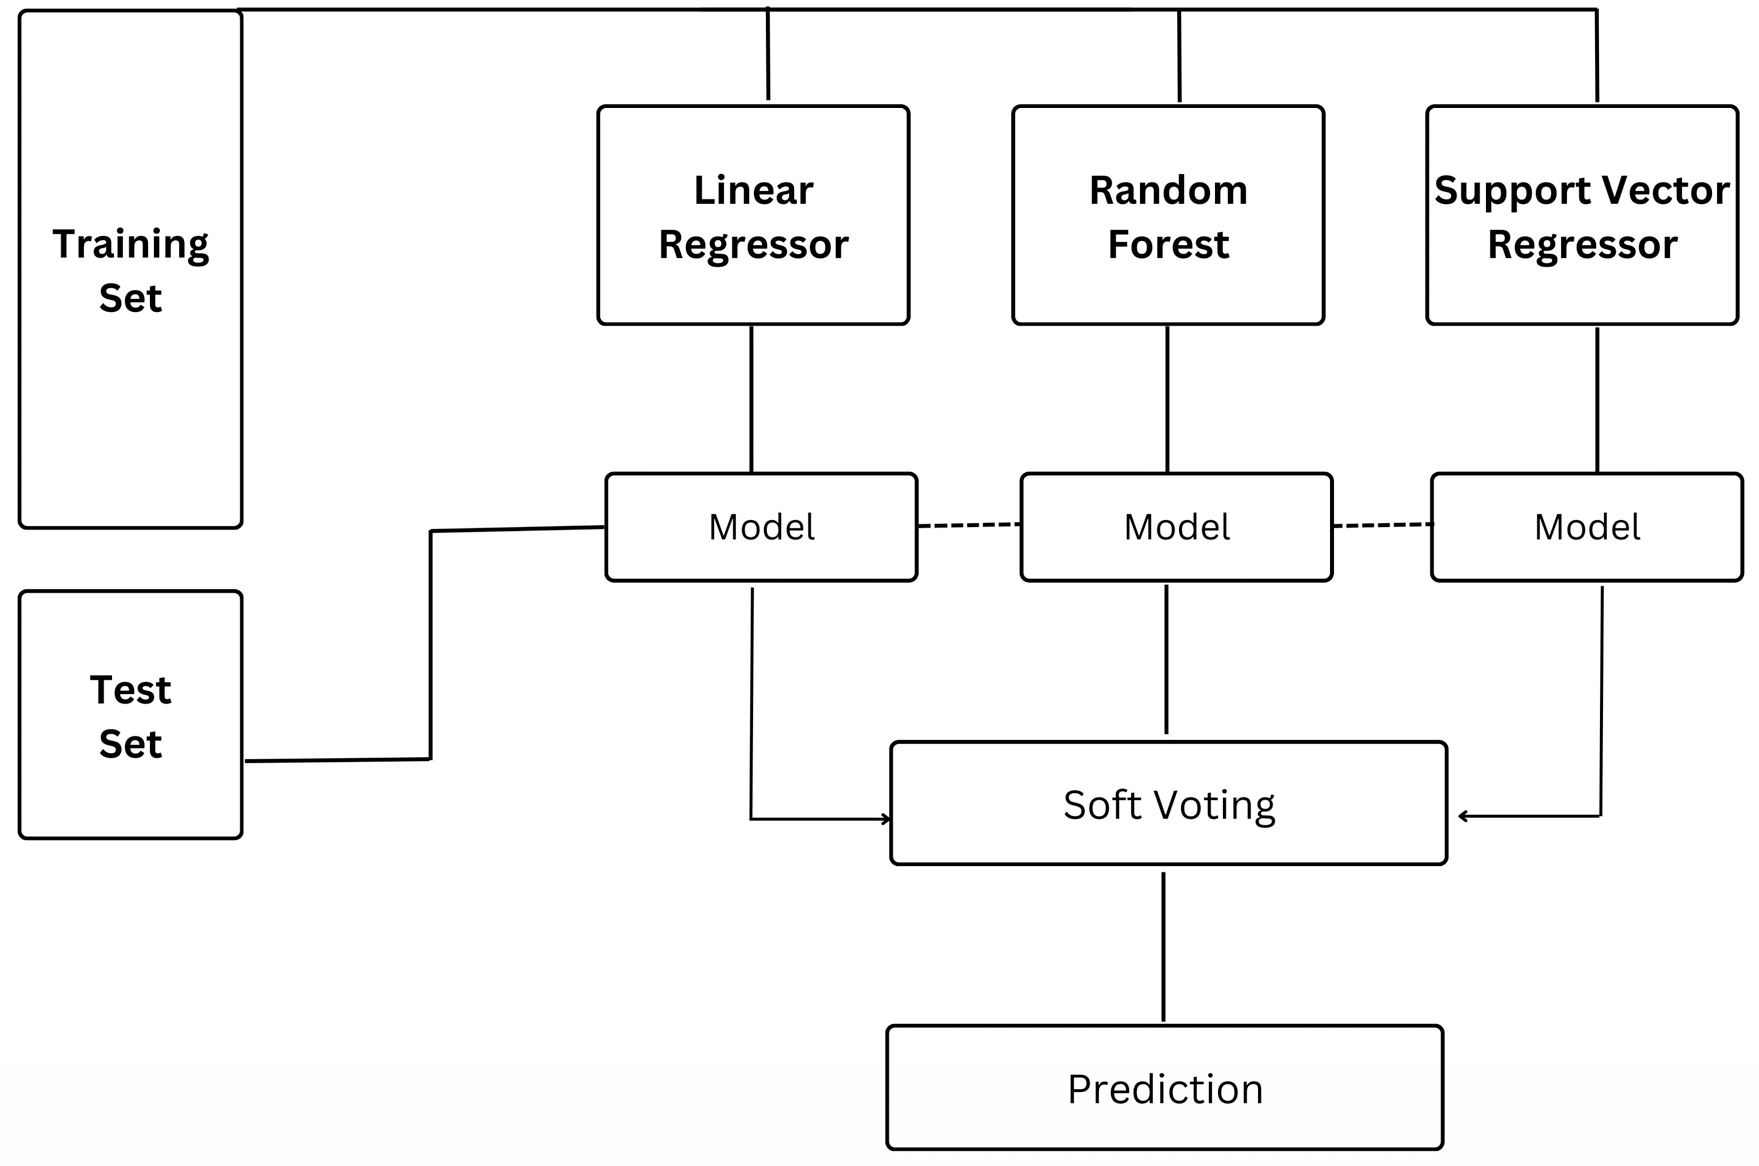
The Ensemble-based regressor model used for Rainfall amount and Daily Average temperature prediction is based on three machine-learning regressor algorithms, as shown in
Figure 3. Due to their nature, regression techniques like Linear Regression, Random Forest, and Support Vector Regressor are good for rainfall and daily average temperature prediction. Both aim to estimate continuous numerical quantities (rainfall or temperature) from input features. For this reason, regression algorithms are designed to capture and model data patterns and correlations. For regression-based meteorological predictions of rainfall and daily temperatures, their capacity to handle continuous output variables and adapt to complex data patterns makes them the best choice.
Ensemble-based forecasting techniques have emerged as a crucial tool in improving the accuracy and reliability of weather predictions, particularly in regions characterized by dynamic and complex climatic patterns like Bangladesh. Our approach integrates multiple models and their outputs to generate a more robust and comprehensive forecast. In Bangladesh, accurate rainfall and temperature predictions are paramount, as they directly impact various sectors such as agriculture, water resource management, and disaster preparedness. This approach will explore the significance and applications of ensemble-based forecasting methods in addressing Bangladesh's unique meteorological challenges, highlighting such models' potential benefits and contributions to improving the country's resilience to changing weather patterns.
3.2. Dataset
Weather Data Bangladesh is an open-source dataset and contains 10 years of daily weather observations from many locations across Bangladesh [
31]. It contains observations of weather metrics for each day from 2013 to 2022. The dataset includes columns, including Date, MinTemp, MaxTemp, WindDir9am, WindDir3pm, Windspeed9am, windspeed3pm, humidity9am, humidity3pm, pressure9am, pressure3pm, cloud9am, cloud3pm, temp9am, temp3pm, and rainToday. If today is rainy, then ‘Yes’. If today is not rain, then ‘No’.
3.3. Evaluation Metrics
The machine learning models implemented in this research are evaluated, Accuracy Score, F1-Score, Mean Absolute Error (MAE), and Mean Squared Error (MSE). The accuracy and F1 score are used for the rainfall occurrence prediction. However, the MAE and MSE are used for rainfall amounts and daily average temperature prediction.
4. Data Analysis
To analyze the data further, a comprehensive analysis is performed for various attributes, including min, max temperature, wind speed, humidity, pressure, clouds, and temperature. The dataset analysis includes the wind speed, humidity, pressure, clouds, and temperature values for only 9 AM and 3 PM.
4.1. Feature Distribution
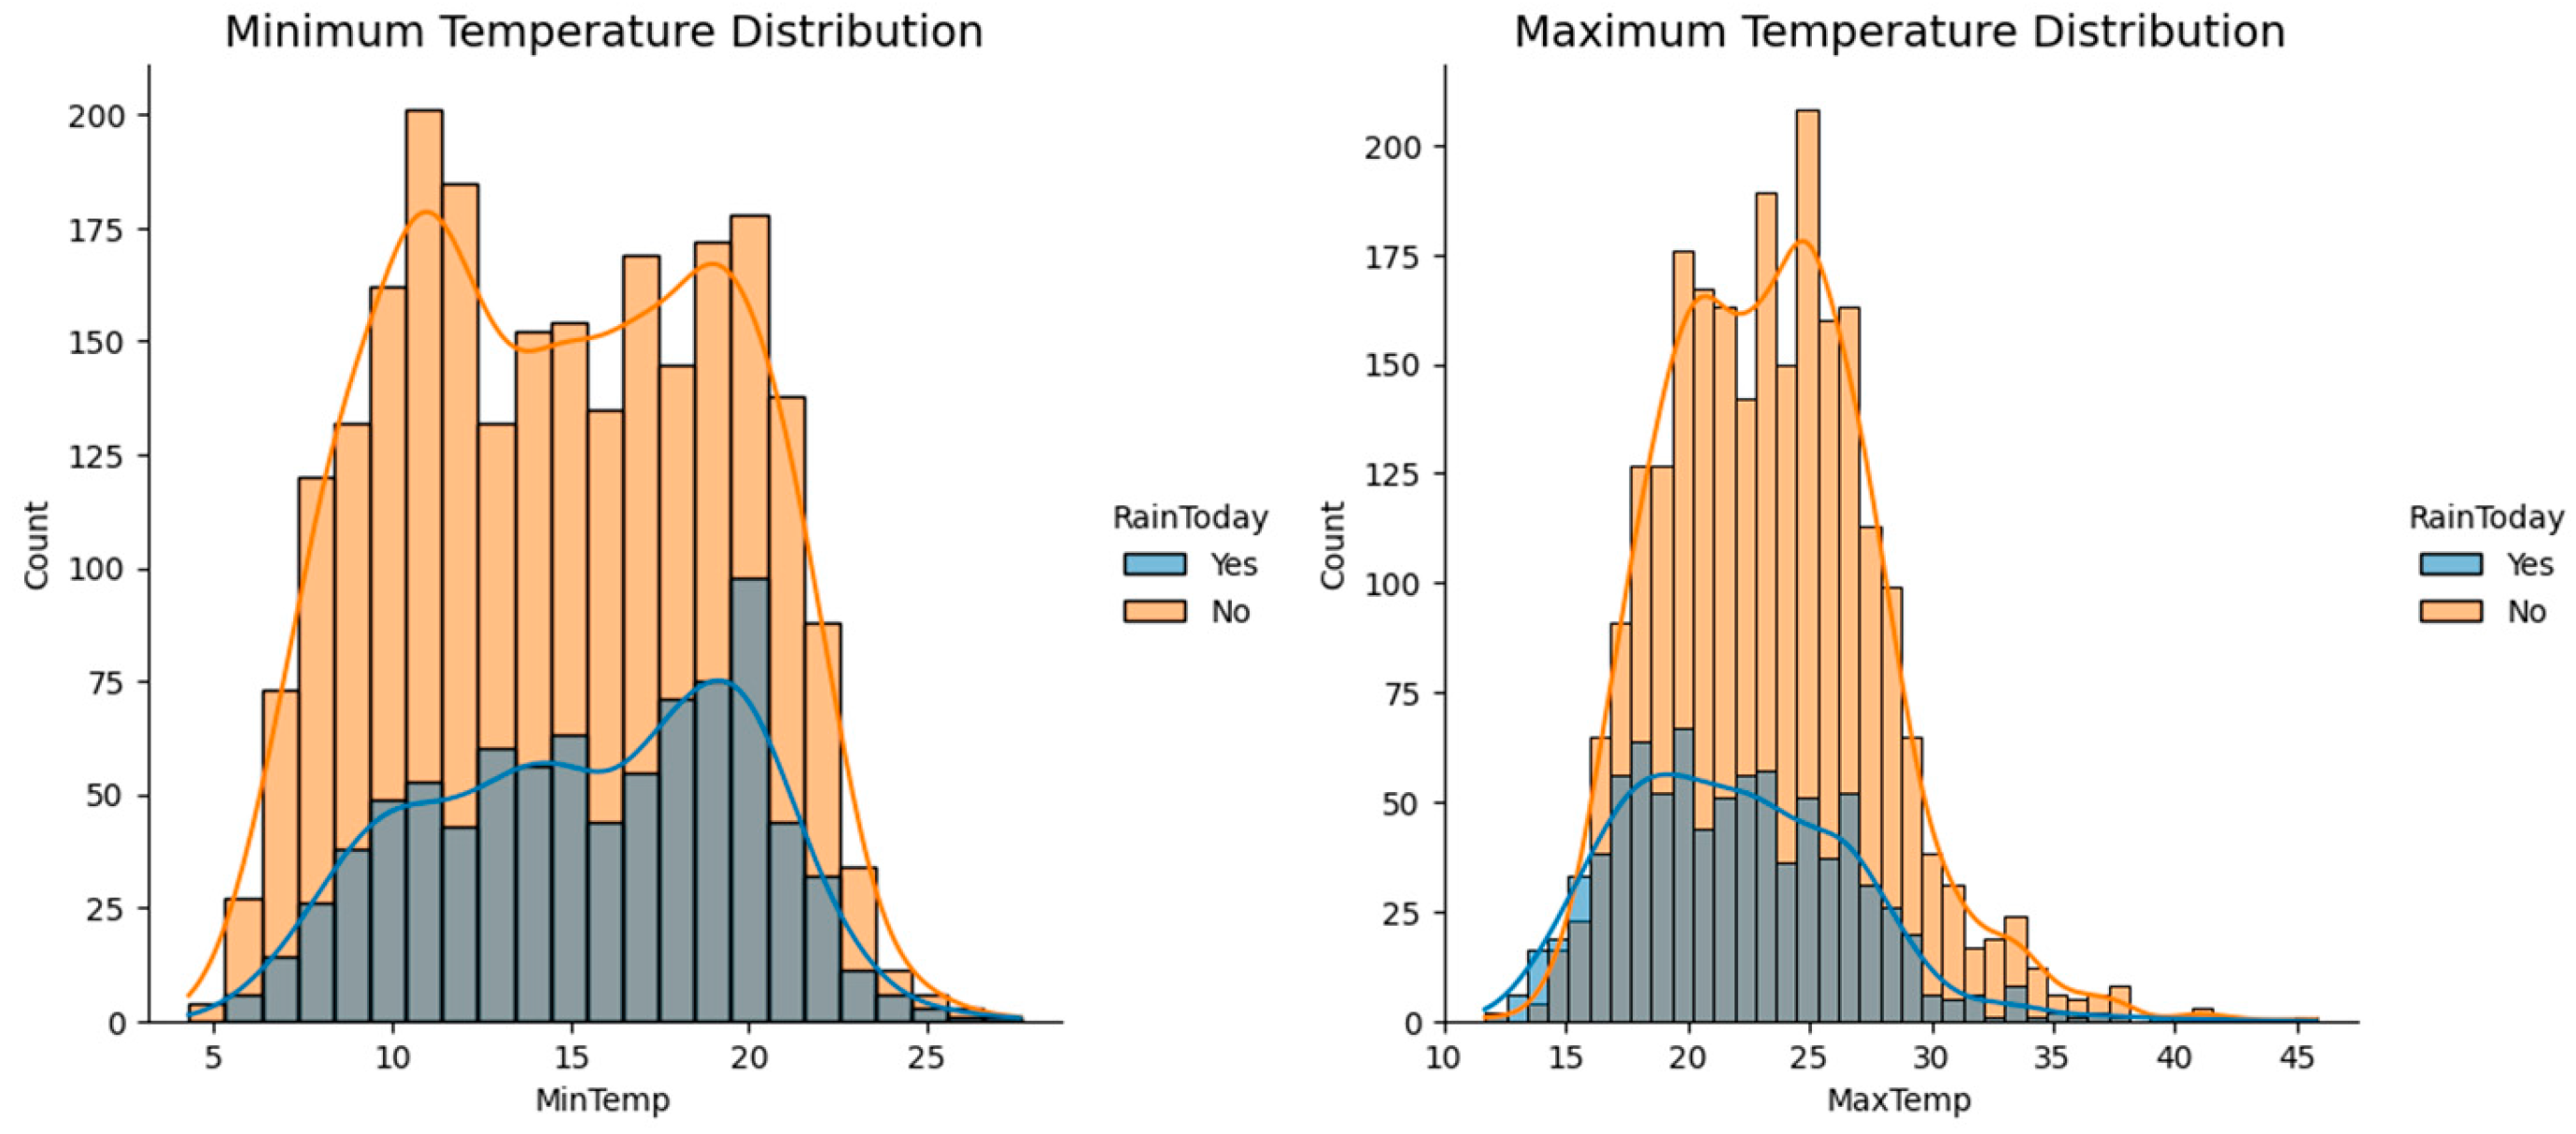
The dataset's minimum temperature ranges from 4.3 to 27.6 degrees Celsius, with the largest frequency at 11 and 20 degrees Celsius, as illustrated in
Figure 4a. However, as
Figure 4b illustrates, the maximum temperature ranges from 11.7 degrees Celsius to 45.8 degrees Celsius, with the largest frequency in the dataset occurring at 25 degrees Celsius.
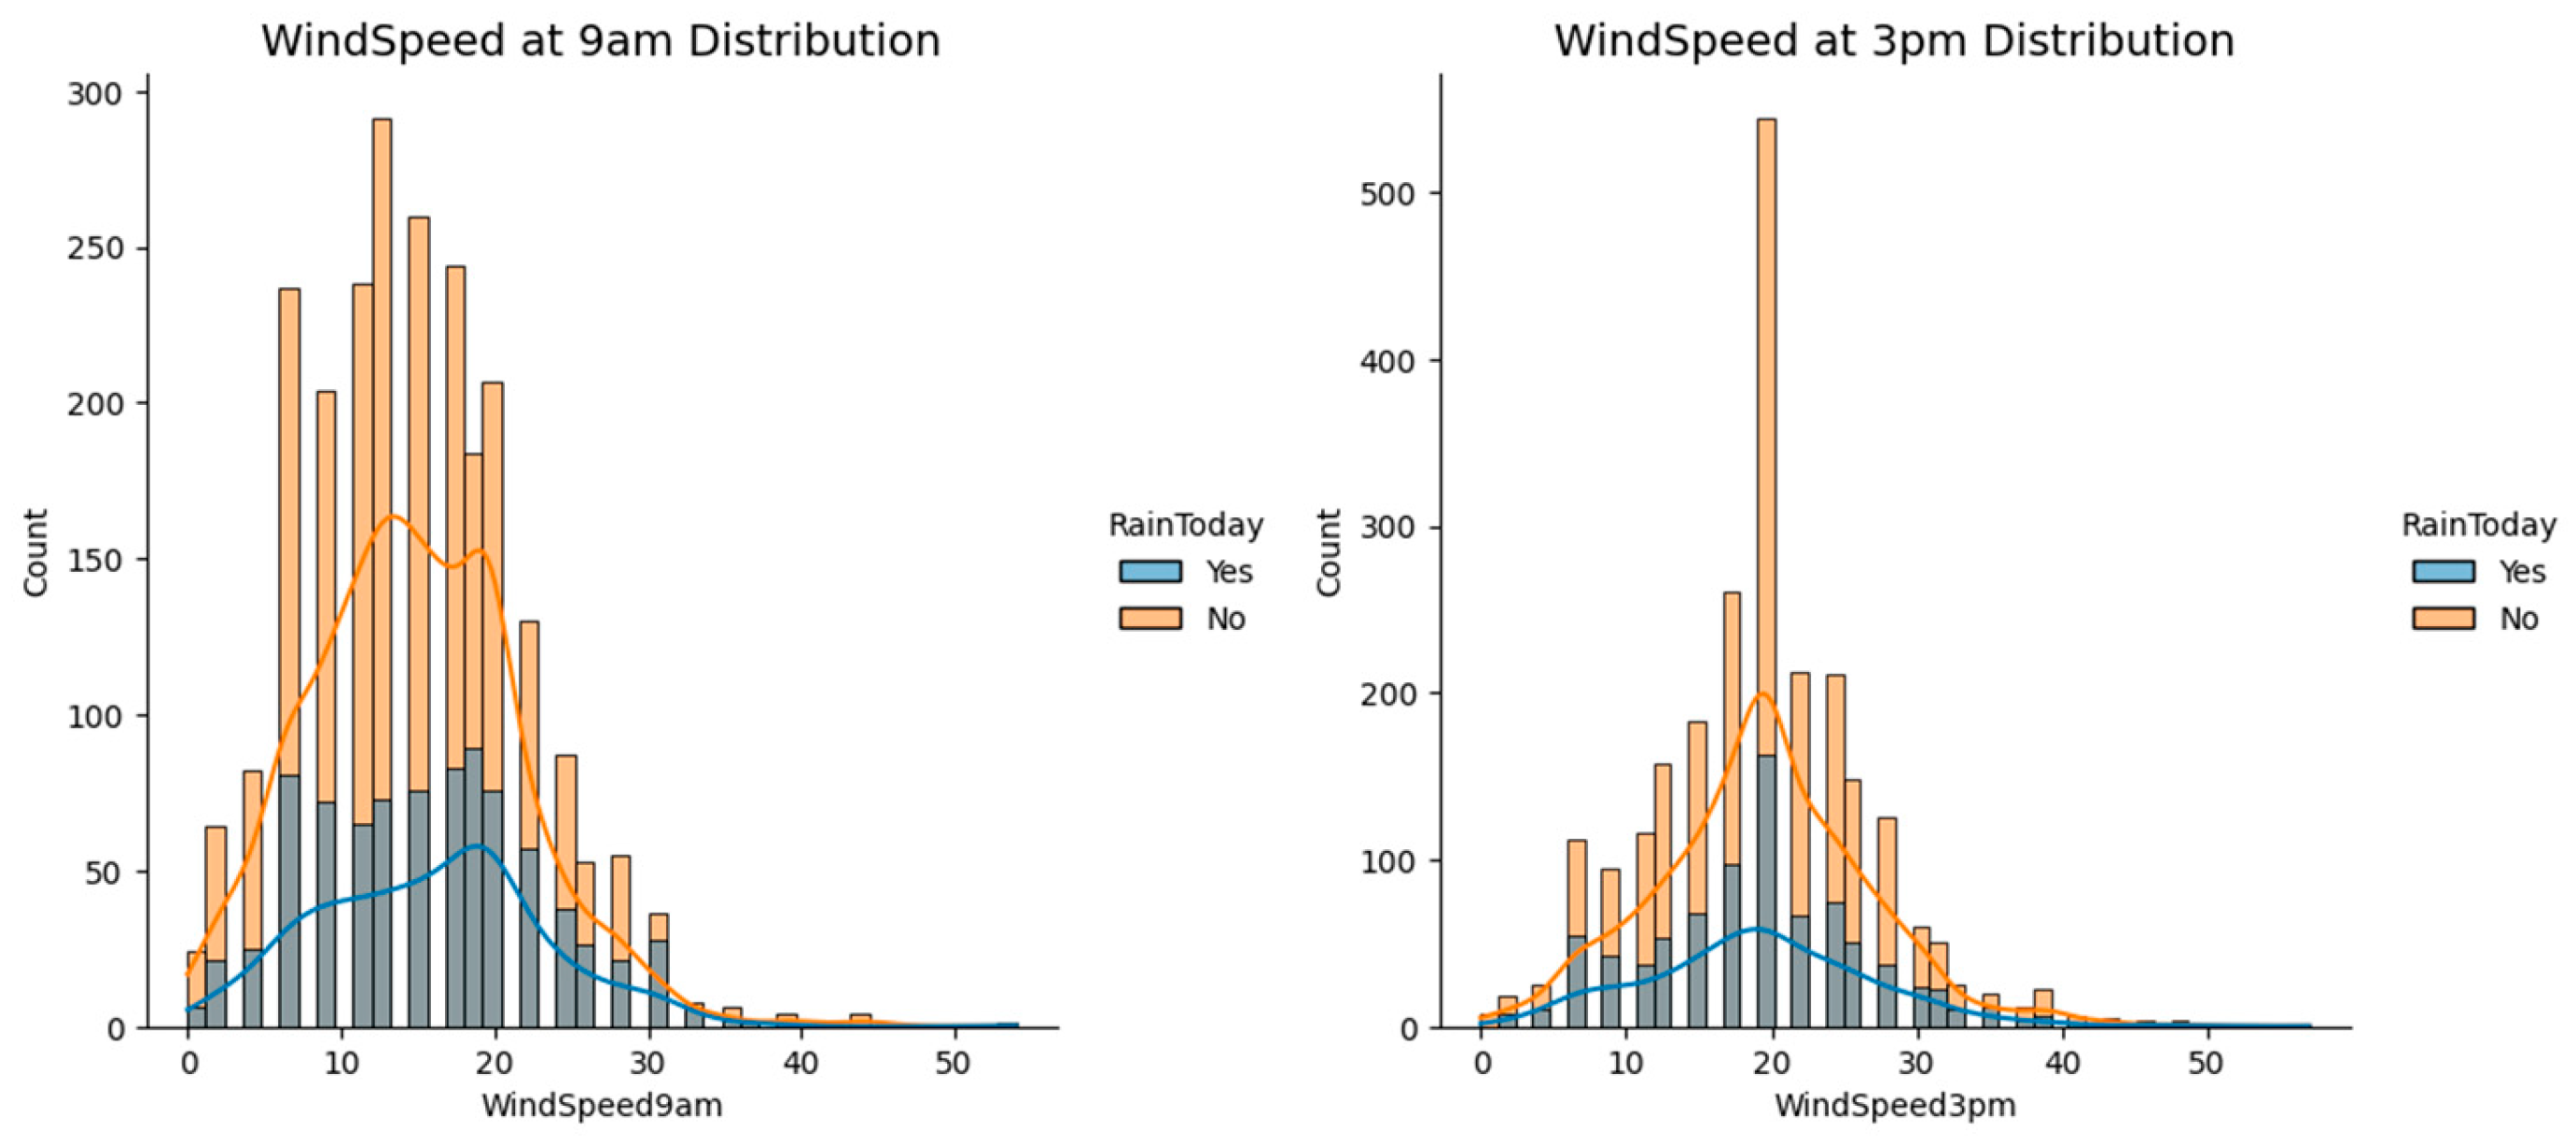
The wind speed ranges from 0 to 57 km/h at 9 AM, with 12 km/h having the largest frequency in the dataset, as shown in
Figure 5a.
Figure 5b shows that the wind speed range at 3 PM is between 0 km/h and 57 km/h, with the highest frequency occurring at 19 km/h.
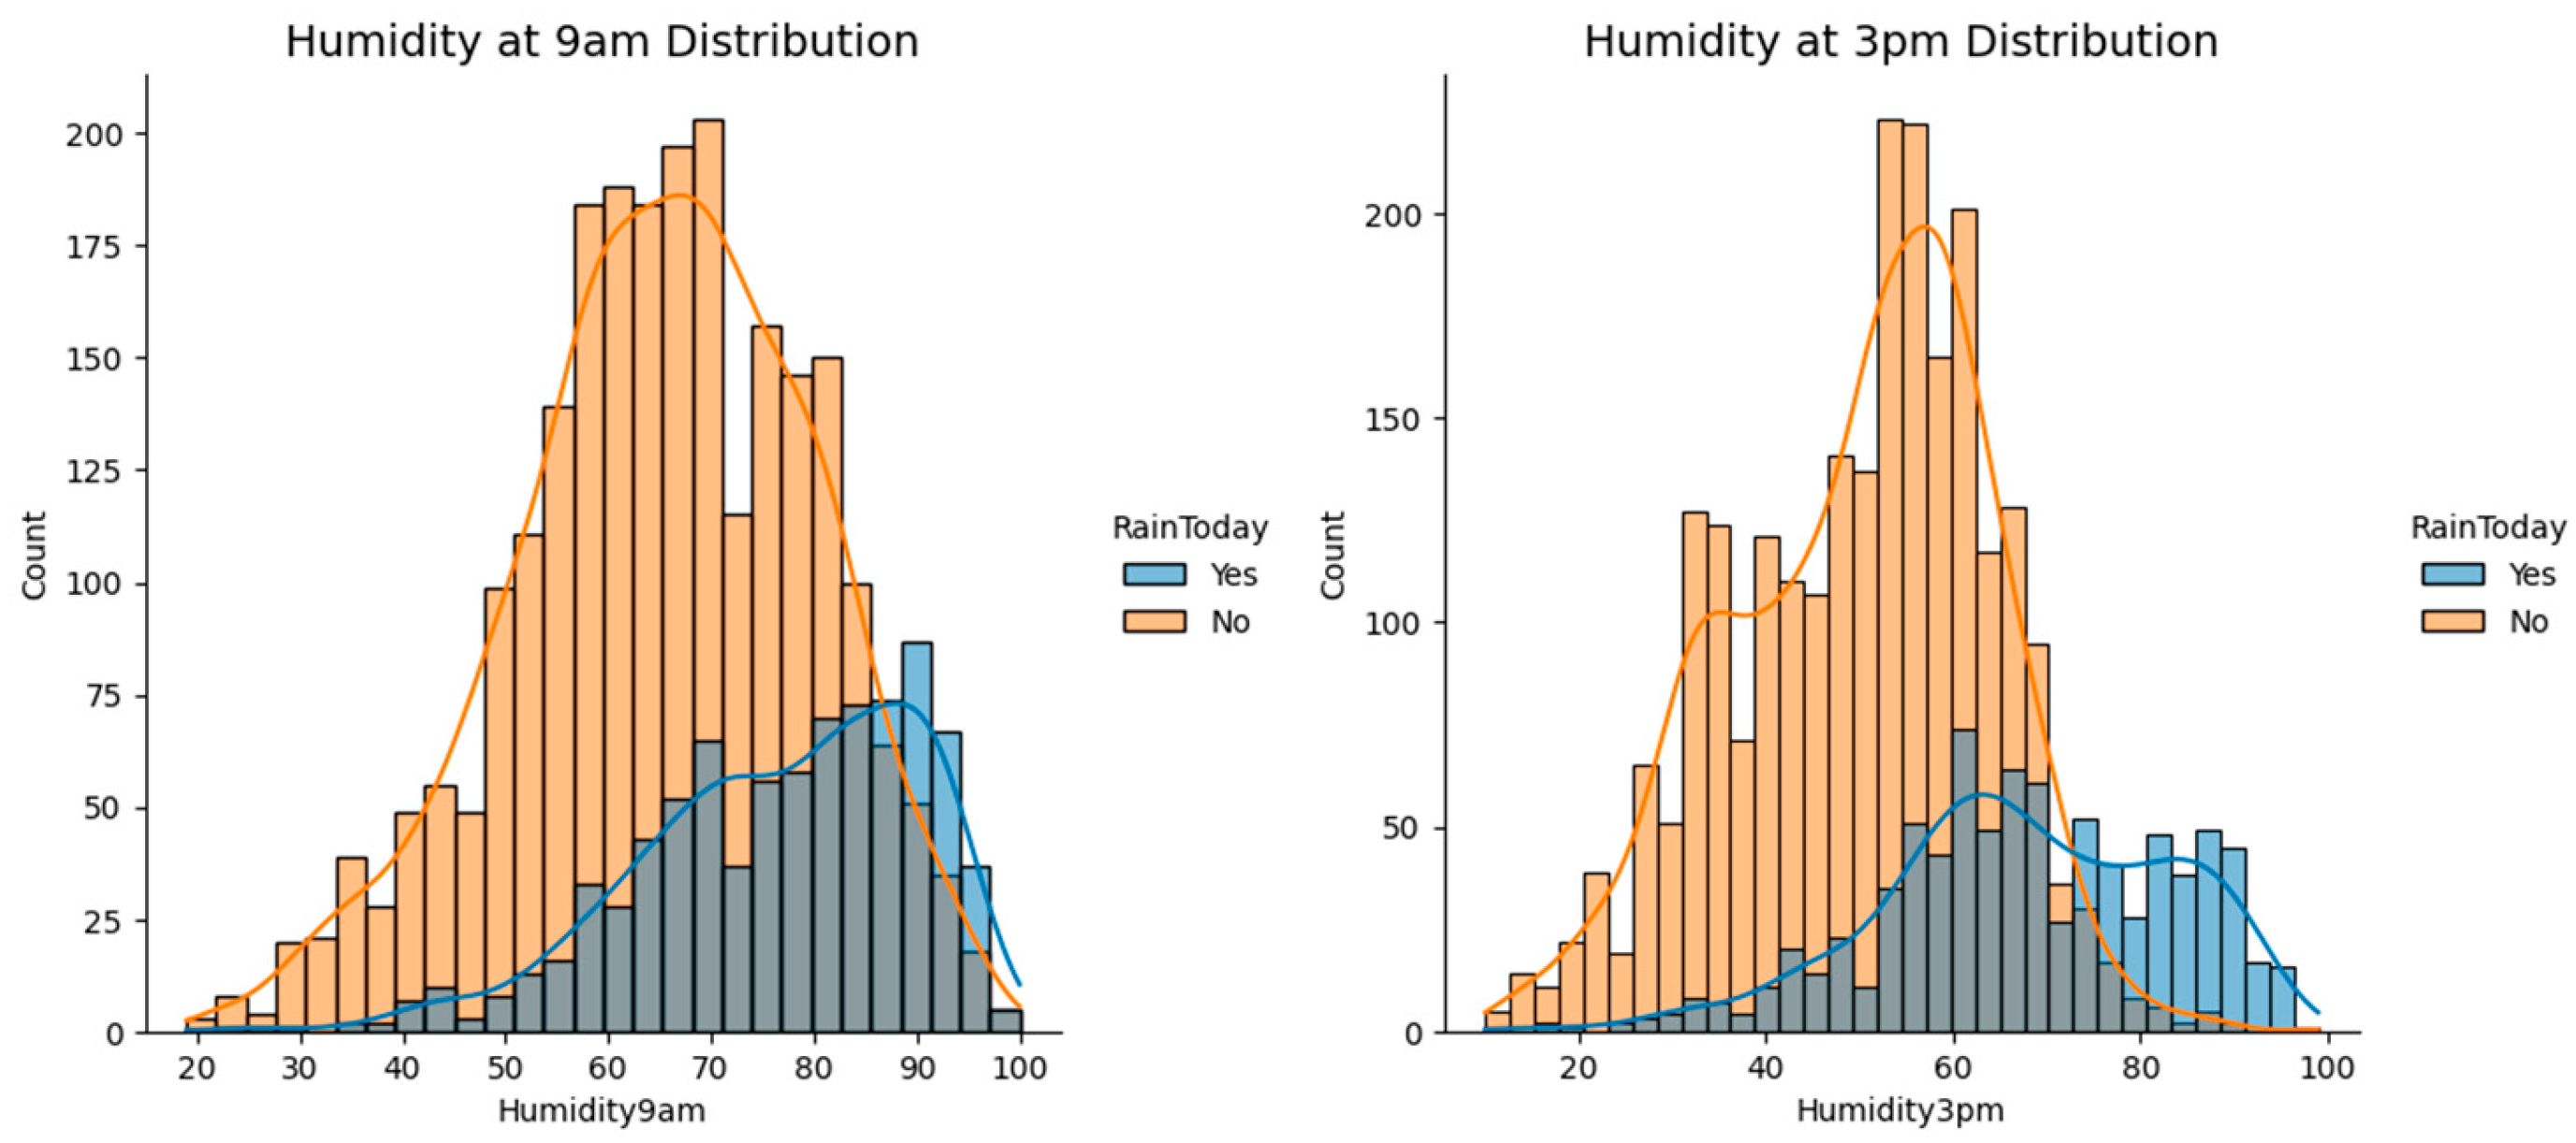
The humidity ranges from 19% to 100% between 9 AM and 3 PM, with 70% humidity at 9 AM having the highest frequency in the dataset, as shown in
Figure 6a. In comparison,
Figure 6b shows that 47.58% of humidity at 3 PM has the highest frequency.
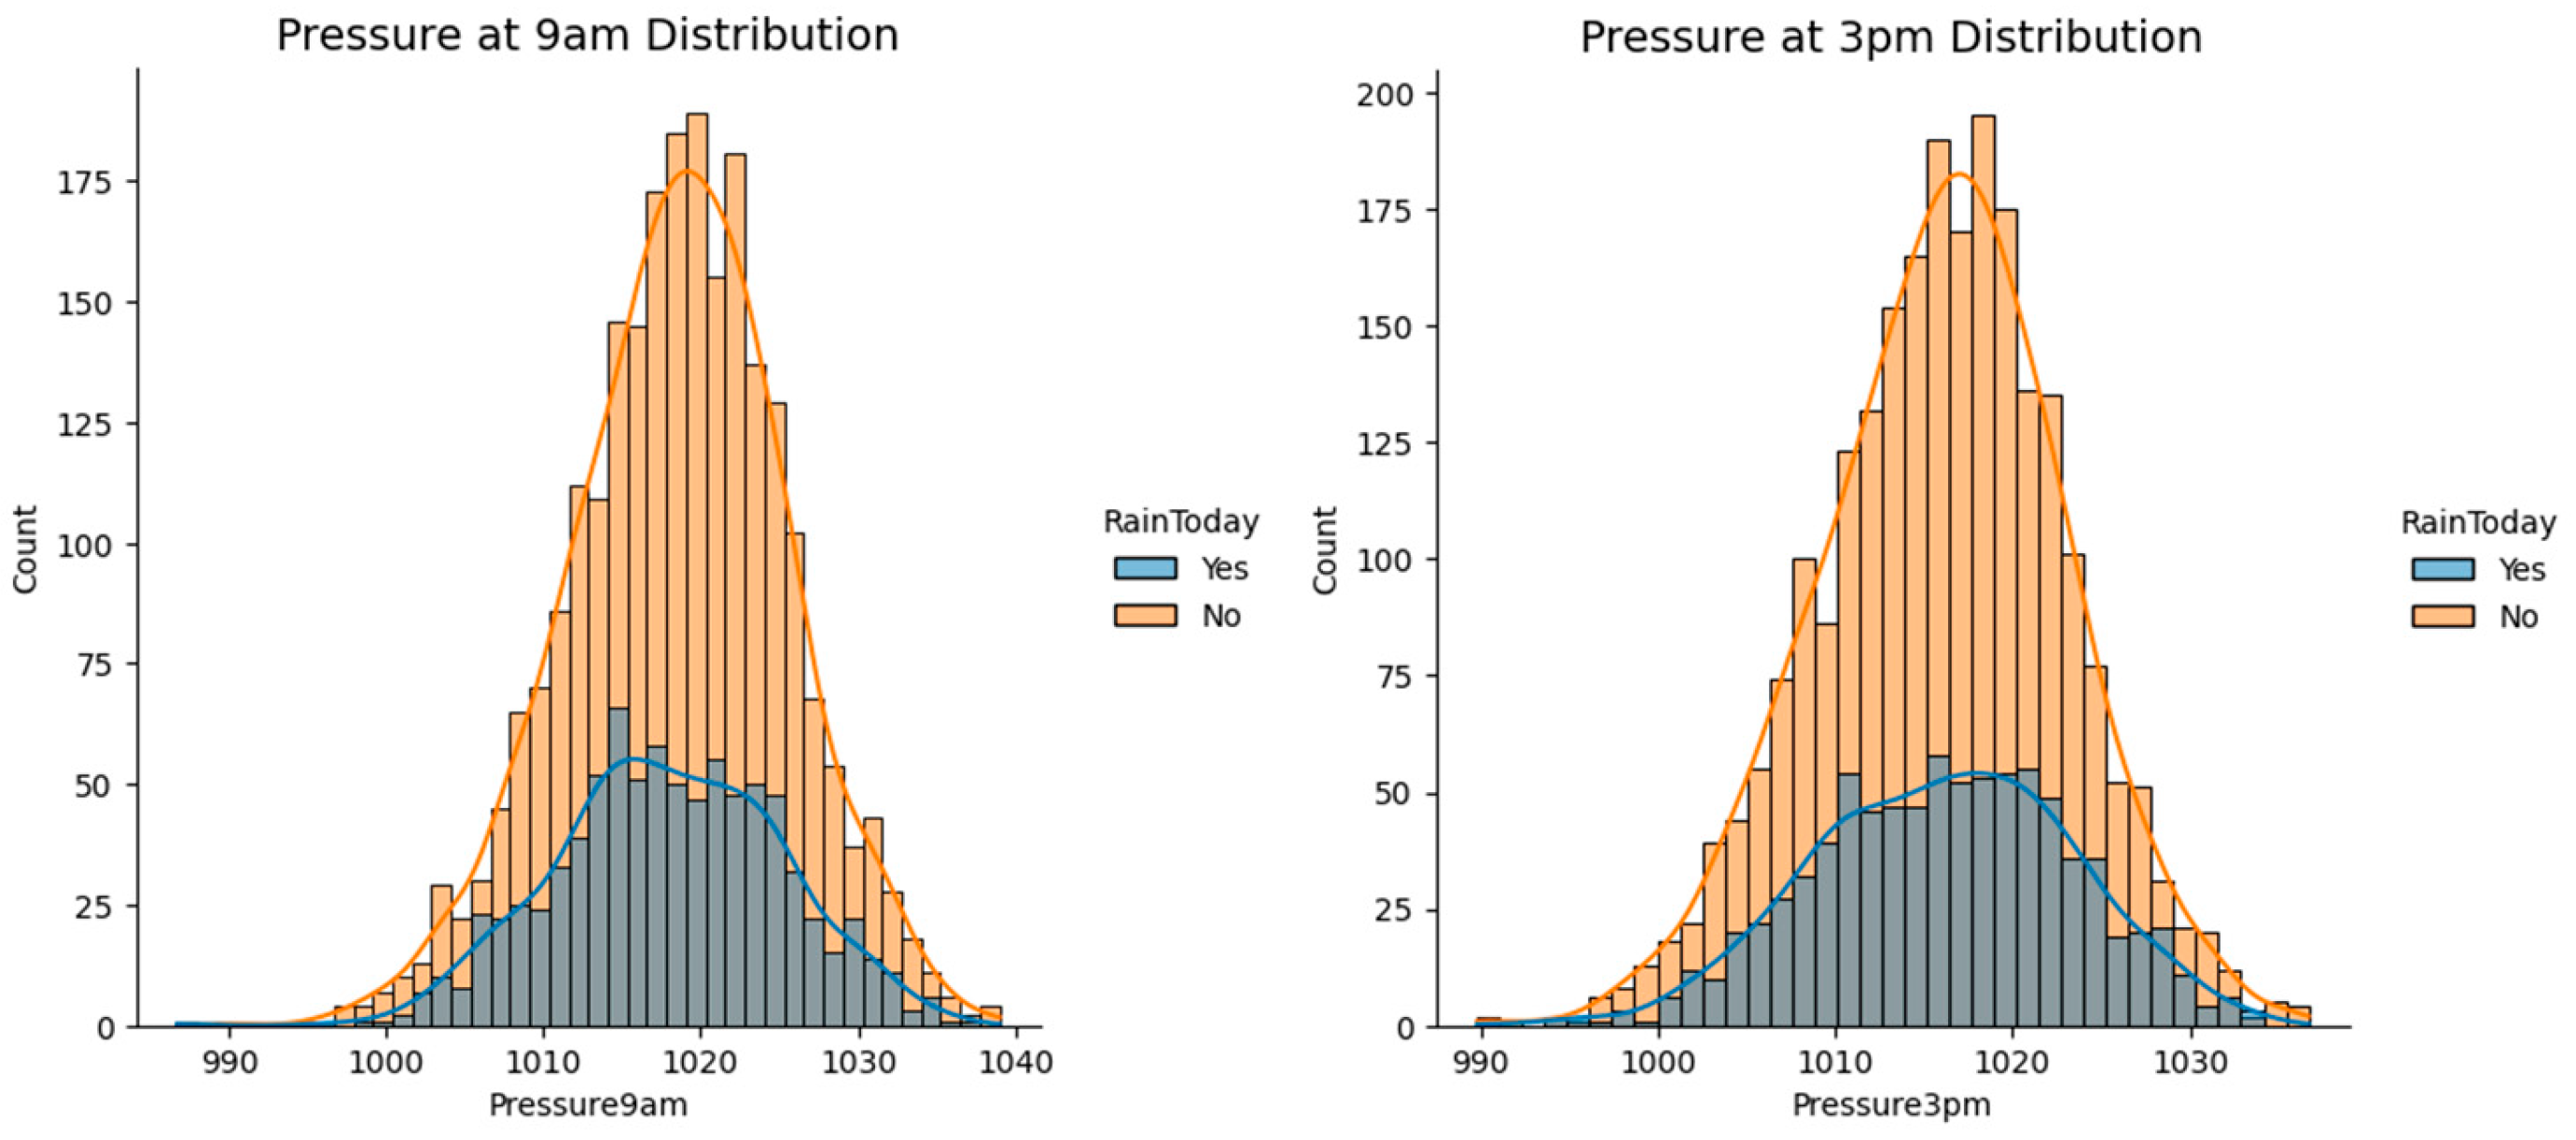
The wind pressure ranges from 980.5 to 1042 Hectopascal (hPa) at 9:00 AM.
Figure 7a illustrates that the 1024.68 hPa pressure has the highest frequency in the dataset.
Figure 7b illustrates that the pressure range at 3 PM is 988.2 hPa to 1039.6 hPa, with 1015.28 hPa of pressure having the highest frequency in the dataset.
4.2. EDA
In this section, the average speed, average humidity, and average temperature per month analysis is performed.
4.2.1. Average Speed Analysis
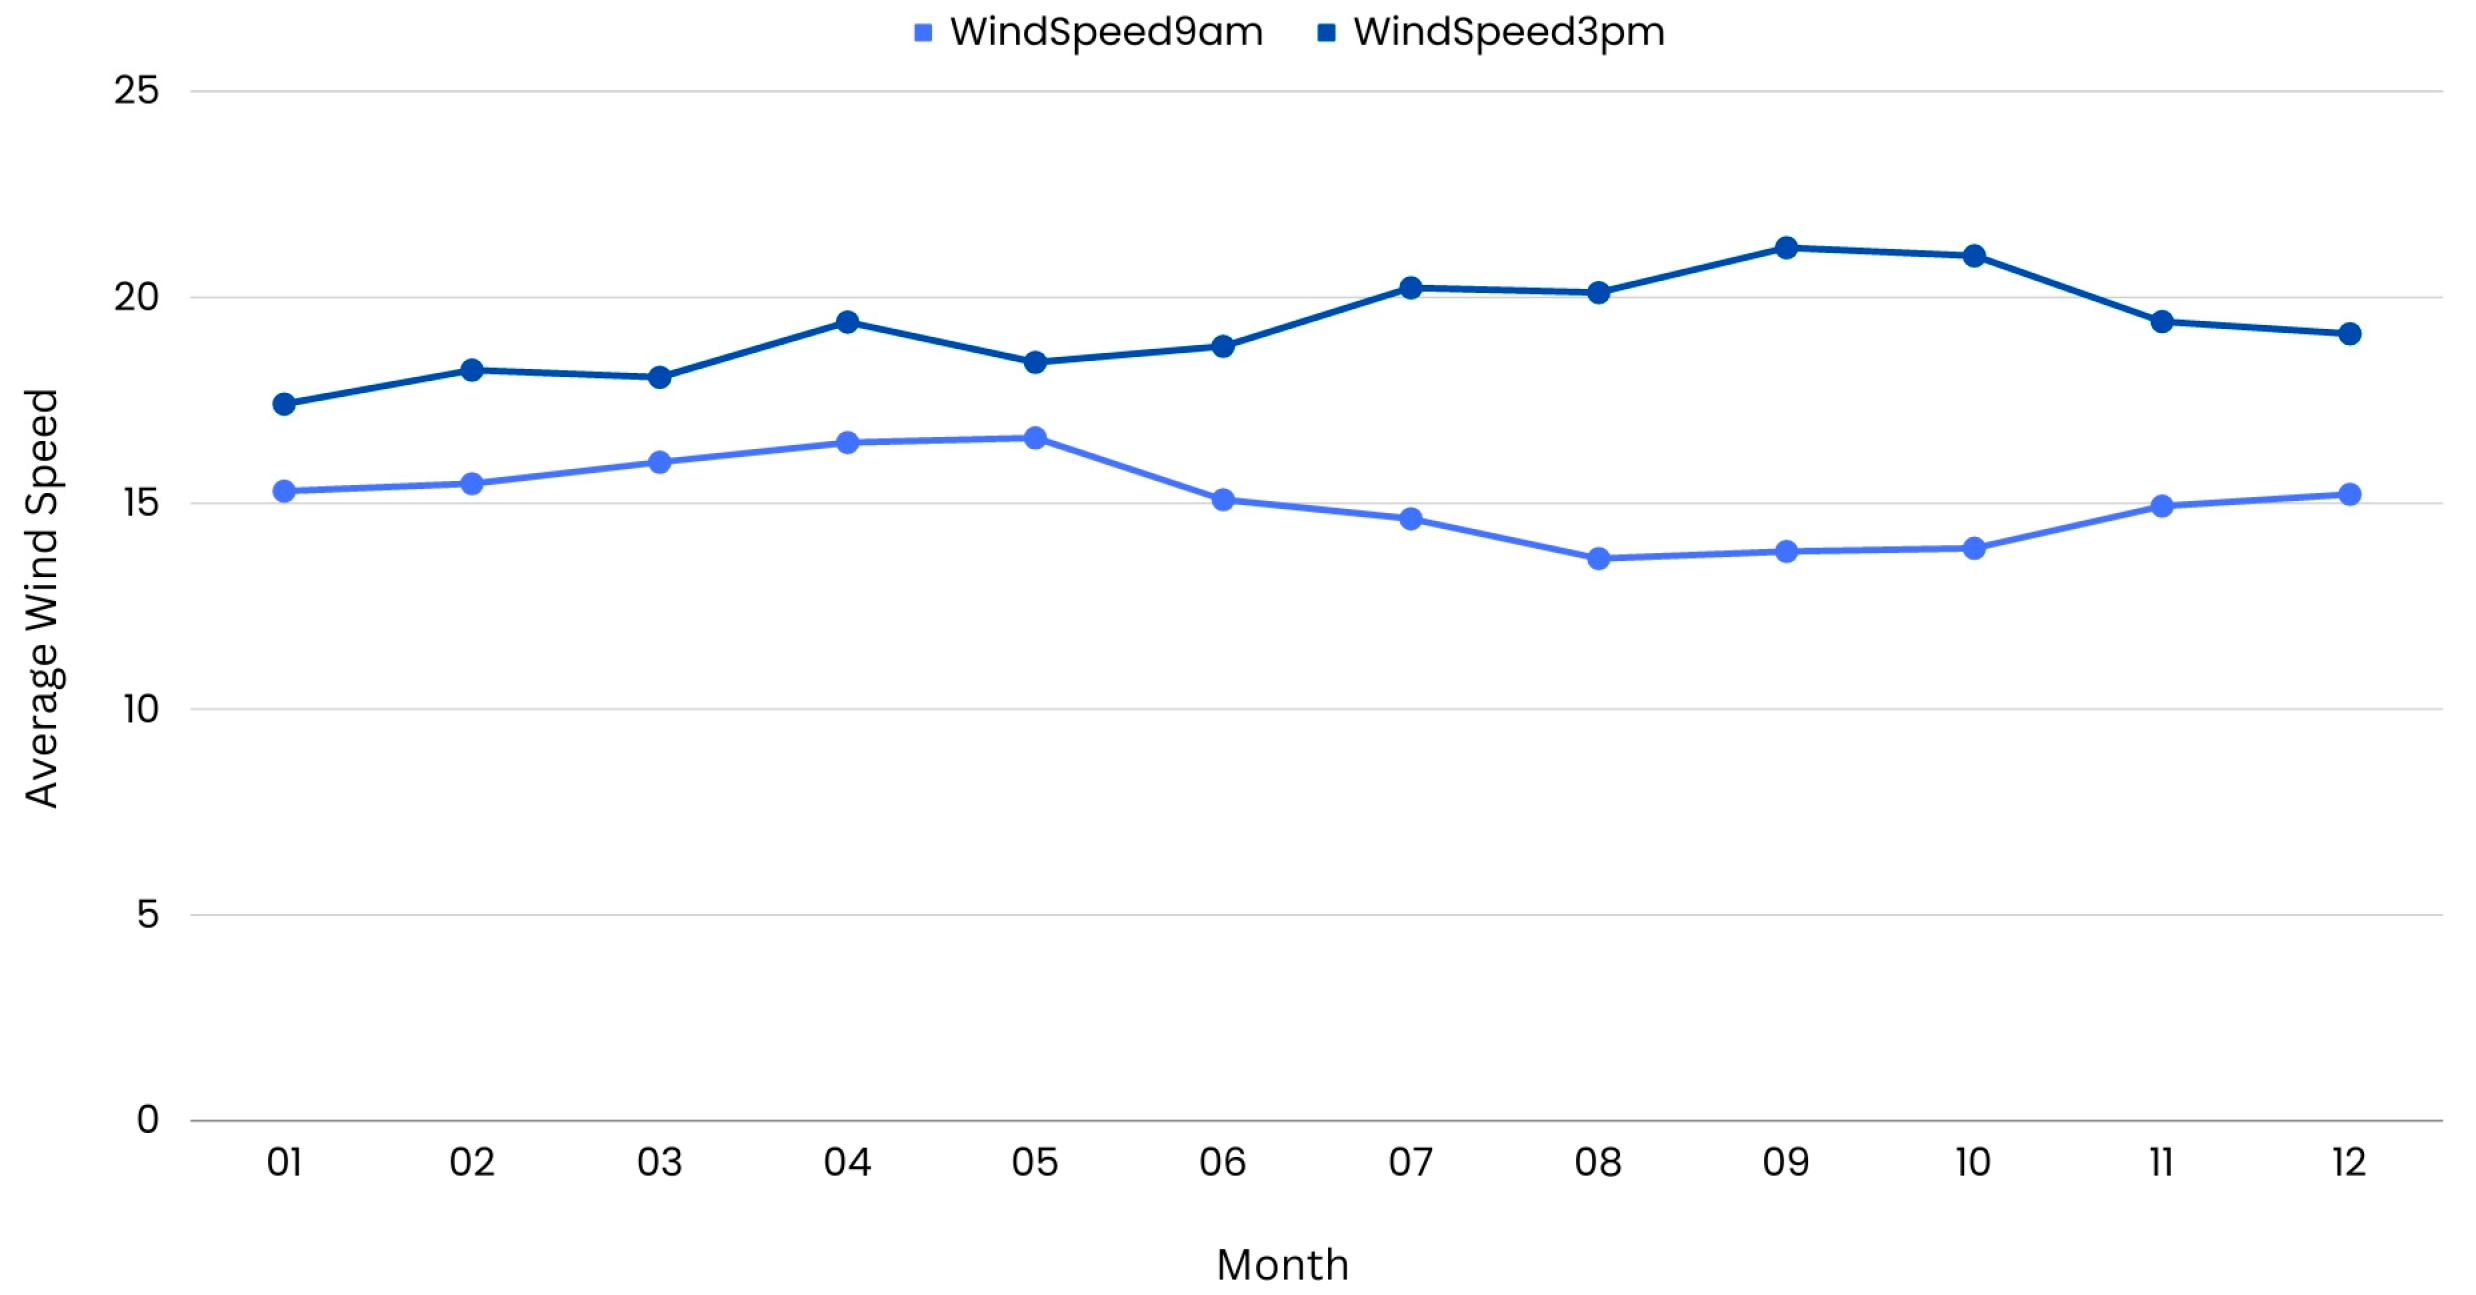
The monthly average wind speed data helps us understand how wind patterns change with the seasons. The results of the study show that wind speeds are usually not too high in the first few months of the year. At 9 a.m. in January, the average speed of the wind was about 15.29 km/h. In February, it picked up a bit, reaching 15.47 km/h. There was a small rise in the average wind speed at 9 a.m. in March, hitting about 15.99 km/h. Based on this view, it looks like spring has begun. As spring turns into late spring and early summer, wind speeds start to pick up. It has been seen that the average wind speed at 9 a.m. in April goes up, hitting 16.47 km/h. After that, in May, this wind speed jumped to 16.58 km/h. There is a noticeable drop in wind speed in June, with a recorded speed of 15.08 km/h at 9 a.m., suggesting a generally calm atmosphere. As the spring months give way to summer, especially in July and August, wind speeds tend to pick up even more. When it's 9 a.m. in July, the wind speed can reach 14.61 km/h. Following this, in August, the wind speed went up even more, hitting 13.65 km/h. Based on these numbers, it looks like the wind was stronger during this time. As summer turned into autumn, the wind speed picked up a lot in September, with an average of 13.82 kilometers per hour at 9 a.m. At 9 a.m. in October, the wind is usually blowing at 13.90 km/h. In the last few months of the year, especially November and December, wind speeds drop from their highest point in the summer to a very low level. The average wind speed at 9 a.m. in November is 14.92 km/h, and at the same time in December, it is 15.21 km/h, marking the end of the year. The average windspeed by month is shown in
Table 2.
The average wind speed analysis is shown in
Figure 8.
4.2.2. Average Speed Analysis
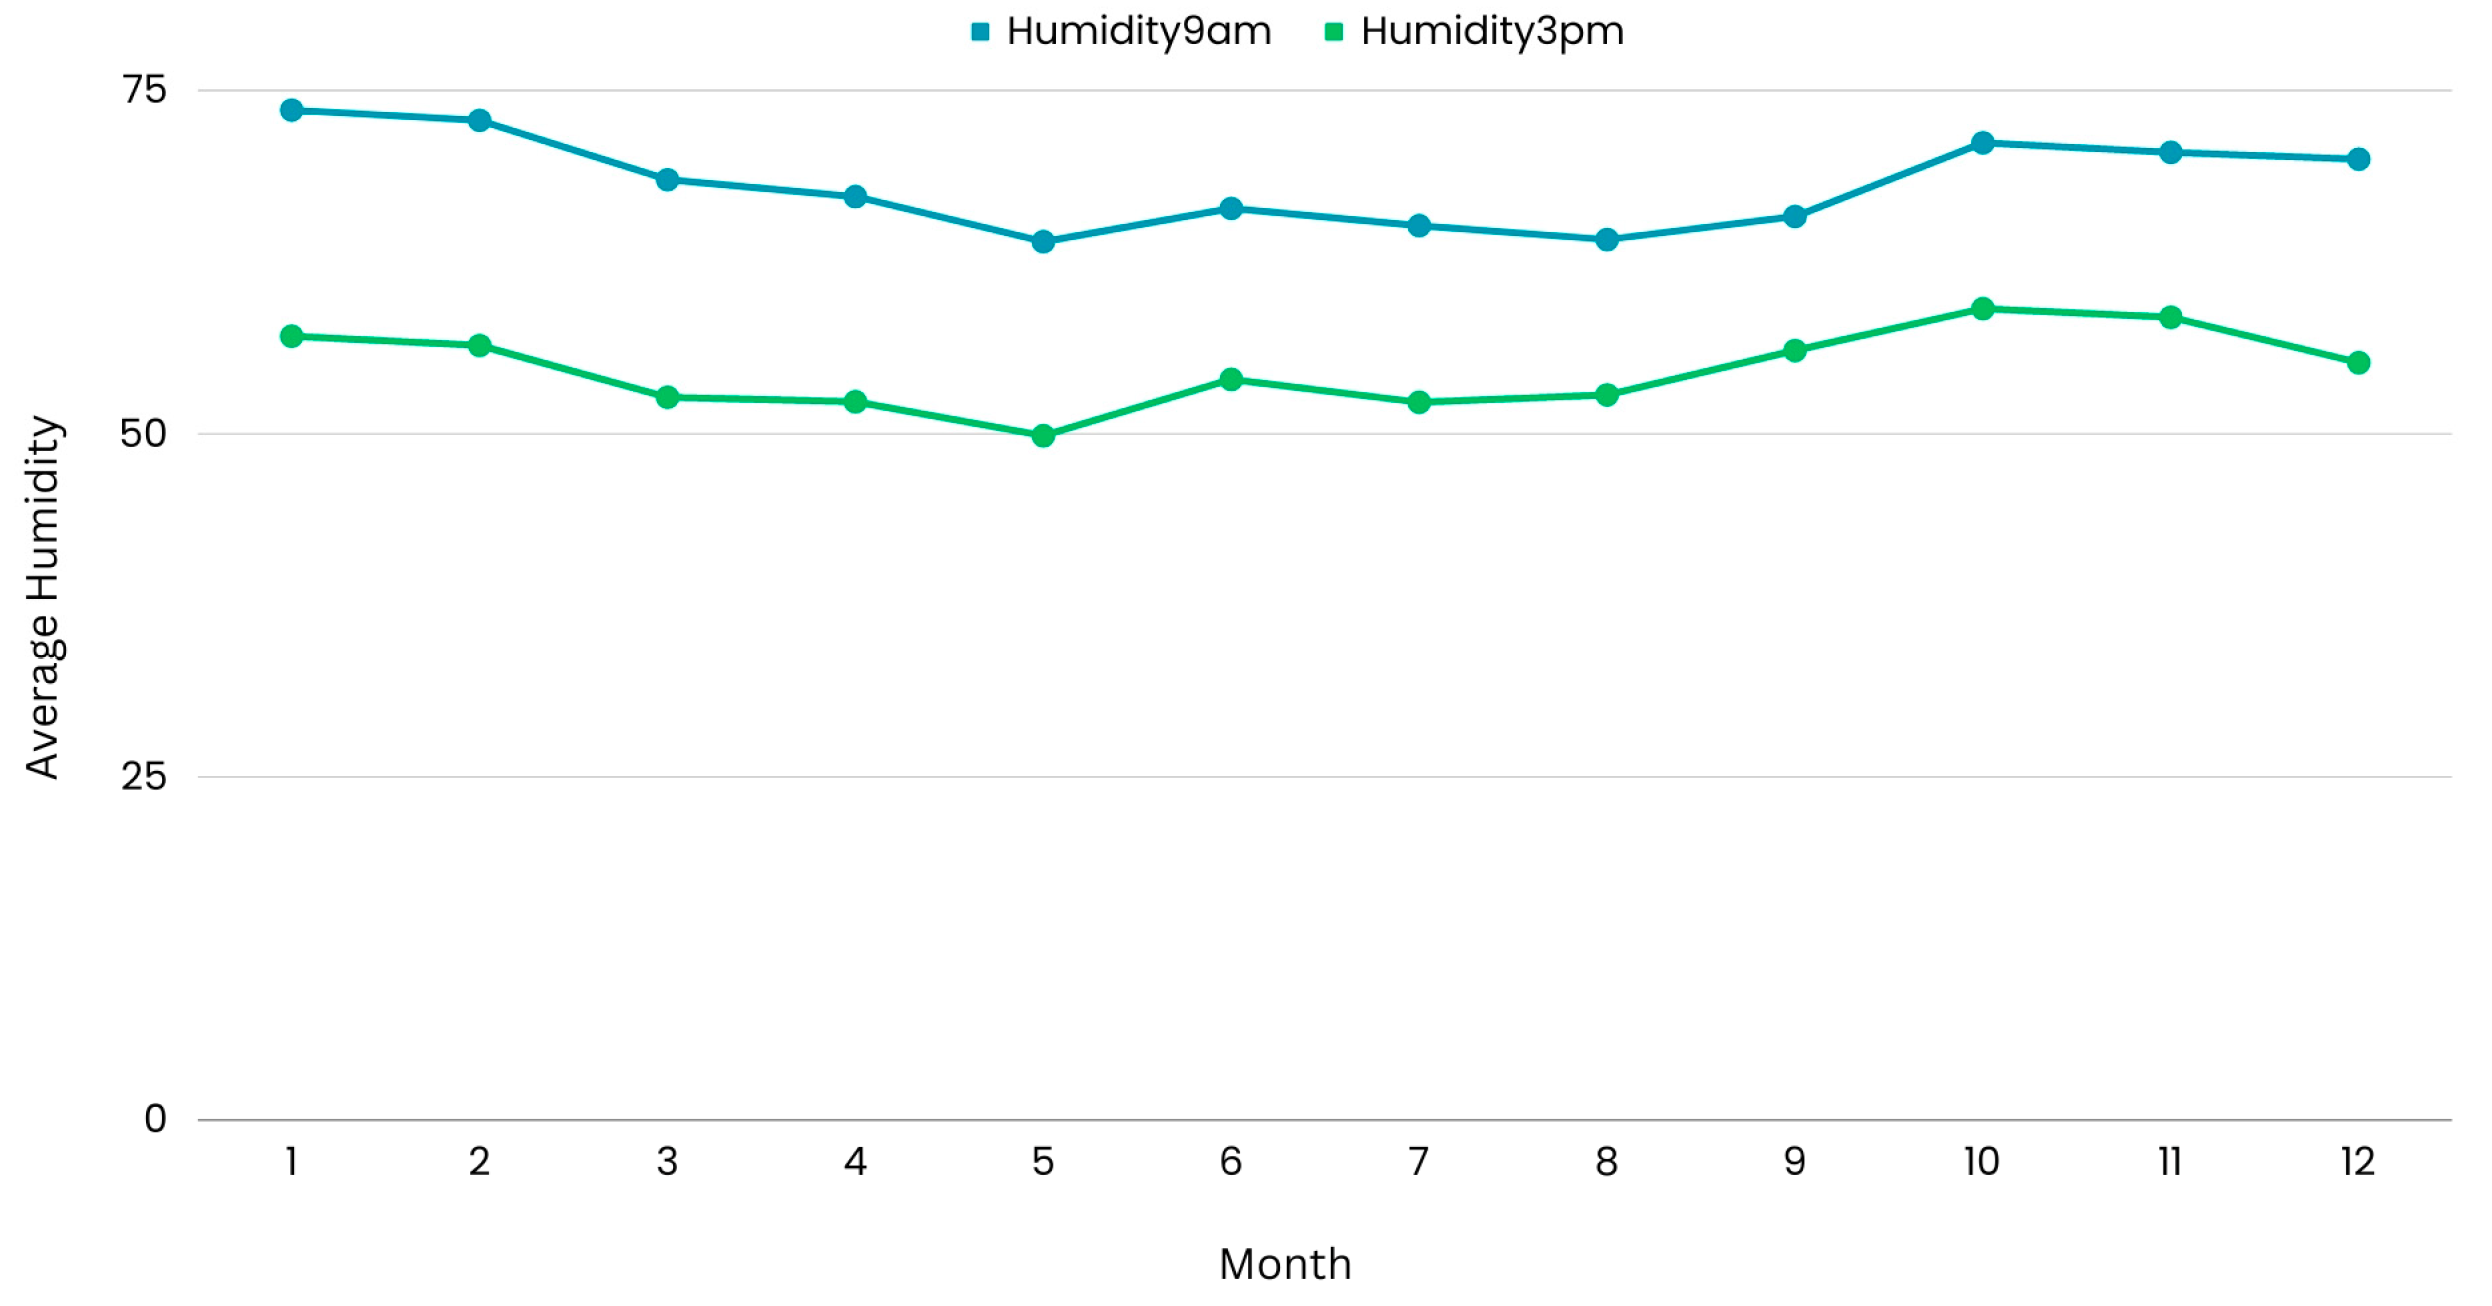
According to the dataset, there are clear regular patterns in the average relative humidity in Bangladesh during each season. In January, the humidity starts out pretty high, average 73.57% at 9 AM and 57.14% at 3 PM. During the winter months of February and March, the humidity drops gradually, hitting about 68.52% at 9 AM and 52.70% at 3 PM in March. In April and May, which are spring months, the humidity drops even more. In April, it's 67.29% at 9 a.m. and 52.37% at 3 p.m., and in May, it's 64.01% at 9 a.m. and 49.91% at 3 p.m. When summer comes back in June, the humidity starts to rise again. At 9 AM, it's about 66.43%, and at 3 PM, it's only 54%. August and July keep this growing trend going. In August, the average humidity is 52.33% at 3 p.m. and 65.18% at 9 a.m., and 64.16% at 9 a.m. and 52.87% at 3 p.m. The wettest month of the summer is September, when the humidity is about 65.84% at 9 a.m. and 56.10% at 3 p.m. In the autumn, however, humidity levels slowly drop. On average, they drop from about 71.20% at 9 AM to 59.14% at 3 p.m. in October and November to 70.50% at 9 AM and 58.51% at 3 p.m. December sees a return to lower humidity levels, with an average of 70.01% at 9 AM and 55.21% at 3 PM. The average humidity per month is shown in
Table 3.
The average monthly humidity analysis is shown in
Figure 9.
4.2.3. Average Temperature Analysis
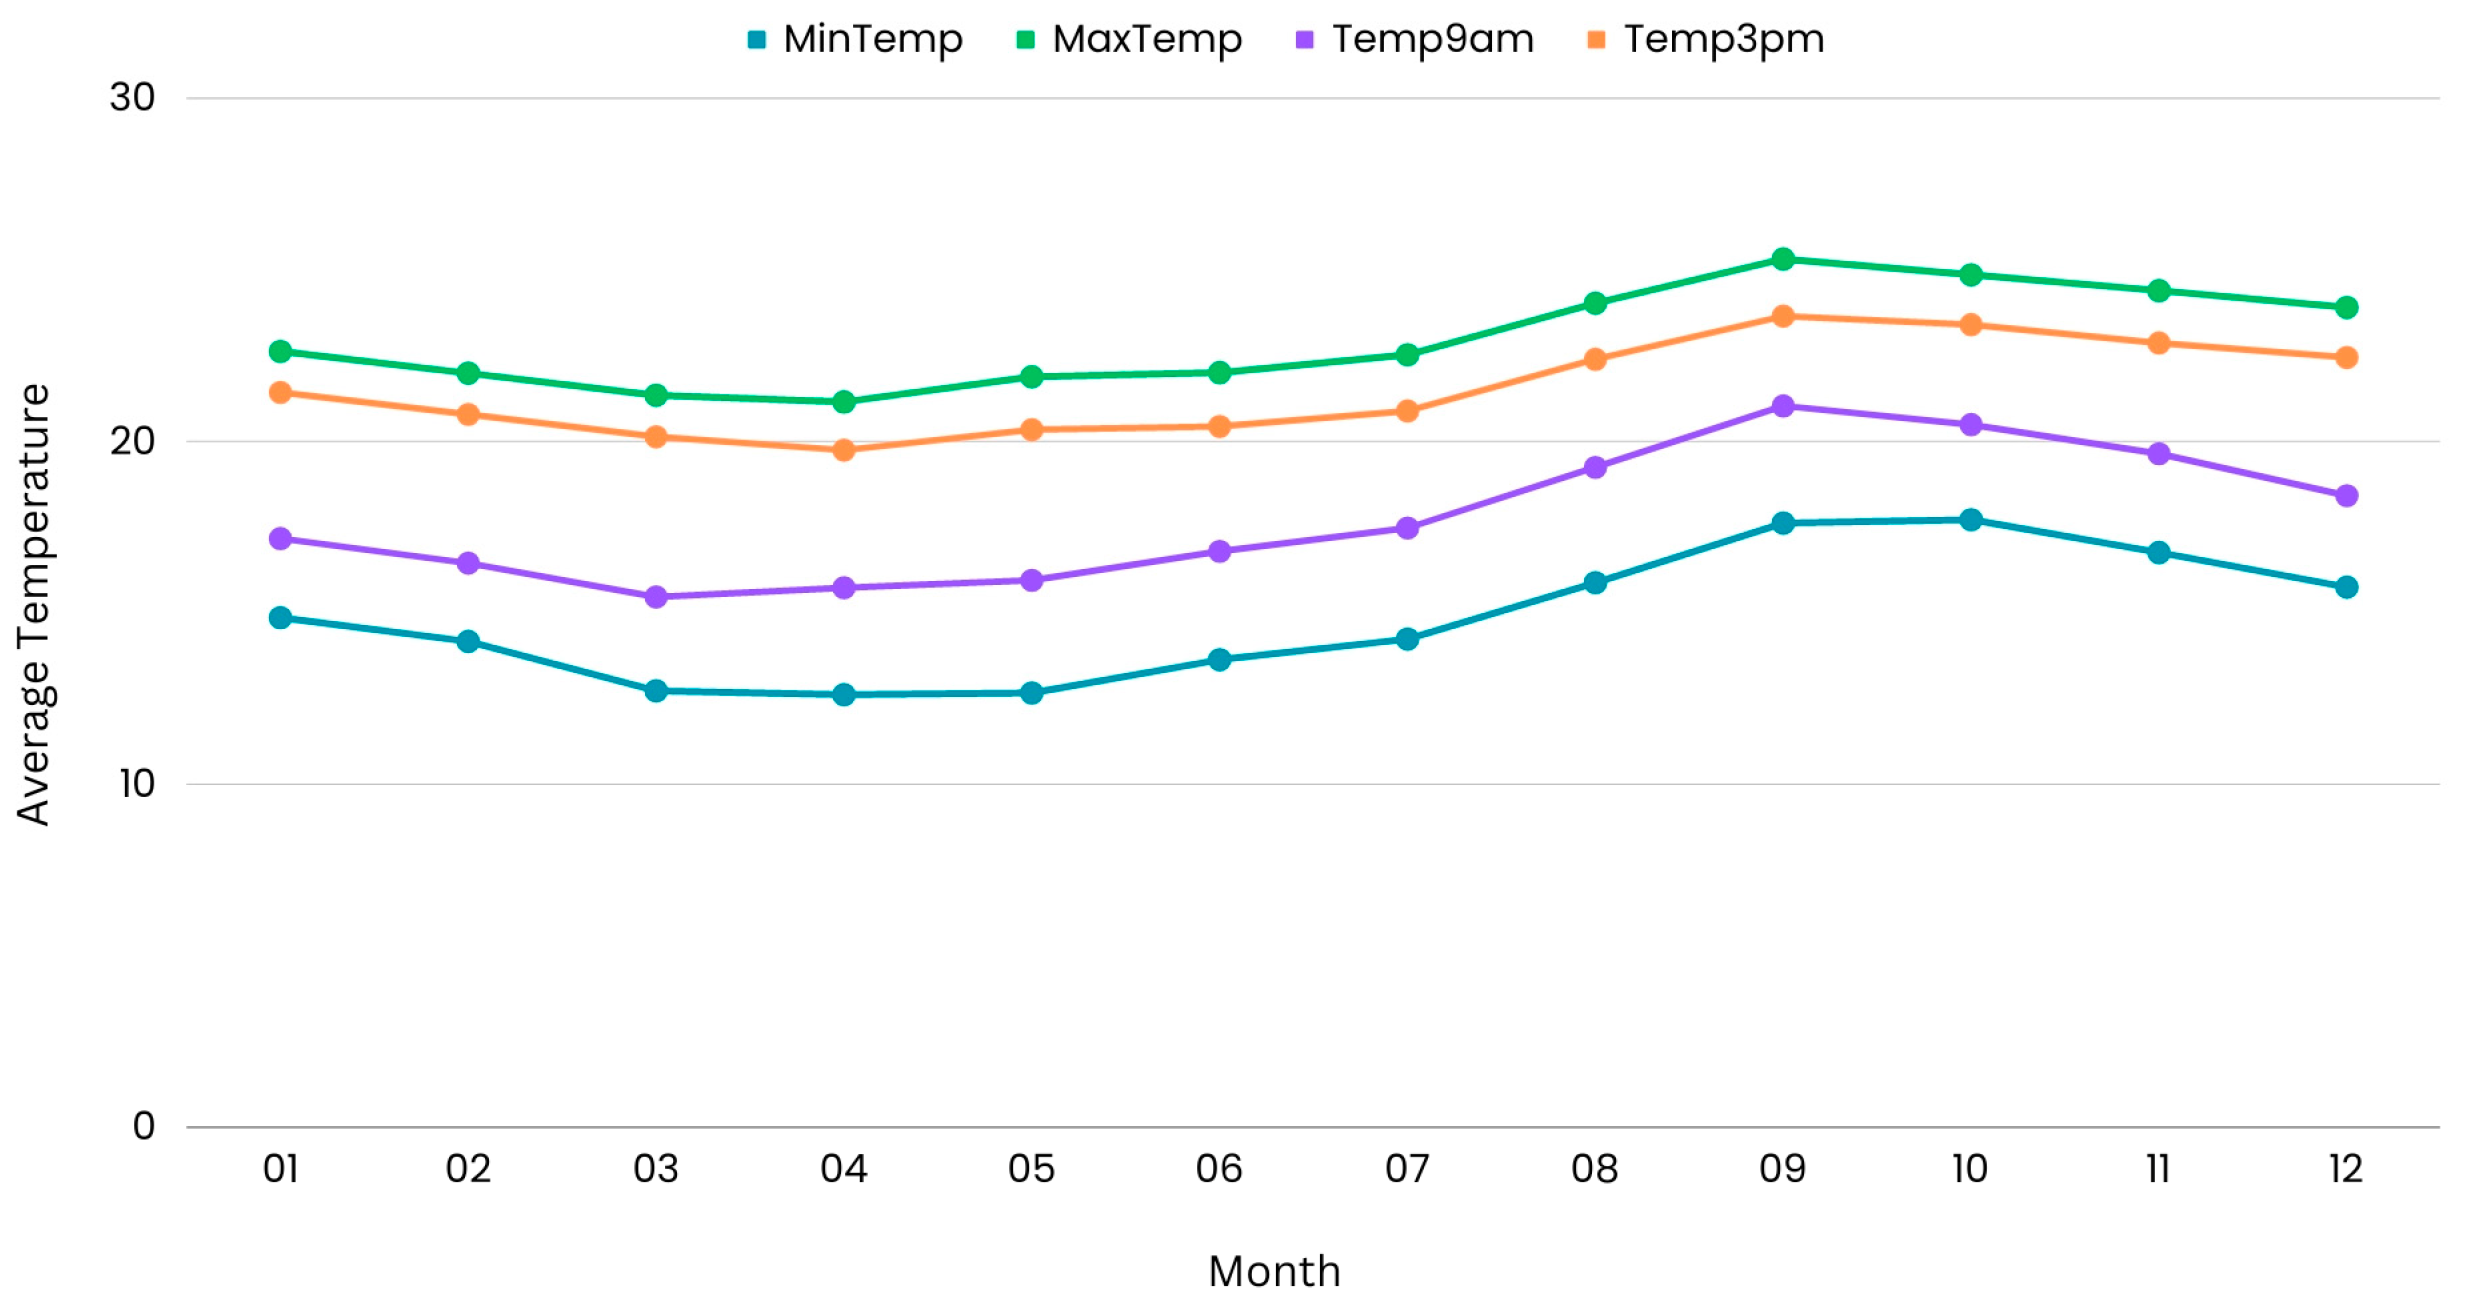
The average temperature data analysis reveals unique seasonal patterns. The weather is warm in January and February, with an average high temperature of 22.6°C and pleasant afternoon temperatures. In March and April, the start of spring, temperatures rise to a modest level, with a maximum rise of about 21.3°C on average. When May comes around, the temperature goes up even more, reaching a usual high of 21.9°C. There are gradual rises in temperature from June to August, which is summer. July and August have the highest normal maximum temperatures, at about 22.5°C. In September and October, the temperature steadily dropped, going from 24.8°C in September to 24.4°C in October. This is because it is fall. November and December are the last two months of the year. The weather is usually mild during these months, with normal high temperatures of about 24.4°C and 24.1°C. The average temperature per month is shown in
Table 4.
The month-wise average temperature analysis is shown in
Figure 10.
5. Implementation
This section contains the overview of the data preprocessing process using standardizing and transforming variables, along with the Rainfall occurrence prediction, Rainfall amount prediction, and temperature prediction.
5.1. Data Processing
The dataset used in this research work is collected from Kaggle. The dataset consists of Bangladesh weather data of 10 years with daily weather observations from many locations across the country, with data for each day from 2013 to 2022.
5.1.1. Standardize the Variables
The scale of the variables is significant, as the classifier and regressor utilize the identification of the nearest test observations to predict the class and values of a given test observation. Variables with a large scale exert a considerably greater influence on the distance between observations. Standard Scaler is implemented for standardizing the variables during pre-processing. This process involves calculating the mean and standard deviation for each feature. The scaler then subtracts the mean from each feature and divides the result by the standard deviation. Further, the transform method of Standard Scaler is used for scaling transformation based on the mean and standard deviation of parameters.
5.1.2. Transforming Categorical Variables
Initially, it is important to transform categorical values into binary variables. The get_dummies() method in pandas will be used for this. Then, the categorical values within the 'RainToday' column are substituted with binary values, transforming the column from a categorical representation to a binary one. The get_dummies method is not utilized to avoid the creation of duplicate columns for the variable 'RainToday', the target variable of interest.
5.2. Rainfall Occurrence Prediction
The rainfall occurrence prediction uses machine learning techniques, including Logistic Regression, KNN, Decision Tree, Random Forest, SVC, and Ensemble-based classifier. The RainToday column was selected as the target to predict the occurrence of precipitation. With a test_size of 0.35 and a random_state of 101, the train_test_split function splits the features and Y data frames for training and testing of all the models, including the ensemble classifier.
5.3. Rainfall Amount Prediction
The rainfall amount prediction uses regression algorithms such as Logistic Regression, Random Forest, SVR, and Ensemble-based regressor. The rainfall column is the target variable to predict how much rain will fall in millimeters (mm) for a given day. With a test_size of 0.35 and a random_state of 101, the train_test_split function splits the features and Y data frames for training and testing all the regressor algorithms, including the ensemble regressor.
5.4. Daily Average Temperature Prediction
The daily average temperature prediction is also performed using regression algorithms such as logistic regression, random forest, SVR, and ensemble-based regression. The average temperature for a certain day is predicted in Celsius (oC). The Temp9am, Temp3pm, MinTemp, and MaxTemp columns generate a new column, AvgTemp, the target variable. With a test_size of 0.35 and a random_state of 101, the train_test_split function splits the features and Y data frames for training and testing all the regressor algorithms, including the ensemble regressor.
6. Results and Discussion
This section contains the results for the rainfall occurrence prediction using the machine learning models and the ensemble classifier, along with the rainfall amount prediction and daily average temperature prediction using regression algorithms and the ensemble classifier.
6.1. Rainfall Occurrence Prediction
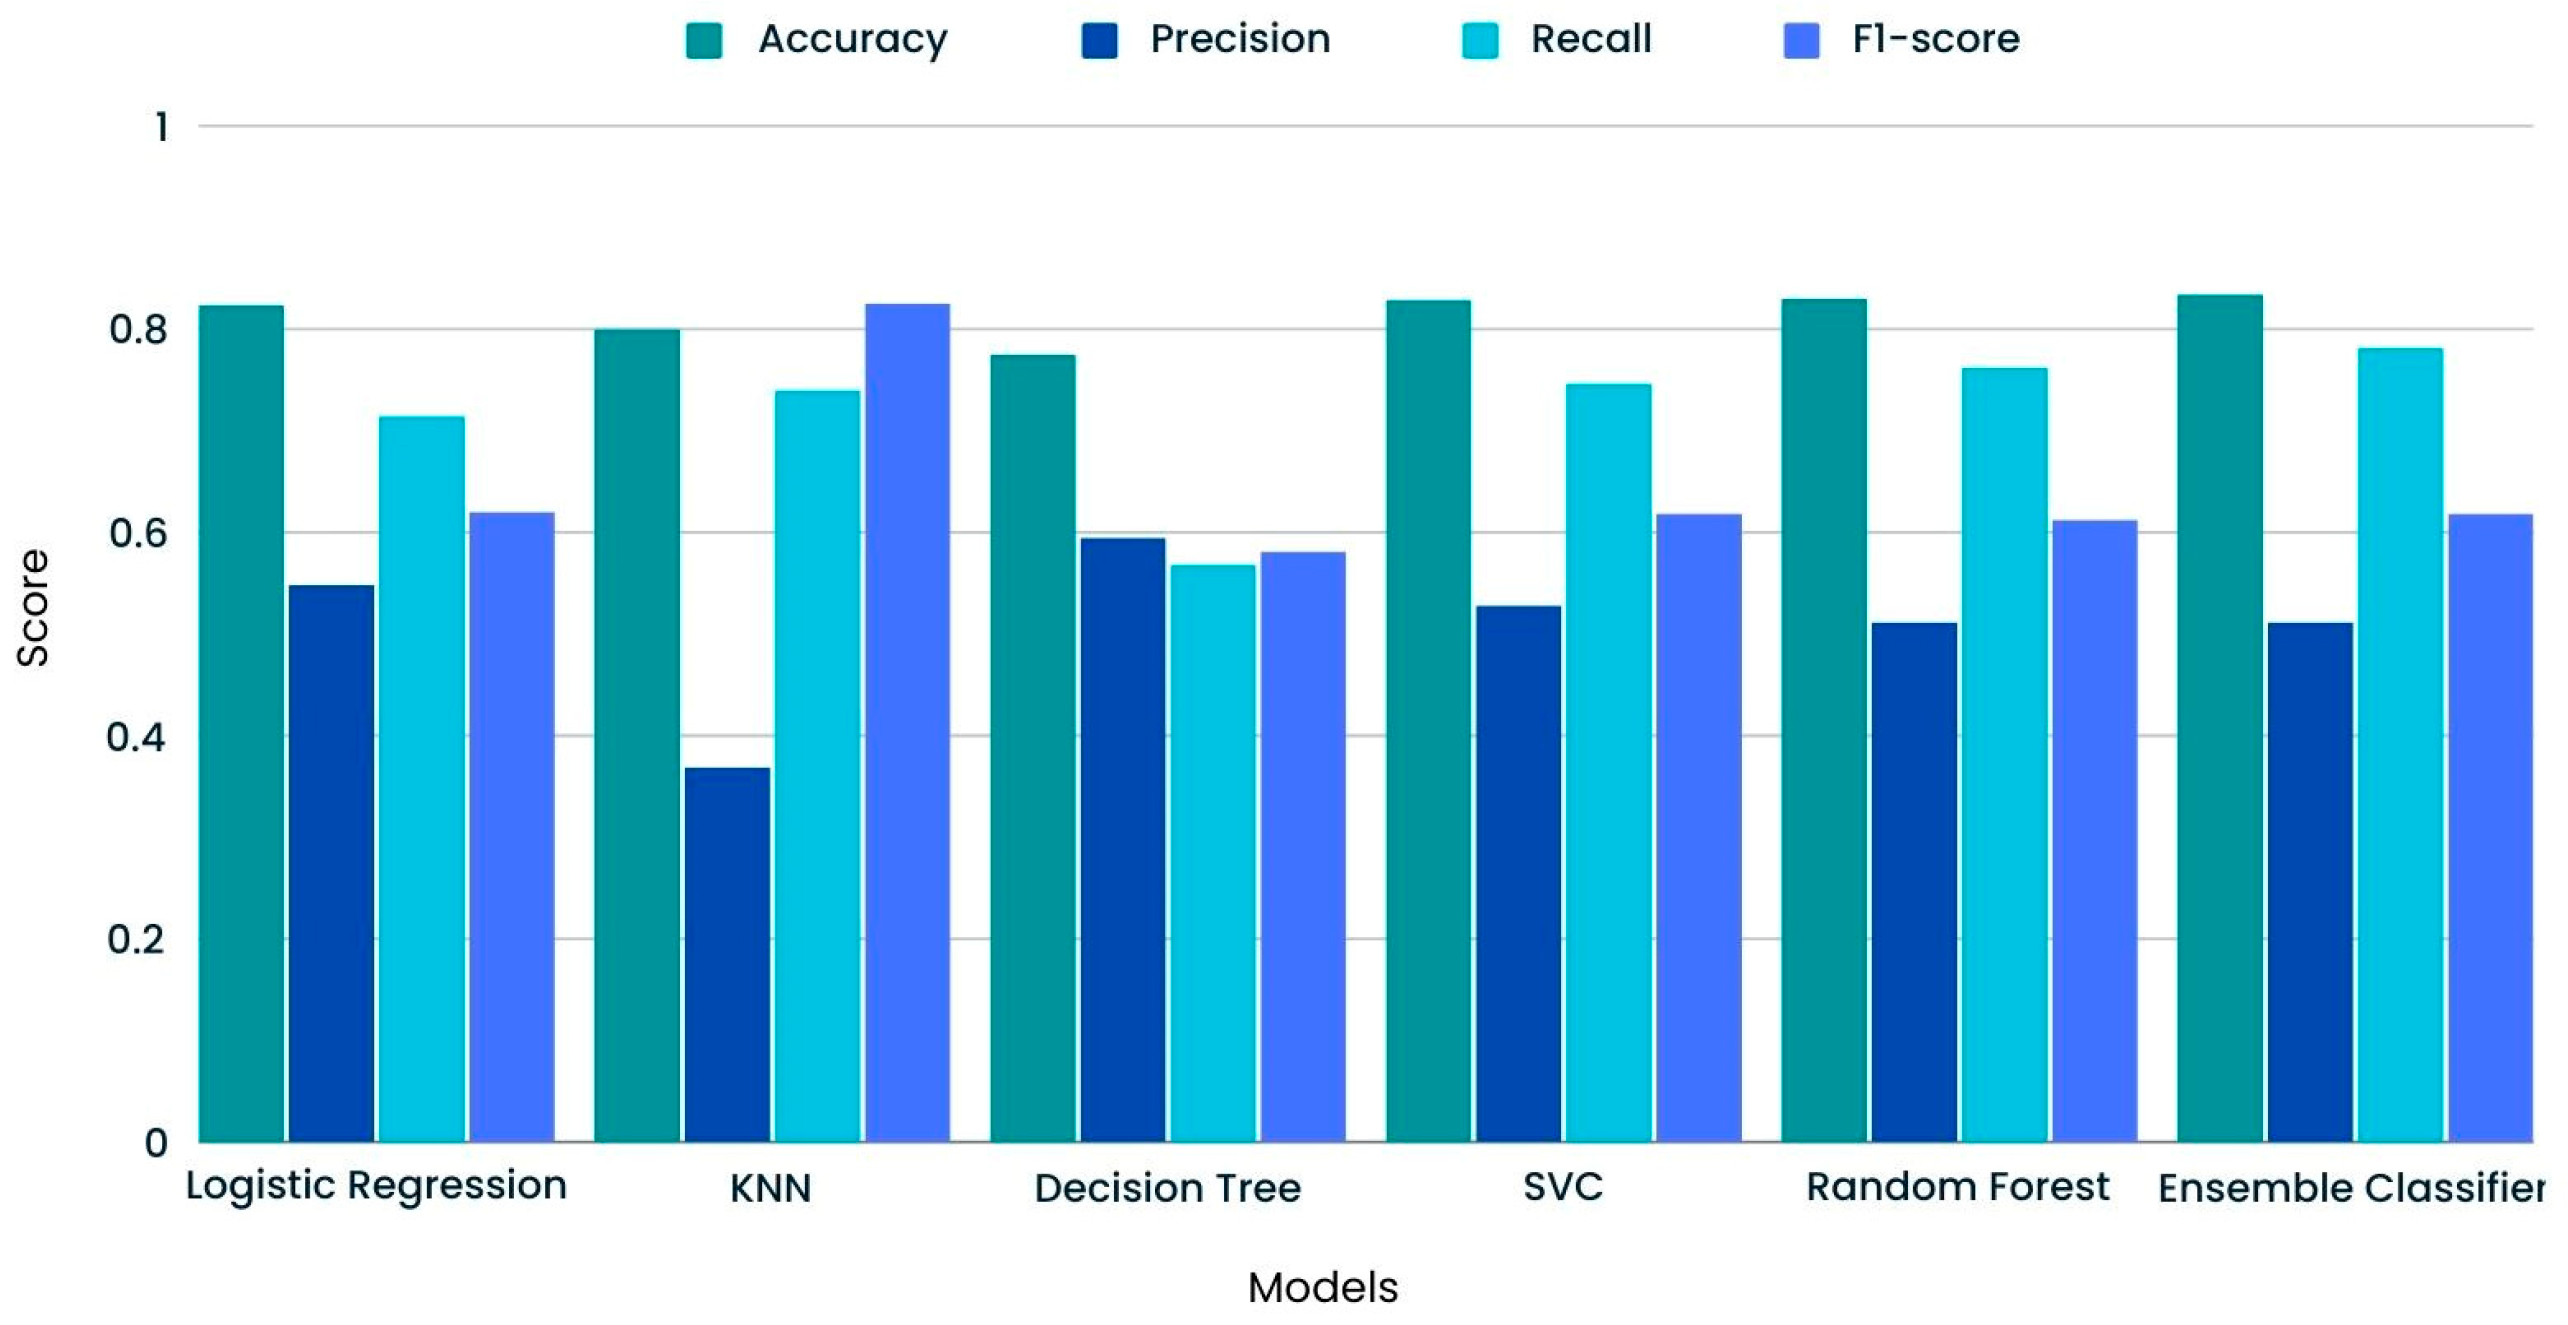
When comparing different classification algorithms based on their accuracy, precision, recall, and F1 score, the Ensemble Classifier shows the highest accuracy rate (83.41%). Based on this result, the Ensemble Classifier can correctly guess more cases. Still, the model's precision, which is the number of correct positive guesses, is 51.16%, which is the same as the Random Forest model's precision. The Ensemble Classifier's recall metric works very well, with a value of 78.17%, which means it is very good at finding all relevant cases. It is important to note, though, that the Decision Tree has a much lower memory rate, at 56.82%. There is a lot of consistency between all models in the F1 score, which balances precision and recall. For F1 score of 61.85%, the Ensemble Classifier performs better than others. The Logistic Regression model does a good job overall, with an F1 score of 62.03%, an accuracy of 82.36%, a precision of 54.82%, and a recall of 71.43%. Regarding precision and F1 score, the SVC works in the same way as Logistic Regression. It does, however, have worse accuracy and recall. The KNN algorithm has an impressively high F1 score of 82.53%, even though it is less accurate at 80%. This F1 score shows that KNN strikes a good balance between accuracy and recall when correctly guessing events in its environment. It is slightly more accurate than the SVC algorithm (82.97% vs. 82.97% for the Random Forest algorithm). It's important to note, though, that Random Forest has the lowest accuracy, at 51.16%. Taking all of these measurements together shows that the Ensemble Classifier has better accuracy and memory, but it's important to consider the loss of precision. Logistic Regression and SVC models, on the other hand, do better across all measures.
Table 5 contains the accuracy, precision, recall, and F1 score for rainfall occurrence prediction for the machine learning models and the Ensemble classifier.
The comparison of the machine learning classifiers, along with the ensemble-based classifier using accuracy, precision, recall, and F1-score of the machine learning models the ensemble classifier is shown in
Figure 11.
6.1.1. Rainfall Prediction Comparison
The results of rainfall prediction using an ensemble classifier are compared with a similar study [
28], which implements ensemble-based model using multiple machine learning methods including Naïve Bayes (NB), Decision Tree (DT), Support Vector Machine (SVM), Random Forest (RF) and Neural Network (NN), and Artificial Neural Network (ANN) for the performance metrics including accuracy, precision, recall, and f-score.
Table 6 shows the comparison of our model performance with the existing ensemble-based model.
6.2. Rainfall Amount Prediction
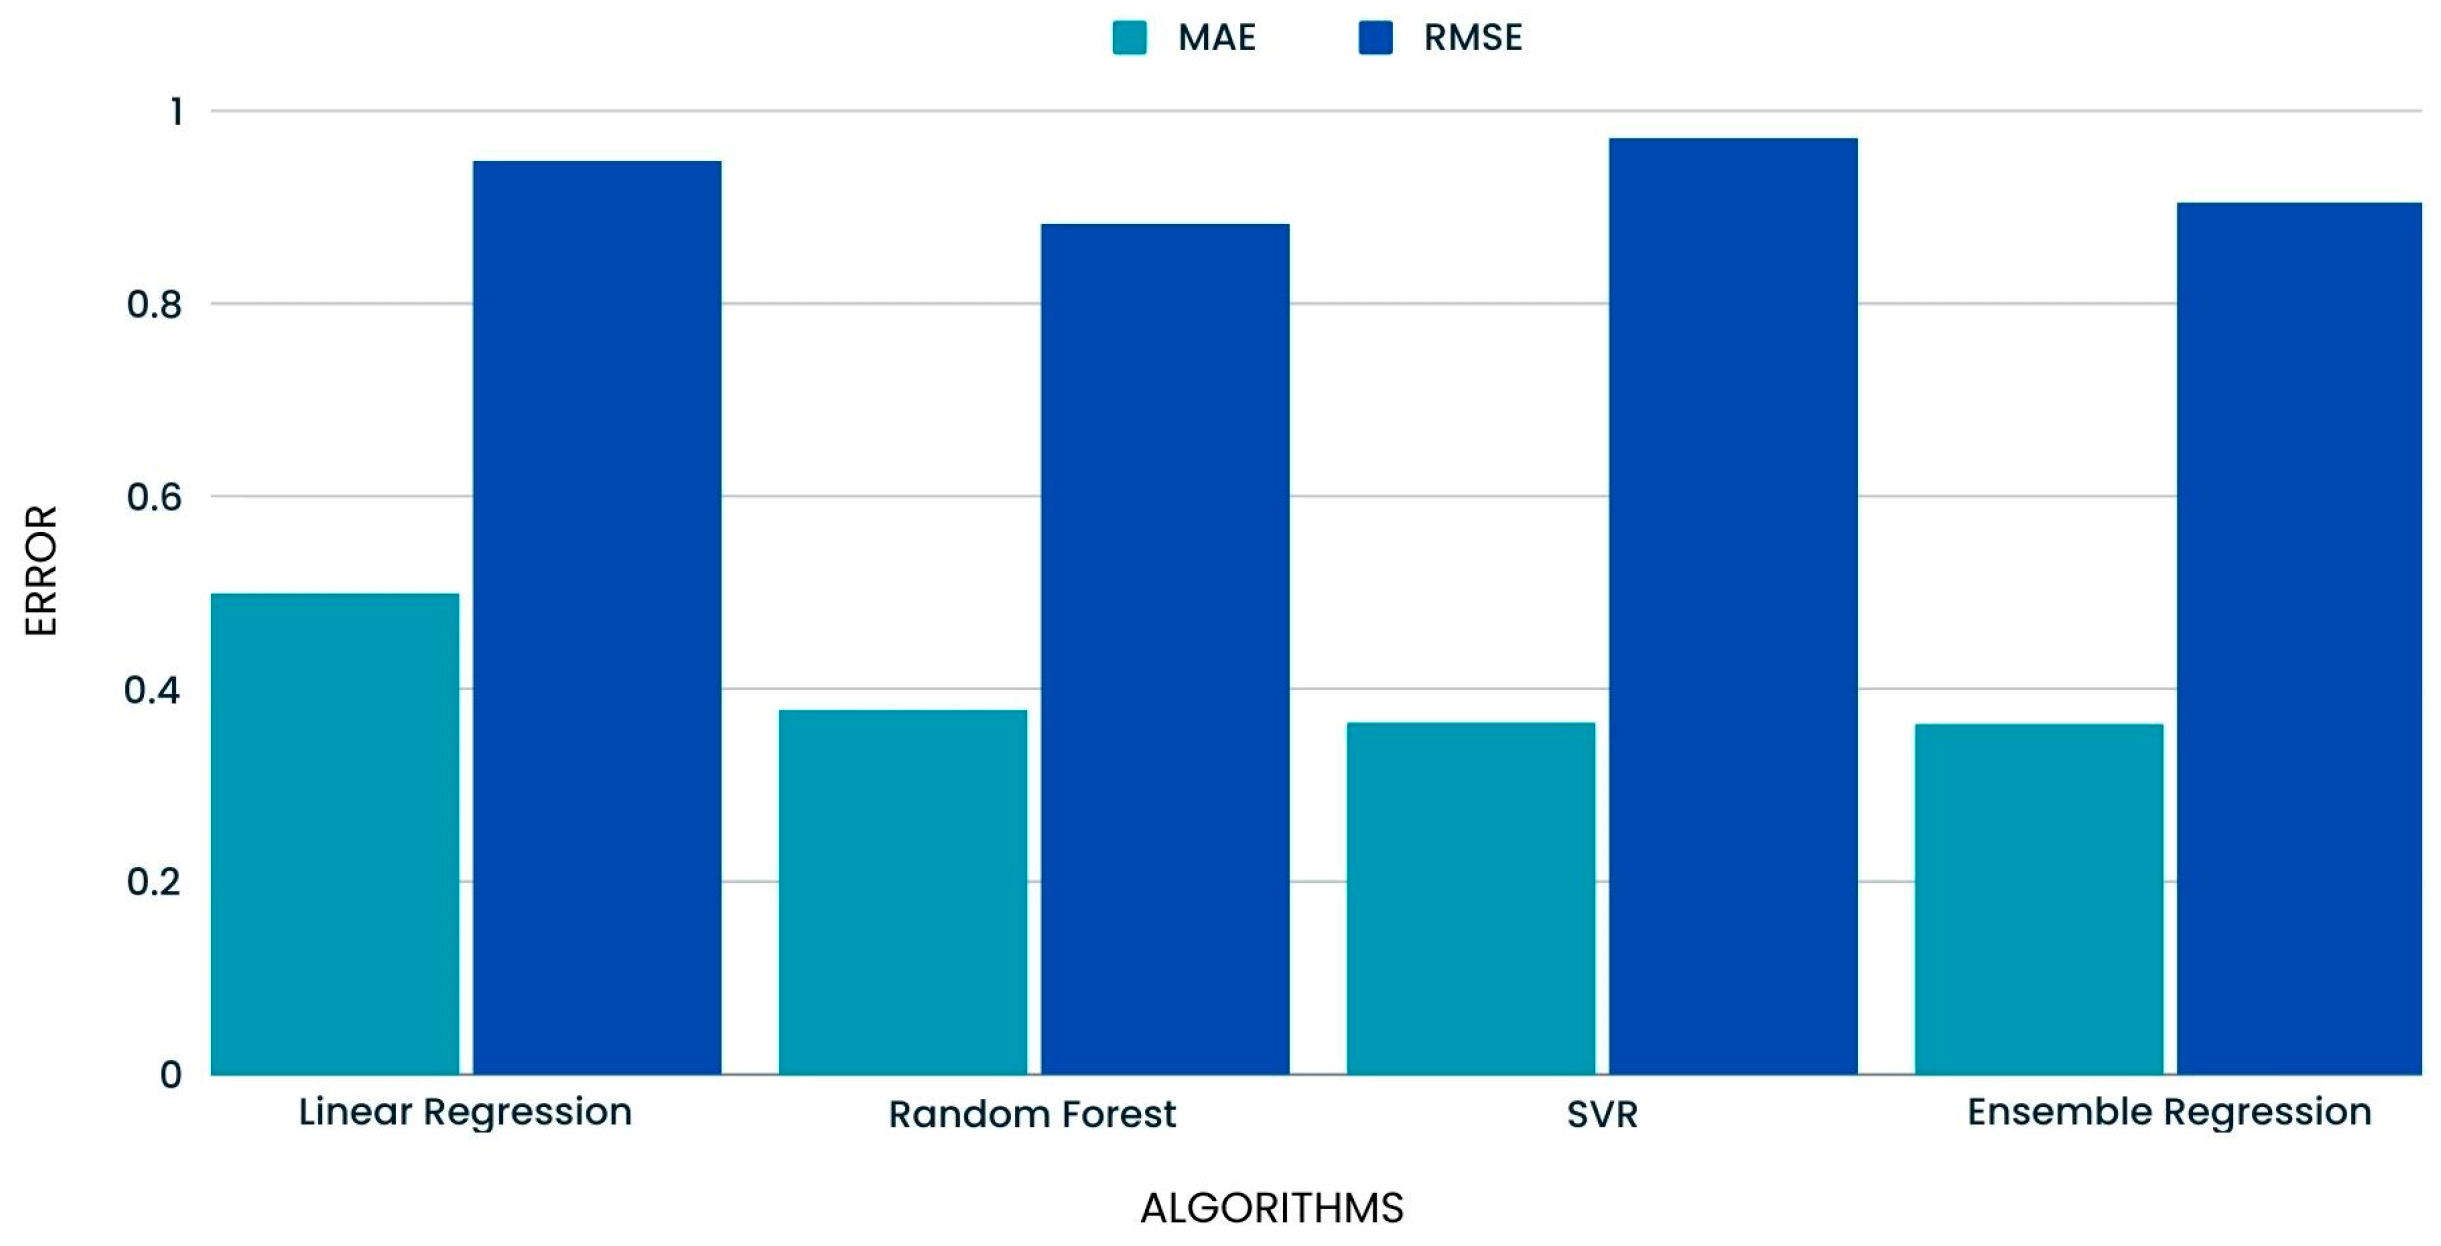
The effectiveness of various machine learning regression models can be evaluated using MAE and RMSE, two essential metrics for assessing predicted accuracy. Significant variations in the accuracy of regression algorithms can be observed when comparing their performance. Linear regression exhibits comparatively greater values of MAE and RMSE, indicating constraints on its predictive accuracy. In contrast, the Random Forest algorithm demonstrates enhanced performance by exhibiting lower MAE and RMSE values, suggesting higher accuracy in its predictive capabilities. The SVR model has a decreased MAE but a greater RMSE, indicating the possibility of enhancing predictive accuracy. The Ensemble Regression model performs better by achieving the optimal trade-off between MAE and RMSE. Consequently, it outperforms all other assessed models in terms of prediction accuracy.
Table 7 contains the MAE and RMSE for rainfall amount prediction using the regression algorithms and the Ensemble classifier.
The comparison of the MAE and RMSE of the regression algorithms along with the ensemble classifier is shown in
Figure 12.
6.3. Daily Average Temperature Prediction
The performance of various machine learning regression models is evaluated using two critical metrics: MAE and RMSE. Linear regression, albeit exhibiting a certain degree of predictive capability, demonstrates comparatively elevated values for MAE and RMSE. In contrast, the Random Forest model demonstrates enhanced accuracy, as evidenced by lower MAE and RMSE, suggesting more exact predictions. The efficiency of SVM in generating accurate predictions is indicated by its lower MAE and RMSE. Nevertheless, the Ensemble Regression model performs better than the other models assessed. This model demonstrates a commendable equilibrium between MAE and RMSE, resulting in the most precise predictions among the examined models.
Table 8 contains the MAE and RMSE for daily average temperature prediction using the regression algorithms and the Ensemble classifier.
The comparison of MAE and RMSE of the models and the ensemble classifier is shown in
Figure 13.
7. Conclusions
Forecasting rainfall involves looking at numerous variables, such as temperature, humidity, wind speed, and water level, to guess where it might rain. The most popular techniques used in rainfall forecasting are supervised machine learning techniques, which use testing data to make predictions after training predetermined example data. Finding appropriate mechanisms, balancing the sensitivity of the objective functions, and handling characteristics all present significant challenges for these systems. These variations result in variable performances, making choosing an appropriate technique for rainfall prediction difficult. This paper uses the Bangladesh Weather Dataset to implement machine learning algorithms and Ensemble-based models for the weather forecast, including rainfall occurrence prediction, rainfall amount prediction, and daily average temperature prediction. The ensemble-based model is used to improve the performance for prediction. The ensemble model used for rainfall occurrence prediction is based on a voting classifier, which uses five machine learning algorithms; however, for the rainfall amount and daily average temperature, the ensemble regressor is used by combining regression-based algorithms. The models are trained and tested using the dataset. The results show that the ensemble-based models perform better than the machine learning models for rainfall occurrence, amount, and daily average temperature prediction. The Ensemble Classifier exhibits the highest accuracy of 83.41% and recall 78.17% in predicting the occurrence of rainfall. However, its precision is tied for the lowest at 51.16%. Although the KNN achieves a lower accuracy of 80%, its high F1 score of 82.53% indicates a robust equilibrium. The Ensemble Regression model outperforms Linear Regression, Random Forest, and SVR in predicting precipitation amount, as evidenced by its lowest MAE of 0.363691 and RMSE of 0.904688. The Ensemble Regression model demonstrates its superiority over alternative regression models in daily average temperature prediction by yielding the most accurate results with MAE 0.425209 and RMSE 0.545714 as the lowest error. Ensemble methods demonstrate a consistent advantage in performance metrics across all tasks.
The main objective of this research work was the accurate prediction of rainfall occurrence and amount, along with the daily average temperature, with ensemble-based models using machine learning models. An accurate weather forecast helps mitigate the challenges of heavy rainfalls, especially in Bangladesh, which has an agriculture-based economy. In the future, ensemble-based models and other machine learning models can be applied to multiple datasets, and their performance evaluation can be. Also, the deep learning models can be applied for the predictions and compared with machine learning models, including ensemble-based models.
Author Contributions
The contributions of the authors is as follows: “Conceptualization, A. Hussain. ; methodology, A. Hussain.; software, S. Tripura.; validation, A. Hussain, and A. Aslam; formal analysis, S. Tripura; investigation, A. Hussain resources, A. Hussain and A. Aslam; data curation, A. Hussain and A. Aslam; writing—original draft preparation, A. Hussain and A. Aslam; writing—review and editing, A. Hussain and A. Aslam; visualization, A. Hussain and S. Tripura; supervision, A. Hussain; project administration, A. Hussain; funding acquisition, A. Hussain. All authors have read and agreed to the published version of the manuscript.
Data Availability Statement
The data used in this research work is publically available on Kaggle.
Conflicts of Interest
The authors declare no conflicts of interest.
References
- S. Badhiye, P. Chatur, and B. Wakode, "Temperature and humidity data analysis for future value prediction using clustering technique: an approach," International Journal of Emerging Technology and Advanced Engineering, vol. 2, no. 1, pp. 88-91, 2012.
- K. Pabreja, "Clustering technique to interpret Numerical Weather Prediction output products for forecast of Cloudburst," International Journal of Computer Science and Information Technologies (IJCSIT), vol. 3, no. 1, pp. 2996-2999, 2012.
- Parmar, K. Mistree, and M. Sompura, "Machine learning techniques for rainfall prediction: A review," in International conference on innovations in information embedded and communication systems, 2017, vol. 3.
- S. Kundu, S. K. Biswas, D. Tripathi, R. Karmakar, S. Majumdar, and S. Mandal, "A Review on Rainfall Forecasting using Ensemble Learning Techniques," e-Prime-Advances in Electrical Engineering, Electronics and Energy, p. 100296, 2023. [CrossRef]
- M. E. Mann and P. H. Gleick, "Climate change and California drought in the 21st century," Proceedings of the National Academy of Sciences, vol. 112, no. 13, pp. 3858-3859, 2015. [CrossRef]
- 6. C. C. Stephan, N. P. Klingaman, P. L. Vidale, A. G. Turner, M.-E. Demory, and L. Guo, "A comprehensive analysis of coherent rainfall patterns in China and potential drivers. Part I: Interannual variability," Climate Dynamics, vol. 50, pp. 4405-4424, 2018. [CrossRef]
- N. A. B. Klutse, B. J. Abiodun, B. C. Hewitson, W. J. Gutowski, and M. A. Tadross, "Evaluation of two GCMs in simulating rainfall inter-annual variability over Southern Africa," Theoretical and applied climatology, vol. 123, pp. 415-436, 2016. [CrossRef]
- K. Sittichok, A. G. Djibo, O. Seidou, H. M. Saley, H. Karambiri, and J. Paturel, "Statistical seasonal rainfall and streamflow forecasting for the Sirba watershed, West Africa, using sea-surface temperatures," Hydrological Sciences Journal, vol. 61, no. 5, pp. 805-815, 2016. [CrossRef]
- J. Wu, J. Long, and M. Liu, "Evolving RBF neural networks for rainfall prediction using hybrid particle swarm optimization and genetic algorithm," Neurocomputing, vol. 148, pp. 136-142, 2015. [CrossRef]
- N. Singh, S. Chaturvedi, and S. Akhter, "Weather forecasting using machine learning algorithm," in 2019 International Conference on Signal Processing and Communication (ICSC), 2019: IEEE, pp. 171-174. [CrossRef]
- S. Cramer, M. Kampouridis, A. A. Freitas, and A. K. Alexandridis, "An extensive evaluation of seven machine learning methods for rainfall prediction in weather derivatives," Expert Systems with Applications, vol. 85, pp. 169-181, 2017. [CrossRef]
- N. Srinu and B. H. Bindu, "A Review on Machine Learning and Deep Learning based Rainfall Prediction Methods," in 2022 International Conference on Power, Energy, Control and Transmission Systems (ICPECTS), 2022: IEEE, pp. 1-4. [CrossRef]
- E. Dritsas, M. Trigka, and P. Mylonas, "A Multi-class Classification Approach for Weather Forecasting with Machine Learning Techniques," in 2022 17th International Workshop on Semantic and Social Media Adaptation & Personalization (SMAP), 2022: IEEE, pp. 1-5. [CrossRef]
- S. Choi and E.-S. Jung, "Optimizing Numerical Weather Prediction Model Performance using Machine Learning Techniques," IEEE Access, 2023. [CrossRef]
- S. Nigam, M. Gupta, A. Shrinivasan, A. V. S. Uttej, C. Kumari, and P. Disha, "Comparative Study to determine Accuracy for Weather Prediction using Machine Learning," in 2023 International Conference on Computer Communication and Informatics (ICCCI), 2023: IEEE, pp. 1-4. [CrossRef]
- M. A. Rahman, L. Yunsheng, and N. Sultana, "Analysis and prediction of rainfall trends over Bangladesh using Mann–Kendall, Spearman’s rho tests and ARIMA model," Meteorology and Atmospheric Physics, vol. 129, no. 4, pp. 409-424, 2017. [CrossRef]
- Mahabub and A. Habib, "An overview of weather forecasting for Bangladesh using machine learning techniques," Machine Learning, pp. 1-36, 2019.
- H. Shaiba et al., "Weather Forecasting Prediction Using Ensemble Machine Learning for Big Data Applications," Computers, Materials & Continua, vol. 73, no. 2, 2022. [CrossRef]
- H. Bosu, T. Rashid, A. Mannan, and J. Meandad, "Trends of Rainfall and Temperature in Bangladesh: A Comparative Analysis of CMIP5 Results and Meteorological Station Data," The Dhaka University Journal of Earth and Environmental Sciences, vol. 9, no. 2, pp. 9-18, 2020. [CrossRef]
- F. Hashim, N. N. Daud, K. Ahmad, J. Adnan, and Z. Rizman, "Prediction of rainfall based on weather parameter using artificial neural network," Journal of Fundamental and Applied Sciences, vol. 9, no. 3S, pp. 493-502, 2017. [CrossRef]
- J. Dong, W. Zeng, L. Wu, J. Huang, T. Gaiser, and A. K. Srivastava, "Enhancing short-term forecasting of daily precipitation using numerical weather prediction bias correcting with XGBoost in different regions of China," Engineering Applications of Artificial Intelligence, vol. 117, p. 105579, 2023. [CrossRef]
- S. Paul and S. Roy, "Forecasting the Average Temperature Rise in Bangladesh: A Time Series Analysis," Journal of Engineering Science, vol. 11, no. 1, pp. 83-91, 2020.
- J. Sulaiman and S. H. Wahab, "Heavy rainfall forecasting model using artificial neural network for flood prone area," in IT Convergence and Security 2017: Volume 1, 2018: Springer, pp. 68-76. [CrossRef]
- B. T. Pham, D. Tien Bui, M. Dholakia, I. Prakash, and H. V. Pham, "A comparative study of least square support vector machines and multiclass alternating decision trees for spatial prediction of rainfall-induced landslides in a tropical cyclones area," Geotechnical and Geological Engineering, vol. 34, pp. 1807-1824, 2016. [CrossRef]
- M. Kim, Y. Kim, H. Kim, W. Piao, and C. Kim, "Evaluation of the k-nearest neighbor method for forecasting the influent characteristics of wastewater treatment plant," Frontiers of Environmental Science & Engineering, vol. 10, pp. 299-310, 2016. [CrossRef]
- S. Zainudin, D. S. Jasim, and A. A. Bakar, "Comparative analysis of data mining techniques for Malaysian rainfall prediction," Int. J. Adv. Sci. Eng. Inf. Technol, vol. 6, no. 6, pp. 1148-1153, 2016.
- Sagi and L. Rokach, "Ensemble learning: A survey," Wiley Interdisciplinary Reviews: Data Mining and Knowledge Discovery, vol. 8, no. 4, p. e1249, 2018. [CrossRef]
- N. S. Sani, A. H. Abd Rahman, A. Adam, I. Shlash, and M. Aliff, "Ensemble learning for rainfall prediction," International Journal of Advanced Computer Science and Applications, vol. 11, no. 11, 2020.
- Y. Ren, L. Zhang, and P. N. Suganthan, "Ensemble classification and regression-recent developments, applications and future directions," IEEE Computational intelligence magazine, vol. 11, no. 1, pp. 41-53, 2016. [CrossRef]
- G. Kunapuli, Ensemble Methods for Machine Learning. Simon and Schuster, 2023.
- "Weather Data Bangladesh." Kaggle. https://www.kaggle.com/datasets/apurboshahidshawon/weatherdatabangladesh (accessed 20 September, 2023).
Figure 2.
Ensemble-based Classifier for Rainfall Occurrence Prediction.
Figure 2.
Ensemble-based Classifier for Rainfall Occurrence Prediction.
Figure 3.
Ensemble-based Regressor for Rainfall Amount and Daily Average Temperature Prediction.
Figure 3.
Ensemble-based Regressor for Rainfall Amount and Daily Average Temperature Prediction.
Figure 4.
Temperature Distribution (a). Minimum Temperature (b). Maximum Temperature.
Figure 4.
Temperature Distribution (a). Minimum Temperature (b). Maximum Temperature.
Figure 5.
Windspeed Distribution (a). Minimum Windspeed (b). Maximum Windspeed.
Figure 5.
Windspeed Distribution (a). Minimum Windspeed (b). Maximum Windspeed.
Figure 6.
Humidity Distribution (a). Humidity at 9 AM (b). Humidity at 3 PM.
Figure 6.
Humidity Distribution (a). Humidity at 9 AM (b). Humidity at 3 PM.
Figure 7.
Pressure Distribution (a). Pressure at 9 AM (b). Pressure at 3 PM.
Figure 7.
Pressure Distribution (a). Pressure at 9 AM (b). Pressure at 3 PM.
Figure 8.
Average Windspeed per Month.
Figure 8.
Average Windspeed per Month.
Figure 9.
Average Humidity per Month.
Figure 9.
Average Humidity per Month.
Figure 10.
Min, Max, and Average Temperature per Month.
Figure 10.
Min, Max, and Average Temperature per Month.
Figure 11.
Performance Comparison for Rainfall Amount Prediction.
Figure 11.
Performance Comparison for Rainfall Amount Prediction.
Figure 12.
RAE and RMSE Comparison for Rainfall Amount Prediction.
Figure 12.
RAE and RMSE Comparison for Rainfall Amount Prediction.
Figure 13.
RAE and RMSE Comparison for Daily Average Temperature Prediction.
Figure 13.
RAE and RMSE Comparison for Daily Average Temperature Prediction.
Table 1.
Overview of Related work.
Table 1.
Overview of Related work.
| Refs |
Models |
Prediction |
Limitation |
| [11] |
Genetic Programming, Support Vector Regressor (SVR), M5 rules, M5 Model Trees, Radial Basis Neural Network |
Rainfall Amount |
Using traditional machine learning techniques |
| [17] |
SVR, Linear Regression, Ridge Regression, Bayesian Ridge, Gradient Boosting, XGBoost, CatBoost, AdaBoost, KNN, Decision Tree |
Windspeed, Humidity, Temperature and Rainfall amount |
-Rainfall occurrence prediction is not implemented
-Regression based algorithms are used only |
| [20] |
Multi-layer Perceptron (MLP) |
Raindrop prediction using temperature, pressure and humidity |
-using single model only
-rainfall occurrence and temperature prediction not implemented |
| [21] |
XGBoost Model |
Rainfall Amount Prediction |
-Rainfall occurrence prediction is not implemented |
| [22] |
Linear Regression, Polynomial Regression, and SVR |
Daily Min, Max and average temperature prediction |
-Rainfall occurrence and Rainfall amount prediction is not implemented
-Traditional Techniques |
| [23] |
Artificial Nerual Network (ANN) |
Rainfall Amount Prediction |
-Rainfall occurrence prediction is not implemented |
| [24] |
Least Square Support Vector Machine (LSSVM) and Multi-class Alternating Decision Tree (MADT) |
Rainfall Prediction |
-only rainfall prediction
-using 1 year dataset only |
| [26] |
Naïve Bayes, Decision Tree, Random Forest |
Rainfall Prediction |
Small training dataset, 10 and 30% only |
| [28] |
Ensemble based model using Random Forest, SVM, NN, NB, C4.5) |
Rainfall Prediction |
Low Accuracy |
Table 2.
Average Windspeed per month.
Table 2.
Average Windspeed per month.
| Month |
WindSpeed9am |
WindSpeed3pm |
| 01 |
15.285171 |
17.403042 |
| 02 |
15.468504 |
18.228346 |
| 03 |
15.989247 |
18.053763 |
| 04 |
16.466667 |
19.396296 |
| 05 |
16.580645 |
18.419355 |
| 06 |
15.077778 |
18.807407 |
| 07 |
14.612903 |
20.229391 |
| 08 |
13.645161 |
20.114695 |
| 09 |
13.818519 |
21.203704 |
| 10 |
13.896057 |
21.007168 |
| 11 |
14.922222 |
19.407407 |
| 12 |
15.207885 |
19.111111 |
Table 3.
Average Humidity per month.
Table 3.
Average Humidity per month.
| Month |
Humidity9am |
Humidity3pm |
| 01 |
73.574144 |
57.136882 |
| 02 |
72.830709 |
56.468504 |
| 03 |
68.519713 |
52.698925 |
| 04 |
67.285185 |
52.374074 |
| 05 |
64.014337 |
49.906810 |
| 06 |
66.433333 |
54.000000 |
| 07 |
65.179211 |
52.333333 |
| 08 |
64.164875 |
52.867384 |
| 09 |
65.844444 |
56.100000 |
| 10 |
71.197133 |
59.139785 |
| 11 |
70.500000 |
58.514815 |
| 12 |
70.007168 |
55.211470 |
Table 4.
Average Temperature per month.
Table 4.
Average Temperature per month.
| Month |
MinTemp |
MaxTemp |
Temp9am |
Temp3pm |
| 01 |
14.851331 |
22.621673 |
17.158555 |
21.422814 |
| 02 |
14.154331 |
21.984252 |
16.439764 |
20.783858 |
| 03 |
12.713620 |
21.339068 |
15.451971 |
20.127599 |
| 04 |
12.600000 |
21.145926 |
15.721111 |
19.736667 |
| 05 |
12.651971 |
21.878495 |
15.939785 |
20.335125 |
| 06 |
13.621852 |
22.000741 |
16.786296 |
20.429259 |
| 07 |
14.223297 |
22.521505 |
17.465591 |
20.882437 |
| 08 |
15.870251 |
24.025090 |
19.237276 |
22.390323 |
| 09 |
17.608148 |
25.315926 |
21.029630 |
23.648889 |
| 10 |
17.709319 |
24.853047 |
20.483154 |
23.400000 |
| 11 |
16.749630 |
24.394074 |
19.634815 |
22.865185 |
| 12 |
15.739785 |
23.900358 |
18.408602 |
22.443011 |
Table 5.
Performance for Rainfall Occurrence Prediction.
Table 5.
Performance for Rainfall Occurrence Prediction.
| Models |
Accuracy |
Precision |
Recall |
F1 score |
| Logistic Regression |
0.823581 |
0.548173 |
0.714286 |
0.620301 |
| KNN |
0.800000 |
0.368771 |
0.740000 |
0.825270 |
| Decision Tree |
0.774672 |
0.594684 |
0.568254 |
0.581169 |
| SVC |
0.828821 |
0.528239 |
0.746479 |
0.618677 |
| Random Forest |
0.829694 |
0.511628 |
0.762376 |
0.612326 |
| Ensemble Classifier |
0.834061 |
0.511628 |
0.781726 |
0.618474 |
Table 6.
Performance Comparison.
Table 6.
Performance Comparison.
| Models |
Accuracy |
Precision |
Recall |
F1 Score |
| Combination of (SVM, ANN, NB, C4.5, RF)[28] |
75% |
53% |
73% |
61% |
| Ours |
83% |
51% |
78% |
61% |
Table 7.
MAE and RMSE Comparison for Rainfall Amount Prediction.
Table 7.
MAE and RMSE Comparison for Rainfall Amount Prediction.
| Algorithms |
MAE |
RMSE |
| Linear Regression |
0.498774 |
0.948272 |
| Random Forest |
0.378243 |
0.882860 |
| SVR |
0.365070 |
0.971967 |
| Ensemble Regression |
0.363691 |
0.904688 |
Table 8.
MAE and RMSE Comparison for Daily Average Temperature Prediction.
Table 8.
MAE and RMSE Comparison for Daily Average Temperature Prediction.
| Algorithms |
MAE |
RMSE |
| Linear Regression |
0.470631 |
0.603241 |
| Random Forest |
0.450968 |
0.570240 |
| SVR |
0.434701 |
0.560317 |
| Ensemble Regression |
0.425209 |
0.545714 |
|
Disclaimer/Publisher’s Note: The statements, opinions and data contained in all publications are solely those of the individual author(s) and contributor(s) and not of MDPI and/or the editor(s). MDPI and/or the editor(s) disclaim responsibility for any injury to people or property resulting from any ideas, methods, instructions or products referred to in the content. |
© 2024 by the authors. Licensee MDPI, Basel, Switzerland. This article is an open access article distributed under the terms and conditions of the Creative Commons Attribution (CC BY) license (http://creativecommons.org/licenses/by/4.0/).
