1. Introduction
Advanced glycation end products (AGEs) are a diverse group of compounds formed through a non-enzymatic reaction between reducing sugars and proteins, lipids, or nucleic acids[
1]. This reaction, known as glycation or the Maillard reaction, occurs spontaneously under normal physiological conditions[
2]. AGEs accumulate over time in various tissues and organs, especially in long-lived proteins like collagen and elastin[
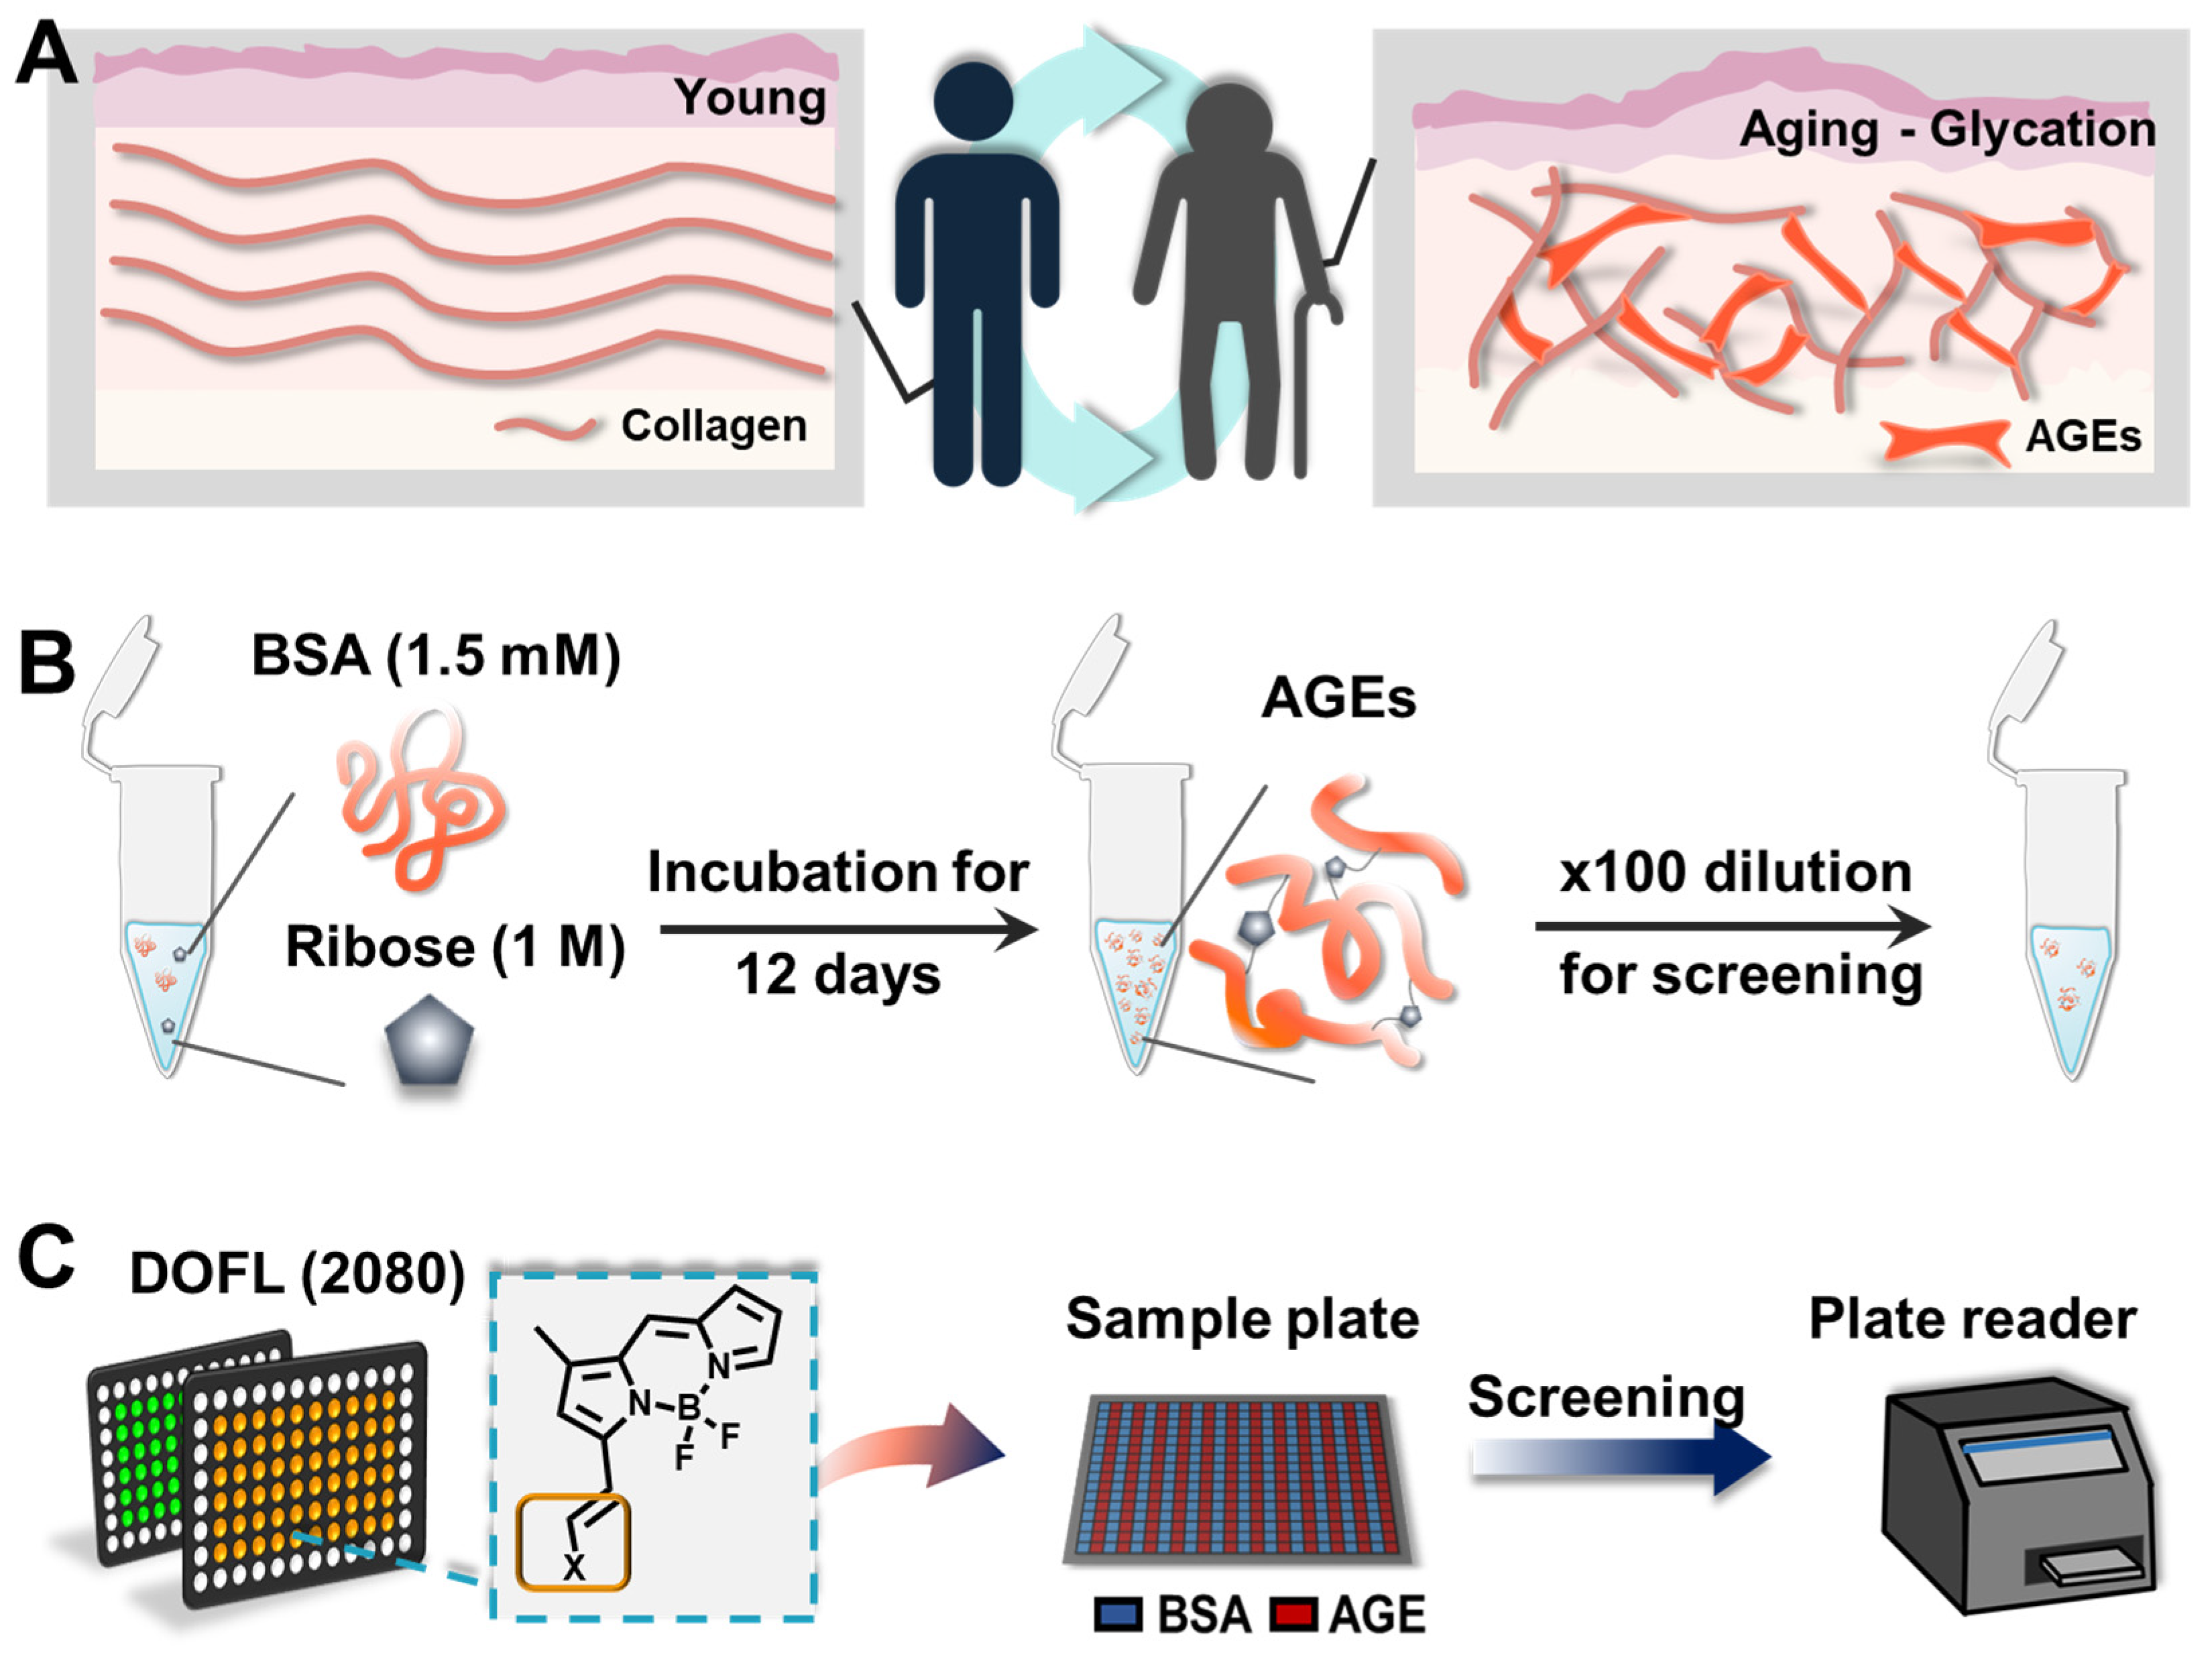
3]. In recent times, numerous scientific investigations have shown that AGEs can serve as a hallmark of aging on a molecular scale (
Figure 1). The intricate relationship between AGEs and aging is multifaceted. Furthermore, the accumulation of AGEs has been linked to the development of age-related diseases such as diabetes, cardiovascular issues, neurodegenerative disorders, and kidney dysfunction[
4]. Consequently, comprehending the complex interplay between AGE accumulation and the aging process bears significant implications for therapeutic strategies aimed at mitigating age-related ailments and fostering healthy aging. Therefore, monitoring AGE levels in biological samples may provide valuable information regarding the progression of age-related conditions. However, the relationship between aging and AGEs has been complicated to be uncovered due to several reasons, including a shortage of available and precise techniques to measure specific AGEs, and a deficiency in AGEs mimicking models that reproduce the conditions[
4].
The most common way to detect AGEs is measuring the autofluorescence of AGEs using fluorescence spectroscopy. However, this method lacks specificity and sensitivity and may be influenced by other fluorescent compounds present in biological samples, along with high background, considering excitation by a ultra violet region. Considering the emergence of AGEs as a potential biomarker, it is necessary to overcome the current limitations and elicit new molecular tools to detect AGEs with high sensitivity.
Fluorescent small molecules have earned significant interest because of their prospective roles in sensor and visualization. Though a conventional approach to probe development typically relies on established molecular recognition processes for specific substances, its efficacy and efficiency within complex biological environments remains inconsistent despite thorough planning. Consequently, the pace and breadth of probe elicitation have been hampered by several inherent constraints. To surmount these challenges, diverse fluorescence library methods have been employed to generate novel fluorescent probes, even in scenarios where prior comprehension of the target recognition mechanism is lacking[
5]. Our group has established huge amounts of fluorescence libraries, DOFL (Diversity Oriented Fluorescence Library; >10,000 compounds)[
6]. With a systematic approach, we have successfully reported more than 30 fluorescent small molecules applying to various biological samples[
7,
8,
9,
10,
11]. Here, we firstly developed AGEs-selective probe,
AGO, through screening DOFL.
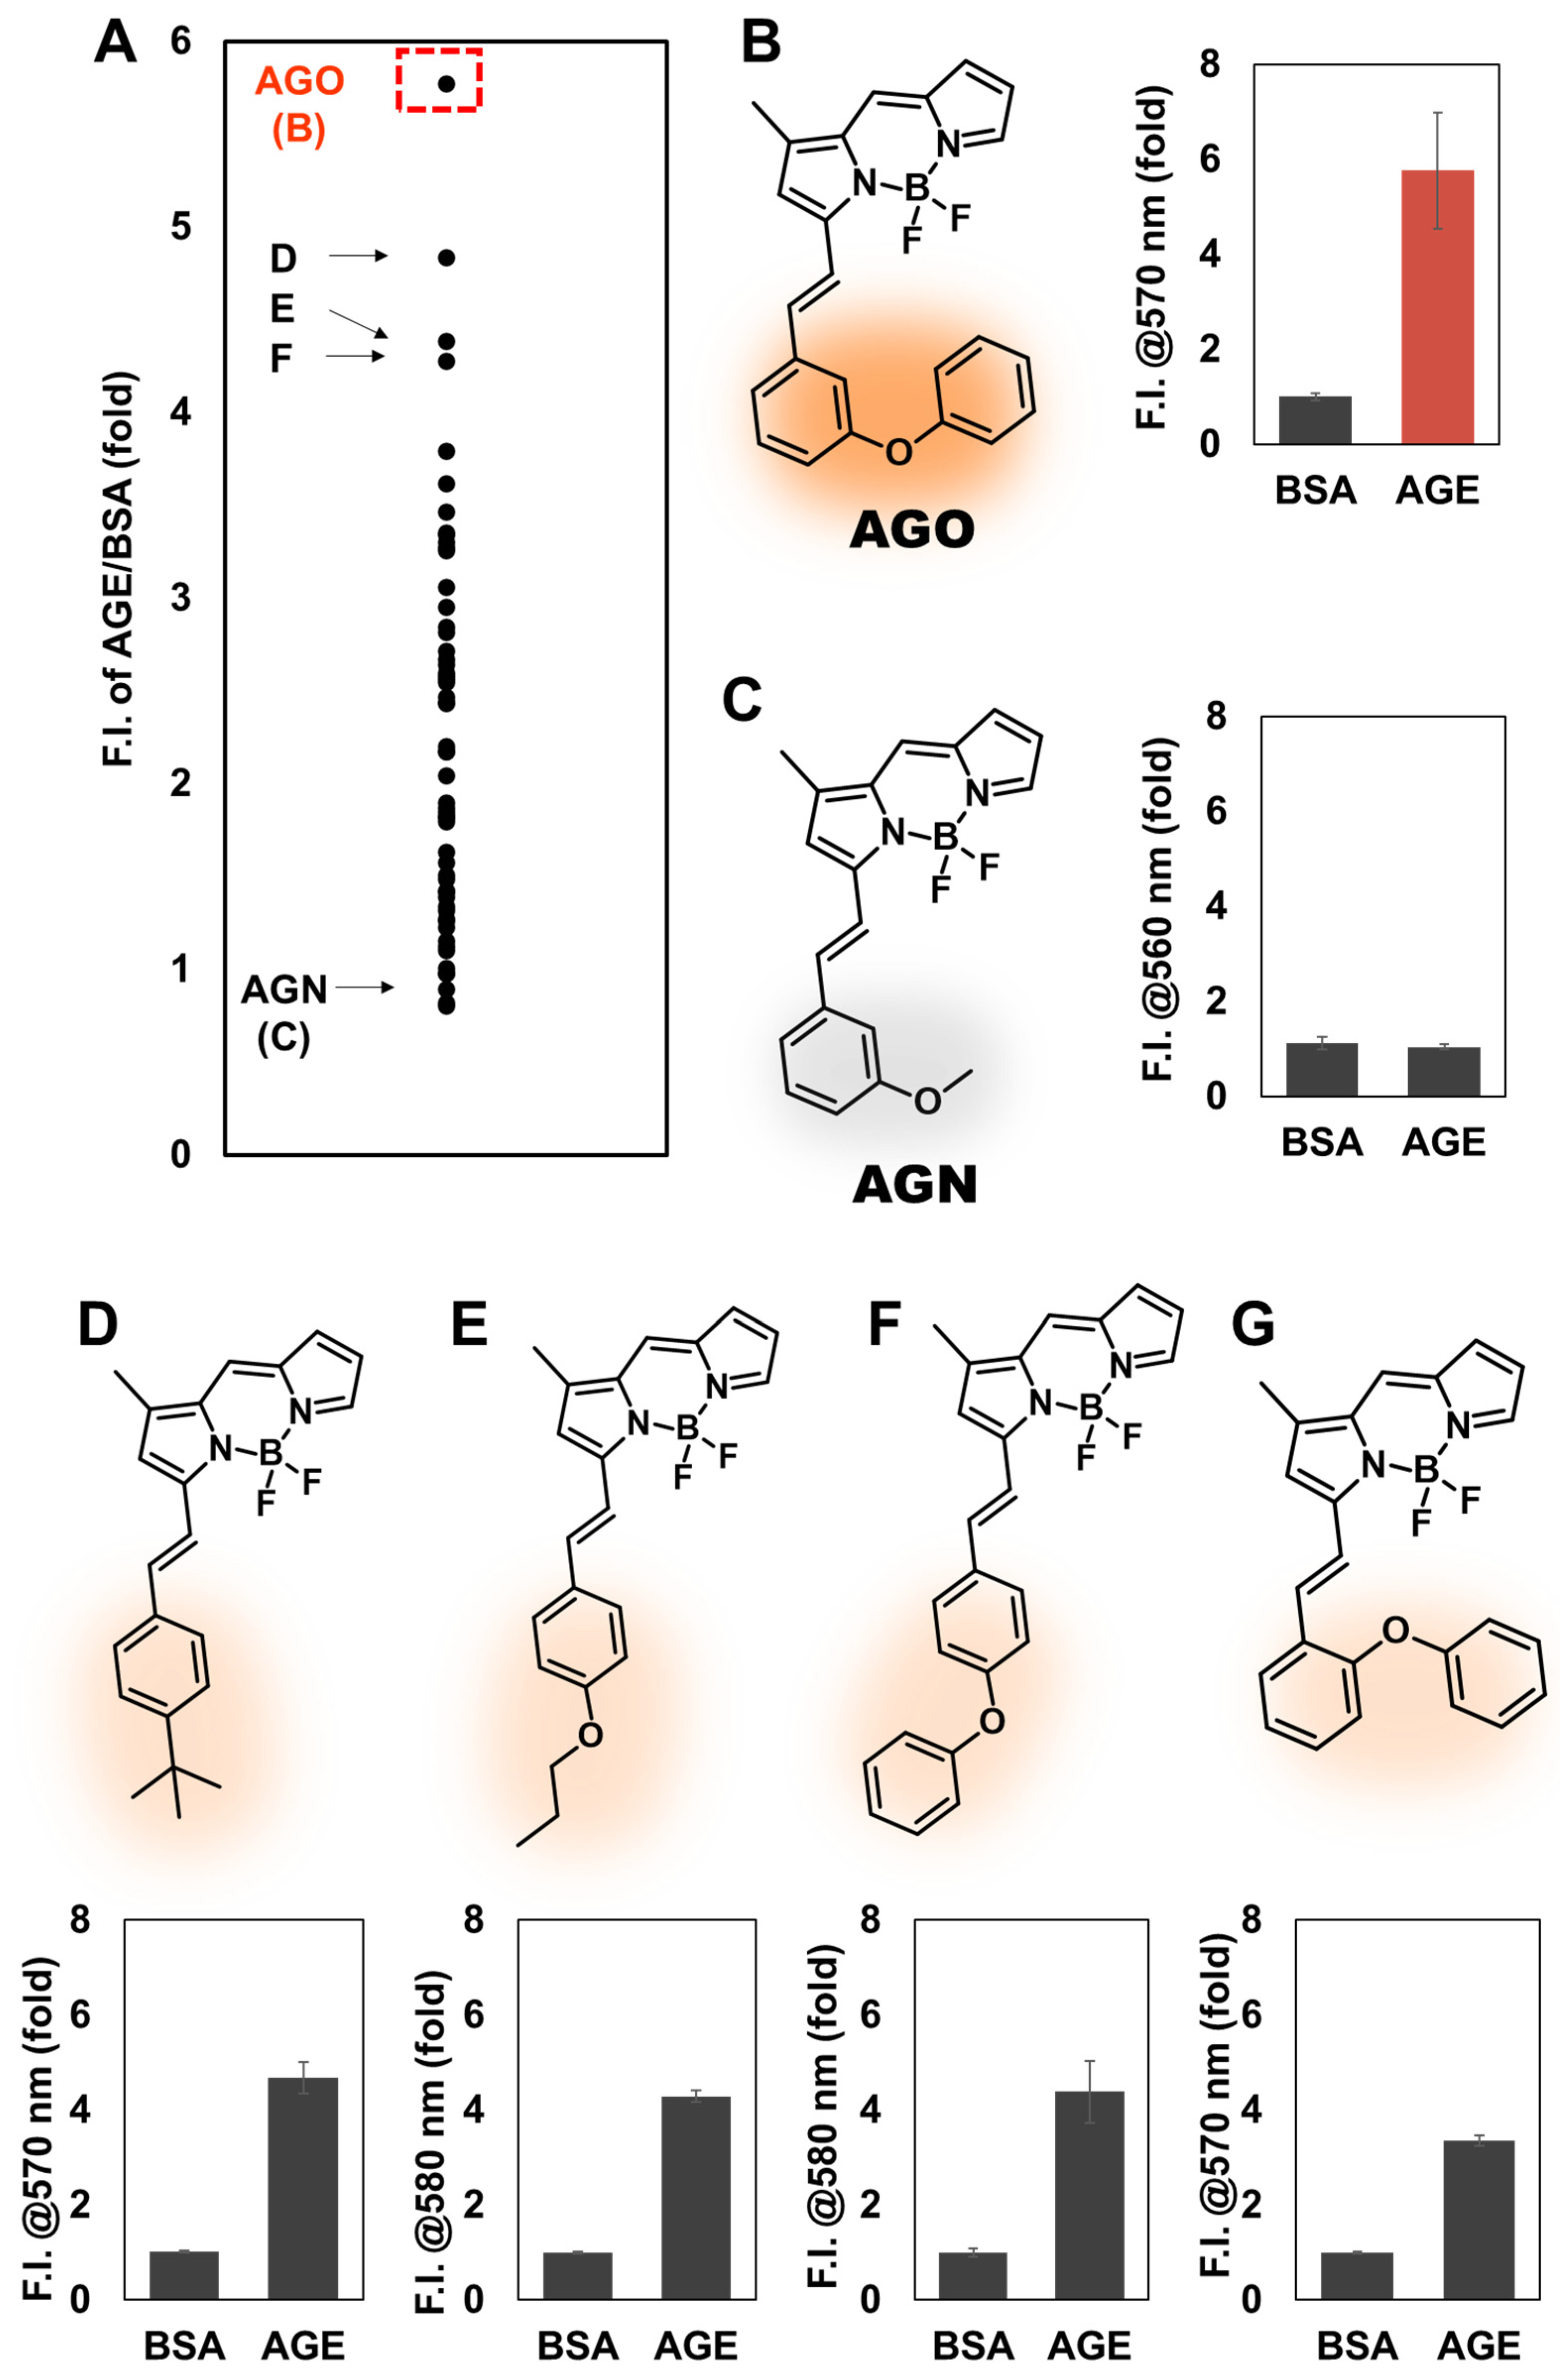
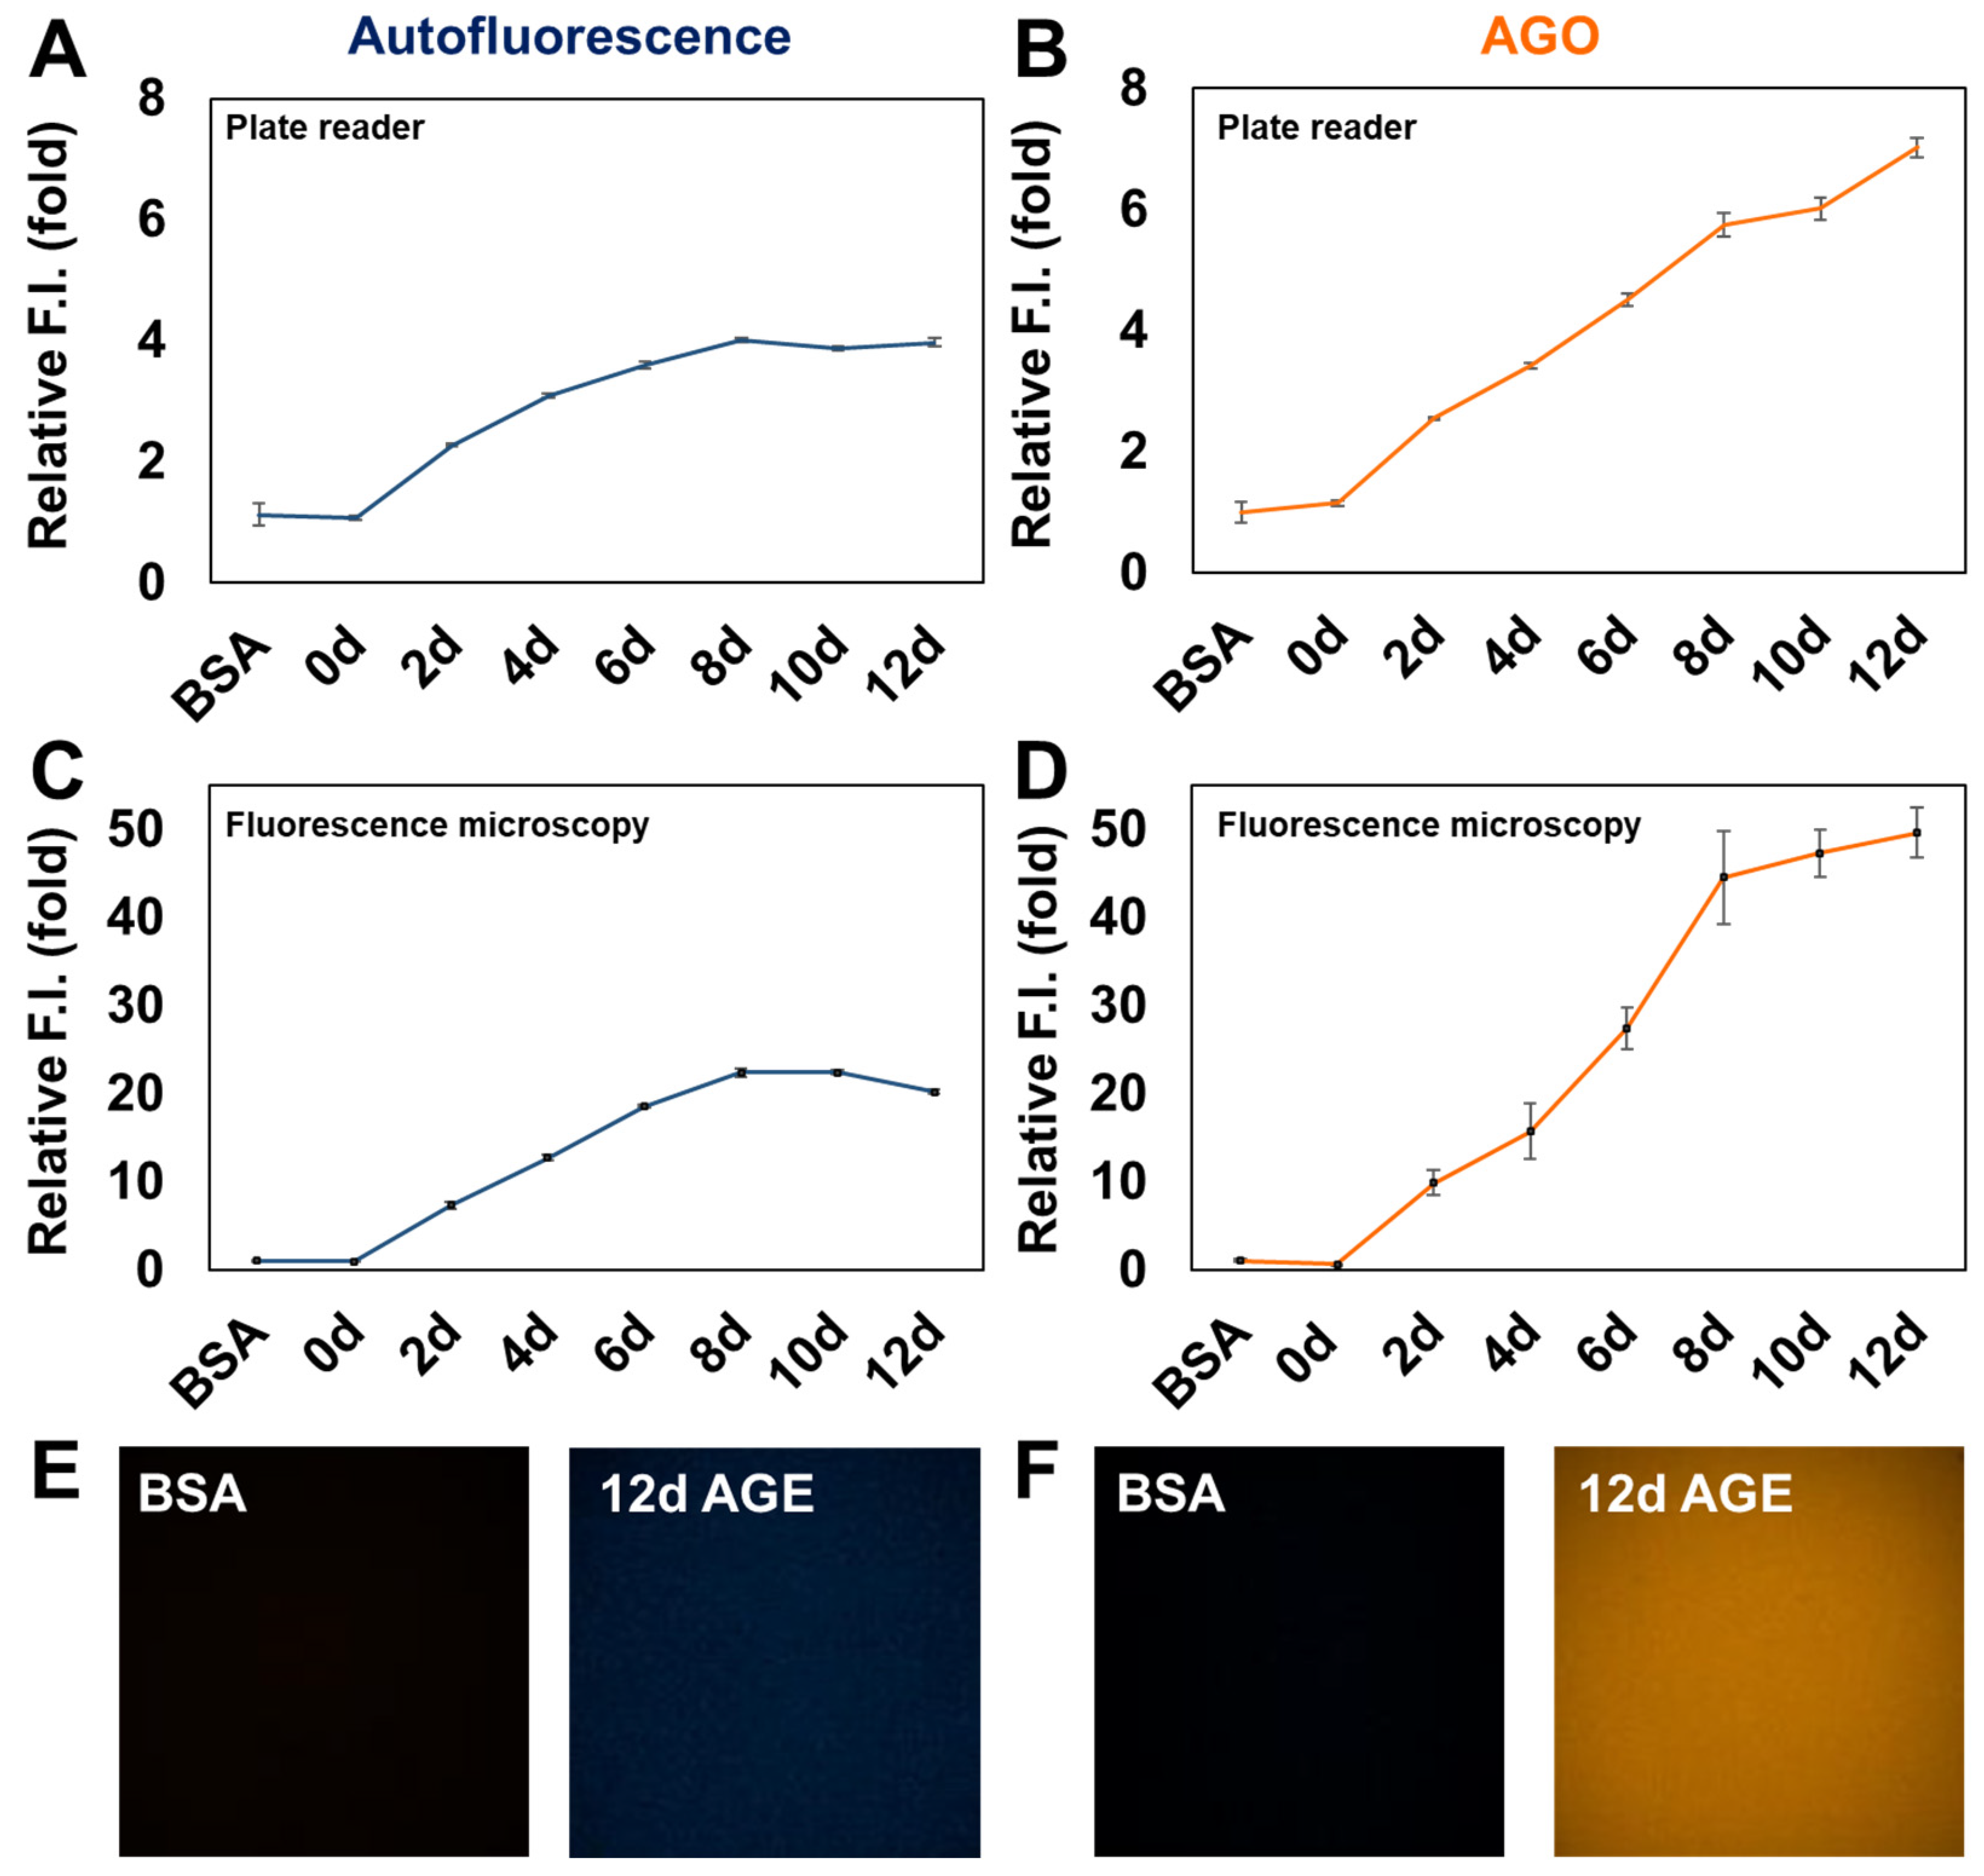
AGO showed the highest selectivity over 2080 compounds, and a better sensitivity to AGEs compared to autofluorescence from AGEs. Moreover, we observed that
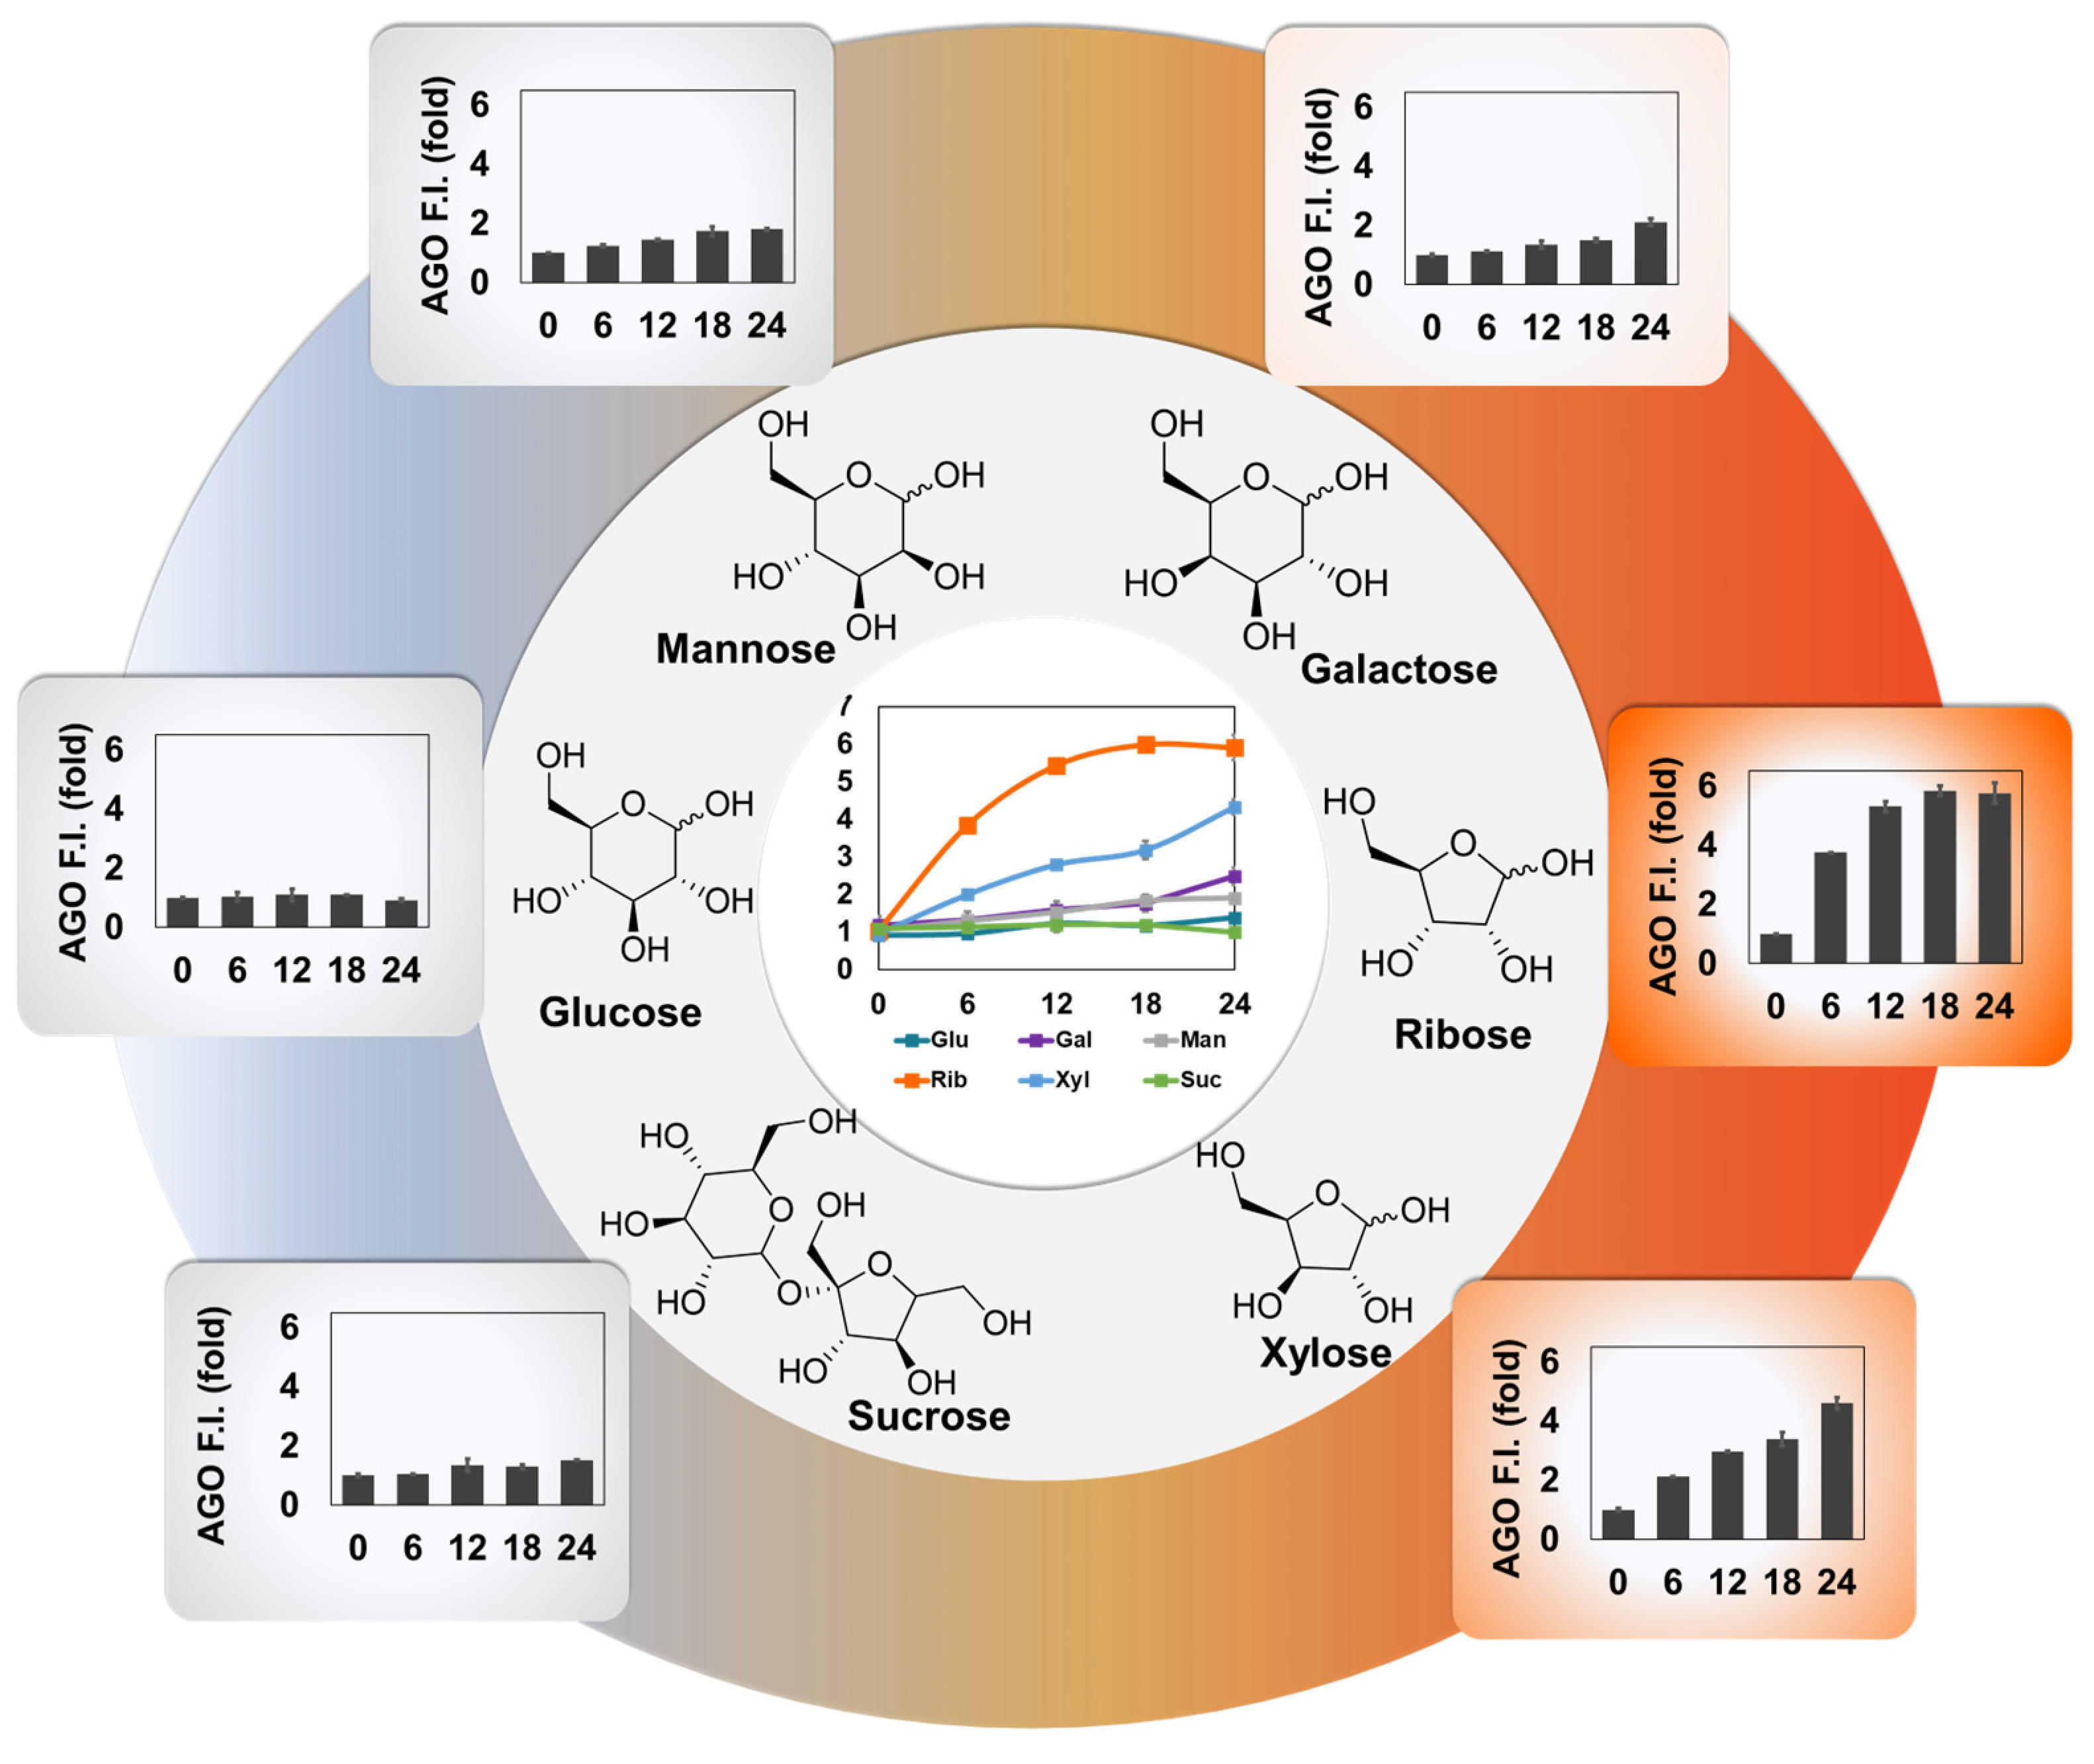
AGO can highly sense ribose-derived glycation products, compared to other hexoses or disaccharide. Finally, the ability of
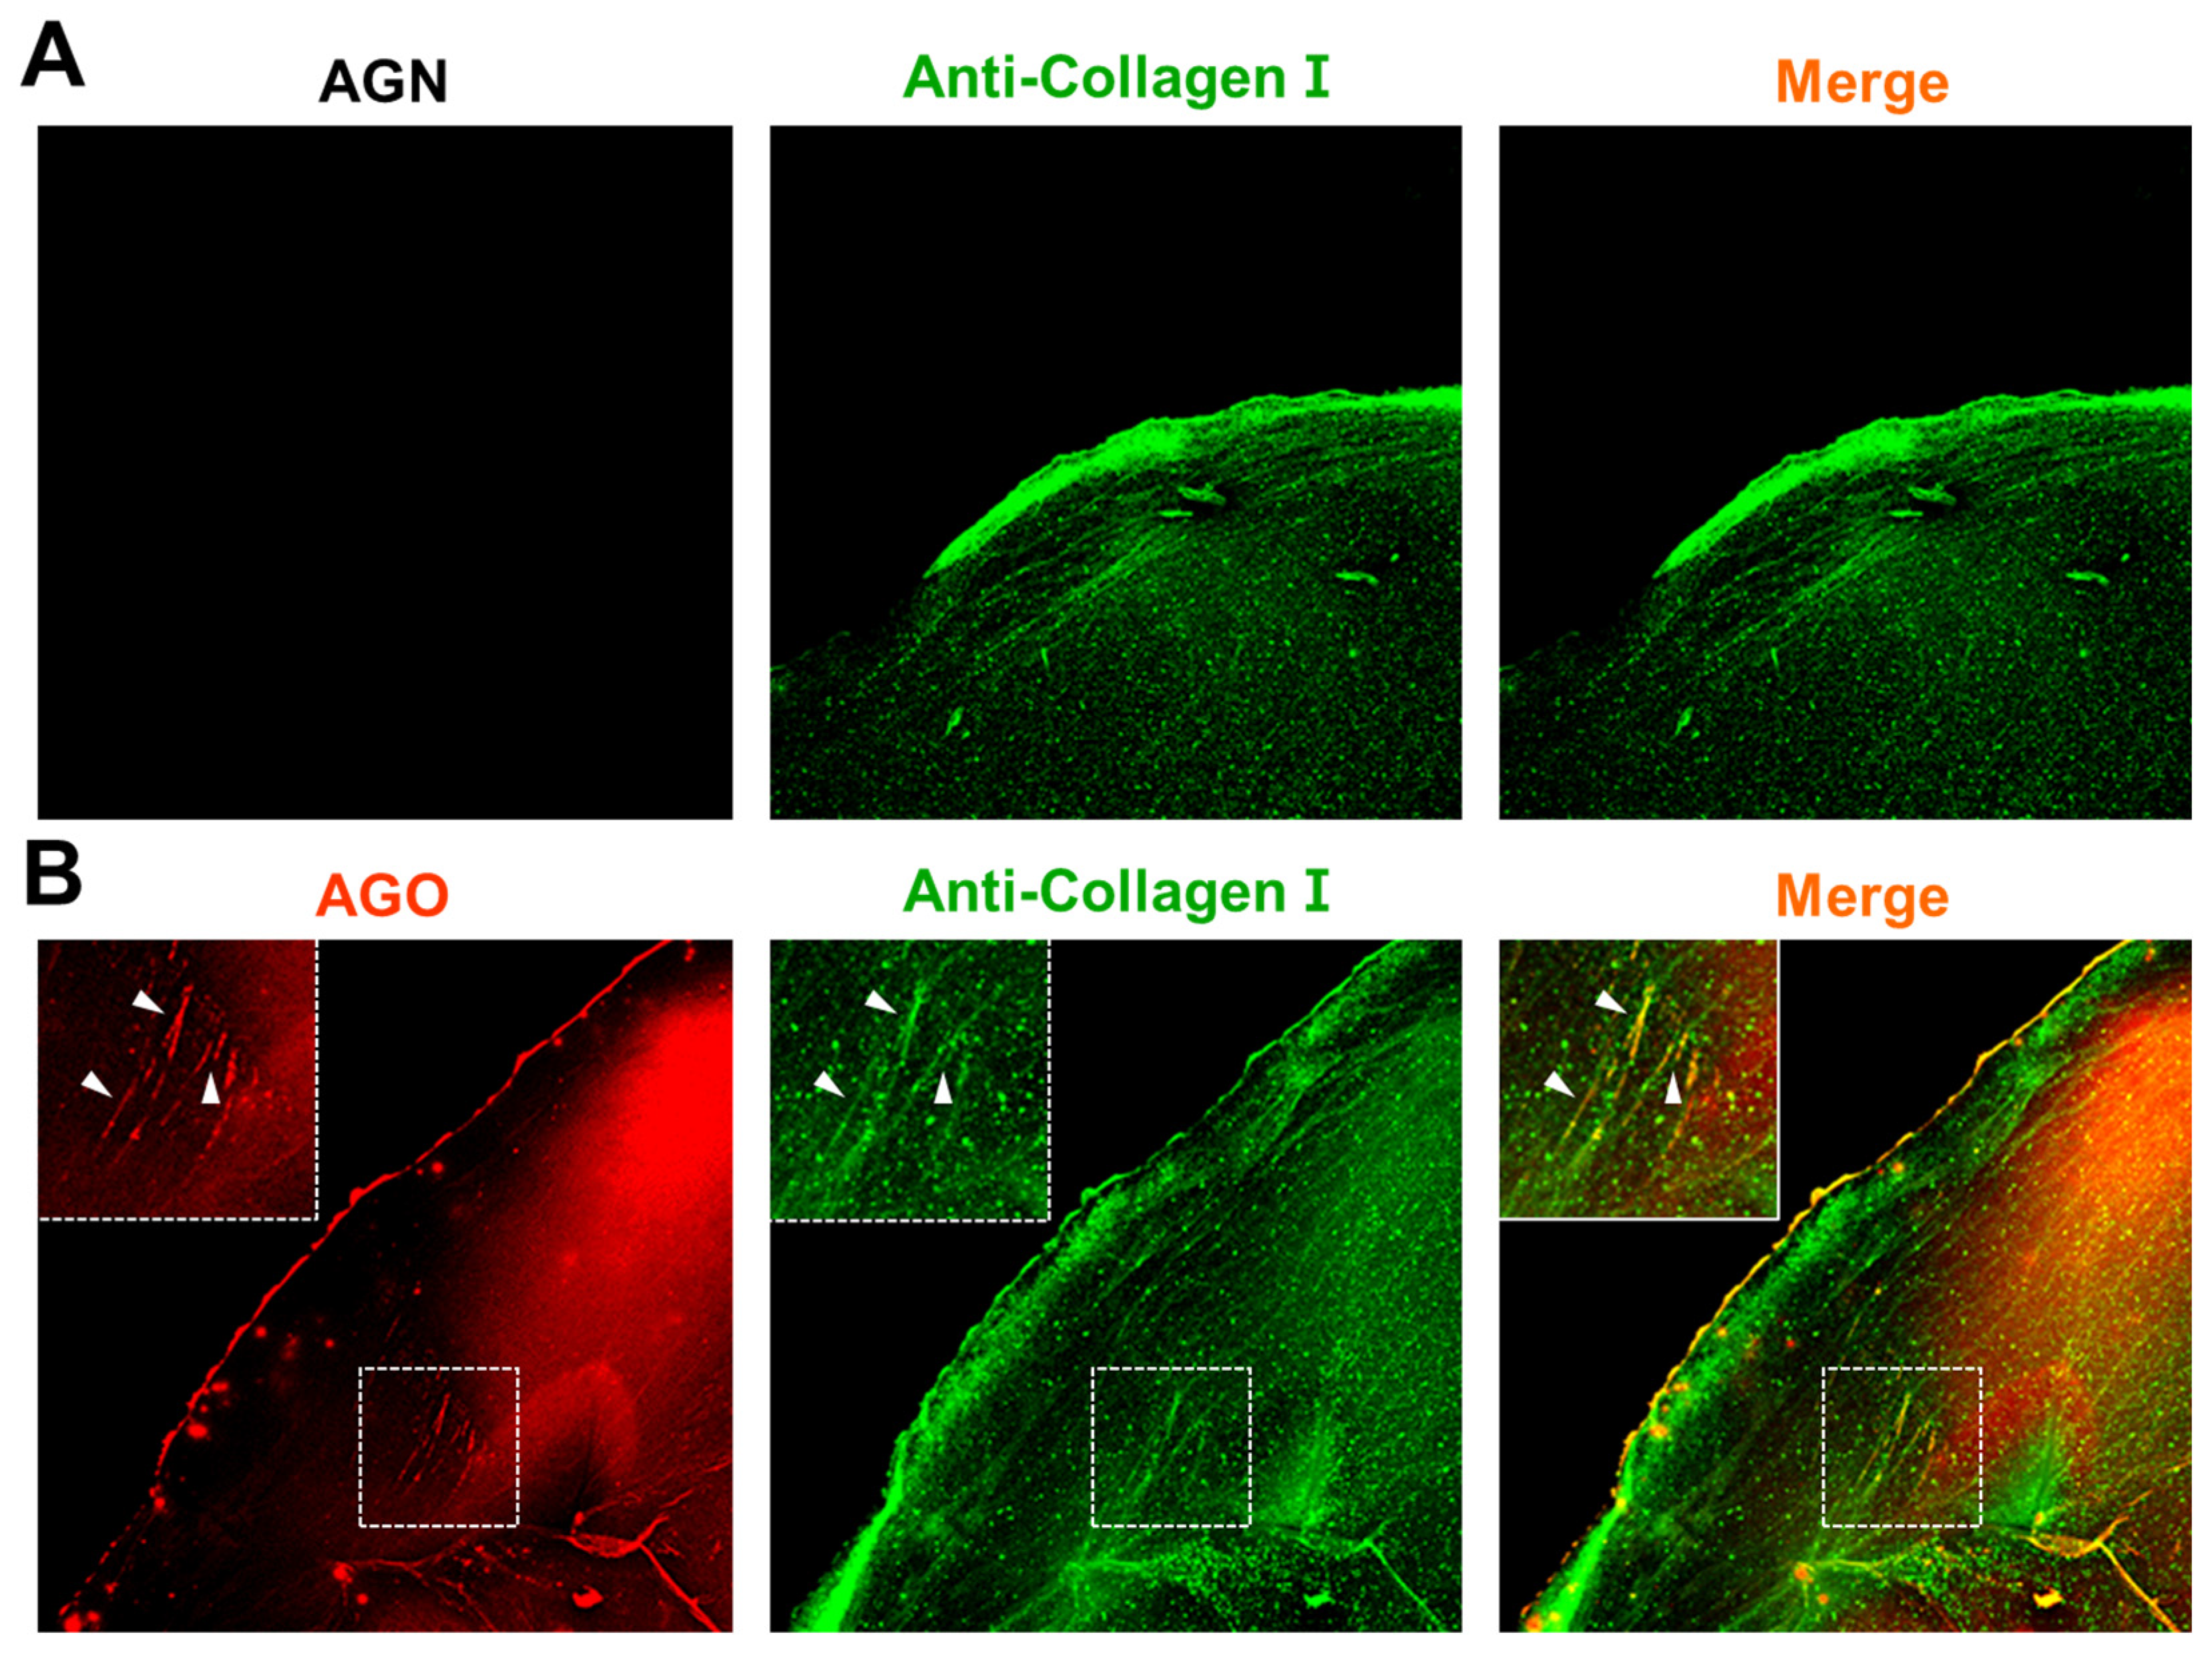
AGO was demonstrated in a glycated collagen framework, mimicking the natural glycation of the matrix.
2. Materials and Methods
2.1. Materials
D-(+)-Galactose (Sigma Aldrich; St. Louis, Mo, USA), D-(+)-Mannose, D-(+)-Ribose, sucrose, and bovine serum albumin were purchased from Sigma Aldrich (St. Louis, Mo, USA). We acquired D-(+)-Glucose from Alfa Aesar (Haverhill, MA, USA), and D-(+)-Xylose from TCI (Tokyo, Japan).
2.2. Glycation of BSA
BSA was dissolved in PBS, containing 0.05% sodium azide to yield a stock solution of 3 mM. This solution was resuspended with carbohydrates, prepared in PBS with 0.05% sodium azide to a final concentration of 1.5 mM BSA and 1 M carbohydrates. The mixtures were incubated at 37°C, and incubation days were dependent on each experiment. Before a resuspension, all solutions were filtered with 0.45 μm, and 0.22 μm membranes (Millipore, USA).
2.3. DOFL Screening
26 DOFL library (including 2080 compounds) was used for 384-well based screening. For the screening, compounds (100 μM in DMSO) were mixed with AGE solution to a final concentration of 5 μM compounds. After 30 minutes incubation at room temperature, plates were read by a plate reader (Molecular Devices, USA).
2.4. TEM Image
The TEM images were taken by JEOL JEM1011 (JEOL USA, INC, Peabody, MA). BSA stock solution was resuspended with Ribose to a final concentration of 1 M, and incubated at 37°C for 12 days. The concentrations of both stock solutions were used after dilution by a factor of 20x, and images were captured by 150k objective lens. The samples for imaging were prepared followed by instructions.
2.5. Fluorescence Microscopy
BSA (1.5 mM) and D-ribose (1 M) were incubated at 37°C until 12 days at the intervals of 2 days. After 12 days, samples were stained with AGO (5 μM) for 30 min at room temperature. The samples (50 μL) were transferred to 384-well plate after dilution of stock solution to 100. The fluorescence from solution was taken by fluorescence microscopy using Operetta CLS (Perkin Elmer,Walthan,MA, USA) with x10 objective lens. AGEs autofluorescence was captured by DAPI channel (ex: 355-385 / em: 430-500), and AGO fluorescence was measured with TRITC channel (ex: 530-560/570-650). Each channel was set to give 20% power and expose to 10 ms.
2.6. Assay of AGEs Derived by Different Carbohydrate Types
The mixtures of BSA (1.5 mM) and each carbohydrate (1 M) including glucose, galactose, mannose, ribose, xylose, and sucrose, were incubated at 37°C until 24 days, and mixtures were prepared at the intervals of 6 days. To conduct the assay, the samples were made after 100x dilution, and transferred them into 96-well plate. The mixtures were measured by the plate reader (Molecular Devices, USA) after staining with AGO (5 μM) for 30 min at room temperature. The autofluorescence data was acquired by excitation at 370 nm, and emission at 420 nm. AGO graph was obtained by excitation at 490 nm, and emission at 570 nm.
2.7. Preparation of Glycated Collagen Hydrogel
To fabricate collagen microgels, the collagen type I solution (Corning, 354249) was neutralized to a physiological pH (approximately 7.0-7.4) utilizing a mixture comprised of 1N sodium hydroxide (NaOH), distilled water, and 10x phosphate-buffered saline (PBS), conducted on ice as per the manufacturer’s instructions. Subsequently, the solution's concentration was meticulously adjusted to 3 mg/mL. Following the neutralization process, 100 μL of the collagen mixture was carefully pipetted into each well of a 24-well plate (SPL, 30024). Gelation was then initiated by incubating the plates at 37°C for 1 h, facilitating the polymerization of the collagen. Upon completion of the gelation process, the resulting hydrogel was immersed in a 500 mM ribose solution (Merck, R9629) prepared in PBS. This was incubated at 37°C for a duration of one week to ensure adequate modification of the hydrogel properties.
2.8. Immunofluorescence Staining
After the glycation process, collagen microgels were washed three times with PBS for 10 minutes each to remove any residual ribose. Following this, they were fixed using 4% paraformaldehyde (PFA) for 1 h at room temperature to preserve their microstructures. After fixation, the samples were permeabilized with 0.15% Triton-X 100 in PBS for 30 min. To prevent non-specific antibody binding, the microgels were then blocked with 1% bovine serum albumin (BSA) in PBS for 1 h. Subsequently, they were incubated overnight at 4°C with anti-collagen I (Abcam, ab21286) antibody, followed by a 2-hour incubation with secondary antibodies (Merck, F0382) at room temperature. For a comparison of AGE selectivity in the glycated extracellular matrix (ECM), the hydrogels were stained with 10 μM AGO/AGN dyes for 1 h. Each step was followed by three 10-minute washes with PBS. Finally, fluorescent images were captured and analyzed using a confocal laser scanning microscope (Nikon, A1R).
2.9. Chemical Materials and General Methods for AGO Synthesis
All used compounds and solvents were purchased from Alfa Aesar (Haverhill, MA, USA), Sigma Aldrich (St. Louis, MO, USA), Combi-Blocks (San Diego, USA), TCI (Tokyo, Japan), and Samchun Chemicals (Seoul, Republic of Korea). All the chemicals were directly used without further purification. MERCK silica gel 60 (230-400 mesh, 0.040-0.063 mm) was used for normal-phase column chromatography. The optical properties were performed with SpectraMax M2e spectrophotometer (Molecular Devices) in 96 well plate (clear bottom) and QS high-precision cuvette. The relative fluorescence quantum yield method was selected, and Rhodamine B (Φ = 0.49) was utilized as the standard. The quantum yield equation was calculated by equation (1). For analytical characterization of AGO HPLC (Agilnet, 1260 series) with a DAD (diode array detector) and a single quadrupole mass spectrometer (Aglient, 6100 series, ESI) were used. Eluents (A: H2O with 0.1% formic acid (FA), B: ACN with 0.1% FA) and Zorbax SB-C18 column (2.1 x 50 mm, 1.8 μm particle size, 80 Å pore size) were used. High-performance liquid chromatography (HPLC) was utilized on Prep. HPLC (Shimadzu) with a PDA detector with a C18(2) Luna column (5 μm, 250 mm × 21.2 mm, 100 Å). A gradient elution of 60% B for 5 min and them, 60% B to 100% B for 40 min, and then 100% B for 55 min was used at flow rate of 8 mL/min (solvent A: H2O; B: ACN). 1H and 13C NMR spectra were obtained from Brucker AVANCE III HD 850.
Where Φfi and Φfs represented the fluorescence quantum yield of sample and standard, respectively. F represented the area under curve of the fluorescence spectrum (from 550 to 800 nm), n represented the refractive index of the solvent, and f represented the absorption factor (f = 1 – 10–A, where A represented the absorbance) at the excitation wavelength selected for sample and standard.
2.10. Synthesis of AGO
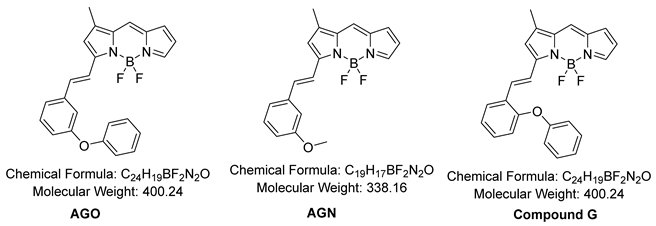
The reaction followed the below procedure. BD (4,4-Difluoro-5,7-dimethyl-4-bora-3a,4a-diaza-S-indacene) (30 mg, 136 μmole), 3-Phenoxybenzaldehyde (32.3 mg, 164 μmole), Acetic acid (47 μL, 818 μmole), Pyrrolidine (69 μL, 818 μmole) were dissolved in ACN (5 mL), stirring at 70°C for 30 min. The collected mixture was concentrated in vacuo. The residue was purified via High-performance liquid chromatography (HPLC) was utilized on Prep. HPLC (Shimadzu) with a PDA detector with a C18(2) Luna column (5 μm, 250 mm × 21.2 mm, 100 Å). A gradient elution of 60% B for 5 min and them, 60% B to 100% B for 40 min, and then 100% B for 55 min was used at flow rate of 8 mL/min (solvent A: H2O; B: ACN). After purification, purple solid was obtained (39.8 mg, 73%). 1H NMR (850 MHz, Chloroform-d) δ 7.71 (s, 1 H), 7.63 (d, J = 16.3 Hz, 1H), 7.43 (d, J = 7.74 Hz, 1H),
7.38 (q, J = 7.65 Hz, 3H), 7.33 (d, J = 16.3 Hz, 1H), 7.28 (s, 1H), 7.24 (t, J = 1.7 Hz), 7.21 (s, 1H), 7.16 (t, J = 7.40 Hz, 1H), 7.06 (d, J = 7.74 Hz, 2H), 7.01 (dd, J = 8.14 Hz, 1H), 6.97 (d, J = 3.83 Hz, 1H), 6.75 (s, 1H), 6.49 (q, J = 3.74 Hz, 3H), 2.33 (s, 3H). 13C NMR (214 MHz, Chloroform-d) δ 158.22, 157.73, 156.95, 144.50, 139.55, 139.01, 137.75, 137.73, 133.30, 130.18, 129.88, 126.48, 123.57, 122.41, 120.09, 119.34, 118.97, 118.51, 117.17, 116.69, 11.51. LC-MS (ESI) [M+H]+, m/z calcd for C24H19BF2N2O 400.16, found: 401.0
2.11. Synthesis of AGN
The reaction followed the below procedure. BD (100 mg, 454 μmole), 3-Methoxybenzaldehyde (74.2 mg, 545 μmole), Acetic acid (104 μL, 1820 μmole), Pyrrolidine (152 μL, 1820 μmole) were dissolved in ACN (10 mL), stirring at 70°C for 30 min. The collected mixture was concentrated in vacuo. The residue was purified via High-performance liquid chromatography (HPLC) was utilized on Prep. HPLC (Shimadzu) with a PDA detector with a C18(2) Luna column (5 μm, 250 mm × 21.2 mm, 100 Å). A gradient elution of 60% B for 5 min and them, 60% B to 100% B for 40 min, and then 100% B for 55 min was used at flow rate of 8 mL/min (solvent A: H2O; B: ACN). After purification, purple solid was obtained (33.5 mg, 22 %). 1H NMR (850 MHz, Chloroform-d) δ 7.71 (s, 1 H), 7.63 (d, J = 16.3 Hz, 1H), 7.35 (d, J = 7.74 Hz, 1H), 7.32 (t, J = 7.91 Hz, 1H), 7.28 (s, 1H), 7.22 (d, J = 7.91 Hz), 7.18 (s, 1H), 7.12 (t, J = 1.7 Hz, 1H), 6.95 (d, J = 3.74 Hz, 1H), 6.94(dd, J = 8.14 Hz, 1H), 6.75 (s, 1H), 6.47 (q, J = 3.74 Hz, 3H), 3.88(s, 3H), 2.32 (s, 3H). 13C NMR (214 MHz, Chloroform-d) δ 159.97, 158.61, 144.57, 139.88, 139.14, 137.83, 137.17, 133.21, 129.88, 126.20, 123.33, 120.73, 118.81, 117.24, 116.54, 115.92, 112.68, 55.37, 11.49. LC-MS (ESI) [M+H]+, m/z calcd for C19H17BF2N2O 338.14, found: 339.0
2.12. Synthesis of Compound G
The reaction followed the below procedure. BD (30 mg, 136 μmole), 2-Phenoxybenzaldehyde (32.3 mg, 164 μmole), Acetic acid (47 μL, 818 μmole), Pyrrolidine (69 μL, 818 μmole) were dissolved in ACN (5 mL), stirring at 70°C for 30 min. The collected mixture was concentrated in vacuo. The residue was purified via High-performance liquid chromatography (HPLC) was utilized on Prep. HPLC (Shimadzu) with a PDA detector with a C18(2) Luna column (5 μm, 250 mm × 21.2 mm, 100 Å). A gradient elution of 60% B for 5 min and them, 60% B to 100% B for 40 min, and then 100% B for 55 min was used at flow rate of 8 mL/min (solvent A: H2O; B: ACN). After purification, purple solid was obtained (11.1 mg, 20%). LC-MS (ESI) [M+H]+, m/z calcd for C24H19BF2N2O 400.16, found: 401.
4. Discussion
Aging, an intricate biological process, encompasses a myriad of molecular and cellular changes over time, influencing various physiological functions. Among the multitude of factors implicated in the aging process, the accumulation of advanced glycation end products (AGEs) has emerged as a significant contributor. Despite its importance, the relationship between aging and AGEs has not been well established yet. One of the major factors contributing to this gap is the lack of competent monitoring tools. The most common method involves detecting AGEs using autofluorescence. However, autofluorescence typically occurs at shorter wavelengths (~420 nm), resulting in high background levels and the possibility of detecting other biological molecules in complex systems. Therefore, there is a need to develop an efficient molecular tool for sensing AGEs.
To develop such a probe, we selected BODIPY-fluorescence libraries from DOFL, considering the lipophilic characteristics of BODIPY that may enhance the opportunity to detect AGEs. We then prepared AGEs using BSA and ribose, confirming their formation by TEM. After screening samples with fluorescence molecules, we identified one molecule that exhibited the highest selectivity among 2080 compounds. It comprised a BODIPY fluorophore with a meta-positioned phenoxybenzene moiety. Through structure-activity relationship studies, we concluded that phenoxybenzene, along with its proper positioning, enables sensitive detection of AGEs.
Furthermore, we compared the selectivity of AGE detection between autofluorescence and AGO fluorescence. Interestingly, autofluorescence could detect AGEs adequately but reached its limit at a certain point. In contrast, AGO exhibited continuous and sensitive detection of AGEs over time. The efficacy of AGO was further validated using fluorescence microscopy, where AGO demonstrated a much more vivid sensing ability compared to autofluorescence under similar conditions. This indicates the potential of AGO to replace autofluorescence for measuring AGEs more meticulously.
Motivated by the sensitivity of AGO, we investigated how AGO behaves in AGEs derived from different types of carbohydrates. We prepared three hexoses (glucose, galactose, mannose), two furanoses (ribose, xylose), and one disaccharide (composed of glucose and fructose), incubating each sugar with BSA. Interestingly, ribose exhibited a higher glycation effect than other sources, followed by xylose and galactose. Based on this observation, we speculate that aging processes may be accelerated by certain carbohydrate sources. This phenomenon was also observed with AGO, implying that AGO can systematically measure the kinetics of AGE formation.
Finally, we confirmed the selectivity of
AGO in a glycated collagen model, mimicking natural phenomena. Collagen, the most abundant protein in the human body[
20], constitutes a significant portion of connective tissues such as skin[
24] or tendons[
25]. It provides structural support, elasticity, and strength to various tissues. However, once collagen is glycated, physiological processes may be disrupted due to the accumulation of glycation products[
3]. AGEs can cross-link with collagen fibers, resulting in the formation of rigid and dysfunctional collagen structures. Additionally, collagen cross-linking by AGEs increases tissue stiffness and disrupts cell-matrix interactions[
26]. Overall, the accumulation of AGEs and their interactions with collagen can have detrimental effects on tissue structure and function, particularly in aging processes. Taking into account the impacts of AGEs on collagen during aging processes, our results indicate a notable progression in comprehending the role of AGEs in aging. Moreover, they indicate the potential for AGO as an effective diagnostic tool for detecting AGEs in vitro.
Author Contributions
Conceptualization, H.Cho, N.-K.Hong, H.-Y.Kwon, N.-Y.Kang, L.M.C, and Y.-T.Chang; methodology, H.Cho, N.-K.Hong, I.Yong, L.M.C, P.Kim, and Y.-T.Chang; software, H.Cho, and N.-K.Hong; validation, H.Cho, N.-K.Hong, and I.Yong; investigation, H.Cho, N.-K.Hong, I.Yong, H.-Y.Kwon, N.-Y.Kang, L.M.C, P.Kim, and Y.-T.Chang; data curation, H.Cho, and N.-K.Hong; writing—original draft preparation, H.Cho.; writing—review and editing, Y.-T.Chang.; visualization, H.Cho, N-K.Hong, I.Yong.; supervision, Y.-T.Chang.; project administration, Y.-T.Cahng.; funding acquisition, H.-Y.Kwon, N.-Y.Kang, Y.-T.Chang. All authors have read and agreed to the published version of the manuscript.

