
Preprint
Communication
Small Farm Holder Cropping Systems Influence Microbial Profiles in an Equatorial Rainforest Agroecosystem
Altmetrics
Downloads
98
Views
40
Comments
0
A peer-reviewed article of this preprint also exists.
supplementary.pdf (334.13KB )


Submitted:
27 February 2024
Posted:
28 February 2024
You are already at the latest version
Alerts
Abstract
Metabarcoding of prokaryotic and fungal ribosomal DNA was used to describe the microbial communities in soils of remnant equatorial rainforest, maize-bean intercrop, and sugarcane in western Kenya. Cropping systems influenced the microbial community composition and functional traits (energy source and nutrient cycling) of bulk soil in each crop. Microbial richness and diversity tended to increase with cultivation intensity. Soil of maize-bean intercrop had lower percentages and sugarcane had higher percentages of unique amplicon sequence variants of both bacteria and fungi compared to the remnant forest. Functional traits were altered by cultivation intensity. Compared to remnant forest soils, maize-bean intercrop soil had lower percentages of aerobic chemoheterotrophic bacteria and higher percentages of N-cycling bacteria, while sugarcane had higher percentages of aerobic chemoheterotrophic bacteria and lower percentages of N-cycling bacteria. In the face of increasing forest loss and pressures for agricultural productivity, this landscape provides a rich site for studying the impacts of cropping systems on soil health.
Keywords:
Subject: Biology and Life Sciences - Agricultural Science and Agronomy
1. Introduction
In the equatorial rainforest region, permanent and continuous cultivation of extractive crops has the potential to fundamentally alter soil properties (e.g., reduction in soil organic matter content, changes in soil structure, losses in nutrient retention and erosion resistance) and soil microbial communities [1], which in turn may lower crop yield [2,3]. Shortened fallow periods and year-round cultivation practices are implemented in smallholder farms [4] for the production of food crops (e.g., sole maize or maize-bean intercropping) [5] or cash crops (e.g., sugarcane) [6]. Soil microbial community health is linked to crop productivity and sustainability [7], so it is invaluable to understand how continuous cropping practices in low-input systems change the structure of these microbial communities.
Within the equatorial rainforest region of the River Isiukhu watershed of Kakamega County in western Kenya, we compared soil properties and soil microbial communities in two cropping systems commonly used by farmers in this region—maize-bean intercrops and pure sugarcane fields—and in pristine remnant forest soils.
2. Materials and Methods
The River Isiukhu watershed is a humid forest agroecological zone with poorly drained clay ferralsols in the south and well-drained sandy clay acrisols in the north [8]. We sampled (1) undisturbed soils in the Kakamega Forest Reserve near Maghaka (Ma) in Kenya (F, n = 3), and (2) soils in croplands in Bukhaywa (Bu; sugarcane only), Ikolomani (Ik), and Township (Tw) where maize-bean intercrop (MB, n = 9) or sugarcane crops (Sc, n = 9) had been planted continuously for at least five years.
Five replicates of approximately 400 g from the top 20 cm of soil were collected and then pooled from each location (Ma, Bu, Ik, Tw) for each cropping system (F, MB, Sc) and analyzed for: soil texture (%Sand, %Silt, %Clay) [9], bulk density (BD; g cm−3) [10], pH [11], % organic carbon (%OC) [12], and % nitrogen (%N) [10]. Total N (TN) and soil organic carbon (SOC) in Mg ha−1 were estimated from % dry weight [13].
A subset of 50 g of soil was pooled for each cropping system and analyzed for microbial community profiles. Each sample underwent DNA extraction using 0.25 g of soil followed by PCR amplification using (1) 16S rDNA V4 region prokaryote primers: U518F/806R [14,15] and (2) 28S rDNA Ascomycota (fungi) primers: LSU200A- F/LSU476A-R [16]. Libraries were sequenced using an Illumina MiSeq at the London Regional Genomics Centre (Robarts Research Institute, London, Canada). Amplicon sequence variants (ASVs; clusters of 100% identical sequence reads) were created and classified using DADA2 v1.10.1 [17] and the SILVA 132 [18] reference dataset.
Kruskal-Wallis one-way analysis of variance on ranks and Dunn’s pairwise (p < 0.05) comparisons were used to compare soil properties among locations (Ma, Bu, Ik, Tw) and among cropping systems (F, MB, Sc). Microbial data were analyzed and visualized using microeco v0.5.2 [19], with functions assigned to taxa identified using FAPROTAX [20] and FUNGuild [21] in R v4.1.1.
3. Results
3.1. Soil Properties
The remnant forest system occurred in a relatively restricted range of soil properties—sandier, more acidic, and lower organic carbon, both OC (%) and SOC (Mg/ha)—compared to the two cropping systems. In contrast, the two cropping systems occurred in a broad range of soil conditions—sandy to clay/silt rich, low to high acidity, low to high organic carbon and nitrogen (both N (%) and TN (Mg/ha)) (Table 1).
3.2. Microbial Diversity
The relative abundance of prokaryotes (bacterial and archaeal classes) and Ascomycota differed among the intact forest and the two cropping systems. Among prokaryotes, the largest differences were among classes Bacilli and Gammaproteobacteria (highest in F), Blastocatellia, Alphaproteobacteria (all Eubacteria), and Nitrososphaeria (Archaea) (highest in MB), and the Eubacteria Actinobacteria, Chitinophagia, and Verrucomicrobia (highest in Sc) (Figure S1A). Among orders of Ascomycota, Hypocreales had the highest relative abundance in all three systems (greatest in F, moderate in MB, and lowest in Sc), followed by Pleosporales, Capnodiales, Onygenales, Sordariales, and Helotiales (Figure S1B). Soils of Sc had by far the highest microbial richness and diversity, followed MB and F (Table 2), and had the largest number of unique prokaryote and ascomycotan ASVs, followed by F and MB (Figure 1). Of the top 40 fungal and prokaryote ASVs, 29 fungi and 20 bacteria were confidently identified to genus (Figure S2).
3.3. Microbial Functional Traits
Forest soils and the two cropping systems, particularly Sc, all had prokaryotes with energy source functional traits dominated by aerobic chemoheterotrophy. More prokaryotes capable of fermentation (C-cycling) were found in F soil, followed by Sc and then MB with the least. Forest soils had among the highest diversity of microbes representing the largest diversity of N-cycling functional traits (nitrification, nitrate reduction, ammonia oxidation, and nitrate oxidation). In comparison to F, MB soils had similar percentages of N-cycling microbes but these were concentrated in a smaller number of N-cycling functional traits (nitrogen fixation, nitrification, and ammonia oxidation), and Sc soils had fewer still, concentrated in the smallest number of N-cycling functional traits (nitrification and ammonia oxidation) (Figure 2A). All soils had primarily saprotrophic ascomycotan fungi, with a smaller proportion of symbiotrophs and pathotrophs. Again, F soils had the greatest diversity of fungal functional groups, followed by Sc and MB (Figure 2B), a pattern that was not seen in taxonomic diversity, and MB and Sc fungal guilds and trophic modes were proportionally similar in comparison to F.
4. Conclusions
This communication presents relatively rare data on the soil properties and microbial communities in arable lands with more than five years of continuous maize-bean or sugarcane cultivation in the River Isiukhu watershed of western Kenya. We found that cropping systems influence the composition and functions of microbial communities relative to that of the remnant original forest. Intercrop maize-bean cultivation had higher SOC and %OC than sugarcane and undisturbed forest soils, with a larger proportion of N-cycling bacteria. However, sugarcane had higher bacterial diversity and richness than maize-bean and forest soils. As this was a descriptive study based on a limited number of samples, future work will benefit from increased replication and the inclusion of other cropping systems common in the region. Extractive cropping practices have the potential to fundamentally alter soil chemistry and microbial communities, and their energy and nutrient cycling processes in complex ways.
Supplementary Materials
The following supporting information can be downloaded at the website of this paper posted on Preprints.org. Figure S1: Relative abundance of amplified sequence variants grouped by (A) prokaryote class (16S RNA) and (B) Ascomycota order (28S RNA) for each cropping system; Figure S2: Log relative abundance heatmap of the top 40 ASVs within (A) prokaryote and (B) Ascomycota samples.
Author Contributions
Conceptualization, F.M., I.F.C., R.G.T., A.W.S.; methodology, C.M., N.M.W.; validation, N.M.W., R.G.T.; formal analysis, N.M.W.; investigation, C.M.; resources, F.M., I.F.C., A.W.S.; data curation, N.M.W.; writing—original draft preparation, C.M.; writing—review and editing, N.M.W., F.M., I.F.C., R.G.T., A.W.S.; visualization, N.M.W.; supervision, F.M., I.F.C., R.G.T., A.W.S.; project administration, F.M., I.F.C., R.G.T., A.W.S.; funding acquisition, F.M., I.F.C., A.W.S. All authors have read and agreed to the published version of the manuscript.
Funding
This research received no external funding from agencies in the public, commercial, or not-for-profit sectors. Support from a Queen Elizabeth II scholarship to Christine Matindu enabled molecular work at Western University, Canada.
Data Availability Statement
Raw Illumina MiSeq data was uploaded to ENA under project accession PRJEB44367 and is openly available at https://www.ebi.ac.uk/ena/browser/view/PRJEB44367. Other metadata, R code, and intermediate files are openly available in FigShare at doi:10.6084/m9.figshare.25152740.
Acknowledgments
We thank members of the Department of Soil Science, University of Nairobi, especially Ferdinant Anyika, who helped with soil analyses.
Conflicts of Interest
The authors declare no conflicts of interest.
References
- Khatoon, H.; Solanki, P.; Narayan, M.; Tewari, L.; Rai, J.; Hina Khatoon, C. Role of microbes in organic carbon decomposition and maintenance of soil ecosystem. Int J Chem Stud 2017, 5, 1648–1656. [Google Scholar]
- Amolo, R.A.; Sigunga, D.O.; Owuor, P.O. Evaluation of soil properties of sugarcane zones and cropping systems for improved productivity in Western Kenya. Int J Agron Agric Res 2017, 11, 1–16. [Google Scholar]
- Lal, R. Enhancing crop yields in the developing countries through restoration of the soil organic carbon pool in agricultural lands. Land Degrad Dev 2006, 17, 197–209. [Google Scholar] [CrossRef]
- Tian, G.; Kang, B.T.; Kolawole, G.O.; Idinoba, P.; Salako, F.K. Long-term effects of fallow systems and lengths on crop production and soil fertility maintenance in West Africa. Nutr Cycl Agroecosys 2005, 71, 139–150. [Google Scholar] [CrossRef]
- Nassary, E.K.; Baijukya, F.; Ndakidemi, P.A. Intensification of common bean and maize production through rotations to improve food security for smallholder farmers. J Agr Food Res 2020, 2, 100040. [Google Scholar] [CrossRef] [PubMed]
- Krause, H.; Fasse, A.; Grote, U. Nutrient-dense crops for rural and peri-urban smallholders in Kenya—A regional social accounting approach. Sustainability 2019, 11, 3017. [Google Scholar] [CrossRef]
- Jacoby, R.; Peukert, M.; Succurro, A.; Koprivova, A.; Kopriva, S. The role of soil microorganisms in plant mineral nutrition—current knowledge and future directions. Front Plant Sci 2017, 8, 1617. [Google Scholar] [CrossRef]
- Sombroek, W.G.; Braun, H.M.H.; van der Pouw, B.J.A. Exploratory Soil Map and Agro-climatic Zone Map of Kenya, 1980. Scale 1:1,000,000; Kenya Soil Survey: Nairobi, Kenya, 1982; pp. 1–56. ISBN 9032701622. [Google Scholar]
- Bouyoucos, G.J. Hydrometer method improved for making particle size analysis of soil. Agron J 1962, 54, 464–465. [Google Scholar] [CrossRef]
- Anderson, J.M.; Ingram, J.S.I. Tropical Soil Biology and Fertility: A Handbook of Methods, 2nd ed.; Cambridge University Press: Wallingford, Oxfordshire, 1993; pp. 70–74. ISBN 0-85198-821-0. [Google Scholar] [CrossRef]
- McLean, E.O. Soil pH and lime requirement. In Methods of Soil Analysis, Part 2: Chemical and Microbiological Properties, 2nd ed.; Page, A.L., Ed.; American Society of Agronomy: Madison, Wisconsin, 1982; pp. 192–224. [Google Scholar] [CrossRef]
- Walkley, A.; Black, I.A. An examination of the Degtjareff method for determining soil organic, and a proposed modification of the chromic acid titration method. Soil Sci 1934, 37, 29–38. [Google Scholar] [CrossRef]
- Omoro, L.; Starr, M.; Pellikka, P.K.E. Tree biomass and soil carbon stocks in indigenous forests in comparison to plantations of exotic species in the Taita Hills of Kenya. Silva Fenn 2013, 47, 935. [Google Scholar] [CrossRef]
- Muyzer, G.; De Waal, E.C.; Uitterlinden, A.G. Profiling of complex microbial populations by denaturing gradient gel electrophoresis analysis of polymerase chain reaction-amplified genes coding for 16S rRNA. Appl Environ Microbiol 1993, 59, 695–700. [Google Scholar] [CrossRef] [PubMed]
- Caporaso, J.G.; Lauber, C.L.; Walters, W.A.; Berg-Lyons, D.; Lozupone, C.A.; Turnbaugh, P.J.; Fierer, N.; Knight, R. Global patterns of 16S rRNA diversity at a depth of millions of sequences per sample. P Natl Acad Sci 2011, 108 (Supp 1), 4516–4522. [Google Scholar] [CrossRef]
- Asemaninejad, A.; Weerasuriya, N.; Gloor, G.B.; Lindo, Z.; Thorn, G. New primers for discovering fungal diversity using nuclear large ribosomal DNA. PLoS ONE 2016, 11, e0159043. [Google Scholar] [CrossRef] [PubMed]
- Callahan, B.J.; McMurdie, P.J.; Rosen, M.J.; Han, A.W.; Johnson, A.J.A.; Holmes, S.P. DADA2: High-resolution sample inference from Illumina amplicon data. Nat Methods 2016, 13, 581–583. [Google Scholar] [CrossRef] [PubMed]
- Silva taxonomic training data formatted for DADA2 (Silva version 132). Callahan. B. Available online: https://zenodo.org/records/1172783 (accessed on 8 November 2021). [CrossRef]
- Liu, C.; Cui, Y.; Li, X.; Yao, M. microeco: an R package for data mining in microbial community ecology. FEMS Microbiol Ecol 2021, 97, fiaa255. [Google Scholar] [CrossRef] [PubMed]
- Louca, S.; Parfrey, L.W.; Doebeli, M. Decoupling function and taxonomy in the global ocean microbiome. Science 2016, 353, 1272–1277. [Google Scholar] [CrossRef] [PubMed]
- Nguyen, N.H.; Song, Z.; Bates, S.T.; Branco, S.; Tedersoo, L.; Menke, J.; Schilling, J.S.; Kennedy, P.G. FUNGuild: An open annotation tool for parsing fungal community datasets by ecological guild. Fungal Ecol 2016, 20, 241–248. [Google Scholar] [CrossRef]
Figure 1.
Venn diagram of shared and unique amplified sequence variants (clustered at 100% identity) between (A) prokaryote and (B) ascomycota primers for different cropping regimes. Cropping system include: F—forest, MB—maize-bean, Sc—sugarcane.
Figure 1.
Venn diagram of shared and unique amplified sequence variants (clustered at 100% identity) between (A) prokaryote and (B) ascomycota primers for different cropping regimes. Cropping system include: F—forest, MB—maize-bean, Sc—sugarcane.
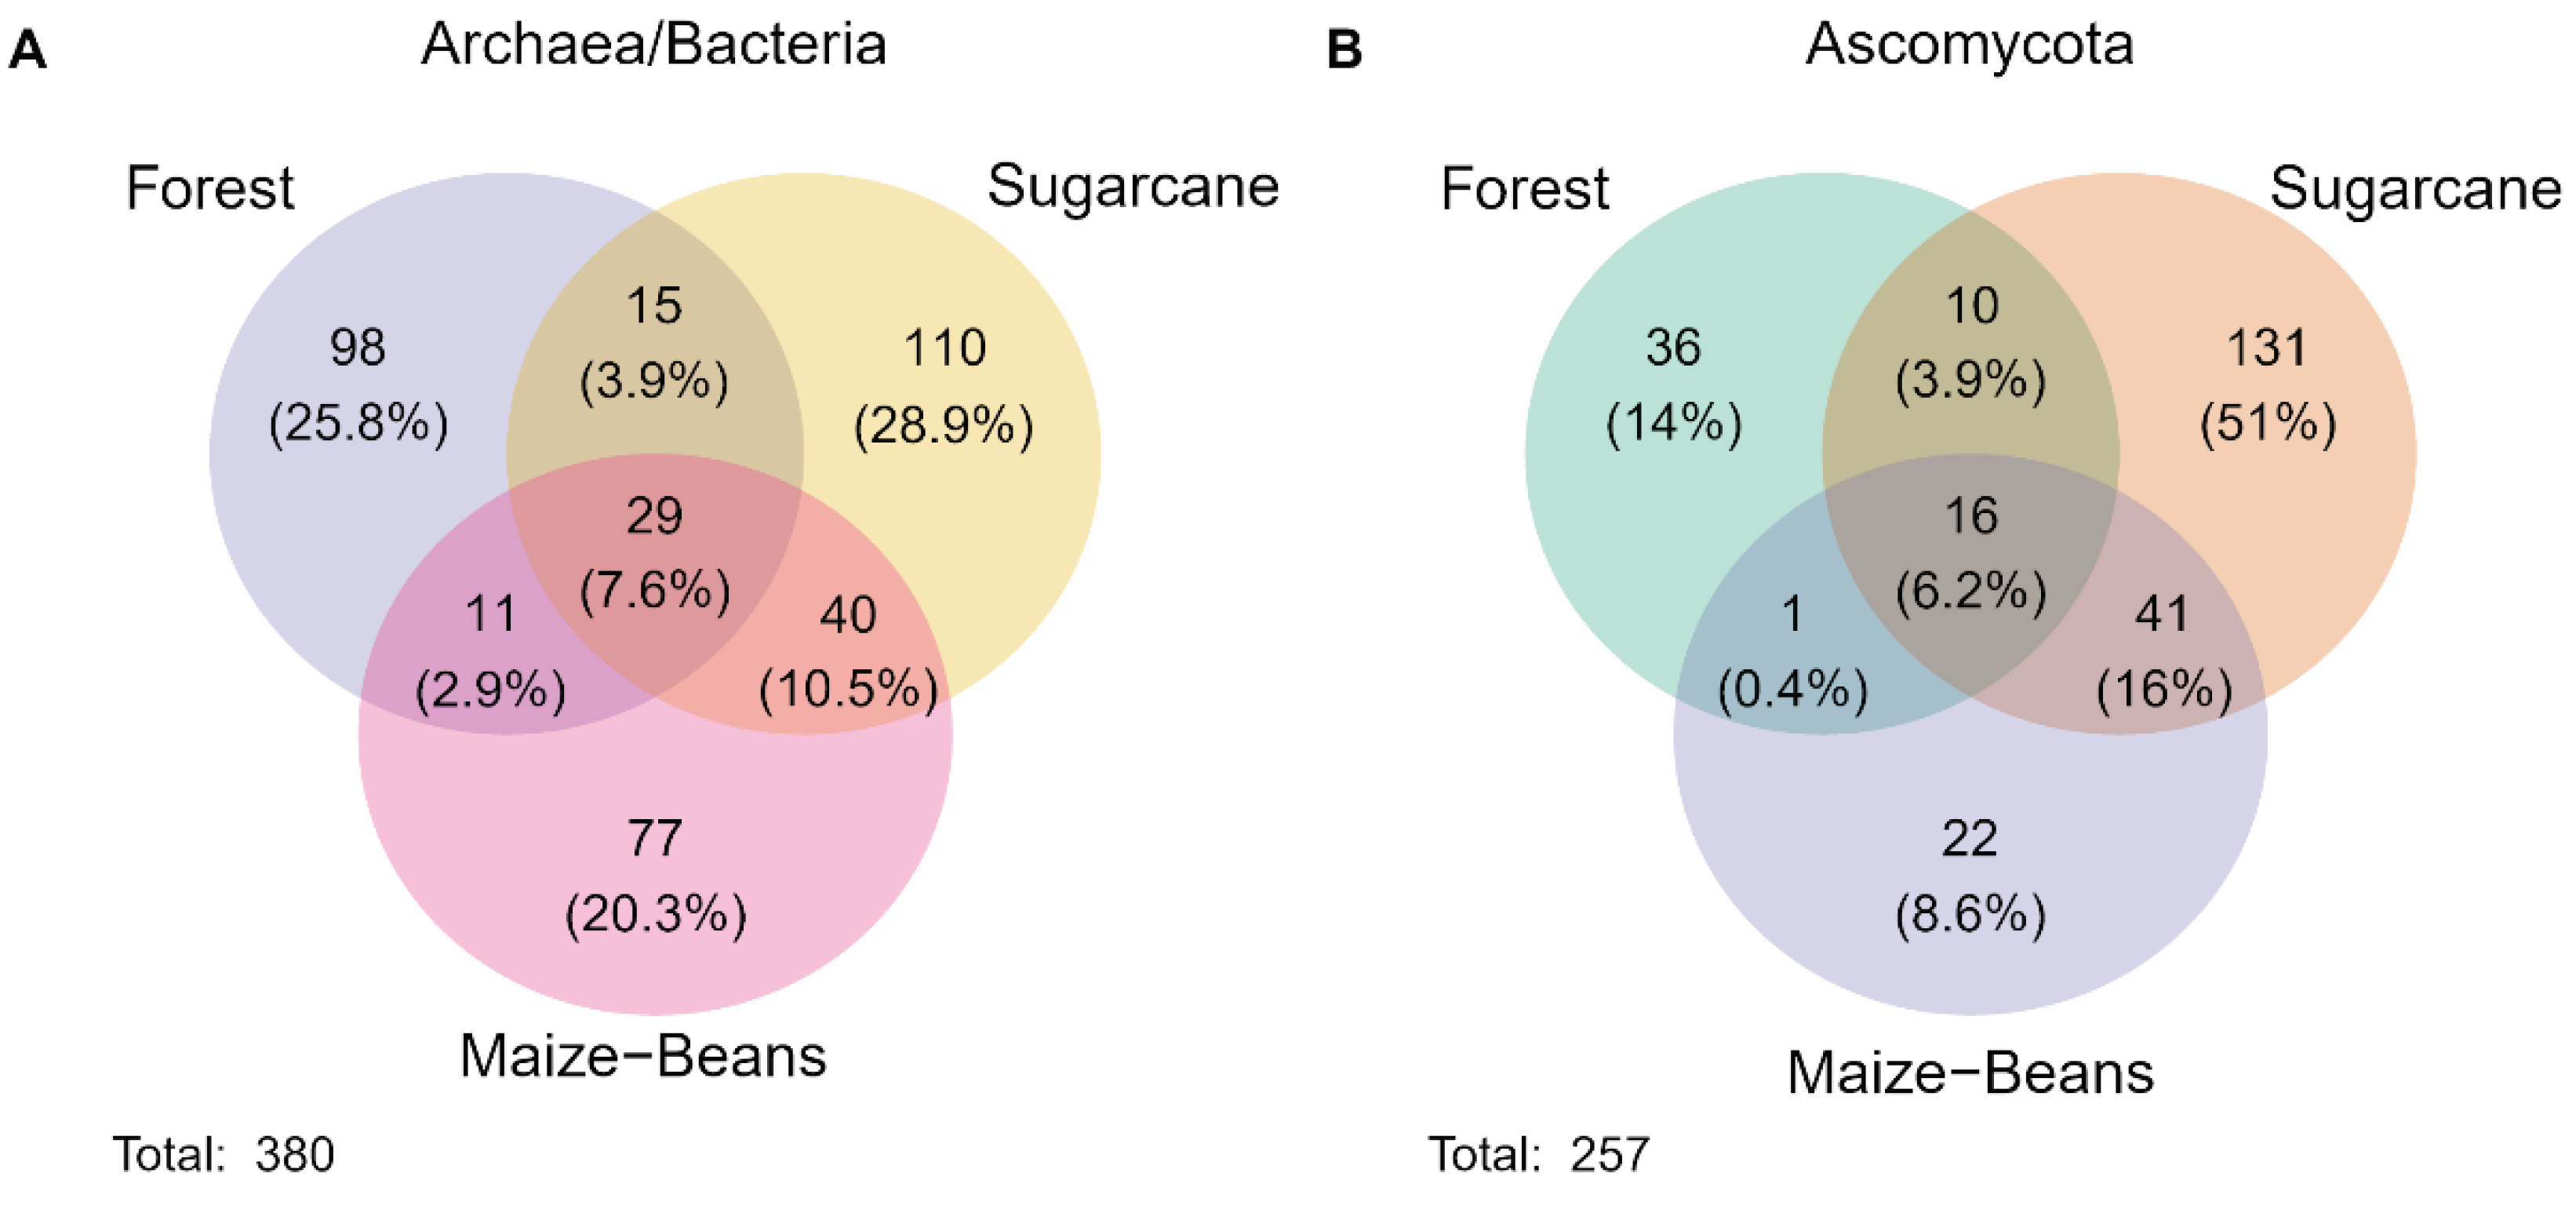
Figure 2.
Select functional traits of (A) prokaryotes (FAPROTAX), and (B) ascomycotan fungi (FUNGuild) as a percent of unique amplified sequence variants in each cropping system: F—forest (prokaryotes n = 25; fungi n = 19), MB—maize-bean (prokaryotes n = 20; fungi n = 26), Sc—sugarcane (prokaryotes n = 34; fungi n = 43).
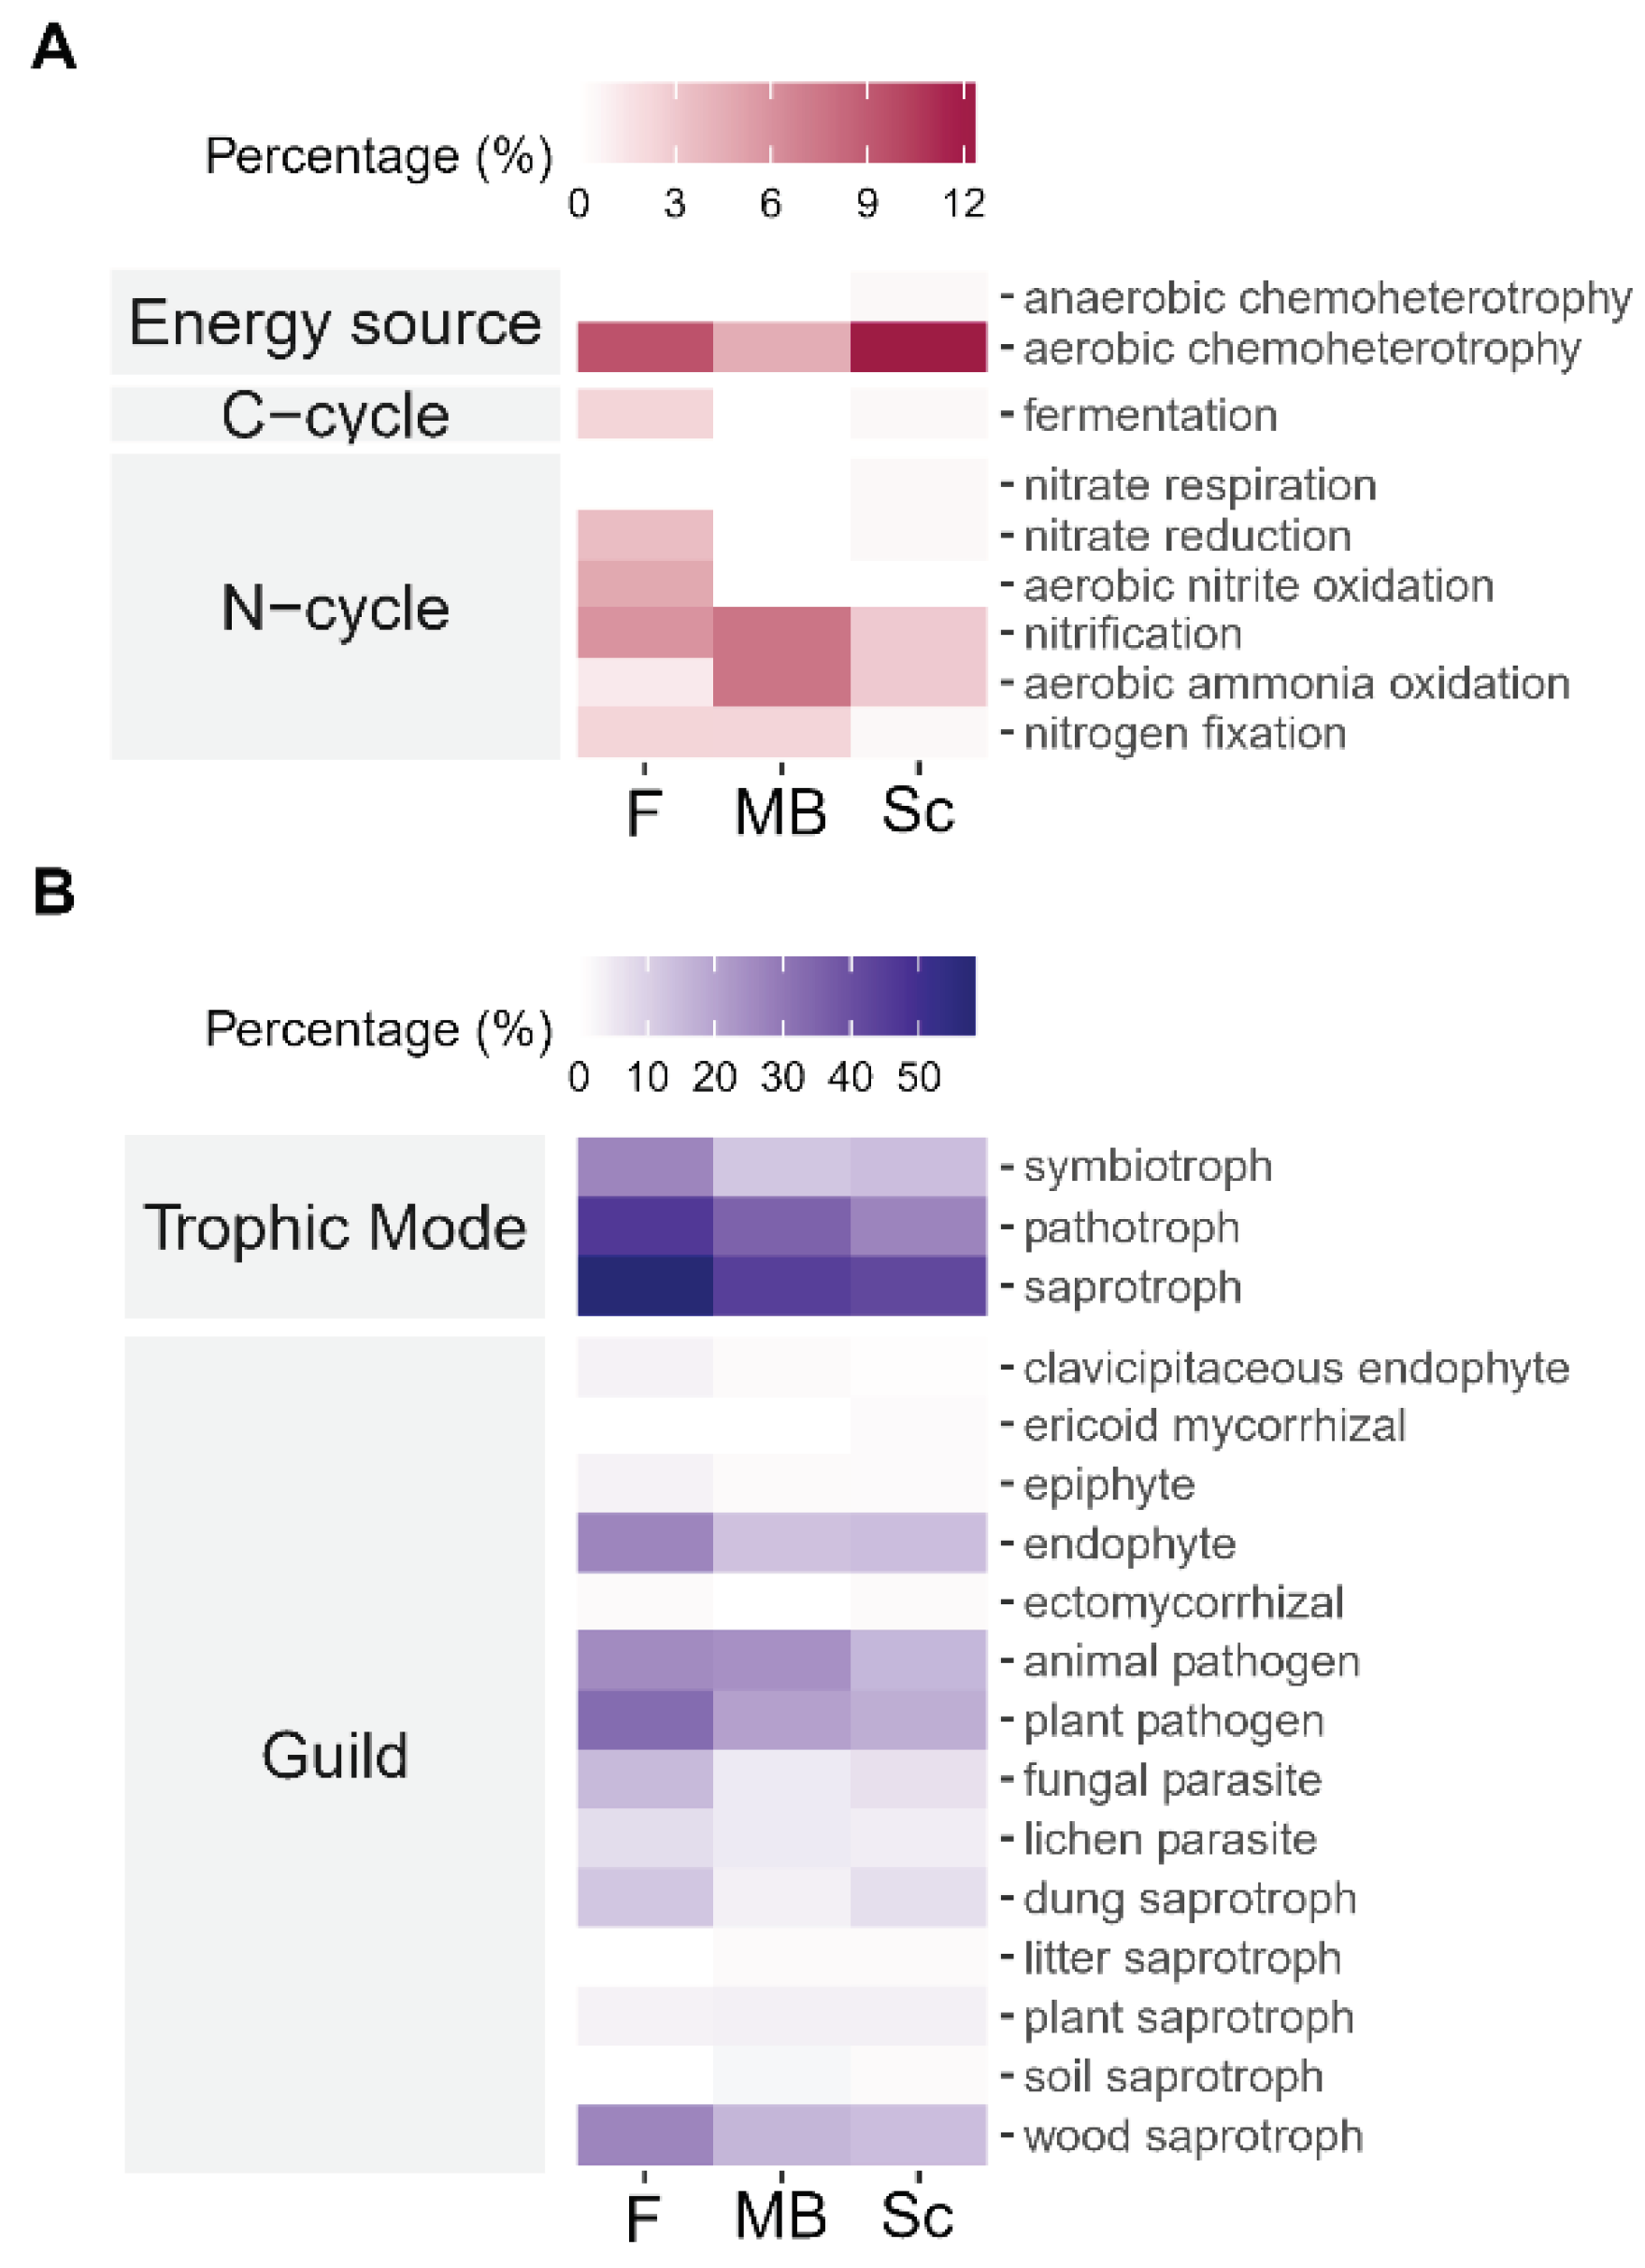

Table 1.
A one-way ANOVA on ranks (Kruskal-Wallis) by cropping system and location. Dunn’s pairwise (p < 0.05) comparisons were adjusted for multiple comparisons using the Holm adjustment, where * = p < 0.05, ** = p < 0.01, *** = p < 0.001, **** = p < 0.0001, ns = not significant (p ≥ 0.05). Sampling locations include: Ma—Magakha, Bu—Bukhaywa, Ik—Ikolomani, and Tw—Township. Cropping systems include: F—forest, MB—maize-bean, and Sc—sugarcane.
| Soil Chemistry | pH | %N | TN | %OC | SOC | BD | %Sand | %Silt | %Clay | |
|---|---|---|---|---|---|---|---|---|---|---|
| Cropping System | ||||||||||
| Kruskal Wallis p-value | 0.016 | 0.293 | 0.324 | 0.034 | 0.033 | 0.282 | 0.03 | 0.088 | 0.081 | |
| Dunn’s Pairwise Comparisons |
F-MB | * | ns | ns | * | |||||
| F-Sc | * | ns | ns | * | ||||||
| MB-Sc | ns | * | ns | ns | ||||||
| Location | ||||||||||
| Kruskal Wallis p-value | 0.002 | 0.125 | 0.233 | 0.024 | 0.038 | 0.059 | <0.001 | <0.001 | <0.001 | |
| Dunn’s Pairwise Comparisons |
Ma-Bu | ** | ns | ns | ns | ns | ns | |||
| Ma-Ik | ns | ns | ns | *** | ** | ** | ||||
| Ma-Tw | * | ns | ns | ns | ns | ns | ||||
| Bu-Ik | ns | * | ns | **** | **** | *** | ||||
| Bu-Tw | ns | ns | ns | ns | ns | ns | ||||
| Ik-Tw | ns | ns | ns | ** | * | * | ||||
Table 2.
Observed microbial richness (Richness) and diversity (Fisher’s alpha, Shannon, Inverse Simpson) indices under forest (F), maize-bean (MB), and sugarcane (Sc) soils.
Table 2.
Observed microbial richness (Richness) and diversity (Fisher’s alpha, Shannon, Inverse Simpson) indices under forest (F), maize-bean (MB), and sugarcane (Sc) soils.
| Richness (S) |
Fisher’s α (S) |
Shannon (H′) |
InvSimpson (λ−1) |
||
|---|---|---|---|---|---|
|
Archaea/ Bacteria |
F | 153 | 17.1 | 4.7 | 73.0 |
| MB | 157 | 17.7 | 4.7 | 64.7 | |
| Sc | 194 | 33.0 | 4.8 | 75.3 | |
| Fungi (Ascomycota) | F | 63 | 6.9 | 2.9 | 8.1 |
| MB | 80 | 9.8 | 3.3 | 9.5 | |
| Sc | 132 | 15.5 | 4.1 | 28.2 |
Disclaimer/Publisher’s Note: The statements, opinions and data contained in all publications are solely those of the individual author(s) and contributor(s) and not of MDPI and/or the editor(s). MDPI and/or the editor(s) disclaim responsibility for any injury to people or property resulting from any ideas, methods, instructions or products referred to in the content. |
© 2024 by the authors. Licensee MDPI, Basel, Switzerland. This article is an open access article distributed under the terms and conditions of the Creative Commons Attribution (CC BY) license (http://creativecommons.org/licenses/by/4.0/).
Copyright: This open access article is published under a Creative Commons CC BY 4.0 license, which permit the free download, distribution, and reuse, provided that the author and preprint are cited in any reuse.


MDPI Initiatives
Important Links
© 2024 MDPI (Basel, Switzerland) unless otherwise stated