Preprint
Article

Understanding Microplastics Retention Efficiency and Sorption Dynamics in Porous Media

Altmetrics

Downloads

160

Views

160

Comments

0

Submitted:

28 February 2024

Posted:

29 February 2024

You are already at the latest version

Alerts
Abstract
This study concerns the transport and retention of polydisperse micron-sized (16 ± 6 µm) of microplastics (MPls) in porous media under varying flow rate conditions. Sorption kinetics were modeled using first-order reversible and irreversible kinetic sorption models, with sensitivity analyses providing insights into each sorption parameter's effect. Both numerical modeling and experimental measurements were employed to assess sand filter retention rates. The impact of flow rate on sorption reveals variations in distribution coefficient (Kd), mass transfer coefficient (β), and irreversible sorption rate (K1). Lower flow rates are correlated with higher Kd and β values, indicating an increase in sorption and diminished mass transfer rates. The findings revealed that an increase in Kd resulted in a more gradual sorption process with a decrease in peak concentration, whereas changes in β influenced the rate of sorption and peak concentration to a lesser extent compared to Kd. Lower K1 values are associated with higher peak concentrations and decreased retention efficiency. Retention rates were evaluated by a numerical model and found as 28 ± 1% at a flow rate of 31 ml min⁻¹ and 17 ± 1% at 65 ml min⁻¹. The introduction of MPls into soil environments has been noted to modify transport dynamics into soil. As a result, these alterations effects hydrological characteristics of soil, thereby impacting quality of groundwater and agricultural output. The mean absolute error (MAE) of 6% between modeled and observed retention rates suggests minor discrepancies. This study highlights the importance of examining retention efficiency and the accuracy of numerical models in porous media during MPl transport.
Keywords: 
Subject: Environmental and Earth Sciences  -   Environmental Science

1. Introduction

Plastics are extensively used across various sectors, yet their inadequate recyclability coupled with degradation and abrasion processes leads to their fragmentation into smaller pieces and release to nature. Subsequently, these plastic fragments are disseminated into natural environments through diverse transport mechanisms, including wind, runoff, and infiltration. Consequently, these plastic particles, categorized as emerging pollutants, pervade natural ecosystems, including freshwater resources, thereby posing potential risks to living organisms and natural cycles. Solid plastic particles insoluble in water, ranging in size from 1 µm to 1,000 µm are categorized as microplastics (MPls), with dimensions ranging from 1 mm to 5 mm, and are classified as large MPls. The size classification of MPls is divided into 6 classes (Tabel S1) [1].
MPls have been identified in marine, terrestrial, and freshwater environments [2,3]. They have also been found in karst groundwater systems [4], alluvial sedimentary aquifers [5], and groundwater around landfill sites [6]. The filtration properties of groundwater environments play a crucial role in regulating the quality of groundwater by removing or reducing the concentration of particles and contaminants as water moves through the subsurface. The filtration mechanism of porous media is orchestrated through three key steps. The first is a transport step, characterized by a physical-hydraulic process. Following this, an attachment step ensues, driven by a physical-chemical process. The final step is detachment, wherein retained particles are released as long as new particles or blank water continue to be supplied. These steps collectively define the dynamic processes governing the intricate filtration mechanism of porous media [7].
Physical mechanisms that are mainly responsible for particle transport in the filter pores are Brownian diffusion, deposition, direct interception, and hydrodynamics. Diffusion assumes a critical role, especially for particles smaller than 1 micron [8]. The deposition mechanism, governed by gravity, is linked to the sedimentation rate of particles. This process guides particles through streamlines, ultimately directing them toward the grains of porous media, known as collectors. Gravity-induced deposition holds particular significance for particles larger than 1 micron, where the density of particles becomes pivotal. Interception occurs as particles traverse streamlines closely to the collector, resulting in attachment. The hydrodynamic process, influenced by particle rotation and movement across streamlines, is intricately tied to particle shape and its interaction with the fluid [8].
The adaptation of the approaches used for solute transport to colloidal solution transport is an employed practice [9]. In the literature, there are models that integrate the classical advection-dispersion equation with various types of kinetic attachment models. A majority of these transport models presume that the attachment process adheres to either one-site kinetics, involving both forward and reverse terms [10], or two-site kinetics, encompassing reversible and irreversible attachment mechanisms [11]. In a kinetic model, the solute transport equation describes the rate at which the solute is adsorbed onto the solid surface and desorbed from it [12].
In recent studies, the analysis of MPls transport into porous media has predominantly involved the utilization of Class 1 (1 μm to 5 μm) MPLs, as outlined in Table S1 [13,14,15]. Hou et al., (2020) focused on Class 3 (10 μm to 50 μm) MPls revealed that increased particle sizes in the porous medium, along with lower ionic strength and the presence of fulvic acid, can potentially augment the movement of MPLs (40 - 48 µm) within porous media. Conversely, smaller-sized porous media and lower velocities demonstrate superior filtration performance. The highest mass recovery of MPls was determined to be 18 %. Another study involving MPLs (200 - 500 µm) which corresponds Class 5 (100 µm to 500 µm) found that velocity is a significant parameter influencing filtration [17]. Two models, namely the attachment model and the attachment-detachment model, were formulated, and it was determined that the attachment-detachment model, incorporating a time-dependent detachment coefficient, better predicts the transport of MPls (10 µm and 20 µm) which in the range of Class 3 (10 μm to 50 μm) in porous media compared to the traditional attachment model [18]. This observation underscores the importance of MPls desorption in the transport process. The calculated total mass recovery under various conditions ranged from 0.08% to 35.9% [18].
Notably, there is a lack of research concentrating on the filtration capacity of porous media for non-reference type MPls and their transport dynamics. These MPl particles, lacking the characteristics of reference material, are presumed to exhibit shapes and size distributions more akin to particles found in natural environments. This study aims to investigate the filtration capacity of porous media while transport of polyethylene-type, polydisperse, Class 3 sized MPl particles in a saturated quartz sand-type porous medium and assess its filtration efficiency using numerical models derived from flow and transport equations. This investigation encompasses the computation of sorption parameters with reversible and irreversible kinetic sorption models, the determination of retention efficiencies, and an examination of the impact of flow rate on the transport process.

2. Materials and Methods

2.1. Materials

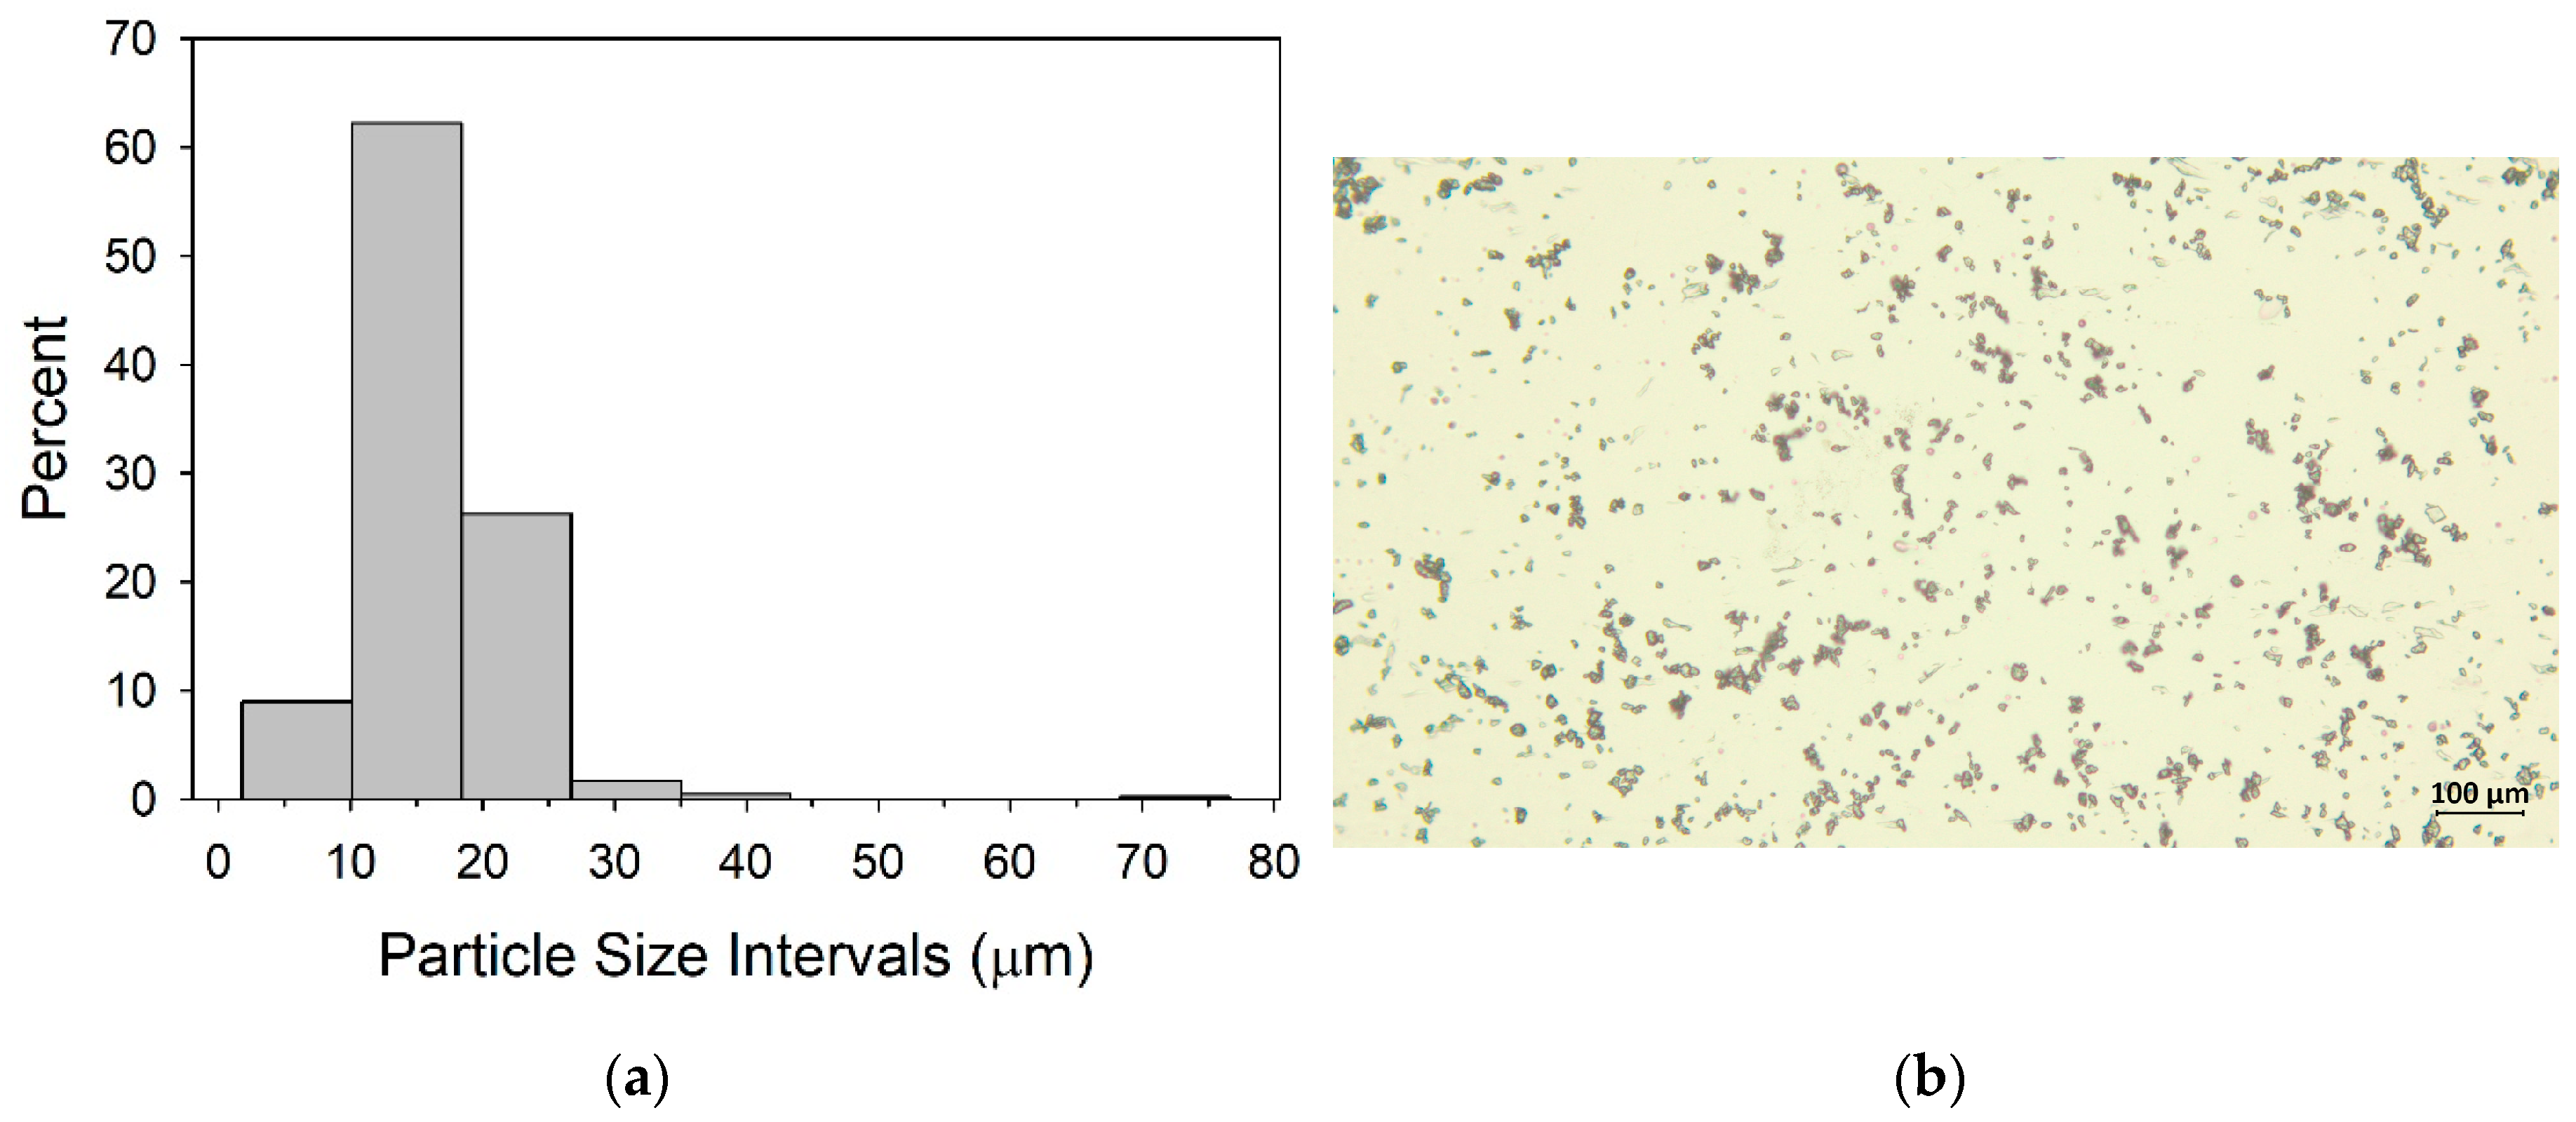
The polyethylene (PE) type MPls are in fine powder form with a density of 0.91 g cm-3 were purchased from Goonvean Fibres, (United Kingdom). The PE particles are polydisperse, and their size measurements were conducted under optical microscopy, with an average particle size of 16 ± 6 µm (Figure 1a and Table 1). The shape of MPls can be described as fragmental (Figure 1b). A commercially available dish detergent containing anionic surfactant was employed to generate a uniform suspension of MPls. Injection concentrations were prepared with MPls and surfactant at a ratio of 1:1, with a concentration of 2 g/L. Prior to reaching the 1:1 ratio, lower ratios were attempted, but successful dispersion could not be achieved. Additionally, the 1:1 ratio was favored in the literature [19].
A stock concentration of 25 g L-1 of rhodamine WT (Cole-Parmer) fluorescent dye was utilized in tracer experiments to assess the hydrodynamic characteristics of porous media. The primary concentration was diluted to 400 µg L-1 to perform dye tracer experiments right before starting the experiment to avoid the direct influence of sunlight.
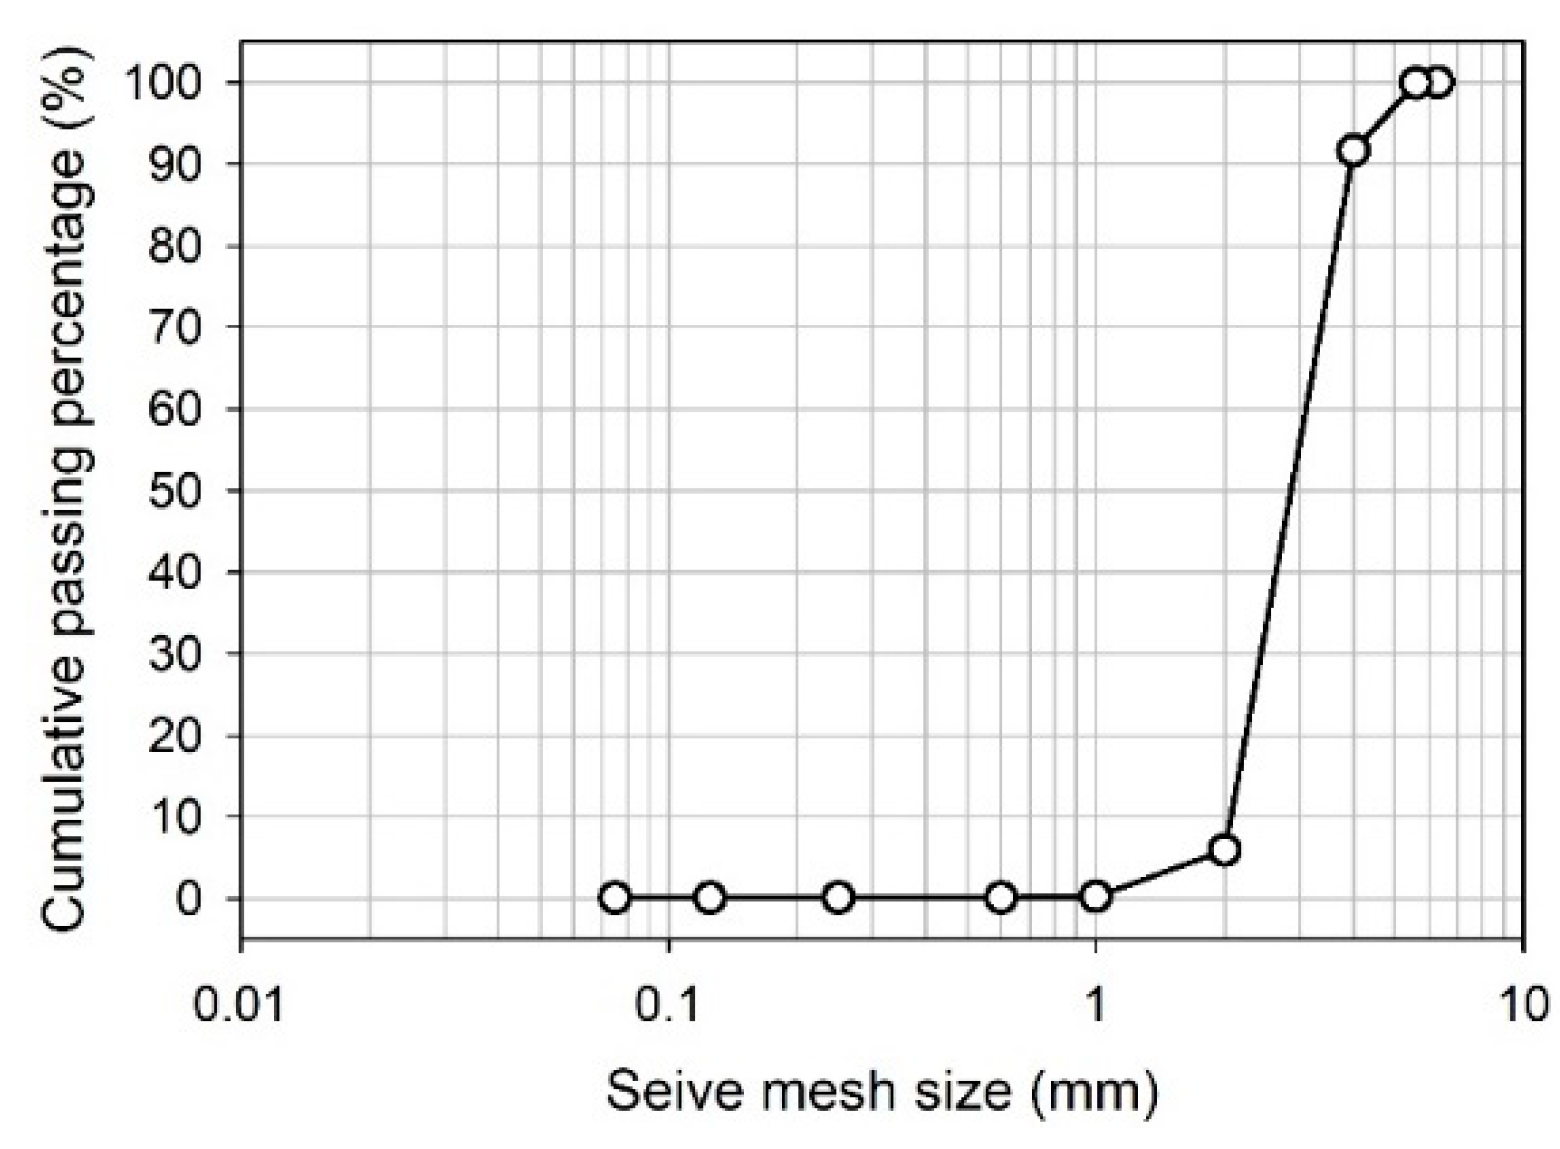
Quartz sand was kindly provided by Esan Eczacıbaşı Industrial Raw Materials Co. (Türkiye) with a density of 2.60 g ml-1 and bulk density of 1.33 g ml-1. The determination of particle size was accomplished via sieve analysis, resulting in a D50 value of 2.9 mm. A notable proportion, specifically 83%, of the sand exhibited retention on a 2 mm mesh-sized sieve (Figure 2). The hydraulic conductivity of the sand was determined with a constant head permeameter and found to be 11.0 ± 0.3 cm min-1. The effective porosity (θ) was calculated as 0.49 ± 0.009 with fluorescent dye tracer experiments and numerical modeling.

2.2. Methods

Transport experiments and constant head permeameter experiments were conducted in an acrylic column with 100 cm height and 7 cm inner diameter. The column has been packed with washed and dried sand at 105 ° C overnight. During the packaging process, water was pumped from bottom to top, and the column was gently tapped to prevent possible air bubbles.
The experiments adhered to a sequence commencing with constant-head permeameter tests to ascertain hydraulic conductivity. Subsequently, dye tracer experiments were conducted to evaluate the hydrodynamic properties of the porous media, and the sequence concluded with MPls tracer experiments aimed at determining sorption parameters and retention efficiencies of the porous media. This order was consistently followed for each column packing, and after completing the series of experiments, the porous media were changed for a new set of tests. In total, four sets of experiments were carried out.

2.2.1. Permeameter Experiments

Following the column filling process, preceding each dye tracer test, constant head permeameter experiments were conducted. The hydraulic conductivity of the packed sand was determined with Dacy’s Law [20].
K = Q A d h / d s
K is the hydraulic conductivity (L/T), Q is discharge (L3/T), A is the cross-sectional area of the column (L2) and dh/ds is the hydraulic gradient. The hydraulic gradient was altered three times, and the average values resulting were employed in the numerical models.

2.2.2. Transport Experiments

Subsequently, the column underwent a thorough flushing with distilled water, reaching a state of saturation characterized by effluent exhibiting negligible turbidity measurements. The operational pH and electrical conductivity values were measured following each MPls transport experiment, with mean values determined as 7 ± 0.2 for pH and 57 ± 5 µS cm-1 for electrical conductivity.
The volume of one pore volume in each sand-packed column varies slightly depending on the sand height and porosity. Specifically, the average one pore volume of the sand-packed column is calculated to be 1664 ± 31 ml. The amount equivalent to 1.8 pore volume of fluorescent dye tracer was continuously injected, followed using at least 2 pore volumes for the 65 ± 0.3 ml min⁻¹ flow rate, and 5 pore volumes for the 31 ± 0.4 ml min⁻¹ flow rate of distilled water to flush the column. This injection procedure was followed for continuous injection of MPls. The flushing process was conducted at a constant flow rate generated by a peristaltic pump 65 ± 0.5 ml min⁻¹ and 31 ± 0.2 ml min⁻¹ flow rates. Relative to the flow rate employed, samples of 4 ml each were collected every two minutes, commencing from the 8th minute post-injection for a flow rate of 65 ml min⁻¹, and every three minutes, beginning from the 27th minute post-injection for a flow rate of 31 ml min⁻¹. Each flow rate condition was replicated.
The flow rates of 31 ml min⁻¹ and 65 ml min⁻¹ correspond to linear velocities (v) of 0.4 cm min⁻¹ and 0.8 cm min⁻¹, respectively. Groundwater moves from higher elevations to lower elevations and from locations of higher pressure to locations of lower pressure. Typically, this movement is quite slow, ranging from less than 0.3 meters per day to a few tens of meters per day. For karst aquifers, which are not considered porous medium, it could be faster [21].Typical groundwater velocity in a sandy or gravelly aquifer may range from approximately 0.01 to 1 cm per minute [22].
There is nearly a twofold difference between the two flow rates, which allows for the distinction of their effects on the experiment. When the flow rate is too fast, advective transport becomes dominant, overshadowing the dispersion and sorption effects. Therefore, a maximum flow rate of 65 ml min⁻¹ was chosen. For the selection of the lowest flow rate, the reliability of operational conditions was considered, particularly focusing on the duration of the experiment, which was set to six hours for a flow rate of 31 ml min⁻¹. These selected flow rates align with the general conditions of groundwater flow.
The Aquaflour® Handheld dual-channel fluorometer and turbidity device were utilized for concentration determination. For fluorescent dye tracer experiments, the concentration measurements were calibrated using known concentrations of dye solutions in the green channel. Following the calibration of the fluorometer at a concentration of 400 µg/L rhodamine WT for effluent measurements, dilutions of rhodamine WT were prepared for each experiment by deriving calibration curves from the injection solution. (Figure S1) For MPl tracer experiments, the turbidity channel was employed. The device was initially calibrated using a 1000 NTU calibration standard, followed by the creation of a calibration curve using MPls and surfactant-containing suspension of different concentrations to convert NTU to concentration values (Figure S2). The injection concentration is selected 2 g/L which is approximately equal to the 1000 NTU to reduce the measurement errors due to impurities caused by sand or water at the low concentrations in the experiment.
In simulation computations, MT3DMS where MT3D stands for the Modular 3-Dimensional Transport model, and MS denotes the multi-species structure for accommodating add-on reaction packages is commonly employed alongside MODFLOW which is a block-centered finite-difference flow model. Following the development and calibration of a flow model, the required data for the transport model was retrieved accordingly. [23,24]. The transport of fluorescent dye was simulated using advection-dispersion equations corporation first-order reversible kinetic (non-equilibrium) sorption, while the transport of MPls was modeled with advection-dispersion equations incorporating first-order reversible kinetic (non-equilibrium) sorption and first-order irreversible sorption terms. The numerical models from the observed values were created with Groundwater Vistas Version 7 (student license) which provides user interfaces for MODFLOW and MT3D modules of USGS [24]. The MT3D module is applied for modeling advection, dispersion, and chemical reactions within groundwater systems.
The partial differential equation governing the fate and transport of contaminants in one-dimensional, transient groundwater flow systems can be expressed as follows [24] :
θ C t = x θ D C x x θ v C + q C s + Σ R n
where θ is porosity (-), C is concentration (ML-3), t is time (T), x is distance (L), D is hydrodynamic dispersion coefficient (L2T-1), v is linear pore water velocity (LT-1), q is volumetric flow rate per unit volume of aquifer representing fluid sources (positive) and sinks (negative) (T-1), Cs is concentration of the source or sink flux (ML-3), and ΣRn is chemical reaction term (ML-3T-1).
In instances where the local equilibrium cannot be attained, it is posited that the sorption process may be effectively delineated through a reversible kinetic reaction of the first order as follows [24]:
ρ d C t = β C C K d
Where ρb is bulk density (M/L3), β is the first-order mass transfer rate between the dissolved (C) and sorbed (C’) phases (T-1), and Kd is the distribution coefficient (L3M-1).
The bulk density ρb is calculated from the density ρ of sand grains (M/L3) which is calculated with a pycnometer. Then the bulk density is calculated as follows [20]:
ρ b = 1 θ ρ
In some situations, once the solute is sorbed on the solid phase, it cannot be desorbed. The reaction is irreversible and leads to a mass loss of the dissolved phase. This process can be described through the first-order irreversible kinetic sorption model, with the following equation [25]:
C t = K 1 C
where K1 (T-1) is the first order irreversible kinetic sorption rate constant.
The first-order irreversible kinetic sorption model was used by Lee et al., (2021) to analyze the migration of toluene contaminant plume in 3D flow conditions. This last kinetic model was also applied to simulate radioactive decay or biodegradation [27]. In such cases, the constant rate (K1) is related to the half-life (t1/2) of the materials as follows (Equation 5):
K 1 = ln 2 t 1 / 2
where t1/2 is conventionally denoting half-life (T-1), was employed to signify the retained mass rather than its conventional application to represent the temporal duration associated with the decay of a substance by half.
Rhodamine WT might not behave entirely as a conservative tracer, especially when applied to the used quartz sand [28,29]. Consequently, a numerical solution incorporating sorption was chosen as a better fit, enhancing the alignment of calculated BTCs with observed BTCs. Through fluorescent dye experiments, kinematic porosity (θ), dispersivity (α), distribution coefficient for the sorbed phase (Kd), and the first-order mass transfer rate (β) values that characterize properties of porous media were estimated. The obtained θ and α values were subsequently utilized as inputs for analyzing MPl experiments. In the MPl experiments, the parameters under investigation include the distribution Kd, β, and K1. The identification of optimal values necessitates the utilization of a trial-and-error approach. The parameters Kd, β, and K1 were adjusted iteratively to align the curve with the calculated values to the curve with observed values. Following each parameter adjustment, the residual sum of squares (RSS) error was scrutinized.

2.2.3. Retention Efficiencies

The quantity of MPls transported through the porous media was assessed through numerical model mass calculations and by measuring the mass of particles at the conclusion of experiments. The numerical model evaluation involves accounting for mass released from storage as a result of a decrease in sorbed concentration and mass accumulation in storage due to an increase in sorbed concentration, incorporating considerations for first-order irreversible reactions.
Experimental measurements were conducted by collecting the transported effluent with a known volume at the conclusion of experiments. The concentration of accumulated particles was determined using a turbidimeter and then converted to concentration units. By utilizing the known volume, the transported mass was calculated. Subsequently, the initially transported quantity was subtracted from the total injected amount, thereby yielding insights into the retention rates of MPls in porous media.
The Mean Absolute Error (MAE) was calculated by comparing the retention values obtained numerically with those measured experimentally, aiming to evaluate the precision of the numerical model. MAE provides a direct measure of the average absolute deviation between predicted and actual values. It is frequently employed in scenarios where all errors carry equal significance, rendering it more resilient to the influence of outliers compared to other metrics such as RMSE. Additionally, MAE shares the same unit of measurement as the original data, further enhancing its interpretability.
2.2.4. Sensitivity Analyses

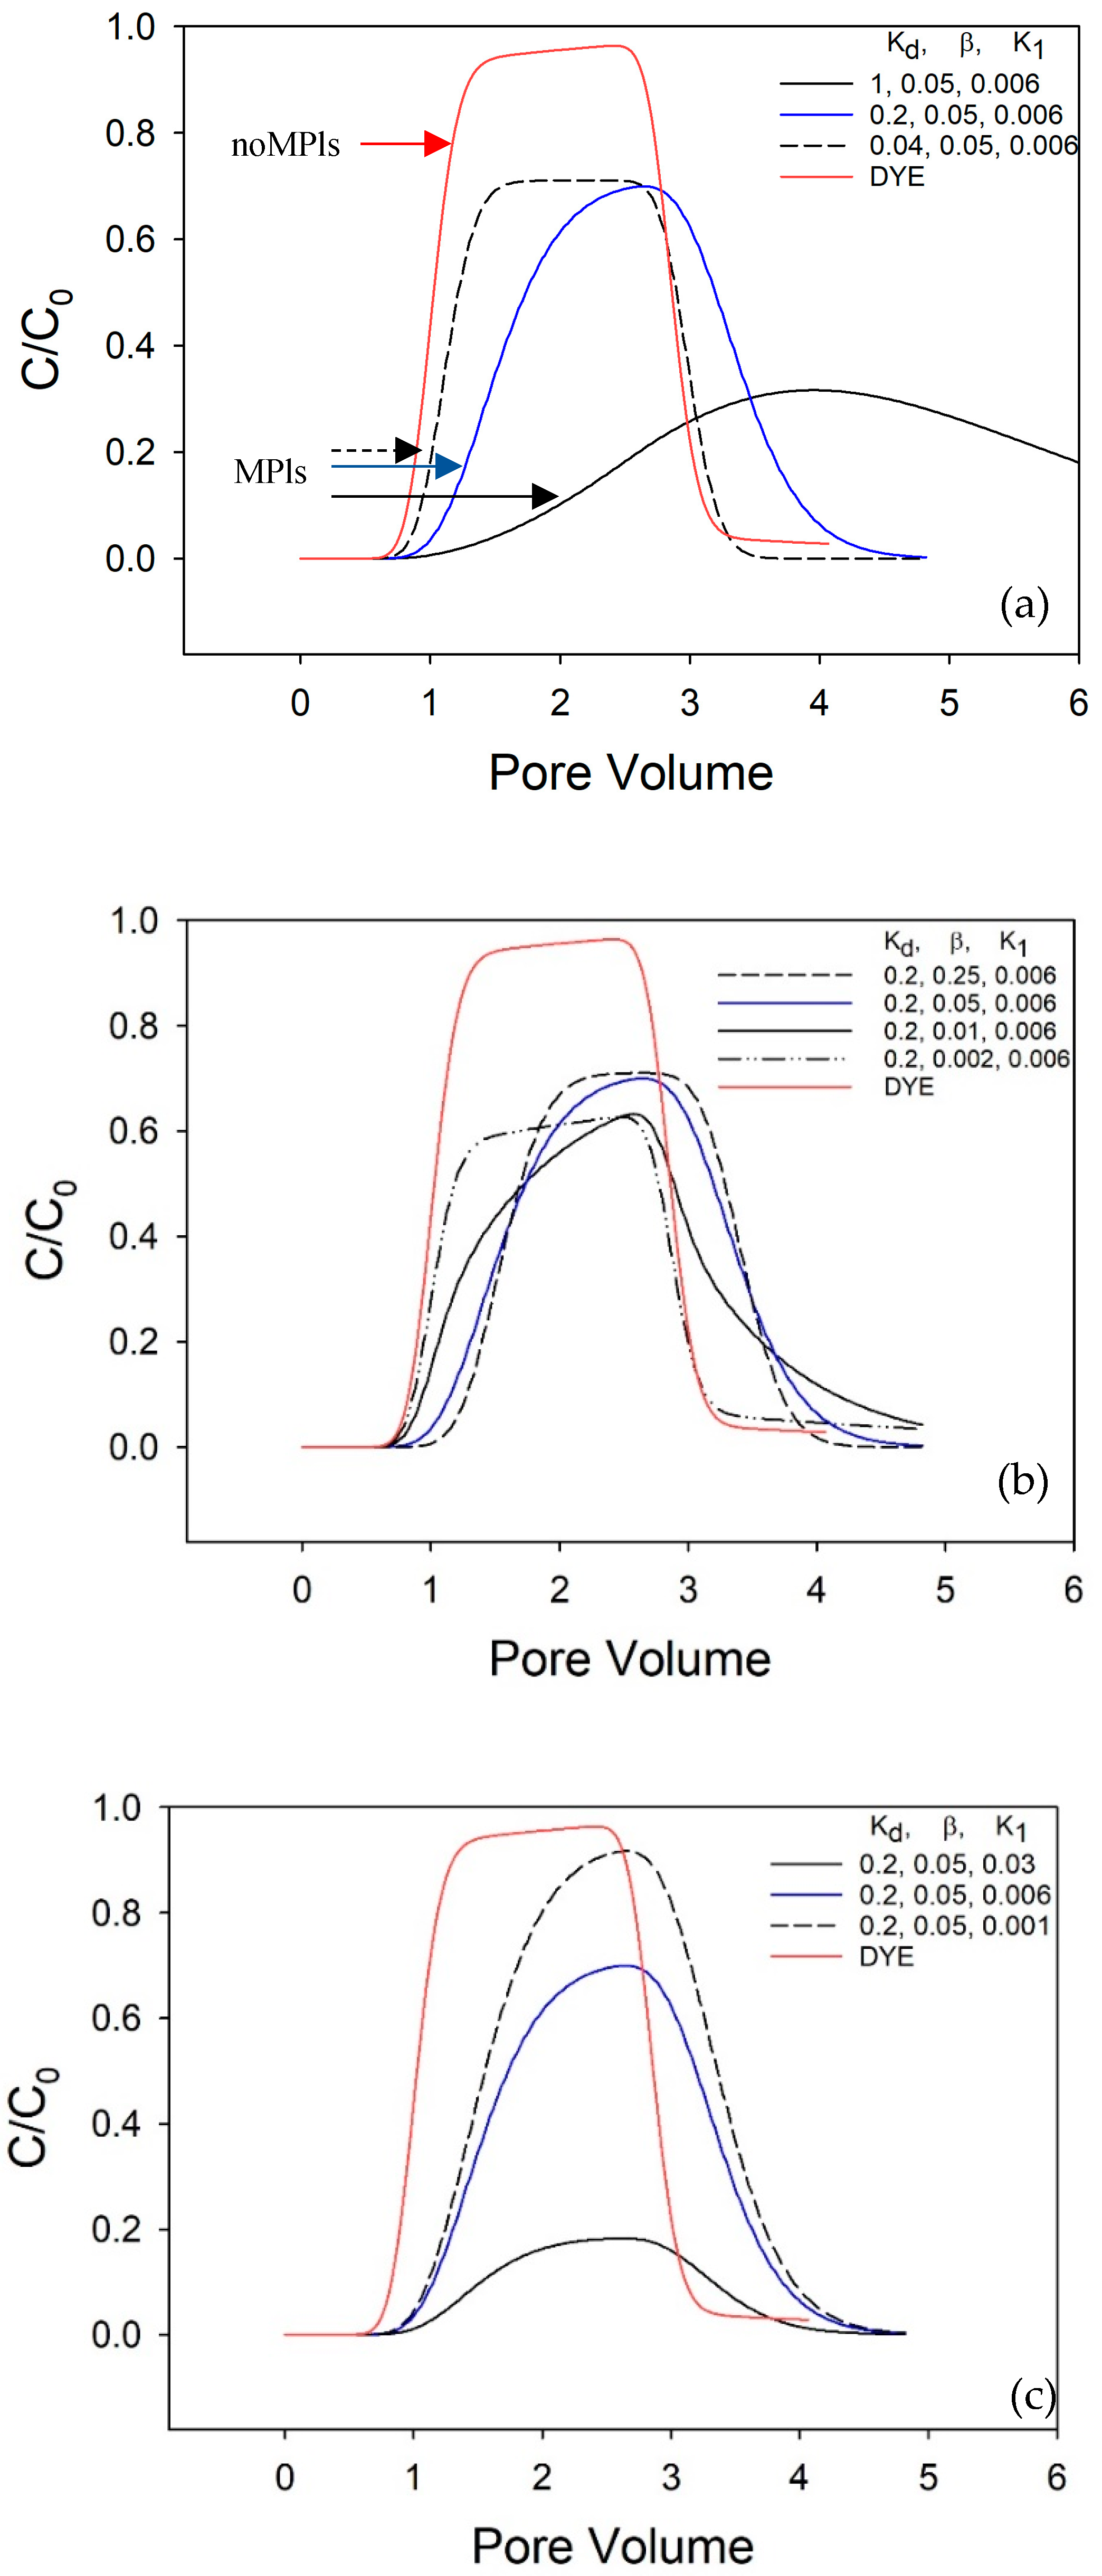
The sensitivity of the model was applied by systematically altering the input of one parameter at a time, including Q, Kd, β and K1, to evaluate their effects on the filtration of MPls. In the sensitivity analyses, each variable was individually modified based on the predicted values of the MPl A and MPl B experiments. The influence of sorption on MPls’ transport was assessed based on both the MPl particle transport experiment and the dye (solute) experiment. The dye experiment serves as a reference transport breakthrough curve (BTC). The impact of retention efficiencies was assessed to comprehend the influence of Q and K1 parameters on retention.

3. Results and Discussions

3.1. Permeameter Experiments

In this study, a constant head permeameter and a dye experiment were conducted under consistent conditions for each MPls experiment. This allowed for the observation of the transport behavior of MPls in comparison to the solute. Hydraulic conductivity values were determined with Equation 1 and shown in Table 2 for each packed sand column by conducting constant-head permeameter tests to be used in the numerical model. Minor disparities in hydraulic conductivity values are evident, likely attributed to the utilization of freshly packed sand for each experiment. Variations in the arrangement of sand grains, discrepancies in grain sizes, and the presence of angular shapes could account for these observed differences.

3.2. Transport Experiments

Breakthrough curves (BTCs) are depicted by a normalized concentration, defined as the outlet concentration (C) divided by the constant inlet concentration (C0), as a function of pore volume, which represents the volume of voids within the packed porous media. The pore volume is computed by multiplying the volume of the packed column (or the volume can be calculated for each sample while multiplying sampling time with flow rate) by the porosity of the porous media.
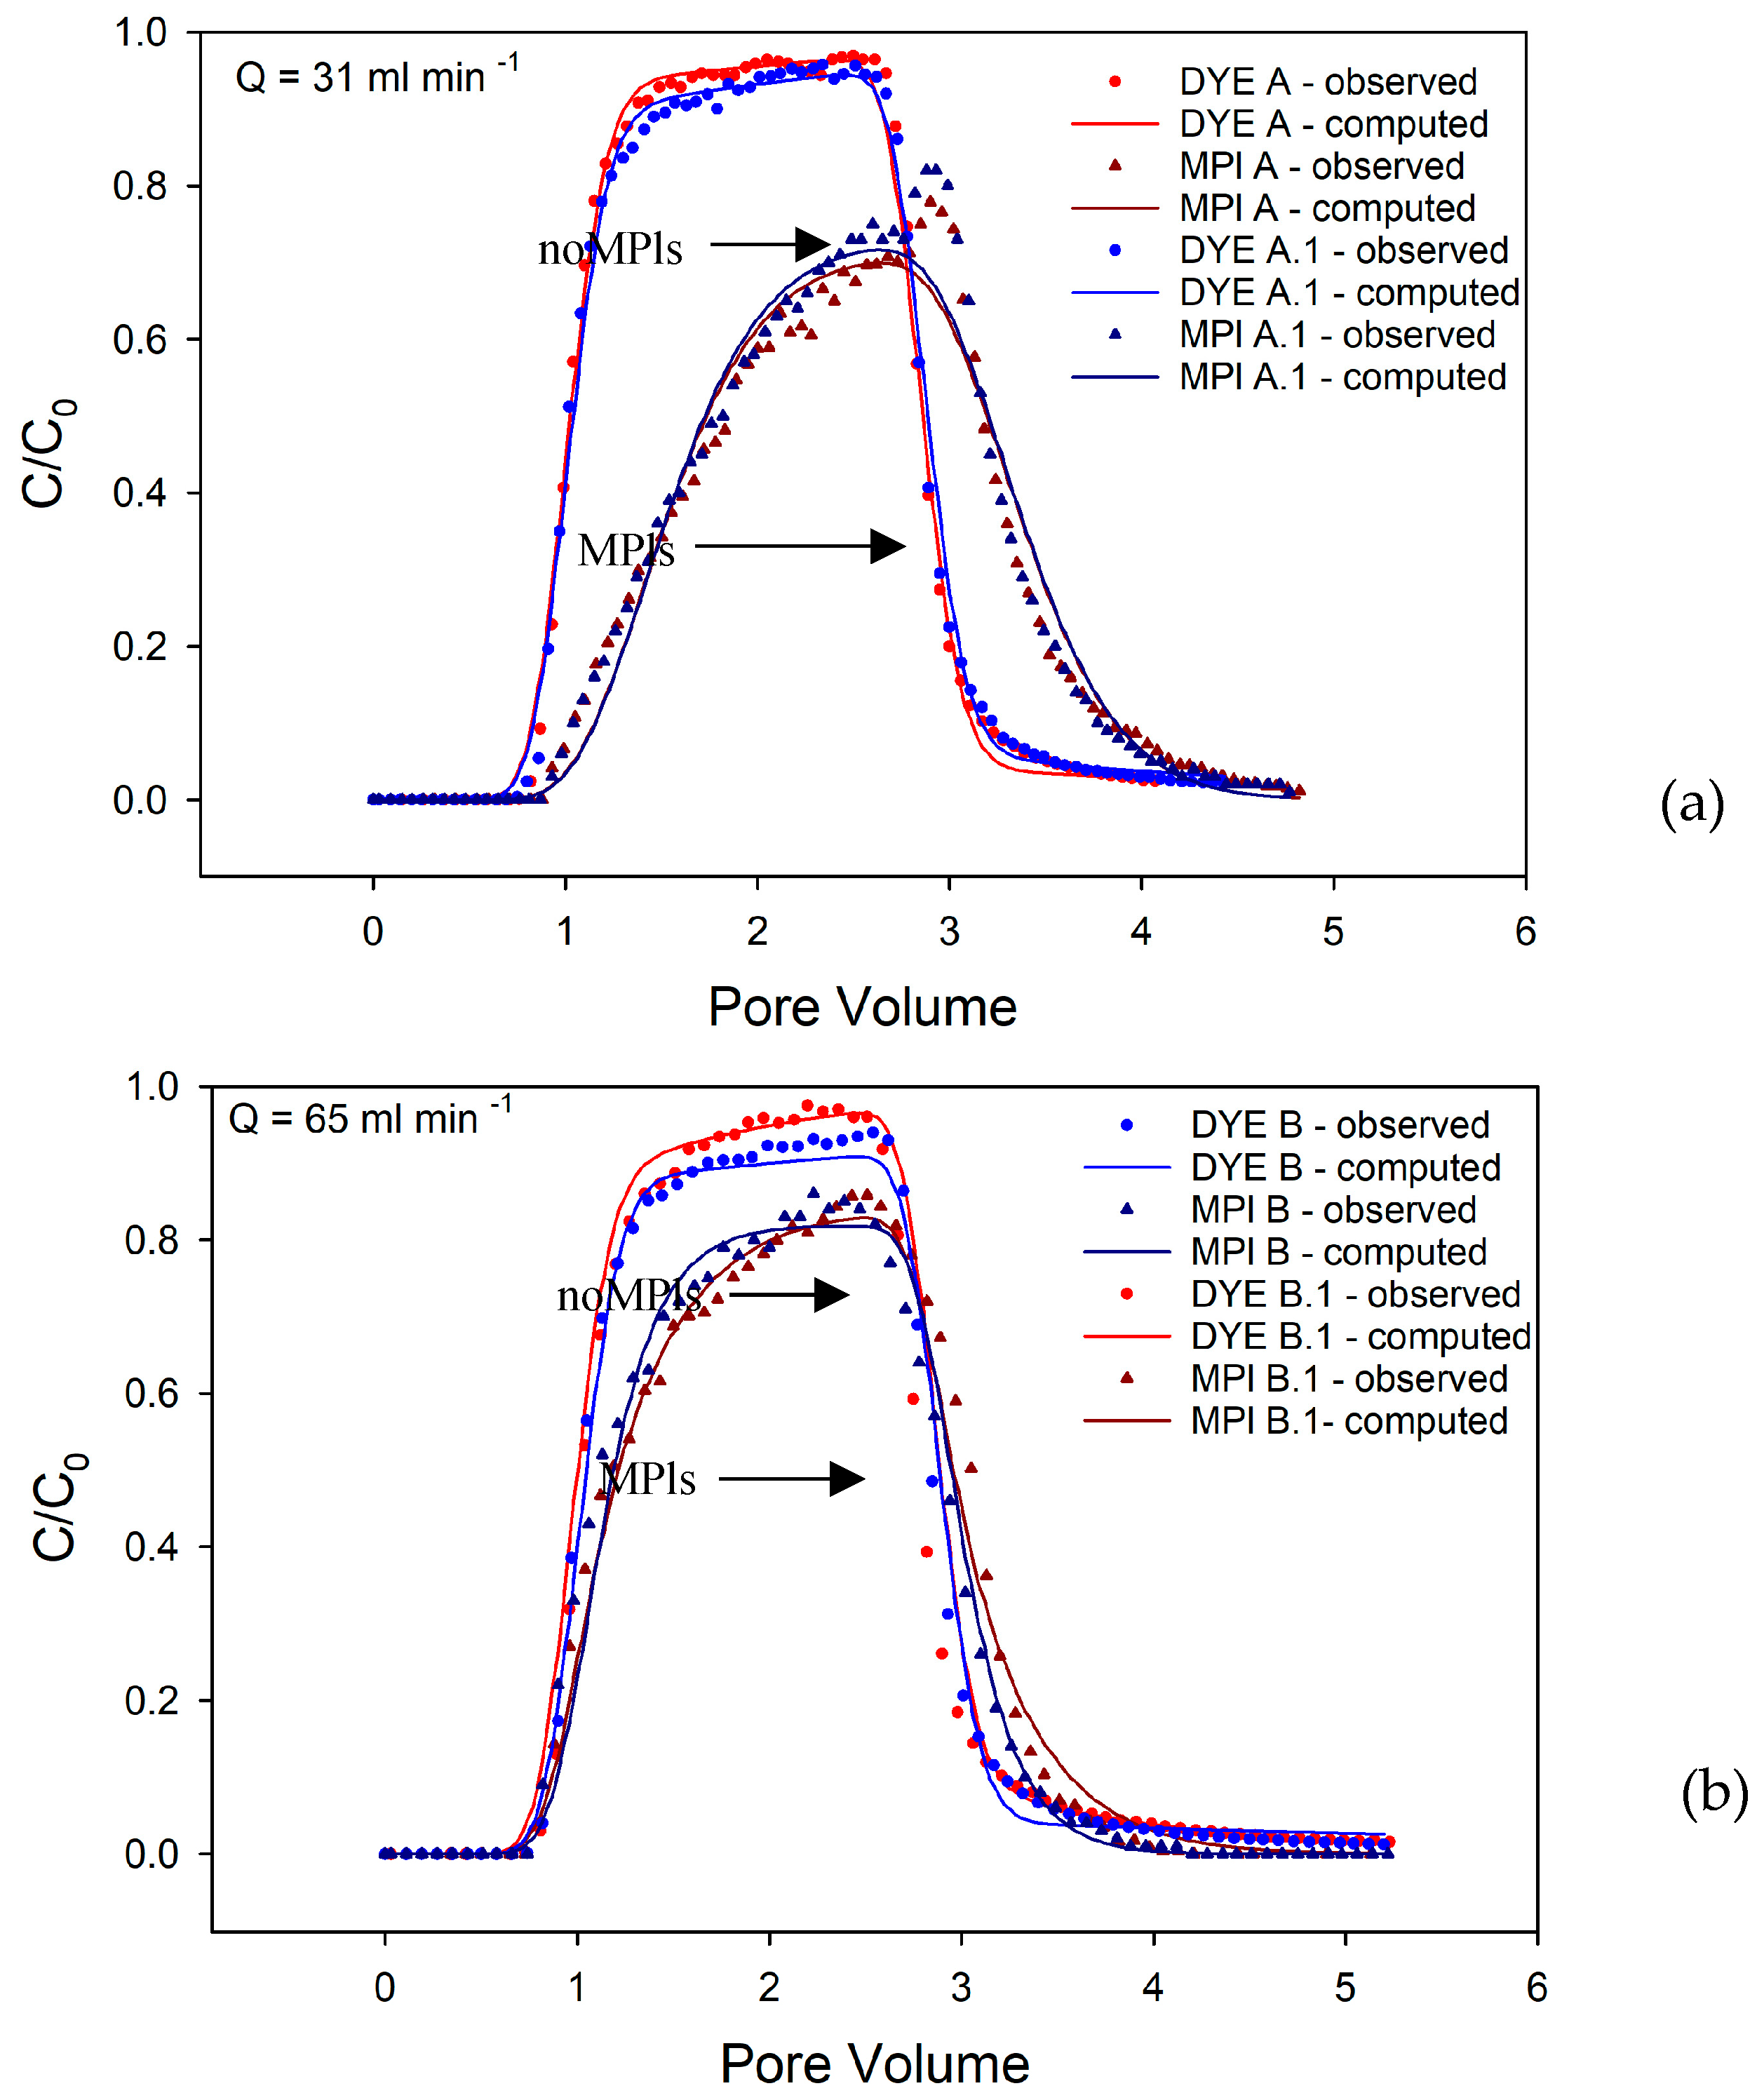
The observed and computed BTCs were shown for 31 ml min⁻¹ and 65 ml min⁻¹ in Figure 3 a and b, respectively. The values for α, θ, β, and Kd were obtained through modeling and adjusting the computed results to align with the observed outcomes of the dye tracer experiments, are presented in Table 3. Upon analysis of the average values, the dispersivity was determined to be consistent at 0.1 across all experiments, while the porosity value was calculated as 0.49 ± 0.009. Regarding sorption parameters, the Kd values were observed to be 0.08 ml g⁻¹ for a flow rate of 31 ml min⁻¹ and 0.125 ± 0.075 ml g⁻¹ for a flow rate of 60 ml min⁻¹. Additionally, for β values, a slight increase was noted with increasing flow rate, with values measured at 0.0009 ± 0.0001 min⁻¹ for a flow rate of 30 ml min⁻¹ and 0.0025 min⁻¹ for a flow rate of 65 ml min⁻¹.
Subsequently, α and θ were employed as constant input parameters for modeling the corresponding MPls experiments. Dye concentrations swiftly reach a relative concentration close to unity after the arrival of the solute. This concentration level was maintained until the conclusion of the solute concentration. When assessing the study conducted with MPls, there is an observable gradual increase in particle concentration. This gradual increase is more prominent at 31 ml min-1 flow rate (Figure 3).
The sorption which is expected between MPl particles and sand grains causes the suspension to appear later than expected at the column outlet. If the displacing of solute is held back within the column due to some chemical or physical process, the BTC will shift to the right [30]. The BTCs for MPls at 31 ml min-1 exhibit a shape more indicative of transport involving sorption reactions compared to the BTCs for 65 ml min-1 (Figure 3). Upon examining studies conducted at the relatively high flow rate, it is observed that the transport of MPls forms a curve closer to the reference transport of dye.
Sorption is characterized through the values of Kd, β and K1, as presented in Table 4. At the lower flow rate, the average Kd was computed as 0.2 ml g⁻¹, whereas at the higher flow rate, the average Kd was determined to be 0.07 ± 0.02 ml g⁻¹. A reduction in flow rate corresponded to an increase in the Kd value. The β values were observed to be 0.05 min⁻¹ for the lower flow rate and 0.02 min⁻¹ for the higher flow rate. The bulk density of sand was determined to be 1.33 g ml ⁻¹, and this value was utilized by the model for the calculation of β values. Increased flow rates were associated with a decrease in β values, indicative of altered mass transfer rates. The irreversible sorption of MPls into the column was referred to as K1. The calculated K1 value was 0.006 ± 0.0003 min-1 for the experiments conducted at a relatively slow flow rate of 31 ml min-1. The calculated K1 value was 0.007 ± 0.0004 min-1 for the experiments at a relatively fast flow rate of 65 ml min-1. The increase in the flow rate was followed by an increase in K1 values. (Table 4).

3.3. Retention Efficiencies

The retained mass within the porous media was determined through both numerical simulations (R1) and experimental measurements (R2). Analyzing the percentage of retained mass enabled the assessment of the retention efficiency of MPls within the utilized porous media, particularly in response to variations in flow rate. For a flow rate of 31 ml min⁻¹, the average retention rates are measured at 28 ± 1% for R1 and 24 ± 2% for R2, respectively. For a flow rate of 65 ml min⁻¹, the average retention rates are measured at 17 ± 1% for R1 and 9 ± 4% for R2, respectively. For a flow rate of 65 ml min⁻¹, the average retention rates are determined to be 17 ± 1% for R1 and 9 ± 4% for R2, respectively (Table 5). An observed trend indicates a decrease in retention efficiency with an increase in flow rate. The standard deviation of R2 is notably higher for the flow rate of 65 ml min⁻¹ may be attributed to non-homogenized effluent suspension. This could be explained by the higher flow rate leading to increased flow heterogeneity.
The Mean Absolute Error (MAE) is calculated as 6%, indicating that, on average, the model’s predicted retention rates (R1) differ by 6% from the experimentally measured retention rates (R2). This can give information on the accuracy of the numerical model simulation based on experimentally measured retention rates. It is important to acknowledge that sampling homogeneously from MPl effluent reservoirs is challenging, which may contribute to slight measurement errors that need to be accounted for while considering model accuracy.

3.4. Sensitivity Analyses

The impact sorption parameters can be uncovered through sensitivity analysis. The sensitivity analyses were conducted for 31 ml min-1 and 65 ml min-1 flow rate.
The variations in the Kd value have been modeled while keeping β fixed at 0.05 min-1 and K1 fixed at 0.006 min-1. In the context of nonequilibrium transport, the phenomena of sorption are contingent on time and occur gradually [31]. The increase in Kd has led to a more gradual sorption over an extended period and increased retardation. When Kd and K1 are held constant at values of 0.2 ml g-1 and 0.006 min-1, respectively, and the impact of β variation is examined, a decrease tends to approximate solute transport and leads to a reduction in peak concentration. Conversely, as the β values increase, the sorption process occurs more gradually (Figure 4b). Finally, to examine the impact of K1, the Kd, and β values were held constant at 0.17 ml g-1 and 0.06 min-1, respectively. The effect of K1 is proportional to the retained mass, with a decrease leading to an increase in the concentration peak value, and an increase resulting in a decrease. (Figure 4c). Since it is irreversible kinetic sorption rate, K1 directly influences the retained mass, with a decrease in K1 resulting in a decrease in retention efficiency (Table 6).
Upon evaluating the sensitivity of flow rates while keeping the sorption parameters (Kd, β, and K1) constant, the impact of flow rate changes on retention efficiencies was examined (Table 7).
As the flow rate decreases, there is an increase in the retention of MPls within porous media. This is attributed to the higher velocity associated with increased flow rates, leading to a stronger advection process. Consequently, when flow rates are higher, advection predominates over retention, resulting in lower retention rates. (Figure S4).

4. Conclusion

The study aimed to fill the knowledge gap regarding the transport of 16 ± 6 µm, polydisperse MPls in porous media under different flow rate conditions. The hydrophobic nature of polyethylene poses challenges for dispersing MPls in water. Surfactants proved instrumental in facilitating their dispersion in distilled water. Additionally, surfactants commonly found in natural environments are frequently employed in cleaning products.
Sorption kinetics were modeled with first-order reversible kinetic (non-equilibrium) sorption and first-order irreversible kinetic sorption models. The sensitivity analyses provided information about the effect of each sorption parameter. The retention rates of the sand filter were revealed in both numerical modeling and experimental measurements. The accuracy of the model was calculated with the error between modeled and observed retention efficiencies.
The study explored the impact of flow rate on sorption, examining the distribution coefficient (Kd), mass transfer coefficient (β), and irreversible sorption rate (K1). The BTCs for dye tracer experiments showed consistent behavior, while those for MPls exhibited gradual increases in particle concentration, particularly at lower flow rates, indicating sorption effects. Sorption parameters varied with flow rate, with lower flow rates associated with higher Kd and β values, suggesting increased sorption and altered mass transfer rates.
Increasing Kd led to more gradual sorption and increased retardation, while variations in β affected the pace of sorption and peak concentration. Changes in K1 influenced retained mass with lower K1 values associated with higher concentration peak values and decreased retention efficiency when the flow rate is constant. Another significant parameter affecting the retained mass in porous media is the flow rate. When keeping the sorption parameters constant, an increase in flow rate led to a decrease in retention efficiencies. That indicates advection becomes preponderant compared to retention.
Retention rates were assessed at different flow rates with numerical model (R1) and experimental measurement (R2). For a flow rate of 31 ml min⁻¹, the average retention rates are 28 ± 1% for R1 and 24 ± 2% for R2, respectively. At a flow rate of 65 ml min⁻¹, the average retention rates are 17 ± 1% for R1 and 9 ± 4% for R2. Similarly, for a flow rate of 65 ml min⁻¹, the average retention rates are found to be 17 ± 1% for R1 and 9 ± 4% for R2. The mean absolute error (MAE) of 6% was found and that indicates the model’s predicted retention rates differed slightly from experimental measurements.
The current study focuses on examining the retention efficiency of porous media during the transport of MPls with the presence of surfactant into saturated porous media. The utilization velocities [17], properties of porous media[16], size of particles, water chemistry [15,32] and co-existence with natural [33] or pollutant components [34] need to be considered for an efficient filtration process. In this study the flow rate and co-presence of MPls with surfactant were assessed. It is important to note that the quantities of surfactant and injected MPls do not precisely mirror natural conditions. Nonetheless, the study addresses existing gaps in understanding non-reference MPls, prompting further exploration into filtration efficiency and transport dynamics by integrating solute transport principles with kinetic attachment models.
Filters constructed using sand, as demonstrated in this study, provide insights into the effectiveness of sand filtration processes in drinking water treatment plants and the contamination of subsurface groundwater environments, both of which are vital sources of freshwater. Sand filtration is a common and conventional phase in drinking water treatment plants, and it is crucial to evaluate its efficiency in removing microplastics (MPls), which can be observed at all treatment stages [35]. Soil-groundwater interactions are the primary pathway for the migration of MPls into groundwater. These particles have various toxic effects on terrestrial ecological systems, including microorganisms, plants, and animals, impacting their growth and reproduction [36]. Additionally, humans may ingest microplastics in groundwater directly through drinking water or indirectly via the food chain, posing significant health risks [37]. For future perspective, the studies could consider modifying water properties to better emulate natural systems, such as introducing organic materials and various types of salt ions and reducing the concentration of injected MPls. These conditions can contribute to an improved understanding of freshwater source protection and aid in the development of strategies to safeguard these vital resources.

Supplementary Materials

The following supporting information can be downloaded at the website of this paper posted on Preprints.org, Table S8 Particle size classification of MPls (adapted from [1]). Figure S1: The calibration curves for dye experiments which were used for plotting BTCs. (a) is for DYE A, (b) is for DYE A.1, (c) is for DYE B and (d) is for DYE B.1 experiments; Figure S2: The calibration curves for MPl experiments which were used plotting curves. NTU is the unit of turbidity. (a) is for MPl A, (b) is for MPl A.1, (c) is for MPl B and (d) is for MPl B.1 experiments.; Figure S3 The BTCs of the sensitivity simulations for the distribution coefficient, Kd (a), mass transfer rate, β (b), and kinetic sorption rate, K1 (c), were analyzed. The computed BTCs of the MPl B and DYE B experiments are represented by a blue line and a red line, respectively. In the legend, the parameters are listed in the order of Kd, β, and K1. (This sensitivity analyses corresponds to MPl B experiments where 1 pore volume is equal to 1678 ml).; Figure S4: The BTCs of the sensitivity simulations for the flow rates were analyzed. The computed BTCs of the MPl B experiment are represented by a blue line. In the legend, the parameters are listed in the order of Kd, β, and K1. (This sensitivity analyses corresponds to MPl A experiments where 1 pore volume is equal to 1688 ml)

Author Contributions

Conceptualization, M.R. and P.L. ; methodology, H.O., Ç.S., P.L., and M.R.; software, H.O. and M.R.; validation, M.R., P.L. and B.K. ; formal analysis, H.O. and M.R.; investigation, H.O., Ç.S and H.B.Ö.; resources, P.L., and E.P.; data curation, H.O. ; writing—original draft preparation, H.O. ; writing—review and editing, H.O., Ç.S., B.K., H.B.Ö., E.P., M.R. and P.L..; visualization, H.O. ; supervision, B.K., M.R. and P.L.; project administration, P.L.; funding acquisition, B.K., M.R., P.L. All authors have read and agreed to the published version of the manuscript.

Funding

This research received no external funding

Data Availability Statement

Data will be made available upon request.

Acknowledgments

The authors would like to extend their sincere gratitude to the Esan Eczacıbaşı Industrial Raw Materials Co. (Türkiye) for their generous earth material support. Special thanks are also due to the Institute of Earth and Space Sciences at Eskisehir Technical University (Türkiye) for their technical assistance. Additionally, we express our appreciation to the laboratory team member of the Institute of Earth and Space Sciences, Mr. Fatih Öztürk, for his dedicated contributions to this work.

Conflicts of Interest

The authors declare no conflict of interest.

References

  1. ISO 24187 Principles for the analysis of microplastics present in the environment; 2023.
  2. Koutnik, V.S.; Leonard, J.; Alkidim, S.; DePrima, F.J.; Ravi, S.; Hoek, E.M.V.; Mohanty, S.K. Distribution of microplastics in soil and freshwater environments: Global analysis and framework for transport modeling. Environ. Pollut. 2021, 274, 116552. [Google Scholar] [CrossRef] [PubMed]
  3. Ivar Do Sul, J.A.; Costa, M.F. The present and future of microplastic pollution in the marine environment. Environ. Pollut. 2014, 185, 352–364. [Google Scholar] [CrossRef]
  4. Panno, S.V.; Kelly, W.R.; Scott, J.; Zheng, W.; McNeish, R.E.; Holm, N.; Hoellein, T.J.; Baranski, E.L. Microplastic Contamination in Karst Groundwater Systems. Groundwater 2019, 57, 189–196. [Google Scholar] [CrossRef] [PubMed]
  5. Samandra, S.; Johnston, J.M.; Jaeger, J.E.; Symons, B.; Xie, S.; Currell, M.; Ellis, A. V.; Clarke, B.O. Microplastic contamination of an unconfined groundwater aquifer in Victoria, Australia. Sci. Total Environ. 2022, 802, 149727. [Google Scholar] [CrossRef] [PubMed]
  6. Bharath, K.M.; Natesan, U.; R, V.; Kumar R, P.; R, R.; S, S. Spatial distribution of microplastic concentration around landfill sites and its potential risk on groundwater. Chemosphere 2021, 277, 130263. [Google Scholar] [CrossRef]
  7. Adin, A.; Baumann, E.R.; Cleasby, J.L. Application of Filtration Theory To Pilot-Plant Design. J Am Water Work. Assoc 1979, 71, 17–27. [Google Scholar] [CrossRef]
  8. Banihashem, S.; Karrabi, M. Investigation of suspended particle size effects on clogging of soil filters under laminar flow. Eur. J. Environ. Civ. Eng. 2022, 26, 2294–2303. [Google Scholar] [CrossRef]
  9. Simunek, J.; He, C.; Pang, L.; Bradford, S.A. Colloid-Facilitated Solute Transport in Variably Saturated Porous Media: Numerical Model and Experimental Verification. Vadose Zo. J. 2006, 5, 1035–1047. [Google Scholar] [CrossRef]
  10. Tufenkji, N.; Elimelech, M. Deviation from the Classical Colloid Filtration Theory in the Presence of Repulsive DLVO Interactions. Langmuir 2004, 10818–10828. [Google Scholar] [CrossRef]
  11. Compère, F.; Porel, G.; Delay, F. Transport and retention of clay particles in saturated porous media. Influence of ionic strength and pore velocity. J. Contam. Hydrol. 2001, 49, 1–21. [Google Scholar] [CrossRef]
  12. Fetter, C.W.; Boving, T.; Kreamer, D. Contaminant Hydrogeology (Third Edition); 2018; ISBN 0023371358.
  13. Li, M.; Zhang, M.; Rong, H.; Zhang, X.; He, L.; Han, P.; Tong, M. Transport and deposition of plastic particles in porous media during seawater intrusion and groundwater-seawater displacement processes. Sci. Total Environ. 2021, 781, 146752. [Google Scholar] [CrossRef]
  14. Zhao, P.; Cui, L.; Zhao, W.; Tian, Y.; Li, M.; Wang, Y.Y.; Chen, Z. Cotransport and deposition of colloidal polystyrene microplastic particles and tetracycline in porous media: The impact of ionic strength and cationic types. Sci. Total Environ. 2021, 753, 142064. [Google Scholar] [CrossRef] [PubMed]
  15. Dong, Z.; Qiu, Y.; Zhang, W.; Yang, Z.; Wei, L. Size-dependent transport and retention of micron-sized plastic spheres in natural sand saturated with seawater. Water Res. 2018, 143, 518–526. [Google Scholar] [CrossRef] [PubMed]
  16. Hou, J.; Xu, X.; Lan, L.; Miao, L.; Xu, Y.; You, G.; Liu, Z. Transport behavior of micro polyethylene particles in saturated quartz sand: Impacts of input concentration and physicochemical factors. Environ. Pollut. 2020, 263, 114499. [Google Scholar] [CrossRef] [PubMed]
  17. Okutan, H.M.; Sağir, Ç.; Fontaine, C.; Nauleau, B.; Kurtulus, B.; Le Coustumer, P.; Razack, M. One-Dimensional Experimental Investigation of Polyethylene Microplastic Transport in a Homogeneous Saturated Medium. Front. Environ. Sci. 2022, 10. [Google Scholar] [CrossRef]
  18. Qi, S.; Song, J.; Shentu, J.; Chen, Q.; Lin, K. Attachment and detachment of large microplastics in saturated porous media and its influencing factors. Chemosphere 2022, 305, 135322. [Google Scholar] [CrossRef] [PubMed]
  19. Jiang, Y.; Yin, X.; Xi, X.; Guan, D.; Sun, H.; Wang, N. Effect of surfactants on the transport of polyethylene and polypropylene microplastics in porous media. Water Res. 2021, 196, 117016. [Google Scholar] [CrossRef] [PubMed]
  20. Batu, V. Applied flow and solute transport modeling in aquifers: Fundamental principles and analytical and numerical methods; 2005; ISBN 9781420037470.
  21. Maurice, L.; Farrant, A.R.; Mathewson, E.; Atkinson, T. Karst hydrogeology of the Chalk and implications for groundwater protection. Geol. Soc. London, Spec. Publ. 2023, 517, 39–62. [Google Scholar] [CrossRef]
  22. Harter, T. Basic Concepts of Groundwater Hydrology. Basic Concepts Groundw. Hydrol. 2003, 1–6. [Google Scholar] [CrossRef]
  23. Shu, X.; Wu, Y.; Zhang, X.; Yu, F. Experiments and models for contaminant transport in unsaturated and saturated porous media–A review. Chem. Eng. Res. Des. 2023, 192, 606–621. [Google Scholar] [CrossRef]
  24. Zheng, C.; Wang, P.P. MT3DMS : A Modular Three-Dimensional Multispecies Transport Model for Simulation of Advection, Dispersion, and Chemical Reactions of Contaminants in Groundwater Systems ; Documentation and User ’ s Guide; 1999.
  25. Fetter, C.W. Contaminant Hydrogeology, 2nd ed.; Prentice Hall Inc.: New Jersey, USA, 1999. [Google Scholar]
  26. Lee, S.G.; Lee, S.; Choi, J.W. Nonlinear sorption of organic contaminant during two-dimensional transport in saturated sand. Water (Switzerland) 2021, 13, 1–16. [Google Scholar] [CrossRef]
  27. Matthies, M.; Witt, J.; Klasmeier, J. Determination of soil biodegradation half-lives from simulation testing under aerobic laboratory conditions: A kinetic model approach. Environ. Pollut. 2008, 156, 99–105. [Google Scholar] [CrossRef] [PubMed]
  28. Runkel, R.L. On the use of rhodamine WT for the characterization of stream hydrodynamics and transient storage. Water Resour. Res. 2015, 51, 6125–6142. [Google Scholar] [CrossRef]
  29. Sabatini, D.A.; Austin, T.A. Characteristics of Rhodamine WT and Fluorescein as Adsorbing Ground-Water Tracers. Groundwater 1991, 29, 341–349. [Google Scholar] [CrossRef]
  30. Nielsen, D.R.; Biggar, J.W. Miscible Displacement: III. Theoretical Considerations. Soil Sci. Soc. Am. J. 1962, 26, 216–221. [Google Scholar] [CrossRef]
  31. Skaggs, T.H.; Leij, F.J. 6.3 Solute Transport: Theoretical Background. In In Methods of Soil Analysis; Dane, J.H., Topp, C.G., Eds.; 2002; pp. 1353–1380.
  32. Dong, S.; Xia, J.; Sheng, L.; Wang, W.; Liu, H.; Gao, B. Transport characteristics of fragmental polyethylene glycol terephthalate (PET) microplastics in porous media under various chemical conditions. Chemosphere 2021, 276, 130214. [Google Scholar] [CrossRef] [PubMed]
  33. Li, M.; Zhang, X.; Yi, K.; He, L.; Han, P.; Tong, M. Transport and deposition of microplastic particles in saturated porous media: Co-effects of clay particles and natural organic matter. Environ. Pollut. 2021, 287, 117585. [Google Scholar] [CrossRef] [PubMed]
  34. Ling, X.; Yan, Z.; Liu, Y.; Lu, G. Transport of nanoparticles in porous media and its effects on the co- existing pollutants *. Environ. Pollut. 2021, 283, 117098. [Google Scholar] [CrossRef] [PubMed]
  35. Negrete Velasco, A.; Ramseier Gentile, S.; Zimmermann, S.; Stoll, S. Contamination and Removal Efficiency of Microplastics and Synthetic Fibres in a Conventional Drinking Water Treatment Plant. Front. Water 2022, 4. [Google Scholar] [CrossRef]
  36. Shi, W.; Wu, N.; Zhang, Z.; Liu, Y.; Chen, J.; Li, J. A global review on the abundance and threats of microplastics in soils to terrestrial ecosystem and human health. Sci. Total Environ. 2024, 912, 169469. [Google Scholar] [CrossRef]
  37. Wei, Y.; Chen, Y. The Urgent Need to Investigate Microplastic Contamination in Groundwater: Soil and Groundwater Interactions as Key Drivers. ACS ES T Water 2023, 3, 3736–3740. [Google Scholar] [CrossRef]
Figure 1. The histogram of the size distribution (a) and the optical microscopy image (b) of MPls.
Preprints 100083 g001
Figure 2. The grain size distribution curve of sand.
Preprints 100083 g002
Figure 3. The breakthrough curves observed and computed data for low (a) and high (b) flow rates. In each plot, the y-axis is denoted as C/C0, while the x-axis corresponds to pore volume.
Preprints 100083 g003
Figure 4. The BTCs of the sensitivity simulations for the distribution coefficient, Kd (a), mass transfer rate, β (b), and kinetic sorption rate, K1 (c), were analyzed. The computed BTCs of the MPl A and DYE A experiments are represented by a blue line and a red line, respectively. In the legend, the parameters are listed in the order of Kd, β, and K1. (This sensitivity analyses corresponds to MPl A experiments where 1 pore volume is equal to 1688 ml).
Preprints 100083 g004
Table 1. The statistical properties of MPls size distribution (All the values are given in µm).
Size of Population Max Min Median Mean Standard Deviation Quantile 1 Quantile 3
400 77 2 16 16 6 13 19
Table 2. Hydraulic conductivity (K) values corresponding to each experimental series. (For the A series, tracer experiments were conducted at a flow rate of 31 ml min⁻¹, while for the B series, tracer experiments were conducted at a flow rate of 65 ml min⁻¹.).
Experiment Name K (cm min-1)
A 11.3 ± 0.4
A.1 10.7 ± 0.1
B 10.9 ± 0.1
B.1 11.3 ± 0.3
Table 3. The dye experiment results for porosity (θ), dispersivity (α), distribution coefficient (Kd), and mass transfer rate (β) values.
Experiment Name Q (ml min 1) θ (%) α(cm) Kd (cm3g-1) β (min-1)
DYE A 31 0.49 0.1 0.08 0.0008
DYE A.1 30 0.49 0.1 0.08 0.0010
DYE B 65 0.49 0.1 0.20 0.0025
DYE B.1 64 0.47 0.1 0.05 0.0025
Table 4. The computed parameters for distribution coefficient (Kd), , and mass transfer rate (β) , and irreversible kinetic sorption rate (K1) were determined for each flow rate, with the C/C0 peak representing the ratio of MPls concentration at the peak point.
Experiment Name Q (ml min-1) Kd (ml g-1) β (min-1) K1 (min-1) C/C0 peak
MPl A 31 0.2 0.05 0.006 0.78
MPl A.1 31 0.2 0.05 0.006 0.82
MPl B 65 0.05 0.02 0.008 0.86
MPl B.1 64 0.09 0.02 0.007 0.86
Table 5. The numerically calculated retention rates for each experiment, varying according to the flow rate, are shown as R1, while the experimentally measured retention rates are indicated as R2.
Q (ml min-1) R1 (%) R2 (%)
MPl A 31 29 26
MPl A.1 31 27 22
MPl B 65 18 13
MPl B.1 64 16 5
Table 6. The retention efficiency values calculated numerical solution due to change in irreversible kinetic sorption rate (K1).
Q (ml min-1) Kd (ml g-1) β (min-1) K1 (min-1) Retention Efficiency (%)
31 0.2 0.05 0.006 29
31 0.2 0.05 0.03 81
31 0.2 0.05 0.001 7
65 0.25 0.02 0.01 18
65 0.05 0.02 0.04 63
65 0.05 0.02 0.002 4
Table 7. The retention efficiency values calculated numerical solution due to change in flow rates, Q, with constant sorption parameters which are distribution coefficient (Kd), and mass transfer rate (β), and irreversible kinetic sorption rate (K1). The sorption parameters of experiment MPl A, conducted at a flow rate of 31 ml min⁻¹, remained constant.
Kd (cm3/g) β (min-1) K1 (min-1) Q (ml min-1) Retention Efficiency (%)
0.2 0.05 0.006 155 7
0.2 0.05 0.006 65 15
0.2 0.05 0.006 31 29
0.2 0.05 0.006 6 82
Disclaimer/Publisher’s Note: The statements, opinions and data contained in all publications are solely those of the individual author(s) and contributor(s) and not of MDPI and/or the editor(s). MDPI and/or the editor(s) disclaim responsibility for any injury to people or property resulting from any ideas, methods, instructions or products referred to in the content.
Copyright: This open access article is published under a Creative Commons CC BY 4.0 license, which permit the free download, distribution, and reuse, provided that the author and preprint are cited in any reuse.
Prerpints.org logo

Preprints.org is a free preprint server supported by MDPI in Basel, Switzerland.

Subscribe

© 2024 MDPI (Basel, Switzerland) unless otherwise stated