Preprint
Article

Robustness of Real-World Networks after Weight Thresholding by Strong Link Removal

Altmetrics

Downloads

83

Views

29

Comments

0

Submitted:

28 February 2024

Posted:

29 February 2024

You are already at the latest version

Alerts
Abstract
Weight thresholding (WT) is a method intended to decrease the number of links within weighted networks that may otherwise be excessively dense for network science applications. WT aims to remove links to simplify the networks by holding most of the features of the original network. Here, we test the robustness and the efficacy of the node attack strategies on real-world networks subjected to WT that remove links of higher weight (strong links). We measure the network robustness along node removal with the largest connected component (LCC). We find that the real-world networks under study are generally stable in terms of robustness when subjected to WT. Nonetheless, WT by strong link removal changes the efficacy of the attack strategies and the rank of node centralities. Also, WT by strong link removal may trigger a greater change in node centrality rank than WT by removing weak links. Network science research finding important/influential nodes in the network has to consider that simplifying the network with WT methodologies may change the node centrality.
Keywords: 
Subject: Physical Sciences  -   Other

1. Introduction

Weight thresholding is a simple technique that aims to reduce the number of edges in weighted networks that are otherwise too dense for applying standard graph-theoretical methods [1]. WT is a methodology in sparsification approaches to reduce link density in different real-world networks [2]. WT has many real-world applications, such as sparsifying ecological, financial, brain, and biological networks [3,4,5]. The principal aim of WT is to remove links to simplify the networks and make them easier to analyze. So, the WT policy should guarantee that the significant traits of the original network are retained intact. In short, the objective of the WT procedure is to prune the highest number of links, avoiding drastic alteration in the critical structure of the original real-world network. Unfortunately, many conventional network properties quickly change under the WT procedure [1,6].
WT finds applications in research focusing on neural networks (NNs) or other machine learning models. In essence, WT involves applying a threshold to the weights of links in a NN. Links with weights below the threshold are considered less significant and can be eliminated or considered inactive. This process reduces the overall number of connections in the model, making it simpler and often more computationally efficient [7,8].
A recent study has investigated how weight thresholding procedures, which remove the weak links (links of lower weight), affect the robustness of the real-world networks to node attacks and the rank of node centrality [2]. And the results found that the real world networks hold robust connectivity structure to node attack with WT.
Here, we test whether WT by strong link removal changes the efficacy of the node attack strategies and how it affects the robustness of a set of real-world networks. To do this, we perform a sparsification procedure by removing a fixed fraction of higher-weight links. After sparsification, we execute a network attack by removing nodes using different node centrality indicators, as from the literature. Generally, the real-world networks under study show robust connectivity against the WT procedure. Differently, the WT procedure removing strong links induces a more significant change in the ranking of nodes than the weak WT procedure.

2. Methods

2.1. Real-World Networks

We implemented five different node attack strategies on nine real-world weighted networks from different domains. The statistics of these real-world networks, with node, link, and link weight meaning, are summarized in Table 1.

2.2. Attack strategies

We simulated network attacks by removing the nodes based on their centrality measures. The node centrality measures considered here account for the binary as well as the weighted structure of the networks. The node attack strategies are:
  • Random (Ran): Randomly selected nodes are removed. Selecting nodes at random is analogous to simulating errors or failures occurring in the network [22,23].
  • Degree (Deg): Nodes having the highest degree (hubs) are removed first [22,24,25,26,27]. The degree of a node is the number of links connected to it. The degree k i of node i is given by
    k i = j = 1 N a i j ,
    where a i j = 1 indicates the presence of a link between nodes i and j and is 0 otherwise. N is the number of nodes in the network.
  • Strength (Str): A node’s strength is the sum of the weights of the links connected to that node. It is a weighted version of the degree centrality [28], and it is also called weighted degree.
    Mathematically, the strength   s i of node i is:
      s i =   j = 1 N a i j   .   w i j ,
    where a i j = 1 indicates the presence of a link between nodes i and j and is 0 otherwise. w i j is the weight of the link between i and j. In this attack strategy, nodes with the highest strength are removed first.
  • Betweenness (Bet): Betweenness of a node is the number of shortest paths (between all the pairs of nodes) passing through it [24,25,26]. This binary metric defines the shortest path between two nodes as the minimum number of links needed to travel from one node to another. Mathematically, the betweenness b i   of node i is:
    b i = s , t = 1 N σ s t i σ s t
    where σ s t i is the number of shortest paths between nodes s and t passing through the node i.   σ s t is the total number of shortest paths between nodes s and t. Based on this global metric, this attack strategy first removes nodes with the highest betweenness.
  • Weighted Betweenness (WBet): Weighted betweenness of a node is defined as the number of weighted shortest paths passing through that node [29].
    Weighted Betweenness b i w of node i is:
    b i w = s , t = 1 N σ s t   w i σ s t   w   ,
    where σ s t   w i   is the number of weighted shortest paths between nodes s and t passing through the node i.   σ s t   w is the total number of weighted shortest paths between nodes s and t.
While computing betweenness, it is essential to differentiate whether the link weight corresponds to “flows” or “costs” [30]. If link weight means flow, such as the number of passengers in transportation networks or the number of common papers in authorship networks, then the shortest path is computed by summing the inverse of link weights. If link weights are costs such as distance or time of information delivery between two stations, shortest paths are computed directly by summing the link weights.
These attacks are performed by removing nodes and the links incident on them by targeting the nodes according to the decreasing order of their centrality values (Deg, Str, Bet, WBet). First, target the node with the highest centrality and continue the attack on lesser centrality nodes until the network collapses. Attacking the nodes based on their pre-calculated rank is known as an initial (not recalculated) or simultaneous attack strategy [24]. However, the network structure may change after each attack, and the nodes' importance may also change. In such a scenario, the pre-calculated ranking of nodes may no longer be valid. Here, we can recalculate the node centrality values and update the node’s rank after each attack [24]. This attack strategy is known as a recalculated (also named adaptive) attack strategy. In the case of ties (i.e., nodes with equal centrality value), we randomly select the node to remove. These node ties are randomized by averaging the outcomes over 100 simulations.

2.3. Weight thresholding

We investigate the effect of strong link removal on the robustness of real-world networks under various node attack strategies. This analysis is done by performing the weight thresholding (WT) procedure by removing links having higher weights. Given a weighted network G with N number of nodes and L number of links, the first step is to rank the links in decreasing order of their weight. Then, we performed the WT by removing a fraction of the strong links (links of higher weight). For example, for WT=0.05, we remove the first 5% stronger links in the order of rank. Consider a network having ten links of the following discrete weights: 1, 1, 2, 2, 4, 6, 7, 8, 8, and 9. Then, by WT= 0.5, we shall remove the links of weights 9, 8, 8, 7, and 6 in that order.
In our study, we take nineteen discrete threshold values WT = {0.0, 0.05, 0.1, 0.15, 0.2, 0.25, 0.3, 0.35, 0.4, 0.45, 0.5, 0.55, 0.6, 0.65, 0.7, 0.75, 0.8, 0.85, 0.9}, (i.e., from 0% to 90% of strong links removal). In the case of ties (links having the same weight), we selected the links randomly. These ties are randomized by averaging the outcomes over 100 simulations. The thresholded network G' will be the subgraph of G with the same number of nodes N and number of links, L’= (1 – WT) L. Then apply node attack strategies on G' by identifying the nodes in the decreasing order of their centrality measures (Deg, Bet, Str, and WBet) computed from G'. This procedure is repeated for each WT. The overall methodology is depicted in Algorithm 1. The variables m and n in Algorithm 1 represent the number of iterations to break the link and node ties.
Algorithm 1: Methodology of WT analysis.
Procedure Weight Thresholding (G, N, L)
1: WT = {0.0, 0.05, 0.1,…………., 0.85, 0.9}
2: for each WT
3:   for i =1 to m
4:     link_set= {links in the decreasing order of their weight}
5:     strong_linkset = {WT fraction of strong links from link_set}
6:     G’= G - strong_linkset
7:      Initial attack (G’, N, L’)
8:      Recalculated attack (G’, N, L’)
Procedure Initial attack (G’, N, L’)
1: Find Initial LCC
2: for i =1 to n
3:   node_set = { nodes of G’ in the decreasing order of centrality measure }
4:   while (LCC !=1)
5:     Remove a node x from the G’ (in the order of node_set)
6:     Find LCC of new network
7:     node_set = node_set - x
Procedure Recalculated attack (G’, N, L’)
1: Find Initial LCC
2: for i=1 to n
3:   while (LCC !=1)
4:     Calculate centrality meaures
5:     node_set = { nodes of G in the decreasing order of centrality measure }
6:     Remove a node x from the G (in the order of node_set)
7:      Find LCC of new network
8:      node_set = node_set - x

2.4. Network robustness indicator

The largest Connected Component (LCC) is the simplest binary measure of the network's functioning along node removal. It is defined as the highest number of connected nodes in the network [22,23,27]. Here, normalized LCC against the fraction (q) of nodes removed is used to measure network damage. The normalization is done in two ways.
1)
One way is to normalize the LCC after node removal by the initial LCC value (before node attack) of the network after WT. In this case, we are considering each thresholded network as an independent network, and we do not account for the LCC decrease directly caused by the WT procedure.
2)
A second way is to normalize the LCC after node removal by the initial LCC at WT=0, i.e., we normalize using the LCC of the original network. In this second case, we consider the LCC decrease triggered by the link removal of the WT procedure. This normalization is intended to analyze the joint effect of the weight thresholding and node attack to directly decrease the LCC. This is the total LCC decrease.
For ease of comparison, the response of networks to each attack strategy is represented by a single number called robustness (R). It is defined as the area under the curve of network functioning measure (here, LCC) against the fraction (q) of nodes removed. From now on, we refer to 'robustness' as the R measure computed with the first LCC normalization and ‘total robustness’ (Rtot) as the measure computed with the second LCC normalization. Table 2 lists the abbreviations used in this manuscript.

3. Results and Discussion

3.1. Robustness against WT

We investigate the role of strong links on the robustness of networks to node attack strategies. The WT removes a fixed fraction of strong links, and then we perform the node attack strategies on each thresholded network. These strategies are performed using initial and recalculated node attack methods.
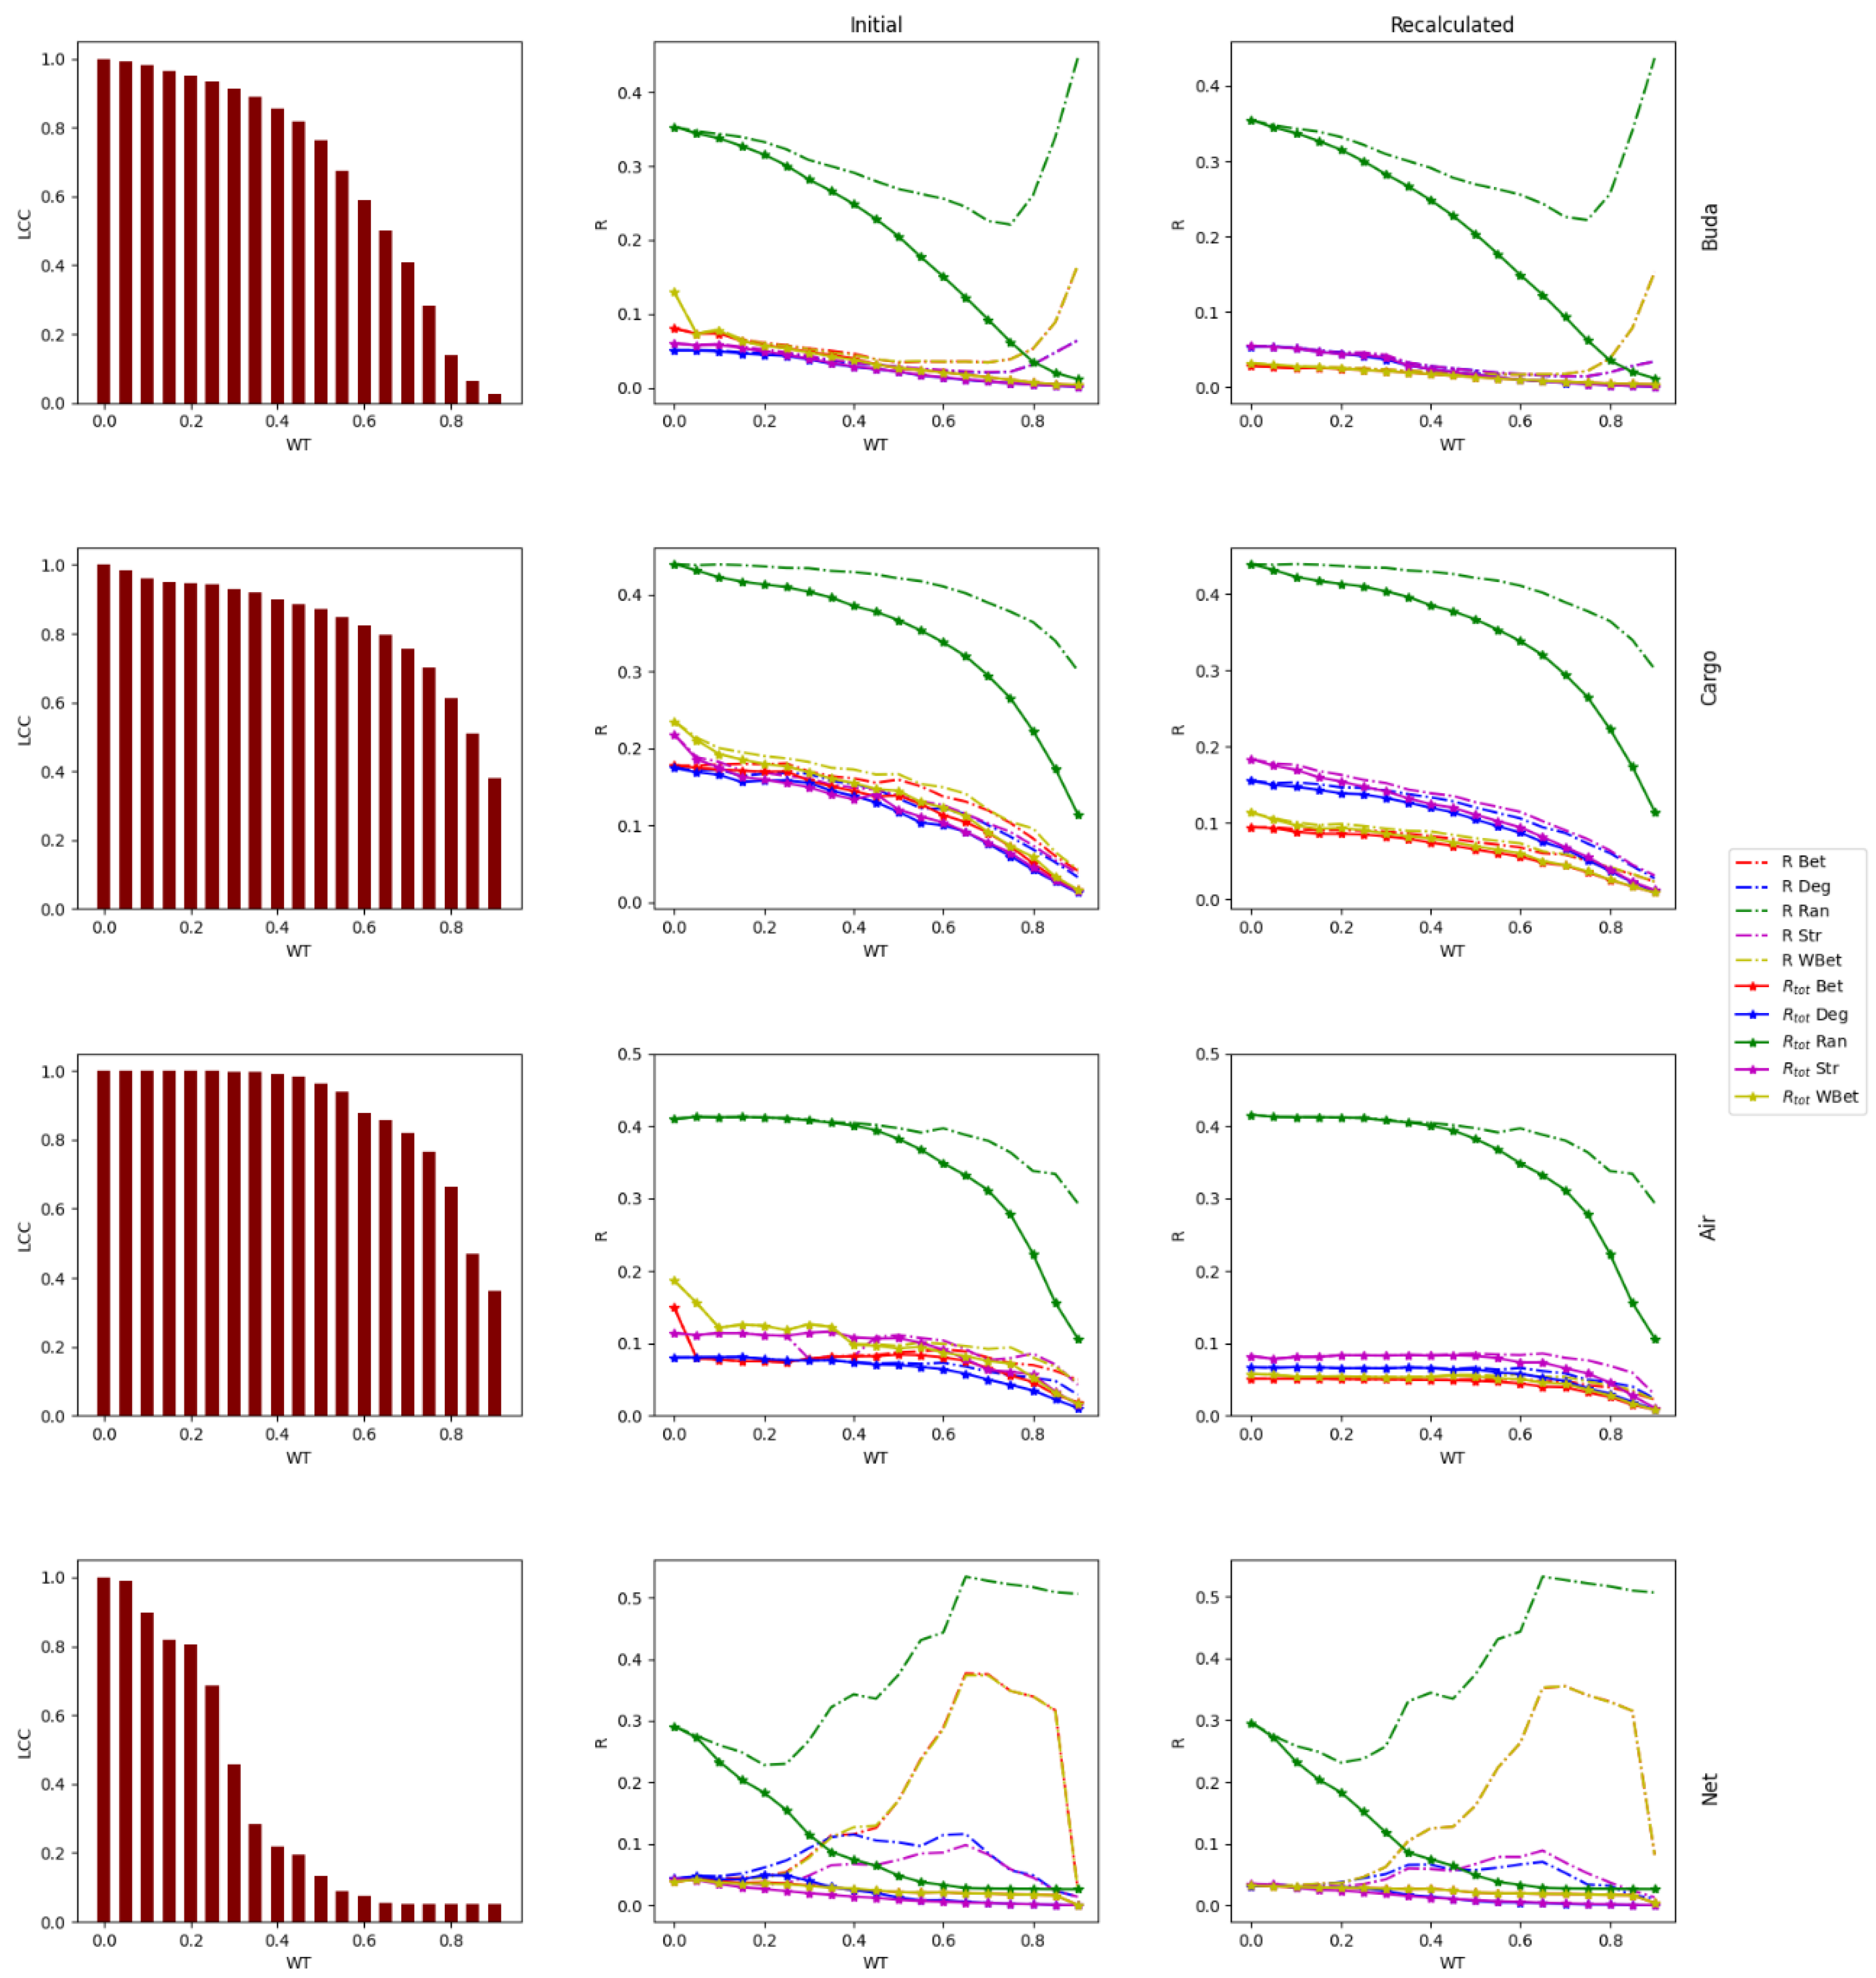
Figure 1 and Figure 2 show the LCC and the robustness R as a function of WT for different real-world networks. First, we analyze the LCC decrease induced by the WT procedure. The bar plots in the first column of Figure 1 and Figure 2 depict this LCC decrease. The networks C. Elegans, Caribbean, Human12a, and US Airports show the slowest LCC decrease when subjected to the WT procedure. The WT procedure corresponds to the classic strong link removal [31]. Specifically, C. Elegans and the Caribbean keeps 80% of LCC even up to 75% removal of strong link removal (WT = 0.75) and Human12a keeps 85% LCC for 80% removal of strong links (WT ≤ 0.85). The smallest network in our study, Cypdry (N = 66), and the air transportation network, US Airport, also maintain comparable LCC up to WT = 0.7.
The other networks, such as E. Coli, Budapest, Cargoship, and Netscience present a lower robustness against WT procedure, showing a faster LCC decrease than other networks.
Budapest and Netscience networks show a faster LCC disruption under the WT procedure. Removing strong links accelerates the fragmentation of science co-authorship networks (Netscience). In this network, dense local neighborhoods of scientists are primarily composed of weak links. In contrast, the strong links represent more significant and enduring connections among leading scholars, bridging distant research communities and thus playing a crucial role in overall network connectivity [32].
In summary, the real-world networks under study are robust to the strong WT procedure regarding LCC. For this reason, the real-world networks under study unveil general robustness to strong link removal [31].

3.2. Robustness to WT and node attack

We investigate the network robustness against the coupled effect of the WT and node attack strategies in two ways.
First, we normalize the LCC along node removal with the initial LCC of the network subjected to WT. This normalization does not consider the LCC decrease triggered by the WT link removal. This normalization evaluates the network after WT as an independent system and accounts only for the LCC decrease caused by the node attack. The trends of the robustness R with this normalization procedure for the node attack strategies, Ran, Deg, Str, Bet, and WBet are represented in Figure 1 and Figure 2.
Another way is to compute the relative robustness normalizing the LCC over the original LCC size, i.e., before WT and node attack. In this manner, we can understand the decrease in network functioning by the joint effect of WT and node attack (i.e., total robustness Rtot). The Rtot for the node attack strategies, Ran, Deg, Str, Bet, and WBet is represented in Figure 1 and Figure 2.
We find a gradual change of R along the WT in both initial and recalculated strategies for most of the networks. The C. Elegans network almost keeps a steady robustness to all the attack strategies up to WT=0.75. After removing 75% of the strong links, we can see a drop in the robustness of the network. The C. Elegans network, with the remaining 25% weak links, is highly vulnerable to all the attack strategies. The networks Caribbean, Human12a, E. Coli, Cargoship, and US airport show gradual change in robustness after each thresholding even up to WT=0.90. Instead of a smooth change in R, the network Cypdry shows some spikes in R, especially towards the Bet (red) and Str (purple) attack strategies.
The total robustness Rtot (solid lines) follows a similar pattern of robustness decrease for all the attack strategies except Ran (see green dotted and solid lines). In networks such as C. Elegans, Human12a, and E. Coli, the joint effect of thresholding and node attack (Rtot) returns roughly the same robustness computed with the first normalization procedure (R). In all other networks, we can observe only a small difference in the values of these two types of robustness when focusing on targeted attacks. Differently, the robustness of the networks against random removal is always lower when considering the joint effect of WT and random node attack. The solid green lines describing the Rtot decrease with increasing WT in Figure 1 and Figure 2 are significantly lower than the dotted green lines (R).
The principal aim of WT is to remove links to simplify the networks, making them easier to analyze and reducing the simulation time. Previous analyses showed that many standard network features quickly change under the WT procedure [1,6]. Here, we test whether WT by strong link removal changes the robustness of real-world networks when subjected to node attack. Taking together these results leads to the point that the real-world networks analyzed here hold comparable robust connectivity using both the two normalization procedures of the LCC.
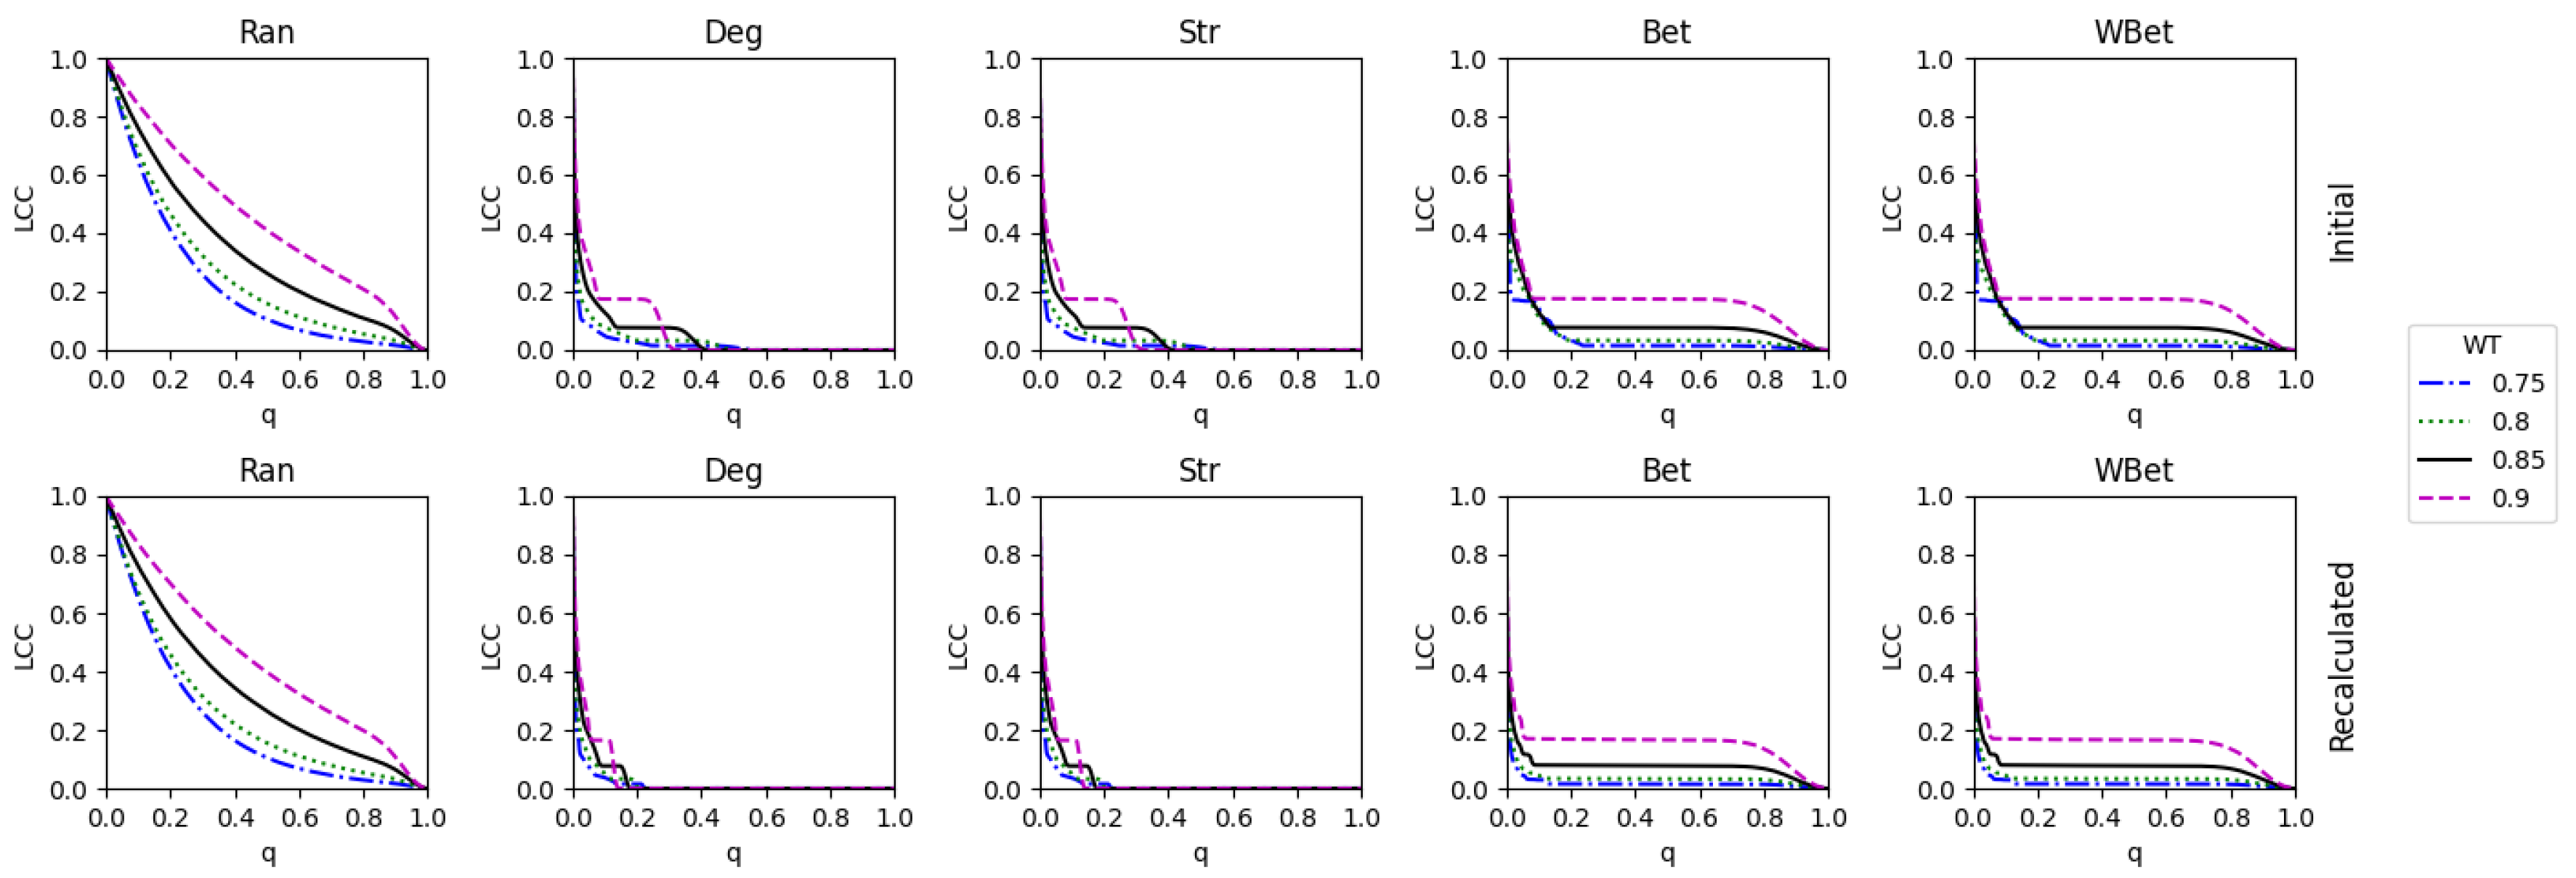
There are some exceptions in Budapest and Netscience networks when we consider the normalization by initial LCC of the network subjected to WT. The Budapest network shows a higher robustness structure towards the end of thresholding (WT>0.7) (See Figure 2). Figure 3 shows the LCC as a function of the fraction of nodes removed q for Ran, Deg, Str, Bet, and WBet attacks in the Budapest network for WT values 0.75, 0.8, 0.85, and 0.9. It clearly shows that higher WT value returns slower LCC decrease.
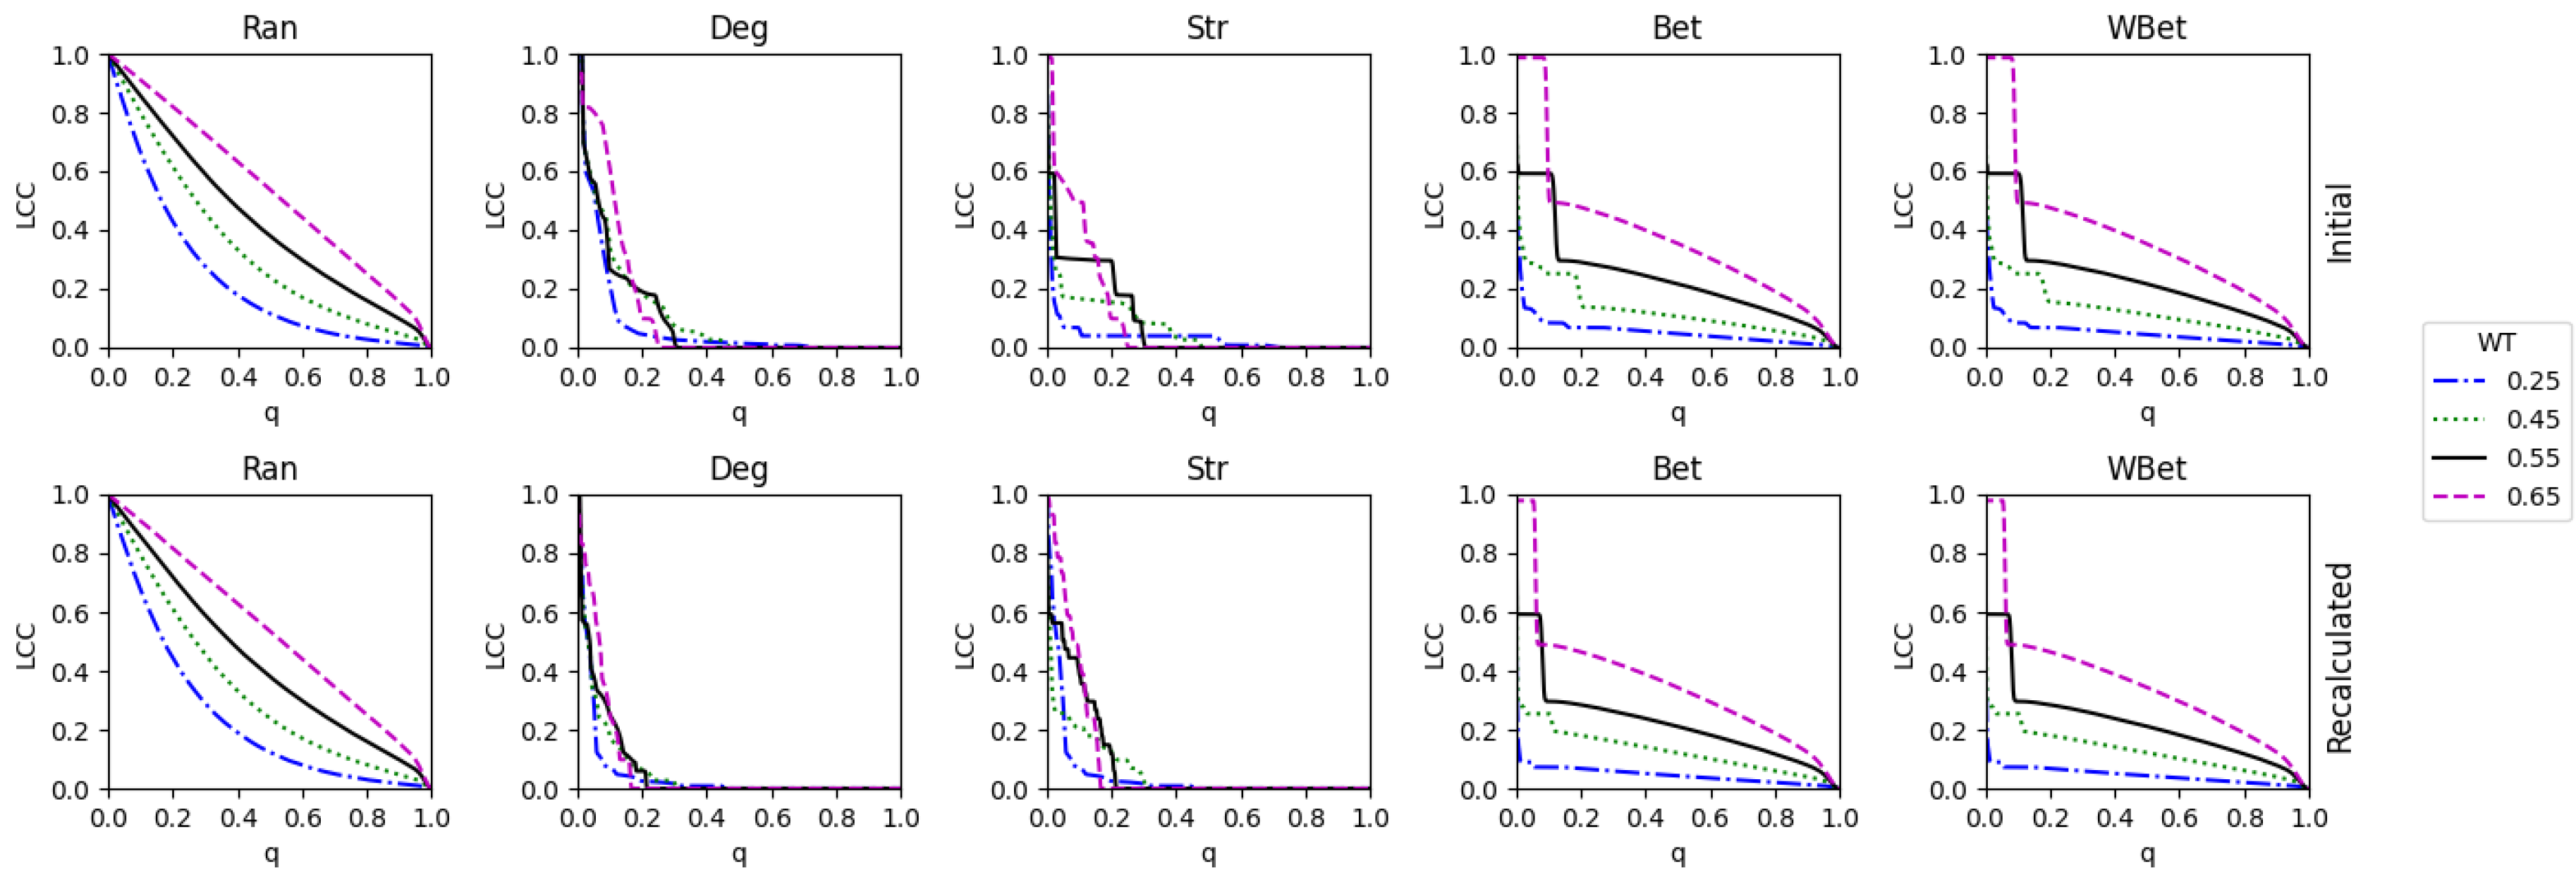
In Figure 2, the Netscience also shows a higher robustness structure for some thresholding (WT>0.2). The effect is also visible in Figure 4. This interesting and counterintuitive result reveals that the network structures after WT may show a more robust LCC connectivity structure to node removal. In other terms, the strong link removal performed by applying WT can make stronger networks against node attack.

3.3. The efficacy of the node attack strategies

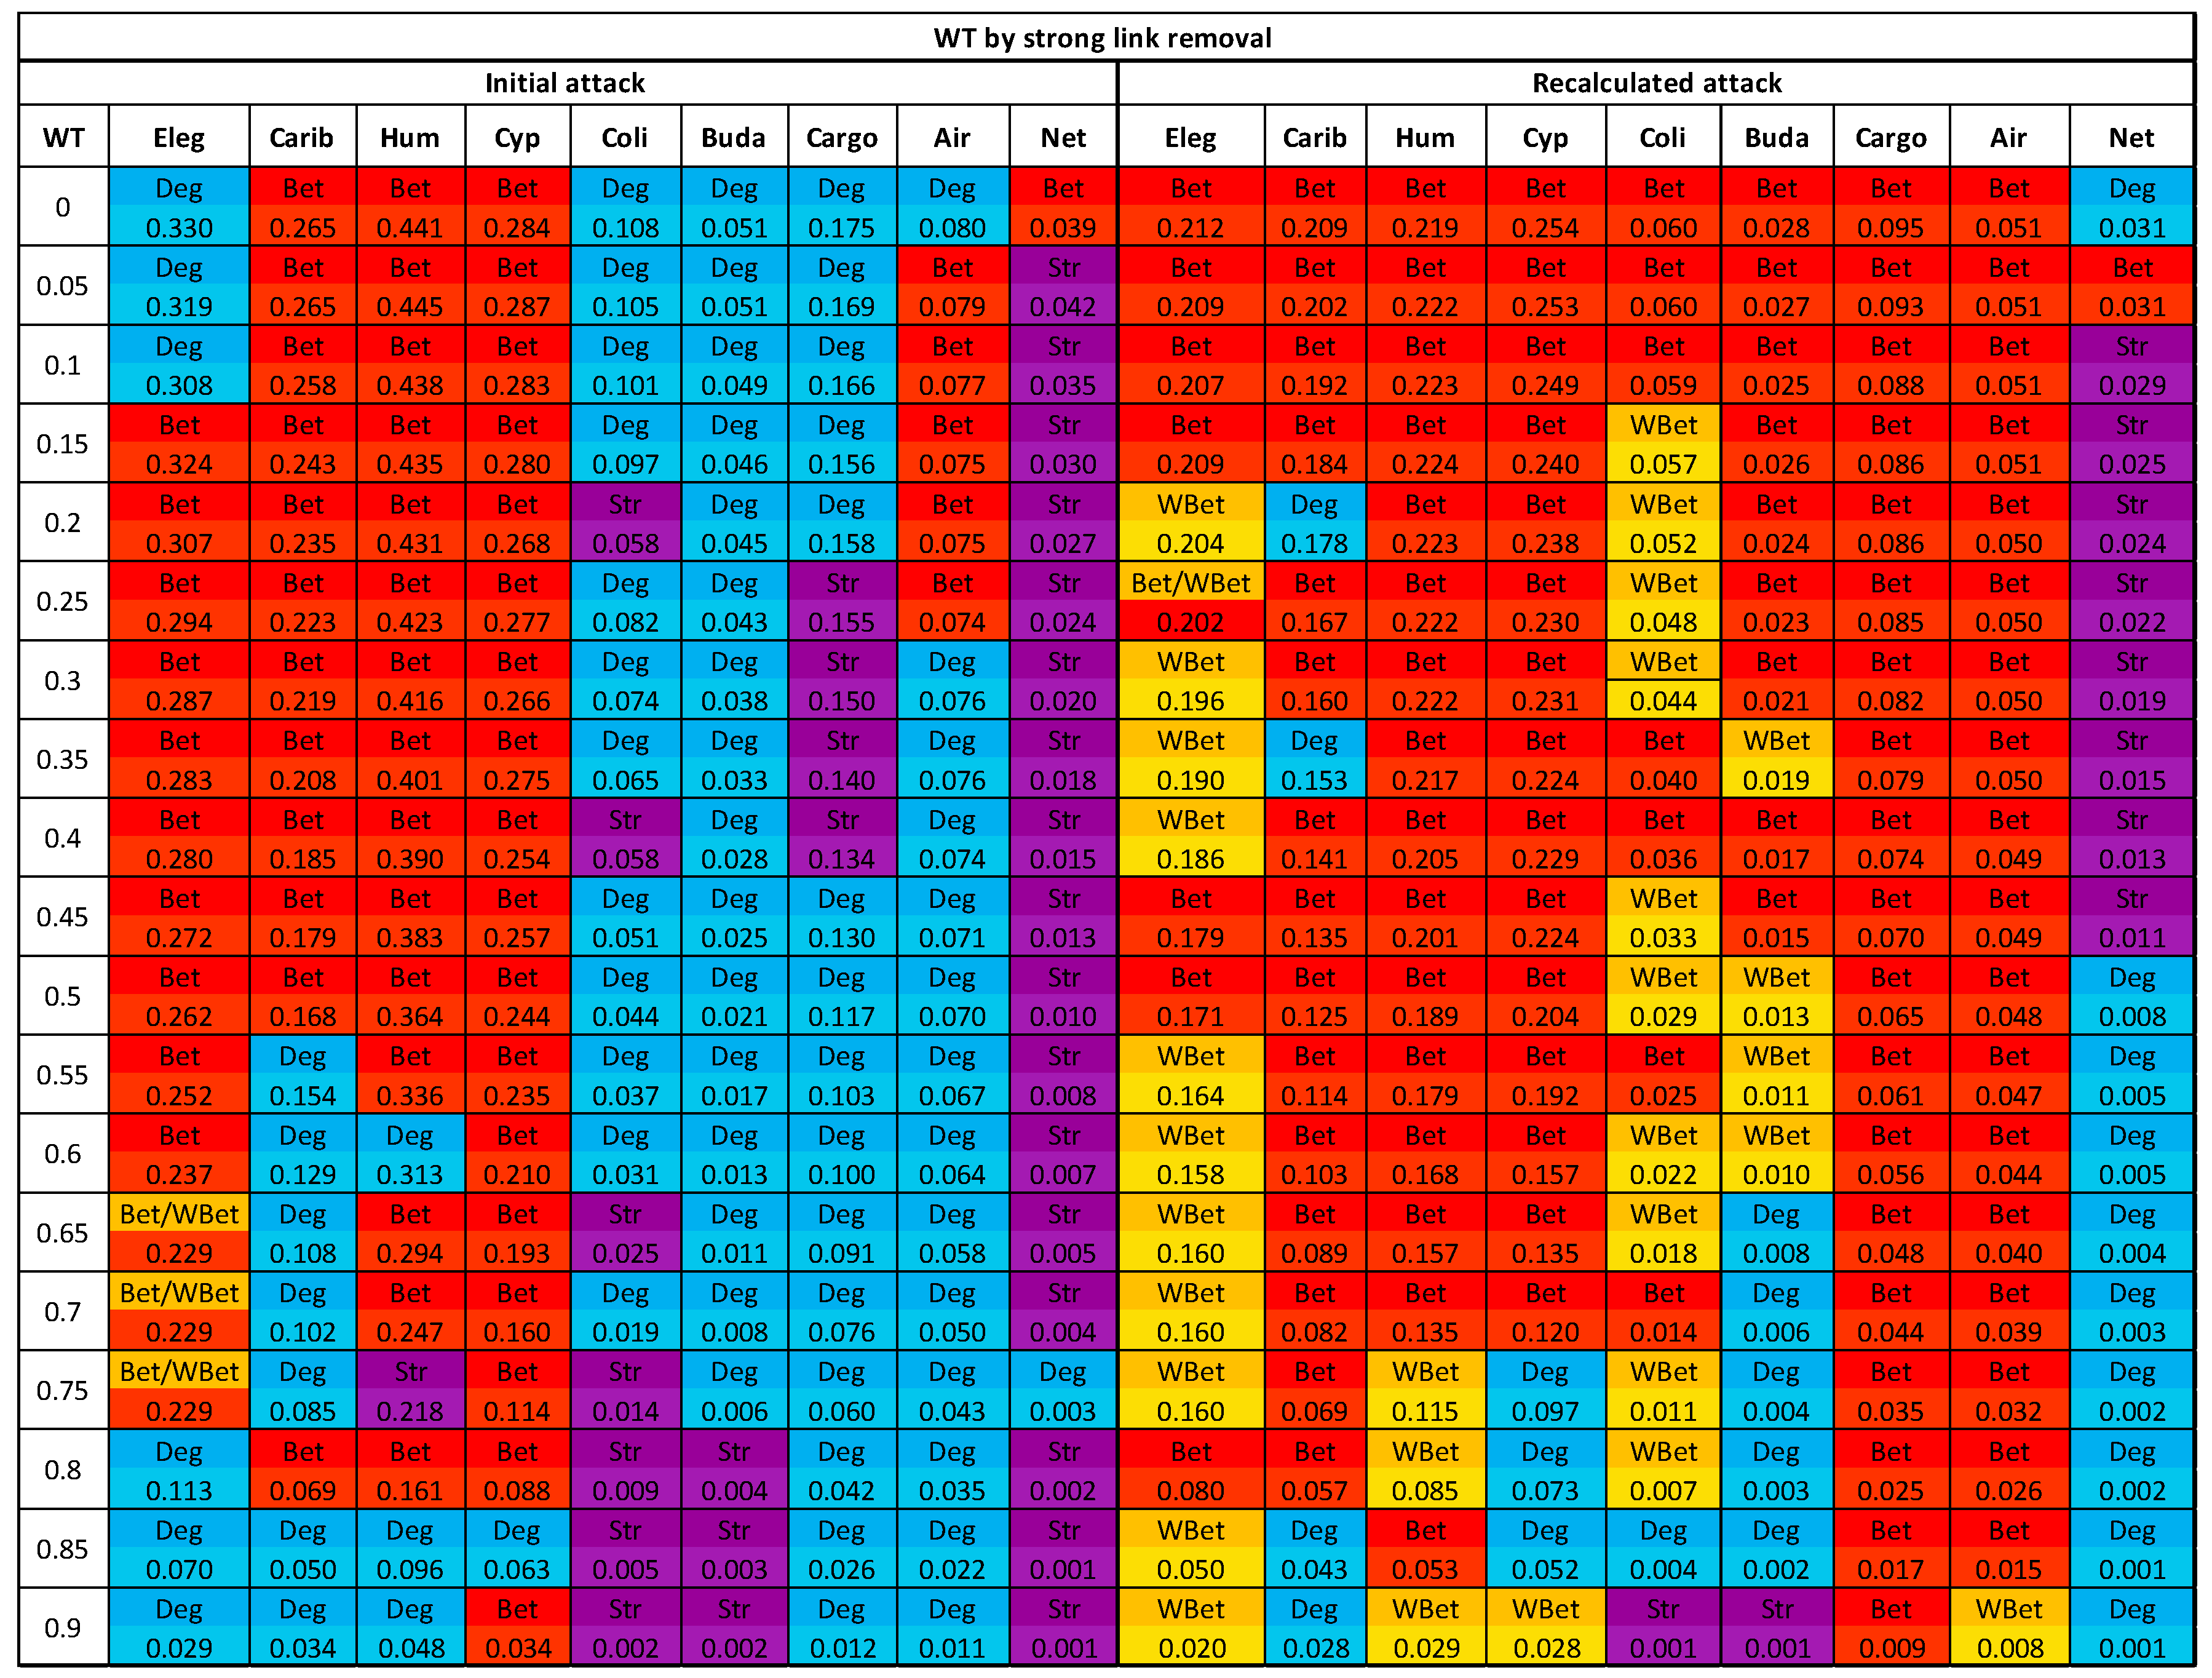
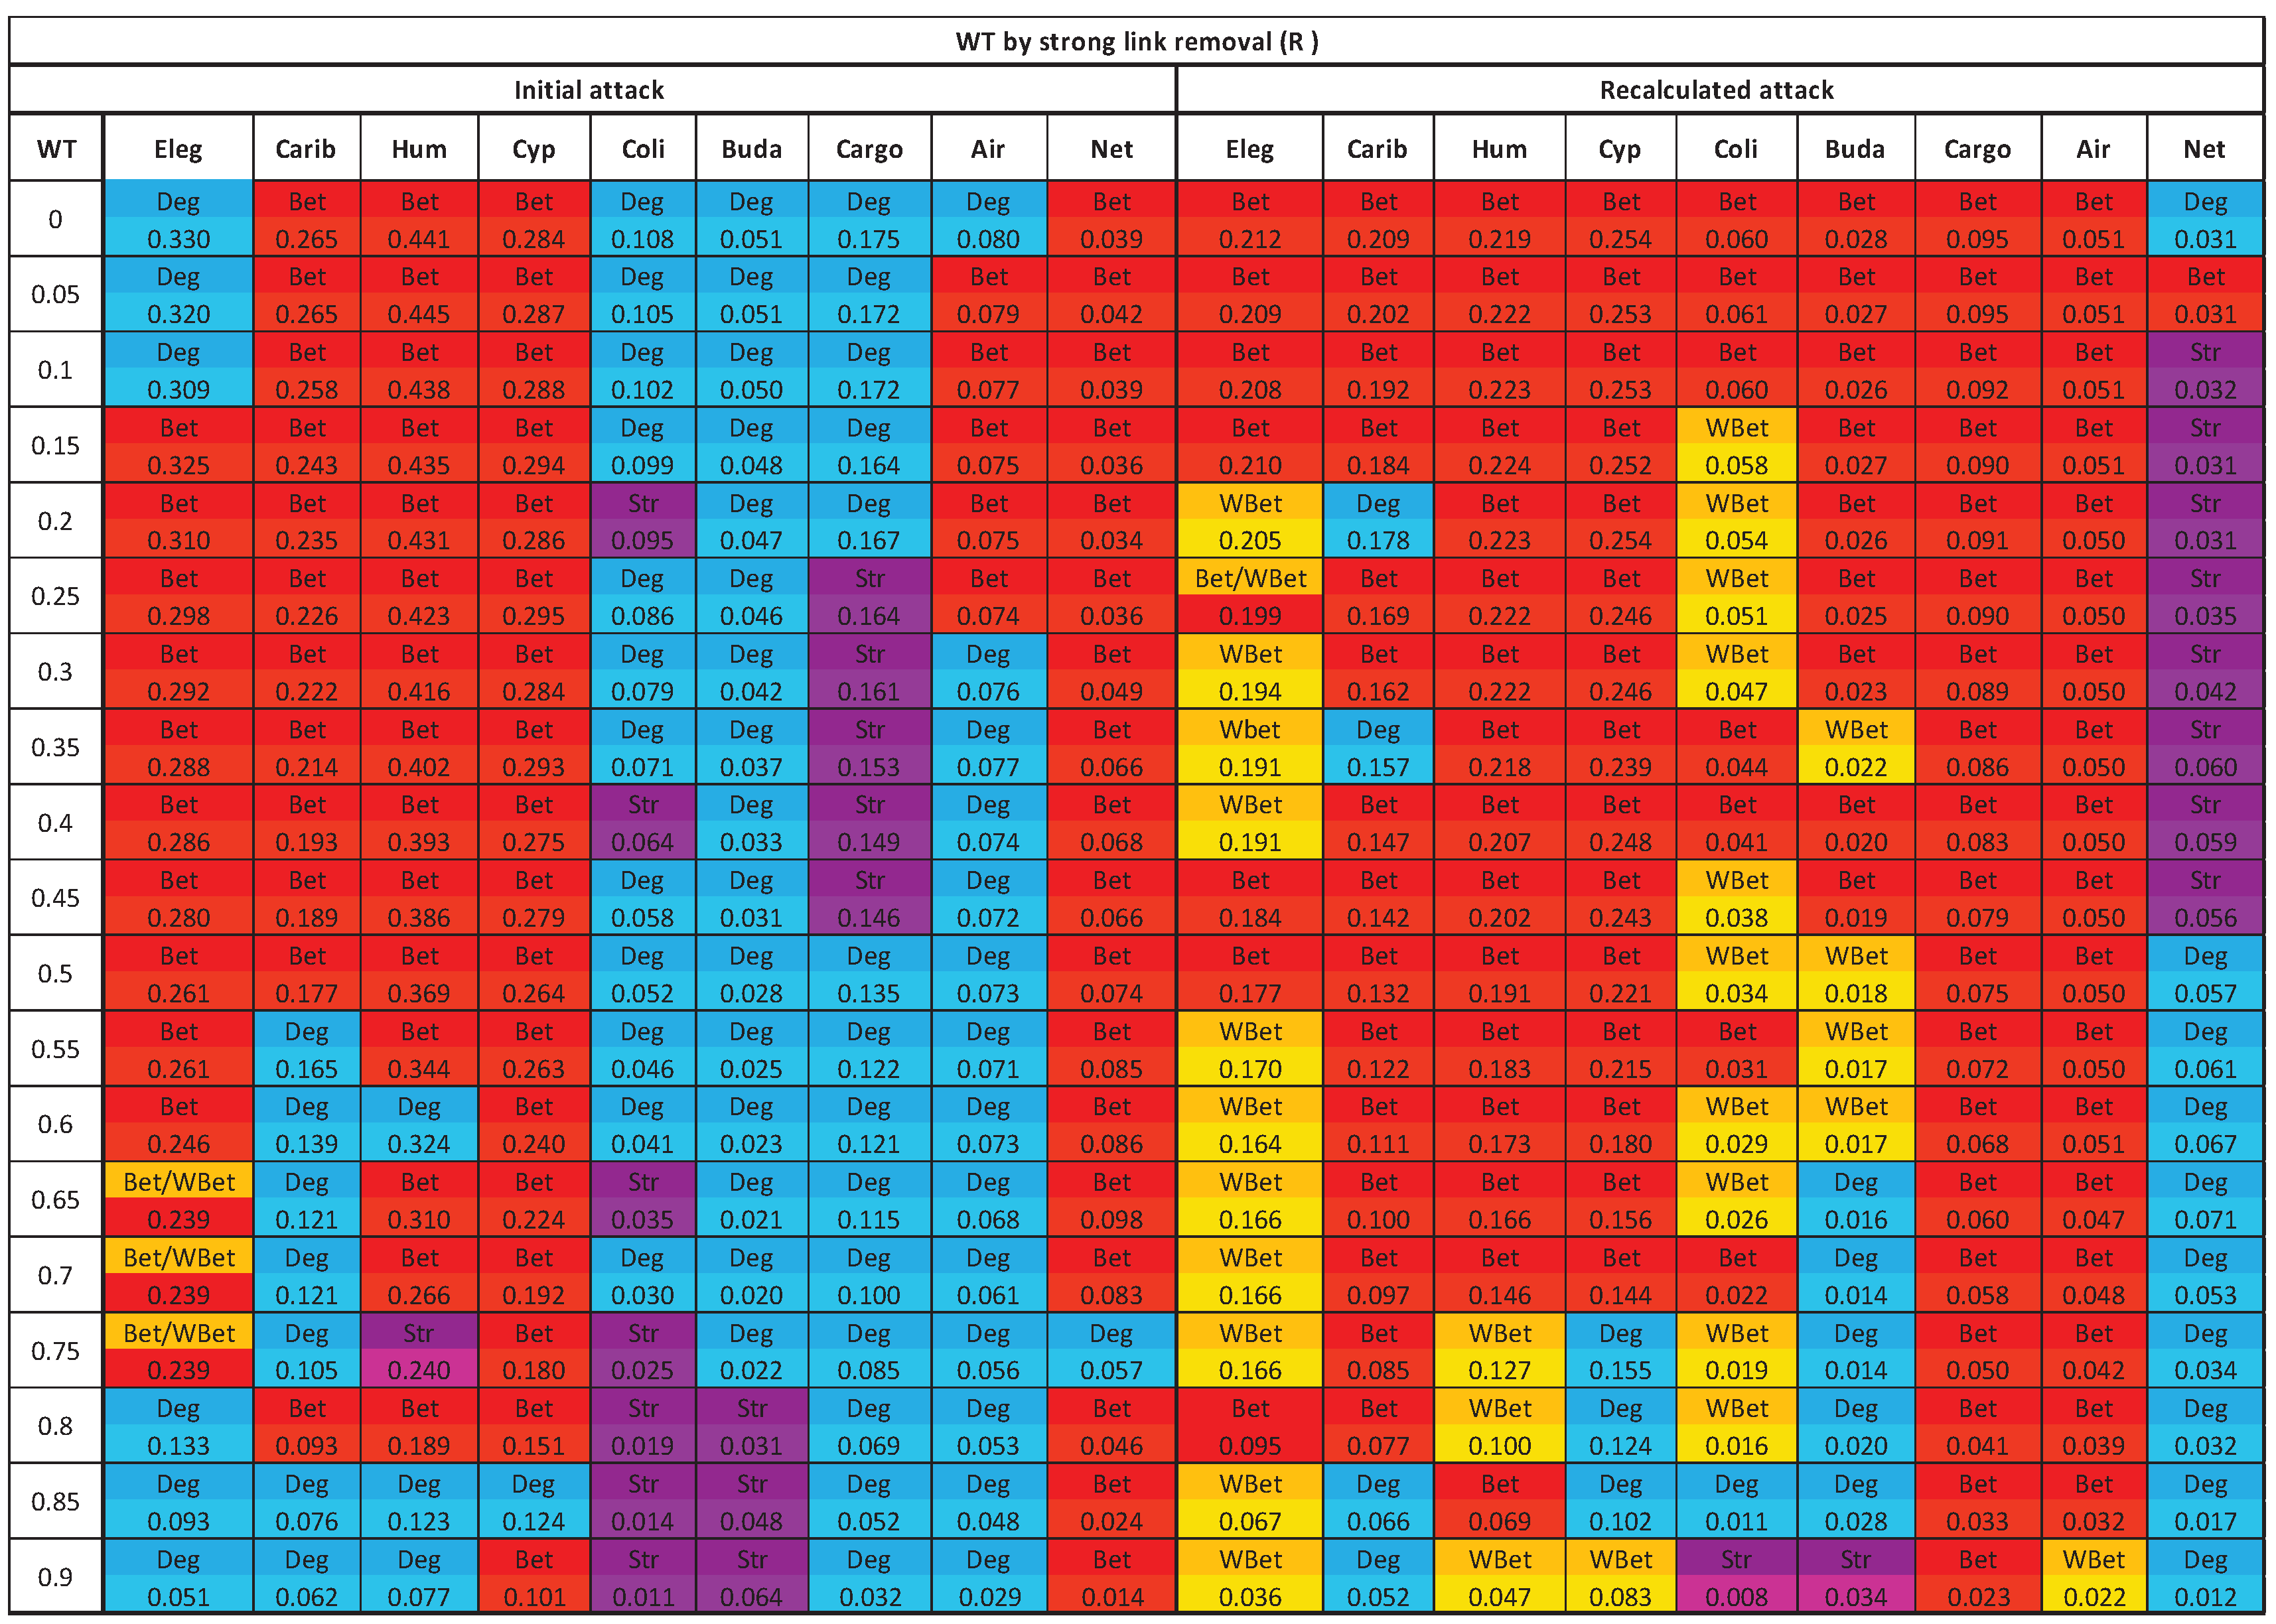
Table 3 and Table 4 list the best attack strategy, returning the lowest R value for each real-world network and each WT value. We find that with increasing WT, the efficacy of the attack strategy changes as well, and this is for both the normalization procedures of the LCC. For example, for initial node attack strategies, the best attack strategy for the C. Elegans network is the degree-based strategy (Deg) for WT≤0.1, whereas for WT>0.1, the betweenness attack strategy (Bet) becomes the best method to dismantle the LCC (Table 4). For Cargo network, the best attack strategy is Str for 0.25≤WT≤0.4; in the remaining WT parameter space, the best attack strategy is Deg.
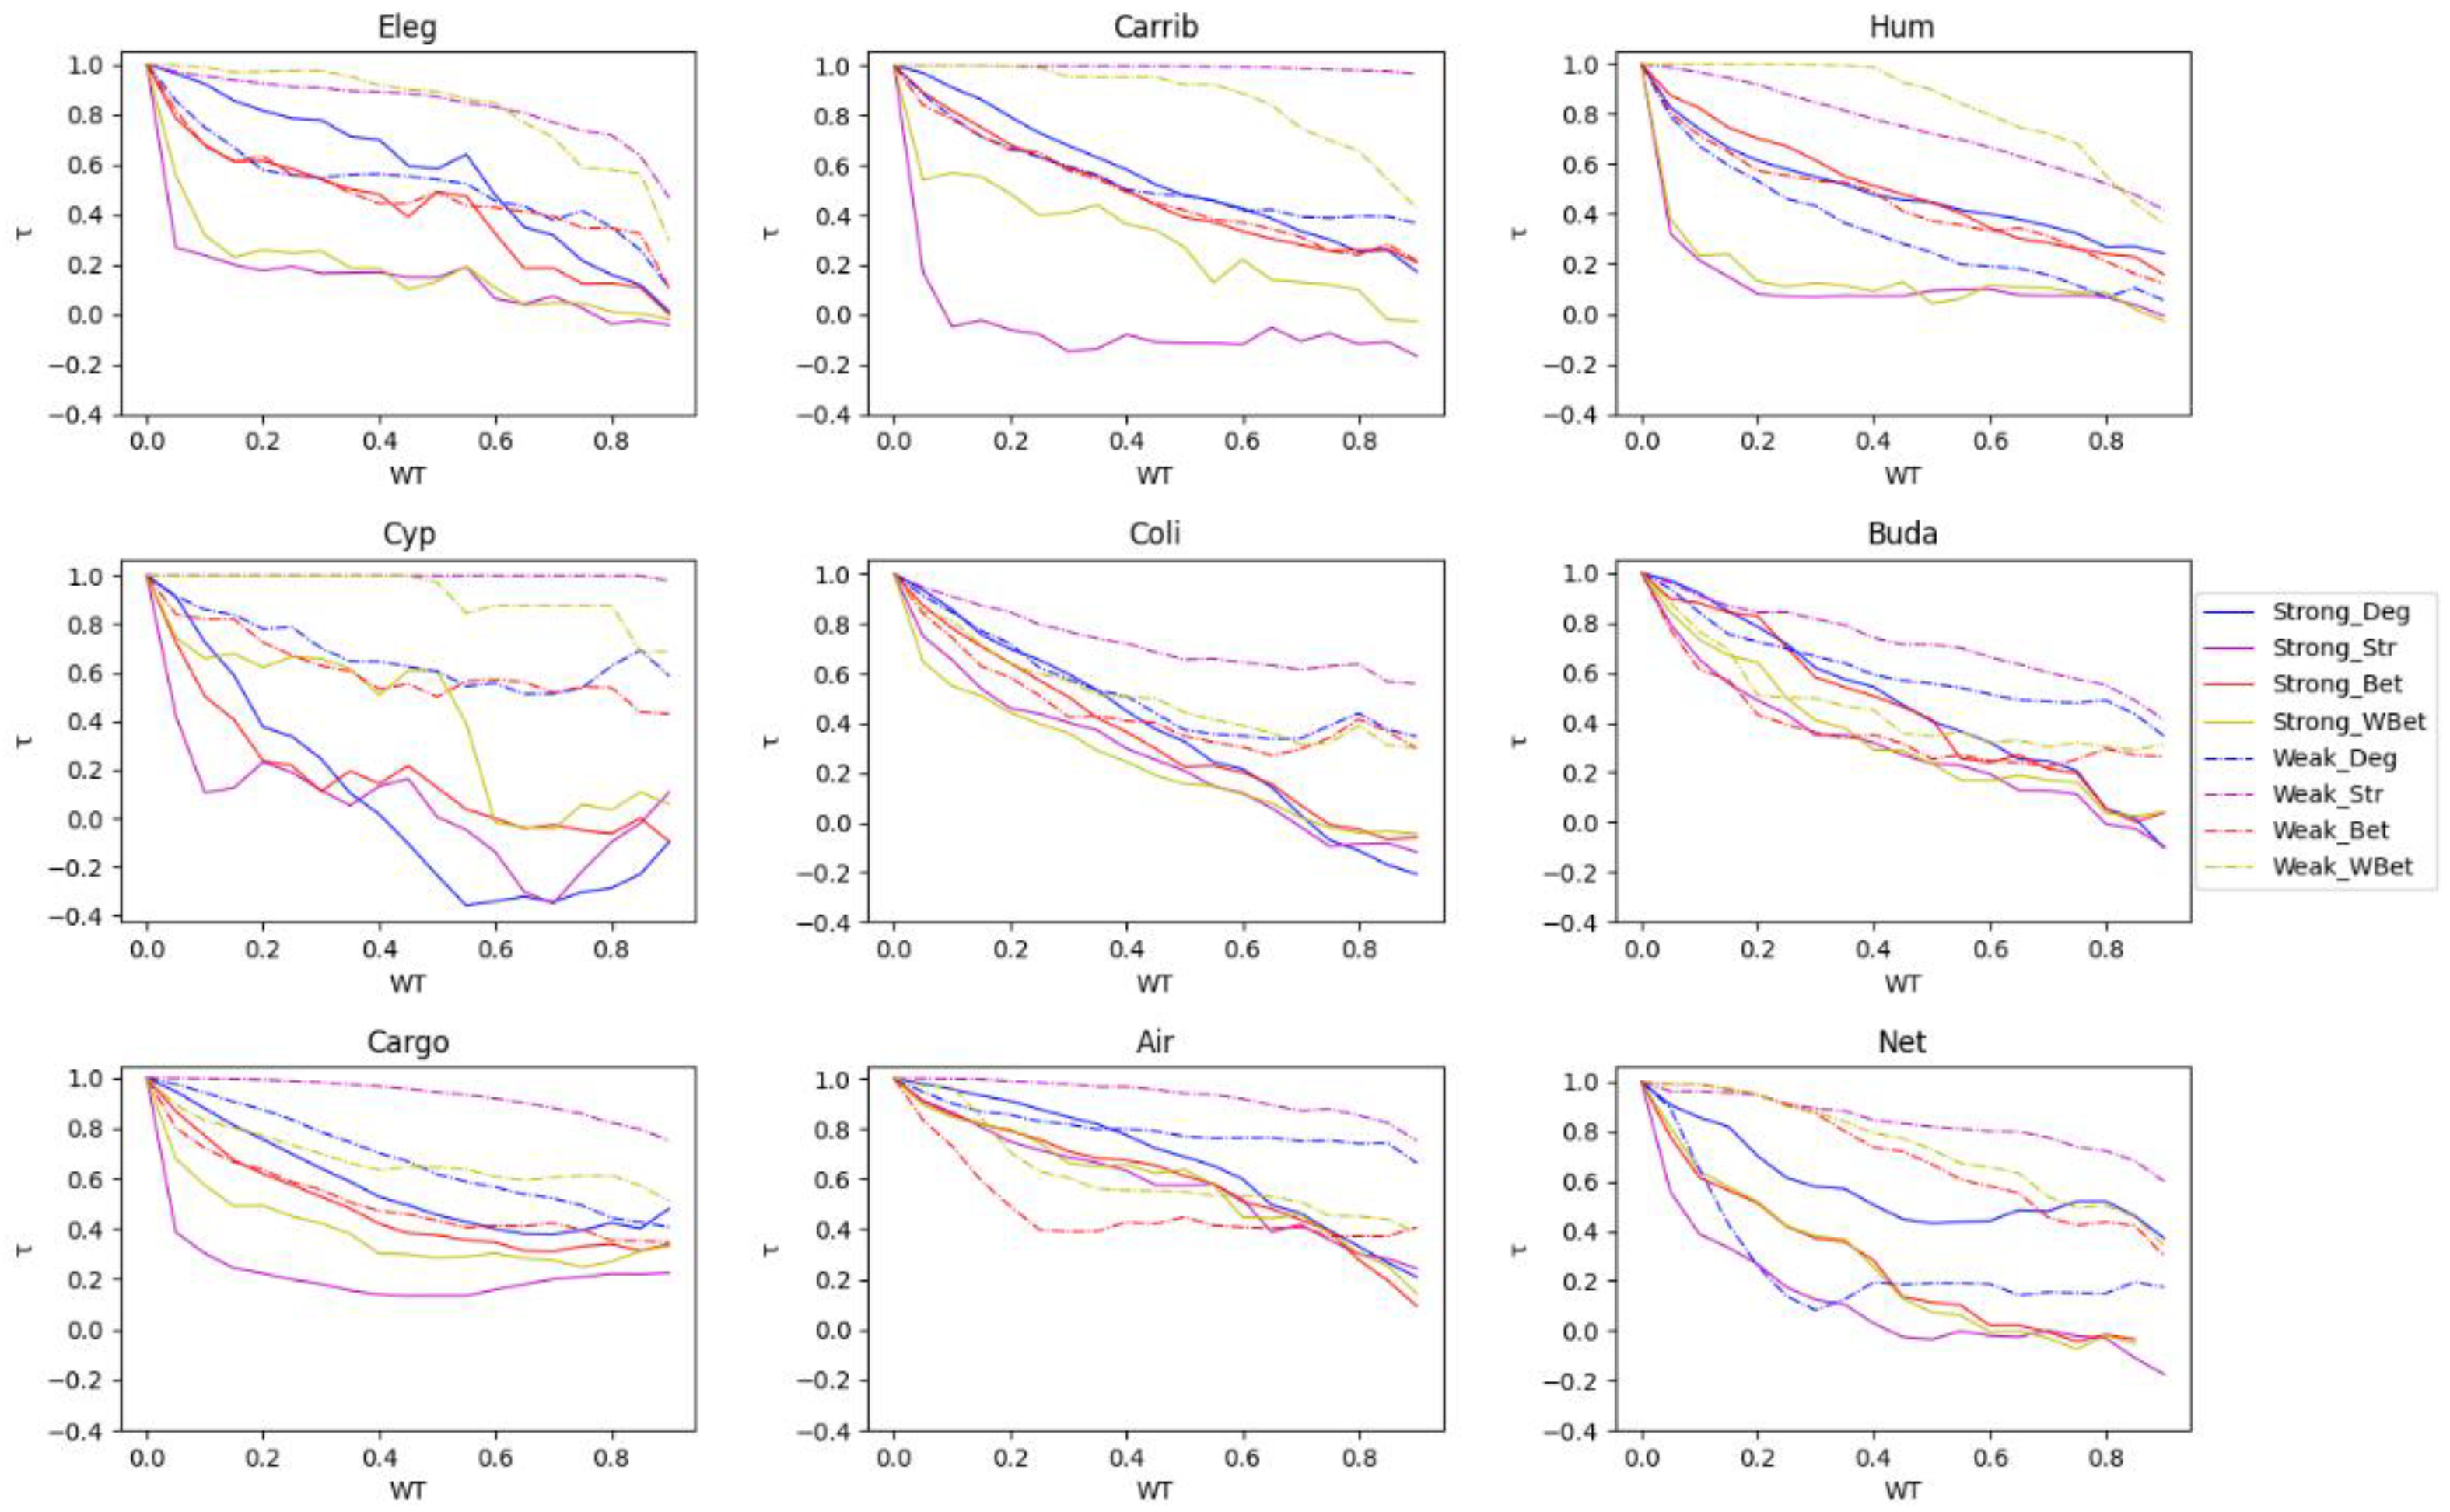
These findings show that the strong link removal performed by the WT procedure clearly changes the efficacy of the node attack strategies. This last result has two important consequences. (I) To find the best node attack strategies in real-world networks is a fundamental problem in network science with many real applications [26,30,33,34]. The WT procedure aiming to simplify the network by reducing the number of links induces structure changes that affect the efficacy of the node attack strategies. For this, network science research focusing on node attack strategies must consider that applying WT may significantly change the node attack efficacy. (II) Finding the best attack strategies is a heuristic way to select important nodes in the network [30]. Here, we show that WT performed by strong links removal changes the efficacy of the attack strategies. Therefore, strong WT is likely affecting the node rank importance in the network [2]. To test how WT affects the rank of the different node centralities, we use Kendall’s tau coefficient (τ) to evaluate the change in node rank after weight thresholding [35]. τ is a measure of the magnitude of correspondence between two ranked data, i.e., the higher the Kendall's τ coefficient, the more similar the two ranking sequences. The range of Kendall's τ coefficient is from −1 to 1. We depict the results of this analysis in Figure 5. τ decreases by increasing WT, indicating changes in node rank after WT procedure. Comparing the τ coefficient for strong WT (Figure 5, solid lines) with the τ coefficient discovered in previous work by applying weak WT [2] (Figure 5, dashed lines), we find that strong WT produces a faster decrease of the τ coefficient. John et al. [2] found that applying the WT weak link removal decreases the τ coefficient to around 0.3 for most networks. By applying strong WT, we can lower the τ coefficient to 0 or even negative values (Figure 5, solid lines). This indicates that sparsification procedures based on strong link removal may trigger a greater change in node centrality rank concerning the sparsification procedures removing weak links. Network science research focusing on developing algorithms to find important (influential nodes) [36] has to consider that simplifying the network with WT methodologies may also change the node importance evaluated by different node centrality indicators in the network.

3.4. Comparing strong and weak WT procedures

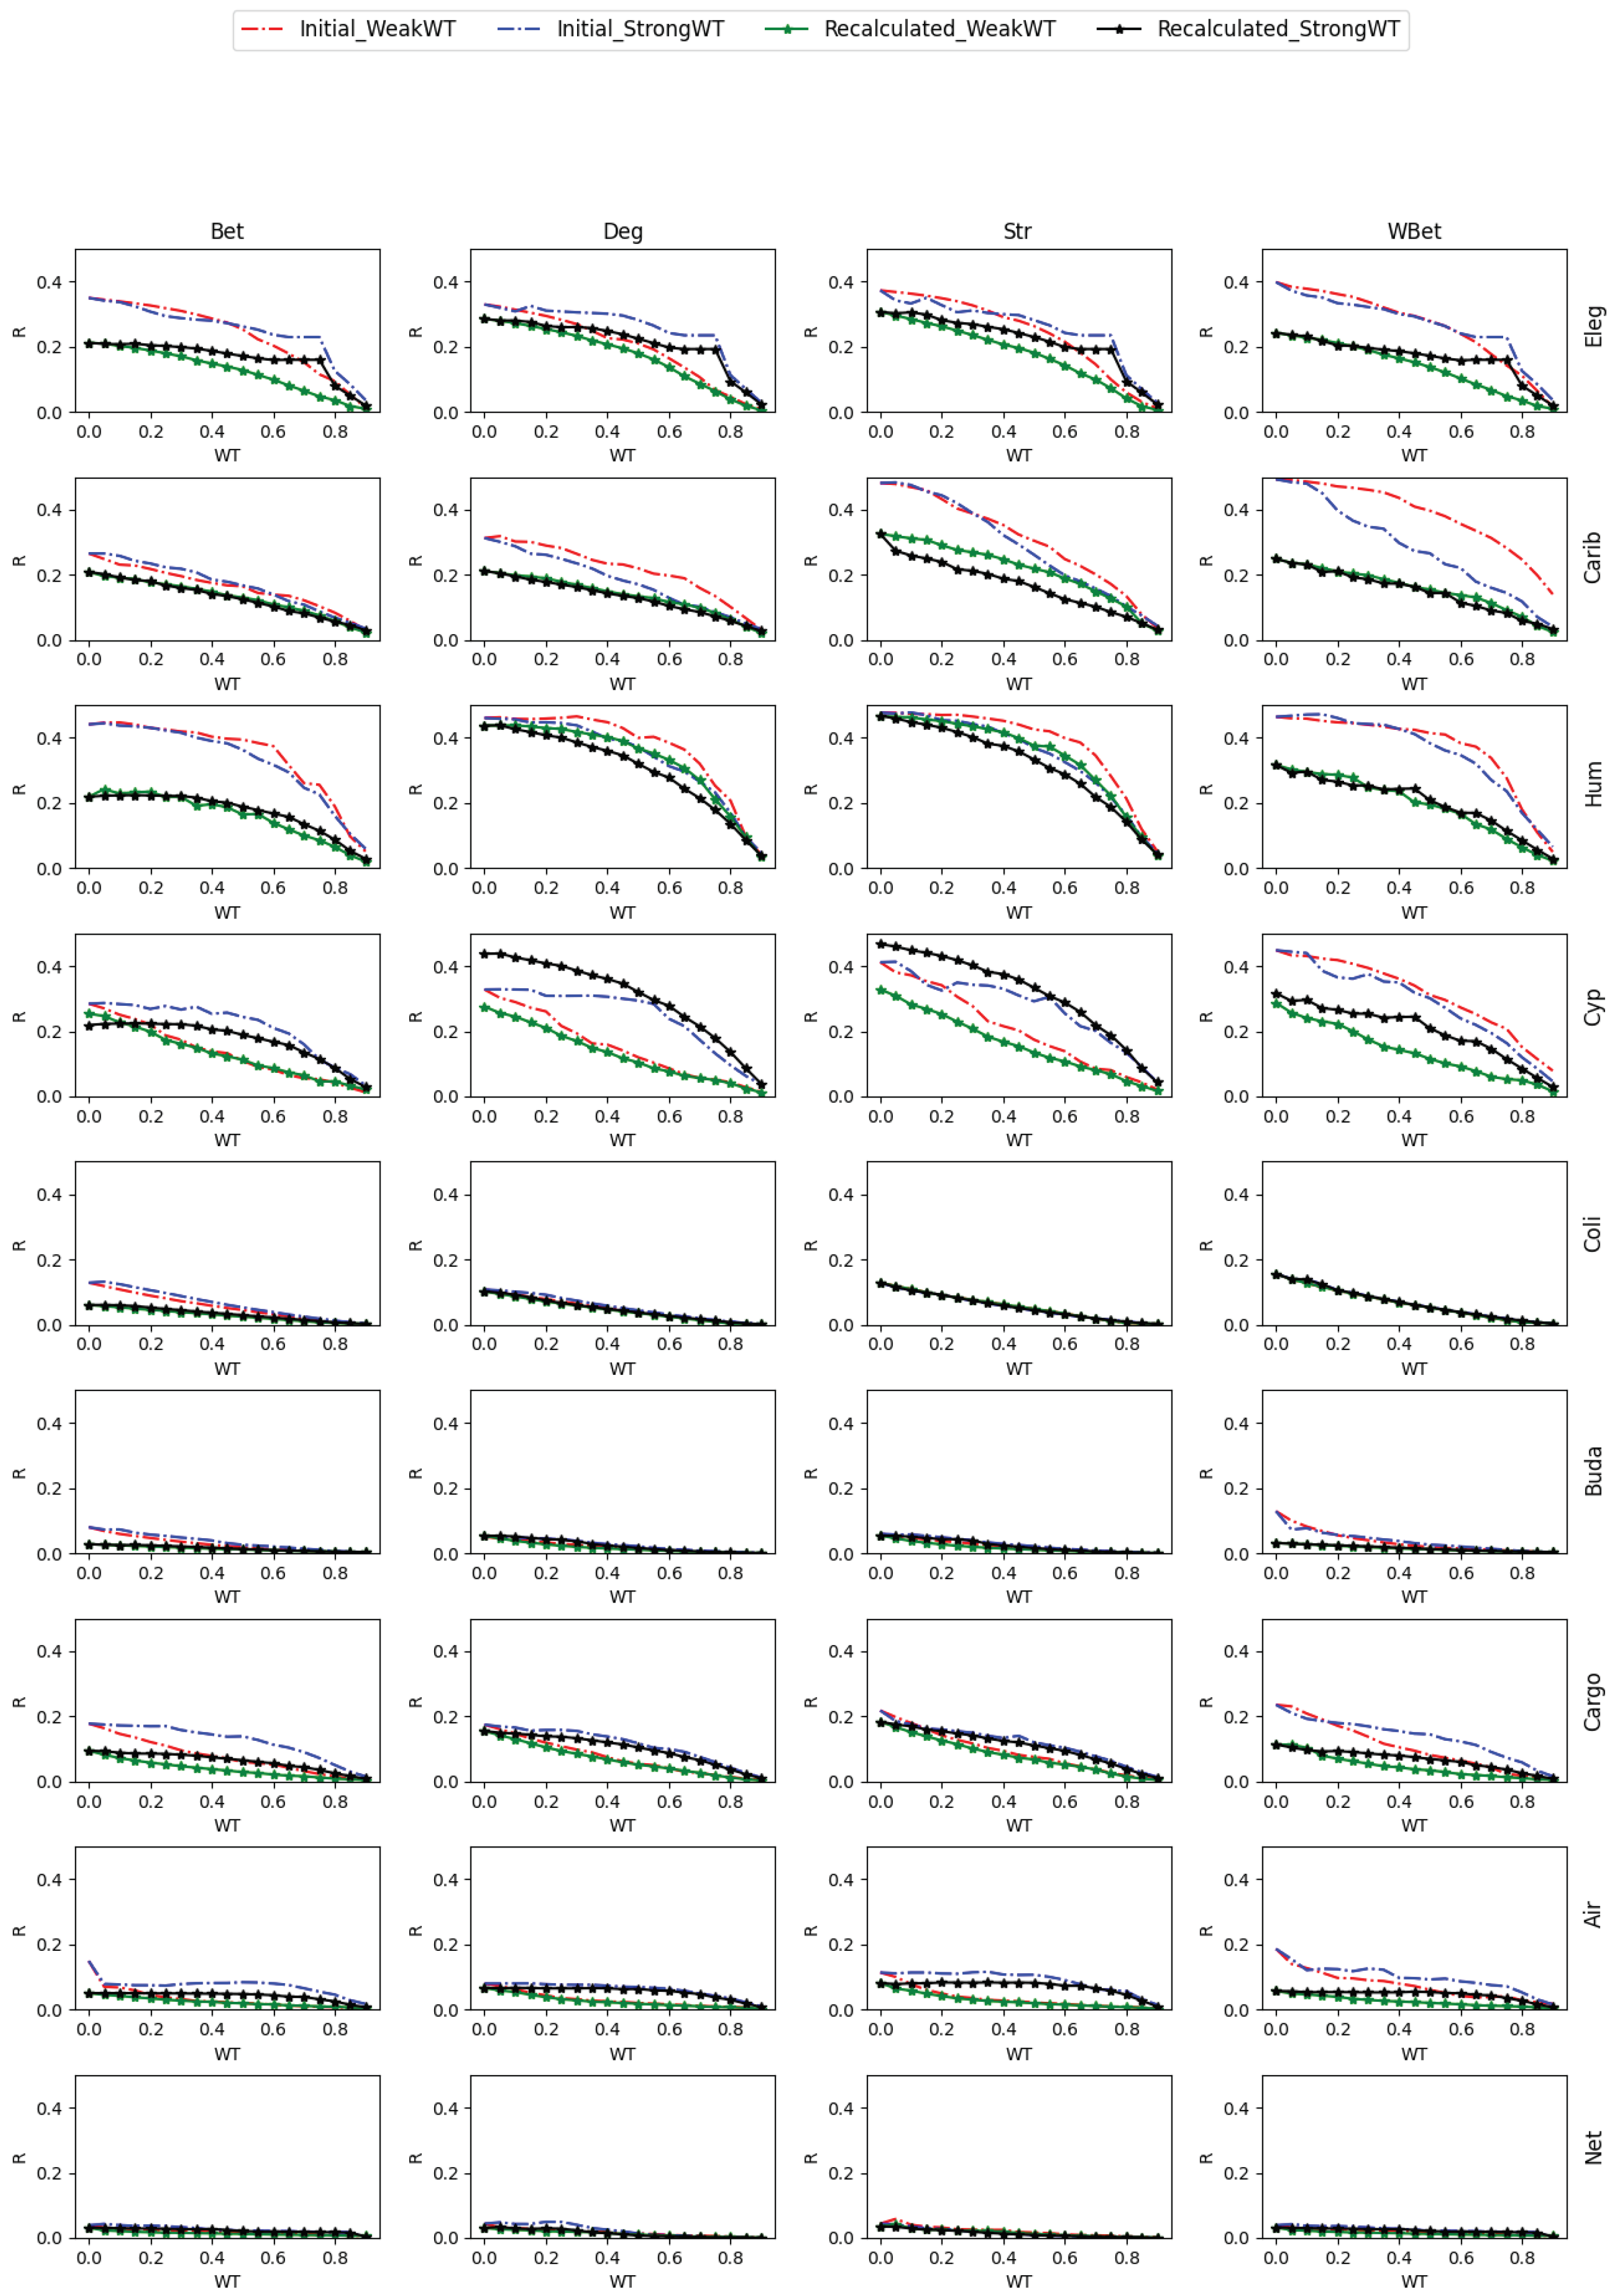
John et al. [2] investigated the effect of weight thresholding (WT) on the robustness of real-world complex networks against various node attack strategies by removing a fixed fraction of weak links. In this research, we investigate the opposite perspective and perform WT by removing strong links. In Figure 6, we compare the Rtot against the initial node attack when weak and strong WT procedures simplify networks. We do not find a clear trend; in some cases, weak WT triggers a faster robustness decrease, and in others, it is the contrary. For example, the weak WT induces a higher decrease in robustness with respect to the strong WT for Air and Cargo networks for both initial (Figure 6, red lines) and recalculated attacks (Figure 6, green lines). In the Carib network, the strong WT returns lower robustness, especially for initial node attacks. These latest results show the difficulty in predicting how different sparsification procedures may affect the robustness of node attacks on real-world networks. Different real-world networks may exhibit opposite behaviors regarding sparsification through the removal of the heaviest-weight links (strong WT) compared to removing the links of lower weight (weak WT).

4. Conclusion

We analyzed the impact of weight thresholding on the robustness of real-world networks to different node attack strategies. Here, weight thresholding is performed by removing a fixed fraction of strong links. Generally, the real-world networks under study show robust connectivity against the WT procedure. In other words, real-world networks maintain a robust structure regarding LCC to strong link removal. These results suggest that strong link removal can be used as a method for the sparsification of networks for applications in which the robustness to node attack is important.
Then, we find that applying WT may significantly change the node attack efficacy and the rank of different node centrality measurements. The strong WT procedure induces a greater change in the ranking of nodes than the weak WT procedure. For this reason, network research focusing on finding the efficacy of node attack strategies or finding important nodes in the network has to consider the network structural changes caused by the weight thresholding (sparsification) procedures. The results presented in this research can be useful in network science research needing to simplify complex networked systems and in machine learning and neural networks research to reduce model complexity or eliminate less important network connections.

Acknowledgments

This research is funded by the IIT Palakkad Technology IHub Foundation Doctoral Fellowship. IPTIF/HRD/DF/019 and Ecosister project, funded under the National Recovery and Resilience Plan (NRRP), Mission 4 Component 2 Investment 1.5—Call for tender No. 3277 of December 30, 2021 of the Italian Ministry of University, and research funded by the European Union—NextGenerationEU. Award Number: Project Code ECS00000033, Concession Decree No. 1052 of June 23, 2022, adopted by the Italian Ministry.

References

  1. X. Yan, L.. G. S. Jeub, A. Flammini, F. Radicchi and. S. Fortunato, “Weight thresholding on complex networks,” Physical Review E, vol. 98, no. 4, 2018.
  2. J. M. John, M. Bellingeri, D. S. Lekha, D. Cassi and R. Alfieri, “Effect of Weight Thresholding on the Robustness of Real-World Complex Networks to Central Node Attacks,” Mathematics, vol. 11, 2023.
  3. A. Namaki, A. H. Shirazi, R. Raei and G. Jafari, “Network analysis of a financial market based on genuine correlation and threshold method,” Physica A: Statistical Mechanics and its Applications, vol. 390, pp. 3835--3841, 2011.
  4. M.-E. Lynall, D. S. Bassett, R. Kerwin, P. J. McKenna, M. Kitzbichler, U. Muller and E. Bullmore, “Functional connectivity and brain networks in schizophrenia,” Journal of Neuroscience, vol. 30, pp. 9477--9487, 2010.
  5. S. Allesina, A. Bodini and C. Bondavalli, “Secondary extinctions in ecological networks: bottlenecks unveiled,” Ecological Modelling, vol. 194, pp. 150--161, 2006.
  6. K. A. Garrison, D. Scheinost, E. S. Finn, X. Shen and R. T. Constable, “The (in) stability of functional brain network measures across thresholds,” Neuroimage, vol. 118, pp. 651--661, 2015.
  7. T. Kavzoglu and P. M. Mather, “Assessing artificial neural network pruning algorithms,” in Proceedings of the 24th annual conference and exhibition of the remote sensing society, Greenwich, UK, 1998.
  8. P. Hongwu, G. Deniz, H. Shaoyi, G. Tong, J. Weiwen, K. Orner and D. Caiwen, “Towards Sparsification of Graph Neural Networks,” in IEEE 40th International Conference on Computer Design (ICCD), Olympic Valley, CA, USA, 2022.
  9. D.. J. Watts and. S. H. Strogatz, “Collective dynamics of ‘small-world’ networks,” Nature, vol. 393, p. 440–2, 1998.
  10. V. Latora, V. Nicosia and G. Russo, Complex Networks: Principles, Methods and Applications., 2017.
  11. A. Allard, M. A. Serrano,. G. Garcia-Perez and M. Boguna, “The geometric nature of weights in real complex networks.,” Nature communications, vol. 8, pp. 1-8, 2017.
  12. V. Colizza, R. Pastor-Satorras and A. Vespignani, “Reaction-diffusion processes and metapopulation models in heterogeneous,” Nature Physics, vol. 3, p. 276–282, 2007.
  13. A. M. Serrano,. M. Boguna and. F. Sagues, “Uncovering the hidden geometry behind metabolic networks,” Molecular BioSystems, vol. 8, p. 843–850, 2012.
  14. M.. E. J. Newman, “Finding community structure in networks using the eigenvectors of matrices,” Phys. Rev., vol. 74, p. 036104, 2006.
  15. A. Avena-Koenigsberger, J. Goni, R. F. Betzel,. M. P. v. d. Heuvel, A. Griffa,. P. Hagmann, J.-P. Thiran and. O. Sporns, “Using Pareto optimality to explore the topology and dynamics of the human connectome,” Philos Trans R Soc Lond B Biol Sci., vol. 369, 2014.
  16. P. Hagmann, L. Cammoun,. X. Gigandet,. R. Meuli,. C. J. Honey, V. J. Wedeen and O. Sporns, “Mapping the structural core of human cerebral cortex,” PLoS biology, vol. 6, p. 1479–1493, 2008.
  17. M. Bellingeri and A. Bodini, “Food web's backbones and energy delivery in ecosystems,” Oikos, vol. 125, pp. 586-594, 2016.
  18. S. Opitz, Trophic Interactions in Caribbean Coral Reefs, ICLARM, 1996.
  19. J.. J. Heymans, R. E. Ulanowicz and C. Bondavalli, “Network analysis of the South Florida Everglades graminoid marshes and comparison with nearby cypress ecosystems,” Ecological Modelling, vol. 149, pp. 5-23, 2002.
  20. M. Bellingeri and S. Vincenzi, “Robustness of empirical food webs with varying consumer's sensitivities to loss of resources,” Journal of Theoretical Biology, vol. 333, pp. 18-26, 2013.
  21. B. Szalkai, C. Kerepesi, B. Varga and V. Grolmusz, “The Budapest Reference Connectome Server v2.0,” Neuroscience Letters, vol. 595, pp. 60-62, 2015.
  22. R. Albert, H. Jeong and. A.-L. Barabasi, “Error and attack tolerance of complex networks,” Nature volume, vol. 406, p. 378–382, 2000.
  23. R. Albert and A.-L. Barabasi, “Statistical mechanics of complex networks,” Review of Modern Physics, vol. 74, no. 1, pp. 47-97, 2002.
  24. P. Holme, B. J. Kim, C. N. Yoon and S. K. Han, “Attack vulnerability of complex networks,” Phys. Rev. E, vol. 65, no. 5, p. 056109, 2002.
  25. M. Bellingeri,. D. Cassi and S. Vincenzi, “Efficiency of attack strategies on complex model and real-world networks,” Physica A: Statistical Mechanics and its Applications, vol. 414, pp. 174-180, 2014.
  26. S. Iyer, T. Killingback,. B. Sundaram and Z. Wang, “Attack robustness and centrality of complex networks,” PLoS One, vol. 8, pp. 1-17, 2013.
  27. R. Cohen,. K. Erez,. D. Ben-Avraham and S. Havlin, “Breakdown of the internet under intentional attack,” Physical Review Letters, vol. 86, p. 3682–3685, 2001.
  28. M. Bellingeri and D. Cassi, “Robustness of weighted networks,” Physica A: Statistical Mechanics and its Applications, vol. 489, pp. 47-55, 2018.
  29. Q. Nguyen, N. K. K. Nguyen, D. Cassi and M. Bellingeri, “New betweenness centrality node attack strategies for real-world complex weighted networks,” Complexity, vol. 2021, 2021.
  30. M. Bellingeri, D. Bevacqua, F. Sartori, M. Turchetto, F. Scotognella, R. Alfieri, N. K. K. Nguyen, T. T. Le, Q. Nguyen and D. Cassi, “Considering weights in real social networks: A review,” Frontiers in Physics, vol. 11, 2023.
  31. M. Bellingeri, D. Bevacqua, F. a. Scotognella, R. Alfieri and D. Cassi, “A comparative analysis of link removal strategies in real complex weighted networks,” Scientific reports, vol. 10, pp. {1--15, 2020.
  32. R. K. Pan and J. Saramaki, “The strength of strong ties in scientific collaboration networks,” Europhysics Letters, vol. 97, no. 1, p. 18007, 2012.
  33. F. Jordán, “Keystone Species and Food Webs,” Philosophical transactions of the Royal Society of London. Series B, Biological sciences, vol. 364, pp. 1733-41, 2009.
  34. T. Nie, Z. Guo, K. Zhao and Z.-M. Lu, “New attack strategies for complex networks,” Physica A: Statistical Mechanics and its Applications, vol. 424, pp. 248-253, 2015.
  35. M. G. Kendall, “The treatment of ties in ranking problems,” Biometrika, vol. 33, pp. 239--251, 1945.
  36. L. Lü, D. Chen, X.-L. Ren, Q.-M. Zhang, Y.-C. Zhang and T. Zhou, “Vital nodes identification in complex networks,” Physics Reports, vol. 650, pp. 1-63, 2016.
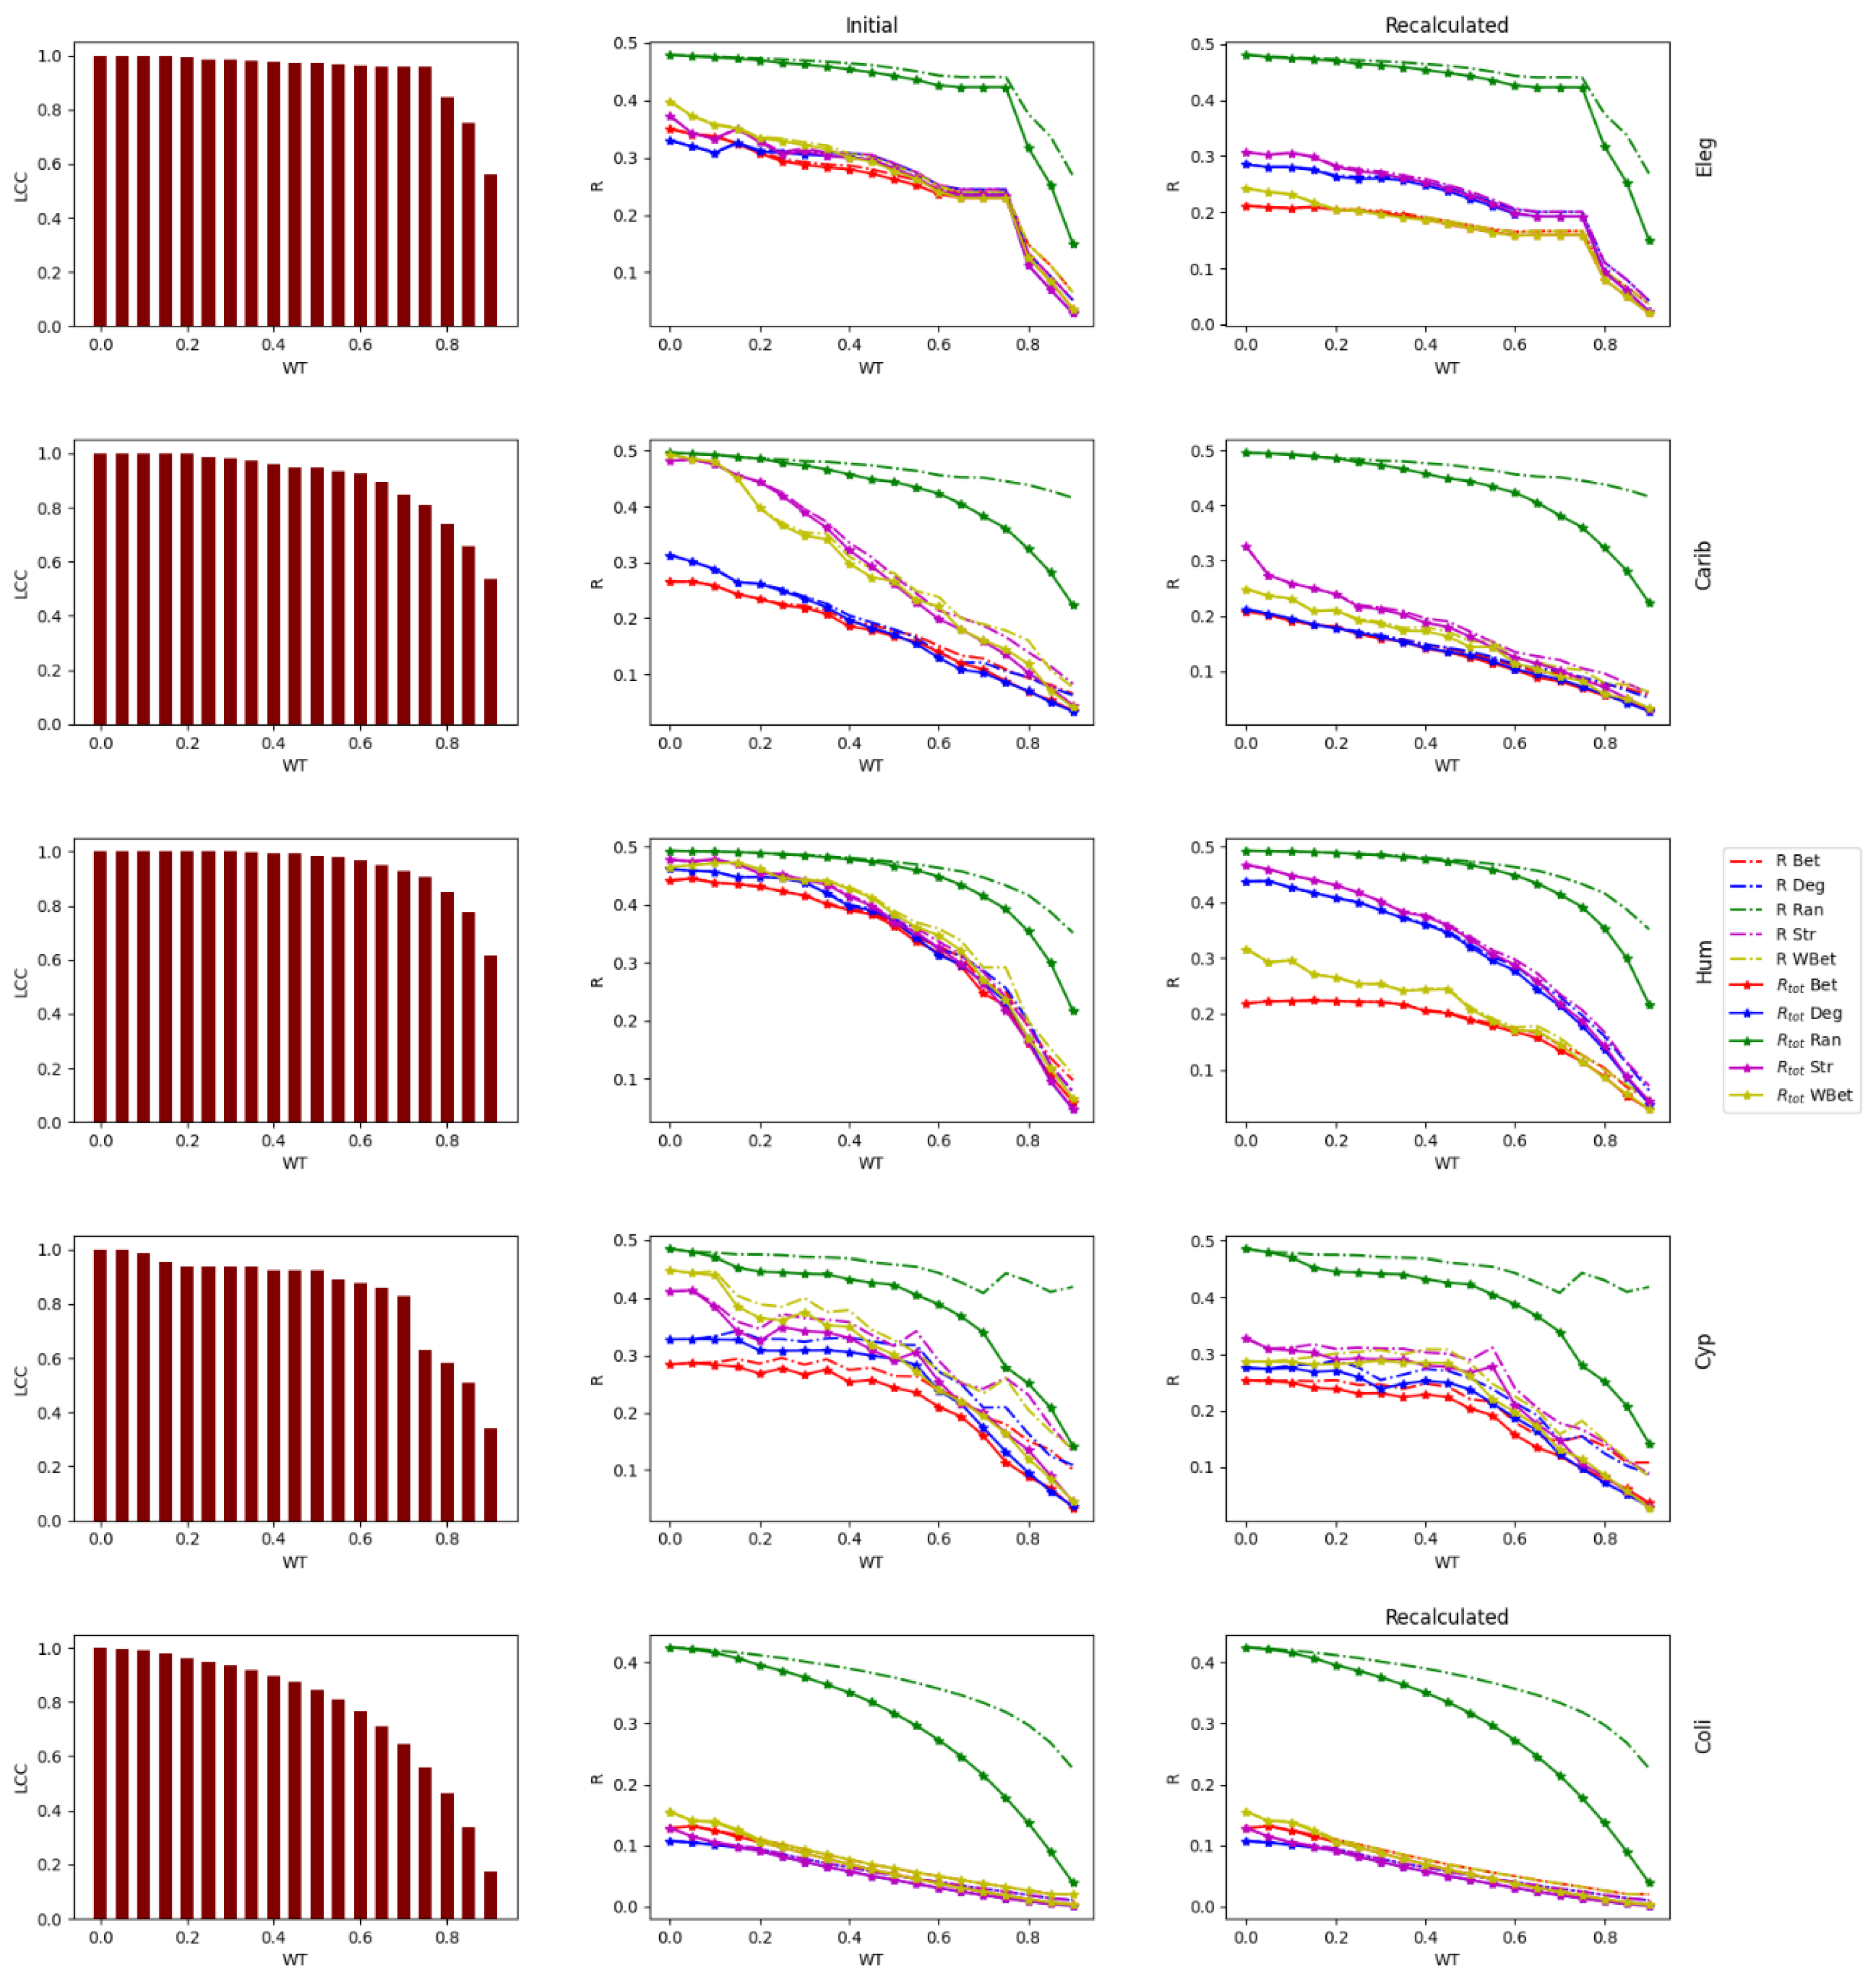
Figure 1. LCC after each weight thresholding (WT) value (left column), Robustness (R) of the network under initial (middle column), and recalculated attack strategies (right column) as a function of weight thresholding (WT) value for the networks C. Elegans (Eleg), Caribbean (Carib), Human12a (Hum), Cypdry (Cyp), and E. Coli (Coli).
Preprints 100161 g001
Figure 2. LCC after each weight thresholding (WT) value (left column), Robustness (R) of the network under initial (middle column), and recalculated attack (right column), strategies as a function of weight thresholding (WT) value for the networks Budapest (Buda), Cargoship (Cargo), US Airports (Air), and Netscience (Net).
Preprints 100161 g002
Figure 3. LCC as a function of the fraction of nodes removed q, for Ran, Deg, Str, Bet and WBet (both initial and recalculated) attacks in Budapest network for WT values 0.75, 0.8, 0.85, and 0.9.
Preprints 100161 g003
Figure 4. LCC as a function of the fraction of nodes removed q, for Ran, Deg, Str, Bet and WBet (both initial and recalculated) attacks in Netscience network for WT values 0.25, 0.45, 0.55, and 0.65.
Preprints 100161 g004
Figure 5. Kendall’s tau coefficient (𝜏) for centrality measures Deg, Str, Bet, and WBet. Correlation is measured between the node rank of the initial network and the node rank of the network after WT. We compute 𝜏 using the top 30% of nodes of the network. Solid lines indicate 𝜏 for WT by strong link removal; dashed lines indicate 𝜏 for WT by weak link removal as in [2].
Preprints 100161 g005
Figure 6. Comparison between the total robustness (Rtot) against weak and strong WT procedure. Network robustness under initial attack (dotted lines) and recalculated attack (solid lines) strategies as a function of weight thresholding (WT) value for the networks C. Elegans (Eleg), Caribbean (Carib), Human12a (Hum), Cypdry (Cyp), E. Coli (Coli), Budapest (Buda), Cargoship (Cargo), US Airports (Air), and Netscience (Net).
Preprints 100161 g006
Table 1. Statistics of real-world networks. N number of nodes; L number of links; <w> average weight; <k> average degree; LCC size of the largest connected component.
Networks Key Ref. Type Node Link Weight N L <k> <w> LCC
C. Elegans Eleg [9,10] Biological Neurons Neurons connection Number of Connections 297 2344 15.8 3.761 297
Cargoship Cargo [11] Transport Ports Route Shipping journeys 834 4348 10.4 97.709 821
USairport Air [12] Transport Airports Route Passengers 500 2979 11.9 152320.2 500
E. Coli Coli [11,13] Biological Metabolites Common reaction Number of Common reactions 1100 3636 6.61 1.364 1100
Netscience Net [14] Social authors Coauthorship Number of Common papers 1461 2741 3.75 0.434 379
Human12a Hum [15,16] Biological Brain regions Connection between regions Connection density 501 6038 24.1 0.01 501
Caribbean Carib [17,18] Ecological Food web Species Trophic relation Amount of biomass 249 3503 28.13 0.067 249
CypDry Cyp [19,20] Ecological Food web Species Trophic relation Amount of biomass 66 503 15.24 0.358 65
Budapest Buda [21] Biological Brain regions Neural connection Amount of track flow 480 1000 4.167 5.024 467
Table 2. List of the abbreviations used in this manuscript.
Abbreviation Full name
WT Weight thresholding
LCC Size of largest connected component
N Number of nodes
L Number of links
<w> Average weight
<k> Average degree
Ran Random node attack
Deg Degree node attack
Str Strength node attack
Bet Betweenness node attack
WBet Weighted Betweenness node attack
G Weighted network
G' Thresholded network
L’ Number of links in G'
q Fraction of nodes removed
R Robustness
Rtot Total Robustness
Initial_Weak WT WT by weak link removal with initial node attack strategy
Initial_Strong WT WT by strong link removal with initial node attack strategy
Recalculated_Weak WT WT by weak link removal with recalculated node attack strategy
Recalculated_Strong WT WT by strong link removal with recalculated node attack strategy
Table 3. Best attack strategy returning the lowest R value for each real-world network and each WT value. In each cell we indicate the best attack strategy and its Rtot value. The Rtot value is computed normalizing the LCC with initial LCC for WT=0.
Preprints 100161 i001
Table 4. Best attack strategy returning the lowest R value for each real-world network and each WT value. In each cell we indicate the best attack strategy and its R value. The R value is computed normalizing the LCC with initial LCC at each WT value.
Preprints 100161 i002
Disclaimer/Publisher’s Note: The statements, opinions and data contained in all publications are solely those of the individual author(s) and contributor(s) and not of MDPI and/or the editor(s). MDPI and/or the editor(s) disclaim responsibility for any injury to people or property resulting from any ideas, methods, instructions or products referred to in the content.
Copyright: This open access article is published under a Creative Commons CC BY 4.0 license, which permit the free download, distribution, and reuse, provided that the author and preprint are cited in any reuse.
Prerpints.org logo

Preprints.org is a free preprint server supported by MDPI in Basel, Switzerland.

Subscribe

© 2024 MDPI (Basel, Switzerland) unless otherwise stated