Submitted:
29 February 2024
Posted:
29 February 2024
You are already at the latest version
Abstract
Keywords:
1. Introduction
2. Materials and methods
2.1. Materials and reagents
- Cement: ordinary Jidong P. O 42.5 silicate cement; its performance characteristics are shown in Table 1.
- Fly ash: class-2 fly ash from the Jinqiao Thermal Power Plant in Hohhot City, Inner Mongolia.
- Coarse aggregate: ordinary crushed-stone pebbles.
- Fine aggregate: Kubuqi Desert aeolian sand and natural river sand.
- Water: ordinary tap water.
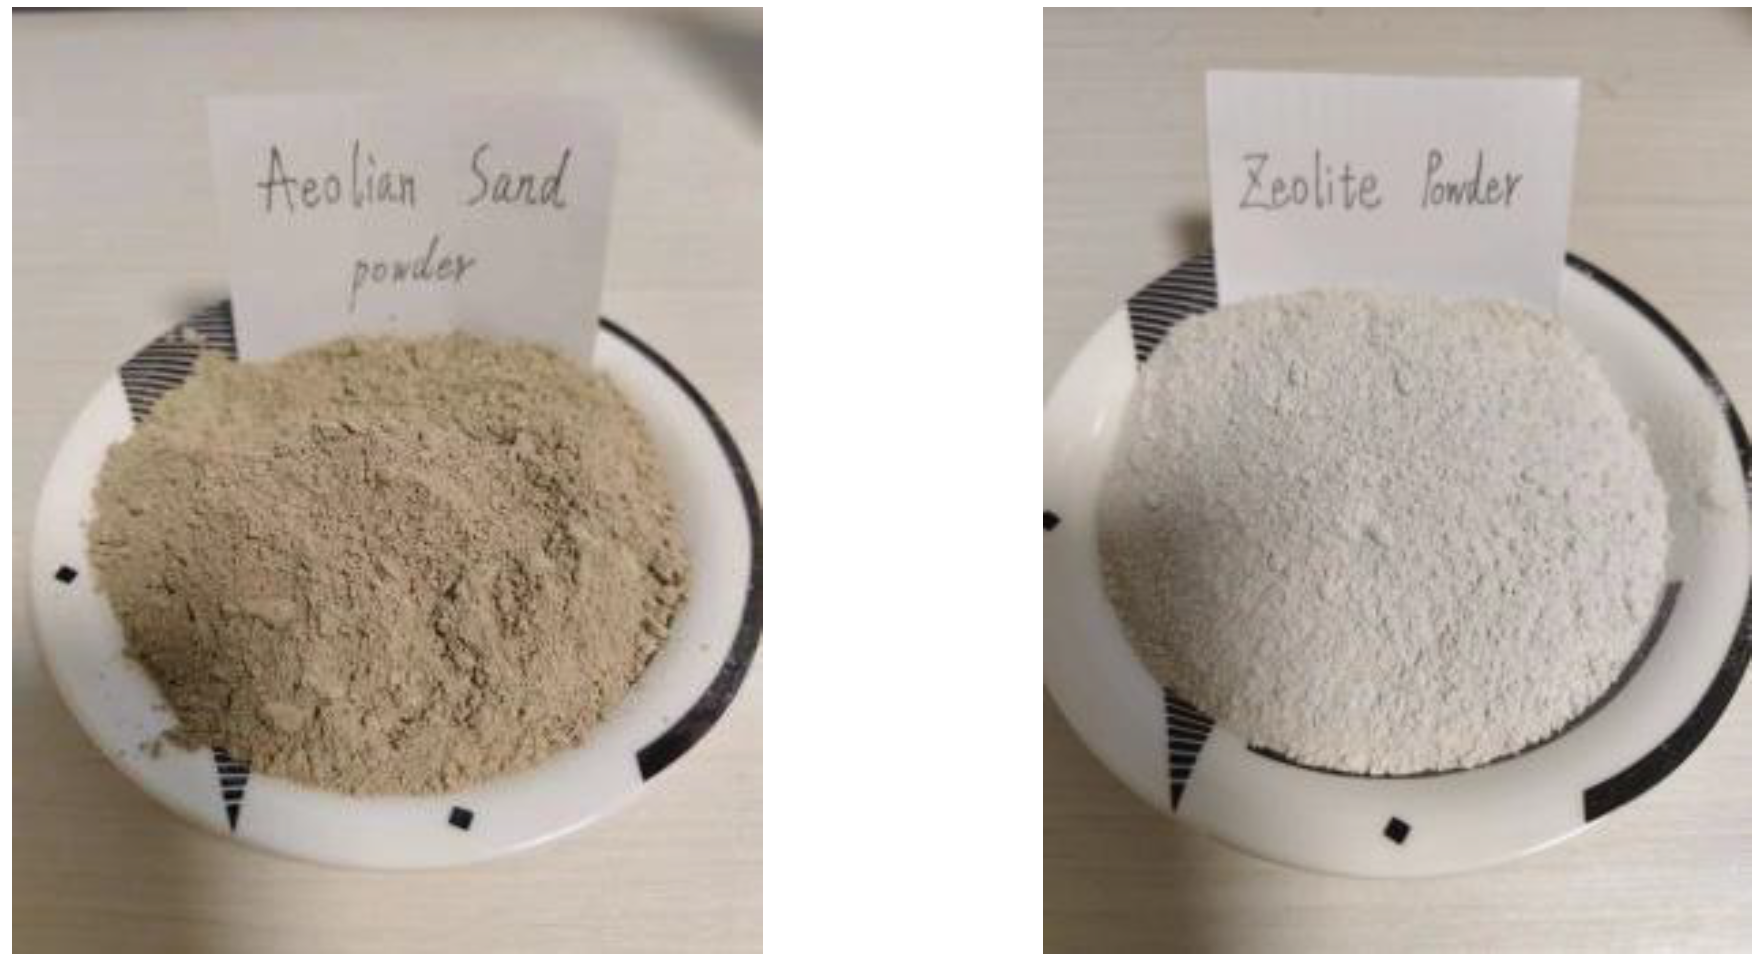
- Admixtures: the experimental admixtures used AE-11 high-efficiency air-entraining water-reducing agent produced by Shanxi Qinfen Building Materials Co. Ltd. Zeolite powder is taken from natural zeolite powder of Lingshou Dehang Mineral Products Co.The chemical compositions and particle properties of the aeolian sand powder and the ZP are shown in Table 2. Pictures of ASCP and ZP are shown in Figure 1
2.2. AAZC-4 concrete specimens
| Sample | Cement | ZP | ASP | River sand | NaOH Activator | Coarse aggregate | Water | Additives |
|---|---|---|---|---|---|---|---|---|
| (kg/m3) | (kg/m3) | (kg/m3) | (kg/m3) | (kg/m3) | (kg/m3) | (kg/m3) | (kg/m3) | |
| OC | 489.8 | 0.0 | 0.0 | 761.9 | 0 | 1777.7 | 210.6 | 3.3 |
| AAZC | 244.4 | 122.2 | 122.2 | 761.9 | 0 | 1777.7 | 210.6 | 3.3 |
| AAZC-2 | 244.4 | 122.2 | 122.2 | 761.9 | 4.88 | 1777.7 | 210.6 | 3.3 |
| AAZC-4 | 244.4 | 122.2 | 122.2 | 761.9 | 9.78 | 1777.7 | 210.6 | 3.3 |
| AAZC-6 | 244.4 | 122.2 | 122.2 | 761.9 | 14.66 | 1777.7 | 210.6 | 3.3 |

2.3. Mechanical tests
2.4. Microscopic characterization of AAZC, AAZC-2, AAZC-4 and AAZC-6
2.5. Freeze–thaw chloride-penetration experiment
3. Results and discussion
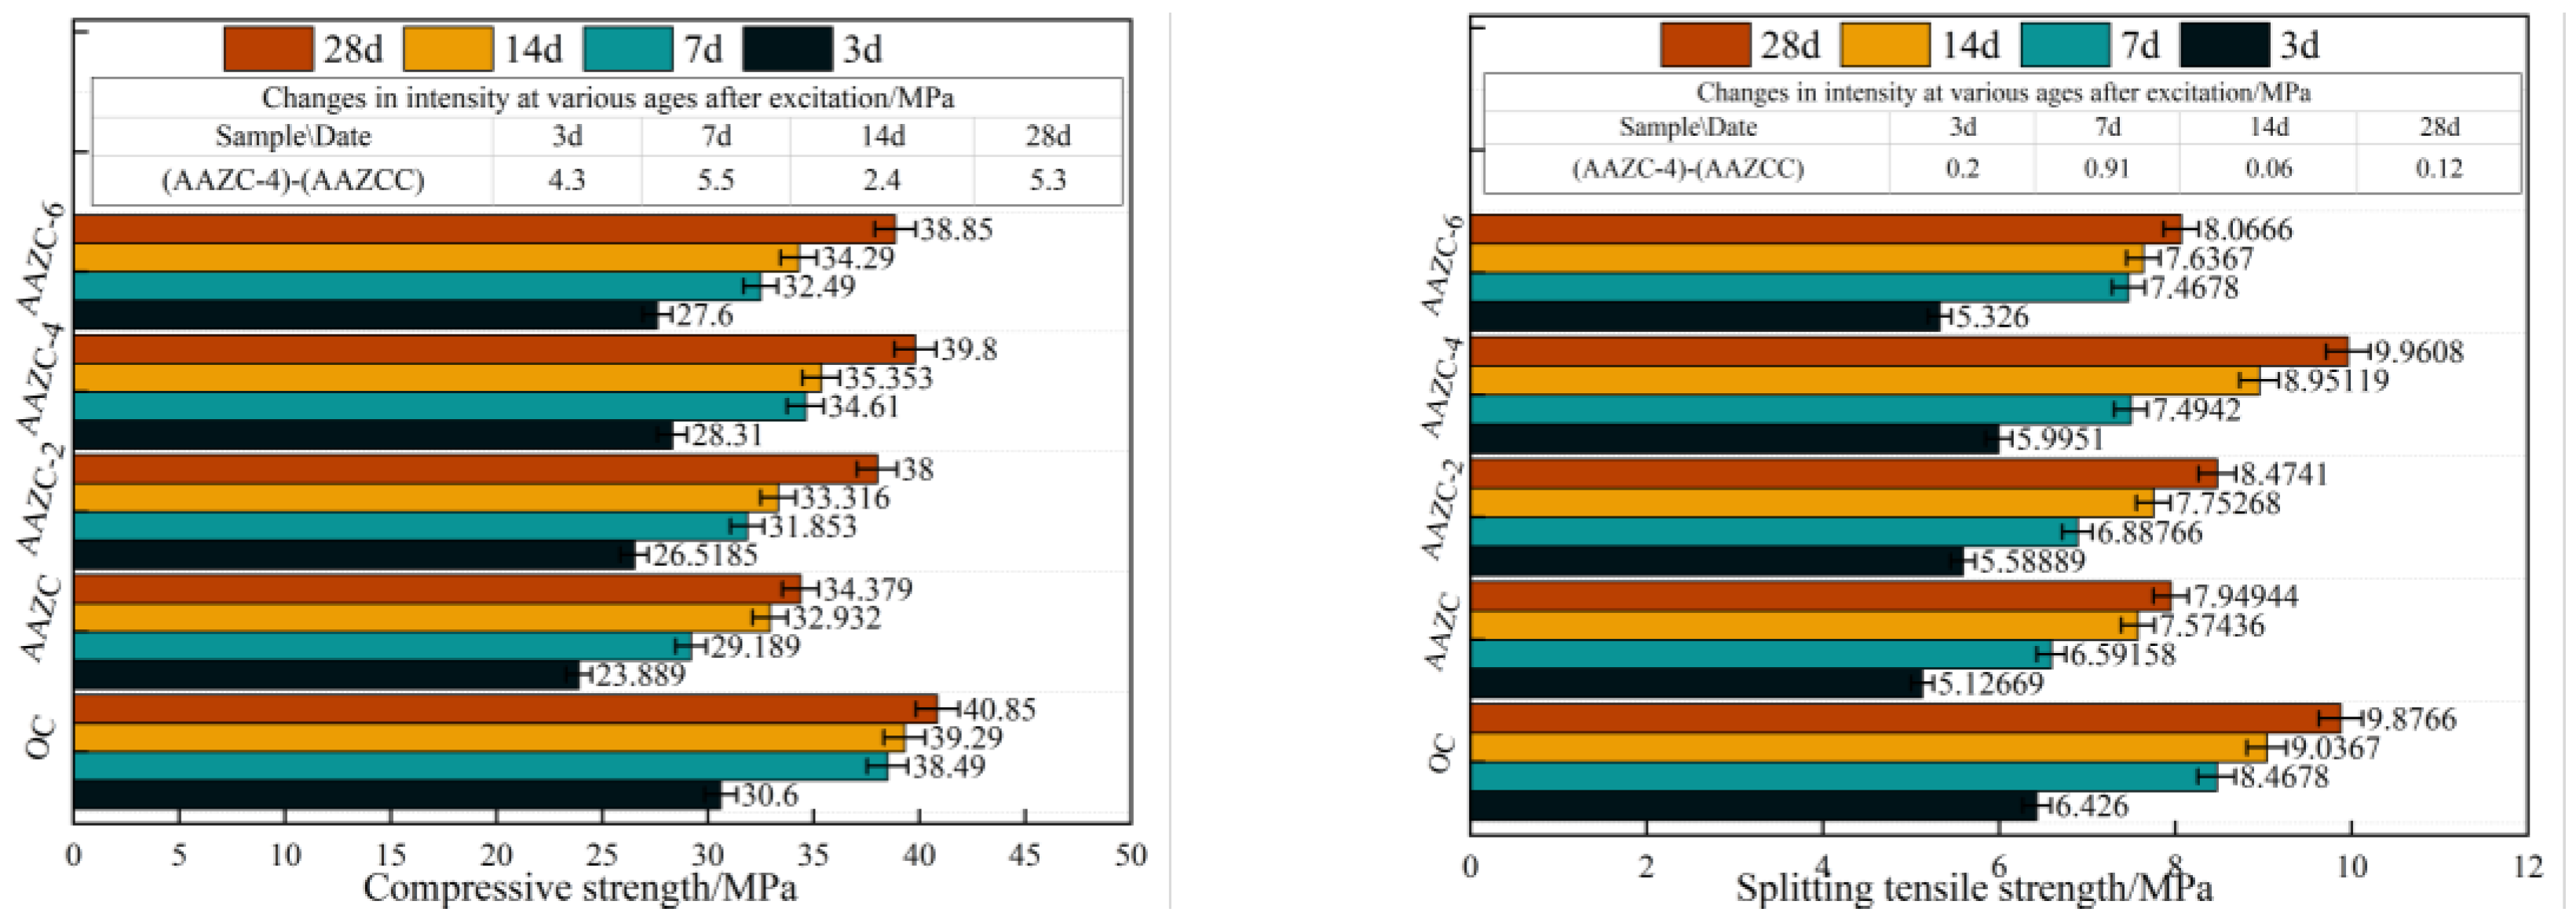
3.1. Compressive strength and tensile splitting-strength experiment
3.2. AAZC-4 characterisation
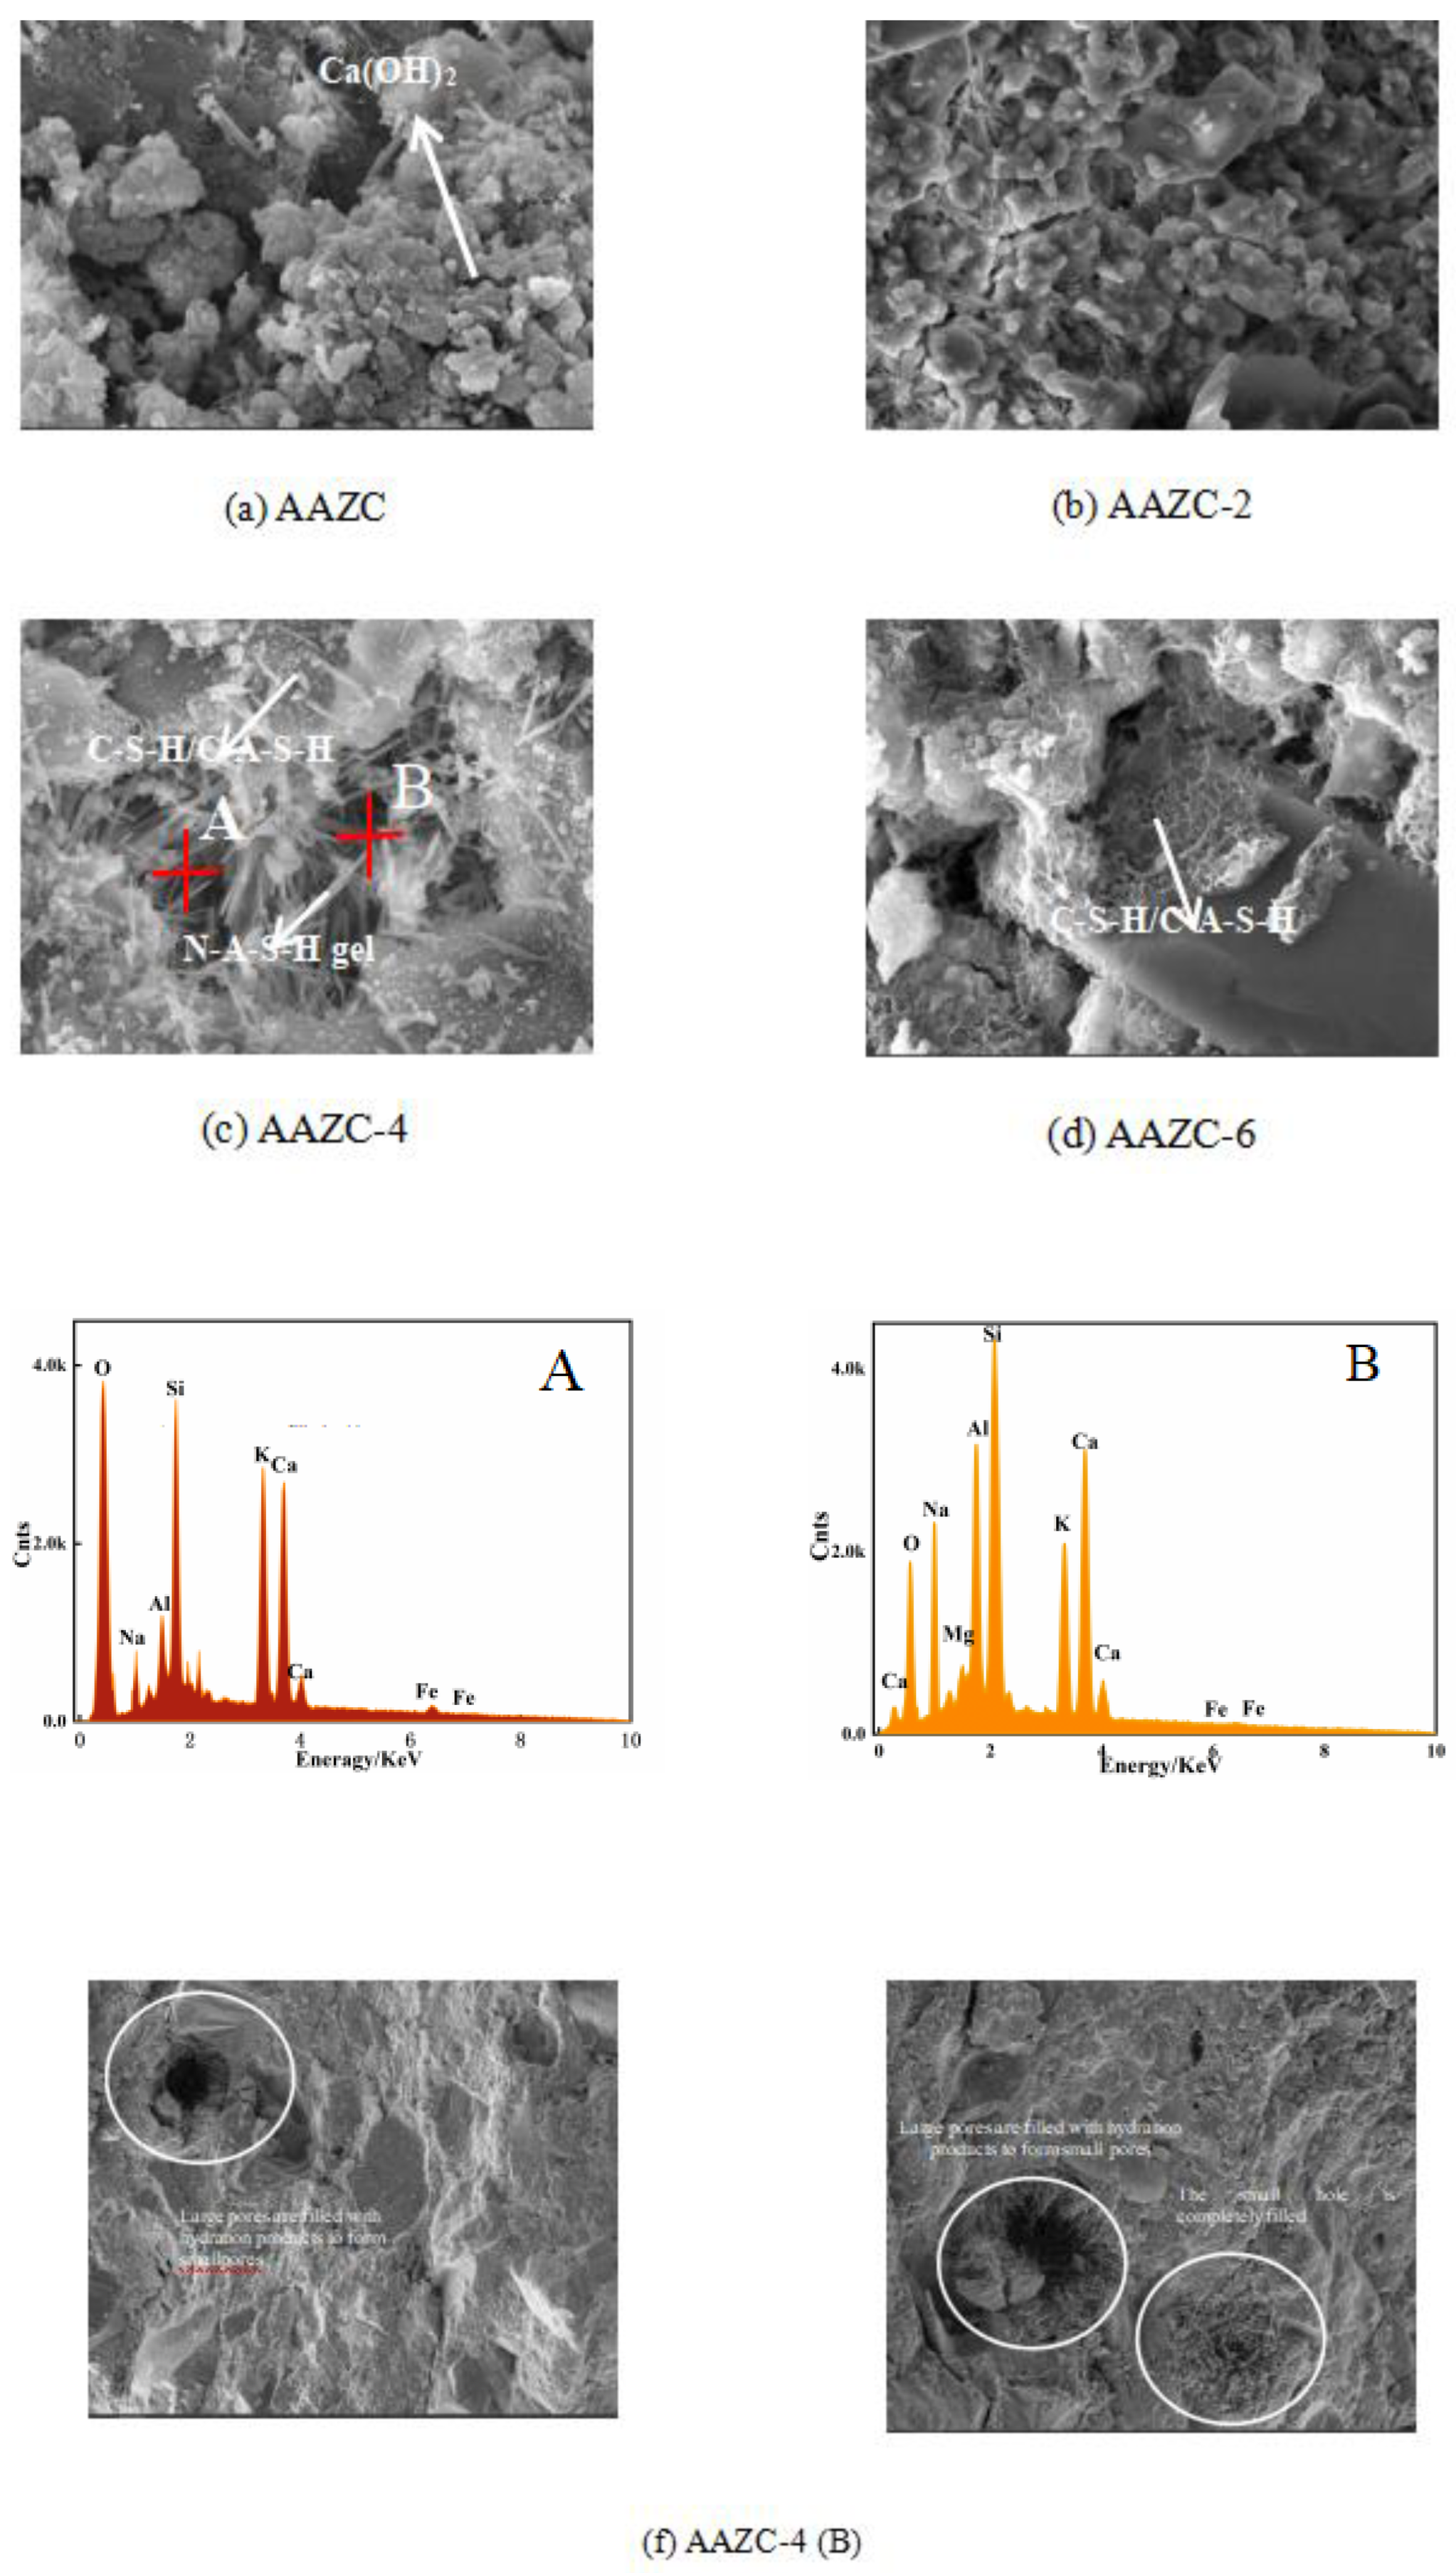
3.2.1. Surface morphology and elemental content of AAZC-4
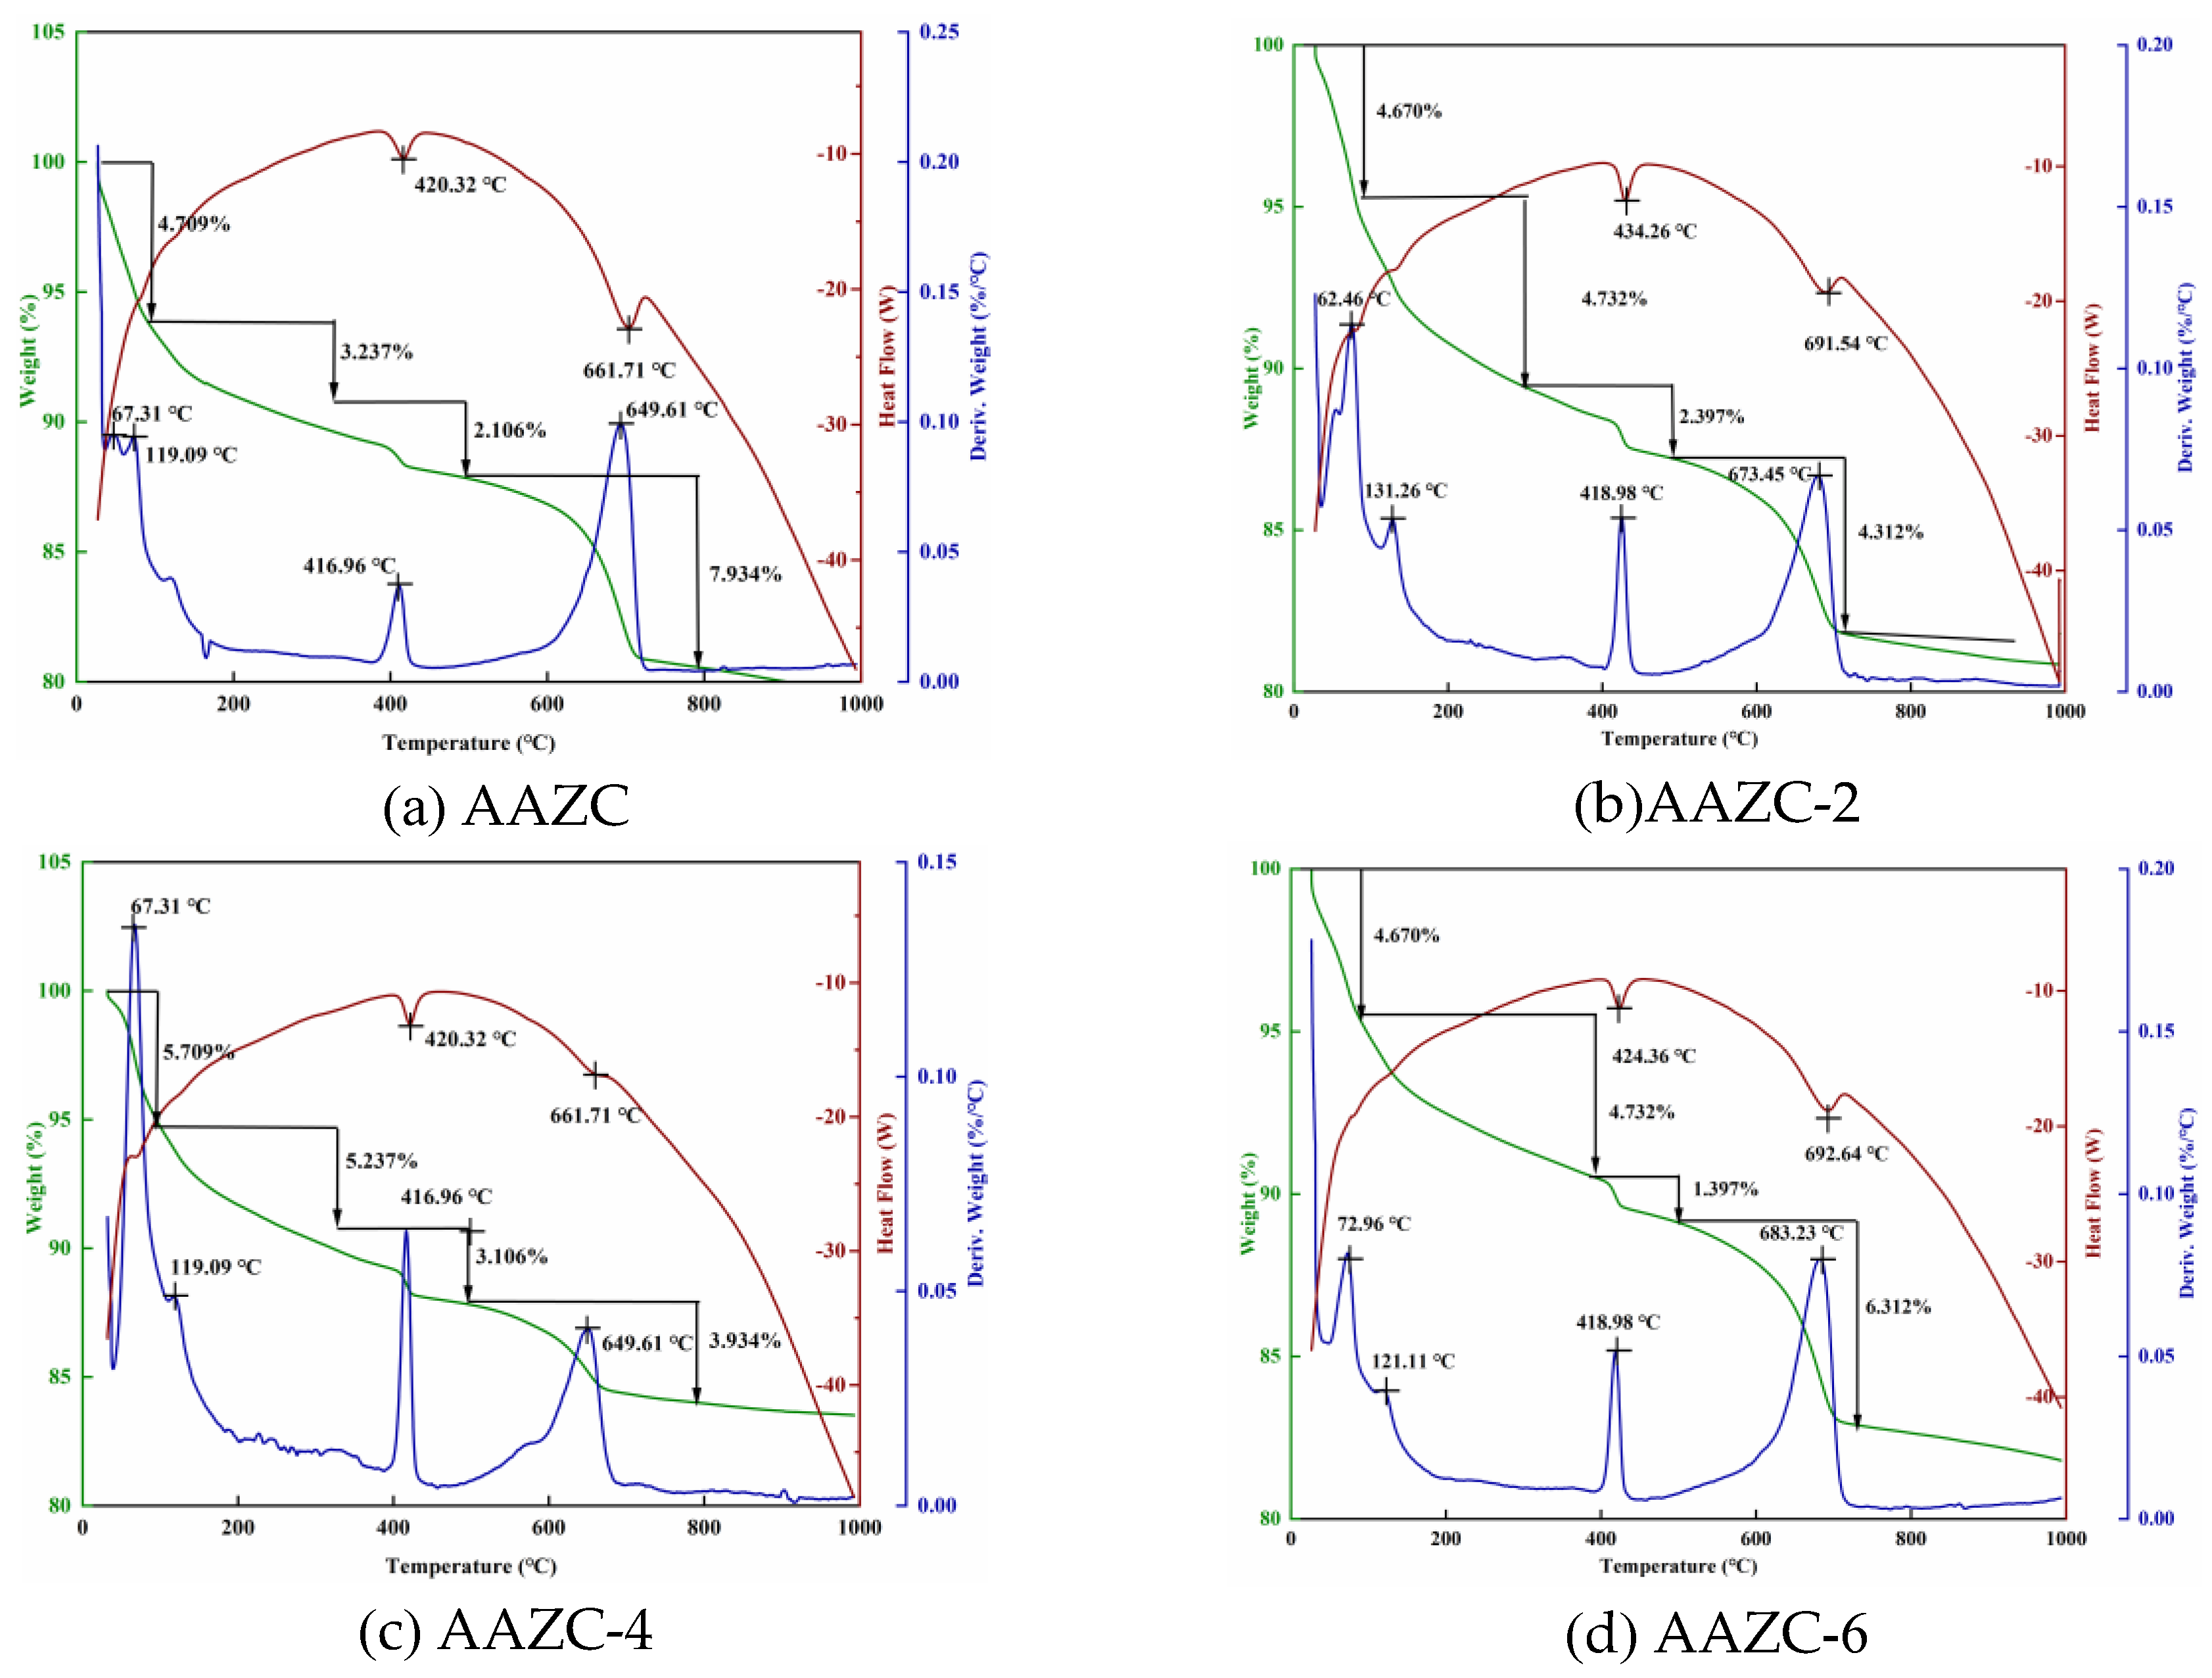
3.2.2. Thermogravimetric analysis of AAZC, AAZC-2, AAZC-4 and AAZC-6
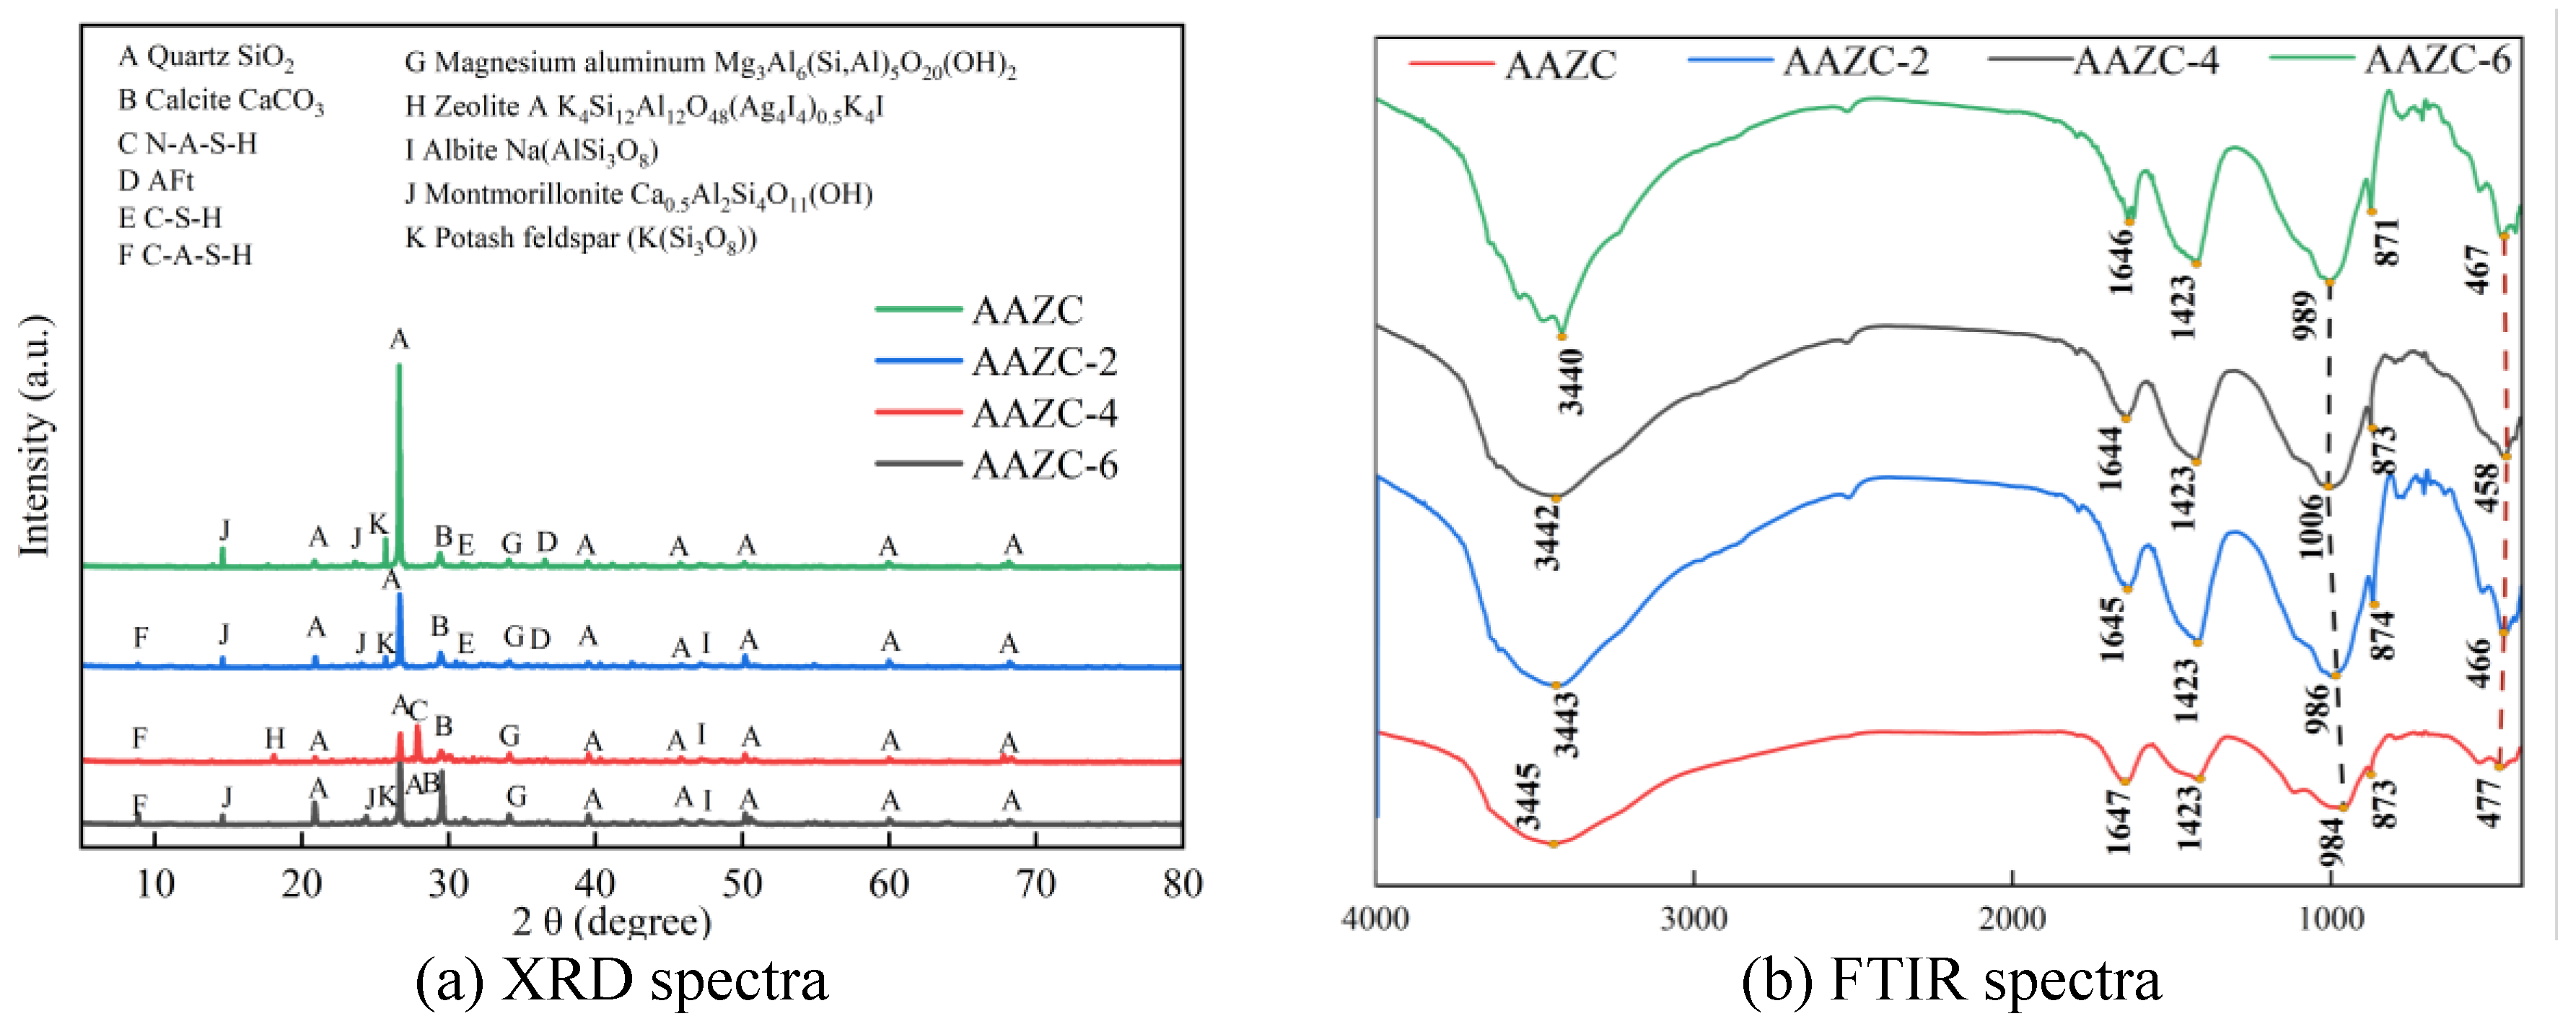
3.2.3. Phases and functional groups of AAZC-2, AAZC-4 and AAZC-6
3.2.4. NMR study of AAZC-2, AAZC-4 and AAZC-6
3.3. Mechanism of NaOH lifting for AAZC
3.4. Freeze–thaw chloride-penetration experiment
4. Conclusions
- With m(ZP):m(ASP) = 5:5 and the amount of added NaOH fixed at 4%, the most favourable eco-friendly concrete (AAZC-4) was obtained with the best mechanical properties among the alkali-treated AAZC specimens. Compared with untreated AAZC, the compressive strength of AAZC-4 increased by 22.6%, 27.5%, 19.8% and 17.2%, whereas the split tensile strength increased by 21.3%, 20.6%, 18.2% and 16.3% after curing for 3, 7, 14 and 28 d, respectively.
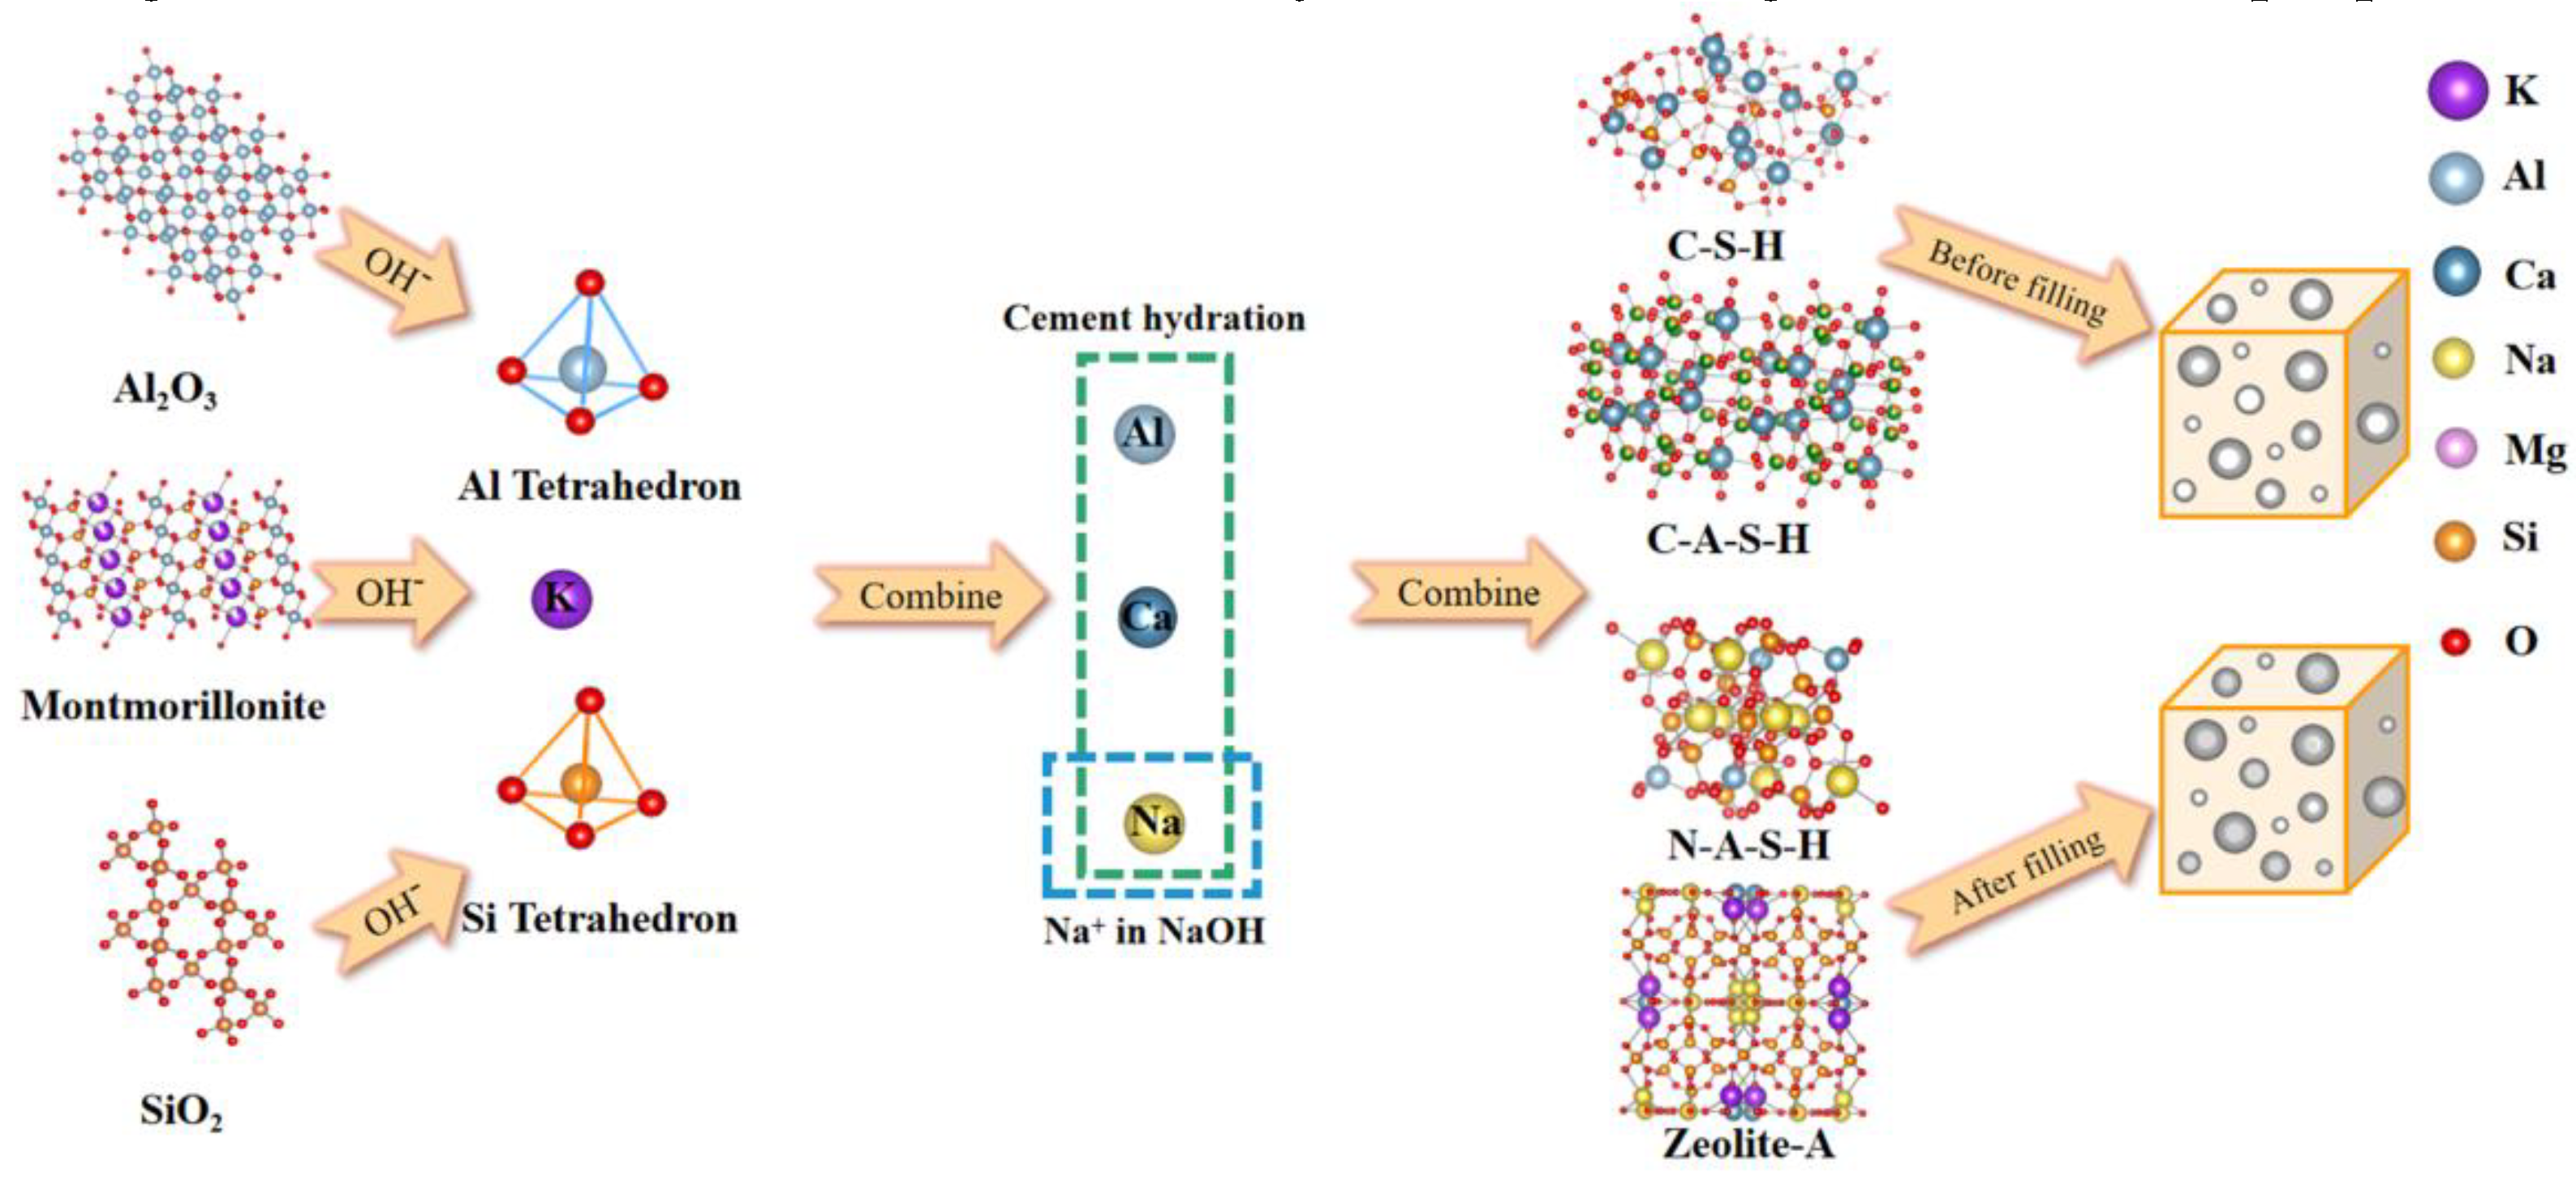
- According to SEM–EDS results, the surface of AAZC-4 produced a series of hydration products similar to those of untreated AAZC, as well as special elongated prismatic hydration products that included Ca, Si, Al, Na, K, O and Mg
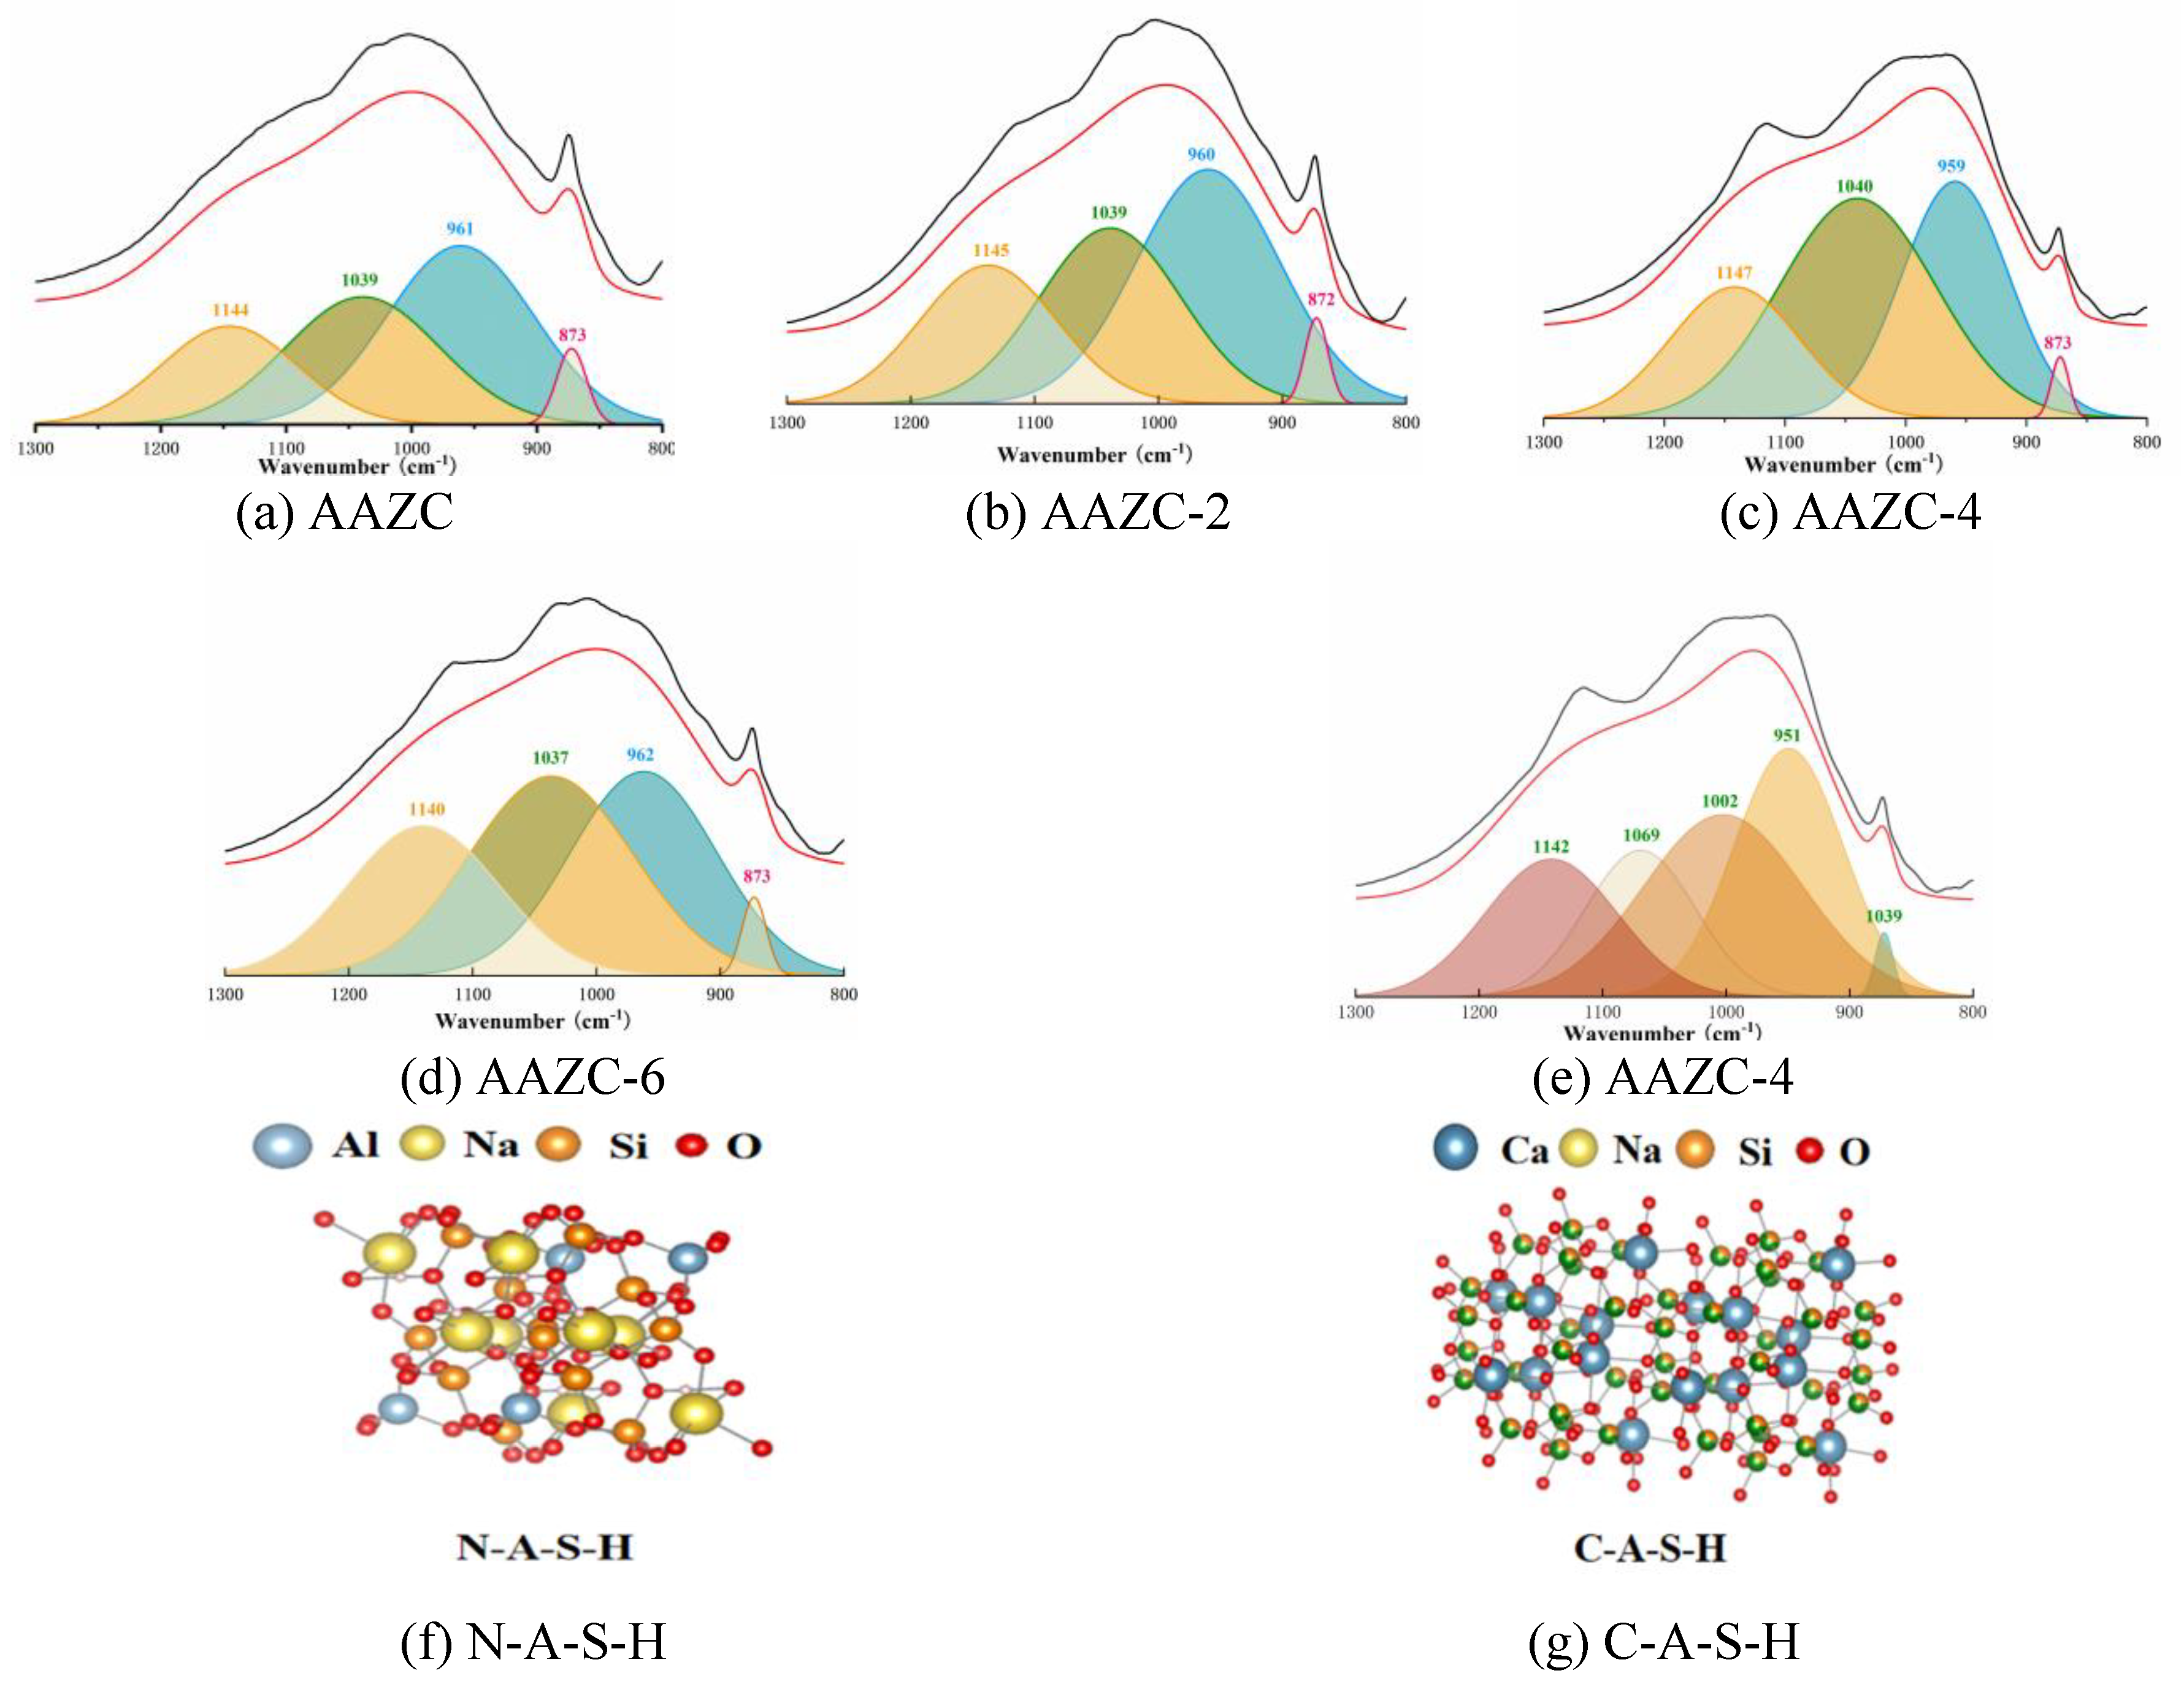
- AAZC-4 contained more stable hydration products—such as the C-S-H, C-A-S-H and N-A-S-H gels—as well as elongated prismatic A-type potassium zeolite crystals than did the other alkali-treated AAZC specimens.
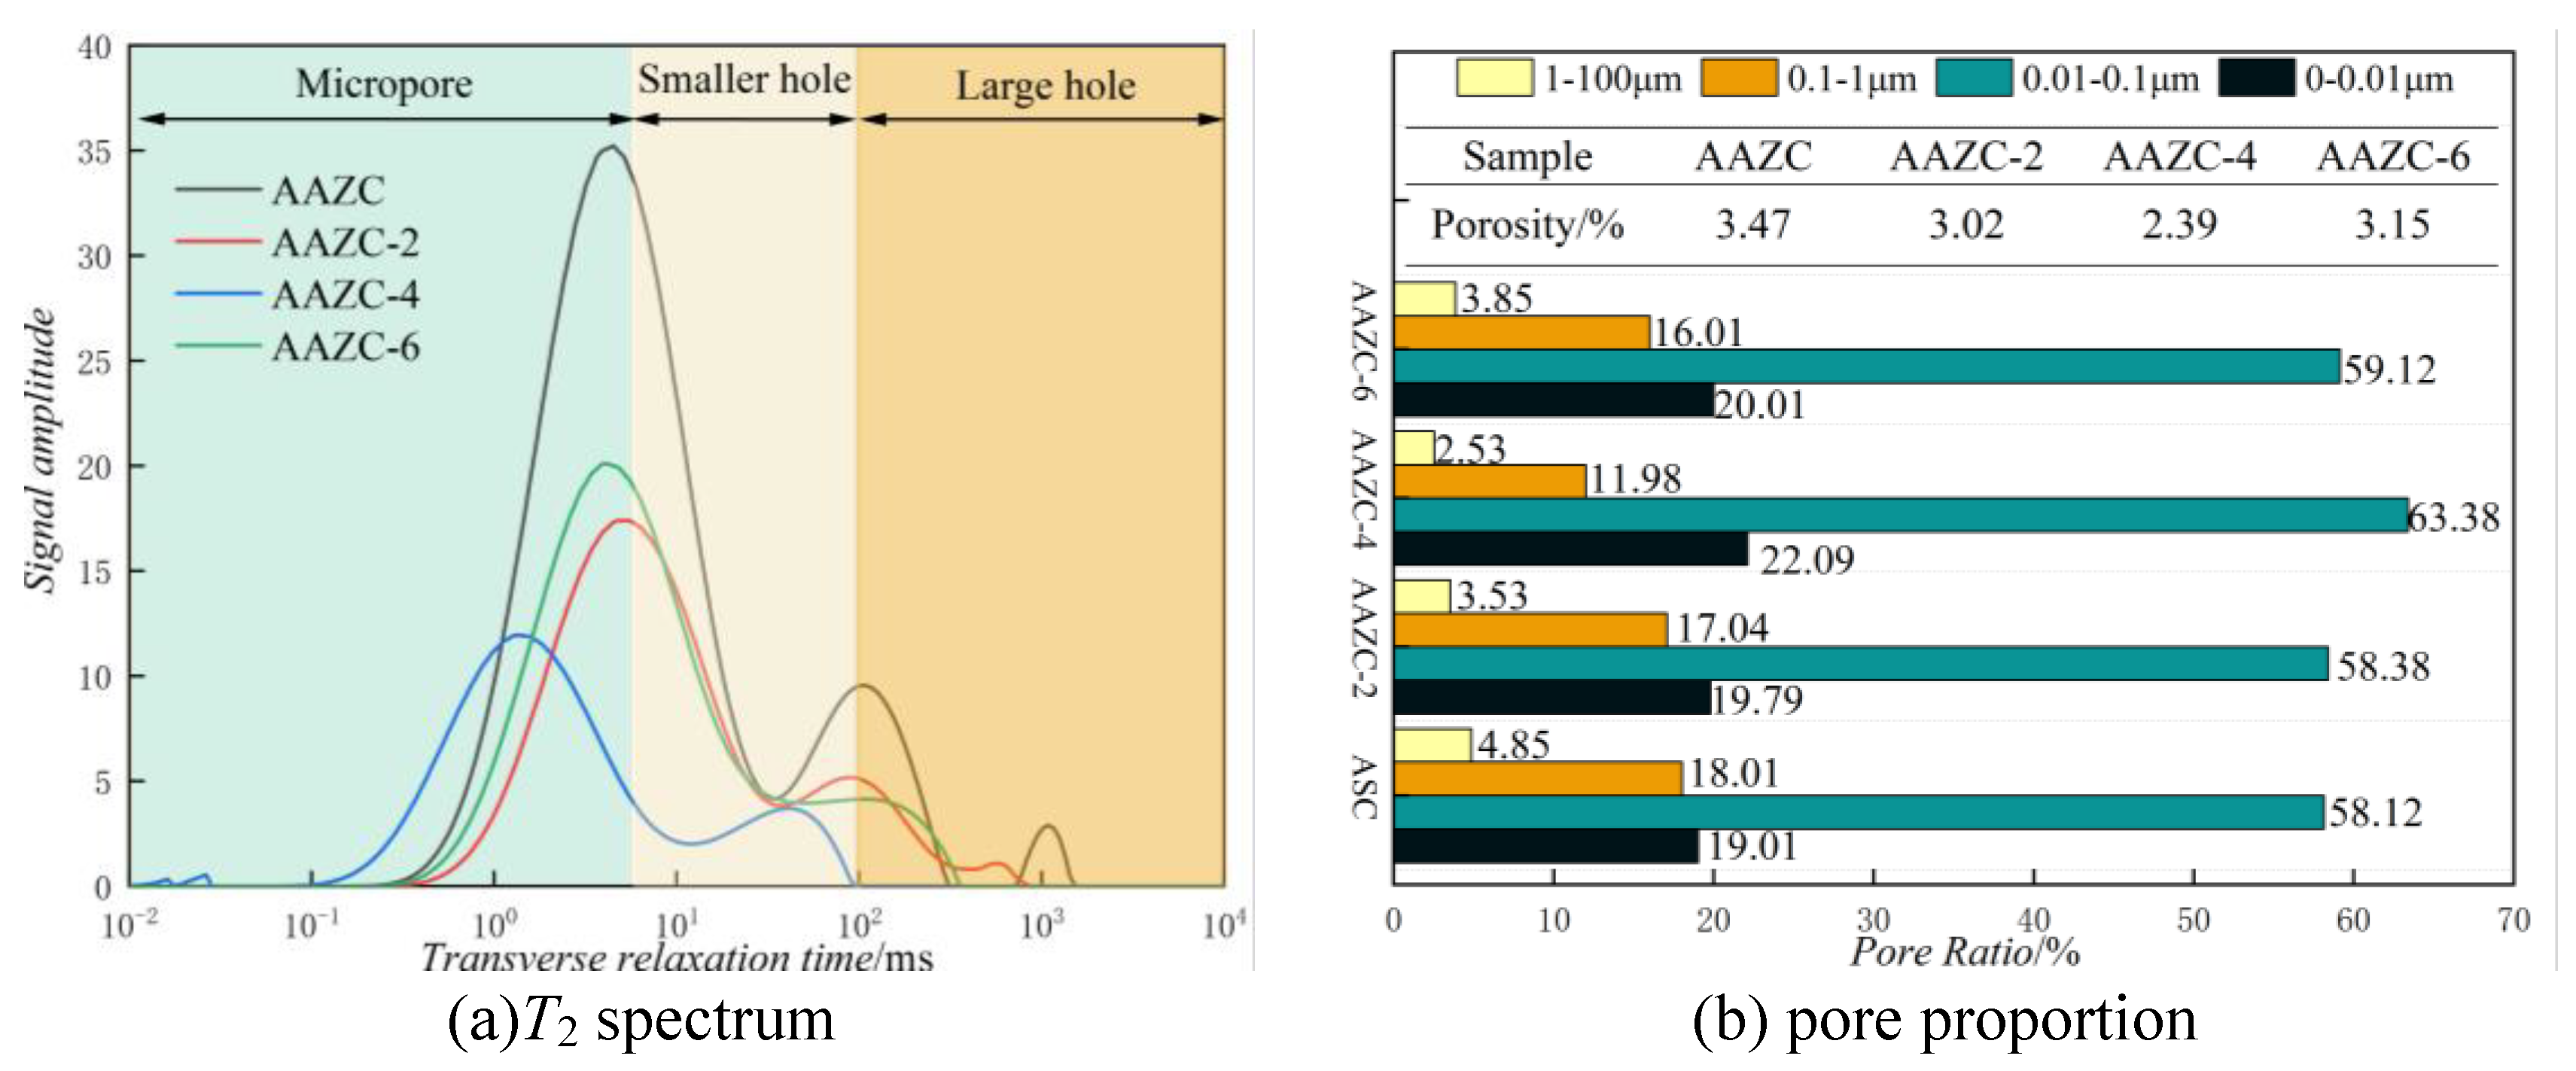
- For AAZC-4, the area of T2 considerably decreased and the deviation to the left was greater than for any of the other concrete specimens. The total porosity of AAZC-4 also decreased, with a decrease of 0.43% in the number of macropores and an increase of 0.21% in the number of harmless pores and little-damage pores. This increased the density of AAZC-4 and enhanced its mechanical properties.
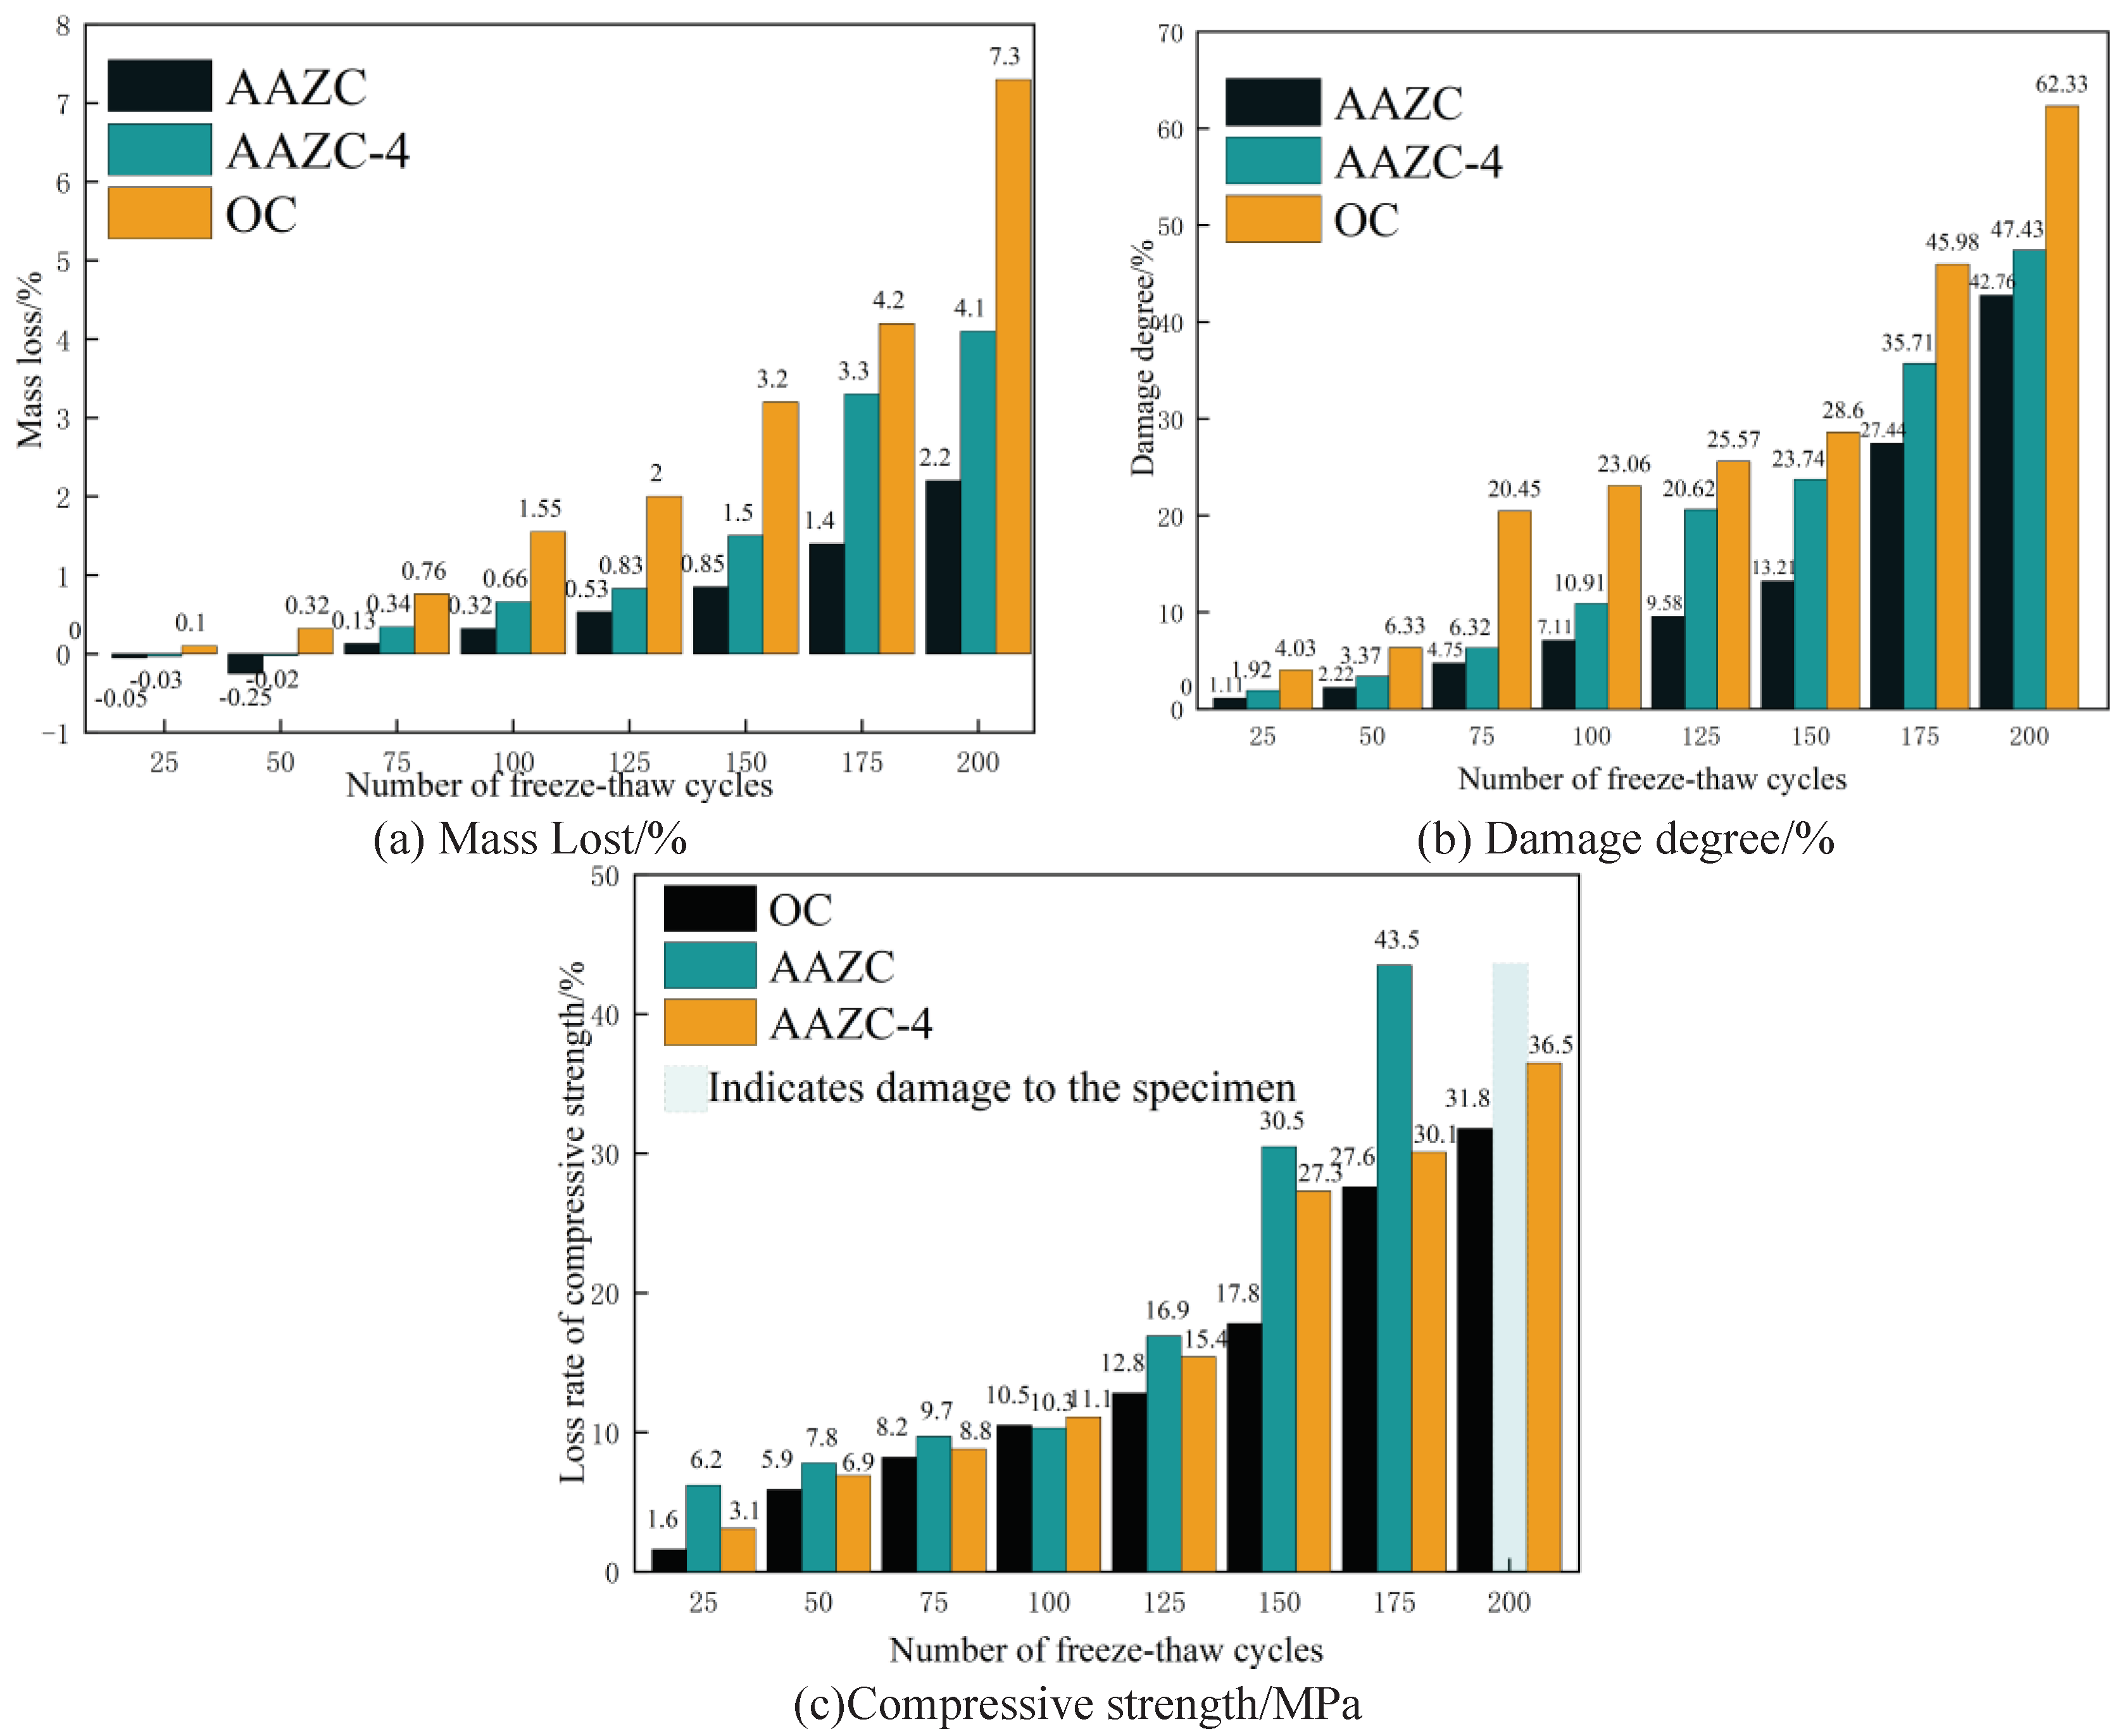
- Compared with untreated AAZC, the mass loss, degree of damage and loss of compressive strength of AAZC-4 were reduced by 36.8%, 19% and 52.1%, respectively, after 200 cycles in a composite chloride-penetration environment. These characteristics of AAZC-4 while undergoing freeze–thaw cycles are similar to those of OC. Thus, the AAZC-4 specimen had sustainable working performance in the chloride ion permeable environment in cold and arid areas.
Authorship Contributions
Funding:
Conflicts of interest
Appendix A.
References
- Chen, B. The Operation of China's Cement Economy in 2022 and Prospects for 2023 [J]. China Cement, 2023 (02): 6–10 (in Chinese).
- Zadeh A H, Mamirov M, Kim S, et al. CO2-treatment of recycled concrete aggregates to improve mechanical and environmental properties for unbound applications [J]. Construction and Building Materials, 2021, 275: 122180. [CrossRef]
- Witte A, Garg N. Quantifying the global warming potential of low carbon concrete mixes: Comparison of existing life cycle analysis tools[J].Case Studies in Construction Materials.2024,20:02832-. [CrossRef]
- Bouargane B, Laaboubi K,Biyoune M G, et al.Effective and innovative procedures to use phosphogypsum waste in different application domains: review of the environmental, economic challenges and life cycle assessment[J].Journal of Material Cycles and Waste Management. 2023, 3(25): 1288-1308. [CrossRef]
- Lu W, Li J, Qi G, et al. Preparation and properties of zeolite-fly ash-slag composite porous materials: CO2 adsorption performance and mechanical property[J].Environmental science and pollution research international. 2022, 10(30) :27303-27314. [CrossRef]
- Grzegorz L, G. Concrete Composites Based on Quaternary Blended Cements with a Reduced Width of Initial Microcracks[J].Applied Sciences. 2023, 3(12). [CrossRef]
- He Wi, Li B, Meng X, et al. Compound Effects of Sodium Chloride and Gypsum on the Compressive Strength and Sulfate Resistance of Slag-Based Geopolymer Concrete[J].Buildings. 2023, 3(13):675-675. [CrossRef]
- Wu Q, Wu S, Bu R, et al. Purification of runoff pollution using porous asphalt concrete incorporating zeolite powder[J].Construction and Building Materials. 2024, 411:134740-. [CrossRef]
- Zhu D, Wen A, Mu D, et al. Investigation into compressive property, chloride ion permeability, and pore fractal characteristics of the cement mortar incorporated with zeolite powder[J]. Construction and Building Materials. 2024, 411:134522-. [CrossRef]
- He Z, Han X, Zhang Z, et al.Volume stability and nano-scale characteristics of concrete composite containing natural zeolite[J]. Journal of Building Engineering. 2022, 59. [CrossRef]
- Li, Y. Study on the positive coupling effect of zeolite powder and fly ash compounding on the properties of windlogged concrete[D]. Inner Mongolia Agricultural University, 2023. 001320. (in Chinese).
- Guan L W, Yu Y, Wang Q Y, et al. Experimental study on the effect of zeolite powder on the properties of self-compacting concrete[J]. Building Structure,2019,49(S2): 626-629. (in Chinese). [CrossRef]
- Li G F, Xiang dong S, Yu xiao Z, et al. Analysis of the improvement of frost resistance of concrete by adding aeolian sand powder based on microscopic characteristics [J]. Journal of Agricultural Engineering, 2018, 34 (8): 8. (in Chinese). [CrossRef]
- Ou Z, Dong X F. Effect of Aeolian Sand Powder Addition on Frost Resistance of Concrete Pavement[J].International Journal of Analytical Chemistry, 2022,20225087896-5087896. [CrossRef]
- John S K, Nadir Y, Girija K. Effect of source materials, additives on the mechanical properties and durability of fly ash and fly ash - slag geopolymer mortar: A review[J]. Construction and Building Materials, 280 [2023 – 08 - 14]. [CrossRef]
- Soroush R, Seyed A E A,Ramin T M, et al.Multi-level assessment of TiO2/graphene-modified molybdenum slag/bauxite-based alkali-activated composites mechanical, microstructural, and self-cleaning performances[J].Construction and Building Materials. 2024, 417:135256-. [CrossRef]
- Sani H, Pitcha J, Kantipok H, et al. Multiscale investigation of the impact of recycled plastic aggregate as a fine aggregate replacement on one-part alkali-activated mortar performance[J]. Journal of Building Engineering. 2024, 86: 108768-. [CrossRef]
- Xiong Y, Zhang Z, Huo Binbin, et al. Uncovering the influence of red mud on foam stability and pore features in hybrid alkali-activated foamed concrete[J]. Construction and Building Materials. 2024, 416:135309-. [CrossRef]
- Wang A G, Sun D S, Hu P H, et al. Experimental study on the preparation of geopolymer cement from alkaline activated metakaolin [J]. Journal of Hefei University of Technology: Natural Science Edition, 2008, 31 (4): 5, 617-621. (in Chinese).
- Bondar D, Lynsdale C J, Milestone N B, et al. Effect of type, form, and dosage of activators on strength of alkali-activated natural pozzolans[J]. Cement & Concrete Composites, 2011, 33 (2): 251-260. [CrossRef]
- He S B, Xue G, Kong H N. Zeolite powder addition to improve the performance of submerged gravitation-filtration membrane bioreactor[J]. Journal of Environmental Sciences, 2006, 18(2): 242 - 247.
- Hongwei J, Naiqian F, Enyi C.Study on the suppression effect of natural zeolite on expansion of concrete due to alkali-aggregate reaction[J]. Magazine of Concrete Research, 1998, 50(1): 17-24. [CrossRef]
- Naiqian F, Tingyu H.Mechanism of natural zeolite powder in preventing alkali—silica reaction in concrete [J]. Advances in Cement Research, 1998, 10(3): 101-108. [CrossRef]
- Li G, F. Research on durability performance and service life prediction modeling of wind-deposited sand powder concrete [D]. Inner Mongolia Agricultural University, 2020. (in Chinese).
- John S K, Nadir Y, Girija K. Effect of source materials, additives on the mechanical properties and durability of fly ash and fly ash - slag geopolymer mortar: A review[J]. Construction and Building Materials, 280 [2023 – 08 - 14].
- Grutzeck A P W.Alkali-activated fly ashes A cement for the future[J].Cement and Concrete Research, 1999, 29(8), 1323 - 1329.
- Duxson P, Provis J L, Lukey G C,et al. Understanding the relationship between geopolymer composition, microstructure and mechanical properties [J]. Colloids & Surfaces A Physicochemical & Engineering Aspects, 2005, 269(1 - 3): 47 - 58.
- Davidovits J.Geopolymers and geo - polymeric materials[J]. Journal of thermal analysis, 1989. 35 (2): 429-441.
- Wang A G, Sun D S, Hu P H, et al. Experimental study on the preparation of geopolymer cement from alkaline activated metakaolin [J]. Journal of Hefei University of Technology: Natural Science Edition, 2008, 31 (4): 5, 617-621. (in Chinese).
- Li Y, Wang H, Wei L, et al. The Impact of NaOH on the Micro-Mechanical Properties of the Interface Transition Zone in Low-carbon concrete[J]. Materials, 2024, 17(1): 258. [CrossRef]
- Provis J, L. Alkali-activated materials[J]. Cement and concrete research, 2018, 114: 40-48. [CrossRef]
- Hassan A, ElNemr A, Goebel L, et al. Effect of hybrid polypropylene fibers on mechanical and shrinkage behavior of alkali-activated slag concrete[J]. Construction and Building Materials, 2024, 411: 134485. [CrossRef]
- Guo H, Wang H, Li H, et al. Effect of whisker toughening on the dynamic properties of hybrid fiber concrete[J]. Case Studies in Construction Materials, 2023, 19: e02517. [CrossRef]
- Li H, Guo H, Zhang Y. Deterioration of concrete under the coupling action of freeze–thaw cycles and salt solution erosion[J]. Reviews on Advanced Materials Science, 2022, 61(1): 322-333. [CrossRef]
- GUO Haolong. Experimental study on mechanical properties and durability of whisker toughened hybrid fiber concrete[D]. Inner Mongolia Agricultural University, 2022. 000842. (in Chinese). [CrossRef]
| Chemical composition (%) | Physical–mechanical properties | |||||||||||
|---|---|---|---|---|---|---|---|---|---|---|---|---|
| SiO2 | Al2O3 | CaO | Fe2O3 | MgO | SO3 | other | Setting time (min) | Compressive strength (MPa) | Flexural strength (MPa) | |||
| Initial | Final | 3 d | 28 d | 3 d | 28 d | |||||||
| 21.42 | 5.43 | 63.64 | 3.04 | 2.82 | 2.17 | 1.69 | 180 | 395 | 24.8 | 48.9 | 5.0 | 8.1 |
| Powder | Chemical composition (%) | Particle characteristics | |||||||||
|---|---|---|---|---|---|---|---|---|---|---|---|
| SiO2 | Al2O3 | CaO | Fe2O3 | K2O | other | volume mean diameter (μm) |
Specific surface area (m2/kg) | D50 (μm) |
D98 (μm) |
||
| ASP | 68.5 | 12.1 | 7.31 | 4.4 | 2.51 | 5.18 | 13.56 | 994.72 | 7.26 | 67.97 | |
| Z P | 73.4 | 11.91 | 2.16 | 1.86 | 3.14 | 7.53 | 20.44 | 594.91 | 13.19 | 91.16 | |
Disclaimer/Publisher’s Note: The statements, opinions and data contained in all publications are solely those of the individual author(s) and contributor(s) and not of MDPI and/or the editor(s). MDPI and/or the editor(s) disclaim responsibility for any injury to people or property resulting from any ideas, methods, instructions or products referred to in the content. |
© 2024 by the authors. Licensee MDPI, Basel, Switzerland. This article is an open access article distributed under the terms and conditions of the Creative Commons Attribution (CC BY) license (http://creativecommons.org/licenses/by/4.0/).


