Preprint
Article

Genetic Diversity and Population Structure of the Invasive Oriental Fruit Fly, Bactrocera dorsalis (Diptera: Tephritidae) in Burkina Faso

Altmetrics

Downloads

139

Views

59

Comments

0

A peer-reviewed article of this preprint also exists.

Submitted:

29 February 2024

Posted:

01 March 2024

You are already at the latest version

Alerts
Abstract
Bactrocera dorsalis Hendel is a highly invasive horticultural pest of major economic importance worldwide. In Burkina Faso, it is one of the main insect pests constraining the mango production and export. Understanding the biology and the genetic dynamics of this insect pest provide cru-cial information for the development of effective control measures. The aim of this study was to understand the distribution, diversity and genetic structure of B. dorsalis in Burkina Faso. Male flies were collected transversally in Burkina Faso and analyzed by PCR using 10 microsatellite markers. The results showed an abundance of B. dorsalis varying from 87 to 2986 flies per trap per day in the different sampling sites. Genetic diversity was high in all sites with an average Shan-non's Information Index (I) of 0.72 per site. Gene flow was high between study populations and ranged from 10.62 to 27.53 number of migrants. Bayesian admixture analysis showed no evi-dence of structure while Discriminant Analysis of Principal Components identified three weakly separated clusters in the population of B. dorsalis in Burkina Faso. The results of this study could be used to optimize the effectiveness of current control interventions and to guide the imple-mentation of new, innovative and sustainable strategies.
Keywords: 
Subject: Biology and Life Sciences  -   Ecology, Evolution, Behavior and Systematics

1. Introduction

Tephritidae family includes fruit flies of major economic importance worldwide [1,2,3]. They are among the main insect pests of horticulture due to their life cycle being dependent on host plants, which provide breeding grounds and sources of nutrients for the development of the larvae [2,4,5]. They are responsible for huge economic losses in the countries affected, due to crop losses [1,6]. The most damaging fruit fly species belong to the following genera: Anastrepha, Bactrocera, Ceratitis, Dacus, Rhagoletis and Zeugodacus [3]. The genus Bactrocera comprises around 460 species organized into subgroups, including the Bactrocera dorsalis complex [7,8].
The Bactrocera dorsalis s.l. complex comprises around a hundred morphologically similar species. Most are economically less important, with the exception of B. dorsalis (Hendel), commonly known as the oriental fruit fly. Bactrocera dorsalis (Hendel) and its synonymous species such as B. papayae Drew & Hancock, B. philippinensis Drew & Hancock and B. invadens Drew, Tsuruta & White, are notorious insect pests, highly polyphagous, with over 250 host plant species, and extremely invasive. They are particularly fecund and highly resilient to environmental stresses [3,5,9,10].
Bactrocera dorsalis (Hendel) has a worldwide distribution. Its presence in Africa was detected in Kenya in 2003 and it was first described as B. invadens [11], a species closely related to B. dorsalis, as were B. philippinensis, described in the Philippines, and B. papayae, described in Thailand, Malaysia and Indonesia [12,13,14]. B. dorsalis has now spread throughout sub-Saharan Africa, where its capacity for invasion and destruction has made it the main insect pest of the horticultural sector, with damage estimated at nearly US$2 billion per year [15,16,17,18].
In Burkna Faso, B. dorsalis was detected for the first time in 2005 [1,15,19]. It is now the main problem in the fruit sector, affecting a dozen cultivated and/or wild host plants, the main ones being mango (Mangifera indica) and shea (Vitellaria paradoxa). The damage to mangoes is much more significant, with crop losses of up to 100% in some orchards, and quarantine measures affecting the export of fruit from infested countries, contributing to significant economic losses [1,19].
The control of B. dorsalis is essentially based on the use of chemical pesticides, which unfortunately pollute the environment, affecting the food chain and the well-being of humans. Furthermore, these pesticides are nowadays inefficient due to resistance problems developed by insect pests [16,18]. Eco-friendly techniques such as sterile insect techniques (SIT), entomopathogenic fungi, parasitoids and predatory ants have been adopted in control programs [16,20,21]. Unfortunately, these resources are limited by their cost, accessibility and/or the complexity of their implementation.
Recent advances in genetic engineering have led to the emergence of innovative tools for controlling insect pests. Genetic control appears to be a promising technology, based on the introduction of genetic traits aimed to interfere with the ability of insects to develop or reproduce thereby suppressing their populations [22]. These new technologies are potentially more species-specific, accessible, non-polluting, easy to deploy and applicable on a larger scale compared to existing methods [23,24]. However, effective control of insect pests, especially through genetic control strategies, would require an understanding of genetic diversity, genetic structure and gene flow within target populations [23,25,26].
Microsatellites are genetic markers of nuclear origin that are non-coding, codominant and highly polymorphic. They are composed of short nucleotide sequences repeated in tandem, distributed throughout the eukaryotic genome, and are powerful tools for the genetic analysis of natural populations [20,27]. In this study, we exploited the potential of microsatellite markers to elucidate the genetic diversity, gene flow and genetic structure of B. dorsalis populations in Burkina Faso.

2. Materials and Methods

2.1. Sample Collection

Adult flies Bactrocera dorsalis were collected in Burkina Faso in July 2021, in three types of plant formations including mango orchards (MO), shea agroforestry parks (SAP), and natural formations (WLD). Sampling was carried out in seven different sites, including Comoé (CMOE) in the Cascades region, Boulkiemdé-Sanguié (BK-SG), Sissili (SSLI) in the Centre-Ouest region, Kénédougou (KNDG), Houet (HOUET) in the Hauts-Bassins region, Bougouriba (BGRB) and Poni (PONI) in the Sud-Ouest region (Figure 1). Two Tephri traps, implemented with a sex attractant specific to B. dorsalis males, the Methyl-eugenol (ME) and an insecticide, the Dichlorvos or 2,2-dichlorovinyl dimethyl phosphate (DDVP), were placed in each plant formation at intervals of 100 m radius, for 24h of exposure. All the flies collected were identified morphologically under the microscope using the taxonomic identification keys available [12,28], then counted and conserved in 80% ethanol for molecular analysis.

2.2. Molecular Analyses

DNA was extracted from 315 male flies including 45 individuals randomly selected per site, using DNAzol (invitrogen, Thermo Fisher Scientific) according to the manufacturer's instruction. The final product was collected in 100 mL EDTA and stored at -80°C for further analyses. Ten microsatellite markers including Bd15, Bd19, Bd85b, Bi1, Bi5, Bi8, Bi10, MS3, MS4 and MS12A [5,29,30] were analyzed in this study. PCRs were performed in a total volume of 25 µL using a modified protocol of Yi et al. (2016) [31]. Briefly, the PCR mix consisted of 6 µL of the FIREPol Master Mix, 1.5 µL of each primer, 14 µL of H2O and 2 µL of the DNA template. Amplifications were performed with the Thermo Fisher 5020 Arktik PCR Thermal Cycler using the following program: initial denaturation at 94°C for 3 min followed by 35 cycles of 94°C for 30 s, 56-61°C for 30 s, and 72°C for 45 s, final extension at 72°C for 5 min and final storage at 4°C. PCR products were migrated onto a 3% agarose gel and bands were analyzed using the Benchtop UV Transilluminator 2UV.

2.3. Data Analysis

2.3.1. Flies Abundance and Genetic Diversity Analysis

Different softwares were used to analyze the data from this work. The R version 4.3.0 software was used in the R-studio environment to analyze the B. dorsalis abundance in Burkina Faso by calculating the density of flies per trap per day (FTD). GenAlEx version 6.51b2 [32] was used to summarize the statistical genetics by calculating the number of different alleles (Na), effective number of alleles (Ne), Shannon's Information Index (I), observed heterozygosity (Ho), expected heterozygosity (He), total expected heterozygosity (Ht), unbiased expected heterozygosity (uHe), fixation index (F) for each locus in the whole population, and for each sub-population. Then it was used to determine Wright's fixation indexes (Fis, Fit and Fst) and gene flow as number of migrants (Nm) according to each locus in the total population.

2.3.2. Analysis of Genetic Relations between Sampling Populations

GenAlEx version 6.51b2 was also used to estimate genetic differences through analysis of molecular variance (AMOVA), genetic differentiation index (Fst) and gene flow between population pairs as number of migrants (Nm). The software R version 4.3.0 was used for the analysis of Nei's genetic distance [33] between pairs of populations.

2.3.3. Analysis of Genetic Structure

The genetic structure of B. dorsalis populations in Burkina Faso was analyzed using inferential methods such as Bayesian admixture and discriminant analysis of principal components (DAPC) [34].
STRUCTURE software version 2.3.4 was used for the Bayesian admixture analysis. Ancestral genotypic proportions were inferred by considering a number of clusters (K) varying from 1 to 10 with 10 independent replications for each value of K, setting the burn-in period to 50,000 iterations, and considering 100,000 Markov Chain Monte Carlo (MCMC) for each value of K. The expected value of K was determined according to the method of Evanno et al. (2005) using the Structure Harvester platform developed by Earl et al. 2012 [35,36]. The graphical representation of the analysis was generated using STRUCTURE Bar plot [37].
Discriminant Analysis of Principal Components (DAPC) was used to infer genetic relationships between individuals using the adegenet package version 2.1.10 in R version 4.3.0 software. The reproducibility of the analysis results was ensured by setting the random number value to 123 using the set.seed() function. The cross-validation approach through the xvalDapc() function and numerical parameters such as the number of principal components (PCs) achieving highest mean success and the number of PCs achieving lowest root mean squared error (RMSE) were used to determine the optimal number of PCs to retain in the analysis. Missing values in the data were replaced by the mean of the non-missing values. The number of clusters in the Bactrocera dorsalis population in Burkina Faso was determined from the find.clusters() function using the Bayesian Information Criterion (BIC). The number of discriminant functions was determined from the graph of discriminant analysis eigenvalues. The final population structure graph for B. dorsalis in Burkina Faso was generated from the number of PCs and the number of associated discriminant functions, by scatter plotting axis 1 against axis 2.

3. Results

3.1. Abundance and Diversity

3.1.1. Abundance of Bactrocera Dorsalis Pests in Burkina Faso

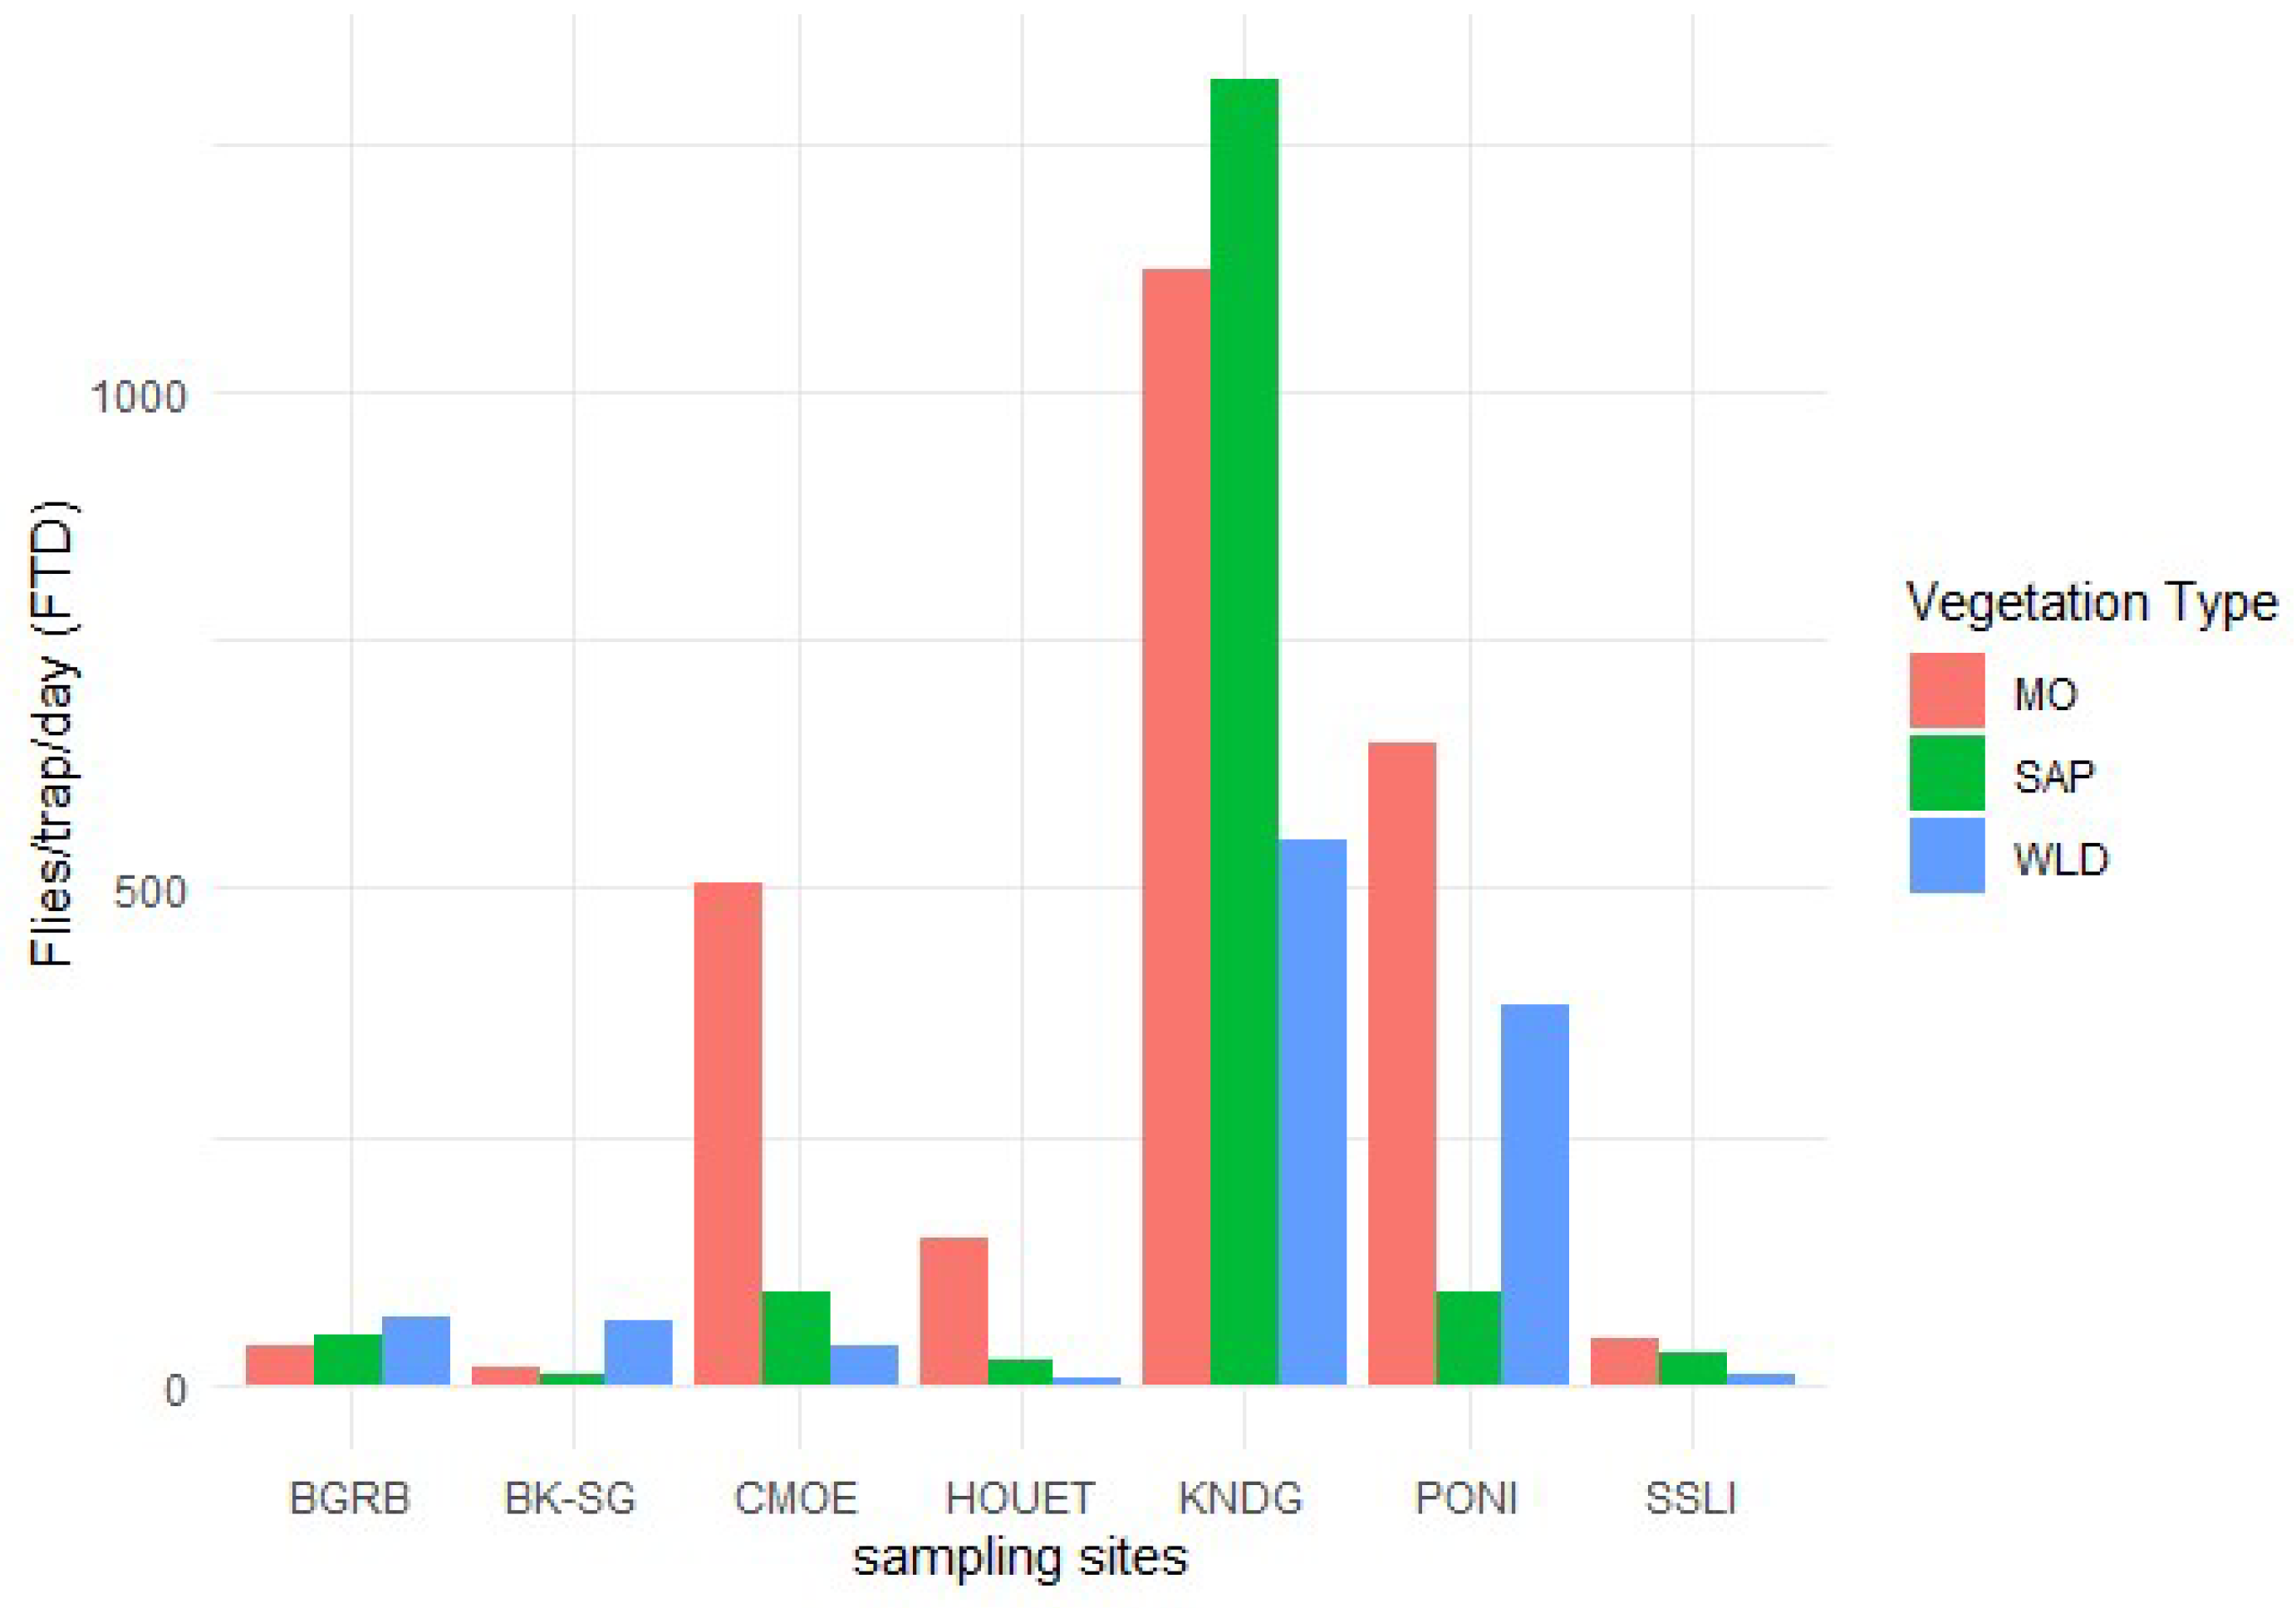
The transversal sampling of Bactrocera dorsalis in July 2021, across seven sites in Burkina Faso revealed a differential abundance of flies caught depending on the sampling sites and the type of plant formation including mango orchards, shea agroforestry parks and natural formations. The highest density per site, with 2986 FTD (56.9%) was observed in Kénédougou (KNDG) while the lowest, with 87 FTD (1.65%) was observed in Sissili (SSLI). The highest density of flies per type of plant formation, with 2520 FTD (48.03%), was observed in mango orchards, while the lowest, with 1118 FTD (21.30%), was observed in natural formations. Regarding the number of flies collected per type of plant formation per site, the highest density, with 68 FTD (43.87%) and 63 FTD (71.59%) were observed in the natural formations in Bougouriba and Boulkiemdé-Sanguié, respectively. In Comoé, Houet, Poni and Sissili, the highest density, with 504 FTD (79.18%), 149 FTD (83.66%), 645 FTD (57.69%) and 45 FTD (52.02%) in the mango orchards. In Kénédougou, the highest density 1313 FTD (43.98%) was observed in the shea agroforestry park. The lowest density of flies per type of plant formation per site were observed in the mango orchard in Bougouriba with 38 FTD (24.19%), in the shea agroforestry park in Boulkiemdé-Sanguié and Poni, with 9 FTD (9.65%) and 92 FTD (8.23%), respectively, in the natural formation in Comoé, Houet, Kénédougou and Sissili, with 41 FTD (6.36%), 5FTD (2.82%), 544 FTD (18.39%) and 11 FTD, (12.72%) respectively (Figure 2).

3.1.2. Polymorphism of Microsatellite Markers and Genetic Diversity

Genetic polymorphism analysis of the 10 microsatellite loci in 315 individuals of the B. dorsalis species from seven localities revealed a total diversity of 44 alleles in the whole population. The total number of alleles per locus ranged from 3 (Bd15) to 7 (Bd85b) with an average of 4.4 per locus. The number of alleles per sampling site ranged from 28 (Sissili) to 35 (Kénédougou) with an average of 31.14 per locality. The mean numbers of alleles (Na) at locus level ranged from 1.286 (Bd15) to 4.429 (MS4) with a total mean of 3.114 per locus while the mean effective numbers of alleles (Ne) ranged from 1.007 (Bd15) to 3.131 (Bd19) with a total mean of 1.924 per locus. Shannon's Information Index (I) ranged from 0.018 (Bd15) to 1.239 (Bd19) with an average of 0.722 per locus. The Shannon Information Index or Shannon Diversity Index is used to measure the diversity at different levels, including genes, populations, whole species and ecosystems. It is widely employed in population genetics studies as a suitable estimator to evaluate the variation at multiallelic loci, such as microsatellites [38]. Mean observed heterozygosity (Ho) per locus ranged from 0.003 (Bd15) to 0.791 (MS4) with a mean of 0.356 while mean expected heterozygosity (He) ranged from 0.006 (Bd15) to 0.673 (Bd19) with a mean of 0.402 per locus. Total Expected Heterozygosity (Ht) ranged from 0.006 (Bd15) to 0.7 (Bd19) in the total population with an average of 0.413 per locus. The hybridization coefficients Fis (Inbreeding Coefficient) and Fit (Total Inbreeding Coefficient) varied respectively from -0.253 (MS12A) to 0.704 (Bi8) and from -0.233 (MS12A) to 0.719 (Bi8) with averages of 0.208 and 0.228 per locus. Genetic differentiation indices (Fst) at locus level ranged from 0.014 (Bi1) to 0.052 (Bi8) with an average of 0.027 per locus, leading to gene flow (Nm) ranging from 4.561 (Bi8) to 17.553 (Bi1) with an average of 11.36 per locus (Table 1).
The average number of alleles (Na) per locus for each locality ranged from 2.8 (SSLI) to 3.5 (KNDG), with an average of 3.1 per locality, while the average effective number of alleles (Ne) ranged from 1.819 (SSLI) to 2.032 (KNDG), with an average of 1.924 per locality. Shannon's Information Index (I) per locality ranged from 0.657 (SSLI) to 0.771 with an average of 0.722 per locality. The average observed heterozygosity (Ho) at loci in each locality ranged from 0.328 (KNDG) to 0.384 (BGRB) with an average of 0.356 per locality, while the average expected heterozygosity (He) ranged from 0.370 (SSLI) to 0.431 (CMOE) with an average of 0.402 per locality. Fixation indices (F) at locality level varied between 0.062 (BK-SG) and 0.269 (CMOE) with an average of 0.166 per locality, and Percentage of Polymorphic Loci (PPL) varied between 80% (HOUET and KNDG) and 100% (CMOE) at localities with an average of 88.6% (Table 2).

3.2. Population Structure

3.2.1. Genetic Differentiation

Genetic differentiation was estimated using analysis of molecular variance (AMOVA), coefficient of genetic differentiation (Fst), gene flow (Nm) and Nei genetic distance between populations.
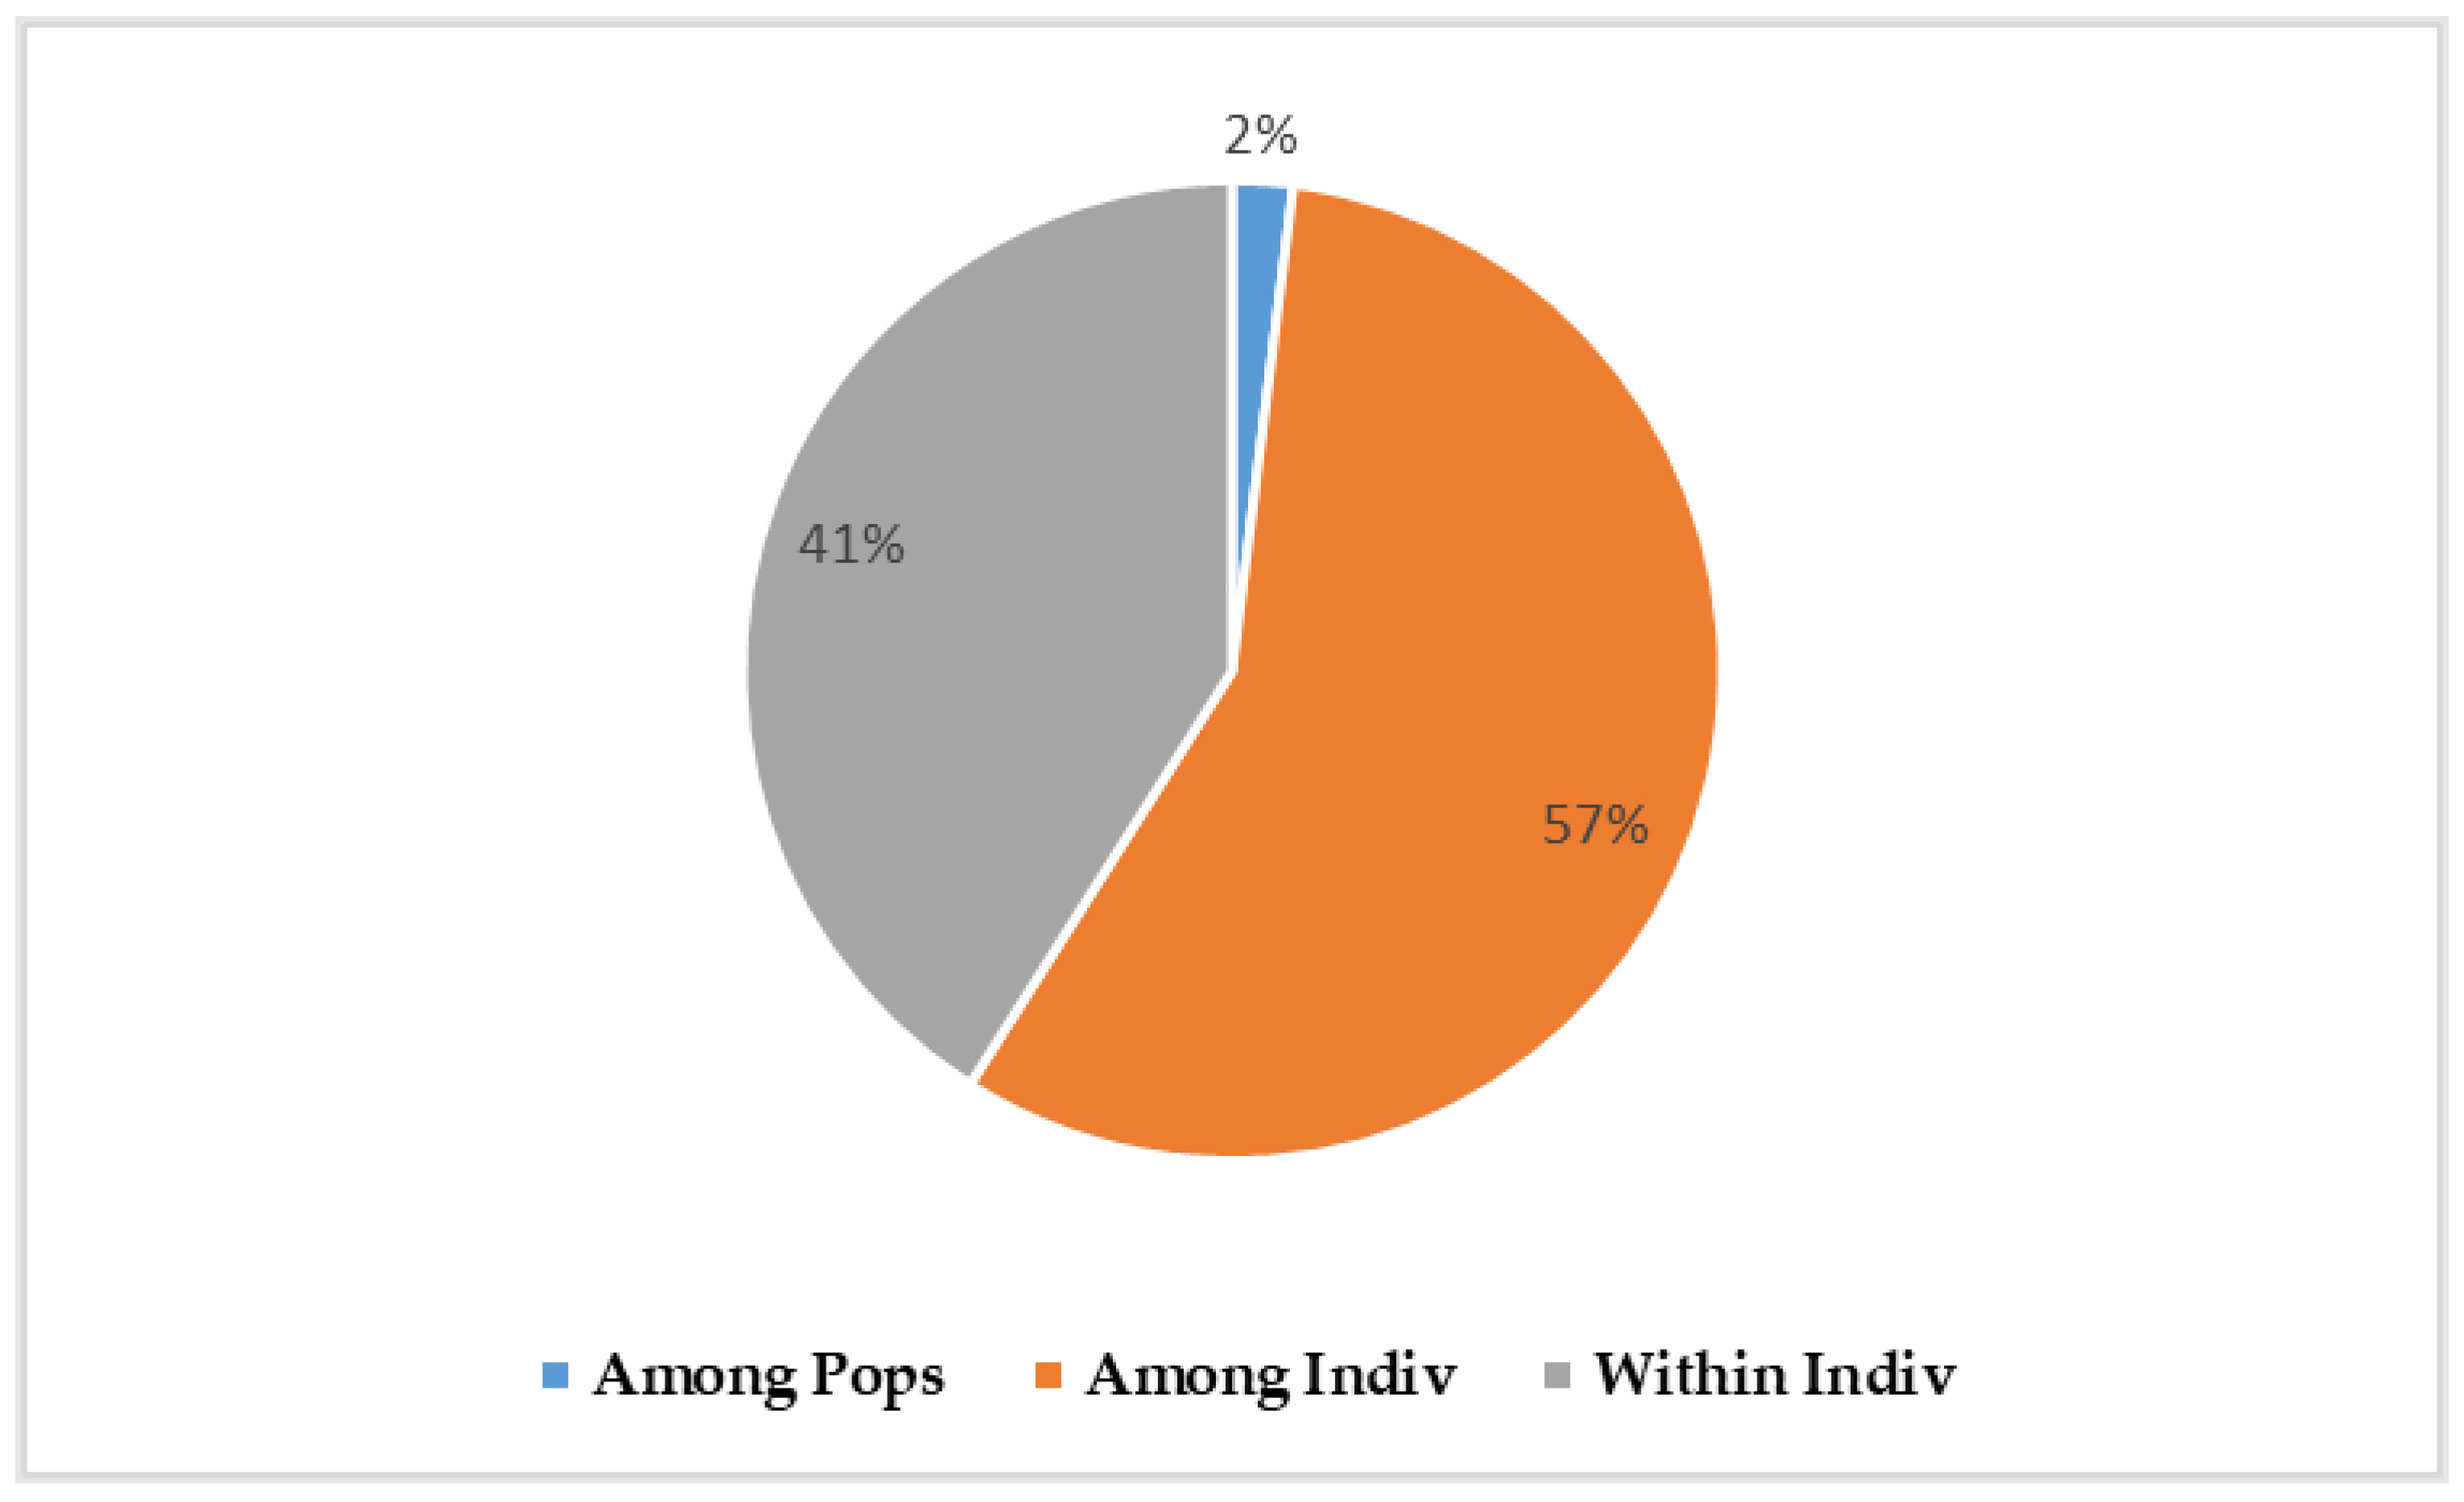
The analysis of molecular variance (AMOVA) showed that 2% of the total variation was observed between populations, 57% was observed between individuals and 41% was observed within individuals (Figure 3). Analysis of genetic differentiation (Fst) and gene flow (Nm) between population pairs showed low genetic differentiation associated with high gene flow between B. dorsalis populations in Burkina Faso. The low Fst (0.009) and the high Nm (27.528) were observed between Comoé and Poni while the highest Fst (0.023) and the lowest Nm (10.62) were observed between Kénédougou and Sissili (Table 3).
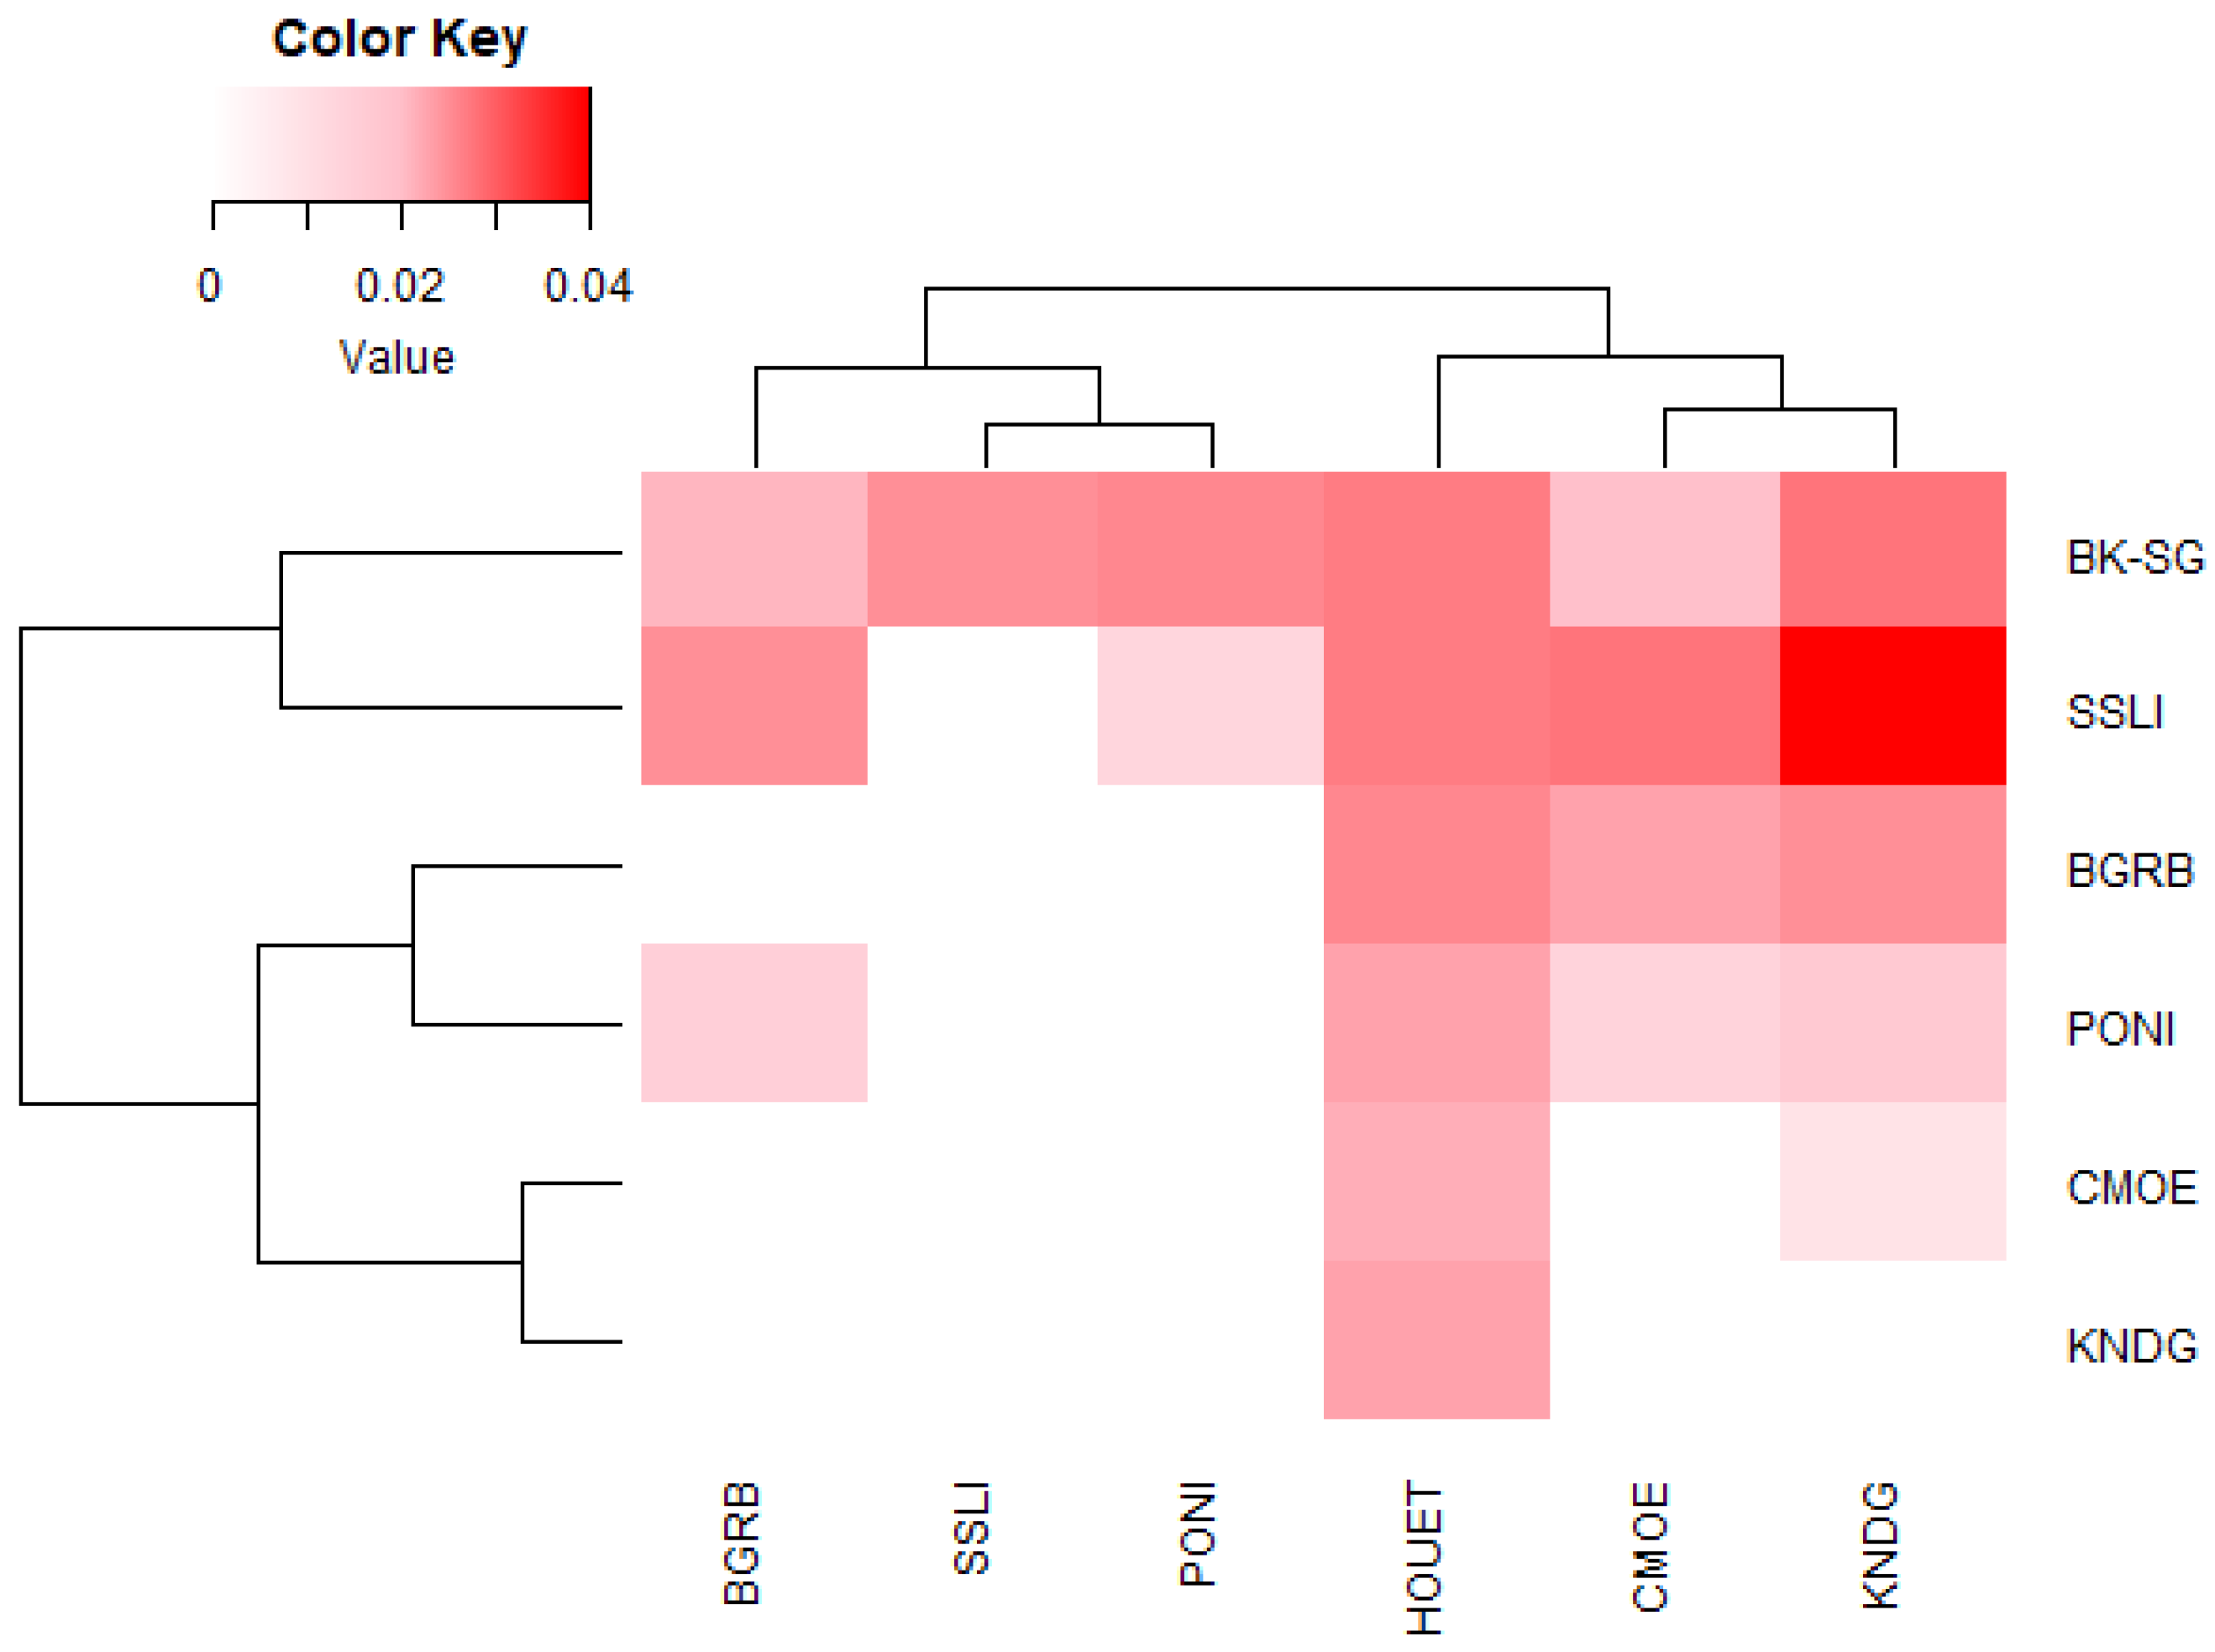
Analysis of Nei's genetic distance showed little overall genetic distancing between B. dorsalis populations at the different study sites (Figure 4). The lowest genetic distance (0.009), represented by the darkest pink color, was observed between Comoé (CMOE) and Poni (PONI), while the largest distance (0.04), represented by the red color, was observed between Kénédougou (KNDG) and Sissili (SSLI). Genetic distancing dendrograms associated with the heatmap showed groupings of the seven B. dorsalis sub-populations into clusters (Figure 5). The horizontal dendrogram shows that the Boulkiemdé-Sanguié (BK-SG) and Sissili (SSLI) sub-populations form a cluster distant from that formed by the Comoé (CMOE), Kénédougou (KNDG), Bougouriba (BGRB) and Poni (PONI) sub-populations organised into sub-clusters grouping Comoé and Kénédougou on the one hand, and Bougouriba and Poni on the other. The vertical dendrogram shows that the Comoé, Kénédougou and Houet sub-populations together form a cluster with a sub-cluster formed by Comoé and Kénédougou. The Bougouriba, Poni and Sissili sub-populations together form another cluster that also includes a sub-cluster made up of Sissili and Poni (Figure 4).

3.2.2. Multivariate Analysis and Genetic Clustering

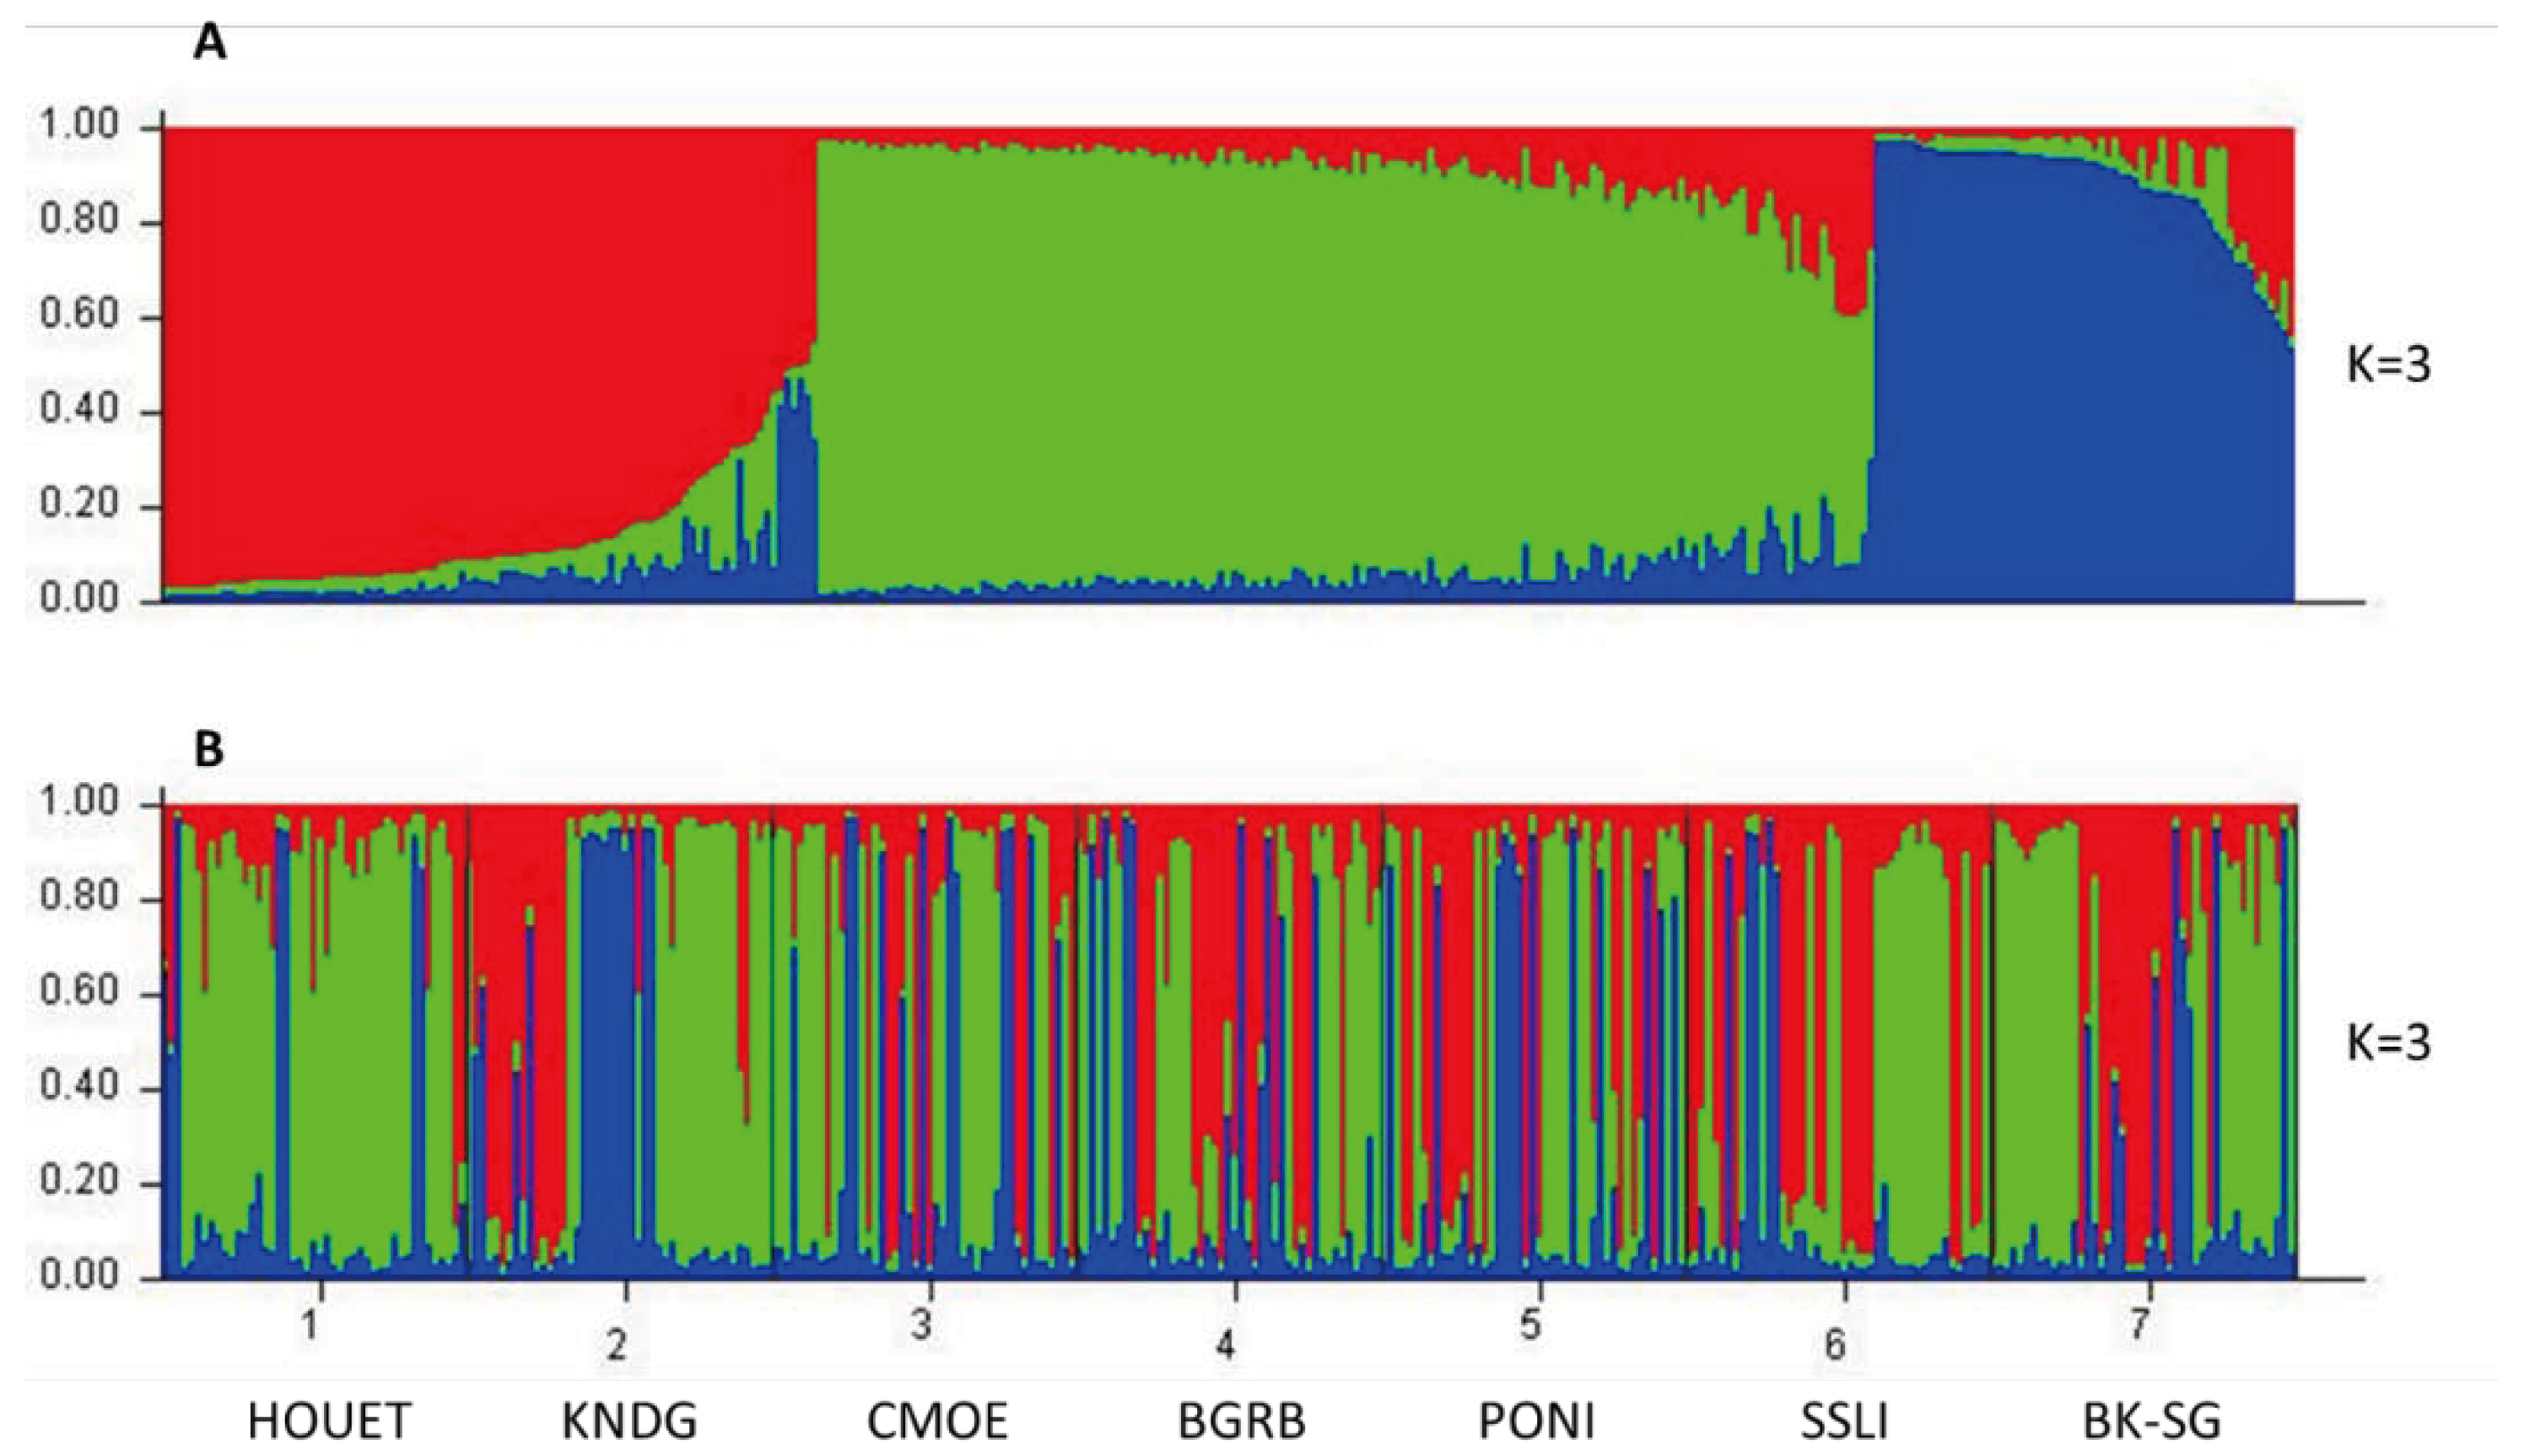
Bayesian admixture analysis of the 10 microsatellite loci using STRUCTURE software showed that the maximum number of clusters (K) corresponding to the highest value of ΔK is estimated at K=3. The B. dorsalis populations of 7 localities in Burkina Faso are structured into three ancestral genetic groups, each with different proportions of ancestral genotype. In the following analyses, an individual was considered to belong to a given ancestral group if its ancestral proportion corresponding to this group was the highest. In the population as a whole, 30.8% of individuals belonged to the first ancestral group (Red), 49.5% belonged to the second ancestral group (Green) and 19.7% belonged to the third ancestral group (Blue) (Figure 5A). Within localities, the majority of individuals in the sub-populations of Comoé (CMOE) (51.11%) and Houet (HOUET) (80%) belonged to the second ancestral group while the minority (22.22% and 6.66% respectively), belonged to the first ancestral group. The majority of individuals in Bougouriba (BGRB) (42. 22%), Boulkiemdé-Sanguié (BK-SG) (55.55%) and Kénédougou (KNDG) (42.22%) belonged to the second ancestral group while the minority (17.77%, 15.55% and 26.66% respectively), belonged to the third ancestral group. The majority of individuals from Poni (PONI) (40%) and Sissili (SSLI) (46.66%) belonged to the first ancestral group while the minority (26.66% and 11.11% respectively) belonged to the third ancestral group (Figure 5B).
DAPC analysis of microsatellite data was used to infer the sub-structures of the B. dorsalis population in Burkina Faso at K=3. Cross-validation and the associated numerical methods were used to retain the first 25 PCs provided by the principal component analysis (PCA) with a conserved variance of 99.7%. The proportions of genetic variance explained by each DAPC axis ranged from 29.8 (axis 1) to 4.1 (axis 6) and the number of discriminant functions retained was three. The scatterplot plot was generated based on the first two axes providing a total capture of 54% of the genetic variance observed in the data with a participation of 29.8% and 24.2% for axis 1 and 2 respectively (Figure 6). This DAPC plot showed a grouping of individuals into three weakly differentiated clusters with Bougouriba (BGRB), Comoé (CMOE), Houet (HOUET), Poni (PONI) and Sissili (SSLI) in a first cluster, Kénédougou (KNDG) in a second cluster and Boulkiemdé-Sanguié (BK-SG) in a third cluster.

4. Discussion

Bactrocera dorsalis is currently a serious threat for horticulture in sub-Saharan Africa. Clearly, effective control of this insect pest would require a good understanding of its ecology, biology, population genetics and other relevant parameters. In sub-Saharan Africa, despite efforts, much remains to be done in the investigation of this insect pest. Several studies were carried out to inventory the main and intermediate host plants of B. dorsalis among cultivated and wild plants, both commercial and non-commercial or to elucidate the seasonal abundance and population dynamics of this insect pest [14,39]. However, data are lacking on a number of parameters, including the distribution of insecticide resistance and genetic diversity and structuring. An initial study by Khamis et al. (2009) looked at the diversity and genetic structuring of B. dorsalis populations in West Africa, Central Africa, East Africa and Sri Lanka [30]. Another study by Qin et al. (2018) gave a global overview of the different structures of B. dorsalis across locations in Africa, Asia and Hawaii. In Africa, 11 countries including Burkina Faso were involved [5]. Two other studies by Faye et al. (2020) and Diallo et al. (2021) pointed out the genetic structuring of B. dorsalis in certain regions of Senegal [40,41]. This study is the first to provide a specific overview of the genetic structuring of B. dorsalis in Burkina Faso.
The results of transversal collections of B. dorsalis scales during July 2021 across three types of plant formations in seven sampling sites in Burkina Faso showed that the highest proportion of flies was observed in Kénédougou while the lowest proportion was observed in Sissili. The month of July was indicated as the outbreak period for B. dorsalis in the west part of Burkina Faso, and this is thought to be mainly influenced by the availability of host fruits and the suitability of climatic conditions with a favorable atmospheric humidity and temperature [1,42]. Moreover, a study in Benin showed that the abundance of B. dorsalis was strongly correlated with relative humidity and rainfall [43]. Therefore, the uneven distribution of rainfall would be a factor influencing the distribution of B. dorsalis in Burkina Faso. The results showed that the most watered areas, such as Comoé, Bougouriba, Kénédougou, Houet and Poni in the Sudanian climate, had higher proportions of flies, while less irrigated areas such as Boulkiemdé-Sanguié and Sissili in the Sudano-Sahelian climate, had lower proportions (Figure 2). Of the three types of plant formations surveyed, the results showed that the high proportion of flies was observed in mango orchards, while the low proportion was observed in natural formations. In Burkina Faso, the natural formations are composed of plants species such as Annona senegalensis, Landolphia heudelotii, Opilia celtidifolia, Sarcocephalus latifolius, Uvaria chamae, etc., which are secondary hosts for B. dorsalis, whereas mangoes (Mangifera indica) are its preferred host fruits [43]. Furthermore, this knowledge of differential distribution of B. dorsalis abundance in Burkina Faso would make it possible to better guide the implementation of the various control interventions for greater impact at a national scale.
Analysis of the genetic diversity of Bactrocera dorsalis in Burkina Faso through polymorphisms of the 10 microsatellite loci showed a high genetic diversity in all subpopulations with an average Shannon Information Index (I) of 0.722. The highest genetic diversity was observed in Comoé (I=0.771) while the lowest was observed in Sissili (I=0.657). The same finding was reported by Khamis et al. (2009), who observed similarly high genetic diversity in West Africa (0.59), and this diversity was also slightly higher than that observed in East Africa (0.54) [30]. Qin et al. (2018) also observed high genetic diversity (0.55) in B. dorsalis populations in certain African localities, including Burkina Faso [5]. These results show that B. dorsalis has successfully adapted in West Africa, and populations are expanding after more than fifteen years of evolution since its invasion around 2005 [1,15,19,30,44]. Indeed, the West African region is a major fruit production and export area, more specifically for mango, which is a key host for B. dorsalis. In addition, B. dorsalis is also known to have a very high capacity for invasion and adaptation [10,30]. Fixation indices (F) in the different subpopulations ranged from 0.062 (Boulkiemdé-Sanguié) to 0.269 (Comoé) with an average of 0.166, showing that all seven B. dorsalis subpopulations deviated from the Hardy-Weinberg equilibrium with heterozygote deficiencies. The Hardy-Weinberg equilibrium is based on a population model with an infinite size where reproduction is sexual and panmictic, there is no overlapping of generations, there is no mutation, no selection and no migration [45]. B. dorsalis is a highly fertile sexual species in which males and females mate with several partners. Females reproduce several times during their lifetime, lasting around three months. The flies reach sexual maturity in around 30 days after undergoing successive embryonic, larval, pupal and imaginal development, giving rise to overlapping generations of flies. The species is also known for its great dispersal capacity, often facilitated by commercial trade in fruit [18]. Populations of B. dorsalis therefore deviate from the Hardy-Weinberg model because of the overlapping generations and migrations that characterize them. The indices of genetic differentiation (Fst) varying from 0.009 (Comoé-Poni) to 0.023 (Kénédougou-Sissili) observed between the sub-populations were low according to Wright's scale, which considers that an Fst between 0 and 0.05 indicates low genetic differentiation [46]. These low genetic differentiations led to high gene flows, varying from 10.62 between Kénédougou and Sissili, to 27.53 between Comoé and Poni. In fact, gene flow is a factor in the adaptation and persistence of the species in new environments through the dispersal of selected resilience traits such as heat or cold resistance alleles and insecticide resistance alleles [23,46]. In addition, local gene flow is a crucial advantage for the success of a genetic control intervention by facilitating the dispersal of the gene of interest [23]. However, it should also be noted that the observed gene flow could constitute an additional complication in the choice of trial sites for a potential evaluation of a genetically modified strain in the natural environment. Indeed, trial sites with a good level of containment, exchanging fewer or no individuals with the surrounding sites, are ideal candidates. These sites offer settings that minimize the risk of invasion of genetically modified insects into non-target sites and maximize the chances of success by preventing bias in the experiment through potential invasions of surrounding wild strains into the trial sites [48]. The genetic differentiations observed were correlated with the Nei's genetic distance observed between the sub-populations, ranging from 0.04 between Kénédougou and Sissili to 0.009 between Comoé and Poni. The high flight capacity and variety of host fruits of B. dorsalis would facilitate its dispersal from one site to another [30]. These migrations help to reduce the genetic difference and/or the genetic distance between the different populations.
Bayesian admixture analysis in STRUCTURE showed that the B. dorsalis populations in Burkina Faso were organized into three genetic groups derived from three ancestral origins. A proportion of 30.8% of the total population belonged to the first ancestral group, 49.5% to the second group and 19.7% to the third group. This is consistent with the three different invasion events of B. dorsalis in Burkina Faso as suggested by Khamis et al. (2009) for the invasion of Africa [30]. Within the sites, the second ancestral group was more represented in Bougouriba, Boulkiemdé-Sanguié, Comoé, Kénédougou and Houet, the first ancestral group was more represented in Poni and Sissili, and the third ancestral group was not dominant in any of the sites but had a significant proportion in Comoé, Kénédougou and Poni. These results show that the population of B. dorsalis fruit flies is not geographically structured in Burkina Faso, but it would appear that the second ancestral group is much more dominant in the western part of the country, with Houet as the epicenter, while the first group is more dominant in the southern part.
DAPC is a multivariate analysis used to infer a model of genetic variation providing information on genetic differentiation, both between subgroups and between individuals, while minimizing information within subgroups [34]. The DAPC of B. dorsalis in Burkina Faso, using microsatellite analysis, showed that the populations were structured into three main genetic groups that were not very well separated. The first group consisted of individuals from the localities Bougouriba, Comoé, Houet, Poni and Sissili, the second group consisted of individuals from Kénédougou and the third group consisted of individuals from Boulkiemdé-Sanguié. Kénédougou, which accounts for almost half of the country's mango production, is a major production area, exporting fruit to other regions of Burkina Faso and abroad. The area imports relatively few fruits from other regions. Interregional trade in fruit is the main means by which fruit flies, including B. dorsalis, are exchanged [49], so the site of Kénédougou constitutes a sort of enclave that could evolve into a special structure. Boulkiemdé-Sanguié is also a site that could evolve into a particular structure due to the geographical distance separating it from the other sites, unlike the case of Kénédougou. Furthermore, the low level of separation between the genetic groups observed demonstrates an absence of geographical structure, which can be explained by the fact that the introduction of B. dorsalis in Burkina Faso is recent and also the genetic structure is a variable strongly influenced by the gene flow factor [23,46].

5. Conclusions

The oriental fruit fly, B. dorsalis, is a serious threat to food security worldwide. Control strategies for this insect pest in Burkina Faso are mainly based on chemical pesticides, entomopathogenic fungi, parasitoids, predatory ants and, in the horizon, genetic control. The effectiveness of these strategies would require a good understanding of this pest, including its biology, distribution, diversity and genetic structure. This study provides valuable information about the geographical distribution, genetic diversity and structure of B. dorsalis in Burkina Faso. Briefly, the results showed that B. dorsalis was unevenly distributed in Burkina Faso due to the unequal distribution of rainfall. The populations were genetically diversified, less differentiated and presenting no evidence of structure. The gene flows between the different populations were high. The information provided on the differential distribution of B. dorsalis in Burkina Faso will help to better direct and rationalize control means. The high genetic diversity and the absence of an evident geographical structure could confirm the hypothesis of a foreign invasion of B. dorsalis in Burkina Faso. The high level of gene flow between populations is a factor that would favor the dispersal of potential insecticide resistance, and this information could be an asset for managing such concern. In addition, these observed gene flows could be linked to the existing fruit exchange flows between the study sites, that will need to be clarified. The results provided would contribute to guide scientists to implement novel control strategies, including genetic control.

Author Contributions

N.T and M.K and H.M conceptualized the research. N.T, K.N and I.Z performed the field collection, N.T and M.K performed experiments. N.T, H.M and BBDS performed the analyses, E.K established the sampling map, N.T, M.K and H.M wrote the early version of the manuscript. A.D performed the funding acquisition. K.N, I.Z, B.B.D.S, R.G, A.M.G.B, R.A.D and A.D edited and validated the manuscript. All authors have read and agreed to the published version of the manuscript.

Funding

This research was funded by the Bill & Melinda Gates Foundation [Grants number INV006610 and INV037164] and the Open Philanthropy fund [Grants number 2016-161185].

Acknowledgments

The authors would like to acknowledge valuable supports from the Institut de Recherche en Sciences de la Santé, Direction Régionale de l'Ouest (IRSS-DRO, Burkina Faso) through the PhD grant awarded from the Target Malaria project, the Institut de l’Environnement et de Recherches Agricoles (INERA, Burkina Faso) and the Sya Innovation Center (SIC) for the collaboration and technical supports.

Conflicts of Interest

The authors declare that they have no conflict of interest.

References

  1. Zida:, S. Zida: S. Nacro, R. Dabiré, L. Moquet, H. Delatte, and I. Somda, “Host range and species diversity of Tephritidae of three plant formations in Western Burkina Faso,” Bull. Entomol. Res., vol. 110, no. 6, pp. 732–742, 2020. [CrossRef]
  2. IPPC, “ISPM 27 Diagnostic protocols for regulated pests DP29 : Bactrocera dorsalis,” Int. Plant Prot. Conv., vol. ISPM 27, no. February, p. 34, 2019.
  3. H. Liu et al., “Invasion, expansion, and control of Bactrocera dorsalis (Hendel) in China,” J. Integr. Agric., vol. 18, no. 4, pp. 771–787, 2019. [CrossRef]
  4. T. Dohino et al., “Phytosanitary Treatments against Bactrocera dorsalis (Diptera: Tephritidae): Current Situation and Future Prospects,” J. Econ. Entomol., vol. 110, no. 1, pp. 67–79, 2017. [CrossRef]
  5. Y. jia Qin et al., “Population structure of a global agricultural invasive pest , Bactrocera dorsalis ( Diptera : Tephritidae ),” Evol. Appl., vol. 11, no. April, pp. 1990–2003, 2018. [CrossRef]
  6. S. Ekesi, M. De Meyer, S. A. Mohamed, M. Virgilio, and C. Borgemeister, “Taxonomy, Ecology, and Management of Native and Exotic Fruit Fly Species in Africa,” Annu. Rev. Entomol., vol. 61, pp. 219–238, 2016. [CrossRef]
  7. A. Loomans, M. Diakaki, M. Kinkar, M. Schenk, and S. Vos, “Pest survey card on Bactrocera dorsalis,” EFSA Support. Publ., vol. 16, no. 9, pp. 2–25, 2019. [CrossRef]
  8. R. I. Vargas, J. C. Piñero, and L. Leblanc, “An overview of pest species of Bactrocera fruit flies (Diptera: Tephritidae) and the integration of biopesticides with other biological approaches for their management with a focus on the pacific region,” Insects, vol. 6, no. 2, pp. 297–318, 2015. [CrossRef]
  9. M. K. Schutze et al., “Synonymization of key pest species within the Bactrocera dorsalis species complex (Diptera: Tephritidae): Taxonomic changes based on a review of 20 years of integrative morphological, molecular, cytogenetic, behavioural and chemoecological data,” Syst. Entomol., vol. 40, no. 2, pp. 456–471, 2015. [CrossRef]
  10. S. Jaffar, S. A. H. Rizvi, and Y. Lu, “Understanding the Invasion, Ecological Adaptations, and Management Strategies of Bactrocera dorsalis in China: A Review,” Horticulturae, vol. 9, no. 9, p. 1004, 2023. [CrossRef]
  11. S. A. Lux, R. S. Copeland, I. M. White, A. Manrakhan, and M. K. Billah, “A New Invasive Fruit Fly Species from the Bactrocera dorsalis (Hendel) Group Detected in East Africa,” Int. J. Trop. Insect Sci., vol. 23, no. 04, pp. 355–361, 2003. [CrossRef]
  12. R. A. I. Drew, K. Tsuruta, and I. M. White, “A new species of pest fruit fly (Diptera: Tephritidae: Dacinae) from Sri Lanka and Africa,” African Entomol., vol. 13, no. 1, pp. 149–154, 2005.
  13. K. B. Badii, M. K. Billah, K. Afreh Nuamah, D. Obeng Ofori, and G. Nyarko, “Review of the pest status, economic impact and management of fruit-infesting flies (Diptera: Tephritidae) in Africa,” African J. Agric. Res., vol. 10, no. 12, pp. 1488–1498, 2015. [CrossRef]
  14. CABI, “Bactrocera dorsalis (Oriental fruit fly),” Invasive Species Compendium, 2021. https://www.cabi.org/isc/datasheet/17685 (accessed May 25, 2022).
  15. Zida, S. Nacro, R. Dabiré, and I. Somda, “Co-Existence of Bactrocera dorsalis Hendel (Diptera: Tephritidae) and Ceratitis cosyra Walker (Diptera: Tephritidae) in the Mango Orchards in Western Burkina Faso,” Adv. Entomol., vol. 08, no. 01, pp. 46–55, 2020. [CrossRef]
  16. W. K. Heve, T. A. Adjadeh, and M. K. Billah, “Overview and future research needs for development of effective biocontrol strategies for management of Bactrocera dorsalis Hendel ( Diptera : Tephritidae ) in sub-Saharan Africa,” Pest Manag Sci, vol. 77, no. February, pp. 1–14, 2021. [CrossRef]
  17. S. Ekesi, M. K. Billah, P. W. Nderitu, S. A. Lux, and I. Rwomushana, “Evidence for competitive displacement of ceratitis cosyra by the invasive fruit fly bactrocera invadens (Diptera: Tephritidae) on mango and mechanisms contributing to the displacement,” J. Econ. Entomol., vol. 102, no. 3, pp. 981–991, 2009. [CrossRef]
  18. R. Mutamiswa, C. Nyamukondiwa, G. Chikowore, and F. Chidawanyika, “Overview of oriental fruit fly , Bactrocera dorsalis ( Hendel ) ( Diptera : Tephritidae ) in Africa : From invasion , bio-ecology to sustainable management,” Crop Prot., vol. 141, no. September 2020, pp. 1–17, 2021. [CrossRef]
  19. S. N. Ouédraogo, J. F. Vayssières, A. Rémy Dabiré, and C. Rouland-Lefèvre, “Biodiversité des mouches des fruits (Diptera: Tephritidae) en vergers de manguiers de l’ouest du Burkina Faso: structure et comparaison des communautés de différents sites,” Fruits, vol. 66, no. 6, pp. 393–404, 2011. [CrossRef]
  20. S. Isasawin, N. Aketarawong, and S. Thanaphum, “Characterization and evaluation of microsatellite markers in a strain of the oriental fruit fly, Bactrocera dorsalis (Diptera: Tephritidae), with a genetic sexing character used in sterile insect population control,” Eur. J. Entomol., vol. 109, no. 3, pp. 331–338, 2012. [CrossRef]
  21. M. Sutantawong, W. Orankanok, W. R. Enkerlin, V. Wornoayporn, and C. Caceres, “The sterile insect technique for control of the oriental fruit fly, Bactrocera dorsalis (Hendel), in mango orchards in Ratchaburi Province, Thailand,” Proc. 6th Int. Fruit Fly Symp., vol. 6-10 May, no. May, pp. 223–232, 2002, [Online]. Available: https://nucleus.iaea.org/sites/naipc/twd/Documents/6thISFFEI_Proceedings/SUTANTAWONG.pdf.
  22. P. T. Leftwich et al., “Genetic pest management and the background genetics of release strains,” Philos. Trans. R. Soc. Lond. B. Biol. Sci., vol. 376, no. 1818, p. 20190805, 2021. [CrossRef]
  23. M. Legros, J. M. Marshall, S. Macfadyen, K. R. Hayes, A. Sheppard, and L. G. Barrett, “Gene drive strategies of pest control in agricultural systems: Challenges and opportunities,” Evol. Appl., vol. 14, no. 9, pp. 2162–2178, 2021. [CrossRef]
  24. R. F. Medina, “Gene drives and the management of agricultural pests,” J. Responsible Innov., vol. 5, pp. S255–S262, 2018. [CrossRef]
  25. S. Choudhary, N. Naaz, C. S. Prabhakar, and M. Lemtur, “Genetic analysis of oriental fruit fly, Bactrocera dorsalis (Diptera: Tephritidae) populations based on mitochondrial cox1 and nad1 gene sequences from India and other Asian countries,” Genetica, vol. 144, no. 5, pp. 611–623, Oct. 2016. [CrossRef]
  26. National Academy of Sciences, Gene Drives on the Horizon. Washington, D.C.: National Academies Press, 2016.
  27. W. Shi, C. Kerdelhué, and H. Ye, “Genetic structure and inferences on potential source areas for Bactrocera dorsalis (Hendel) based on mitochondrial and microsatellite markers,” PLoS One, vol. 7, no. 5, pp. 1–15, 2012. [CrossRef]
  28. G. T. McQuate and R. I. Vargas, “Assessment of attractiveness of plants as roosting sites for the melon fly, Bactrocera cucurbitae, and oriental fruit fly, Bactrocera dorsalis,” J. Insect Sci., vol. 7, no. 57, p. 57, 2007. [CrossRef]
  29. N. Aketarawong, M. Bonizzoni, A. R. Malacrida, G. Gasperi, and S. Thanaphum, “Seventeen novel microsatellite markers from an enriched library of the pest species Bactrocera dorsalis sensu stricto,” Mol. Ecol. Notes, vol. 6, no. 4, pp. 1138–1140, 2006. [CrossRef]
  30. F. M. Khamis et al., “Uncovering the tracks of a recent and rapid invasion: The case of the fruit fly pest Bactrocera invadens (Diptera: Tephritidae) in Africa,” Mol. Ecol., vol. 18, no. 23, pp. 4798–4810, 2009. [CrossRef]
  31. C. Yi, C. Zheng, L. Zeng, and Y. Xu, “High genetic diversity in the offshore island populations of the tephritid fruit fly Bactrocera dorsalis,” BMC Ecol., vol. 16, no. 1, pp. 1–12, 2016. [CrossRef]
  32. P. E. Peakall, R. and Smouse, “GenAlEx 6.5: Genetic Analysis in Excel. Population Genetic Software for Teaching and Research—An Update,” Bioinforma. Appl. Note, vol. 28, pp. 2537–2539, 2012. [CrossRef]
  33. M. Nei, “Chapter 9: Genetic Distance Between Populations,” in The American Naturalist, vol. 106, no. 949, Columbia University Press, 1972, pp. 208–253.
  34. T. Jombart, S. Devillard, and F. Balloux, “Discriminant analysis of principal components: a new method for the analysis of genetically structured populations,” BMC Genet., vol. 11, no. 1, p. 94, Aug. 2010. [CrossRef]
  35. D. A. Earl and B. M. vonHoldt, “STRUCTURE HARVESTER: A website and program for visualizing STRUCTURE output and implementing the Evanno method,” Conserv. Genet. Resour., vol. 4, no. 2, pp. 359–361, 2012. [CrossRef]
  36. G. Evanno, S. Regnaut, and J. Goudet, “Detecting the number of clusters of individuals using the software STRUCTURE: a simulation study.,” Mol. Ecol., vol. 14, no. 8, pp. 2611–20, Jul. 2005. [CrossRef]
  37. R. K. Ramasamy, S. Ramasamy, B. B. Bindroo, and V. G. Naik, “STRUCTURE PLOT: A program for drawing elegant STRUCTURE bar plots in user friendly interface,” Springerplus, vol. 3, no. 1, pp. 1–3, 2014. [CrossRef]
  38. M. K. Konopiński, “Shannon diversity index: a call to replace the original Shannon’s formula with unbiased estimator in the population genetics studies,” PeerJ, vol. 8, no. 6, p. e9391, Jun. 2020. [CrossRef]
  39. Zida, S. Nacro, R. Dabiré, and I. Somda, “Seasonal Abundance and Diversity of Fruit Flies (Diptera: Tephritidae) in Three Types of Plant Formations in Western Burkina Faso, West Africa,” Ann. Entomol. Soc. Am., vol. 113, no. 5, pp. 343–354, Sep. 2020. [CrossRef]
  40. M. Faye, A. Ndiaye, I. Diallo, and P. M. Sembene, “Genetic identification of populations of Bactrocera dorsalis ( Diptera Tephritidae ) in the Niayes and Lower Casamance areas in Senegal,” J. Appl. Biosci., vol. 158, pp. 16351–16362, 2021.
  41. Diallo, A. Ndiaye, E. Faye, M. Faye, and M. Sembene, “Does landscape factors drive the genetic diversity and structure of populations of fruit flies, Senegal? Exploratory study of the case of Bactrocera dorsalis (Hendel, 1912) in the Niayes, Senegal,” J. Entomol. Zool. Stud., vol. 9, no. 6, pp. 47–52, 2021. [CrossRef]
  42. Zida, S. Nacro, R. Dabiré, S. N. Ouédraogo, and I. Somda, “Shea fruit-infesting fruit flies (Diptera: Tephritidae) and evaluation of infestation level according to the ethno-varieties in Western Burkina Faso,” Int. J. Trop. Insect Sci., vol. 40, no. 3, pp. 493–501, Sep. 2020. [CrossRef]
  43. D. Gnanvossou et al., “Diversity and seasonal abundance of tephritid fruit flies in three agro-ecosystems in Benin, West Africa,” J. Appl. Entomol., vol. 141, no. 10, pp. 798–809, 2017. [CrossRef]
  44. J.-F. Vayssières, S. Korie, and D. Ayegnon, “Correlation of fruit fly ( Diptera Tephritidae ) infestation of major mango cultivars in Borgou ( Benin ) with abiotic and biotic factors and assessment of damage,” Crop Prot., vol. 28, no. 6, pp. 477–488, 2009.
  45. T. De Meeûs, Initiation à la génétique des populations naturelles : Applications aux parasites et à leurs vecteurs., IRD Éditio. Marseille : IRD, 2012.
  46. S. Wright, “Variability Within and Among Natural Populations,” in Evolution and the Genetics of Populations, vol. 4, Chicago, IL, USA: University of Chicago Press., 1978.
  47. R. E. Stinner, C. S. Barfield, J. L. Stimac, and L. Dohse, “Dispersal and movement of insect pests.,” Annu. Rev. Entomol. Vol. 28, no. 68, pp. 319–335, 1983. [CrossRef]
  48. G. C. Lanzaro et al., “Selection of sites for field trials of genetically engineered mosquitoes with gene drive,” Evol. Appl., vol. 14, no. 9, pp. 2147–2161, 2021. [CrossRef]
  49. Y. Cao, B. Li, N. Chen, D. Yang, L. Li, and T. Liu, “Evaluation of Reference Genes for Quantitative Reverse Transcription Polymerase Chain Reaction in Bactrocera dorsalis (Diptera: Tephritidae) Subjected to Various Phytosanitary Treatments,” Insects, vol. 12, no. 10, p. 945, Oct. 2021. [CrossRef]
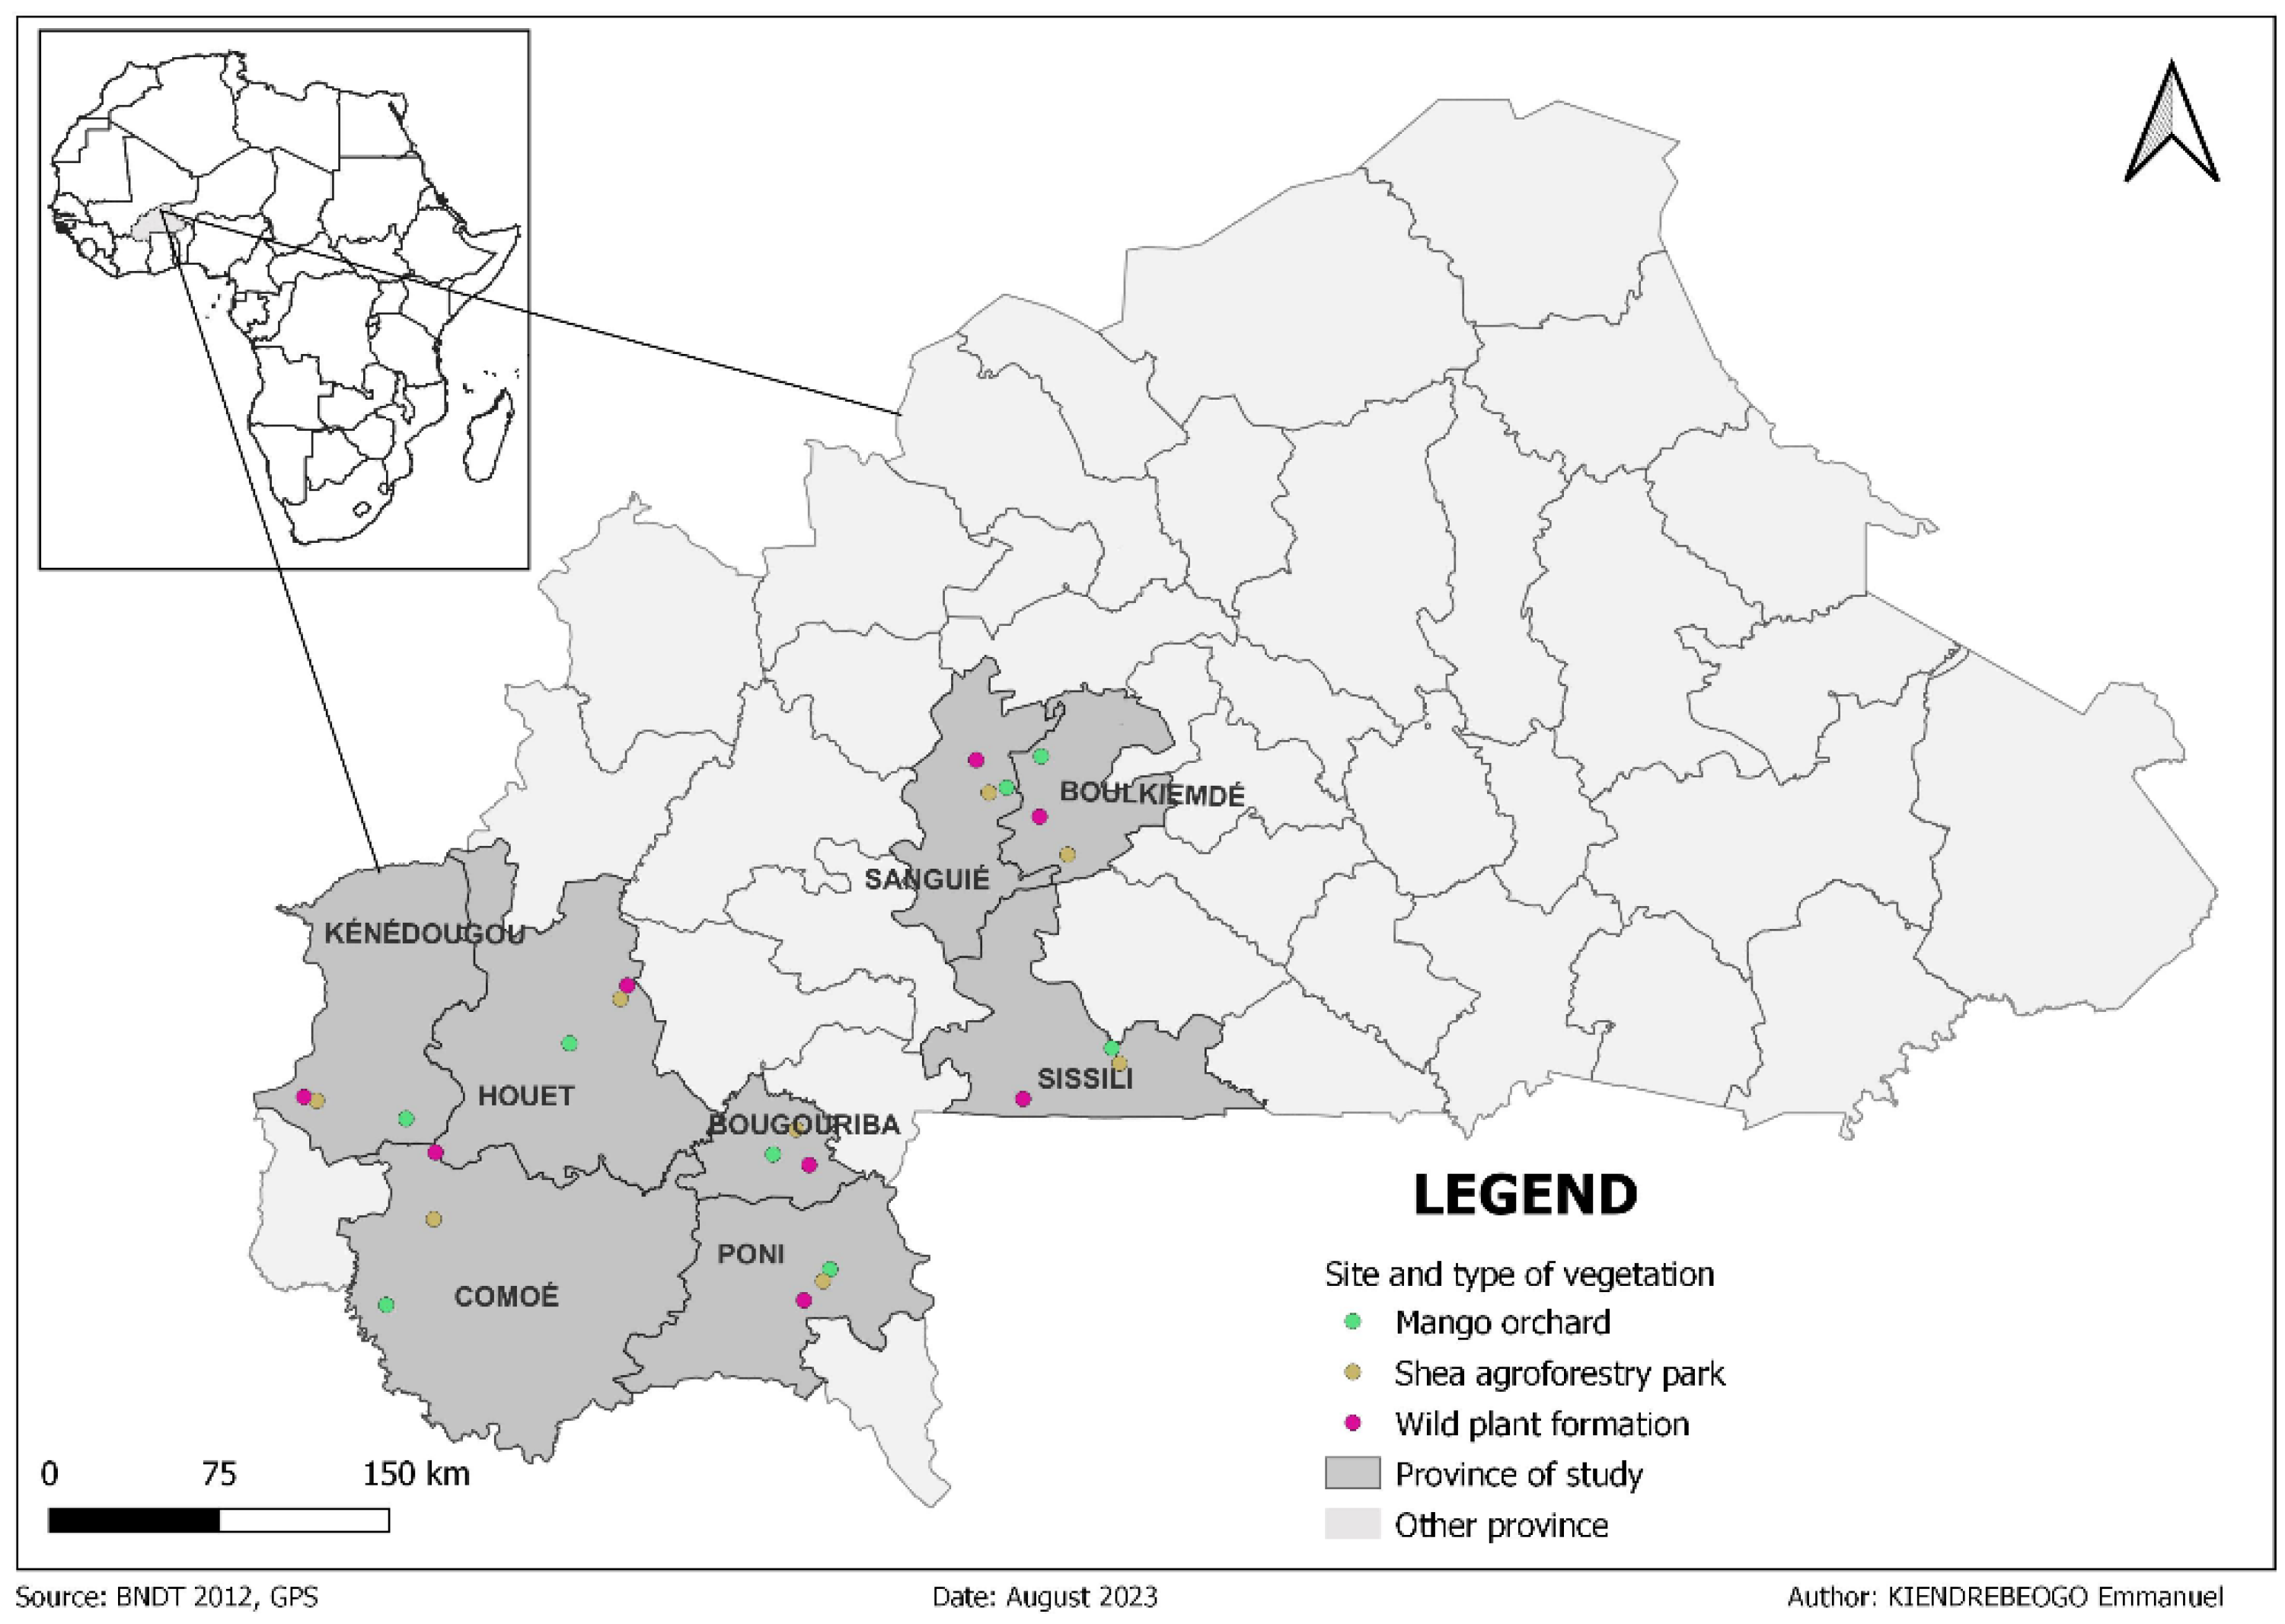
Figure 1. Map showing the sampling sites of Bactrocera dorsalis. The green markers represent mango orchards, the yellow markers represent shea agroforestry parks, and the pink markers represent wild plant formations.
Preprints 100272 g001
Figure 2. Distribution of Bactrocera dorsalis abundance in Burkina Faso during July 2021. The names of the different localities and plant formations are abbreviated as follows: Bougouriba (BGRB), Boulkiemdé-Sanguié (BK-SG), Comoé (CMOE), Houet (HOUET), Kénédougou (KNDG), Poni (PONI), Sissili (SSLI), Mango orchard (MO), Sea Agroforestry Park (SAP) and Wild (WLD). Each locality is represented with the same three colors pink, green and blue, corresponding respectively to MO, SAP and WLD. The y-axis represents the number of flies collected per trap per day, while the x-axis represents the sampling sites.
Preprints 100272 g002
Figure 3. Analysis of Molecular variance. The pie chart shows the percentages of molecular variance among populations (Among Pops), among individuals (Among Indiv) and within individuals (Within Indiv). The blue color within the pie chart represents the genetic variation observed between populations (2%), the orange color represents the genetic variation observed between individuals (57%) and the grey color represents the genetic variation observed within individuals (41%).
Preprints 100272 g003
Figure 4. Heatmap of Nei’s Genetic distance (NGD). The intensity of the colors observed between the populations on the heatmap, varying from pink to red, is proportional to the genetic distance separating them. The lowest genetic distance was observed between Comoé (CMOE) and Kénédougou (KNDG) while the highest was observed between Kénédougou (KNDG) and Sissili (SSLI).
Preprints 100272 g004
Figure 5. Genetic structuring of B. dorsalis populations based on STRUCTURE analysis at K=3. (A) Sort by Q plot, (B) Group by pop Id plot. Each vertical bar represents an individual bearing the genotypic proportions of belonging to the different ancestral groups. The first ancestral group (Red), the second ancestral group (Green) and the third ancestral group (Blue). Bougouriba (BGRB), Boulkiemdé-Sanguié (BK-SG), Comoé (CMOE), Houet (HOUET), Kénédougou (KNDG), Poni (PONI), Sissili (SSLI).
Preprints 100272 g005
Figure 6. DAPC of Bactrocera dorsalis population in Burkina Faso. Bougouriba (BGRB), Boulkiemdé-Sanguié (BK-SG), Comoé (CMOE), Houet (HOUET), Kénédougou (KNDG), Poni (PONI) and Sissili (SSLI). Three weakly differentiated clusters stand out, with individuals from Comoé, Houet, Bougouriba, Poni and Sissili in the first cluster, individuals from Kénédougou in the second and from Boulkiemdé in the third.
Preprints 100272 g006
Table 1. Summary of genetic statistics and Wright’s F-statistic for each microsatellite locus.
Locus N Na Ne I Ho He Ht Fis Fit Fst Nm
Bd15 44,286 1,286 1,007 0,018 0,003 0,006 0,006 0,491 0,499 0,015 16,819
Bd19 44,286 4 3,131 1,239 0,622 0,673 0,7 0,075 0,111 0,039 6,139
Bi1 44,143 3 1,527 0,611 0,356 0,34 0,345 -0,044 -0,03 0,014 17,553
Bi5 44,429 3,571 1,454 0,594 0,276 0,304 0,31 0,092 0,109 0,019 12,915
Bi8 44,714 2 1,147 0,223 0,035 0,118 0,125 0,704 0,719 0,052 4,561
Bi10 44,143 3 1,834 0,773 0,292 0,447 0,462 0,347 0,368 0,032 7,577
MS12A 43,857 3 1,894 0,787 0,589 0,47 0,477 -0,253 -0,233 0,016 15,846
Bd85b 45 3,714 2,613 1,055 0,438 0,616 0,644 0,288 0,32 0,044 5,368
MS4 44,286 4,429 3,013 1,235 0,791 0,664 0,68 -0,191 -0,164 0,023 10,732
MS3 44 3,143 1,623 0,688 0,162 0,378 0,384 0,571 0,577 0,015 16,091
Mean 44,314 3,114 1,924 0,722 0,356 0,402 0,413 0,208 0,228 0,027 11,36
SE 0,111 0,130 0,089 0,047 0,031 0,026 0,048 0,103 0,101 0,004 1,623
Table 2. Genetic diversity parameters among the seven populations of B. dorsalis.
Pop N Na Ne I Ho He uHe F PPL
HOUET 44,6 3,3 1,895 0,718 0,347 0,390 0,394 0,128 80%
KNDG 44,8 3,5 1,963 0,741 0,328 0,397 0,402 0,202 80%
CMOE 43,2 3,2 2,032 0,771 0,348 0,431 0,436 0,269 100%
BGRB 44,6 3,1 1,916 0,740 0,384 0,423 0,428 0,167 90%
PONI 44,5 2,9 1,926 0,716 0,365 0,398 0,402 0,159 90%
SSLI 44,6 2,8 1,819 0,657 0,354 0,370 0,374 0,164 90%
BK-SG 43,9 3,0 1,919 0,712 0,369 0,403 0,407 0,062 90%
Mean 44,3 3,1 1,924 0,722 0,356 0,402 0,406 0,166 88.6 %
Table 3. Pairwize Nm (above diagonal) and Fst (below diagonal) values among the seven populations of Bactrocera dorsalis.
Pop BGRB BK-SG CMOE HOUET KNDG PONI SSLI
BGRB - 16.416 20.583 11.114 12.250 22.477 12.908
BK-SG 0.015 - 17.607 11.655 11.114 13.639 12.250
CMOE 0.012 0.014 - 14.456 22.478 27.528 13.639
HOUET 0.022 0.021 0.017 - 14.456 13.639 14.456
KNDG 0.020 0.022 0.011 0.017 - 17.607 10.620
PONI 0.011 0.018 0.009 0.018 0.014 - 24.75
SSLI 0.019 0.020 0.018 0.017 0.023 0.010 -
Disclaimer/Publisher’s Note: The statements, opinions and data contained in all publications are solely those of the individual author(s) and contributor(s) and not of MDPI and/or the editor(s). MDPI and/or the editor(s) disclaim responsibility for any injury to people or property resulting from any ideas, methods, instructions or products referred to in the content.
Copyright: This open access article is published under a Creative Commons CC BY 4.0 license, which permit the free download, distribution, and reuse, provided that the author and preprint are cited in any reuse.
Prerpints.org logo

Preprints.org is a free preprint server supported by MDPI in Basel, Switzerland.

Subscribe

© 2024 MDPI (Basel, Switzerland) unless otherwise stated