Submitted:
29 February 2024
Posted:
01 March 2024
You are already at the latest version
Abstract
Keywords:
1. Introduction
2. Materials and Methods
3. Results
3.1. The Weibull Distribution
3.2. Power Depending on Wind
4. Conclusions and Discussion
Author Contributions
Funding
Conflicts of Interest
References
- Schislyaeva, E.; Evgrafova, I.; Butakova, N.; Mishalchenko, Y. The EU - Russia - Turkey energy triangle: legal and economic conditions of gas transportation via the TurkStream pipeline. Transportation Research Procedia 2022, 63, 1984–1990. [Google Scholar] [CrossRef]
- Bembenek, M.; Kotsyubynsky, V.; Boychuk, V.; Rachiy, B.; Budzulyak, I.; Kowalski, Ł.; Ropyak, L. Effect of Synthesis Conditions on Capacitive Properties of Porous Carbon Derived from Hemp Bast Fiber. Energies 2022, 15, 8761. [Google Scholar] [CrossRef]
- Lotko, W.; Smigins, R.; Tziourtzioumis, D.; Górska, M. Environmental Aspects of a Common Rail Diesel Engine Fuelled with Biodiesel/Diesel Blends. Advances in Science and Technology Research Journal 2022, 16, 192–201. [Google Scholar] [CrossRef]
- Kurczyński, D.; Łagowski, P.; Wcisło, G. Experimental study into the effect of the second-generation BBuE biofuel use on the diesel engine parameters and exhaust composition. Fuel 2021, 284, 118982. [Google Scholar] [CrossRef]
- Waluś, K.J.; Warguła, Ł. Experimental research on kinematic features of agricultural tractor movement on asphalt pavement. Available online: https://www.matec-conferences.org/articles/matecconf/pdf/2022/04/matecconf_mms2020_05005.pdf (accessed on 19 February 2024).
- Peng, B.; Streimikiene, D.; Agnusdei, G.P.; Balezentis, T. Is sustainable energy development ensured in the EU agriculture? Structural shifts and the energy-related greenhouse gas emission intensity. Journal of Cleaner Production 2024, 141325. [Google Scholar] [CrossRef]
- Ovaere, M.; Proost, S. Cost-effective reduction of fossil energy use in the European transport sector: An assessment of the Fit for 55 Package. Energy Policy 2022, 168, 113085. [Google Scholar] [CrossRef]
- GlobEnergia. Germany produced more than 50% of electricity from RES in 2023! Available online: https://globenergia.pl/niemcy-wyprodukowali-ponad-50-energii-elektrycznej-z-oze-w-2023/ (accessed on 19 February 2024).
- GlobEnergia. Portugal with record share of RES in electricity generation! Available online: https://globenergia.pl/portugalia-z-rekordowym-udzialem-oze-w-generacji-pradu/ (accessed on 19 February 2024).
- GlobEnergia. Wind in sails for offshore wind farms in Poland! Available online: https://globenergia.pl/wiatr-w-zagle-dla-morskich-elektrowni-wiatrowych-w-polsce/ (accessed on 19 February 2024).
- TouchWind. Consortium starts demonstration project into positive wake effects of TouchWind’s floating wind turbine. Available online: https://touchwind.org/news/consortium-starts-demonstration-project-into-positive-wake-effects-of-touchwinds-floating-wind-turbine/ (accessed on 19 February 2024).
- Vestas. Wind Turbine Product Portfolio. Available online: https://us.vestas.com/en-us/products (accessed on 19 February 2024).
- Tests to Begin on a Counter-Rotating Floating Offshore Wind Turbine Concept. Available online: https://maritime-executive.com/article/tests-to-begin-on-a-counter-rotating-floating-offshore-wind-turbine-concept (accessed on 19 February 2024).
- GE Renewable Energy. Haliade-X offshore wind turbine. Available online: https://www.ge.com/renewableenergy/wind-energy/offshore-wind/haliade-x-offshore-turbine (accessed on 19 February 2024).
- GE Renewable Energy. Cypress Onshore Wind Turbine Platform. Available online: https://www.ge.com/renewableenergy/wind-energy/onshore-wind/cypress-platform (accessed on 19 February 2024).
- Siemens Gamesa. SG 14-222 DD: The winds of change have never been stronger. Available online: https://www.siemensgamesa.com/products-and-services/offshore/wind-turbine-sg-14-222-dd (accessed on 19 February 2024).
- VENTUS Power Generator. Products & Services. Available online: https://ventus.group/products-services (accessed on 19 February 2024).
- EnVentus platform variants. Available online: https://www.vestas.com/en/products/enventus-platform (accessed on 19 February 2024).
- Polish wind power plants. Available online: https://generatory-wiatrowe.pl/produkty/polskie-elektrownie-wiatrowe/ (accessed on 19 February 2024).
- Bošnjaković, M.; Katinić, M.; Santa, R.; Marić, D. Wind Turbine Technology Trends. Appl. Sci. 2022, 12, 8653. [Google Scholar] [CrossRef]
- Żurański, J.A.; Jaśpińska, B. Directional analysis of extreme wind speeds in Poland. Journal of Wind Engineering and Industrial Aerodynamics 1996, 66, 13–20. [Google Scholar] [CrossRef]
- Simiu, E. , Scanlan, R.H. Wind Effects on Structures: An Introduction to Wind Engineering, 2nd ed.; John Wiley and Sons: New York, USA, 1986. [Google Scholar]
- Gumbel, E. J. . Statistics of Extremes, 1st ed.; Columbia University Press: New York Chichester, West Sussex, 1958. [Google Scholar] [CrossRef]
- Chmielewski, T.; Bońkowski, A.P. Wind as a natural hazard in Poland. Natural Hazards and Earth System Sciences 2023, 23, 3839–3844. [Google Scholar] [CrossRef]
- Lorenc, H. Maksymalne prędkości wiatru w Polsce, 1st ed. Instytut Meteorologii i Gospodarki Wodnej: Warszawa, Polska, 2012, pp. 5–94. Available online: https://bibliotekanauki.pl/books/2049055 (accessed on 19 February 2024).
- Belu, R. Assessment and Analysis of Offshore Wind Energy Potential. Available online: https://www.intechopen.com/chapters/74556 (accessed on 19 February 2024).
- Wei, J.; Hulio, Z.H.; Rashid, H. Site specific assessment of wind characteristics and determination of wind loads effects on wind turbine components and energy generation. International Journal of Energy Sector Management 2018, 12, 341–363. [Google Scholar] [CrossRef]
- Harris, R.I.; Cook, N.J. The parent wind speed distribution: Why Weibull. Journal of Wind Engineering & Industrial Aerodynamics 2014, 131, 72–87. [Google Scholar] [CrossRef]
- Jung, C.; Schindler, D.; Laible, J.; Buchholz, A. Introducing a system of wind speed distributions for modeling properties of wind speed regimes around the world. Energy Conversion and Management 2017, 144, 181–192. [Google Scholar] [CrossRef]
- Kowalik-Pilarska, E. Wind speed parameters estimation for Poland as a result of mezoscale modelling. Available online: http://www.phd4gen.pl/wp-content/uploads/2021/06/22_06_2021_EKP_UZ3.pdf (accessed on 19 February 2024).
- Banuelos-Ruedas, F.; Camacho, C.A.; Rios-Marcuello, S. Methodologies Used in the Extrapolation of Wind Speed Data at Different Heights and Its Impact in the Wind Energy Resource Assessment in a Region. Available online: https://www.intechopen.com/chapters/17121 (accessed on 19 February 2024). [CrossRef]
- PN-EN 1991-1-4 2005 Oddziaływania na konstukcje. Oddziaływania wiatru. Available online: https://www.studocu.com/pl/document/wojskowa-akademia-techniczna/konstrukcje-betonowe/pn-en-1991-1-4-2005-oddzialywania-na-konstukcje-oddzialywania-wiatru/25166081 (accessed on 19 February 2024).
- Betz, A. Wind-Energie und ihre Ausnutzung durch Windmühlen; Vandenhoeck und Ruprecht: Göttingen, Germany, 1926. [Google Scholar]
- Ragheb, M.; Ragheb, A.M. Wind Turbines Theory - The Betz Equation and Optimal Rotor Tip Speed Ratio. Available online: https://cdn.intechopen.com/pdfs/16242/InTechWind_turbines_theory_the_betz_equation_and_optimal_rotor_tip_speed_ratio.pdf (accessed on 19 February 2024).
- Santiago, G.; Hernandez, W.; Costa De Araujo, A.C.; Rosa, M.; González, M. Application of product development process (PDP) in the construction of vertical axis wind turbine with movable blades. Available online: https://www.academia.edu/42937714/Application_of_product_development_process_PDP_in_the_construction_of_vertical_axis_wind_turbine_with_movable_blades (accessed on 19 February 2024).
- Mihet-Popa, L.; Groza, V. Dynamic modeling, simulation and control strategies for 2 MW wind generating systems. International Review of Modelling and Simulation 2010, 3, 1410–1418. [Google Scholar]
- Heier, S. Grid Integration of Wind Energy: Onshore and Offshore Conversion Systems, 1st ed.; John Wiley and Sons: New York, USA, 1998. [Google Scholar]
- Hansen, L.H.; Helle, L.; Blaabjerg, F.; Ritchie, E.; Munk-Nielsen, S.; Binder, H.; Sorensen, P.; Bak-Jensen, B. Conceptual survey of generators and power electronics for wind turbines. Riso-r-1205(EN), Riso National Laboratory, Roskilde, 2001. Available online: https://www.osti.gov/etdeweb/biblio/20262554 (accessed on 19 February 2024).
- Koźmiński, C.; Michalska, B. Characterization of wind speed and calms in Poland. Acta Agrophysica 2002, 78, 111–132. Available online: https://agro.icm.edu.pl/agro/element/bwmeta1.element.agro-article-18ec9a36-3a7d-4f1d-8490-7a7ed28bfc05 (accessed on 19 February 2024).
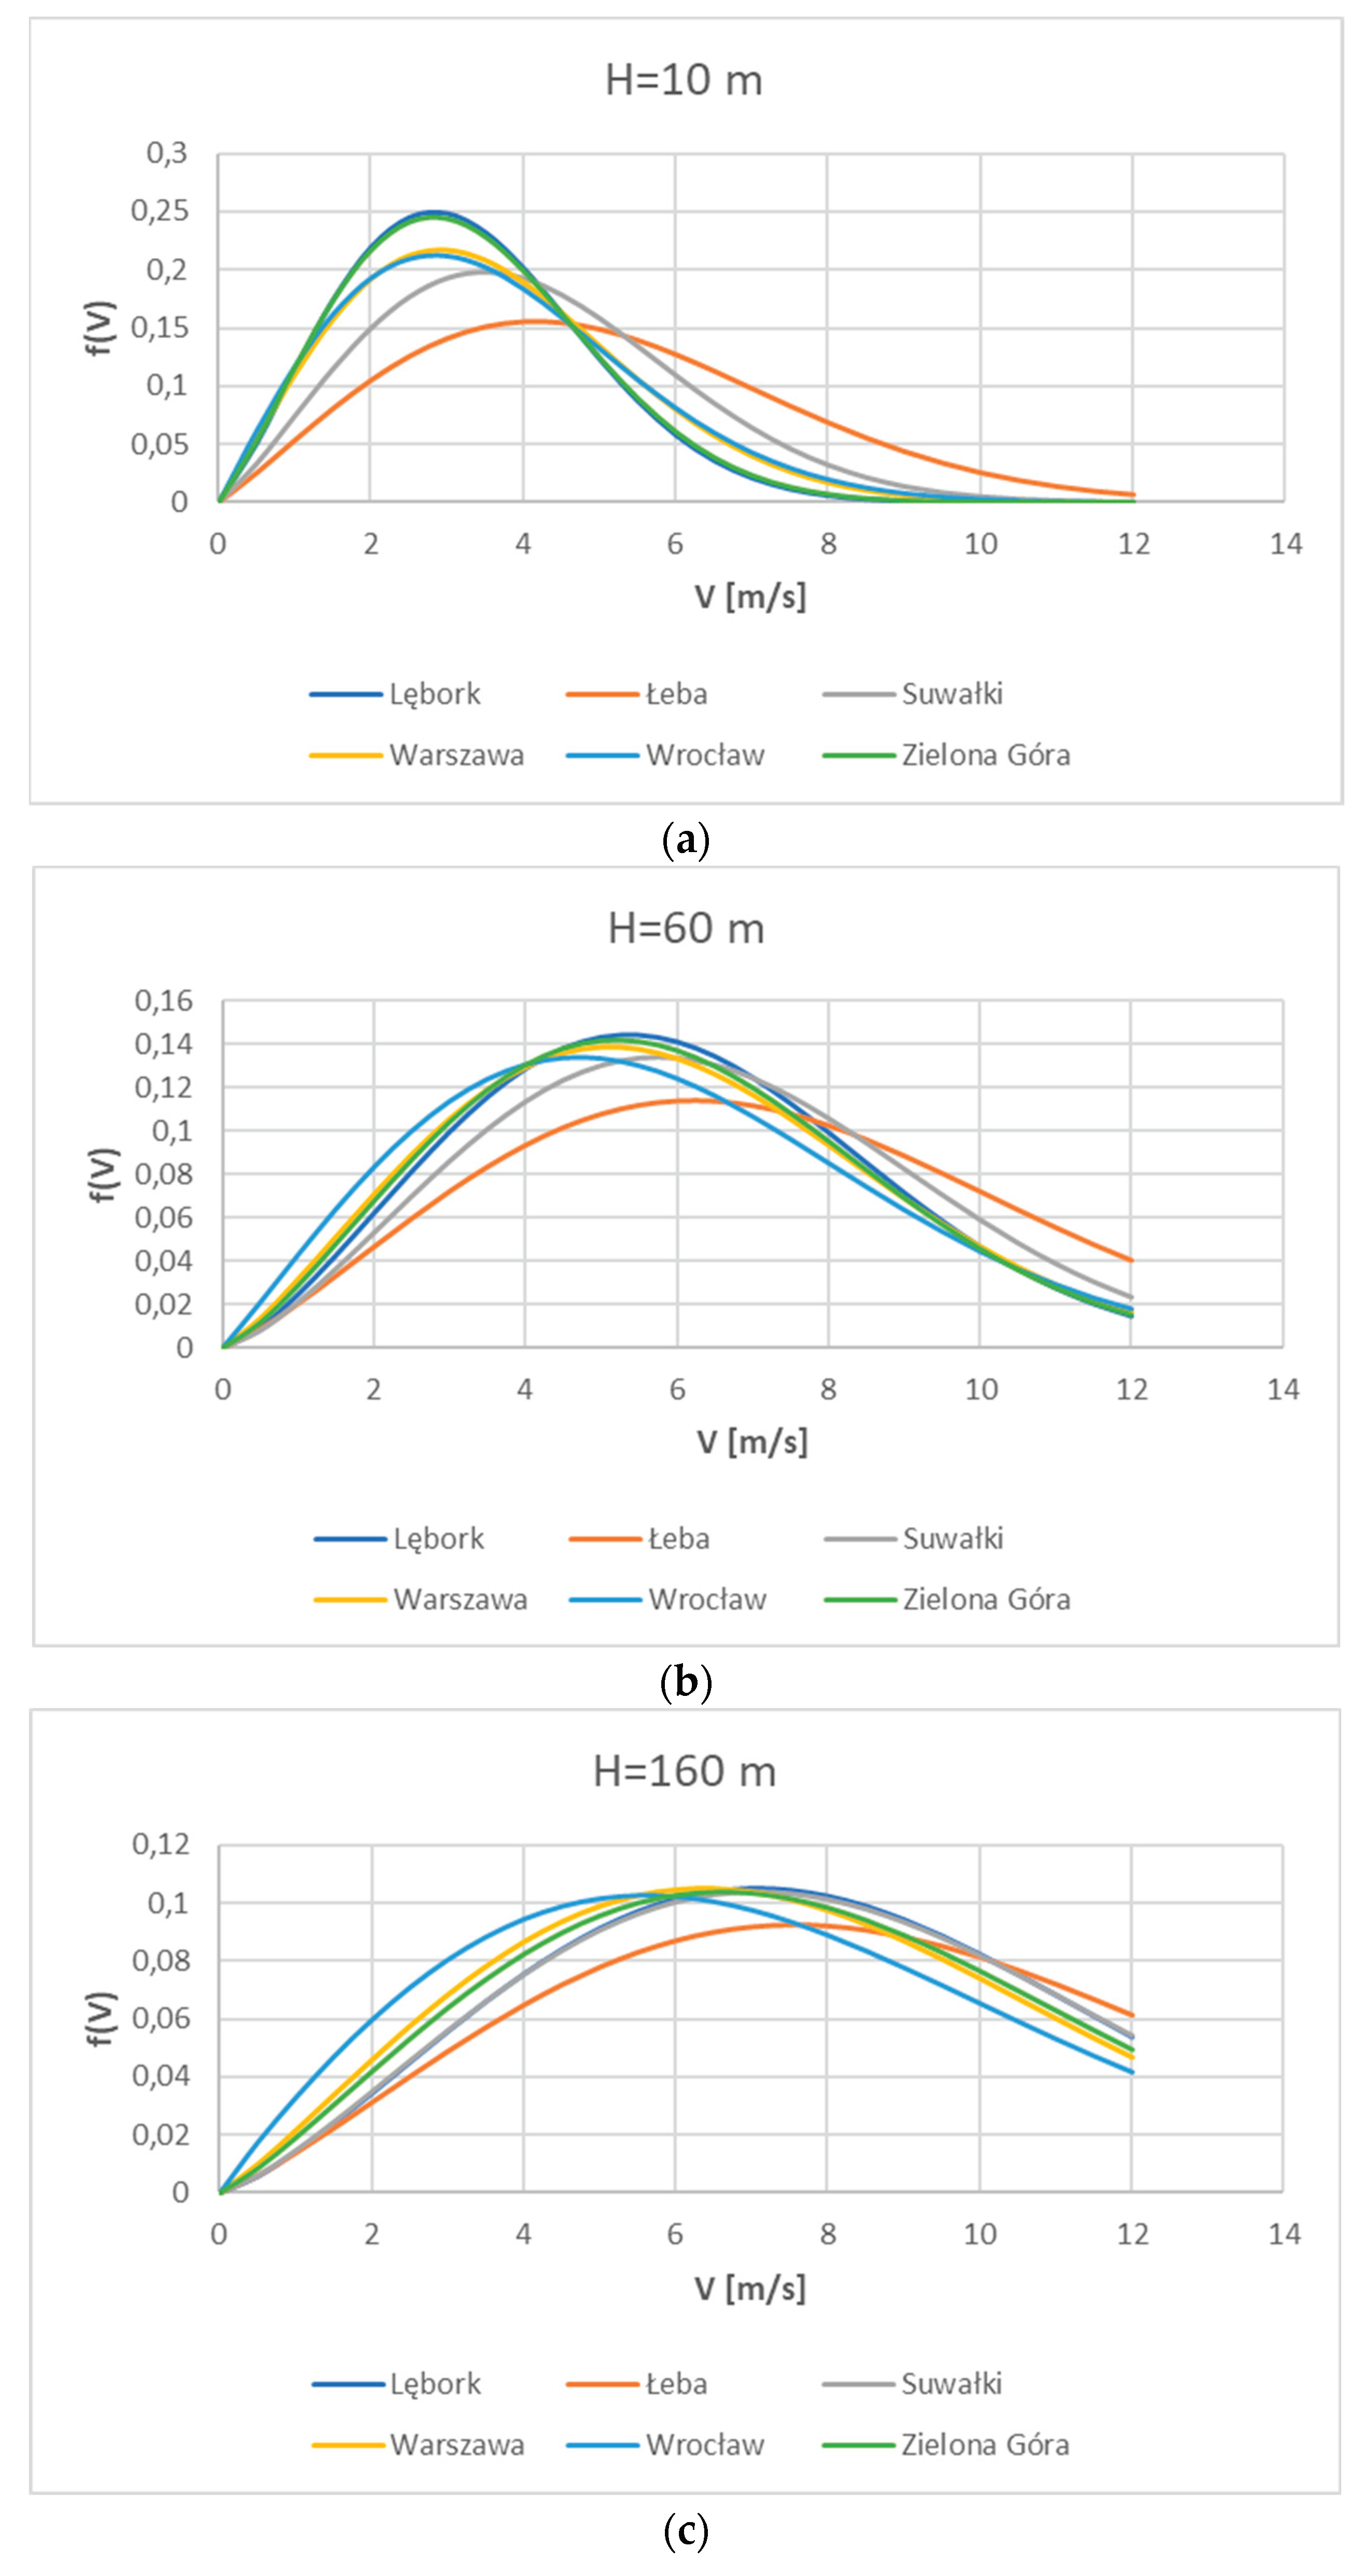
| No | Area | Shape parameter k | Scale parameter c | ||||
|---|---|---|---|---|---|---|---|
| H=10 m | H=60 m | H=160 m | H=10 m | H=60 m | H=160 m | ||
| 1 | Lębork | 2.22367 | 2.38800 | 2.31024 | 3.69743 | 6.73439 | 9.02310 |
| 2 | Łeba | 2.09544 | 2.23580 | 2.20473 | 5.66472 | 8.11317 | 9.94361 |
| 3 | Suwałki | 2.18803 | 2.37893 | 2.28595 | 4.60317 | 7.23649 | 9.06978 |
| 4 | Warszawa | 2.06053 | 2.23177 | 2.13516 | 4.01736 | 6.67782 | 8.55266 |
| 5 | Wrocław | 1.98781 | 2.05001 | 1.92884 | 4.0324 | 6.52111 | 8.18830 |
| 6 | Zielona Góra | 2.19040 | 2.29967 | 2.17879 | 3.72479 | 6.66344 | 8.75553 |
| Terrain class | Terrain | alpha | P160/P60 | P60/P10 |
|---|---|---|---|---|
| 0 | Sea and coastal area exposed to the open sea | 0.11 | 1.38 | 1.81 |
| I | Lakes or area with negligible vegetation and without obstacles | 0.13 | 1.47 | 2.01 |
| II | area with a low vegetation, such as grass and isolated obstacles (trees, buildings) with separations of at least 20 obstacle heights | 0.17 | 1.65 | 2.49 |
| III | area with regular cover of vegetation or buildings or with isolated obstacles with separation of max. 20 obstacle heights (e.g. Villages, suburbia, permanent forest) | 0.19 | 1.75 | 2.78 |
| IV | area in which at least 15% of the surface is covered with buildings and their average height exceeds 15m | 0.24 | 2.03 | 3.63 |
| Season | Month | 7:00 a.m. | 1:00 p.m. | 9:00 p.m |
|---|---|---|---|---|
| Spring | March – May | 2.8 | 4.3 | 2.5 |
| Summer | June – August | 2.4 | 3.8 | 1.8 |
| Autumn | September – November | 2.5 | 3.8 | 2.5 |
| Winter | December – February | 3.3 | 3.9 | 3.3 |
| Yearly average | 2.7 | 3.9 | 2.5 |
| Area | H=10 m | H=60 m | H=160 m |
|---|---|---|---|
| Lębork | 72.8 | 422.4 | 1035.0 |
| Łeba | 270.9 | 766.5 | 1422.6 |
| Suwałki | 141.8 | 525.2 | 1057.4 |
| Warszawa | 97.6 | 427.9 | 922.2 |
| Wrocław | 100.8 | 418.7 | 859.9 |
| Zielona Góra | 75.1 | 417.9 | 977.9 |
Disclaimer/Publisher’s Note: The statements, opinions and data contained in all publications are solely those of the individual author(s) and contributor(s) and not of MDPI and/or the editor(s). MDPI and/or the editor(s) disclaim responsibility for any injury to people or property resulting from any ideas, methods, instructions or products referred to in the content. |
© 2024 by the authors. Licensee MDPI, Basel, Switzerland. This article is an open access article distributed under the terms and conditions of the Creative Commons Attribution (CC BY) license (http://creativecommons.org/licenses/by/4.0/).

