Submitted:
01 March 2024
Posted:
04 March 2024
You are already at the latest version
Abstract
Keywords:
1. Introduction
2. Materials and Methods
2.1. Patients
2.2. Isolation and Phenotyping of White Blood Cells
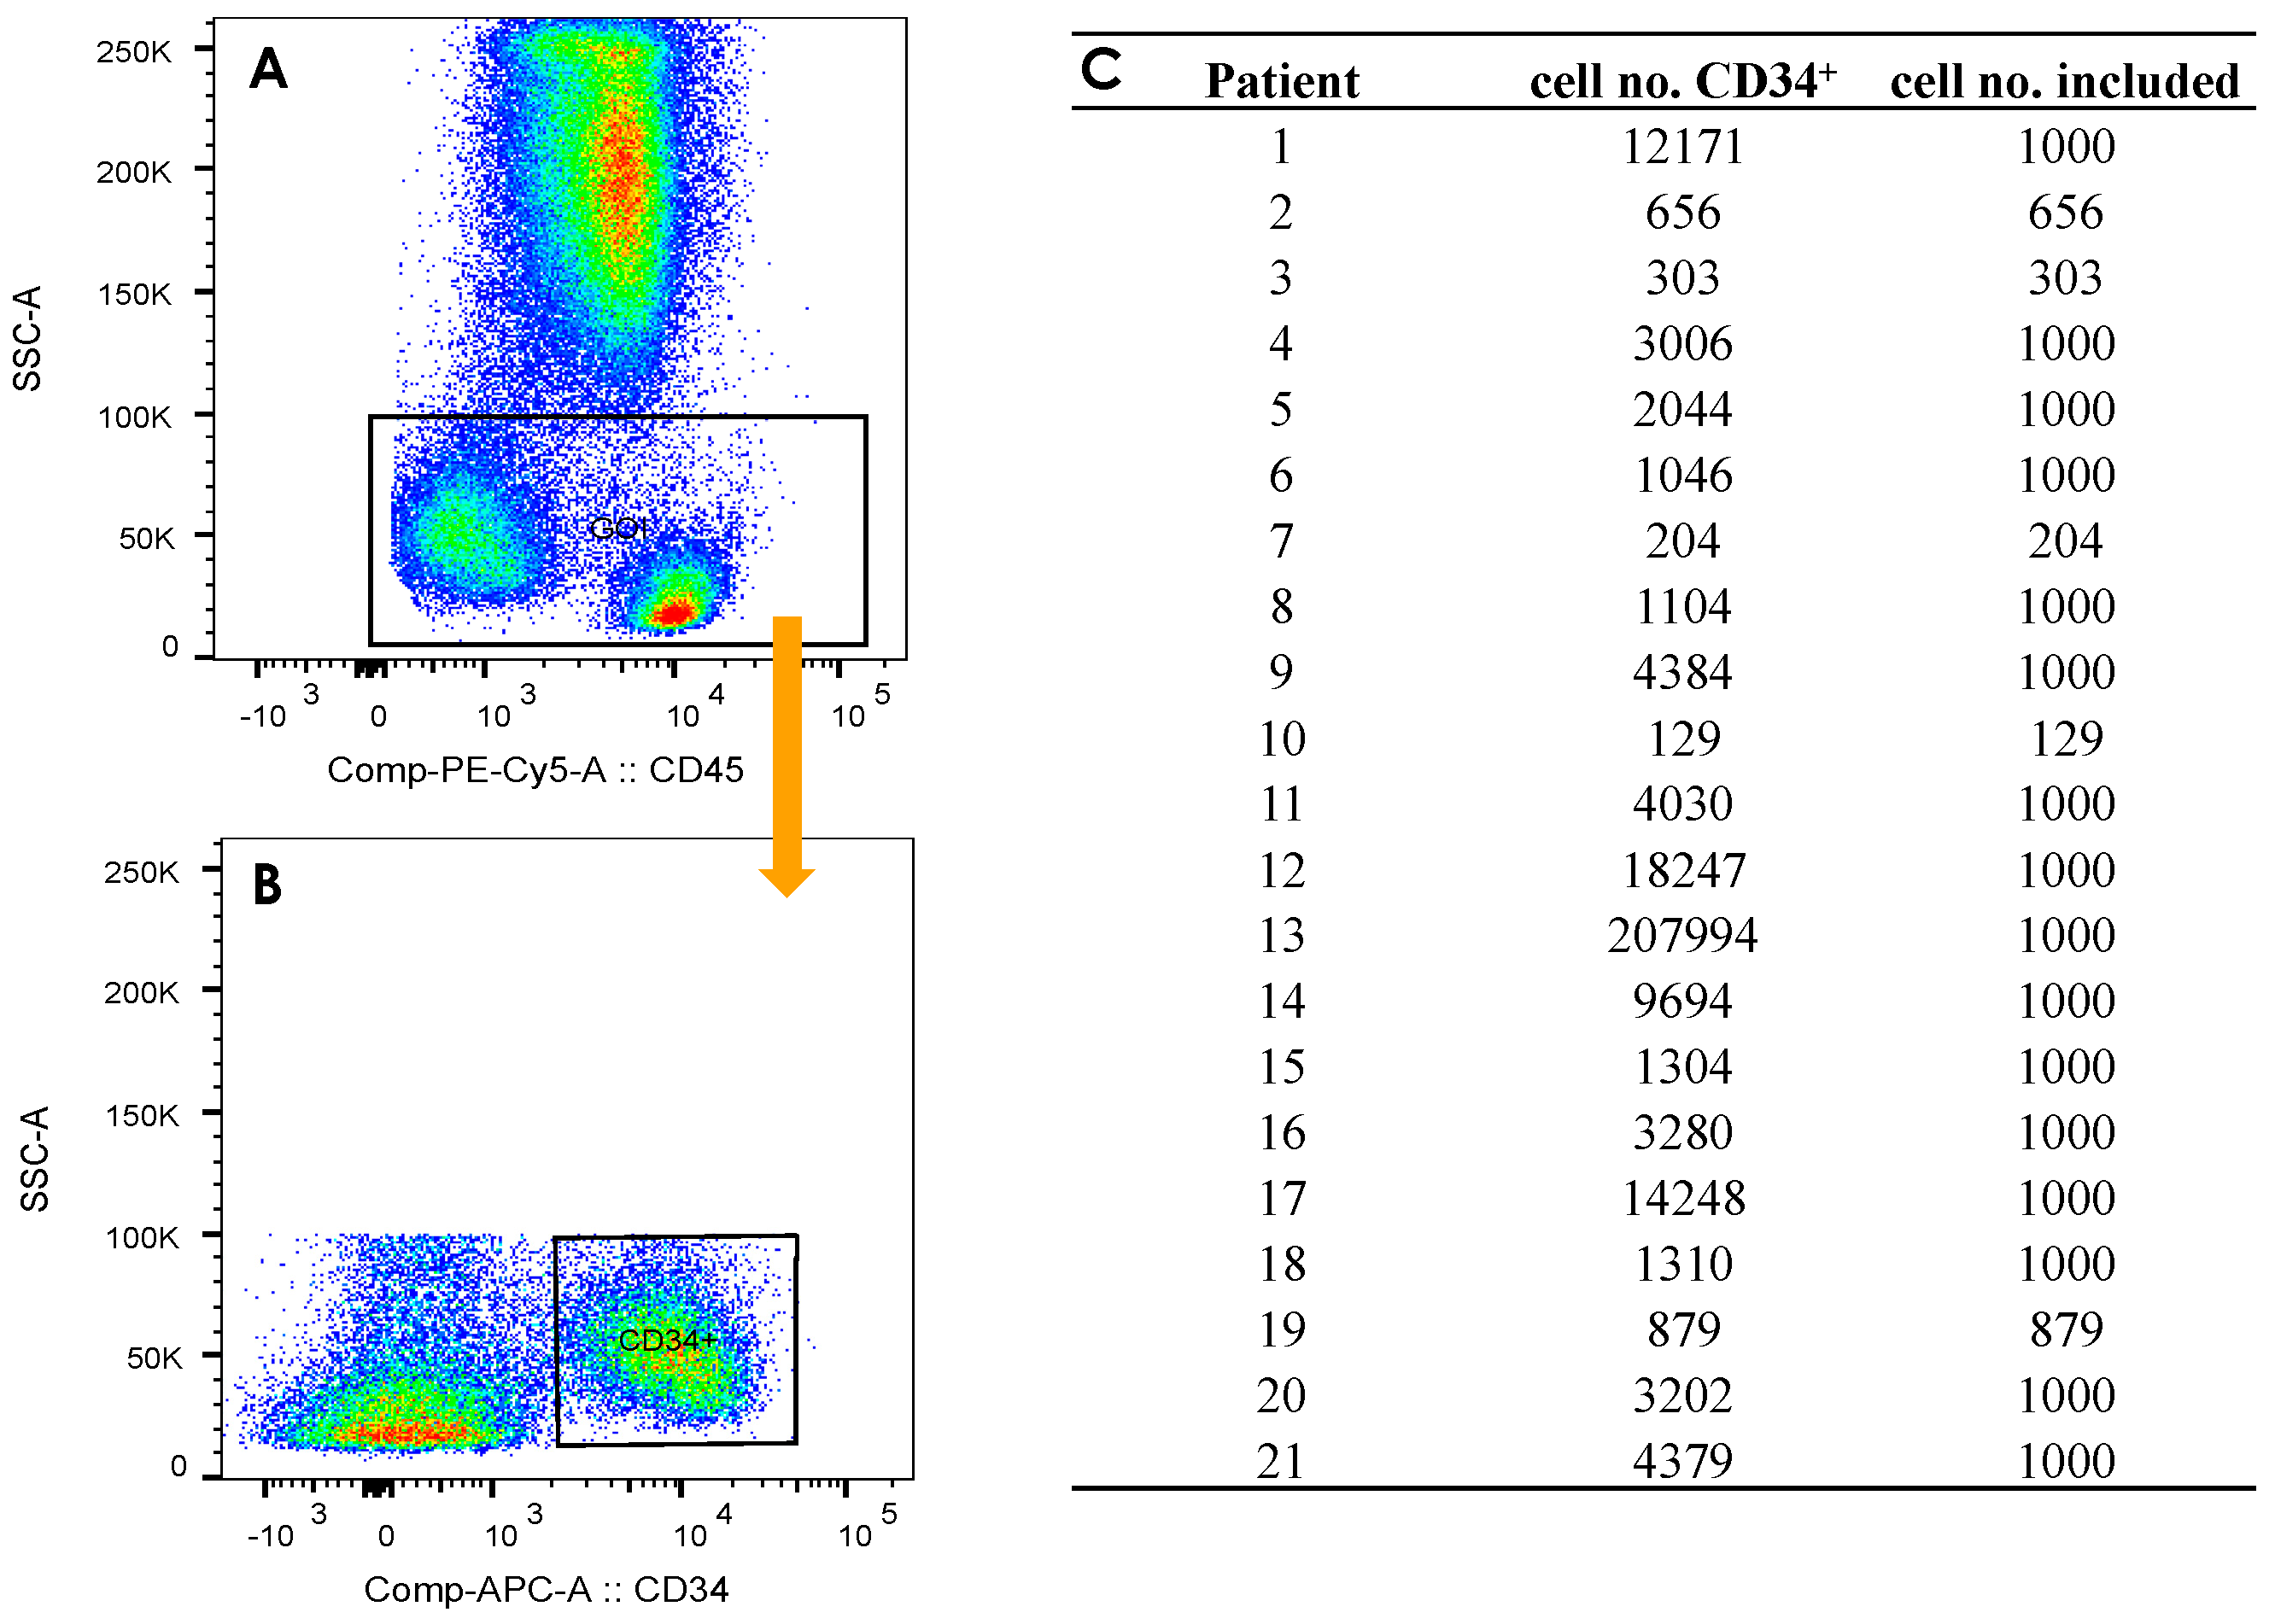
2.3. Gating Strategy
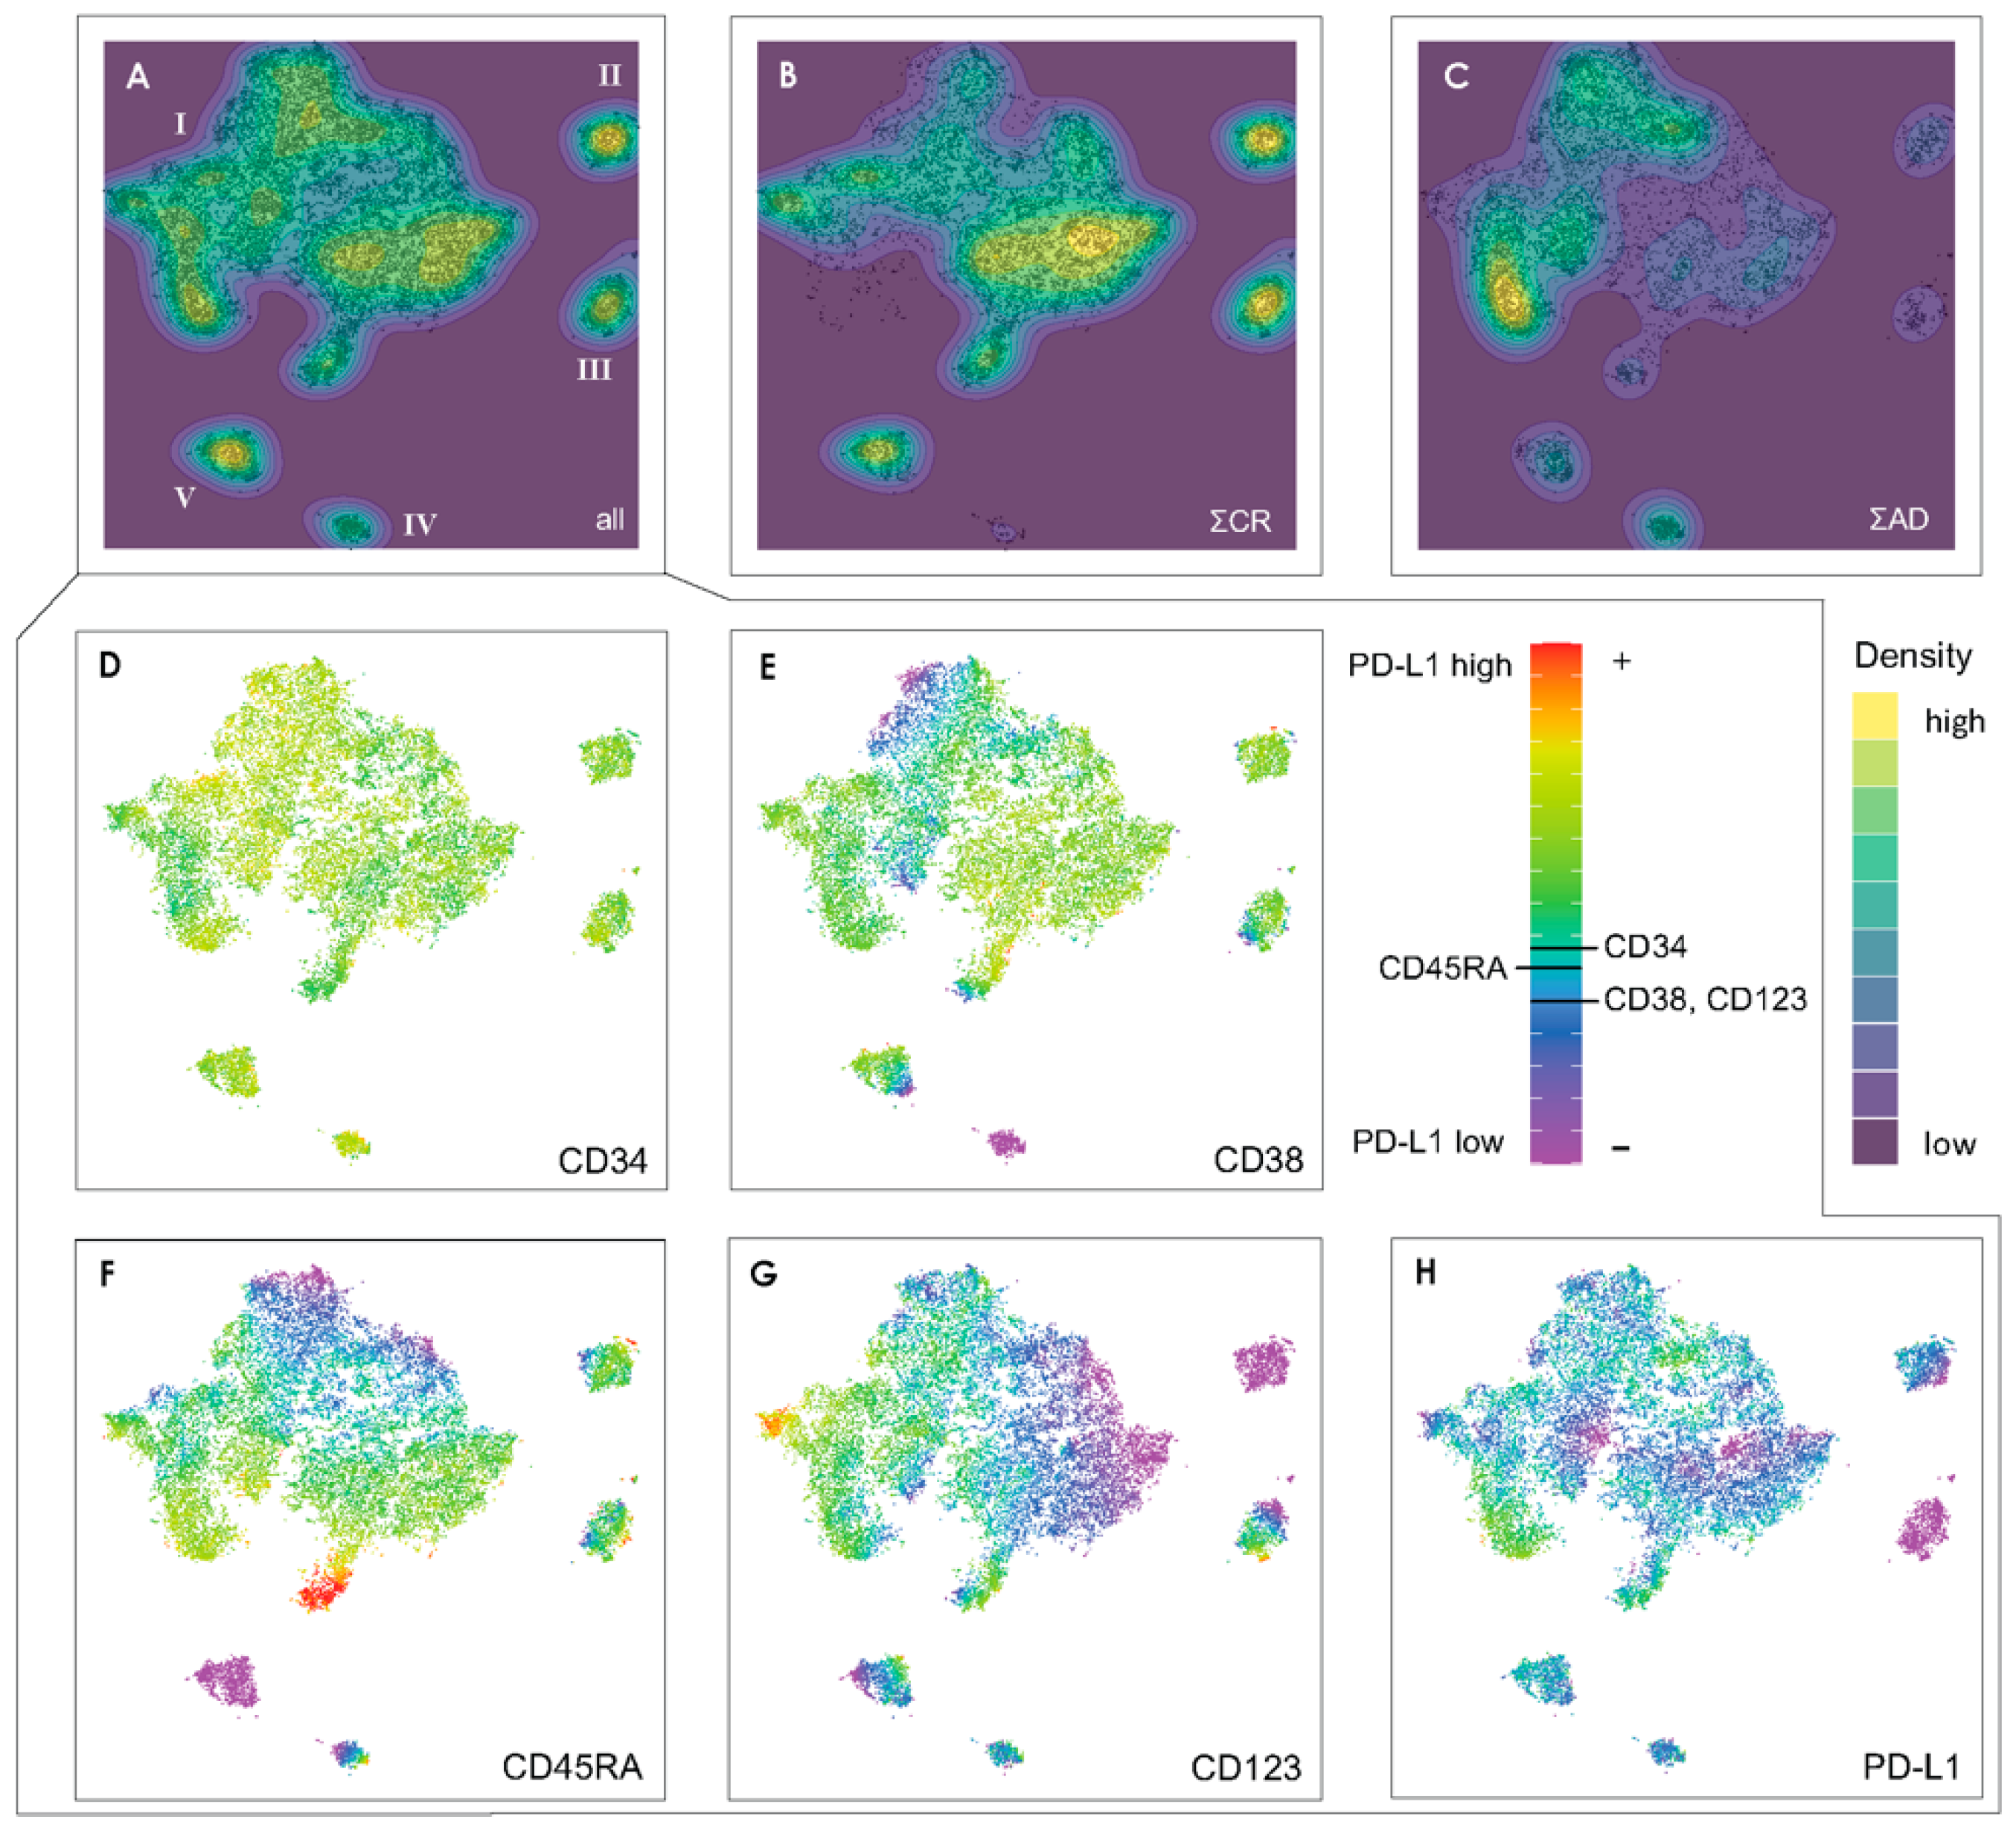
2.4. Visualization by t-SNE
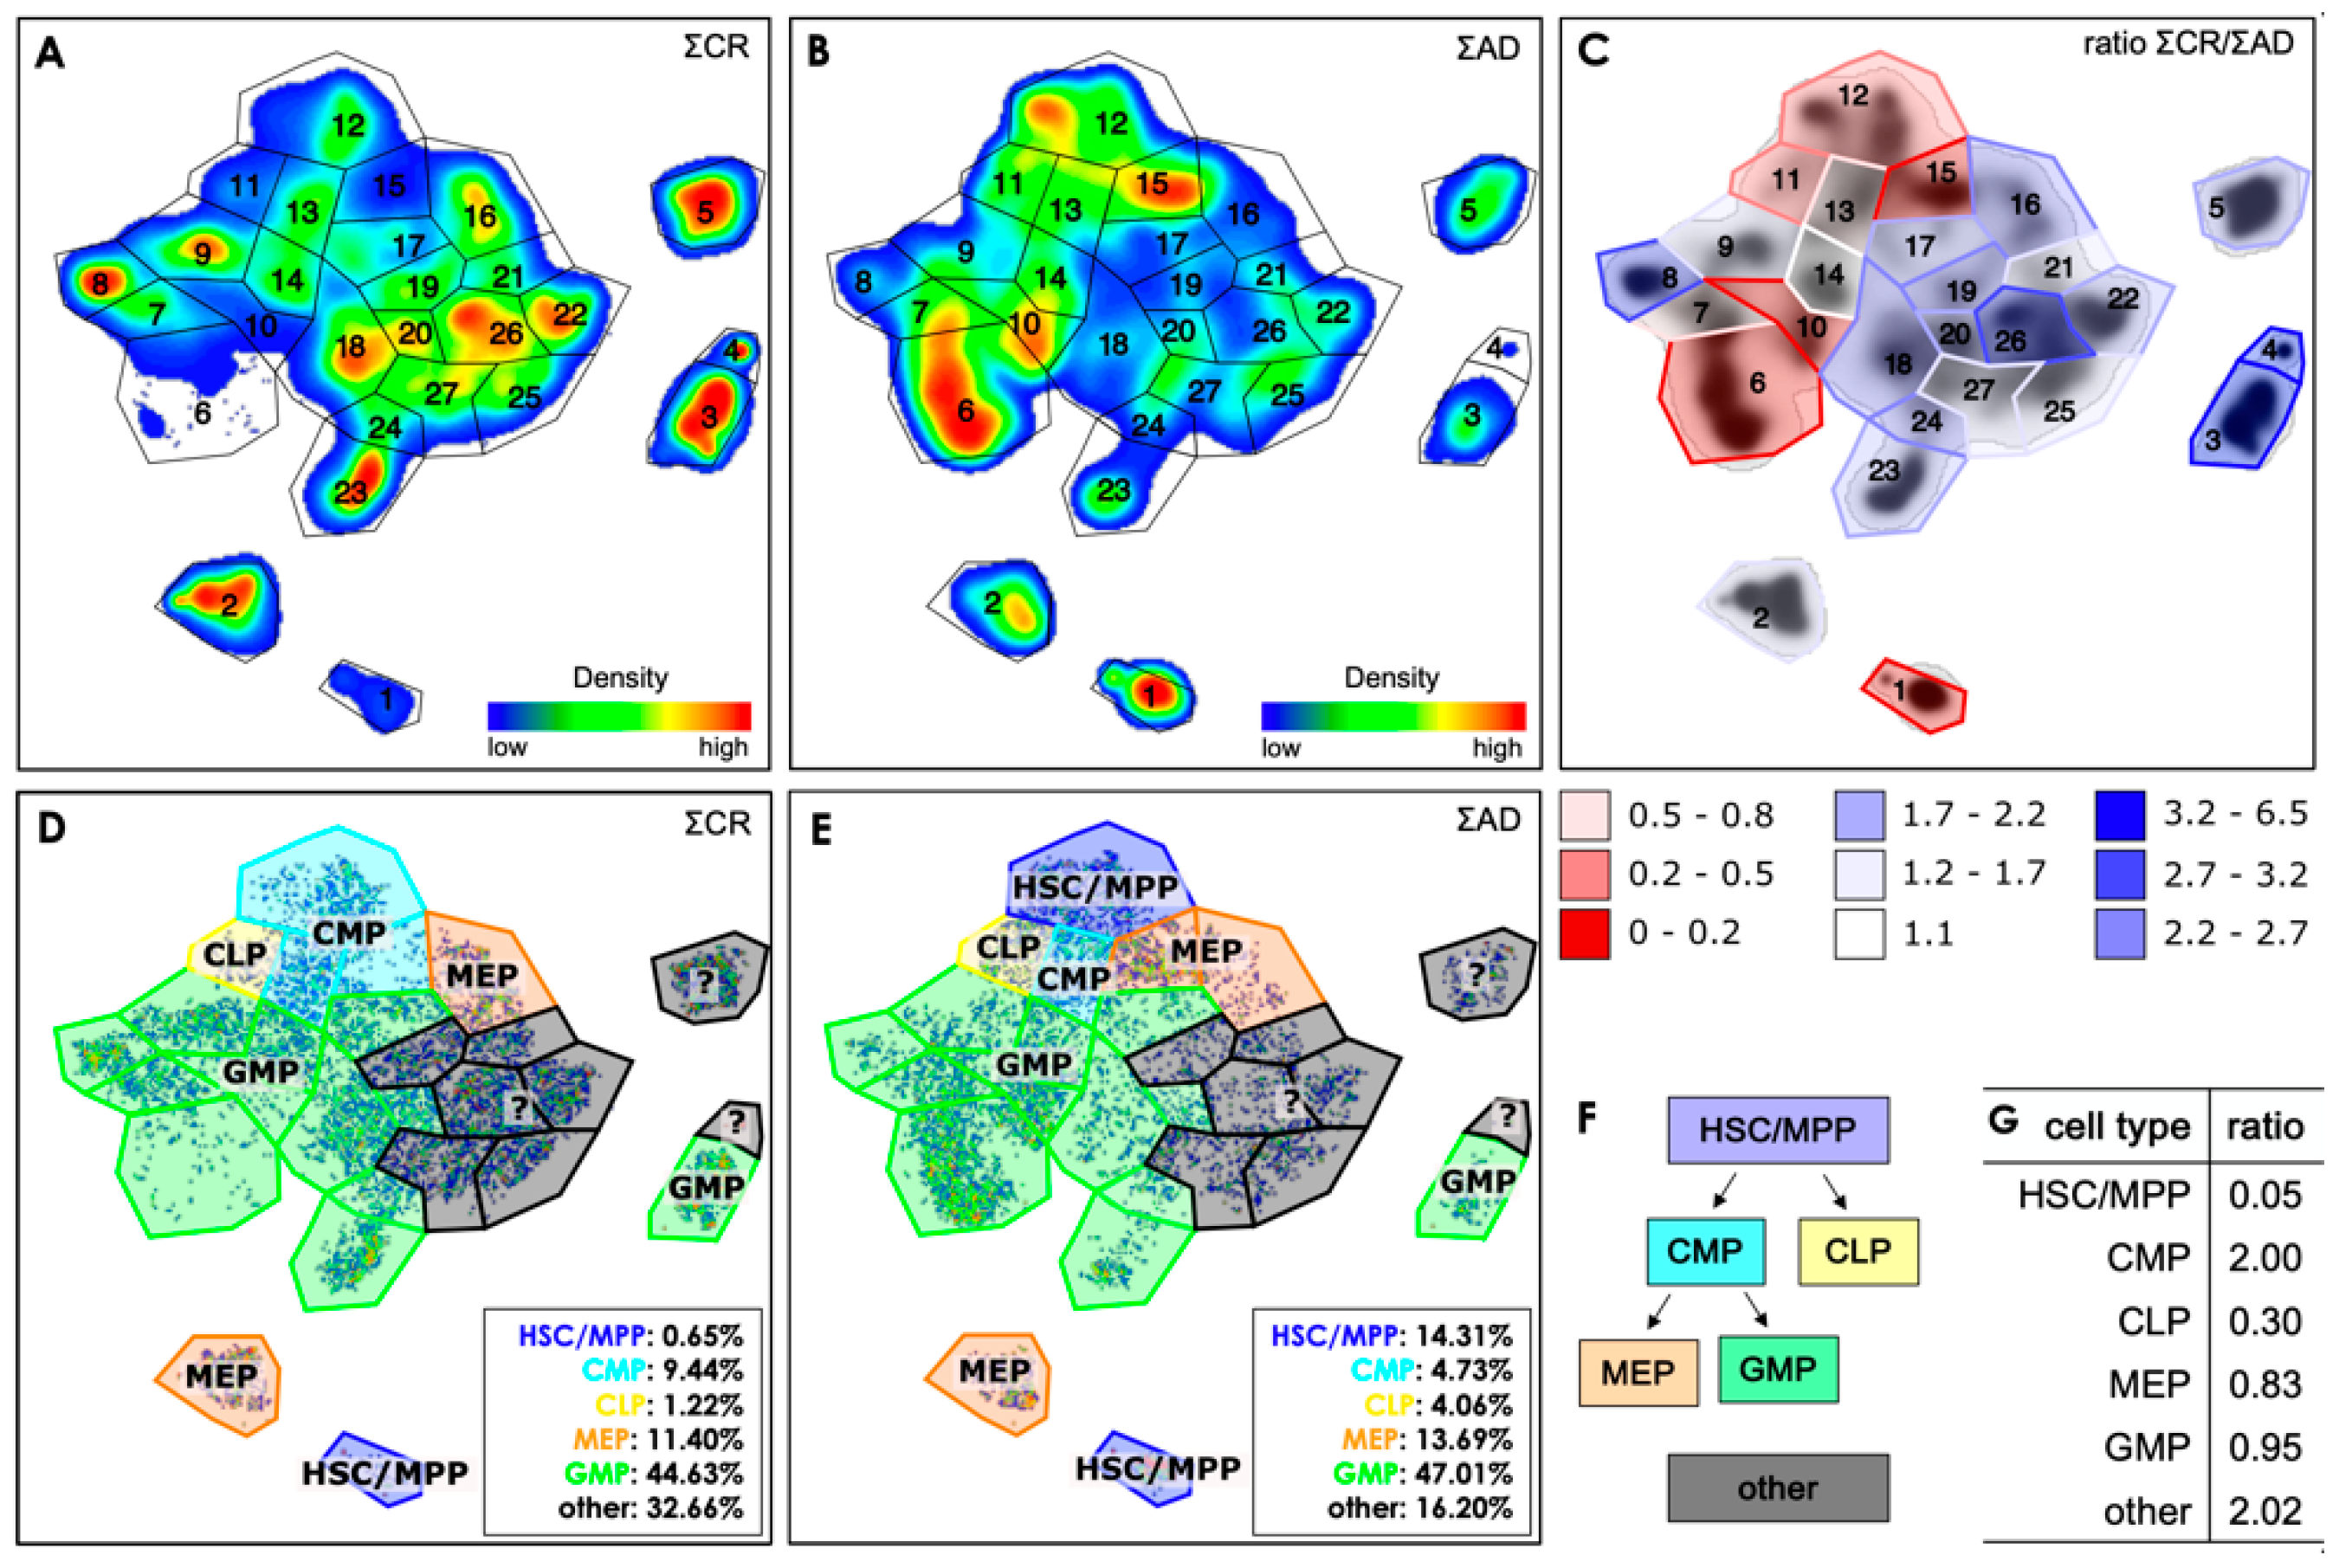
2.5. Defining Gates in the t-SNE Plots
2.6. Determination of the Immunological Phenotypes of HSPCs
2.7. Quantitative Comparison of t-SNE Plots Using the Pearson Correlation Coefficient
3. Results and Discussion
3.1. Design of a t-SNE Based Protocol for Multicolor Flow Cytometry Analysis
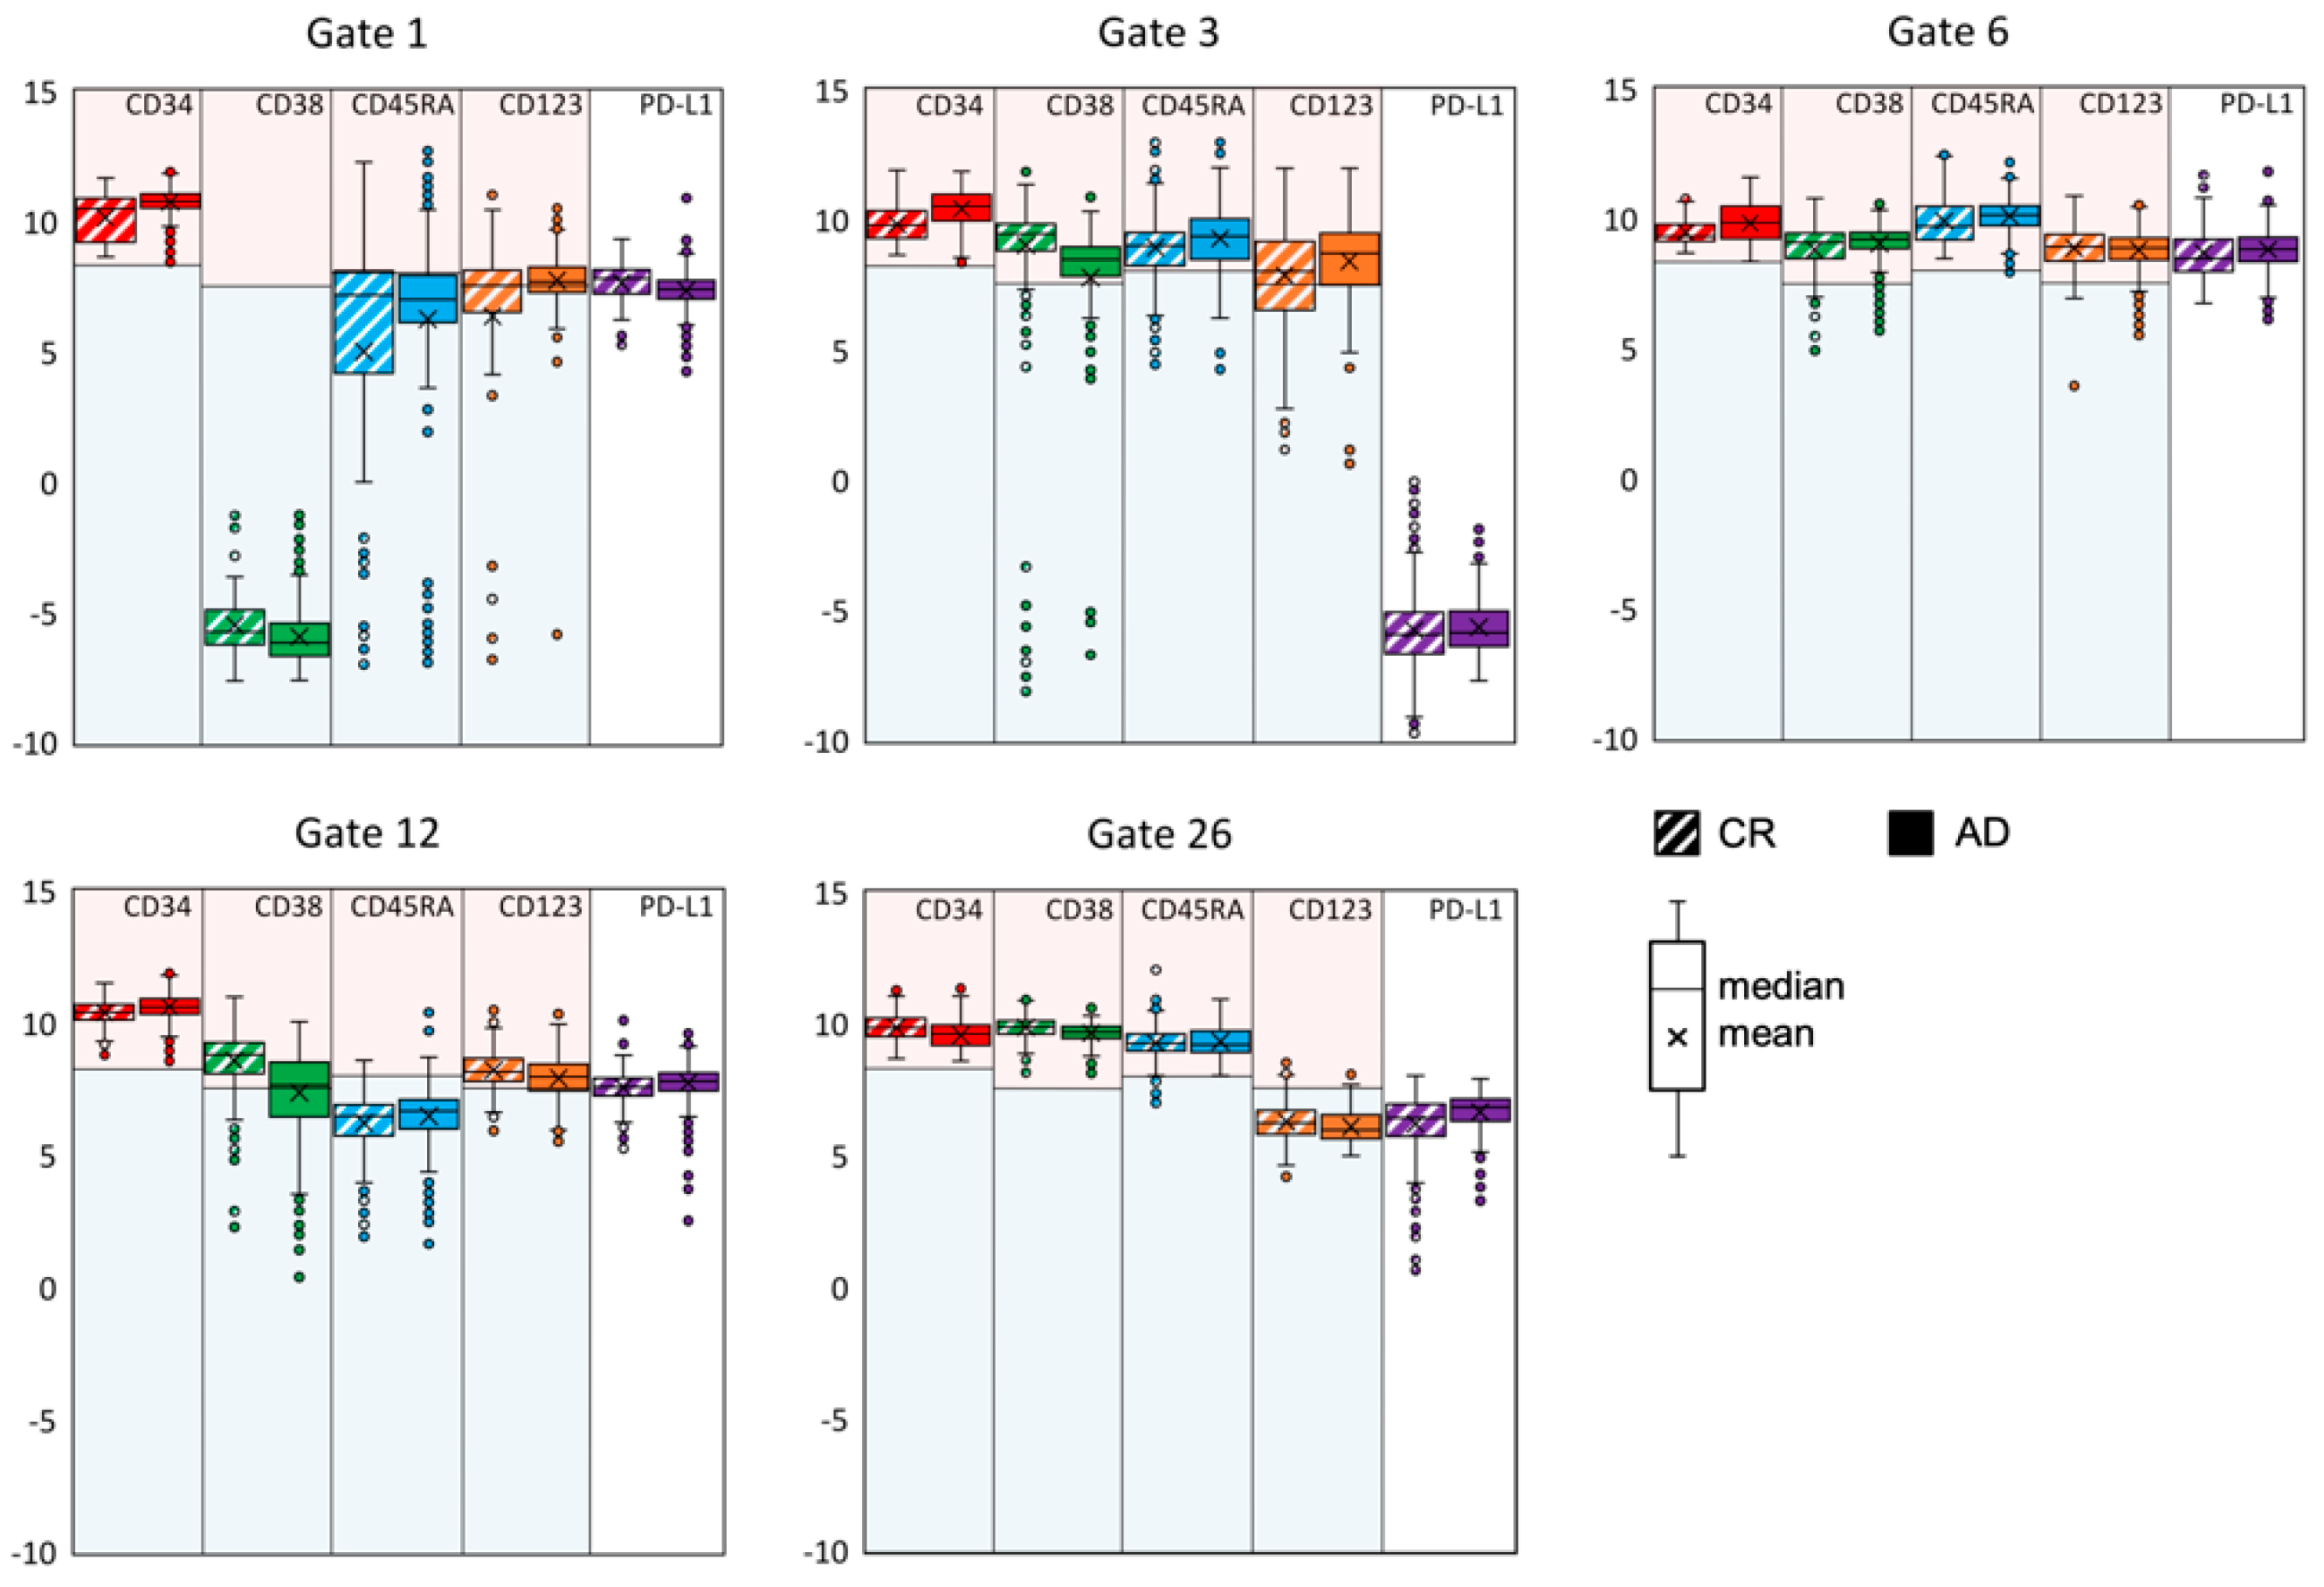
3.2. Exemplifying Discussion of t-SNE Gates
3.3. Quantification of the t-SNE Representation


4. Conclusions
Supplementary Materials
Author Contributions
Funding
Institutional Review Board Statement
Informed Consent Statement
Data Availability Statement
Acknowledgments
Conflicts of Interest
Abbreviations
| AD | active disease |
| AML | Acute Myeloid Leukemia |
| BM | bone marrow |
| CLP | common lymphoid progenitors |
| CMP | common myeloid progenitors |
| CR | complete remission |
| GMP | granulocyte-macrophage progenitors |
| GOI | gate of interest |
| HSCs | hematopoietic stem cells |
| HSPC | hematopoietic stem and progenitor cell |
| HSPCs | hematopoietic stem and progenitor cells |
| LSC | leukemic stem cell |
| LSCs | leukemic stem cells |
| MDS | Myelodysplastic Syndromes |
| MEF | marker expression function |
| MEP | megakaryocyte/erythroid progenitors |
| MPP | multipotent progenitor cells |
| PB | peripheral blood |
| PCA | principal component analysis |
| PD-L1 | programmed death ligand 1 |
| t-SNE | t-distributed stochastic neighbor embedding |
| UMAP | Uniform Manifold Approximation and Projection |
References
- Bonnet, D.; Dick, J.E. Human acute myeloid leukemia is organized as a hierarchy that originates from a primitive hematopoietic cell. Nat. Med. 1997, 3, 730–737. [Google Scholar] [CrossRef]
- Döhner, H.; Wei, A.H.; Appelbaum, F.R.; Craddock, C.; DiNardo, C.D.; Dombret, H.; Ebert, B.L.; Fenaux, P.; Godley, L.A.; Hasserjian, R.P.; Larson, R.A.; Levine, R.L.; Miyazaki, Y.; Niederwieser, D.; Ossenkoppele, G.; Röllig, C.; Sierra, J.; Stein, E.M.; Tallman, M.S.; Tien, H.F.; Wang, J.X.; Wierzbowska, A.; Löwenberg, B. Diagnosis and management of AML in adults: 2022 recommendations from an international expert panel on behalf of the ELN. Blood 2022, 140, 1345–1377. [Google Scholar] [CrossRef]
- Tran, T.B.; Siddon, A.J. Molecular findings in myeloid neoplasms. Int. J. Lab. Hematol. 2023, 45, 442–448. [Google Scholar] [CrossRef]
- Lapidot, T.; Sirard, C.; Vormoor, J.; Murdoch, B.; Hoang, T.; Cacerescortes, J.; Minden, M.; Paterson, B.; Caligiuri, M.A.; Dick, J.E. A cell initiating human acute myeloid-leukemia after transplantation into SCID mice. Nature 1994, 367, 645–648. [Google Scholar] [CrossRef] [PubMed]
- Niu, J.L.; Peng, D.Y.; Liu, L.B. Drug Resistance Mechanisms of Acute Myeloid Leukemia Stem Cells. Front. Oncol. 2022, 12, Article–896426. [Google Scholar] [CrossRef]
- Adan, A.; Alizada, G.; Kiraz, Y.; Baran, Y.; Nalbant, A. Flow cytometry: basic principles and applications. Crit. Rev. Biotechnol. 2017, 37, 163–176. [Google Scholar] [CrossRef]
- Liechti, T.; Roederer, M. OMIP-051-28-color flow cytometry panel to characterize B cells and myeloid cells. Cytom. A 2019, 95A, 150–155. [Google Scholar] [CrossRef]
- Fokken, H.; Waclawski, J.; Kattre, N.; Kloos, A.; Müller, S.; Ettinger, M.; Kacprowski, T.; Heuser, M.; Maetzig, T.; Schwarzer, A. A 19-color single-tube full spectrum flow cytometry assay for the detection of measurable residual disease in acute myeloid leukemia. Cytom. A 2023. [Google Scholar] [CrossRef] [PubMed]
- Pyne, S.; Hu, X.L.; Wang, K.; Rossin, E.; Lin, T.I.; Maier, L.M.; Baecher-Allan, C.; McLachlan, G.J.; Tamayo, P.; Hafler, D.A.; De Jager, P.L.; Mesirov, J.P. Automated high-dimensional flow cytometric data analysis. PNSA 2009, 106, 8519–8524. [Google Scholar] [CrossRef]
- Verschoor, C.P. , Lelic, A., Bramson, J.L., & Bowdish, D.M.E. An introduction to automated flow cytometry gating tools and their implementation. Front. Immunol. 2015, 6, Article–380. [Google Scholar]
- Moon, K.R.; van Dijk, D.; Wang, Z.; Gigante, S.; Burkhardt, D.B.; Chen, W.S.; Yim, K.; van den Elzen, A.; Hirn, M.J.; Coifman, R.R.; Ivanova, N.B.; Wolf, G.; Krishnaswamy, S. Visualizing structure and transitions in high-dimensional biological data. Nat. Biotechnol. 2019, 37, 1482–1492. [Google Scholar] [CrossRef]
- van der Maaten, L.; Hinton, G. Visualizing Data using t-SNE. J. Mach. Learn. Res. 2008, 9, 2579–605. [Google Scholar]
- Diggins, K.E.; Ferrell, P.B.; Irish, J.M. Methods for discovery and characterization of cell subsets in high dimensional mass cytometry data. Methods 2015, 82, 55–63. [Google Scholar] [CrossRef]
- Saeys, Y.; Van Gassen, S.; Lambrecht, B.N. Computational flow cytometry: helping to make sense of high-dimensional immunology data. Nat. Rev. Immunol. 2016, 16, 449–462. [Google Scholar] [CrossRef]
- Mair, F.; Hartmann, F.J.; Mrdjen, D.; Tosevski, V.; Krieg, C.; Becher, B. The end of gating? An introduction to automated analysis of high dimensional cytometry data. Eur. J. Immunol. 2016, 46, 34–43. [Google Scholar] [CrossRef]
- Hu, Z.C.; Bhattacharya, S.; Butte, A.J. Application of Machine Learning for Cytometry Data. Front. Immunol. 2022, 12, Article–787574. [Google Scholar] [CrossRef]
- Amir, E.D.; Davis, K.L.; Tadmor, M.D.; Simonds, E.F.; Levine, J.H.; Bendall, S.C.; Shenfeld, D.K.; Krishnaswamy, S.; Nolan, G.P.; Pe'er, D. viSNE enables visualization of high dimensional single-cell data and reveals phenotypic heterogeneity of leukemia. Nat. Biotechnol. 2013, 31, 545–552. [Google Scholar] [CrossRef]
- McInnes, L.; Healy, J.; and Melville, J. UMAP: uniform manifold approximation and projection for dimension reduction. Preprint at arXiv 2018. [Google Scholar]
- Becht, E.; McInnes, L.; Healy, J.; Dutertre, C.A.; Kwok, I.W.H.; Ng, L.G.; Ginhoux, F.; Newell, E.W. Dimensionality reduction for visualizing single-cell data using UMAP. Nat. Biotechnol. 2019, 37, 38–44. [Google Scholar] [CrossRef] [PubMed]
- Cheung, M.; Campbell, J.J.; Whitby, L.; Thomas, R.J.; Braybrook, J.; Petzing, J. Current trends in flow cytometry automated data analysis software. Cytom. A 2021, 99, 1007–1021. [Google Scholar] [CrossRef] [PubMed]
- Kobak, D.; Berens, P. The art of using t-SNE for single-cell transcriptomics. Nat. Commun. 2019, 10, Article–5416. [Google Scholar] [CrossRef]
- Wattenberg, M.; Viégas, F.; Johnson, I. How to use t-SNE effectively. Distill 2016. Available online: http://distill.pub/2016/misread-tsne. [CrossRef]
- Huang, H.Y.; Wang, Y.F.; Rudin, C.; Browne, E.P. Towards a comprehensive evaluation of dimension reduction methods for transcriptomic data visualization. Commun. Biol. 2022, 5, Article–719. [Google Scholar] [CrossRef] [PubMed]
- Wang, Y.F.; Huang, H.Y.; Rudin, C.; Shaposhnik, Y. Understanding How Dimension Reduction Tools Work: An Empirical Approach to Deciphering t-SNE, UMAP, TriMap, and PaCMAP for Data Visualization. J. Mach. Learn. Res. 2021, 22. [Google Scholar]
- Kobak, D.; Linderman, G.C. Initialization is critical for preserving global data structure in both t-SNE and UMAP. Nat. Biotechnol. 2021, 39. [Google Scholar] [CrossRef] [PubMed]
- Finak, G.; Perez, J.M.; Weng, A.; Gottardo, R. Optimizing transformations for automated, high throughput analysis of flow cytometry data. Bmc Bioinform 2010, 11, Article–546. [Google Scholar] [CrossRef] [PubMed]
- Belkina, A.C.; Ciccolella, C.O.; Anno, R.; Halpert, R.; Spidlen, J.; Snyder-Cappione, J.E. Automated optimized parameters for T-distributed stochastic neighbor embedding improve visualization and analysis of large datasets. Nat. Commun. 2019, 10, Article–5415. [Google Scholar] [CrossRef] [PubMed]
- Civin, C.I.; Loken, M.R. Cell-surface antigens on human marrow-cells - dissection of hematopoietic development using monoclonal-antibodies and multiparameter flow-cytometry. Int. J. Cell Cloning 1987, 5, 267–288. [Google Scholar] [CrossRef]
- Terstappen, L.; Huang, S.; Safford, M.; Lansdorp, P.M.; Loken, M.R. Sequential generations of hematopoietic colonies derived from single nonlineage-committed CD34+CD38- progenitor cells. Blood 1991, 77, 1218–1227. [Google Scholar] [CrossRef]
- Lansdorp, P.M.; Sutherland, H.J.; Eaves, C.J. Selective expression of CD45 isoforms on functional subpopulations of CD34+ hematopoietic-cells from human bone-marrow. J. Exp. Med. 1990, 172, 363–366. [Google Scholar] [CrossRef]
- Sato, N.; Caux, C.; Kitamura, T.; Watanabe, Y.; Arai, K.; Banchereau, J.; Miyajima, A. Expression and factor-dependent modulation of the interleukin-3 receptor subunits on human hematopoietic-cells. Blood 1993, 82, 752–761. [Google Scholar] [CrossRef]
- Kersten, B.; Valkering, M.; Wouters, R.; van Amerongen, R.; Hanekamp, D.; Kwidama, Z.; Valk, P.; Ossenkoppele, G.; Zeijlemaker, W.; Kaspers, G.; Cloos, J.; Schuurhuis, G.J. CD45RA, a specific marker for leukaemia stem cell sub-populations in acute myeloid leukaemia. Br. J. Haematol. 2016, 173, 219–35. [Google Scholar] [CrossRef] [PubMed]
- Brod, S.A.; Rudd, C.E.; Purvee, M.; Hafler, D.A. Lymphokine regulation of CD45R expression on human t-cell clones. J. Exp. Med. 1989, 170, 2147–2152. [Google Scholar] [CrossRef] [PubMed]
- Testa, U.; Pelosi, E.; Castelli, G. CD123 as a Therapeutic Target in the Treatment of Hematological Malignancies. Cancers 2019, 11, Article–1358. [Google Scholar] [CrossRef] [PubMed]
- Testa, U.; Riccioni, R.; Militi, S.; Coccia, E.; Stellacci, E.; Samoggia, P.; Latagliata, R.; Mariani, G.; Rossini, A.; Battistini, A.; Lo-Coco, F.; Peschle, C. Elevated expression of IL-3Rα in acute myelogenous leukemia is associated with enhanced blast proliferation, increased cellularity, and poor prognosis. Blood 2002, 100, 2980–2988. [Google Scholar] [CrossRef] [PubMed]
- Al-Mawali, A.; Pinto, A.D.; Al-Zadijali, S. ; CD34+CD38–CD123+ Cells are present in virtually all Acute Myeloid Leukaemia Blasts: A promising single unique phenotype for minimal residual disease detection. Acta Haematol. 2017, 138, 75–181. [Google Scholar] [CrossRef]
- Moskorz, W.; Cosmovici, C.; Jäger, P.S.; Cadeddu, R.P.; Timm, J.; Haas, R. Myelodysplastic syndrome patients display alterations in their immune status reflected by increased PD-L1-expressing stem cells and highly dynamic exhausted T-cell frequencies. Br. J. Haematol. 2021, 193, 941–945. [Google Scholar] [CrossRef]
- Gurska, L.; Gritsman, K. Unveiling T cell evasion mechanisms to immune checkpoint inhibitors in acute myeloid leukemia. CDR 2023, 6, 674–687. [Google Scholar] [CrossRef] [PubMed]
- Eshghi, S.T.; Au-Yeung, A.; Takahashi, C.; Bolen, C.R.; Nyachienga, M.N.; Lear, S.P.; Green, C.; Mathews, W.R.; O'Gorman, W.E. Quantitative Comparison of Conventional and t-SNE-guided Gating Analyses. Front. Immunol. 2019, 10, Article–1194. [Google Scholar] [CrossRef]
- Ester, M.; Krigel, H.P.; Sander, J.; Xu, X. A density-based algorithm for discovering clusters in large spatial databases with noise. Proceedings of the 2nd International Conference on Knowledge Discovery and Data Mining 1996, 226–231. [Google Scholar]
- Campello, R.J.; Moulavi, D.; Sander, J. Density-Based Clustering Based on Hierarchical Density Estimates. In Pacific-Asia Conference on Knowledge Discovery and Data Mining; Springer: Berlin, Heidelberg, 2013; pp. 160–172. [Google Scholar]
- Bruns, I.; Cadeddu, R.P.; Brueckmann, I.; Fröbel, J.; Geyh, S.; Büst, S.; Fischer, J.C.; Roels, F.; Wilk, C.M.; Schildberg, F.A.; Hünerlitürkoglu, A.N.; Zilkens, C.; Jäger, M.; Steidl, U.; Zohren, F.; Fenk, R.; Kobbe, G.; Brors, B.; Czibere, A.; Schroeder, T.; Trumpp, A.; Haas, R. Multiple myeloma-related deregulation of bone marrow-derived CD34+ hematopoietic stem and progenitor cells. Blood 2012, 120, 2620–2630. [Google Scholar] [CrossRef]
- Terstappen, L.; Huang, S. Analysis of bone-marrow stem-cell. Blood Cells 1994, 20, 45–63. [Google Scholar] [PubMed]
- Lapidot, T.; Sirard, C.; Vormoor, J.; Murdoch, B.; Hoang, T.; Cacerescortes, J.; Minden, M.; Paterson, B.; Caligiuri, M.A.; Dick, J.E. (1994). A cell initiating human acute myeloid-leukemia after transplantation into SCID mice. Nature 1994, 367, 645–648. [Google Scholar] [CrossRef] [PubMed]
- Ho, T.C.; LaMere, M.; Stevens, B.M.; Ashton, J.M.; Myers, J.R.; O'Dwyer, K.M.; Liesveld, J.L.; Mendler, J.H.; Guzman, M.; Morrissette, J.D.; Zhao, J.H.; Wang, E.S.; Wetzler, M.; Jordan, C.T.; Becker, M.W. Evolution of acute myelogenous leukemia stem cell properties after treatment and progression. Blood 2016, 128, 1671–1678. [Google Scholar] [CrossRef] [PubMed]
- Roca, C.P.; Burton, O.T.; Neumann, J.; Tareen, S.; Whyte, C.E.; Gergelits, V.; Veiga, R.V.; Humblet-Baron, S.; Liston, A. A cross entropy test allows quantitative statistical comparison of t-SNE and UMAP representations. Cell Rep. Methods 2023, 3, Article–100390. [Google Scholar] [CrossRef]
- Policar, P.G.; Strazar, M.; Zupan, B. Embedding to reference t-SNE space addresses batch effects in single-cell classification. Mach. Learn. 2023, 112, 721–740. [Google Scholar] [CrossRef]
| Group | Pat. ID |
Age | Sex | WHO classification |
Status of Disease | Initial Mutation | Cytogenetic | Time** [months] |
|---|---|---|---|---|---|---|---|---|
| AD | 1 | 61 | m | MDS-IB2 | Ad | - | 46, XY | 11 |
| AD | 4 | 58 | f | Acute monocytic leukaemia | Mr | - | 47, XX, +11 | 10 |
| AD | 10 | 58 | m | MDS-IB2 | Hr | - | 46, XY | 30 |
| AD | 11 | 67 | m | AML, md-r | Mr/p | FLT3-ITD, RUNX1, EZH2 | 46, XY | 5 |
| AD | 12 | 65 | f | AML, md-r | Hr | ASXL1 | 46, XX, del(11)(q21,q24) [21] | 26 |
| AD | 13 | 60 | m | Acute myelomonocytic leukaemia | Id | IDH1 | 47, XY, +8 [22]/46, XY [2] | 0 |
| AD | 14 | 69 | f | AML, md-r | Hr | JAK2 | 45, XX, -7 | 39 |
| AD | 16 | 60 | m | AML, md-r | Hr | ASXL1, RUNX1 | not initial: 46, XY, del(3)(q21q25) [23]/47idem+8 [5] | 53 |
| AD | 17 | 60 | f | AML with minimal differentiation | Hr | IDH2 | 47, XX, +mar [4]/46, XX [22], cytogenetic aberration: 7(4;12) |
216 |
| CR | 2 | 76 | m | MDS-IB2 | cr | ASXL1 | 46, XY | 13 |
| CR | 3 | 67 | f | AML with CEBPA mutation | cr | CEBPA | 46, XX | 21 |
| CR | 5 | 56 | f | AML with maturation | cr | DNMT3A, IDH1 | 46, XX | 4 |
| CR | 6 | 41 | m | AML, md-r | cr | RUNX1 | complex karyotype | 3 |
| CR | 7 | 54 | f | AML with NPM1 mutation | cr | NPM1, IDH2 | 46, XX | 8 |
| CR | 8 | 51 | m | MDS with low blasts and SF3B1 mutation (MDS-SF3B1) | cr * | JAK2, SF3B1 | complex karyotype | 60 |
| CR | 9 | 67 | f | AML with CBFB-MYH11 fusion | cr | CBFB-MYH11 | 46, XX, inv(16)(p13q22) [24]/ 46, XX [3] | 29 |
| CR | 15 | 28 | f | AML, md-r | cr | RUNX1 | complex karyotype | 47 |
| CR | 18 | 39 | f | AML, md-r | cr | FLT3-ITD | del(7)(q22 [22]/46, XX [3] | 2 |
| CR | 19 | 40 | m | AML, md-r | cr | ASXL1, c-KIT, TET2 | +8, XXY, add(21p) | 32 |
| CR | 20 | 61 | f | AML, md-r | cr | ASXL1, RUNX1 | 46, XX | 57 |
| CR | 21 | 70 | m | AML, md-r | cr * | ASXL1, RUNX1, TET2, EZH2 | 46, XY | 11 |
| Specificity | Clone | Fluorescence Dye | Vendor | Cat # | RRID | Concentration |
|---|---|---|---|---|---|---|
| Fixable Viability Dye | / | eFlour506 | TFS | 65-0866-14 | / | 1:1000 |
| PD-L1 | MIH5 | PerCP-eFlour710 | TFS | 46-5983-42 | AB_11041815 | 1:50 |
| CD123 | 6H6 | PE | TFS | 12-1239-42 | AB_10609206 | 1:100 |
| CD45 | HI30 | PE-Cy5 | BioLegend | 304010 | AB_314398 | 1:200 |
| CD45RA | HI100 | PE-Cy7 | TFS | 25-0458-42 | AB_1548774 | 1:200 |
| CD34 | 4H11 | APC | TFS | 17-0349-41 | AB_2016604 | 1:50 |
| CD38 | HIT2 | APC-eFlour780 | TFS | 47-0389-41 | AB_11217871 | 1:50 |
| cell type | label | antigen combination |
|---|---|---|
| hematopoietic stem cells | HSC | CD34+ CD38- (CD90+ not included) |
| multipotent progenitor cells | MPP | CD34+ CD38- (CD90- not included) |
| common lymphoid progenitors | CLP | CD34+ CD38- CD45RA+ |
| common myeloid progenitors | CMP | CD34+ CD38+ CD45RA- CD123low |
| megakaryocyte/erythroid progenitors | MEP | CD34+ CD38+ CD45RA- CD123- |
| granulocyte-macrophage progenitors | GMP | CD34+ CD38+ CD45RA+ CD123+ |
| not identified by this set of antigens | other | various combinations |
| 1 | 2 | 3 | 4 | 5 | 6 | |
|---|---|---|---|---|---|---|
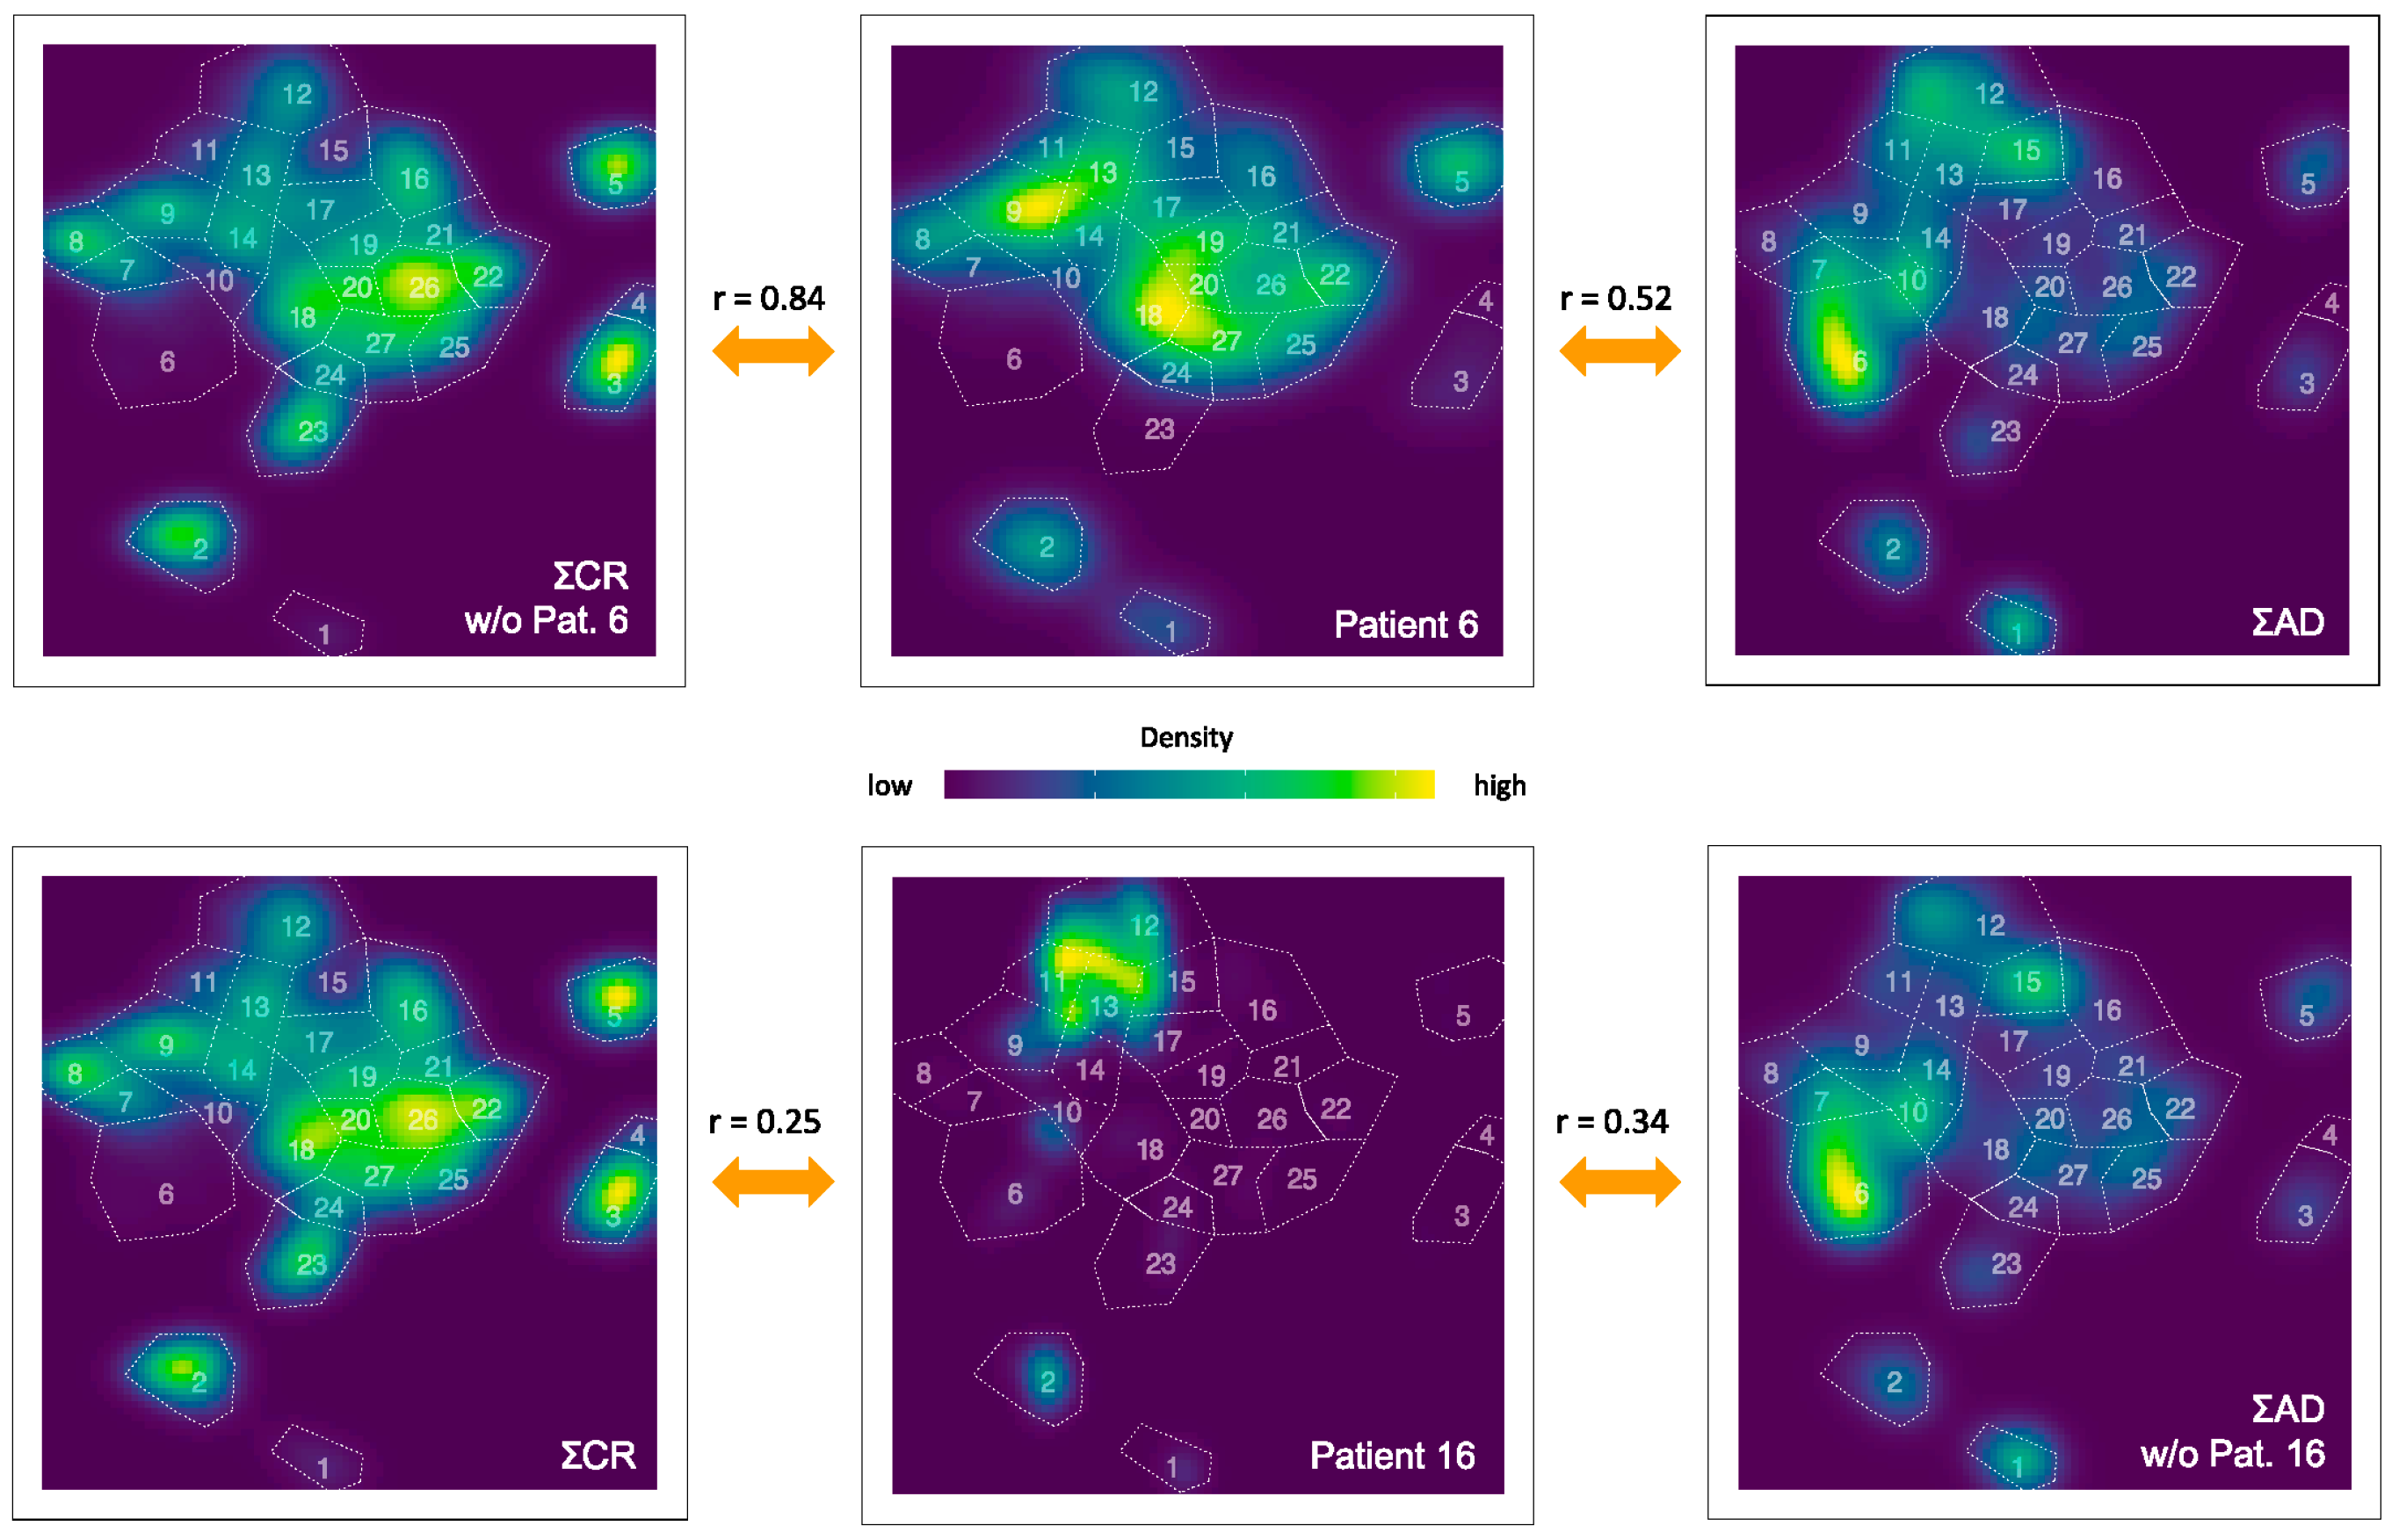
| Pat. | NAD vs. AD | NAD vs. CR | Pat. | NCR vs. CR | NCR vs. AD | CR vs. AD |
| 1 | 0.23 (0.25) | 0.17 | 2 | 0.46 | 0.17 (0.00) | 0.46 (0.24) |
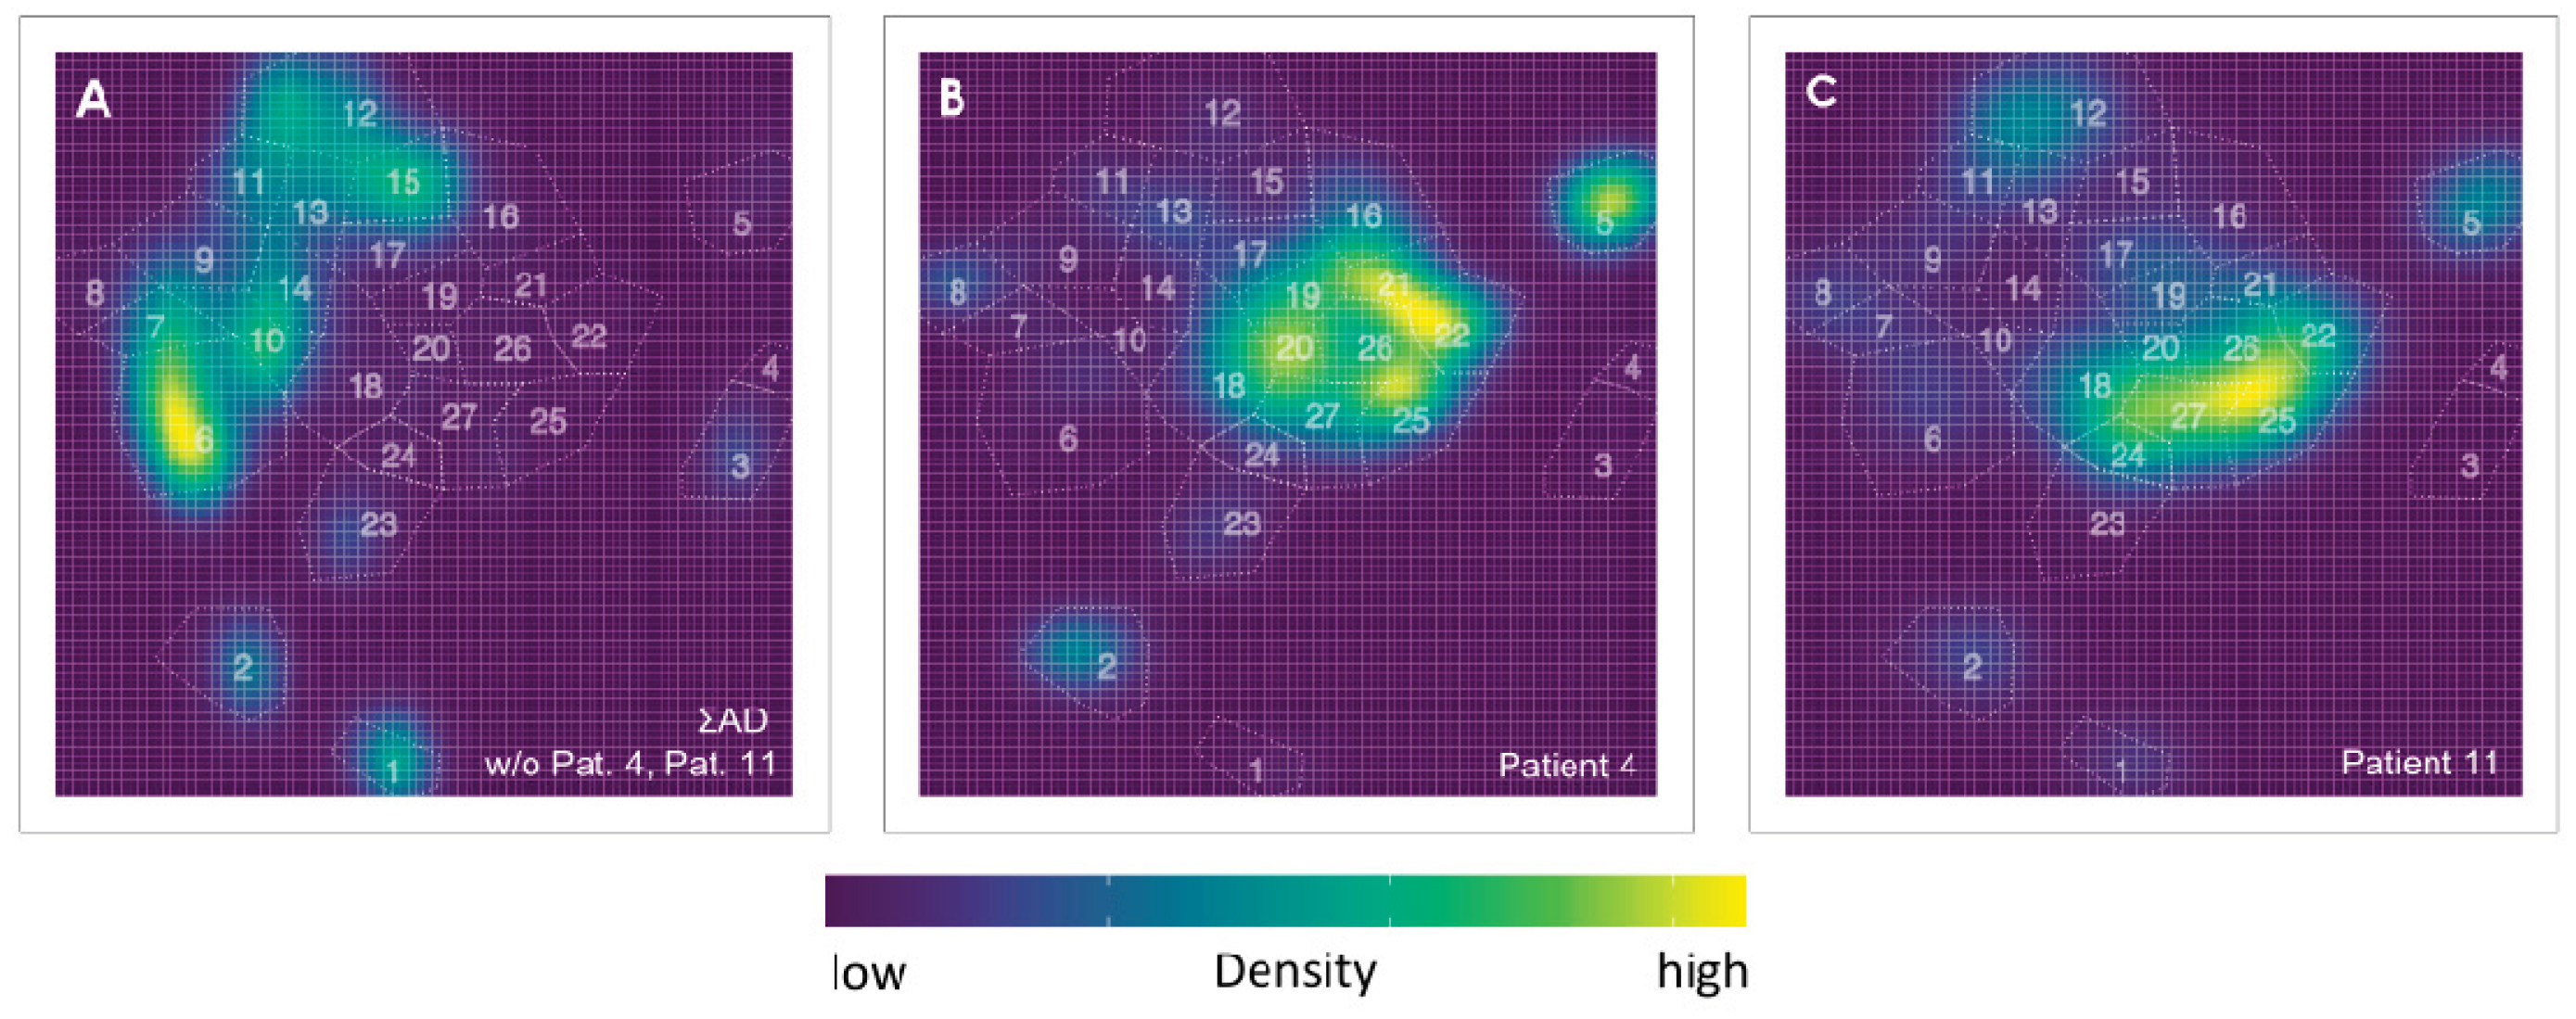
| 4 | 0.12 | 0.80 | 3 | 0.53 | 0.41 (0.36) | |
| 10 | -0.01 (-0.2) | 0.06 | 5 | 0.77 | 0.44 (0.23) | |
| 11 | 0.29 | 0.71 | 6 | 0.84 | 0.52 (0.31) | |
| 12 | 0.14 (0.13) | 0.12 | 7 | 0.50 | 0.43 (0.41) | |
| 13 | 0.05 (0.07) | -0.06 | 8 | 0.56 | 0.19 (0.02) | |
| 14 | 0.22 (0.19) | 0.14 | 9 | 0.61 | 0.24 (-0.05) | |
| 16 | 0.34 (0.33) | 0.25 | 15 | 0.70 | 0.55 (0.43) | |
| 17 | 0.12 (0.11) | 0.15 | 18 | 0.43 | 0.48 (0.42) | |
| 19 | 0.28 | 0.18 (0.16) | ||||
| 20 | 0.67 | 0.25 (0.01) | ||||
| 21 | 0.69 | 0.43 (0.28) |
Disclaimer/Publisher’s Note: The statements, opinions and data contained in all publications are solely those of the individual author(s) and contributor(s) and not of MDPI and/or the editor(s). MDPI and/or the editor(s) disclaim responsibility for any injury to people or property resulting from any ideas, methods, instructions or products referred to in the content. |
© 2024 by the authors. Licensee MDPI, Basel, Switzerland. This article is an open access article distributed under the terms and conditions of the Creative Commons Attribution (CC BY) license (http://creativecommons.org/licenses/by/4.0/).


