Submitted:
01 March 2024
Posted:
04 March 2024
You are already at the latest version
Abstract
Predictive biomarkers for immune checkpoint inhibitors (ICI), such as PD-L1 expression (TPS), remain limited in clinical applications. Improved novel ICI predictive biomarkers are urgently needed. We evaluated a live single-cell functional liquid biopsy cytokine profiling platform to track immunotherapy treatment response and outcomes. Peripheral blood mononuclear cell samples of healthy donors and NSCLC patients undergoing ICI-based therapies were collected longitudinally pre-/post-treatment under IRB-approved protocols. Samples were enriched for CD4+ and CD8+ T-lymphocytes and analyzed on the IsoLight platform. The single T-cells were captured in microchambers on IsoCode chips for cytokines profiling. Functional polyfunctionality data from 55,775 single cells were analyzed using the IsoSpeak software, kappa coefficient, and Kaplan-Meier survival plots. We found a significant difference between responders and non-responders in CD8+ T-cells’ changes in overall polyfunctionality and polyfunctional strength index (ΔPSI). ΔPSI score in CD8+ T-cells performed better than PD-L1 TPS and, when combined with PD-L1 TPS, strongly correlated with early ICI treatment response with a kappa coefficient of 1.0 (p=0.003). High CD4+ T-cells ΔPSI predicted a strong trend of improved PFS (3.9-fold) and OS (3-fold). In conclusion, single peripheral T-cell polyfunctionality dynamics analysis is a promising liquid biopsy profiling platform as NSCLC ICI predictive biomarker regardless of oncogene-addiction status.
Keywords:
cancer immunotherapy
; single cell analysis
; predictive biomarkers
; immune cytokine profiling
; polyfunctionality
; polyfunctional strength index
; lung cancer
1. Introduction
The adoption of immune checkpoint inhibitors (ICIs) has transformed lung cancer therapy and favorably impacted the survival outcomes [1]. ICIs targeting programmed death-1 (PD-1), e.g. pembrolizumab and nivolumab, and PD-Ligand-1 (PD-L1), e.g. atezolizumab and durvalumab, either alone or in combination with chemotherapy are now standard-of-care regimen for non-small cell lung cancer (NSCLC) [2]. Currently available ICI predictive biomarkers include (i) PD-L1 tumor proportion score (TPS), (ii) tumor mutational burden (TMB) and (iii) microsatellite instability (MSI) status [3]. Nonetheless, a substantial unmet need remains for more reliable and accurate therapeutic predictive biomarkers for optimal patient selection in the use of ICI and emerging novel immunotherapy combinations. Many challenges of ICI clinical use still remain. Given the potential for pseudo-progression in cancer immunotherapy [4], tracking the response profile of ICI therapy can be difficult. Some patients represent late responders, and the occurrence of immune-related adverse events (irAEs) altogether poses even more obstacles for treatment decision making. The precise role of ICIs in the treatment application for oncogene-addicted NSCLC is also being debated [5,6,7,8]. Efficacy of ICI treatment of oncogene-addicted NSCLC patients in the setting of acquired targeted kinase inhibitor-resistant progression remains debatable [9,10].
Practical constraints and limitations, including procedure-related risks and limited biopsied-tissues adequacy, hamper the development of tumor tissue-based predictive biomarkers [11,12]. These practical factors altogether confound urgent and real-time bedside treatment decisions for advanced NSCLC patients. The development of plasma-based cell-free DNA (cf-DNA) liquid biopsy for molecular profiling has shown to be a desirable alternative to empower personalized cancer therapy [13,14]. Recent emerging studies support the potential role of circulating T-lymphocytes as playing critical roles in peripheral recruitment in mounting an immunotherapy treatment response to cancer ICIs [15,16]. Of interest, Osorio et al. (2019) [16] revealed clinical evidence to support the notion of the recruitment of peripheral T-cells being more critical than reinvigorating exhausted intra-tumoral tumor-infiltrating lymphocytes (TILs) within the lung tumor microenvironment (TME) [17] in the initiation of tumor response towards ICIs. By studying the lesion-level response dynamics to PD-1/PD-L1 ICI treatment in NSCLC, the investigators identified that the response dynamics was characterized by “broad spatial-temporal uniformity”, thus favoring a systemic, peripheral recruitment of T-cell response [16]. Hence, there is a strong rationale to focus on and characterize the peripheral circulating T-lymphocytes to discover clinically relevant predictive biomarkers of ICI treatment in NSCLC.
State-of-the-art single-cell analysis [18,19,20] offers advanced opportunities to gain crucial functional insights into cancer and immune biology that traditional bulk assays cannot match up. We adopted a microfluidics-based multiplexed lab-on-chip proteomics assay platform, IsoLight (Bruker Cellular Analysis; formerly IsoPlexis), to functionally interrogate live peripheral T-lymphocyte subsets at the single-cell level in a discovery study of T-lymphocytes polyfunctionality for ICI treatment response and survival outcomes prediction in NSCLC.
2. Materials and Methods
2.1. Study Protocol and Patient Population
From January 2018 to April 2019, we enrolled patients in an IRB-approved translational research biorepository study protocol to prospectively collect on-treatment peripheral blood samples longitudinally. The institutional review board approved the SPECIAL (Serial ProspECtive bIopsy for Appalachian Lung cancer molecular profiling) study protocol (IRB: WVU011117 at West Virginia University, Morgantown, West Virginia). Eligible NSCLC patients with histologically confirmed diagnosis for our IsoLight study were selected from a biorepository with adults who underwent PD-1/PD-L1 immune checkpoint inhibition (ICI) treatments. No previous therapy with a PD-1 or PD-L1 inhibitor was allowed. Patients with oncogene alterations including EGFR, KRAS mutations, MET amplification or ALK translocation were allowed. Patients were either treatment naïve or at least 3 weeks out from previous lines of non-ICI systemic lung cancer treatment. Performance status ECOG 0-3 and life expectancy >3 months were required to be included. Healthy donor subjects were collected as controls under IRB-approved protocol (IRB: STUDY00005272 at Penn State Milton S. Hershey Medical Center, Hershey, Pennsylvania). Demographic and clinical information, treatment course, and response and survival outcomes information were extracted from electronic health records (EHR) as approved by the IRB protocols.
2.2. Collection, Processing, and Selection of T-Lymphocytes from Peripheral Blood Samples
Human peripheral blood samples were collected in four EDTA tubes at baseline and every two cycles after treatment. Peripheral blood mononuclear cells (PBMCs) were collected by repeated washing in RBC lysis buffer and cryopreserved in 10% DMSO in 90% FBS (Corning, Tewksbury, Massachusetts). A portion of the PBMCs were processed for RNA extraction using standard protocols. Cells were thawed according to standard protocols and resuspended in fresh complete RPMI media at 1 × 10⁶/ml and subsequently purified for CD4+ and CD8+ T-lymphocytes using a magnetic bead-based enrichment technique for both CD4+ and CD8+ T-cells (Miltenyi, Gaithersburg, Maryland). Cells were then stimulated with anti-human-CD3 (10μg/ml, Cat. No.: 16-0037-85, ThermoFisher, Coraopolis, Pennsylvania) and soluble anti-human-CD28 antibodies (5μg/ml, Cat. No.: 16-0289-81, ThermoFisher, Coraopolis, Pennsylvania) at 37°C, 5% CO2 for 24 hours as previously described [21].
2.3. Live T-Lymphocytes Single Cell Proteomic Cytokines Profiling Using Automated Microfluidics Lab-On-Chip Isolight Platform
In our study, we profiled 20 subjects, including ten healthy donors and ten NSCLC patients (Figure 1). Using the IsoLight (Bruker Cellular Analysis, Branford, Connecticut; formerly IsoPlexis) proteomic cytokine immune profiling platform, we collected and analyzed single cell data from a total of 55,775 single T-lymphocytes enriched and purified from peripheral blood, including 28,881 CD4+ and 26,894 CD8+ single T-lymphocyte cells. After stimulation for 24 hours, approximately 30,000 cells were loaded onto each proprietary IsoCode chip (Cat. No.: ISOCODE-1001-8, Bruker Cellular Analysis, Branford, Connecticut; formerly IsoPlexis). The chips contain ~12,000 microchambers pre-patterned with a 32-plex antibody array, including Effector: Granzyme B, IFN-γ, MIP-1α, Perforin, TNF-α, TNF-β; Stimulatory: GM-CSF, IL-2, IL-5, IL-7, IL-8, IL-9, IL-12, IL-15, IL-21; Chemoattractive: CCL11, IP-10, MIP-1β, RANTES, IL-4, IL-10, IL-13, IL-22, TGFβ1, sCD137, sCD40L, IL-1β; Inflammatory: IL-6, IL-17A, IL-17F, MCP-1, and MCP-4 (Figure 2). Each chip captures between 200-1,500 cells. The cells were then imaged for single cell location in microchambers and incubated at 37 °C, 5% CO2 for an additional 16 hours. Following the incubation period, ELISA detection was used to determine which protein combinations were secreted by each cell. Antibody-barcoded slides captured secreted proteins from single cells; the polyfunctional profile (2+ proteins per cell) of single cells was evaluated using the IsoSpeak (Bruker Cellular Analysis, Branford, Connecticut; formerly IsoPlexis) bioinformatics software.
2.4. Polyfunctional Strength Index (PSI)
PSI measures highly functional cell subsets capable of secreting multiple cytokines and how intensely those cytokines are being secreted. For PSI, data from empty chambers are used to measure the background level for each protein. These data were used to generate protein abundance histograms, which are fitted by normal distributions and nonparametric methods and judged by goodness of fit. The mean of the histogram identified by the best fit is used as the background level. Single-cell data were then normalized by subtracting this background to compare different samples. Cytokines secreted by less than 2% of the samples were considered non-significantly secreted and excluded from the analysis.
2.5. Biostatistics and Bioinformatics Analysis
Statistical analyses were performed using statistical software R software (R Foundation for Statistical Computing, Vienna, Austria; URL http://www.R-project.org/). Descriptive statistical analyses were performed to summarize the data and to describe the outcome variables including summary tables, proportions, median, and means with standard deviations, scatter-plots and boxplots. Student t-test or Wilcoxon rank test was used in the data analysis on continuous variables, while Chi-square test was used in categorical variables. Kaplan-Meier method was used in survival analysis and progression-free survival analysis. In the bioinformatics analysis, the clustering methods were applied to classify the samples into statistically similar groups and the regression-tree analysis was used to explore and distinguish the samples by the biomarker expression patterns and their differences. Linear model and linear mixed models were used to assess the difference of biomarkers between different groups. The mixed model included different model-parameters with groups as the fixed effect and subjects as random effect. It can handle the repeated measures from the same subjects, taking into account the between-subjects and within-subjects variations. With a similar setting, logistic models and generalized linear mixed models were used to assess binary outcome variables such as a dichotomized biomarker. Analyses were considered statistically significant if p<0.05. Bioinformatics analysis of the polyfunctional profiles of single cells was accomplished using the IsoSpeak (Bruker Cellular Analysis, Branford, Connecticut; formerly IsoPlexis) bioinformatics software.
3. Results
3.1. Study Cohort and Clinical Characteristics
The IRB-approved Serial ProspECtive bIopsy for Appalachian Lung cancer molecular profiling (SPECIAL) study was designed to collect serial patient blood samples before and during cancer treatment to empower biomarkers discovery (Table 1). Patients diagnosed with NSCLC, either of the adenocarcinoma or squamous cell subtype, both at advanced-stage and recurrent diseases, were included in our study cohort. Peripheral blood samples from healthy donors were also collected as control under IRB-approved protocol. The median age of NSCLC patients was 67 years, while the median age for healthy donors was 60 years. Sixty percent were females in both NSCLC and healthy donor cohorts. Patients were classified as responders if their tumor assessment showed complete or partial response to treatment according to the RECIST criteria measured two cycles after immunotherapy-based treatments.
3.2. Pre-Treatment Baseline Single T-Lymphocytes Overall Polyfunctionality (PolyFx) And Polyfunctional Strength Index (PSI): Healthy Donors versus NSCLC
We first sought to determine if there are differential functions of peripheral circulatory CD4-positive (CD4+) and CD8-positive (CD8+) T-lymphocytes of healthy donors and baseline pre-treatment NSCLC patient samples in our study (Figure 3). To this end, we compared their overall polyfunctionality (PolyFx) and polyfunctional strength index (PSI) at the single-cell level using the IsoLight and Single-Cell Human Adaptive Immune IsoCode chips (Figure 1 and Figure 2). PolyFx is defined as the percentage of single cells secreting two or more cytokines in each sample. In contrast, PSI is defined as the product of multiplying the rate of polyfunctional cells by the average signal intensity of significantly secreted cytokines from individual functional groups from each cell. We found that the PolyFx of CD4+ (p=0.23) and CD8+ (p=0.49) T-lymphocytes did not significantly differ between the healthy donor samples and baseline pre-treatment diseased samples (Figure 3A,B). There was also no significant difference in the PSI of both CD4+ (p=0.22) and CD8+ (p=0.41) T-lymphocytes (Figure 3C,D). We then sought to determine how the healthy donor samples compare to the diseased non-responder and responder samples, respectively (Figure 3A-D). The PolyFx of CD4+ (p=0.56) and CD8+ (p=0.49) T-lymphocytes were not significantly different between the healthy donor and the diseased non-responder samples. The same is true for PSI, where there is no significant difference between CD4+ (p=0.53) and CD8+ (p=0.81) T-lymphocytes when comparing the two sample groups. We also found no significant difference in PolyFx between the healthy donor samples and the diseased responder samples for CD4+ (p=0.18) and CD8+ (p=0.32) T-lymphocytes. The PSI between these two sample groups showed no significant difference in CD4+ (p=0.18) and CD8+ (p=0.28) T-lymphocytes. Our results are consistent with high immune functional heterogeneity among the NSCLC patients’ pre-treatment baseline T-lymphocytes prior to ICI treatment initiation.
Next, we sought to determine, among the NSCLC patients, the correlation between the pre-treatment baseline PolyFx or PSI from CD4+, CD8+, and total (CD4+ and CD8+) T-lymphocytes and ICI early treatment response (Figure 3A-D; Supplementary Figure S1A). There were no statistically different baseline PolyFx or PSI values between ICI responders and non-responders (p>0.05). This is true for CD4+, CD8+ alone (Figure 3A-D), or combined total T-lymphocytes (Supplementary Figure S1A). Here, our data suggest that baseline pre-treatment single T-cell polyfunctionality or PSI alone at a single time point assay from NSCLC patients under ICI treatment (with or without chemotherapy) was inadequate to predict ICI treatment response.
3.3. Early Changes in Peripheral CD8+ T-Lymphocytes Single Cell Overall Polyfunctionality (ΔPolyFx) and PSI (ΔPSI) as Novel Predictors of ICI Treatment Response
Next, we sought to determine the single T-lymphocyte early onset longitudinal changes in overall polyfunctionality (ΔPolyFx) between baseline pre-treatment T-lymphocytes and those collected after two cycles of ICI treatments (post-treatment). For CD4+ T-lymphocytes, there was no significant difference in ΔPolyFx between the ICI non-responder (NR) group and the responder (R) group (Figure 4A: p=0.806, Wilcoxon rank test; Figure 4E: p=0.635, mixed model). On the other hand, for CD8+ T-lymphocytes, we observed a statistically significant difference in ΔPolyFx when comparing the non-responder (NR) group to the responder (R) group (Figure 4B: p=0.016, Wilcoxon rank test; Figure 4F: p=0.012, mixed model). When examining the changes in polyfunctionality strength index (ΔPSI), we observed no significant difference in CD4+ ΔPSI (Figure 4C: p=0.905, Wilcoxon rank test; Figure 4E: p=0.610, mixed model) between the ICI responder (R) and non-responder (NR) groups. For CD8+ ΔPSI, however, we observed a statistically significant difference of ΔPSI between the R and NR groups (Figure 4D: p=0.016, Wilcoxon rank test; Figure 4F: p=0.006, mixed model). When CD4+ ΔPSI was added to CD8+ ΔPSI in the combined total T-lymphocytes (CD4+/CD8+) analysis, the statistical difference between the R and NR groups became diminished (p=0.191, Supplementary Figure S1B). Our study results nominate ΔPolyFx and ΔPSI of CD8+ T-lymphocytes as a potential predictive biomarker of ICI treatment response in NSCLC.
3.4. CD8+ ΔPolyFx and ΔPSI Perform Better than PD-L1 Tumor Proportion Score (TPS) Alone as a Predictive Biomarker for ICI Treatment Response in NSCLC
In our study cohort, we also asked if the early changes in polyfunctional strength could be a stronger predictor of early ICI treatment response compared to PD-L1 tumor proportion score (TPS). The patient’s tumoral PD-L1 TPS expression status alone failed to correlate with statistical significance with early ICI treatment response (p=0.082) (Figure 4G). As above, both the CD8+ ΔPolyFx and ΔPSI perform better than PD-L1 TPS alone as a predictive biomarker significantly correlated with NSCLC ICI treatment response (Figure 4F). Next, we performed a combined analysis of the CD8+ ΔPSI and PD-L1 TPS status as potential predictors of treatment response under ICI-based treatment. Our results show that a combined CD8+ ΔPSI and PD-L1 TPS status analysis significantly and strongly correlated with ICI treatment response with a kappa coefficient of 1.0 (p=0.003), implying both a sensitivity and specificity of 100% (Figure 4H).
3.5. 2D t-SNE and 3D t-SNE Bioinformatics Analysis of Responder (R) and Non-Responder (NR) Treatment Response Groups
To further illustrate the difference in polyfunctional strength change between R and NR groups, as well as the cellular heterogeneity among cells of the same sample, we generated 2D t-SNE plots based on the intensity of cytokines secreted per cell for both CD4+ and CD8+ T-lymphocytes. The 2D t-SNE plots of both CD4+ and CD8+ T-lymphocytes for a representative non-responder (NR: Patient-0002) and responder (R: Patient-0008) were shown here (Figure 5A,B). The 2D t-SNE plots corroborated the observation that the change in polyfunctional strength separating responders from non-responders was more pronounced in CD8+ T-lymphocytes. Our results demonstrate that the increase in cytokines secreted between pre-treatment and post-treatment samples was more prominent in CD8+ T-lymphocytes but less so in CD4+ T-lymphocytes. The plots also illustrated the heterogeneity in the intensity of cytokines secreted between single cells in the same sample, highlighting the importance of single polyfunctional cells in ICI response.
Additionally, we represented the polyfunctionality data as heat maps with the contributions of each groups of cytokines to the PolyFx or PSI listed. Patient-0002 (non-responder, NR) and Patient-0008 (responder, R) were shown here with heat maps generated based on the PSI (Figure 5C, E) and overall polyfunctionality (Figure 5D,F) as representative illustrations. The percentage of CD8+ T-cells with high average PSI increased for the responder (R) after ICI treatment, primarily driven by single cells secreting sCD137, granzyme B, and IFN-γ (Figure 5C). In contrast, for the non-responder (NR), the increase was not observed, reflecting what was described in the total change in PSI. Likewise, the percentage of highly polyfunctional CD8+ T-cells in responders (R) was also induced after treatment, while being less so for non-responders (NR) (Figure 5D). The changes pre- and post-treatment were not as highly discernible for CD4+ T-cells, partly due to the low number of significantly secreted cytokines.
Next, we performed a CD8+ 3D t-SNE plot analysis of the NR and R groups pre- and post-treatment (two cycles ICI) (Figure 5G, H). Our study results showed that there were distinct subpopulations of post-treatment CD8+ T-cells found to be segregated from the pre-treatment cells in the ICI responders (R) (Figure 5H) at the single cell level but not evident among the ICI non-responders (NR) (Figure 5G), suggesting that CD8+ T-cells secreted cytokines can delineate between the R and NR groups at the single-cell level. This further corroborates our hypothesis to nominate functional single-cell analysis of peripheral CD8+ T-cells as a predictive biomarker of ICI early treatment response.
3.6. ΔPSI in Predicting Treatment Response of Oncogene-Addicted NSCLC under Targeted Therapies versus ICI Therapy
Oncogene-addicted lung cancers generally respond unfavorably to ICI treatments, especially in first-line setting [6,22]. The value of ICIs as further lines of salvage treatment in the acquired tyrosine kinase inhibitor (TKI) drug resistance setting remains controversial [5,23]. Here, we sought to determine the predictive value of ΔPSI in the oncogene-addicted NSCLC patients in our study cohort under various therapeutic modalities.
Patient-0008 is a 79-year-old male, active smoker with 120 pack-years cigarette smoking history and ongoing pipe smoking habit at time of diagnosis. He presented with TP53 mutation and MET genomic amplification-positive metastatic poorly differentiated lung adenocarcinoma, stage IVB (cTxN2M1c), with metastasis to his brain and right adrenal gland at time of initial diagnosis. His tumoral PD-L1 TPS was 95% (22C3). He was initially treated with the anti-PD-1 ICI pembrolizumab alone as his first-line therapy, and experienced near complete response after two cycles. His CD8+ T-cell ΔPolyFx was 10.89 and ΔPSI 126.69 (Figure 4B, D), both correlating well with his ICI treatment response status as a responder.
Patient-0024 is a 49-year-old, never-smoker woman who had recurrent EGFR exon 19 deletion (E746_A750del) driven lung adenocarcinoma after prior lobectomy and subsequent chemoradiotherapy for recurrence. She was sequentially treated with erlotinib followed later by osimertinib both with favorable durable near complete response profile under respective TKIs. Eventually, she was treated with Carboplatin-Paclitaxel-Bevacizumab-Atezolizumab (ABCP) after acquired osimertinib-resistant progression [10,24]. The tumoral PD-L1 expression was strong (TPS 60%; 22C3). She experienced both complete tumor response and metabolic response upon initial ABCP treatment. Her CD8+ T-cell ΔPolyFx was 5.55 and ΔPSI 83.24 (Figure 4B, D), which correlated well with her ICI treatment response status as a responder. She completed a total of 4 cycles of the ABCP induction treatment regimen, with ongoing favorable tumor response on maintenance bevacizumab-atezolizumab therapy.
Patient-0026 is a 57-year-old woman, never-smoker, who had EGFR exon 19 deletion (L747_P753 delinsS)-driven metastatic lung adenocarcinoma that ultimately progressed on erlotinib in acquired drug resistance despite initial tumor response. She was then treated with the ABCP regimen as second-line therapy. She had a strong tumoral PD-L1 expression level, with TPS being 50% (22C3). Restaging imaging studies confirmed non-response status with a mixed early response profile, with refractory progressive disease in the right upper lobe apical nodular opacities despite thoracic nodal adenopathy reduction in her mediastinal and right hilar nodes. Her CD8+ T-cell ΔPolyFx and ΔPSI was found to be -2.47 and -37.52 respectively (Figure 4B,D), accurately predicting her as an ICI non-responder despite the strong PD-L1 expression.
Patient-0028 is a 78-year-old male, former smoker, who had ALK-translocation-driven recurrent advanced NSCLC and was treated with the ALK-TKI alectinib. He responded remarkably to alectinib as expected. Little is known regarding any potential role of a patient’s innate immune response in contributing to tumor response under targeted therapy. Here, we found that Patient-0028 had his CD4+ and CD8+ ΔPSI scores correlate only weakly to his response status (Figure 4B, D). His tumoral PD-L1 TPS was 2% (22C3). Taken together, our data suggests that although ΔPolyFx and ΔPSI can predict early ICI treatment response in oncogene-addicted NSCLC, it is not likely to be applicable for treatment under molecular targeted inhibitors.
3.7. Longitudinal Monitoring of ICI Treatment Response Using Peripheral Single Cell T-Lymphocytes Proteomic Cytokines Profiling On Treatment
Here, we further studied three particular patients in our pilot study cohort, i.e., non-responder (NR): Patient-0002; and responders (R): Patient-0008, and Patient-0024, to derive more insights into their on-treatment longitudinal landscapes of T-cell overall polyfunctionality (PolyFx) and PSI. Our study results showed that the longitudinal CD8+ T-cell PSI profiles in responders (R) displayed association with the treatment response profile (Figure 6A,B) but less so in the non-responder (NR) (Figure 6C). For the non-responder Patient-0002, the PolyFx and PSI only minimally increased after two cycles of ICI. Both the PolyFx and PSI exhibited further increase upon seven more cycles of ICI when the patient experienced on-treatment stable disease according to CT imaging. The PolyFx and PSI decreased after four more cycles of ICI when the patient remained in persistent stable disease status.
For the responders (R) Patient-0008 (Figure 6A) and Patient-0024 (Figure 6B), the PolyFx and PSI increased significantly after two cycles of ICI treatment, confirming that ICI treatment response correlated with an increase in PolyFx and PSI after two cycles. Both patients showed correlating decline in both PolyFx and PSI at time of disease progression as per body imaging diagnosis. Patient-0008 further underwent MET-targeted therapy CBT-101 (i.e., APL-101) and crizotinib after initial ICI treatment, given his molecular findings of MET genomic amplification status. Nonetheless, his overall polyfunctionality and PSI remained low throughout the targeted therapy time points with best stable response on MET-TKIs. Overall, a decline in the CD8+ T-cell PSI on and during ICI treatment beyond cycle two may predict emerging progressive disease and resistance against ongoing ICI-based therapy.
When we analyzed the single CD8+ T-cells in 3D t-SNE plots, we observed that for the R: Patient-0008, the post-treatment CD8+ T-cells segregated meaningfully from the baseline pre-treatment cells (Figure 6D). These results suggest that the circulating T-cells under ICI treatment are functionally distinct and discernible from baseline T-cells. For Patient-0008, the progression and MET-targeted inhibitor treatment time points were segregated further away from the pre- and post-treatment samples, indicating that when the tumor progressed, there were observable differences in the functionality of the respective T-cells. On the other hand, for the NR: Patient-0002, the pre-treatment cells were not distinguishable from the post-2 cycles treatment cells (Figure 6E). In Patient-0002, the stable disease (C11) and persistent stable disease (C15) time points appear to segregate apart from the pre-and post-treatment samples, implying that the T-cells in these time points may also possess differential functionality profiles.
3.8. Kaplan-Meier Clinical Survival Outcomes Analysis
Lastly, we performed Kaplan-Meier survival analysis on our study cohort to better understand the impact of the longitudinal single T-cells interrogation on long-term survival outcomes in addition to early ICI treatment response. Intriguingly, our data showed that a high change in CD4+ PSI (ΔPSI >5) after ICI treatment had a median PFS of 10.8 months compared with that of 2.8 months otherwise. The Kaplan-Meier survival analysis showed that patients with a high CD4+ ΔPSI correlated with a strong trend of improved PFS, with a nearly four-fold (3.9) longer progression-free survival (PFS) than those with a low CD4+ ΔPSI (p=0.07) (Figure 7A). Similarly, patients with a high CD4+ ΔPSI also correlated with a strong trend of improved median overall survival (OS), with a three-fold longer OS than those with a low CD4+ ΔPSI (34.5 months versus 11.5 months; p=0.09) (Figure 7B). In addition, the clinical survival analysis of CD8+ ΔPSI was found to also display a trend of correlation with better PFS and OS in those with a high change in PSI (ΔPSI >5) (Supplementary Figure S2A,B).
4. Discussion
ICI using anti-PD-1/PD-L1 antibodies alone or in combination with chemotherapy has become standard-of-care for not only advanced metastatic stage NSCLC but also early resectable stage patients in the form of adjuvant (IMpower-010) [25], neoadjuvant (CheckMate-816) [26] and perioperative chemoimmunotherapy (Keynote-617) [27]. Nonetheless, there remains an unmet need for robust predictive immunotherapy biomarkers to best select patients for treatment and to guide optimal therapeutic strategies. Currently available biomarkers for ICI treatment, e.g., PD-L1 expression, MSI status, and TMB, often experience limitations in predictive capability especially when an ICI is combined with chemotherapeutics [26,27,28,29,30]. Our study here provided proof-of-concept evidence to support the development of liquid biopsy-based live peripheral single T-cell cytokine proteomics profiling as an ICI treatment predictive biomarker platform in lung cancer. We showed that the longitudinal peripheral CD8+ T-lymphocytes polyfunctional strength index (PSI) profile, as measured in ΔPSI score under ICI immunotherapy, performs better than PD-L1 TPS alone as a predictive biomarker for ICI treatment response. Importantly, our study showed that combining CD8+ ΔPSI and PD-L1 TPS status as a predictive biomarker strongly correlated with ICI-based treatment response with a kappa coefficient of 1.0 (p=0.003). Additionally, CD4+ T-lymphocytes ΔPSI >5 correlated with a strong trend of both improved PFS (~4-fold) and OS (3-fold) in our current study.
Emerging blood-based predictive and prognostic biomarkers under investigations in the form of liquid biopsy offer considerable advantages over the reliance on tumor-tissue-based biomarker assays [31,32,33]. Our study now nominates a real-time longitudinal liquid biopsy assay to predict ICI therapeutic response and long-term clinical survival outcomes by quantifying the intensity profiles of different cytokines released by peripheral CD4+ and CD8+ T-cells before and during treatment into a functional score. In our patient cohort, PD-L1 TPS as a predictive biomarker for ICI treatment tumor response was determined to be only at 80% accuracy. On the other hand, ΔPSI in CD8+ T-lymphocytes alone could significantly distinguish between ICI responders and non-responders (p=0.006, mixed model). When combining PD-L1 TPS with ΔPSI, the integrated ΔPSI/PD-L1 TPS biomarker strategy predicted tumor response with 100% accuracy (Figure 4H, p=0.003). Notably, the immune treatment response to anti-PD-1/PD-L1 ICI in cancer patients can be highly heterogeneous [18]. Published studies have shown that the presence of rare, highly functional cells is important in predicting the overall response of the population [15,21,34]. Population-based techniques such as bulk ELISA and flow cytometry merely provide an aggregated view of all the cells that comprise a population, which masks the contribution of the polyfunctional super-cytokine secretory cells. On the other hand, single-cell methods have been shown to retain critically important cellular elements and differences in the immune cell compartments. As such, single-cell methods prove to be more advantageous when determining therapeutic response driven by rare, highly polyfunctional immune cells in the setting of ICI response, and similarly when considering ICI treatment-acquired resistance.
Our study also promises to provide further utility in uncovering the dynamic changes in functionality landscapes in longitudinal on-treatment immune cells. By analyzing the ΔPSI in peripheral single T-cells at set intervals during an ICI-based treatment course, our liquid biopsy method identified a promising trend of single T-cell functionality changes correlating with emerging ICI treatment resistance, which may ultimately lead to better treatment decisions. We presented the 3D t-SNE plots of longitudinal treatment time points in representative ICI non-responder (NR) Patient-0002 and responder (R) Patient-0008. Despite expressing high PD-L1, Patient-0002’s T cells clustered close to each other in the pre-and post-2 cycles of ICI samples. Intriguingly, the longitudinal additional time-point of “stable disease” (C11) and “persistent stable disease” (C15) samples clustered away from the pre- and post-treatment (C03 and C04) samples, suggesting that the tumor microenvironment may be changing under ICI treatment pressure. Further studies focusing on immune cellular functionality landscapes in radiographic stable disease status are warranted. To this end, our liquid biopsy methodology offers the opportunity to better interrogate the functionality of the T-cells, thereby enabling us to track with higher fidelity the underlying metabolic and molecular responses not always fully represented by CT radiographic measurements per se. In contrast, Patient-0008, who had MET amplification and was an ICI treatment responder, had ΔPolyFx and ΔPSI profiles that correlated significantly with his treatment response status. Our longitudinal 3D t-SNE plot analysis illustrated that the single T-lymphocytes clustered separately during the longitudinal time course of ICI and non-ICI treatment regimens, reflecting the differential treatment responses, molecular heterogeneity, and cell states of circulatory T-lymphocytes during cancer treatments.
Although our study is limited by a small cohort size, each NSCLC patient has at least two time point samples, and each sample was analyzed using novel single-cell functional proteomics profiling methods, increasing the granularity and biological depth of our analysis. Single-cell functional analysis of CD8+ T-cell cytokines landscapes demonstrated the longitudinal shift of CD8+ T-cell PolyFx and PSI during real-time treatment, which is not feasible in bulk cell studies. Similarly, single-cell functional analysis allows deep molecular tracking of adaptive evolutionary changes of patients’ functional immune compartments under cancer immunotherapy longitudinally. Further prospective studies in larger patient cohorts are warranted to test the potential of the single T-cell ΔPolyFx and ΔPSI measures, especially combined with PD-L1 TPS, as real-time immune biomarkers in longitudinal ICI-based treatment courses to facilitate optimal treatment decision making. Since our IsoLight study platform utilizes functional single immune cells as the analytes in the longitudinal analysis, it can be more applicable to any novel immunotherapy combinations in predictive biomarkers discovery and validation, including regimens involving anti-TIGIT [35] and anti-LAG3 antibodies [36], and ICI in combination with cytotoxic chemotherapeutics. Furthermore, novel cancer therapeutics involving immune-mediated antitumor response and outcomes such as antibody-drug-conjugates (ADCs), bispecific antibodies or other emerging novel targeted/immune-mediated therapeutics could be measured and tracked using this functional real-time single-cell assay.
Our study data also nominate a potential role for peripheral CD4+ T-lymphocytes ΔPSI in predicting long-term clinical survival outcomes under ICI treatments. While CD8+ T-lymphocytes might be more important as determinants of early treatment response, CD4+ T-cells could be more relevant and pivotal in sustaining a more durable treatment biological, cellular, and molecular response, thus translating into longer-term clinical survival outcomes [37,38]. A recent report suggested that CD4+ T-cell immunity in the peripheral blood correlates with ICI treatment response in NSCLC [39]. The study identified that long-term ICI responders with >500-day PFS had significantly higher numbers of CD62Llow CD4+ T-cells prior to PD-1 blockade therapy in peripheral blood, which was maintained in high percentages as a T-cell subset in long-term survivors. On the other hand, the same CD4+ T-cell population was found to be decreased in those with acquired resistance after therapy. Another recent publication of a pan-cancer T-cells single-cell atlas highlighted the transcriptomic diversity of tumor-infiltrating T-cells [40]. The analysis provided a sound foundation to improve our insights into the broad roles of different T-cell subtypes and cell states heterogeneity in ICI treatment response and outcomes. Of interest, Chu et al. (2023) identified six major subtypes of T-cells: CD4+, CD8+, γδ T proliferative T-cells (Tgd), natural killer T (NKT), mucosal-associated invariant T (MAIT), and proliferative T-cells. The CD4+ T-cells represented the most abundant subset with their cellular fractions substantially varying across tissues of locations and conditions, implying their relevance in the immune dynamics of the tumor-host-therapeutics milieu under ICI treatment. There were 14 clusters of CD8+ T-cells and 14 transcriptional states defined in the study. Conversely, 12 different CD4+ T-cell states were defined. Interestingly, the unique stress response states in CD8+ and CD4+ TSTR cluster (stress response signature), characterized by highly expressed heat shock genes and stress response signature, were significantly upregulated in intratumoral CD4+/CD8+ cells following ICI treatments, especially associated with nonresponsive tumor [40]. Furthermore, higher CD4+ TCM (central memory)-cells were found linked to increased OS in sarcoma. The CD4+ T cell memory compartment is subdivided into CD62L+CCR7+ central memory T (TCM) cells and CD62L−CCR7− effector memory T (TEM) cells [41]. These cell populations are well poised in effector cytokines rapid secretion upon reactivation and engendering an enhanced secondary immune response. TCM cells are functionally characterized by their IL-2 synthetic capacity and have less potential for rapid IFN-γ or IL-4 secretion. Similar to our investigation results, baseline pre-treatment specimens reported in the study by Chu et al. also did not achieve distinction between R and NR of single-agent ICI treatment based on the individual T-cell states, lending support to the values of longitudinal studies involving pre- and post-ICI treatment in predictive biomarkers discovery.
While the polyfunctionality of effector T-cells at the single cell level is shown to be an important parameter in predicting the quality of T-cell immune response and immunological control over malignant tumors, the fate of the CD8+ cytotoxic T-lymphocytes and the factors that regulate the polyfunctionality of T-cells remain largely unknown. Utilizing transgenic mouse-derived CD8+ T-cells that express a T-cell receptor (TCR) specific for a tumor-derived neoantigen, Imai N et al. (2020) [42] showed that the tumor specific cytotoxic T-lymphocytes generated in the presence of CD4+ T-cells displayed long persistence in vivo and induced enhanced tumor regression when adoptively transferred into mice with progressing tumor. Our study data on the role of CD4+ ΔPSI predicting a strong trend of PFS and OS in ICI-treated NSCLC patients add further support to the notion of CD4+ T-cells positively impacting the polyfunctionality of cytotoxic CD8+ T-cells in their survival and memory formation associated with tumoral immunological control and subsequent long-term clinical survival outcomes [42]. Lastly, peripheral circulating CD4+ T-cell immunity such as activated CD4+ TEM clonal expansion, may have a role in the emergence of immune-mediated adverse events (irAEs) from ICI blockade as well [43]. Importantly, a number of literature reports in recent years provided strong support correlating irAEs and ICI treatment response as well as OS outcomes in human cancers, including NSCLC [44,45,46].
5. Conclusions
In summary, our proof-of-concept study in longitudinal functional single-cell cytokine profiling analysis of peripheral blood immune T-lymphocytes nominated single CD8+ T-cells polyfunctionality measurements as a sound predictive biomarker for PD-1/PD-L1 ICI treatment in NSCLC for early tumor response, whereas single CD4+ T-cells polyfunctionality measurements could be predictive of longer-term ICI treatment survival outcomes. Our study findings warrant further investigations in prospective ICI treatment trials in larger patient cohorts in NSCLC and other cancer types to shed more confirmatory light on the utility of real-time liquid biopsies with T-lymphocytes ΔPSI as an immunotherapy predictive biomarker.
Supplementary Materials
The following supporting information can be downloaded at the website of this paper posted on Preprints.org, Figure S1: (A) Polyfunctional strength index (PSI) comparison of healthy donors and baseline untreated NSCLC patients. The PSI between the healthy donors and the baseline untreated NSCLC patient group was compared for CD4+ and CD8+ T cells combined (Healthy vs. Responder, p=0.59; Healthy vs. NSCLC, p=0.56; Healthy vs. Non-Responder, p=0.69). Statistical analysis was performed with a Wilcoxon rank test. ALK; anaplastic lymphoma kinase; PSI, polyfunctional strength index; ns, not significant. (B) Comparing the changes in polyfunctional strength index (ΔPSI) after two cycles of ICI treatment in responders vs. non-responders. The changes in PSI (ΔPSI) between responders and non-responders were compared for CD4+ and CD8+ T cells combined (p=0.191). ΔPSI, change in polyfunctional strength index; ALK, anaplastic lymphoma kinase; ns, not significant; Figure S2: Kaplan-Meier clinical survival outcomes analysis of PSI changes in ICI-treated NSCLC. CD8+ T-cells analysis. (A) PFS: Progression-free survival. p=0.34. (B) OS: Overall survival. p=0.37.
Author Contributions
Z-F.L.: Conceptualization, Data curation, Investigation, Project administration, Visualization, Writing - Original draft preparation, reviewing and editing; X.W.: Investigation, Data curation, Writing - Reviewing and editing; L.Z.: Data curation; H.A.: Data curation, Writing - Reviewing and editing; M.H.: Data curation, Writing - Reviewing and editing; C.Z.: Resources; M.A.: Data curation; M.S.: Data curation; H.Z.: Resources, Writing - Reviewing and editing; S.W.: Formal analysis, Writing - Reviewing and editing; P.C.M.: Conceptualization, Funding acquisition, Resources, Writing - Reviewing and editing, Supervision. All authors have read and agreed to the published version of the manuscript.
Funding
This research received no external funding.
Institutional Review Board Statement
The study was conducted in accordance with the Declaration of Helsinki, and approved by the Institutional Review Board of West Virginia University (WVU011117, 2016), and by the Institutional Review Board of Penn State Milton S. Hershey Medical Center (STUDY00005272, 2016).
Informed Consent Statement
Informed consent was obtained from all subjects involved in the study.
Data Availability Statement
The authors confirm that the data supporting the findings of this study are all available within the figures and tables of the article.
Acknowledgments
P.C.M.: Dr. Frank and Franco Cancer Research Endowment, GLY Foundation Cancer Research Endowment, and Vernon M. and Jolene E. Chinchilli Family Endowment for Cancer Research of the Penn State Cancer Institute, Penn State College of Medicine, Penn State University. Highmark Community Health Reinvestment Fund.
Conflicts of Interest
P.C.M.: Consulting honorarium AstraZeneca, BeiGene. All other authors declare no conflicts of interest.
References
- Yang, R.; Zhou, Y.; Wang, Y.; Du, C.; Wu, Y. Trends in Cancer Incidence and Mortality Rates in the United States from 1975 to 2016. Ann Transl Med 2020, 8, 1671. [Google Scholar] [CrossRef]
- Marrone, K.A.; Brahmer, J.R. Immune Checkpoint Therapy in Non-Small Cell Lung Cancer. Cancer J 2016, 22, 81–91. [Google Scholar] [CrossRef]
- Bodor, J.N.; Boumber, Y.; Borghaei, H. Biomarkers for Immune Checkpoint Inhibition in Non-Small Cell Lung Cancer (NSCLC). Cancer 2020, 126, 260–270. [Google Scholar] [CrossRef]
- Won, S.E.; Park, H.J.; Byun, S.; Pyo, J.; Kim, J.H.; Choi, C.M.; Lee, J.C.; Lee, D.H.; Kim, S.W.; Yoon, S.; et al. Impact of Pseudoprogression and Treatment beyond Progression on Outcome in Patients with Non-Small Cell Lung Cancer Treated with Immune Checkpoint Inhibitors. Oncoimmunology 2020, 9, 1776058. [Google Scholar] [CrossRef] [PubMed]
- Mazieres, J.; Drilon, A.; Lusque, A.; Mhanna, L.; Cortot, A.B.; Mezquita, L.; Thai, A.A.; Mascaux, C.; Couraud, S.; Veillon, R.; et al. Immune Checkpoint Inhibitors for Patients with Advanced Lung Cancer and Oncogenic Driver Alterations: Results from the IMMUNOTARGET Registry. Ann Oncol 2019, 30, 1321–1328. [Google Scholar] [CrossRef]
- Akbay, E.A.; Koyama, S.; Carretero, J.; Altabef, A.; Tchaicha, J.H.; Christensen, C.L.; Mikse, O.R.; Cherniack, A.D.; Beauchamp, E.M.; Pugh, T.J.; et al. Activation of the PD-1 Pathway Contributes to Immune Escape in EGFR-Driven Lung Tumors. Cancer Discov 2013, 3, 1355–1363. [Google Scholar] [CrossRef] [PubMed]
- Arcila, M.E.; Oxnard, G.R.; Nafa, K.; Riely, G.J.; Solomon, S.B.; Zakowski, M.F.; Kris, M.G.; Pao, W.; Miller, V.A.; Ladanyi, M. Rebiopsy of Lung Cancer Patients with Acquired Resistance to EGFR Inhibitors and Enhanced Detection of the T790M Mutation Using a Locked Nucleic Acid-Based Assay. Clin Cancer Res 2011, 17, 1169–1180. [Google Scholar] [CrossRef]
- Benedettini, E.; Sholl, L.M.; Peyton, M.; Reilly, J.; Ware, C.; Davis, L.; Vena, N.; Bailey, D.; Yeap, B.Y.; Fiorentino, M.; et al. Met Activation in Non-Small Cell Lung Cancer Is Associated with de Novo Resistance to EGFR Inhibitors and the Development of Brain Metastasis. Am J Pathol 2010, 177, 415–423. [Google Scholar] [CrossRef] [PubMed]
- Calles, A.; Riess, J.W.; Brahmer, J.R. Checkpoint Blockade in Lung Cancer With Driver Mutation: Choose the Road Wisely. Am. Soc. Clin. Oncol. Educ. Book 2020, 372–384. [Google Scholar] [CrossRef]
- Socinski, M.A.; Jotte, R.M.; Cappuzzo, F.; Orlandi, F.; Stroyakovskiy, D.; Nogami, N.; Rodriguez-Abreu, D.; Moro-Sibilot, D.; Thomas, C.A.; Barlesi, F.; et al. Atezolizumab for First-Line Treatment of Metastatic Nonsquamous NSCLC. N Engl J Med 2018, 378, 2288–2301. [Google Scholar] [CrossRef] [PubMed]
- Schoenfeld, A.J.; Rizvi, H.; Bandlamudi, C.; Sauter, J.L.; Travis, W.D.; Rekhtman, N.; Plodkowski, A.J.; Perez-Johnston, R.; Sawan, P.; Beras, A.; et al. Clinical and Molecular Correlates of PD-L1 Expression in Patients with Lung Adenocarcinomas. Ann Oncol 2020, 31, 599–608. [Google Scholar] [CrossRef]
- Samstein, R.M.; Lee, C.-H.; Shoushtari, A.N.; Hellmann, M.D.; Shen, R.; Janjigian, Y.Y.; Barron, D.A.; Zehir, A.; Jordan, E.J.; Omuro, A.; et al. Tumor Mutational Load Predicts Survival after Immunotherapy across Multiple Cancer Types. Nat Genet 2019, 51, 202–206. [Google Scholar] [CrossRef]
- Veldore, V.H.; Choughule, A.; Routhu, T.; Mandloi, N.; Noronha, V.; Joshi, A.; Dutt, A.; Gupta, R.; Vedam, R.; Prabhash, K. Validation of Liquid Biopsy: Plasma Cell-Free DNA Testing in Clinical Management of Advanced Non-Small Cell Lung Cancer. Lung Cancer Targets Ther. 2018, 9, 1–11. [Google Scholar] [CrossRef]
- Liu, S.; Wang, J. Current and Future Perspectives of Cell-Free DNA in Liquid Biopsy. Curr. Issues Mol. Biol. 2022, 44, 2695–2709. [Google Scholar] [CrossRef] [PubMed]
- van der Leun, A.M.; Thommen, D.S.; Schumacher, T.N. CD8(+) T Cell States in Human Cancer: Insights from Single-Cell Analysis. Nat Rev Cancer 2020, 20, 218–232. [Google Scholar] [CrossRef]
- Osorio, J.C.; Arbour, K.C.; Le, D.T.; Durham, J.N.; Plodkowski, A.J.; Halpenny, D.F.; Ginsberg, M.S.; Sawan, P.; Crompton, J.G.; Yu, H.A.; et al. Lesion-Level Response Dynamics to Programmed Cell Death Protein (PD-1) Blockade. J Clin Oncol 2019, 37, 3546–3555. [Google Scholar] [CrossRef]
- Liu, H.; Zhang, T.; Ye, J.; Li, H.; Huang, J.; Li, X.; Wu, B.; Huang, X.; Hou, J. Tumor-Infiltrating Lymphocytes Predict Response to Chemotherapy in Patients with Advance Non-Small Cell Lung Cancer. Cancer Immunol Immunother 2012, 61, 1849–1856. [Google Scholar] [CrossRef] [PubMed]
- Heath, J.R.; Ribas, A.; Mischel, P.S. Single-Cell Analysis Tools for Drug Discovery and Development. Nat Rev Drug Discov 2016, 15, 204–216. [Google Scholar] [CrossRef] [PubMed]
- Chattopadhyay, P.K.; Gierahn, T.M.; Roederer, M.; Love, J.C. Single-Cell Technologies for Monitoring Immune Systems. Nat Immunol 2014, 15, 128–135. [Google Scholar] [CrossRef] [PubMed]
- Stubbington, M.J.T.; Rozenblatt-Rosen, O.; Regev, A.; Teichmann, S.A. Single-Cell Transcriptomics to Explore the Immune System in Health and Disease. Science 2017, 358, 58–63. [Google Scholar] [CrossRef]
- Xue, Q.; Bettini, E.; Paczkowski, P.; Ng, C.; Kaiser, A.; McConnell, T.; Kodrasi, O.; Quigley, M.F.; Heath, J.; Fan, R.; et al. Single-Cell Multiplexed Cytokine Profiling of CD19 CAR-T Cells Reveals a Diverse Landscape of Polyfunctional Antigen-Specific Response. J Immunother Cancer 2017, 5, 85. [Google Scholar] [CrossRef]
- Duchemann, B.; Friboulet, L.; Besse, B. Therapeutic Management of ALK+ Nonsmall Cell Lung Cancer Patients. Eur Respir J 2015, 46, 230–242. [Google Scholar] [CrossRef]
- Robert, C. A Decade of Immune-Checkpoint Inhibitors in Cancer Therapy. Nat. Commun. 2020, 11, 3801. [Google Scholar] [CrossRef]
- Kibirova, A.; Mattes, M.D.; Smolkin, M.; Ma, P.C. The Journey of an EGFR-Mutant Lung Adenocarcinoma through Erlotinib, Osimertinib and ABCP Immunotherapy Regimens: Sensitivity and Resistance. Case Rep. Oncol. 2019, 12, 765–776. [Google Scholar] [CrossRef]
- Felip, E.; Altorki, N.; Zhou, C.; Csőszi, T.; Vynnychenko, I.; Goloborodko, O.; Luft, A.; Akopov, A.; Martinez-Marti, A.; Kenmotsu, H.; et al. Adjuvant Atezolizumab after Adjuvant Chemotherapy in Resected Stage IB-IIIA Non-Small-Cell Lung Cancer (IMpower010): A Randomised, Multicentre, Open-Label, Phase 3 Trial. Lancet Lond. Engl. 2021, 398, 1344–1357. [Google Scholar] [CrossRef] [PubMed]
- Forde, P.M.; Spicer, J.; Lu, S.; Provencio, M.; Mitsudomi, T.; Awad, M.M.; Felip, E.; Broderick, S.R.; Brahmer, J.R.; Swanson, S.J.; et al. Neoadjuvant Nivolumab plus Chemotherapy in Resectable Lung Cancer. N. Engl. J. Med. 2022, 386, 1973–1985. [Google Scholar] [CrossRef] [PubMed]
- Wakelee, H.; Liberman, M.; Kato, T.; Tsuboi, M.; Lee, S.-H.; Gao, S.; Chen, K.-N.; Dooms, C.; Majem, M.; Eigendorff, E.; et al. Perioperative Pembrolizumab for Early-Stage Non-Small-Cell Lung Cancer. N. Engl. J. Med. 2023, 389, 491–503. [Google Scholar] [CrossRef] [PubMed]
- Han, Y.; Liu, D.; Li, L. PD-1/PD-L1 Pathway: Current Researches in Cancer. Am. J. Cancer Res. 2020, 10, 727–742. [Google Scholar] [PubMed]
- Anagnostou, V.; Landon, B.V.; Medina, J.E.; Forde, P.; Velculescu, V.E. Translating the Evolving Molecular Landscape of Tumors to Biomarkers of Response for Cancer Immunotherapy. Sci. Transl. Med. 2022, 14, eabo3958. [Google Scholar] [CrossRef]
- Anagnostou, V.; Bardelli, A.; Chan, T.A.; Turajlic, S. The Status of Tumor Mutational Burden and Immunotherapy. Nat. Cancer 2022, 3, 652–656. [Google Scholar] [CrossRef] [PubMed]
- Anagnostou, V.; Ho, C.; Nicholas, G.; Juergens, R.A.; Sacher, A.; Fung, A.S.; Wheatley-Price, P.; Laurie, S.A.; Levy, B.; Brahmer, J.R.; et al. ctDNA Response after Pembrolizumab in Non-Small Cell Lung Cancer: Phase 2 Adaptive Trial Results. Nat. Med. 2023, 29, 2559–2569. [Google Scholar] [CrossRef] [PubMed]
- Oloomi, M.; Moazzezy, N.; Bouzari, S. Comparing Blood versus Tissue-Based Biomarkers Expression in Breast Cancer Patients. Heliyon 2020, 6, e03728. [Google Scholar] [CrossRef] [PubMed]
- Mamdani, H.; Ahmed, S.; Armstrong, S.; Mok, T.; Jalal, S.I. Blood-Based Tumor Biomarkers in Lung Cancer for Detection and Treatment. Transl. Lung Cancer Res. 2017, 6, 648–660. [Google Scholar] [CrossRef] [PubMed]
- Bian, S.; Hou, Y.; Zhou, X.; Li, X.; Yong, J.; Wang, Y.; Wang, W.; Yan, J.; Hu, B.; Guo, H.; et al. Single-Cell Multiomics Sequencing and Analyses of Human Colorectal Cancer. Science 2018, 362, 1060–1063. [Google Scholar] [CrossRef] [PubMed]
- Rovers, S.; Janssens, A.; Raskin, J.; Pauwels, P.; van Meerbeeck, J.P.; Smits, E.; Marcq, E. Recent Advances of Immune Checkpoint Inhibition and Potential for (Combined) TIGIT Blockade as a New Strategy for Malignant Pleural Mesothelioma. Biomedicines 2022, 10, 673. [Google Scholar] [CrossRef] [PubMed]
- Anderson, A.C.; Joller, N.; Kuchroo, V.K. Lag-3, Tim-3, and TIGIT Co-Inhibitory Receptors with Specialized Functions in Immune Regulation. Immunity 2016, 44, 989–1004. [Google Scholar] [CrossRef] [PubMed]
- Oh, D.Y.; Kwek, S.S.; Raju, S.S.; Li, T.; McCarthy, E.; Chow, E.; Aran, D.; Ilano, A.; Pai, C.-C.S.; Rancan, C.; et al. Intratumoral CD4+ T Cells Mediate Anti-Tumor Cytotoxicity in Human Bladder Cancer. Cell 2020, 181, 1612–1625. [Google Scholar] [CrossRef]
- González-Navajas, J.M.; Elkord, E.; Lee, J. Editorial: CD4+ T Cells in Cancer Immunotherapies. Front. Immunol. 2021, 12. [Google Scholar] [CrossRef]
- Kagamu, H.; Kitano, S.; Yamaguchi, O.; Yoshimura, K.; Horimoto, K.; Kitazawa, M.; Fukui, K.; Shiono, A.; Mouri, A.; Nishihara, F.; et al. CD4+ T-Cell Immunity in the Peripheral Blood Correlates with Response to Anti-PD-1 Therapy. Cancer Immunol. Res. 2020, 8, 334–344. [Google Scholar] [CrossRef]
- Chu, Y.; Dai, E.; Li, Y.; Han, G.; Pei, G.; Ingram, D.R.; Thakkar, K.; Qin, J.-J.; Dang, M.; Le, X.; et al. Pan-Cancer T Cell Atlas Links a Cellular Stress Response State to Immunotherapy Resistance. Nat. Med. 2023, 29, 1550–1562. [Google Scholar] [CrossRef]
- Sallusto, F.; Lenig, D.; Förster, R.; Lipp, M.; Lanzavecchia, A. Two Subsets of Memory T Lymphocytes with Distinct Homing Potentials and Effector Functions. Nature 1999, 401, 708–712. [Google Scholar] [CrossRef] [PubMed]
- Imai, N.; Tawara, I.; Yamane, M.; Muraoka, D.; Shiku, H.; Ikeda, H. CD4+ T Cells Support Polyfunctionality of Cytotoxic CD8+ T Cells with Memory Potential in Immunological Control of Tumor. Cancer Sci. 2020, 111, 1958–1968. [Google Scholar] [CrossRef] [PubMed]
- Earland, N.; Zhang, W.; Usmani, A.; Nene, A.; Bacchiocchi, A.; Chen, D.Y.; Sznol, M.; Halaban, R.; Chaudhuri, A.A.; Newman, A.M. CD4 T Cells and Toxicity from Immune Checkpoint Blockade. Immunol. Rev. 2023, 318, 96–109. [Google Scholar] [CrossRef]
- Abu-Sbeih, H.; Tang, T.; Ali, F.S.; Johnson, D.H.; Qiao, W.; Diab, A.; Wang, Y. The Impact of Immune Checkpoint Inhibitor-Related Adverse Events and Their Immunosuppressive Treatment on Patients’ Outcomes. J. Immunother. Precis. Oncol. 2020, 1, 7–18. [Google Scholar] [CrossRef]
- Owen, D.H.; Wei, L.; Bertino, E.M.; Edd, T.; Villalona-Calero, M.A.; He, K.; Shields, P.G.; Carbone, D.P.; Otterson, G.A. Incidence, Risk Factors, and Effect on Survival of Immune-Related Adverse Events in Patients With Non–Small-Cell Lung Cancer. Clin. Lung Cancer 2018, 19, e893–e900. [Google Scholar] [CrossRef]
- Albandar, H.J.; Fuqua, J.; Albandar, J.M.; Safi, S.; Merrill, S.A.; Ma, P.C. Immune-Related Adverse Events (irAE) in Cancer Immune Checkpoint Inhibitors (ICI) and Survival Outcomes Correlation: To Rechallenge or Not? Cancers 2021, 13, 989. [Google Scholar] [CrossRef] [PubMed]
Figure 1.
IsoLight single T-cell live functional immune proteomics profiling workflow.
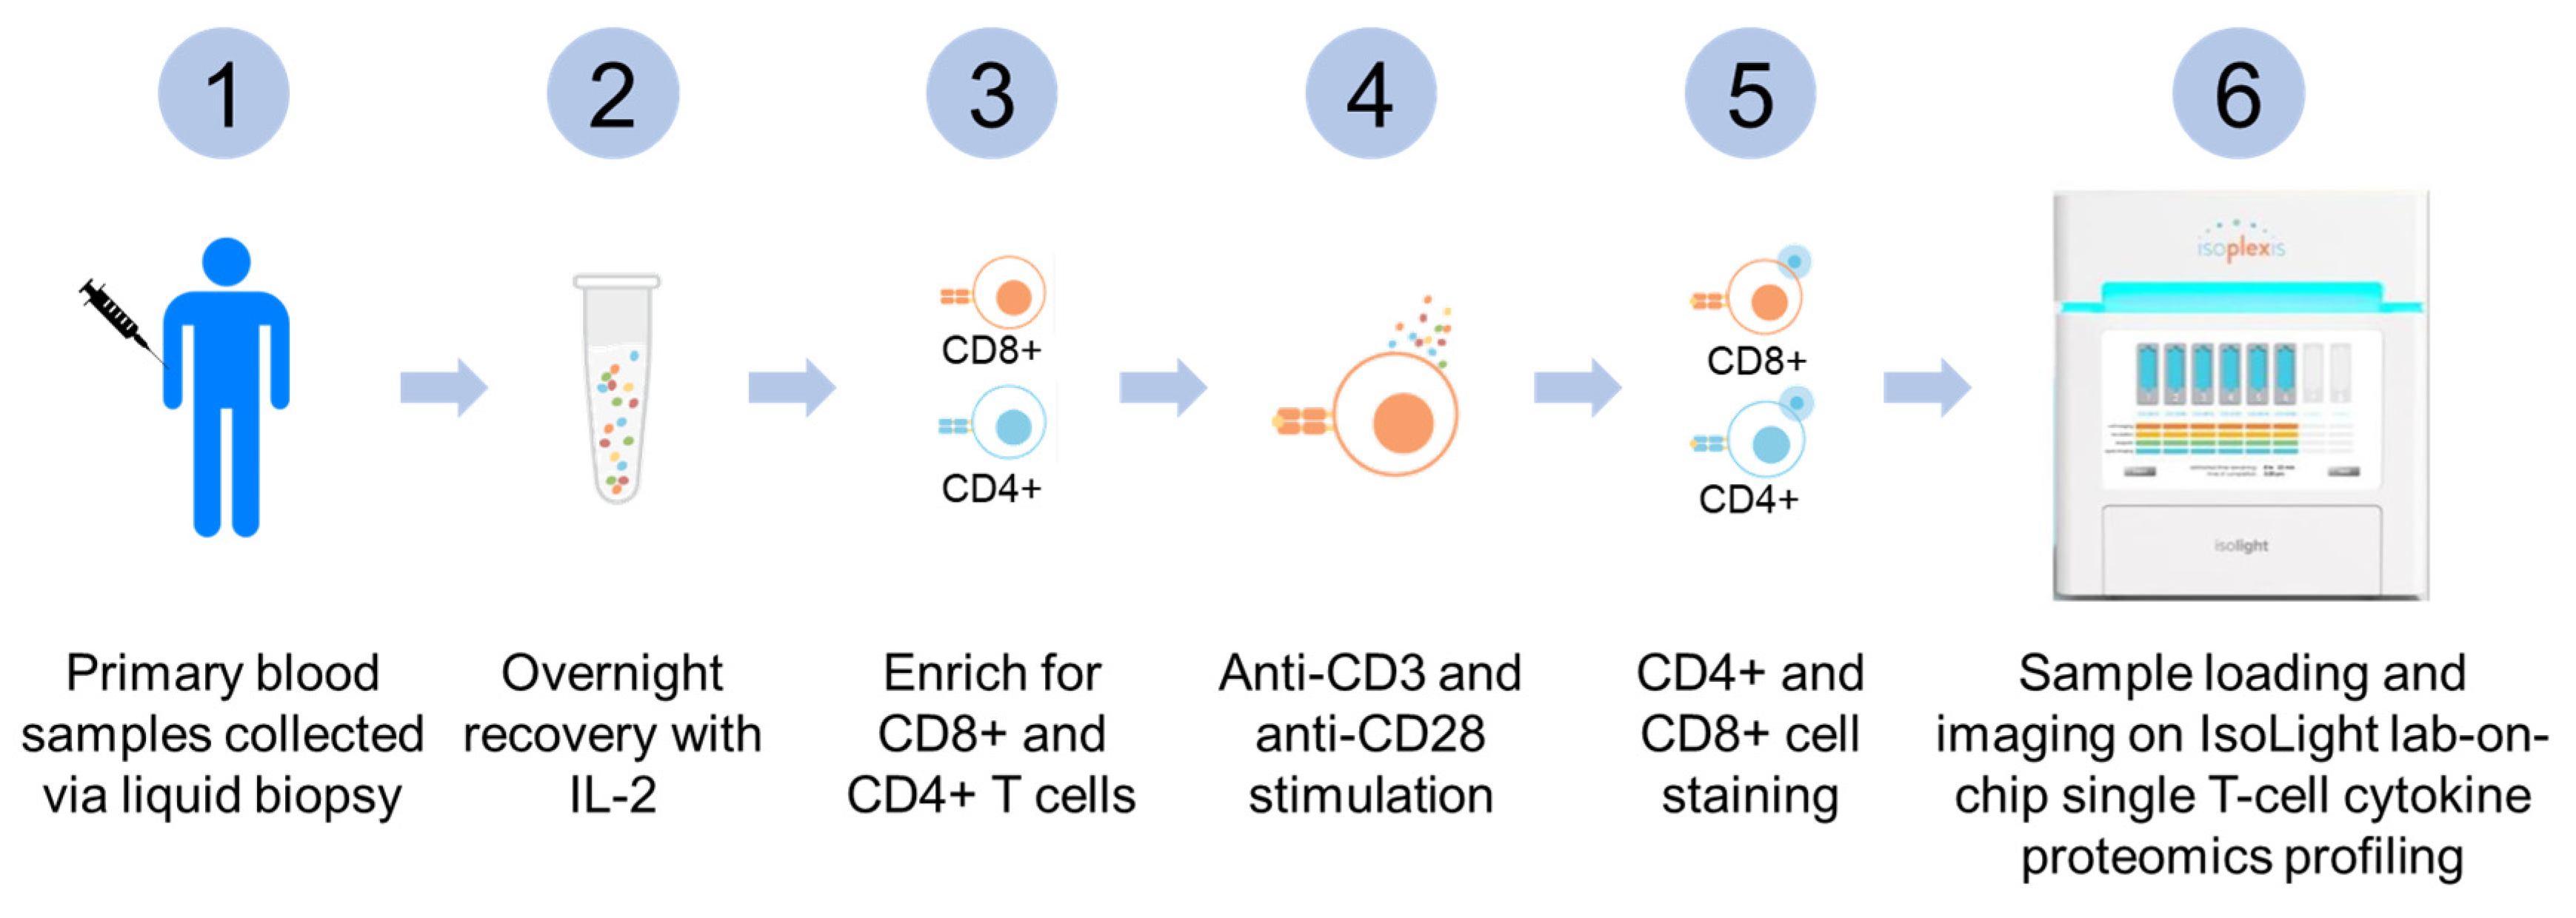
Figure 2.
IsoCode chip single T-cell lab-on-chip capture schematic overview.
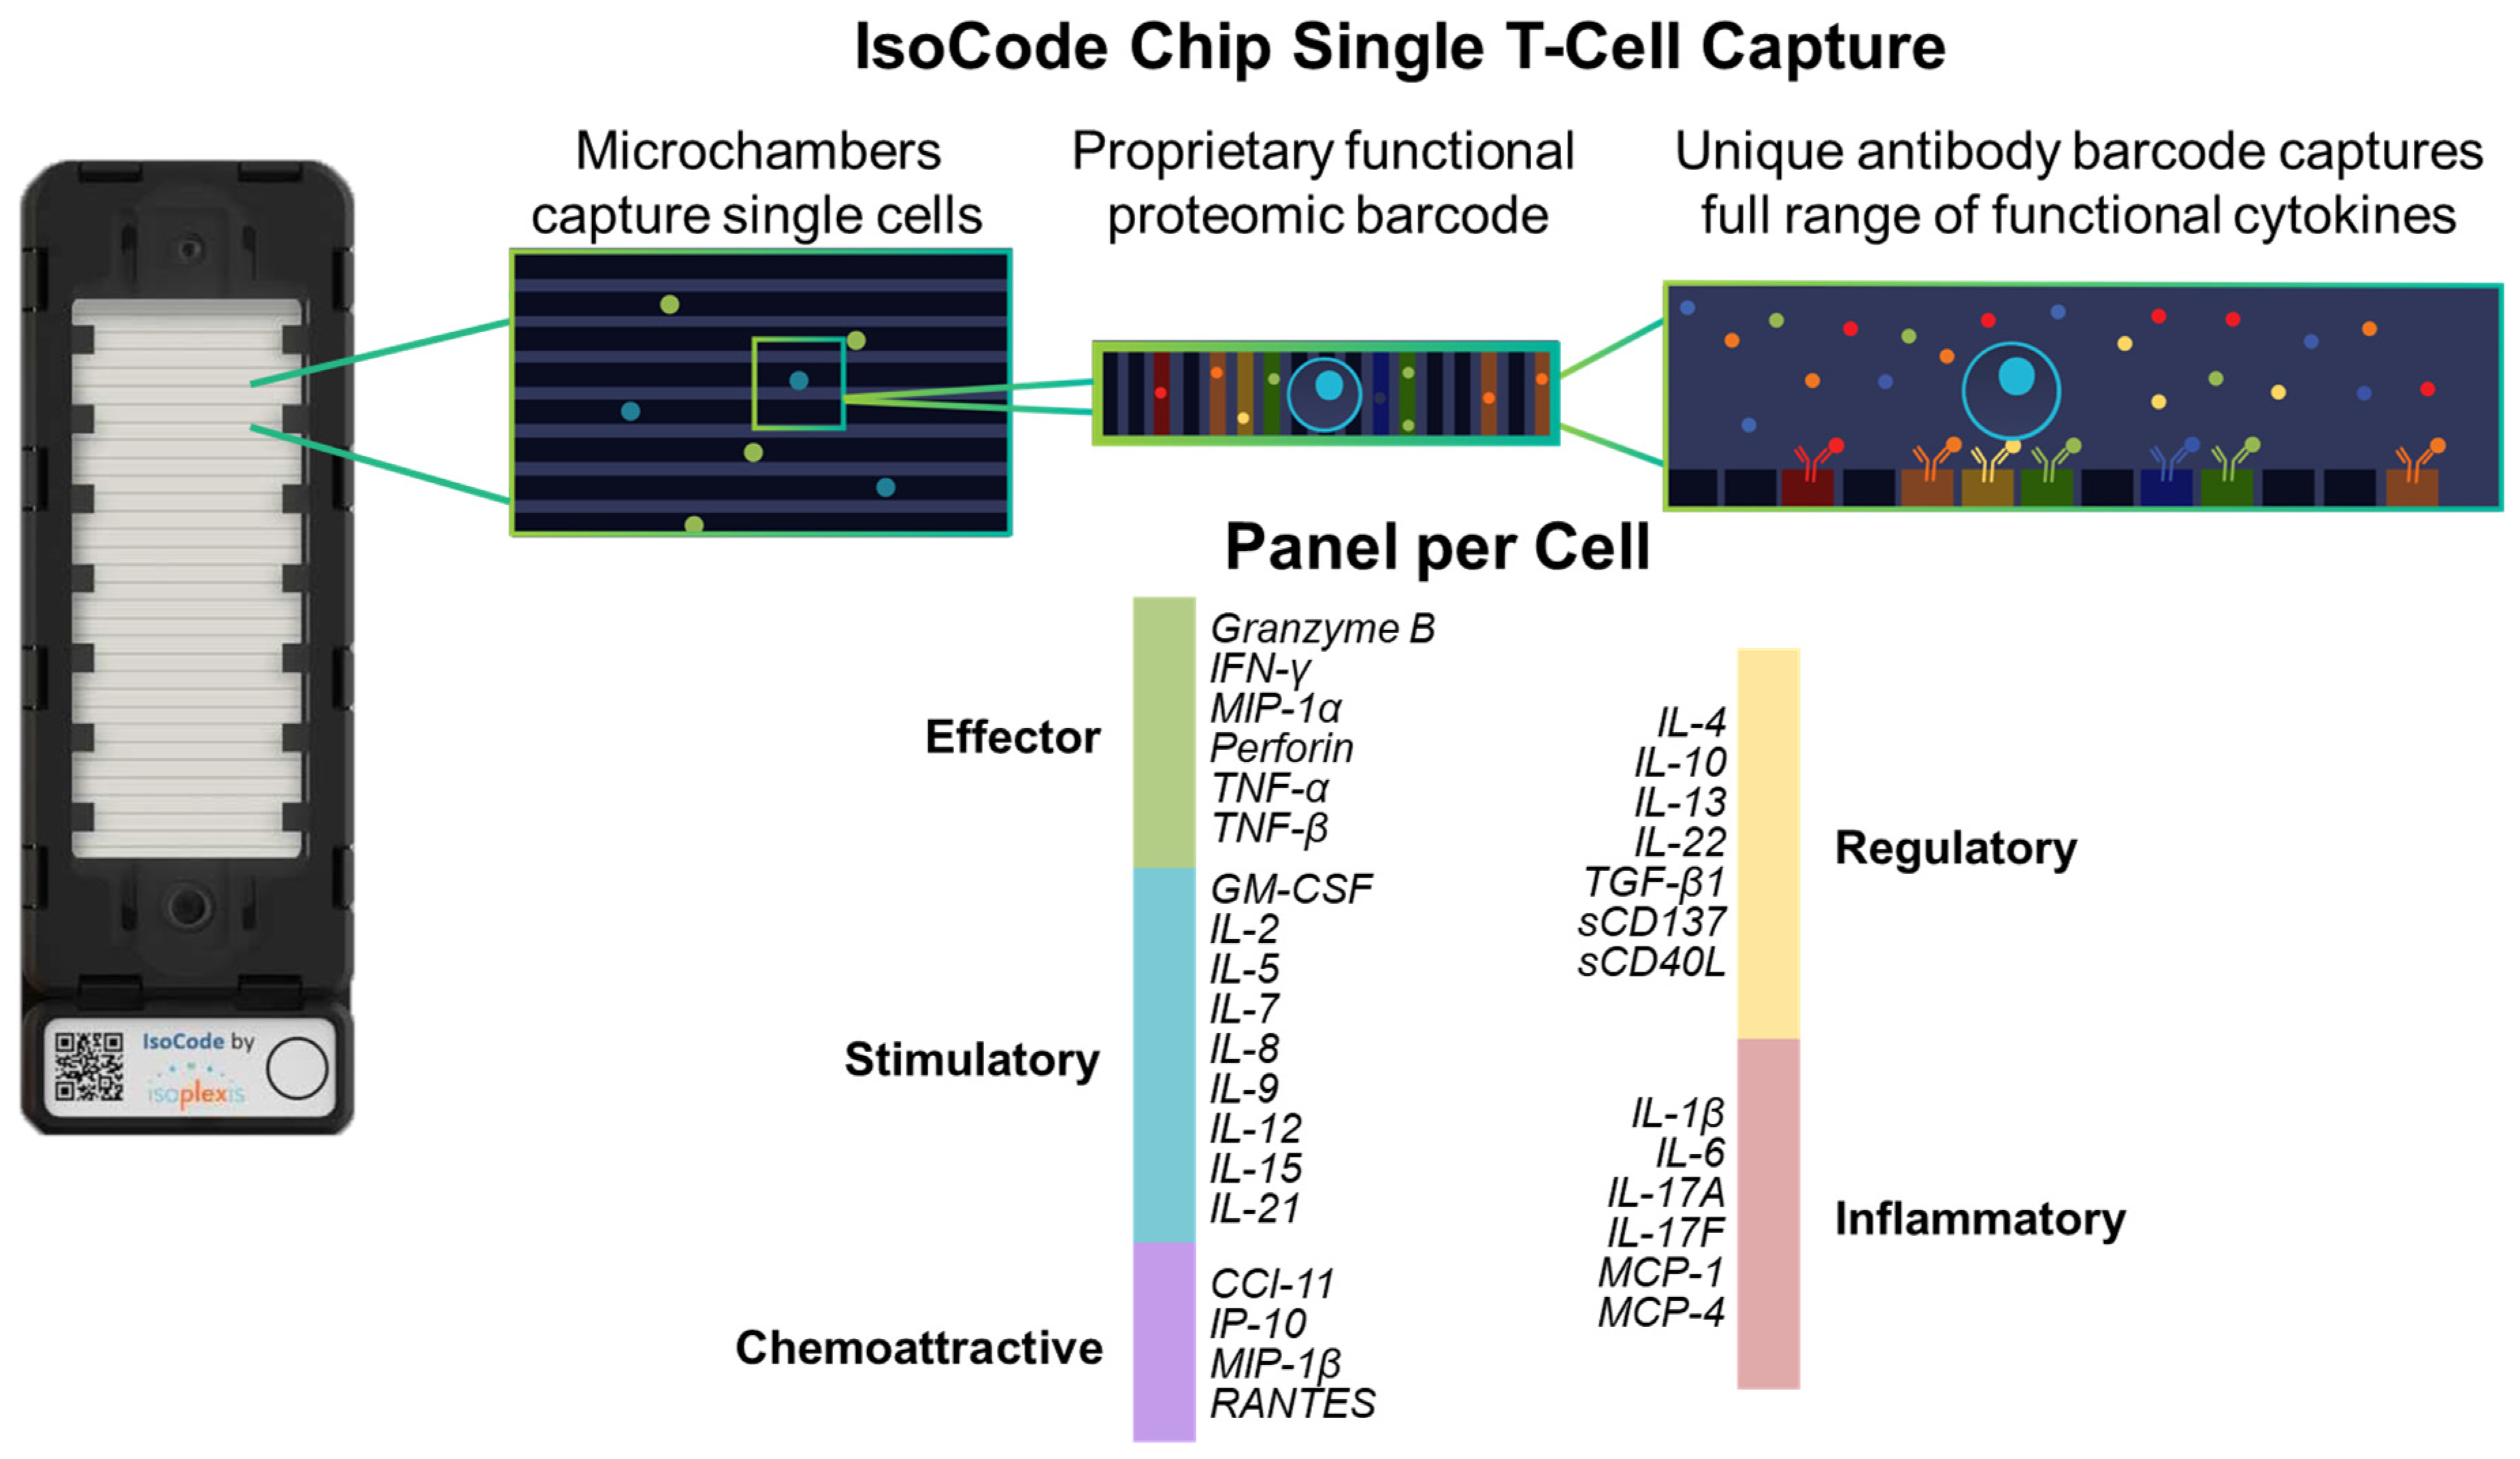
Figure 3.
Overall polyfunctionality (PolyFx) and polyfunctional strength index (PSI) comparison of peripheral single T-cells from healthy donors and pre-treatment baseline blood samples of NSCLC patients. The PolyFx between the healthy donors and the pre-treatment baseline NSCLC patient group was compared for (A) CD4+ T-cells (Healthy vs. NSCLC, p=0.23; Healthy vs. Non-Responder, p=0.56; Healthy vs. Responder, p=0.18) and (B) CD8+ T-cells (Healthy vs. NSCLC, p=0.49; Healthy vs. Non-Responder, p=0.49; Healthy vs. Responder, p=0.32). The PSI between the healthy donors and the pre-treatment baseline NSCLC patient group was compared for (C) CD4+ T-cells (Healthy vs. NSCLC, p=0.22; Healthy vs. Non-Responder, p=0.53; Healthy vs. Responder, p=0.18) and (D) CD8+ T-cells (Healthy vs. NSCLC, p=0.41; Healthy vs. Non-Responder, p=0.81; Healthy vs. Responder, p=0.28). Statistical analysis was performed with a Wilcoxon rank test. ALK; anaplastic lymphoma kinase; PSI, polyfunctional strength index; ns, not significant (p>0.05).
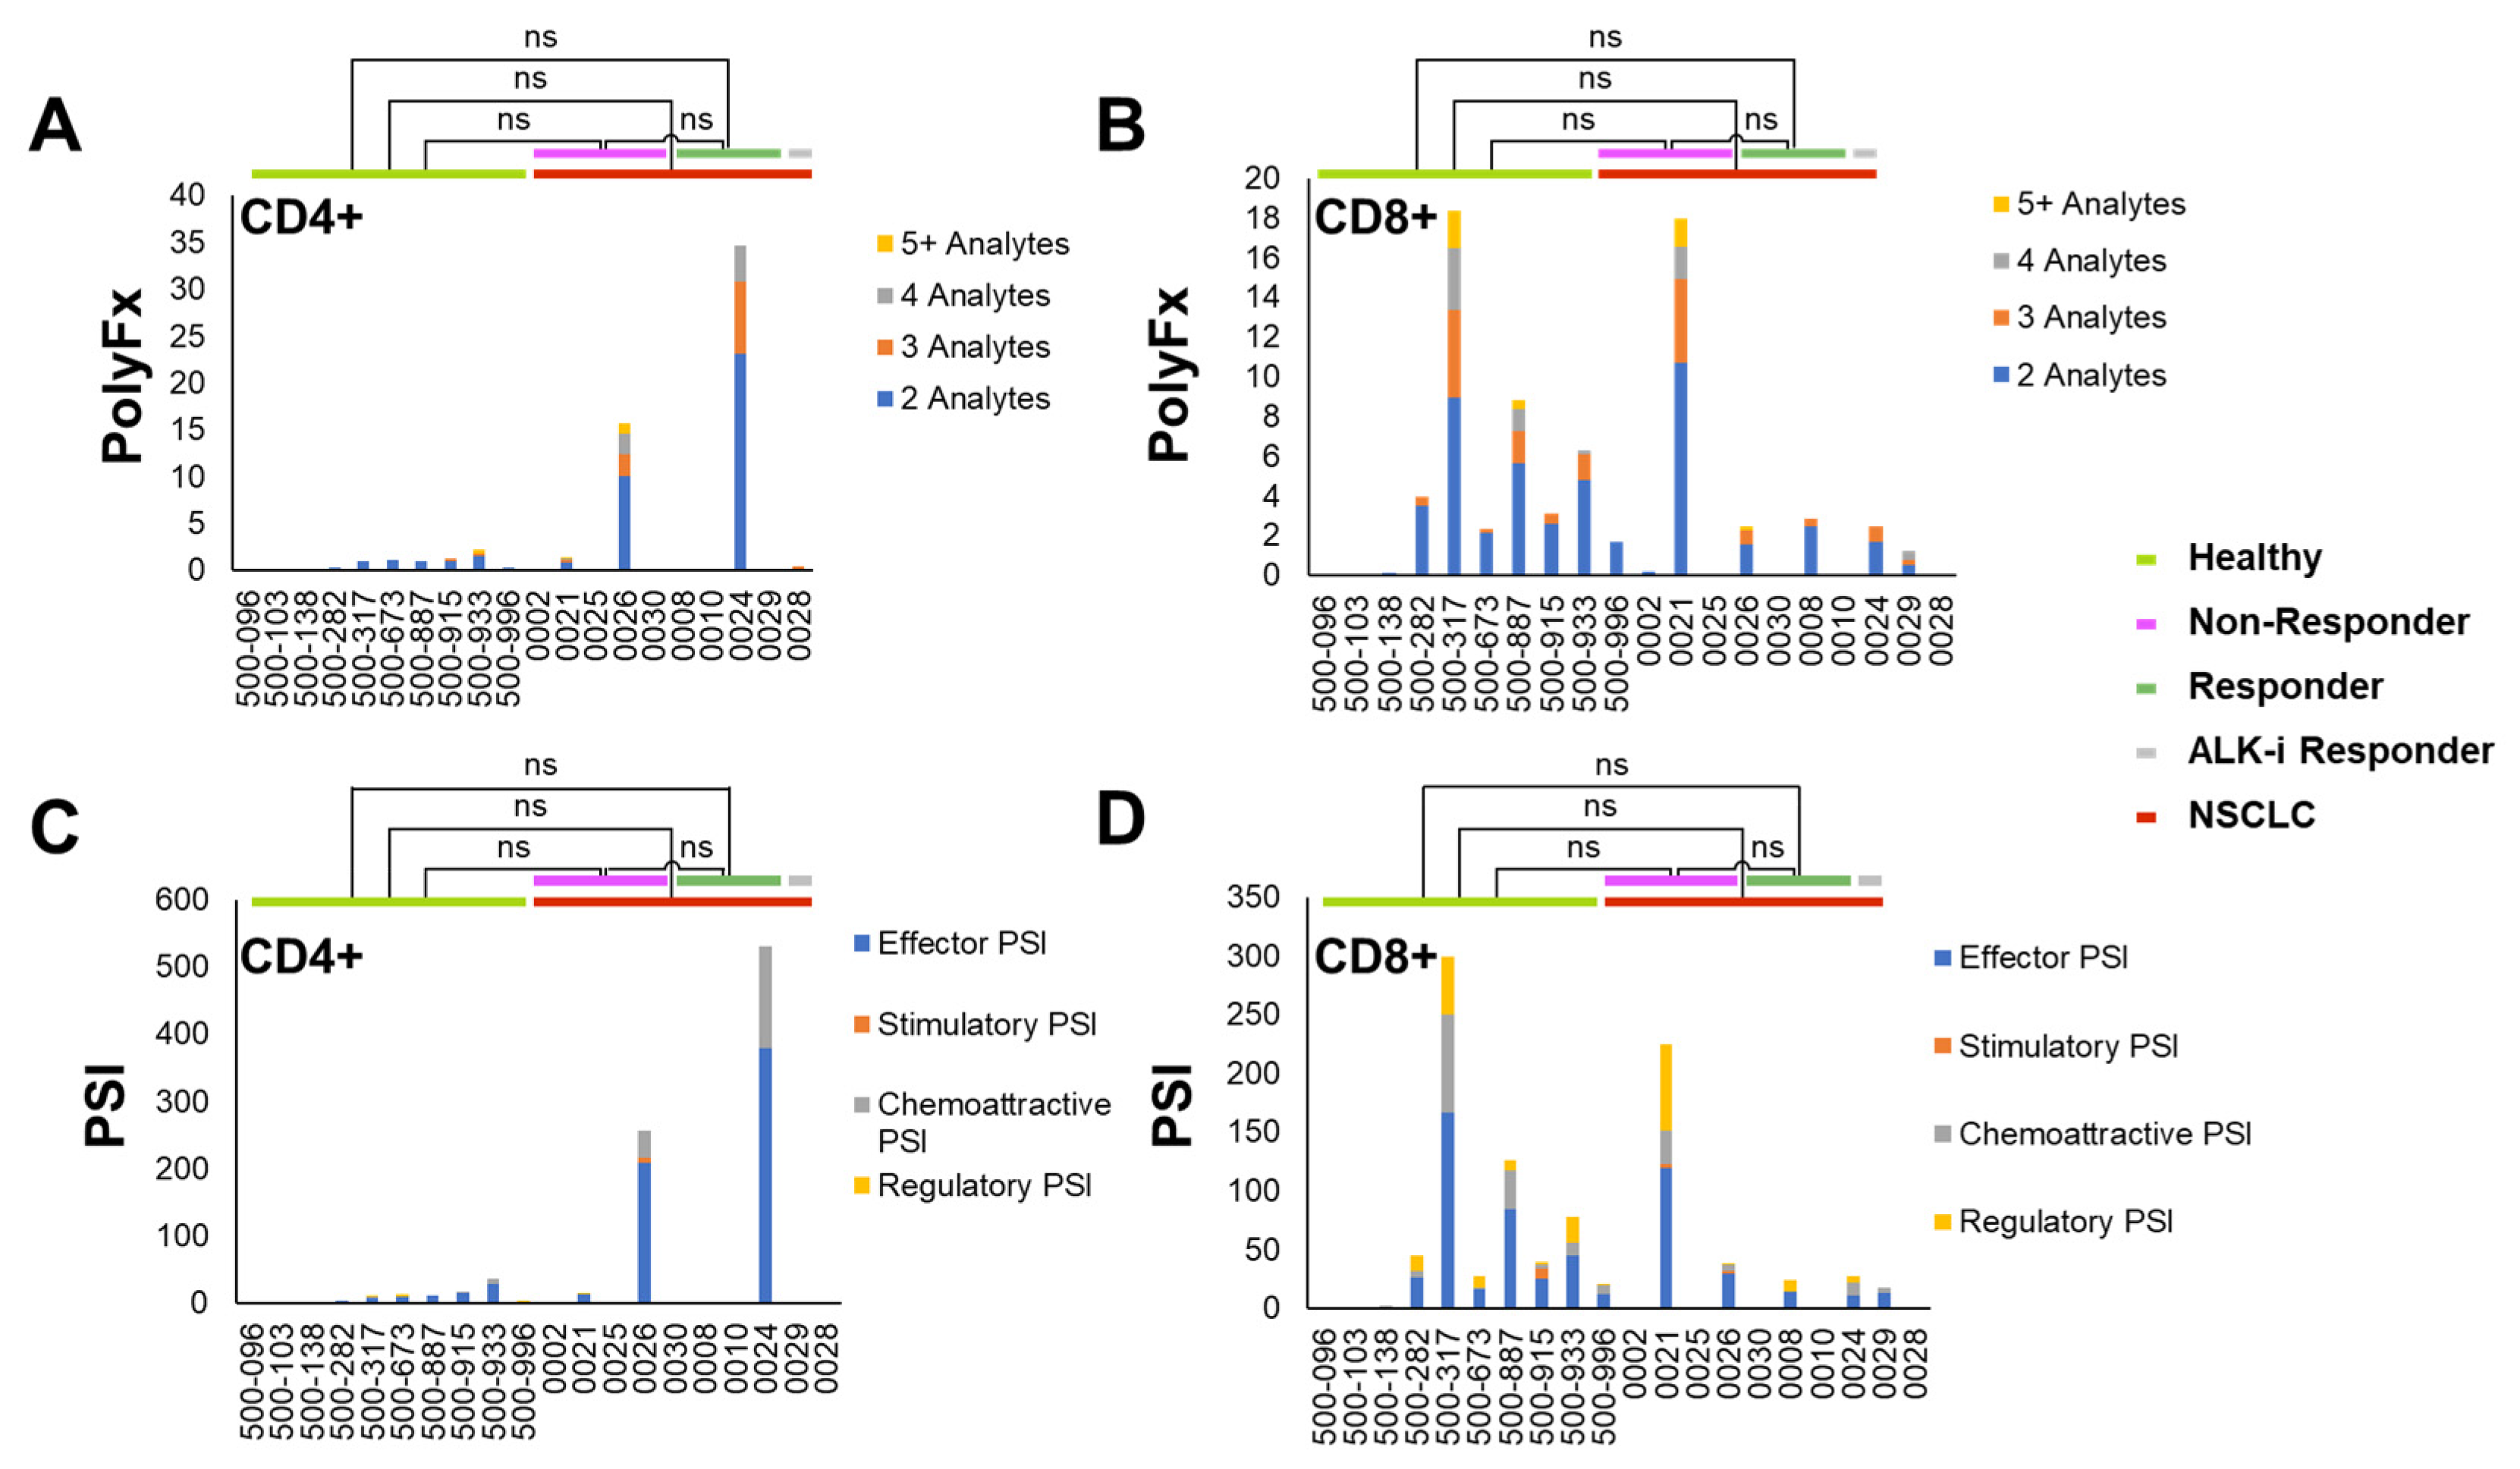
Figure 4.
Comparing the changes in overall polyfunctionality (PolyFx) and polyfunctional strength index (PSI) after two cycles of ICI treatment in responders vs. non-responders. The changes in overall polyfunctionality (ΔPolyFx) between responders and the non-responders were compared for (A) CD4+ T-cells (p=0.806) and (B) CD8+ T-cells (p=0.016). The changes in PSI (ΔPSI) between the responders and non-responders were compared for (C) CD4+ T-cells (p=0.905) and (D) CD8+ T-cells (p=0.016). Statistical analysis was performed with Wilcoxon rank test. Whisker plots representing the changes in overall polyfunctionality (ΔPolyFx) and PSI (ΔPSI) in responders vs non-responders in (E) CD4+ T-cells and (F) CD8+ T-cells revealing a significant difference between responders and non-responders in CD8+ T-cells. Statistical analysis was performed using a mixed model. (G) Comparing the tumor proportion score (TPS) for tumoral PD-L1 expression between responders and non-responders revealed that there is no significant difference (p>0.05) between the two groups. (H) Combining PD-L1 TPS and CD8+ ΔPSI strongly predicts early ICI treatment response to immunotherapy with a kappa coefficient of 1.0 (p=0.003). ΔPolyFx, change in overall polyfunctionality; ΔPSI, change in polyfunctional strength index; TPS, tumor proportion score; ns, not significant (p>0.05).
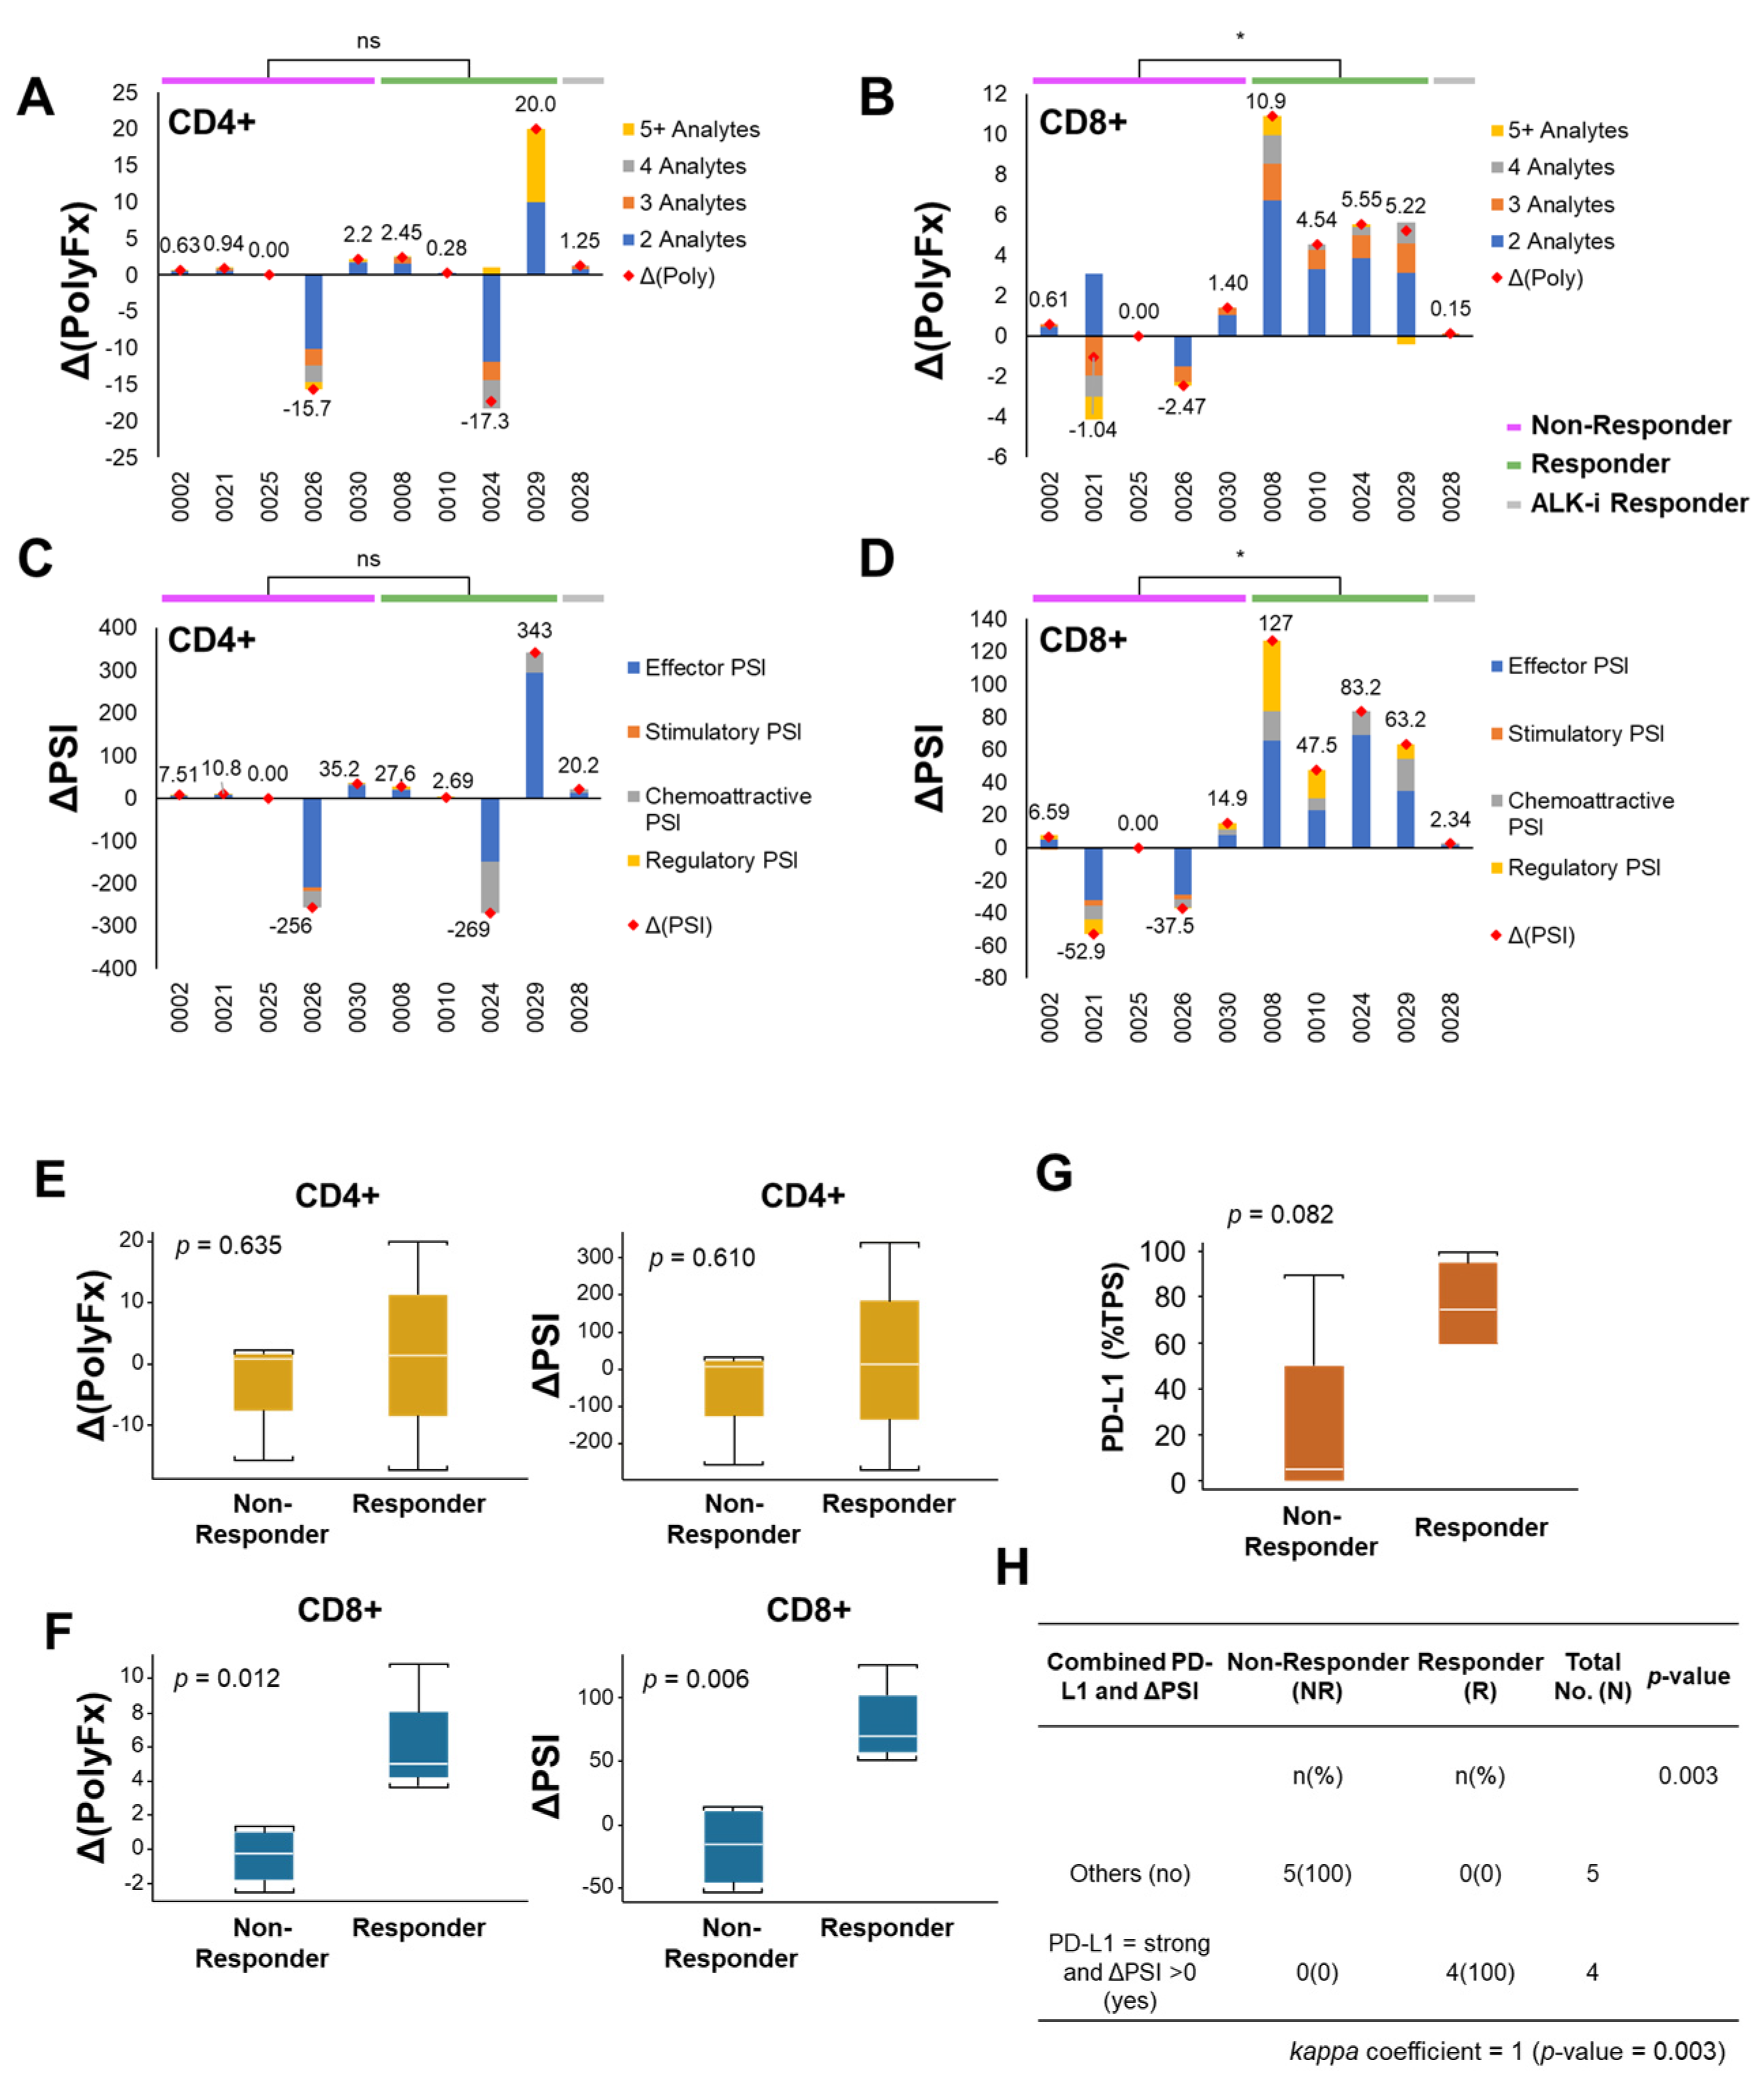
Figure 5.
2D and 3D t-SNE plots reveal greater upregulation of overall polyfunctionality (PolyFx) and PSI in CD8+ T-cells. All single cells secreting the indicated cytokines and the intensity of cytokines secreted between a representative non-responder (Patient-0002) and a representative responder (Patient-0008) pre- and post-2 cycles of immune checkpoint inhibition (ICI) therapy were visualized using a 2D t-SNE plot for (A) CD4+ T-cells and (B) CD8+ T-cells. Each dot represents a single cell. The parameters used for generating the 2D t-SNE plot are as follows: Iterations=3000, Perplexity=50. The heat maps reveal greater upregulation of polyfunctional subpopulations with unique cytokine signatures in CD8+T-cells both when sorted by (C) average PSI and (D) overall polyfunctionality (PolyFx) from responders (as in Patient-0008) compared with non-responders (as in Patient-0002), but not so in CD4+ T-cells when sorted by (E) average PSI and (F) overall polyfunctionality (PolyFx). (G) The 3D t-SNE plot of pre- and post-treatment CD8+ T-cell subsets in non-responders revealed considerable overlap between the two early treatment time points (with the intervals between cycle one and two of ICI), suggesting no appreciable difference between the profiles of cytokines secreted before and after ICI treatment. The dotted orange and blue circles illustrate the profile boundaries of each cell cluster. The parameters used for this plot were as follows: Iterations=3000, Perplexity=100. (H) The 3D t-SNE plot of pre-and post-treatment CD8+ T-cell subsets in responders revealed that the two on ICI-treatment samples tend to form distinct clusters, although with some overlap existing. The dotted orange and blue circles illustrate the profile boundaries of each cell cluster. The parameters used for this plot were as follows: Iterations=3000, Perplexity=100. t-SNE, t-distributed stochastic neighbor embedding. PolyFx, overall polyfunctionality; PSI, polyfunctional strength index; NR, non-responder; R, responder.
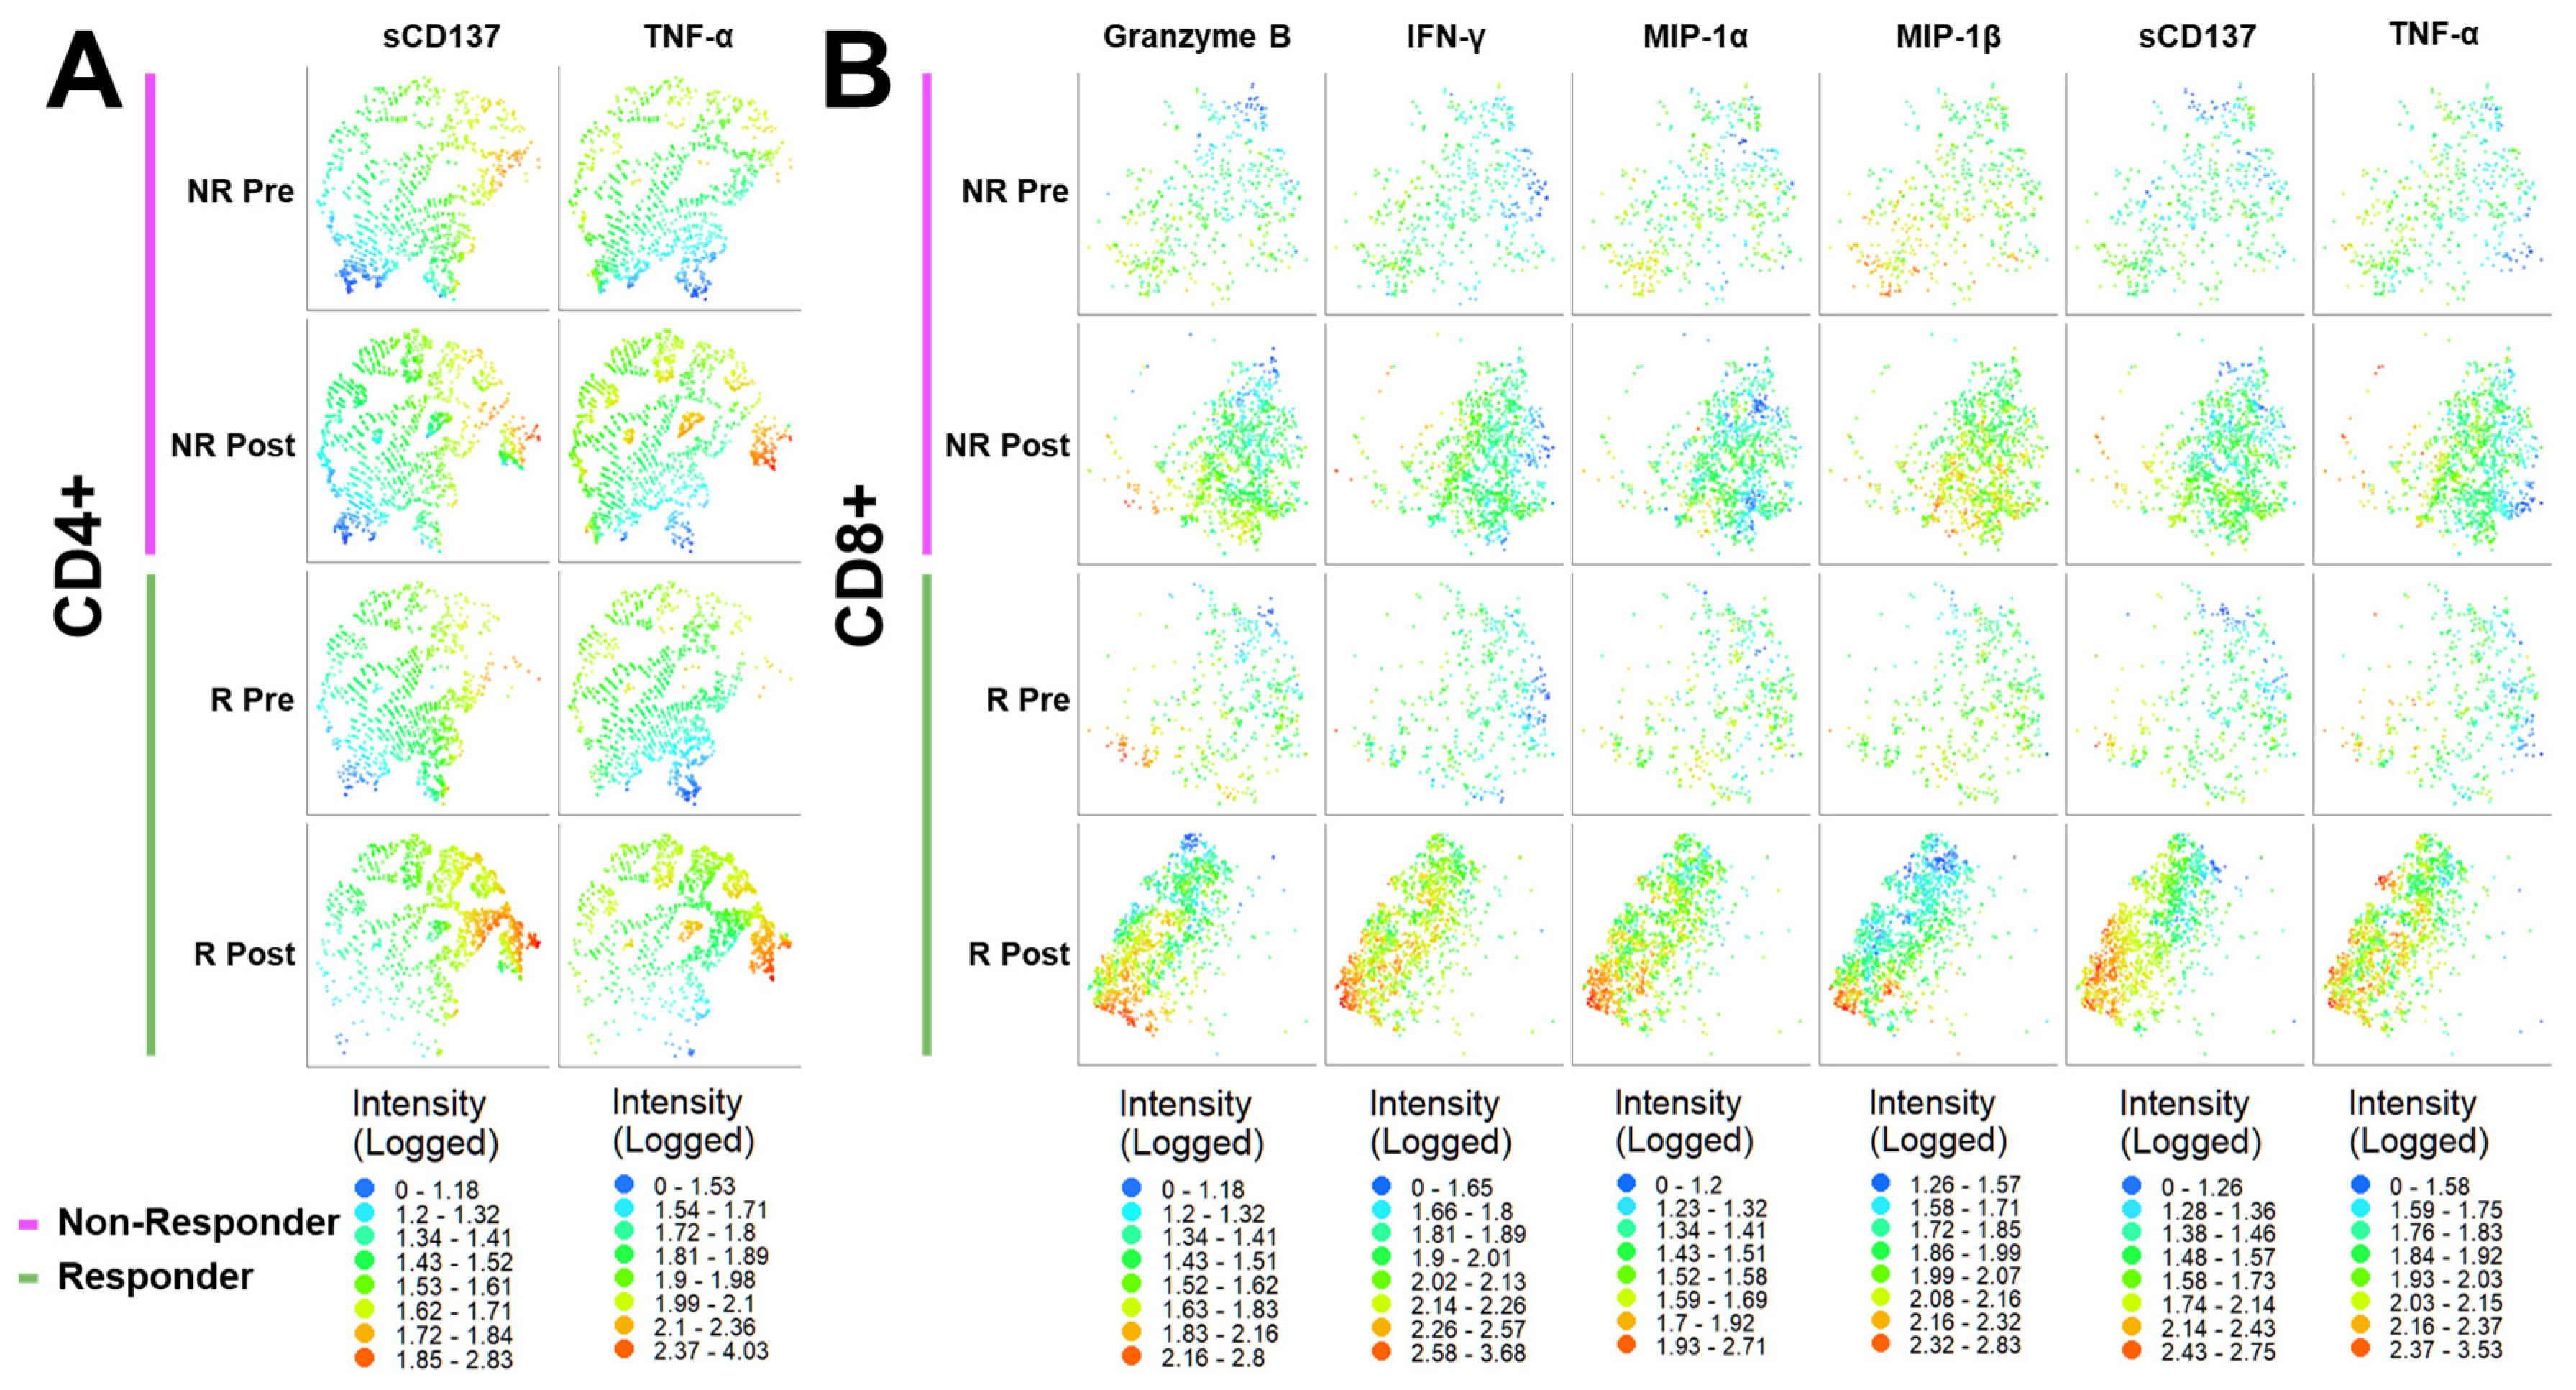
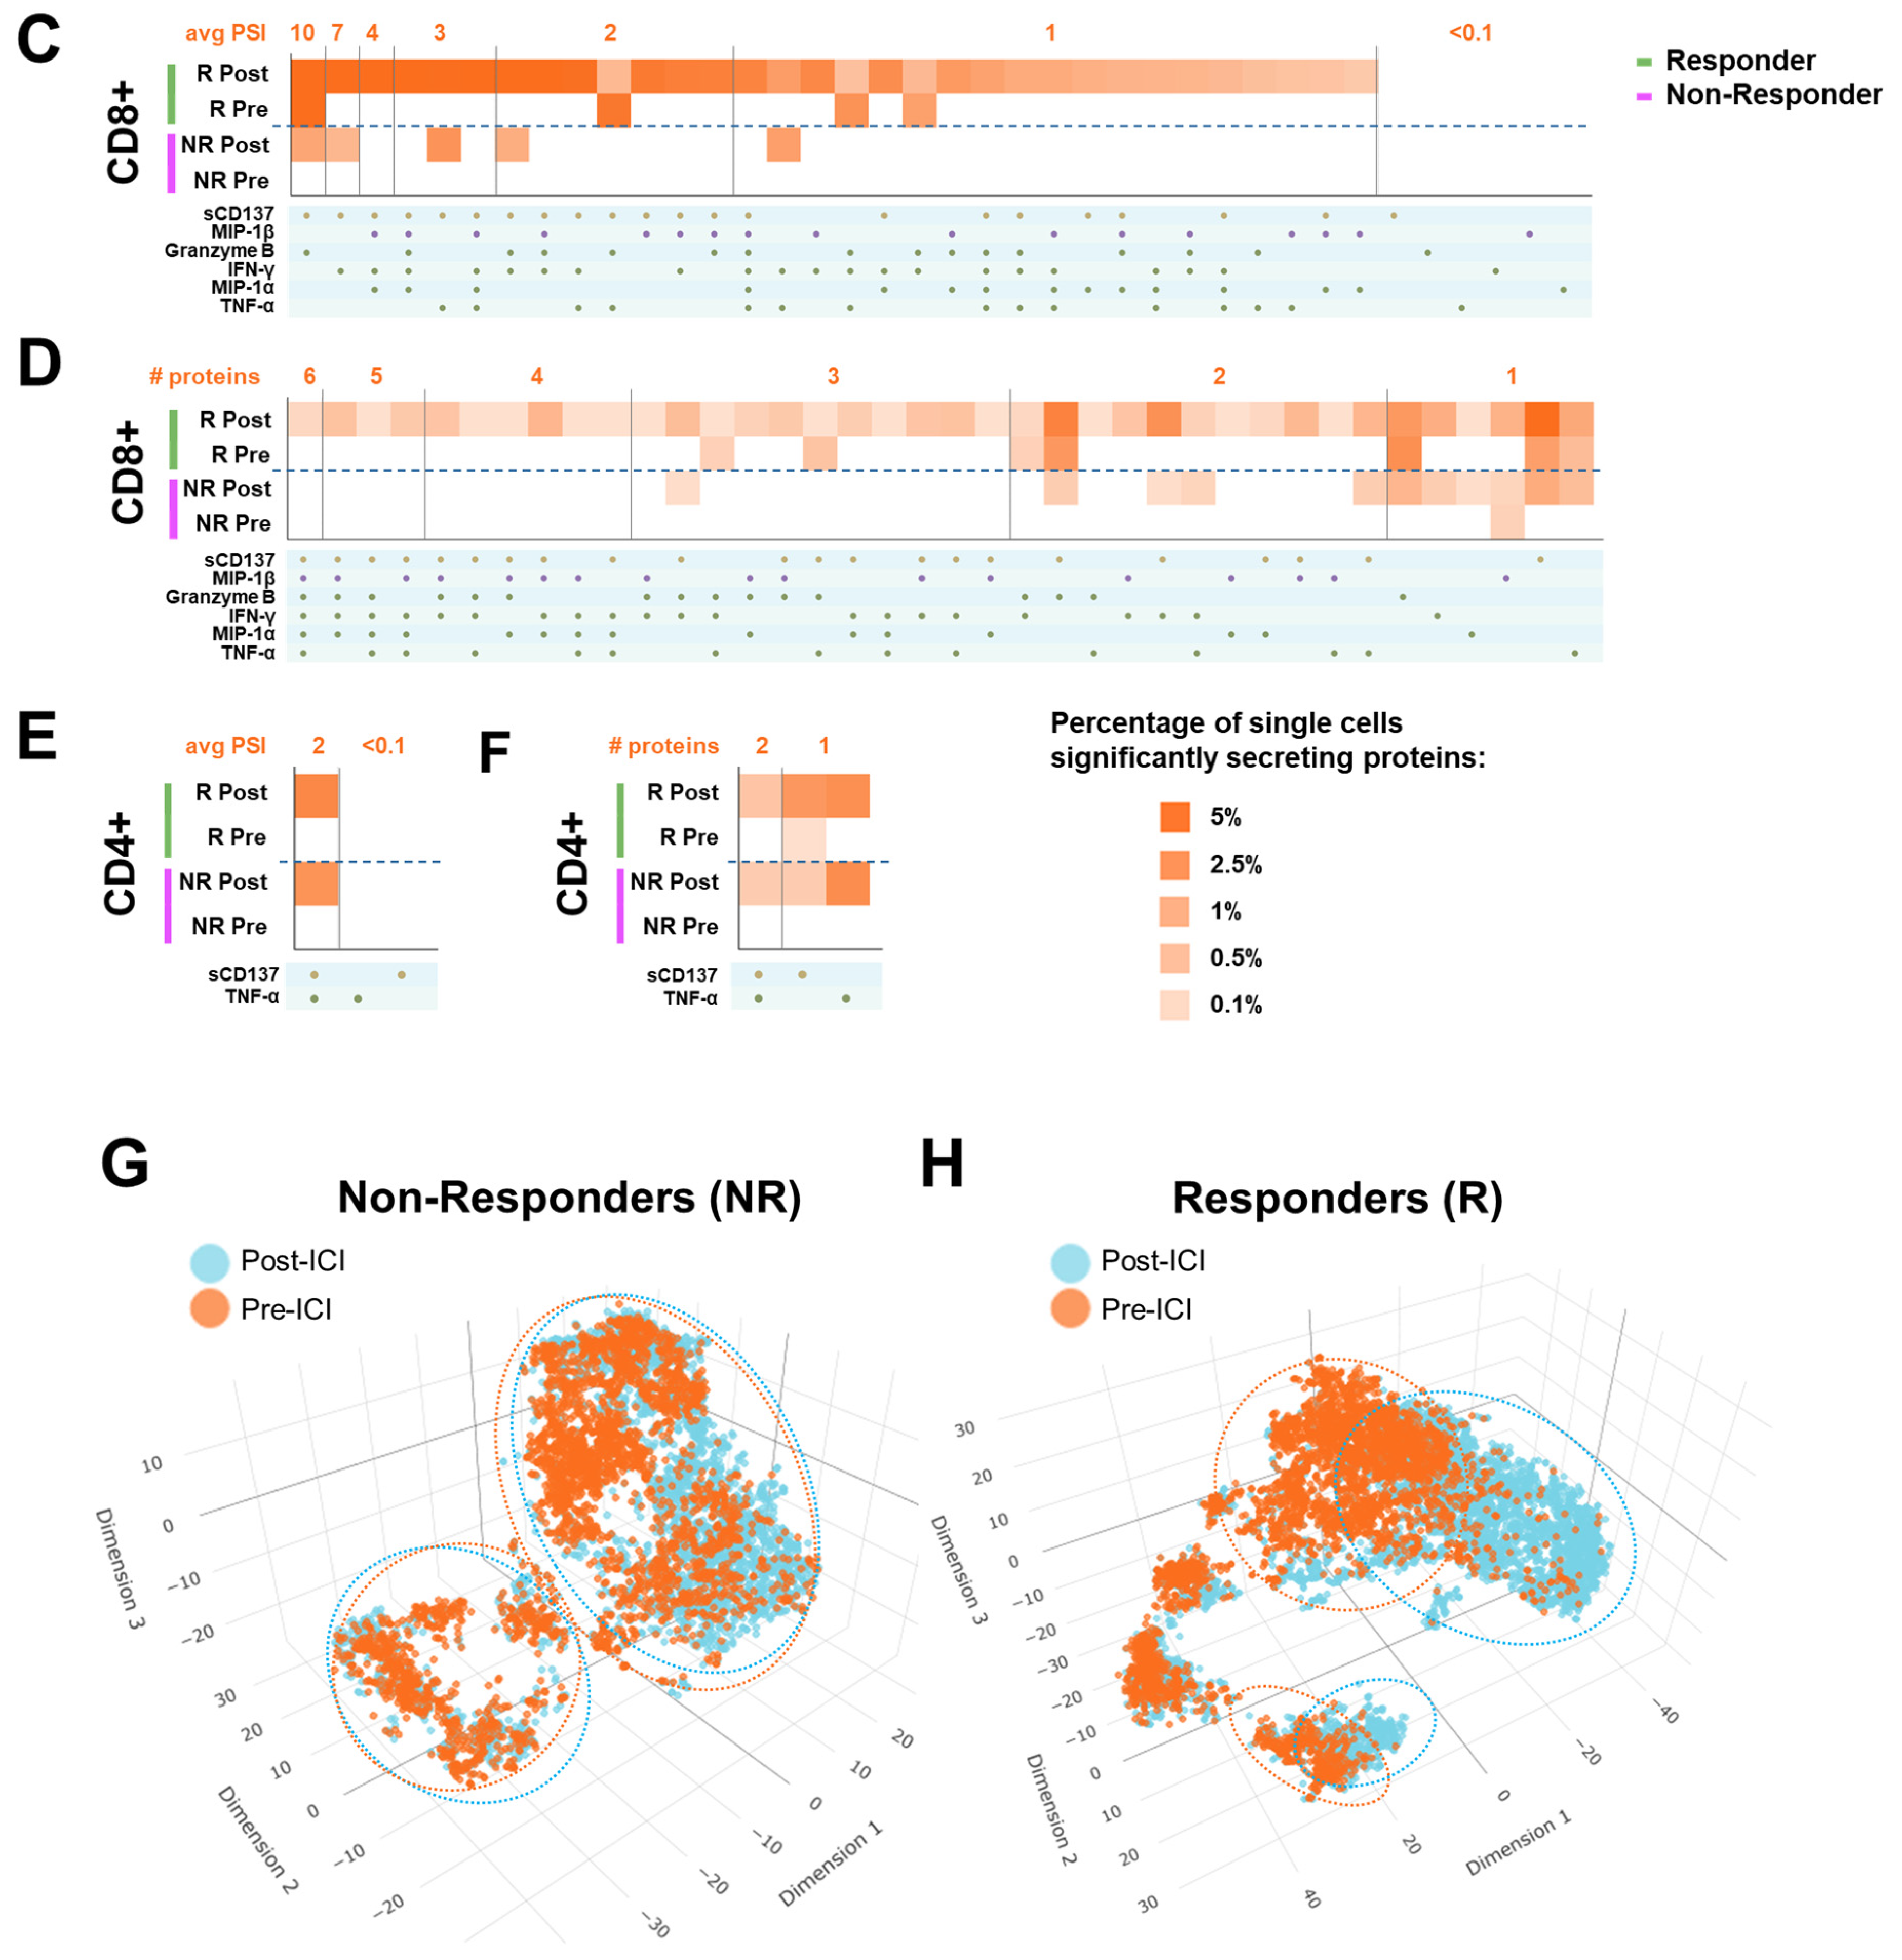
Figure 6.
Longitudinal profiles of the CD8+ T-cell PolyFx and PSI alterations of NSCLC patients undergoing ICI-based treatment and further lines of cancer therapies. Patients-0002, -0008, and -0024 were followed longitudinally, and their PolyFx and PSI dynamic landscapes were plotted and schematically represented here. Key correlating clinical imaging scans were included and presented for illustrative purposes. (A) Responder Patient-0008. 79-year-old male, active smoker with 120 pack-years cigarette smoking history and ongoing pipe smoking habit, with TP53 mutation and MET genomic amplification positive metastatic poorly differentiated lung adenocarcinoma, stage IVB (cTxN2M1c), with metastasis to his brain and right adrenal at time of initial diagnosis. His tumoral PD-L1 TPS was 95% (22C3). He initially presented with mental status change and a motor vehicle accident when it was found, in the emergency department, that he had an abnormal 1.5 x 1.5 x 2 cm ring-enhancing left frontal mass metastasis with extensive vasogenic edema with subfalcine herniation and effacement of the left lateral ventricle. He was initially treated with gamma knife radiotherapy and then systemic pembrolizumab 200mg IV every three weeks ICI alone as his first-line therapy, and experienced near complete response after two cycles. He later had repeat brain gamma knife radiotherapy for a new subcentimeter brain metastasis, with continuation of ICI afterwards with continual near complete response status. His CD8+ T-cell ΔPolyFx was 10.89 and ΔPSI was 126.69 (Figure 2B,D), both correlating well with his ICI treatment response status as a responder. Disease progression was noted in July 2018, after ten cycles of pembrolizumab, with enlargement of subcarinal lymph node (confirmed by positive rebiopsy), and enlarging paratracheal mediastinal nodes and intraabdominal adenopathy. He was then enrolled in a phase 1 clinical trial study treatment using a MET inhibitor CBT-101 with partial response after two cycles of treatment. However, he withdrew from study treatment thereafter due to his concern for treatment-related adverse effects, declining the offer of a trial dose reduction. He was switched to another MET inhibitor crizotinib in December 2018, with which he achieved stable disease response on a total of about two months’ therapy with subsequent discontinuation due to intolerance. He was found to be on disease progression, confirmed by PET/CT imaging eventually in April 2019, with significant weight loss, abdominal pain, and hyperbilirubinemia with clinical jaundice. He was admitted to the hospital and ultimately enrolled in hospice care. Yellow arrows on the imaging scans indicate tumor disease burden. PD, progressive disease; 2C, 2 cycles. (B) Responder Patient-0024. 49-year-old, never-smoker woman who had recurrent EGFR del19 (E746_A750del)-driven lung adenocarcinoma after prior lobectomy and subsequent chemoradiotherapy for recurrence. She then presented with mental status change in recurrence due to brain metastases, which was treated with craniotomy and gamma knife radiotherapy. She was initially started on erlotinib with best complete response, but was later found to have widespread progression on erlotinib and was switched to osimertinib (due to emergence of acquired EGFR-E746_A750del + T790M mutation in erlotinib acquired resistance), with essential complete response. Eventually, she was treated with Carboplatin-Paclitaxel-Bevacizumab-Atezolizumab (ABCP) after osimertinib-resistant progression. The tumoral PD-L1 expression was strong (TPS 60%; 22C3). Intriguingly, she experienced both complete tumor response and metabolic response after merely just one cycle of the ABCP treatment, despite treatment toxicities delaying her 2nd cycle of treatment to 6 weeks later. Her CD8+ T-cell ΔPolyFx was 5.55 and ΔPSI was 83.24 (Figure 2B,D), which correlated well with her ICI treatment response status as a responder. She then continued to complete a total of 4 cycles of the ABCP induction combination therapies, with continual response on extended maintenance bevacizumab-atezolizumab therapy. Yellow arrows on the imaging scans indicate tumor disease burden. 2C, 2 cycles. (C) Non-responder Patient-0002. 66-year-old male, active smoker of 22.5 pack-years history who presented with a worsening productive cough over four months, along with dyspnea, anorexia, and weight loss of 10 pounds, and post-obstructive pneumonia of his right lung. CT chest and PET/CT imaging eventually confirmed a bulky 12 x 10 cm right upper lobe apical mass with mediastinal adenopathy, with the largest being 2.7 cm in the aorta-pulmonary window. CT-guided biopsy of the right lung mass confirmed a poorly differentiated adenocarcinoma. PD-L1 expression was strong at TPS 90% (22C3). There was left supraclavicular hypermetabolic adenopathy in addition to the right hilar and mediastinal disease involvement. He was started on concurrent chemoradiotherapy with cisplatin and etoposide; and later treated with the anti-PD-L1 ICI durvalumab in early 2018, which showed the best response as a stable disease after a total of 12 months of the ICI treatment. Yellow arrows on the imaging scans indicate tumor disease burden. 2C, 2 cycles. (D) 3D t-SNE plots of longitudinal treatment time points in a representative responder Patient-0008. Patient-0008’s pre- and post-2 cycles (2C) ICI single cell populations segregated away from each other, coinciding with his status as an ICI treatment responder. The C06, C07, C09, and C10 time points clustered further away after the early tumor ICI treatment response, coinciding with the time when the tumor began to progress. When the patient underwent further non-ICI MET-targeted therapy treatment regimens (CBT-101 and crizotinib), the single cells clustered away from when the patient underwent ICI treatment, showing that our live functional T-cell measurement is sensitive enough to detect the difference in peripheral T-cells immune functionality landscapes during the evolving course of cancer treatment modalities and disease burden changes. R, responder; 2C, 2 cycles; PD, progressive disease. (E) 3D t-SNE plots of longitudinal treatment time points in a representative non-responder Patient-0002. Patient-0002’s non-responder status was reflected in the longitudinal 3D t-SNE plot as single cells clustering close to each other in the pre-and post-2 cycles of ICI treatment samples (dotted orange and blue circles). The stable disease and persistent stable disease single T-cell samples evidently displayed some clustering away from the pre- and post-treatment samples, suggesting potential tumor microenvironment influence and evolving single T-cell functional flux alterations within stable disease status. NR, non-responder; 2C, 2 cycles.
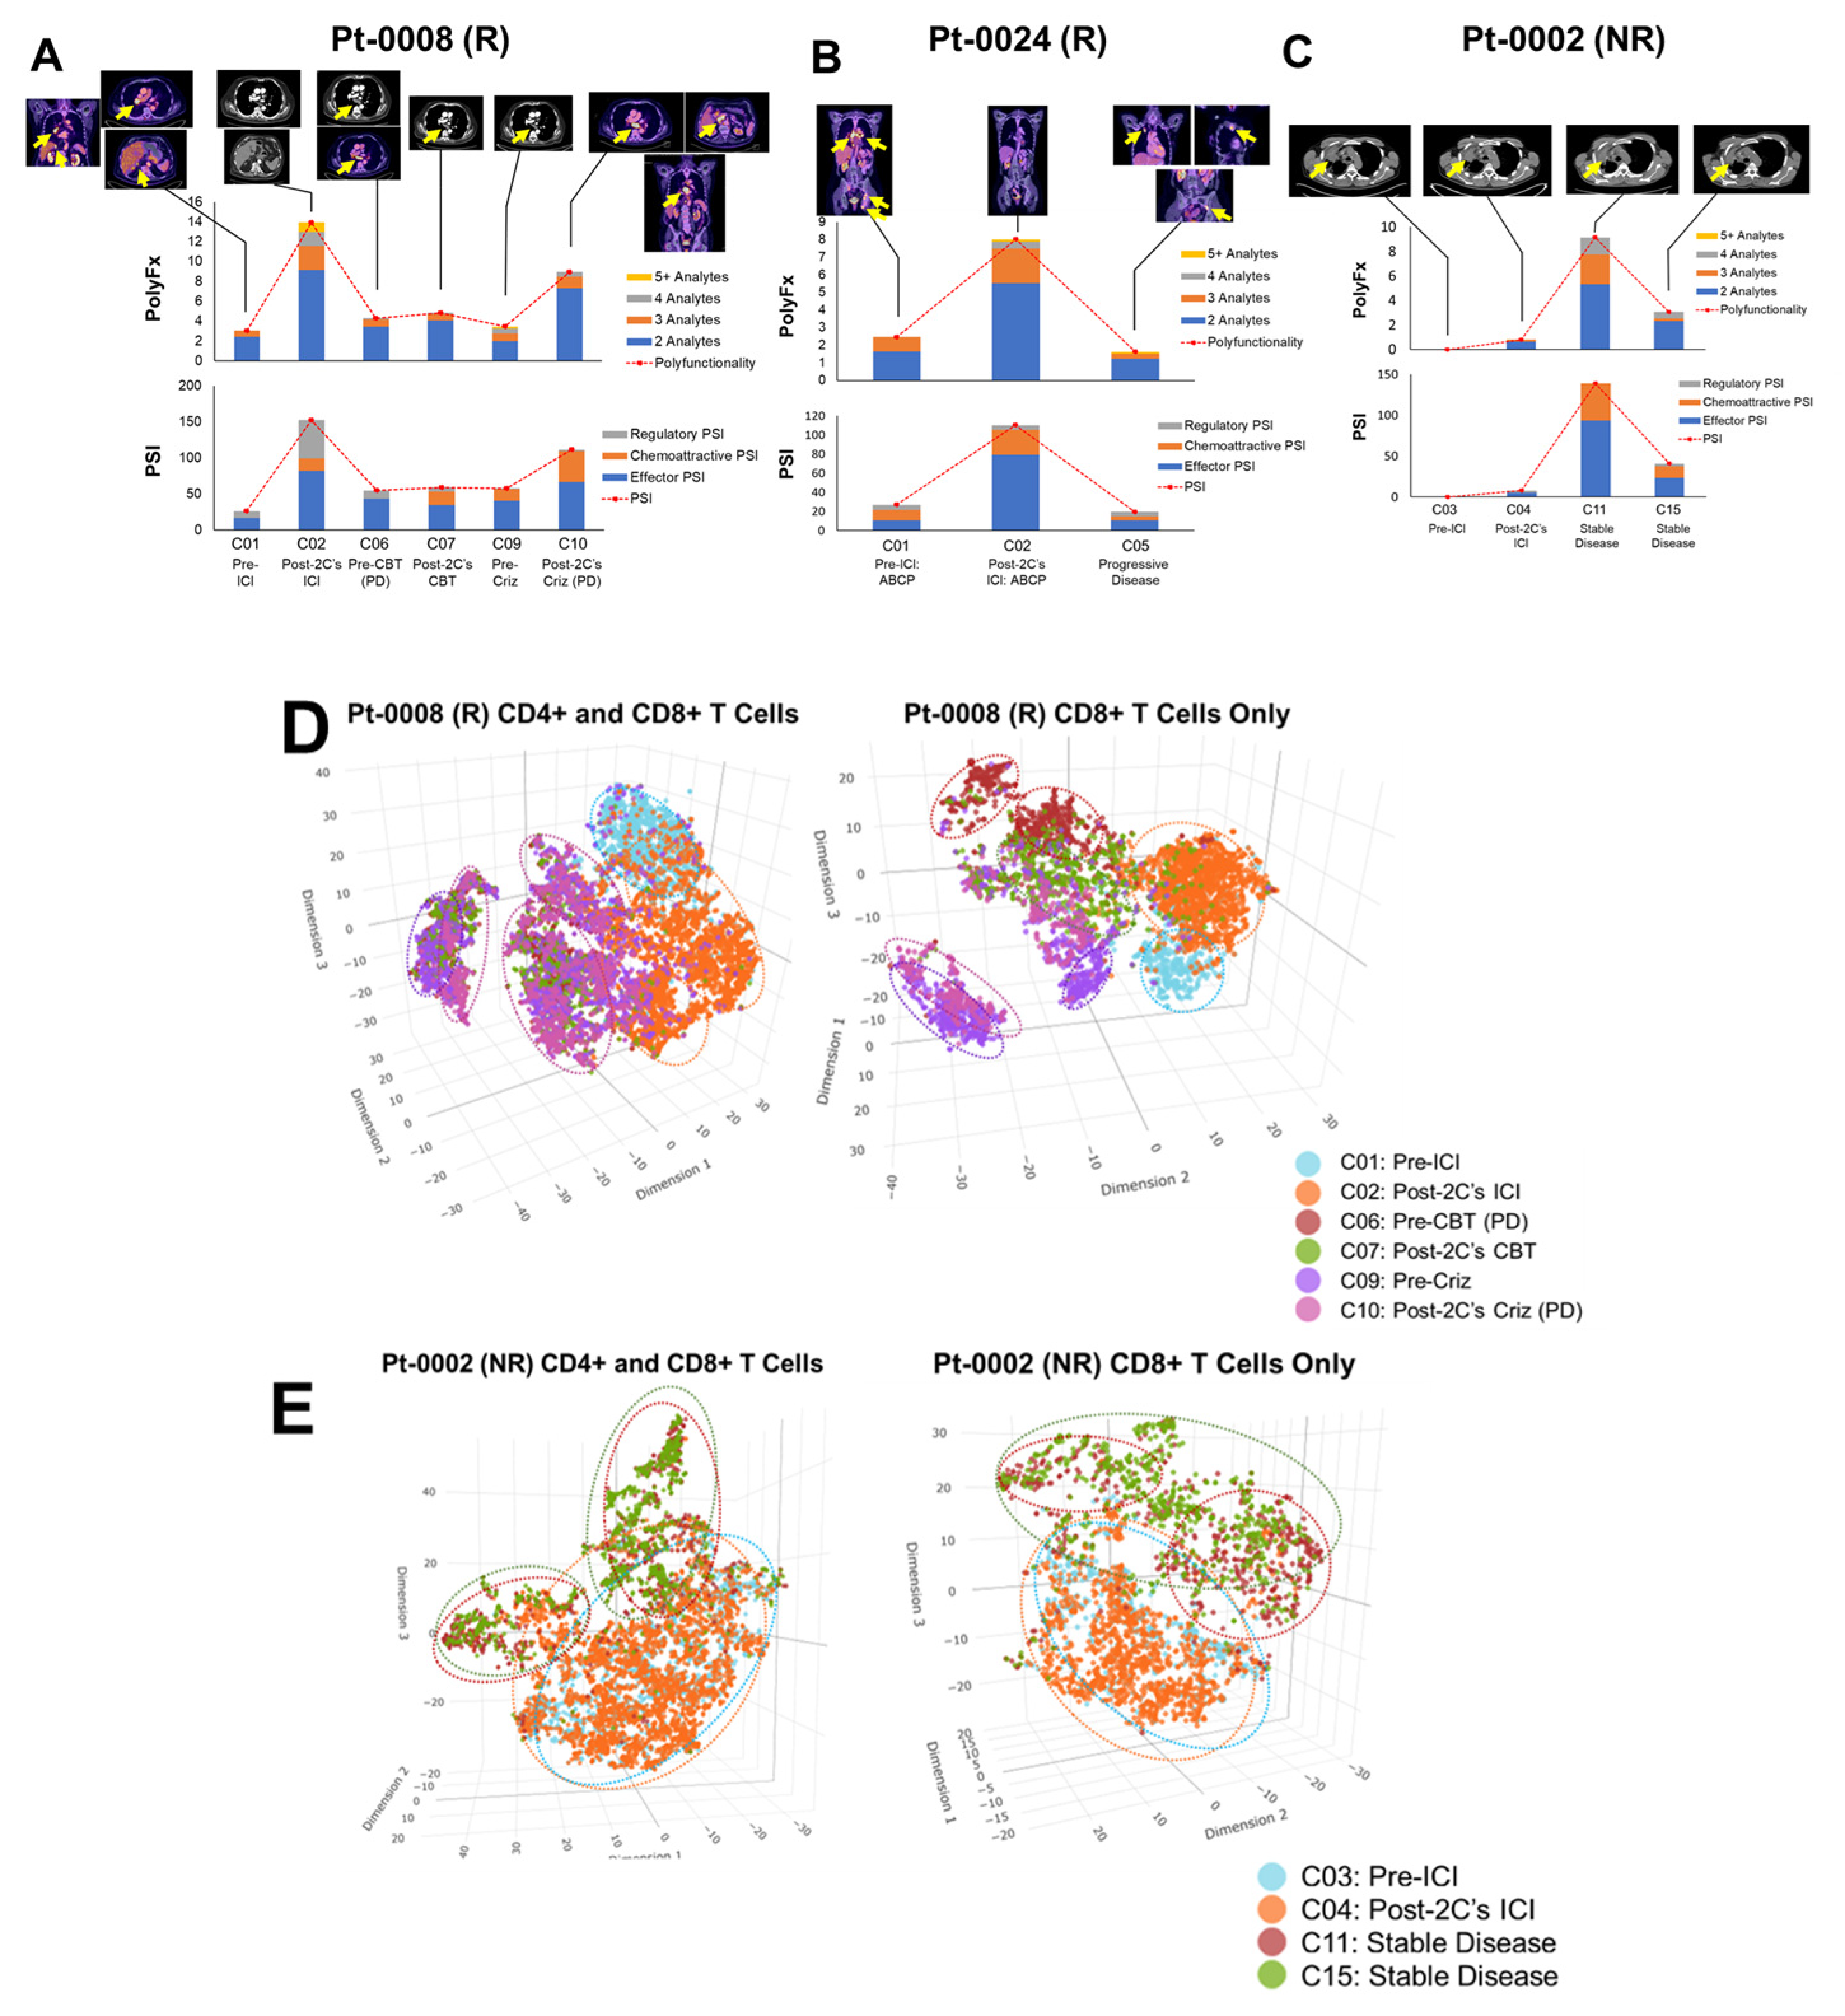
Figure 7.
Kaplan-Meier clinical survival outcomes analysis of PSI changes (ΔPSI) in ICI-treated NSCLC. CD4+ T-cells analysis. (A) PFS: Progression-free survival. The median PFS of patients with CD4+ ΔPSI >5 was 10.8 months, whereas those with ΔPSI ≤5 has median PFS of 2.8 months (p=0.07). (B) OS: Overall survival. The median OS of patients with CD4+ ΔPSI >5 was 34.5 months, whereas those with ΔPSI ≤5 has median PFS of 11.5 months (p=0.09).
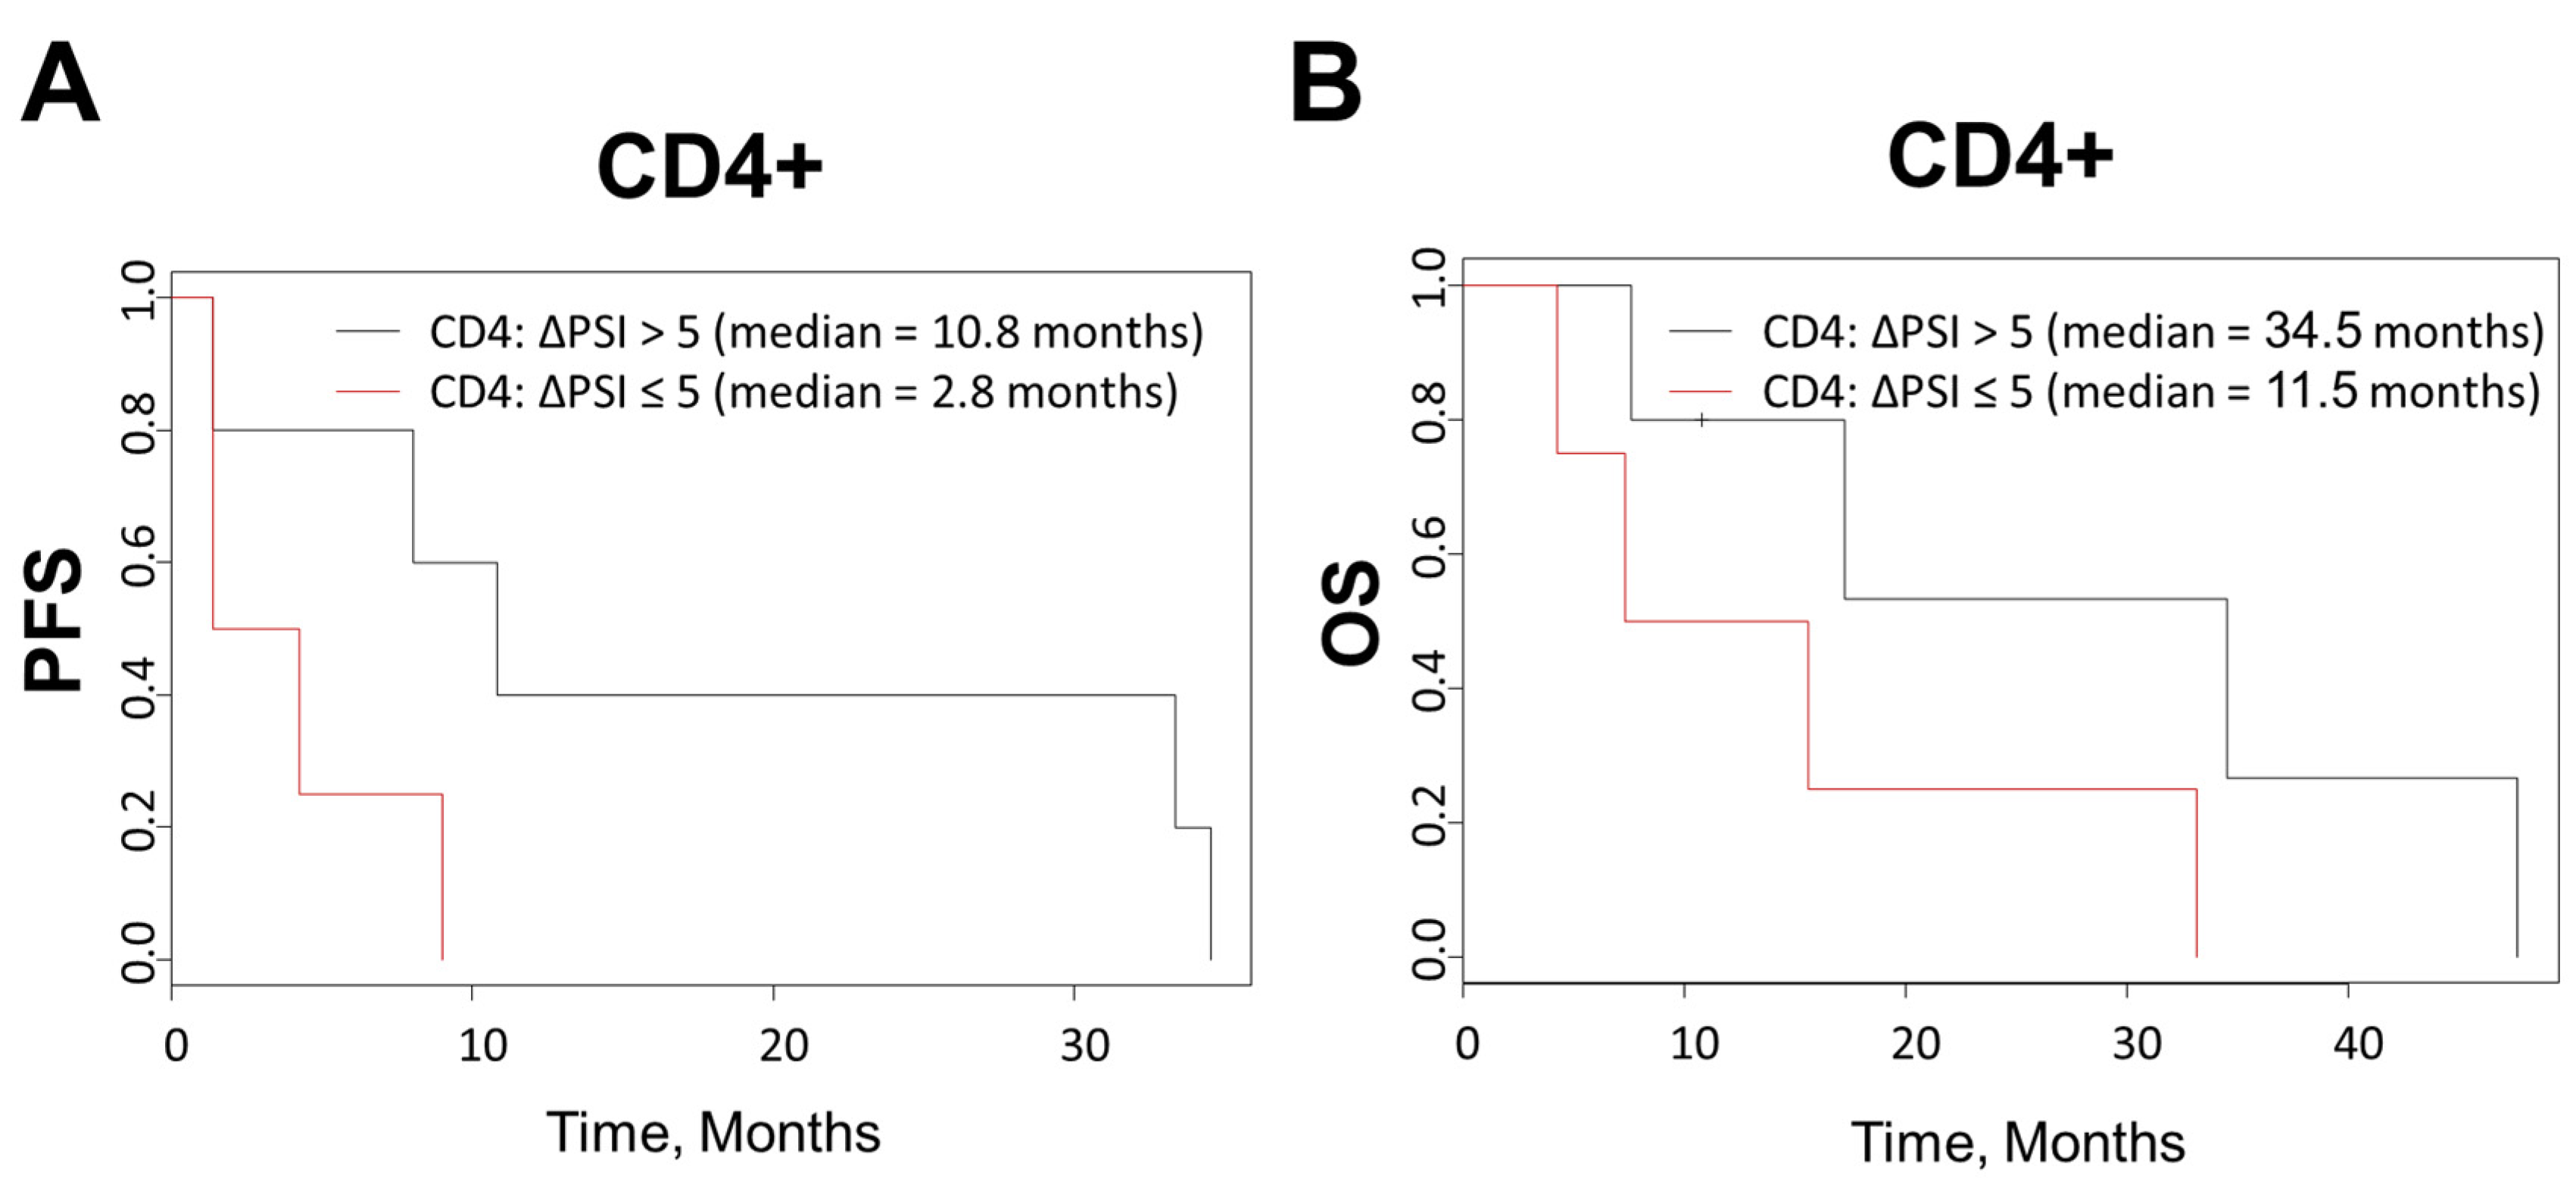

Table 1.
Demographics, clinical and molecular characteristics of study cohort subjects.
| Patient ID | Age | Sex | Histology/Genotype | TNM Stage (8th Ed.) | PD-L1 (22C3) | Tx Response (s/p 2 Cycles) | ICI Regimen |
| 0002 | 66 | M | Adenocarcinoma | IIIC (T4N3M0) |
90% | SD 1 | Durvalumab |
| 0008 | 79 | M | Adenocarcinoma, MET-amplified | IVB (T4N2M1c) | 95% | Excellent PR 2 | Pembrolizumab |
| 0010 | 68 | F | Adenocarcinoma, KRAS-G12C | IVA (T4N2M1a) |
60% | Excellent PR 2 | Carbo/Pem/Pembro 6 |
| 0021 | 71 | M | Squamous Cell | Recurrence IVA (T4N2M1a) |
5% | SD1 | Pembrolizumab |
| 0024 | 49 | F | Adenocarcinoma, EGFR-del19 (E746_A750del), T790M | IVB (T2N2M1c) |
60% | CR 3 | ABCP 7 |
| 0025 | 66 | F | Adenocarcinoma, KRAS-G12C, STK11+, TMB-High (11 muts/Mb) | Recurrence IVA (T1bN2M1b) | <1% | PD4 | Carbo/Pem/Pembro 6 |
| 0026 | 57 | F | Adenocarcinoma, EGFR-del19 (p.L747_P753 delinsS); PIK3CA-E545K | Recurrence IVA (T3N1M1a) |
50% | PD4 | ABCP 7 |
| 0028 | 78 | M | Adenocarcinoma, ALK-fusion | Recurrence IVA (TxN2M1a) |
2% | n/a (Alectinib Responder) | n/a |
| 0029 | 60 | F | Adenocarcinoma | IVA (T2aN1M1b) | 100% | PR 2 (also w/ later Dx 5 of Ovarian Ca) | Pembrolizumab |
| 0030 | 78 | F | Adenocarcinoma, KRAS-G12D; PTEN-R130G | IVB (TxN2M1c) |
<1% | Non-Responder | Carbo/Pem/Pembro 6 |
| 500-096 | 70 | F | Healthy | n/a | n/a | n/a | n/a |
| 500-103 | 53 | F | Healthy | n/a | n/a | n/a | n/a |
| 500-138 | 53 | F | Healthy | n/a | n/a | n/a | n/a |
| 500-282 | 61 | M | Healthy | n/a | n/a | n/a | n/a |
| 500-317 | 61 | M | Healthy | n/a | n/a | n/a | n/a |
| 500-673 | 62 | M | Healthy | n/a | n/a | n/a | n/a |
| 500-887 | 61 | F | Healthy | n/a | n/a | n/a | n/a |
| 500-915 | 58 | F | Healthy | n/a | n/a | n/a | n/a |
| 500-933 | 61 | M | Healthy | n/a | n/a | n/a | n/a |
| 500-996 | 56 | F | Healthy | n/a | n/a | n/a | n/a |
1 SD, stable disease; 2 PR, partial response; 3 CR, complete response; 4 PD, progressive disease; 5 Dx, diagnosis; n/a, not applicable; 6 Carbo/Pem/Pembro, carboplatin, pemetrexed, pembrolizumab treatment regimen; 7 ABCP, atezolizumab, bevacizumab, carboplatin, paclitaxel treatment regimen.
Disclaimer/Publisher’s Note: The statements, opinions and data contained in all publications are solely those of the individual author(s) and contributor(s) and not of MDPI and/or the editor(s). MDPI and/or the editor(s) disclaim responsibility for any injury to people or property resulting from any ideas, methods, instructions or products referred to in the content. |
© 2024 by the authors. Licensee MDPI, Basel, Switzerland. This article is an open access article distributed under the terms and conditions of the Creative Commons Attribution (CC BY) license (http://creativecommons.org/licenses/by/4.0/).
Copyright: This open access article is published under a Creative Commons CC BY 4.0 license, which permit the free download, distribution, and reuse, provided that the author and preprint are cited in any reuse.


