Submitted:
03 March 2024
Posted:
04 March 2024
You are already at the latest version
Abstract
Keywords:
1. Introduction
2. Resources and Methods
2.1. The Study Area
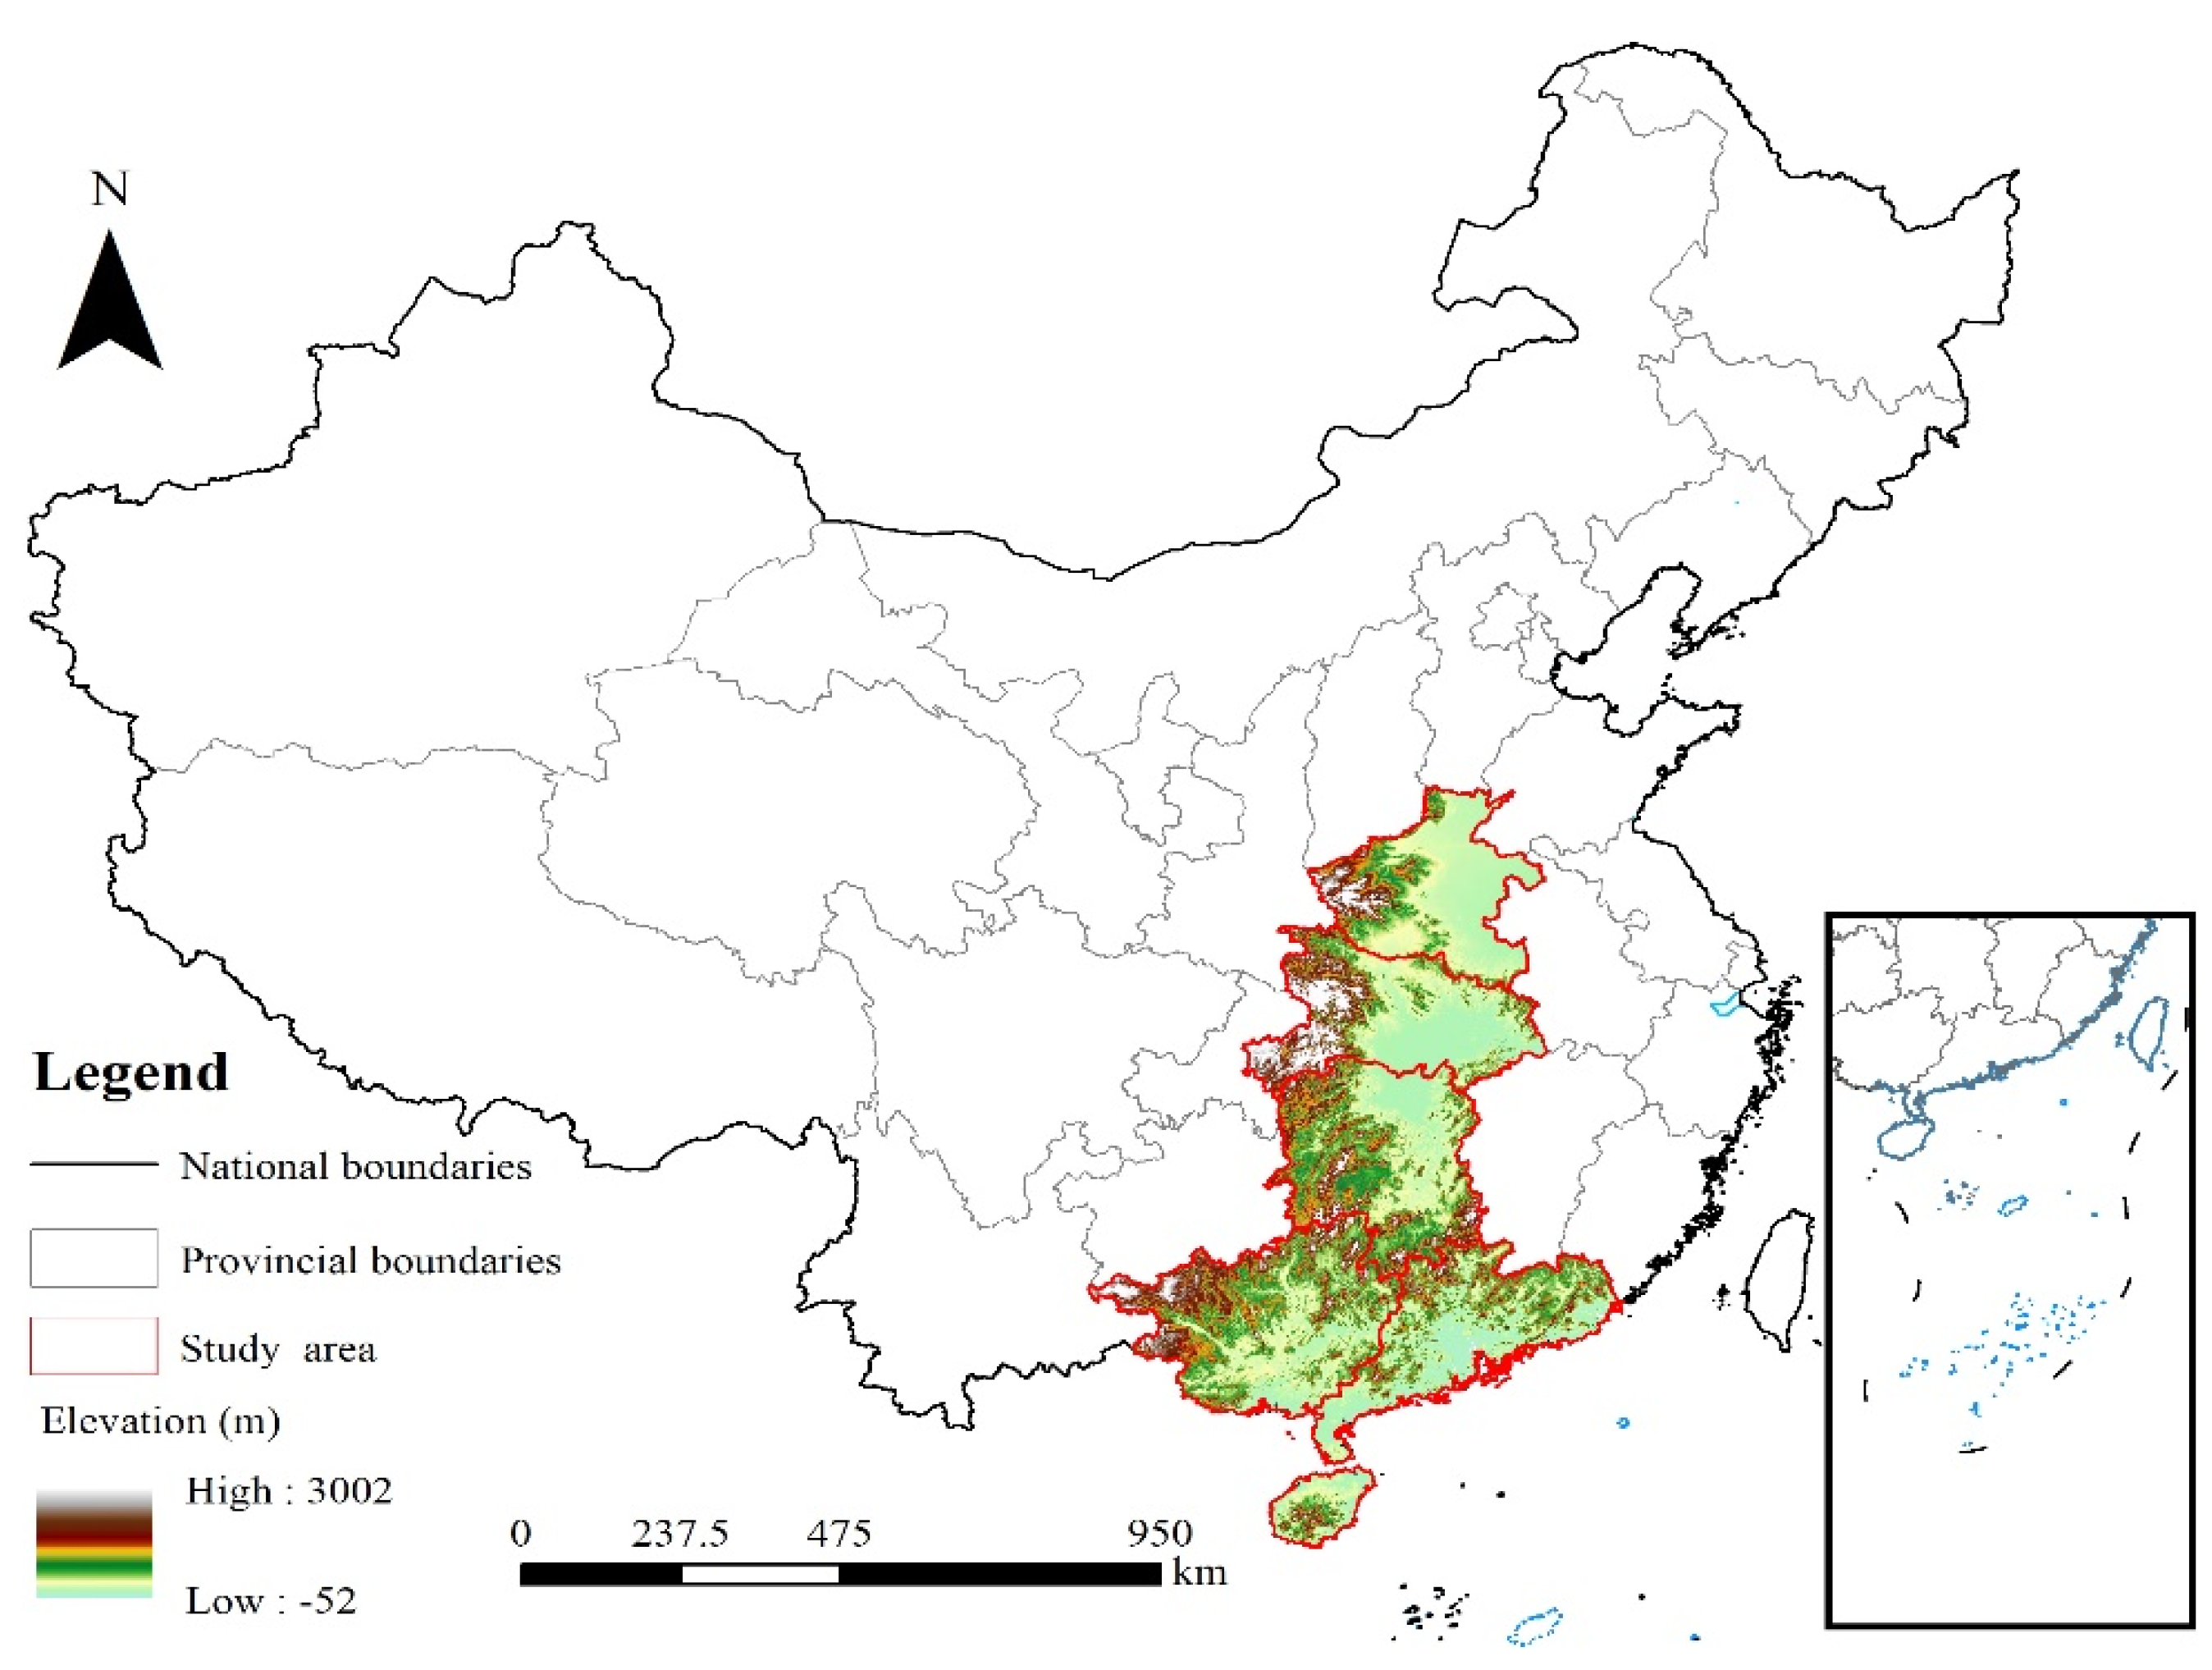
2.2. Data Sources
2.3. Method
2.3.1. Kernel Density Estimation
2.3.2. Spatial Autocorrelation Analysis
2.3.3. Standard Deviation Ellipse
2.3.4. Light Gradient Boosting Model
2.3.5. Evaluation Indicators
3. Results
3.1. Forest Fire Kernel Density Analysis in the Central and Southern Regions
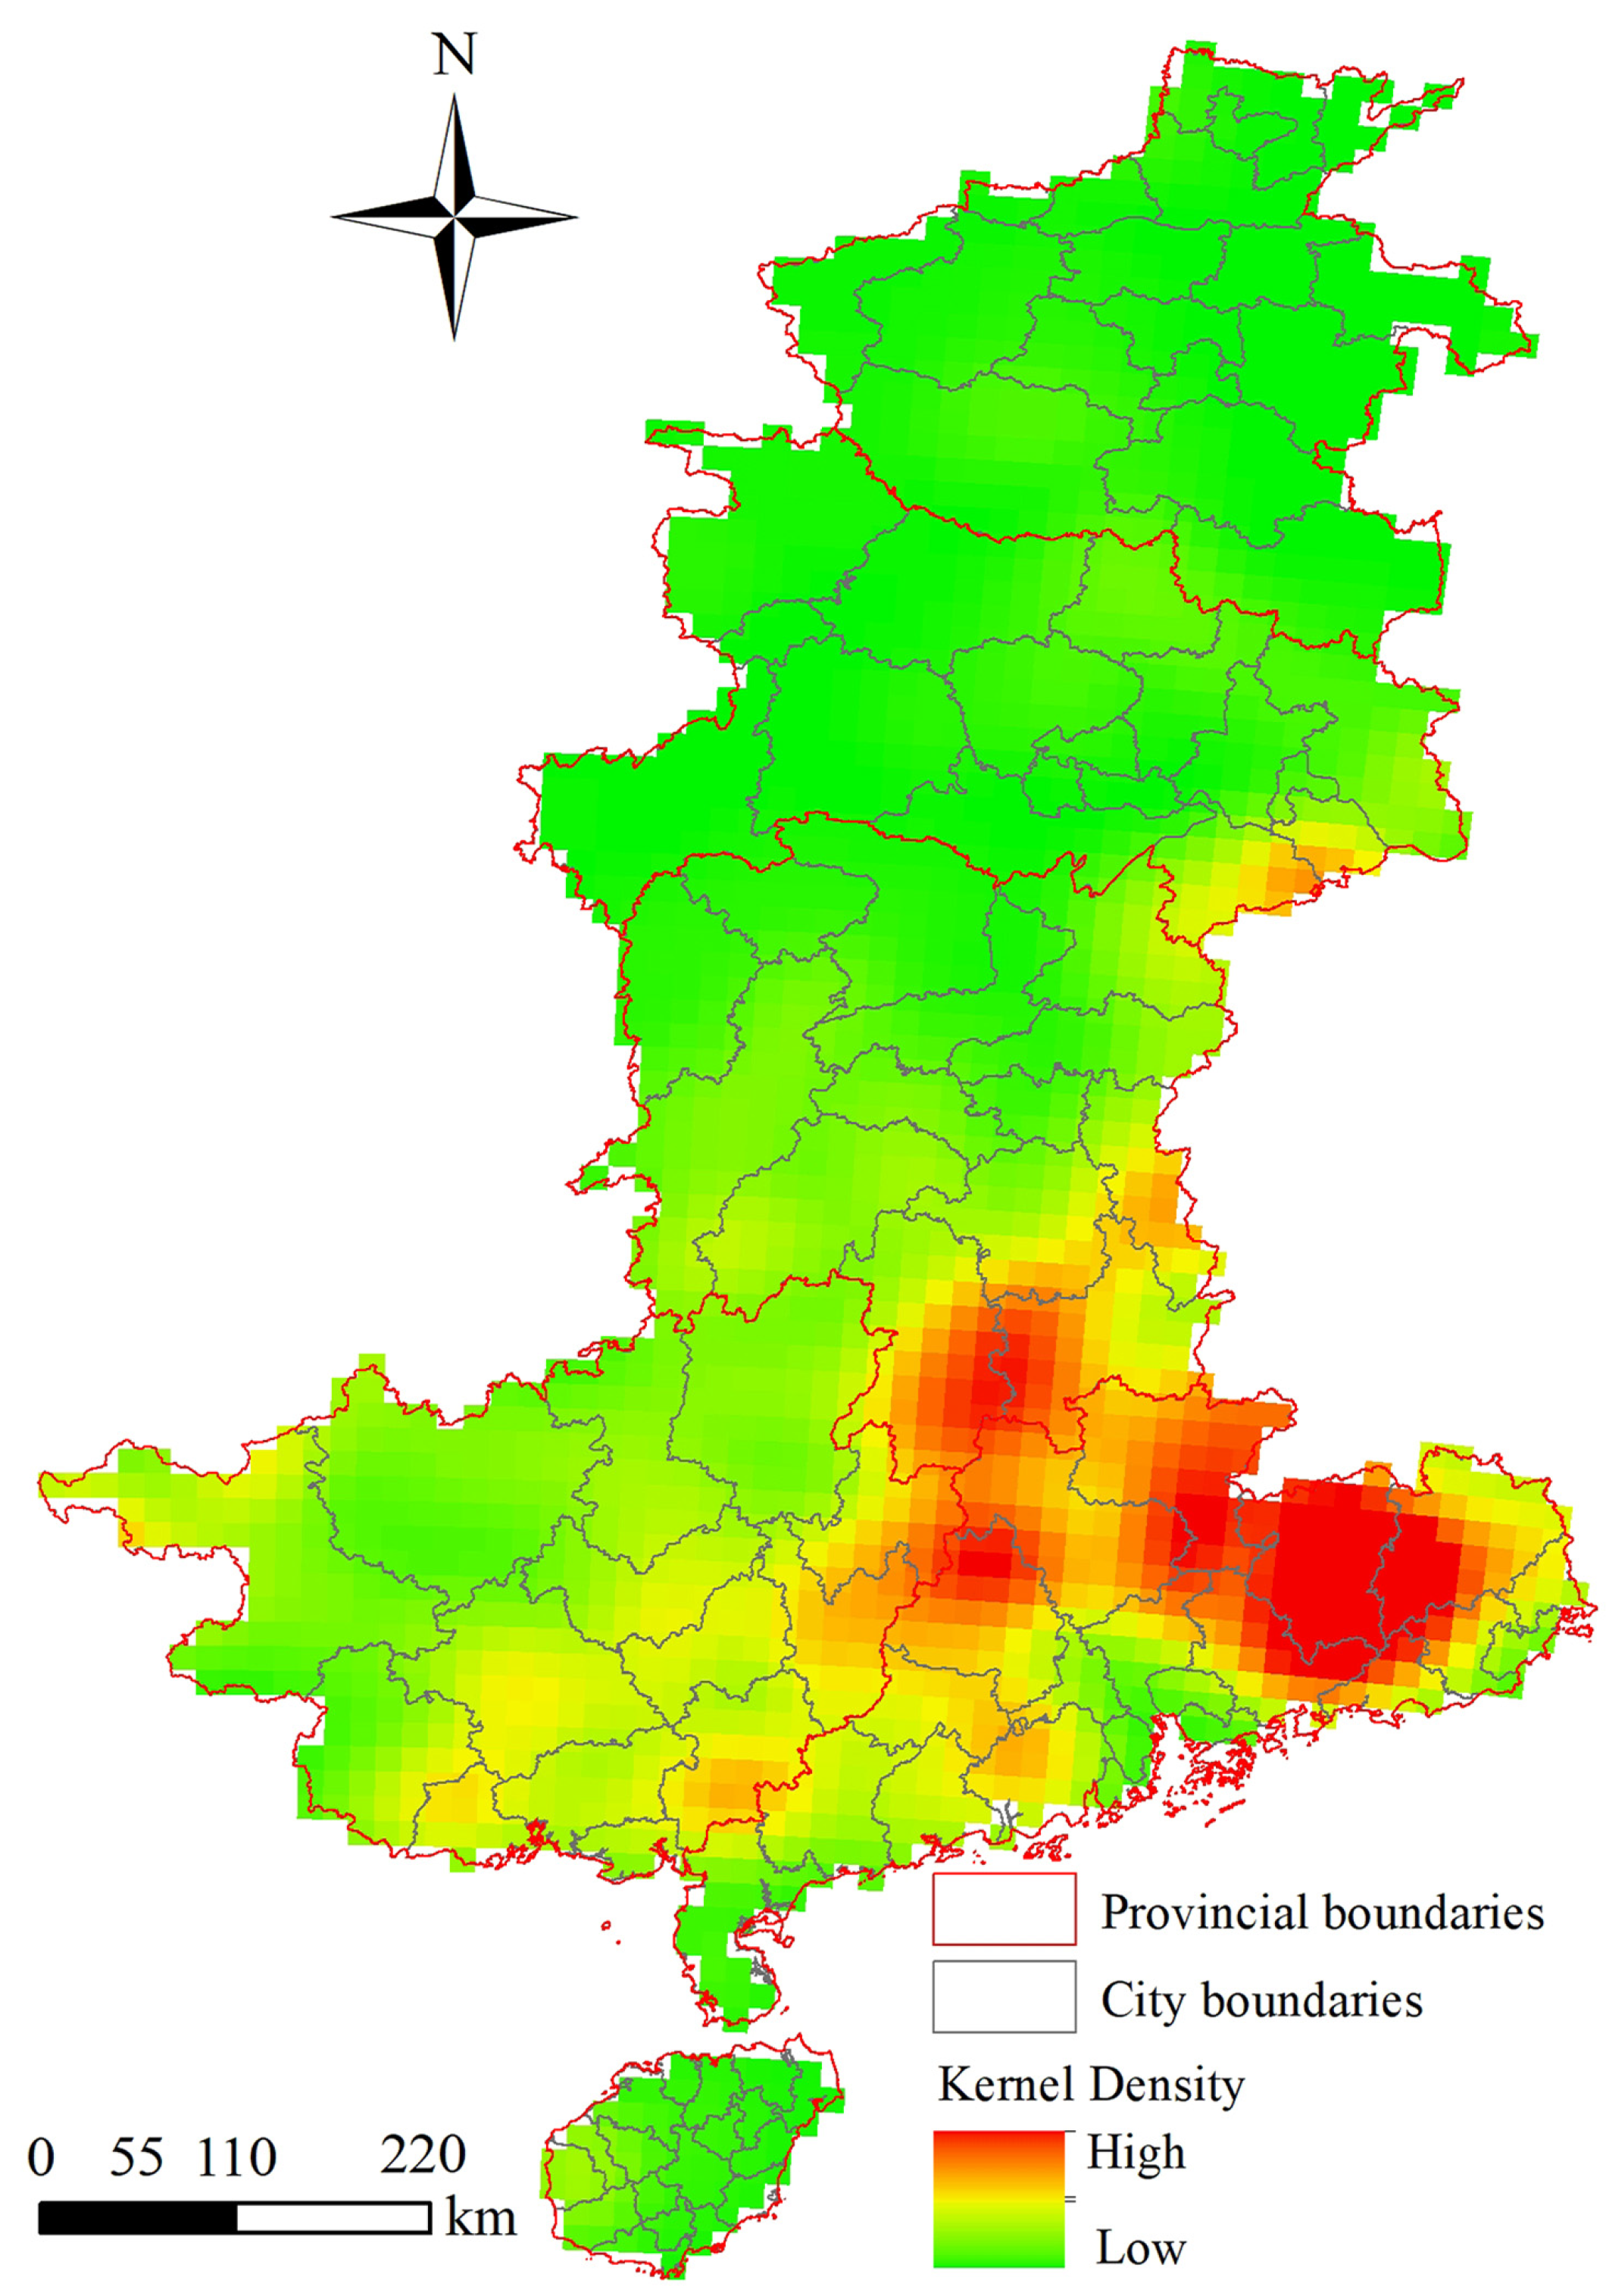
3.2. Results of Autocorrelation Analysis on Forest Fire Occurrences in Central and Southern China region
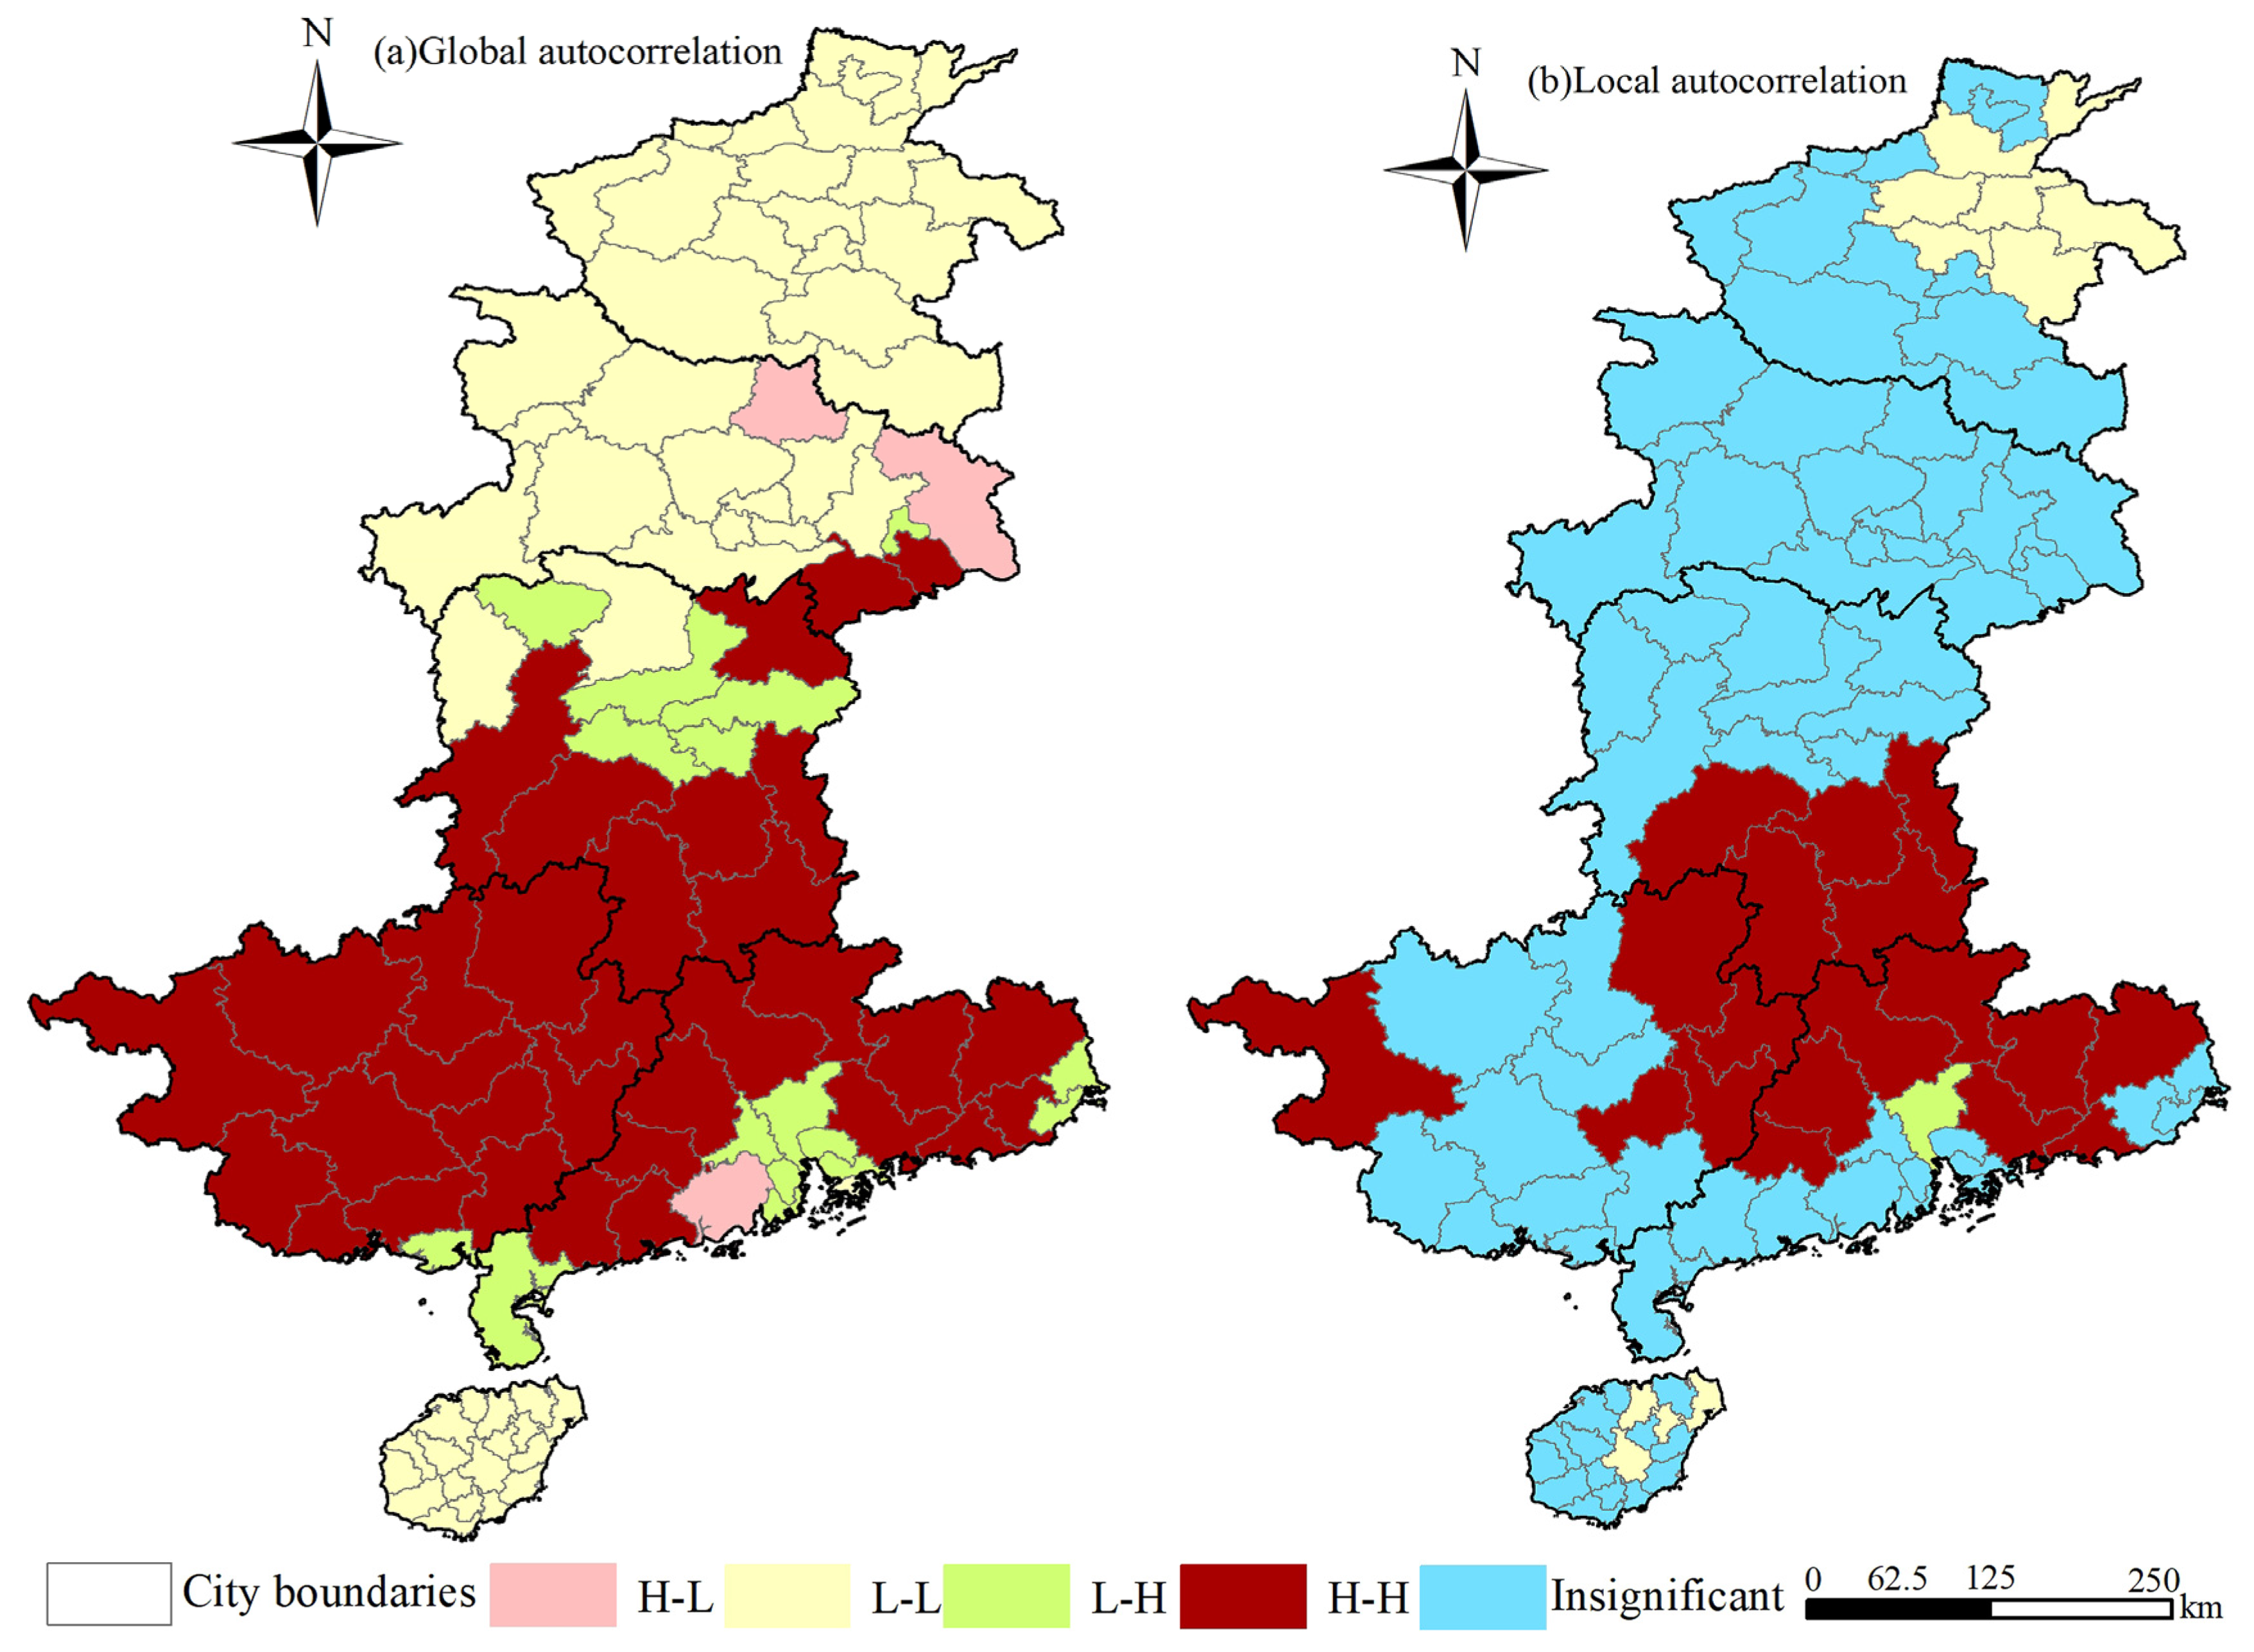
3.3. The Results of Standard Deviation Ellipse for the forest fires
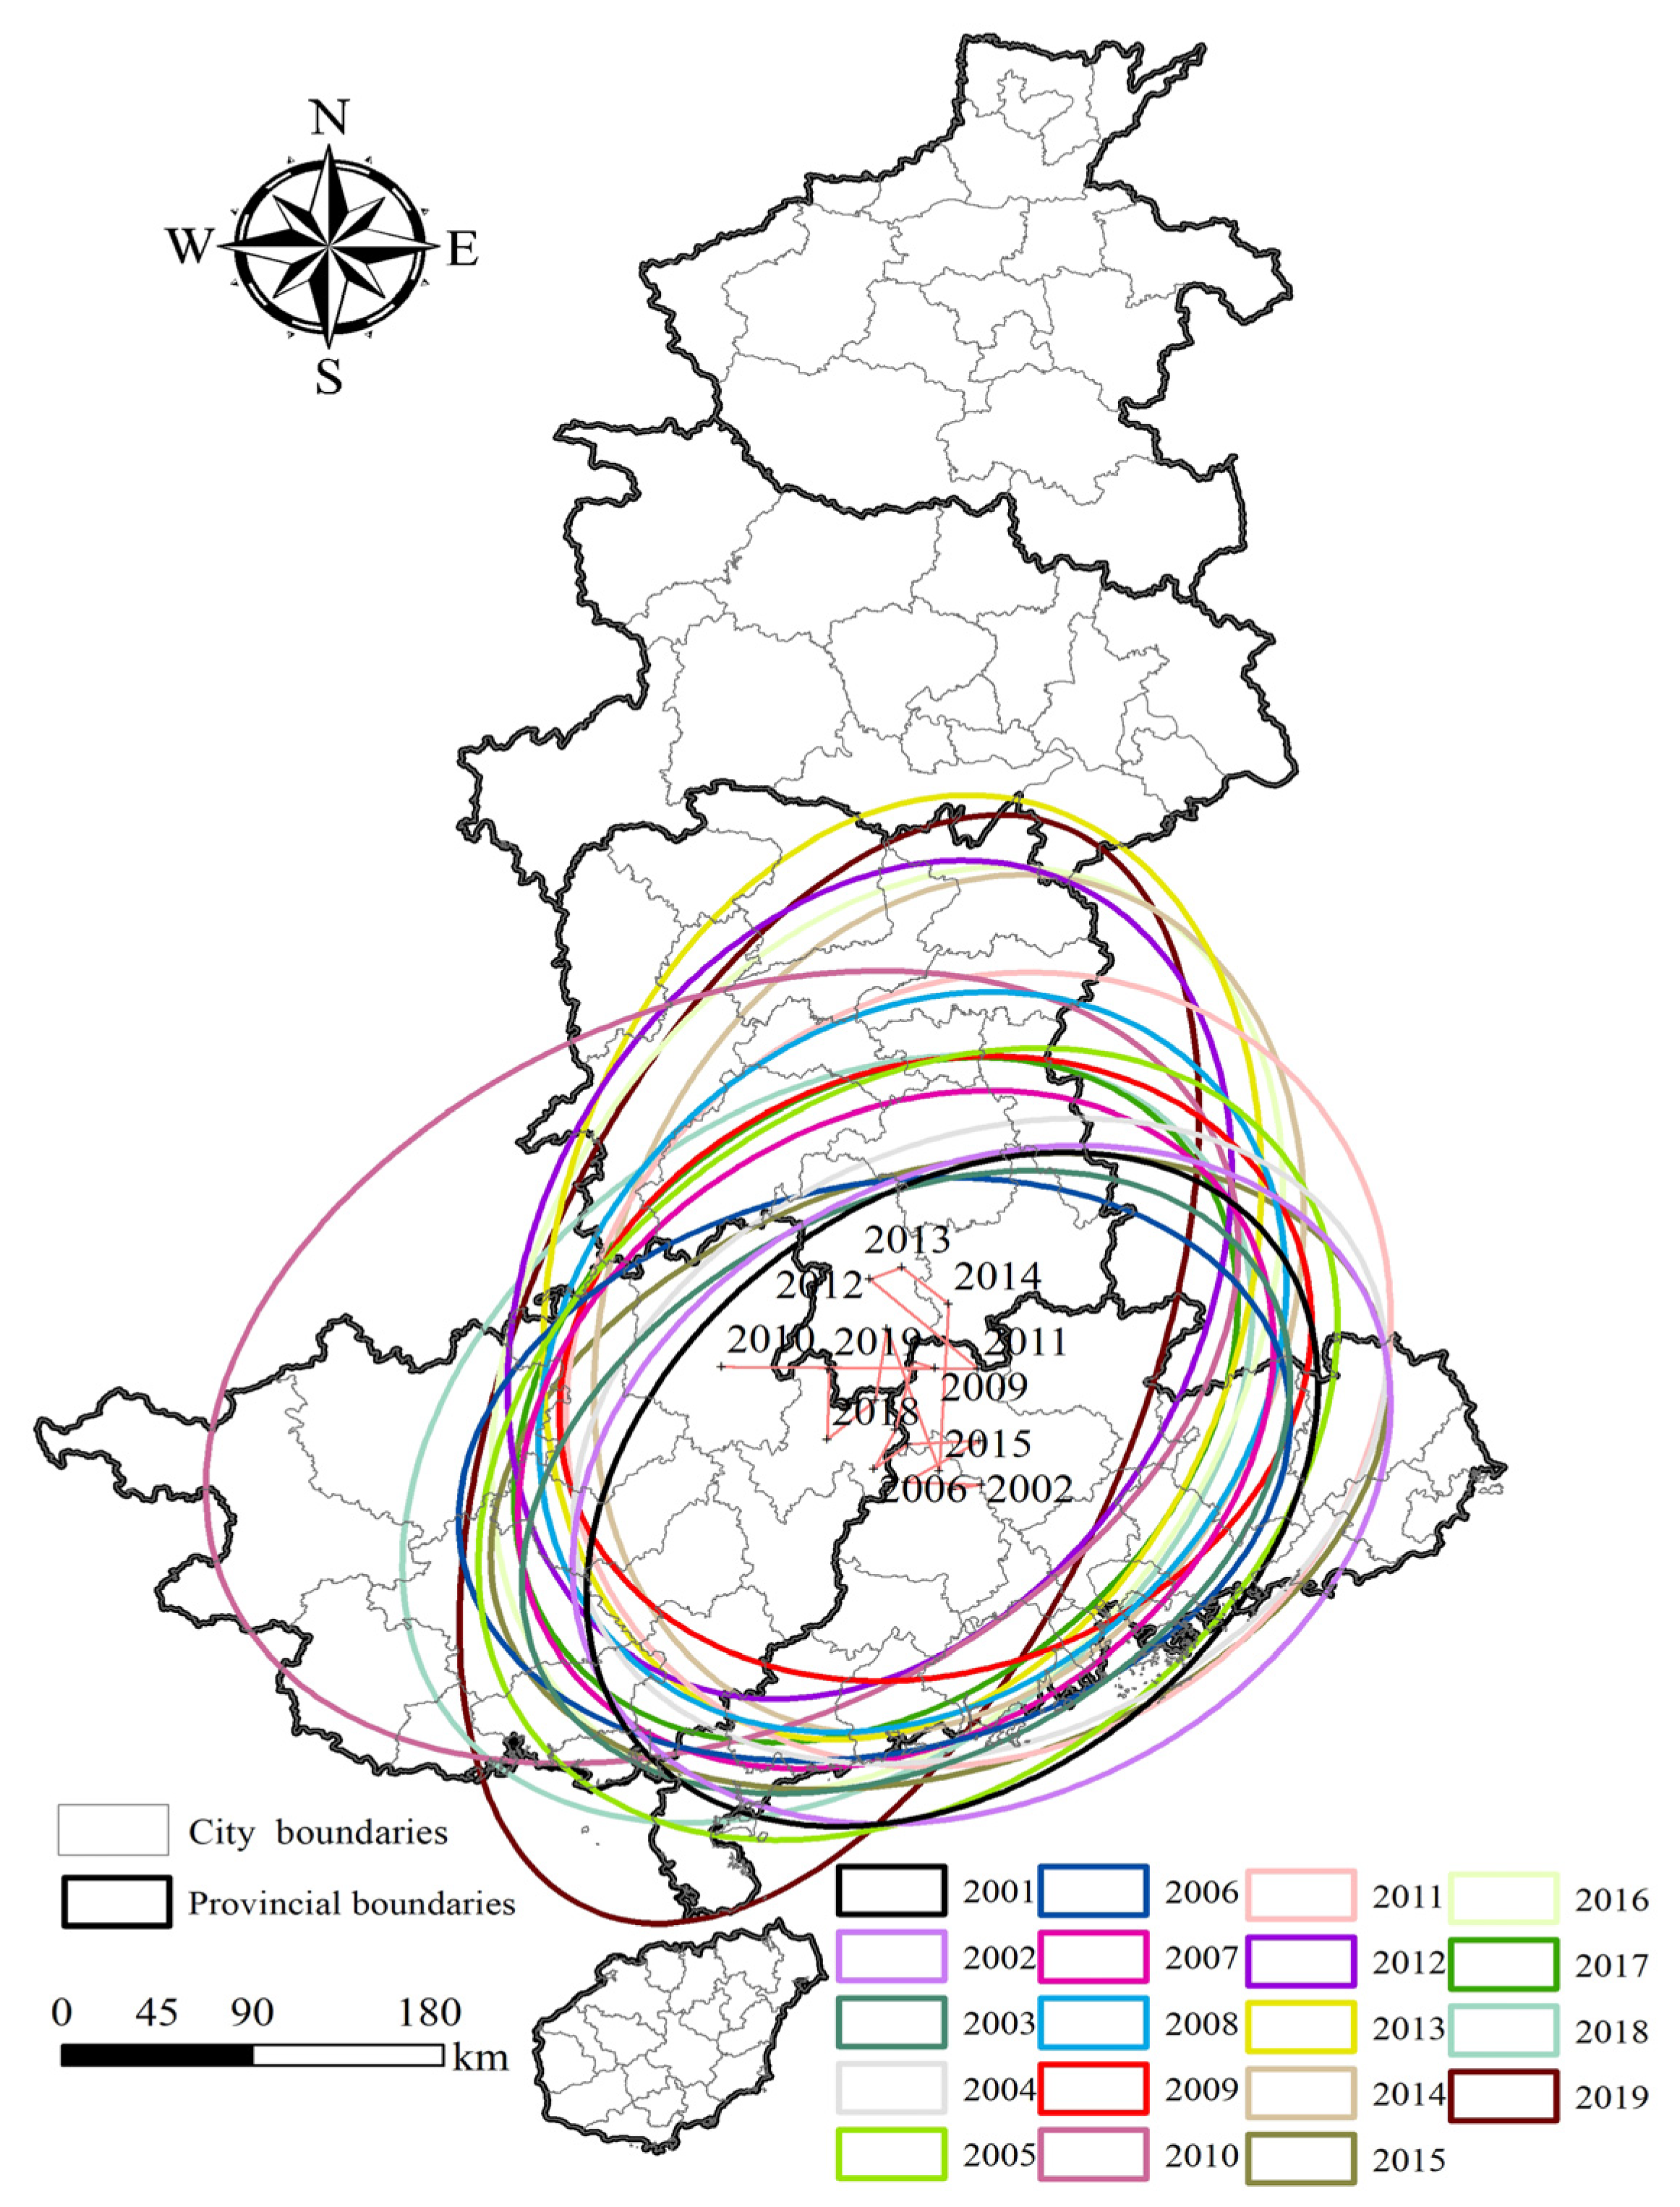
3.4. Evaluation of Forecast Precision for Forest Fires in Southern China
3.5. Predicting Monthly Forest Fires in the Central and Southern Regions of China
4. Discussion and Conclusions
4.1. Discussion
4.2. Conclusions
Author Contributions
Funding
Data Availability Statement
Acknowledgments
Conflicts of Interest
References
- Baldocchi, D.; Penuelas, J. The physics and ecology of mining carbon dioxide from the atmosphere by ecosystems. Global Change Biology 2019, 254, 1191–1197. [Google Scholar] [CrossRef]
- Malhi, Y.; Meir, P.; Brown, S. Forests, carbon and global climate. Philosophical Transactions of the Royal Society of London. Series A: Mathematical, Physical Engineering Sciences 2002, 360, 1567–1591. [Google Scholar] [CrossRef]
- Pawłowski, A.; Pawłowska, M.; Pawłowski, L. Mitigation of greenhouse gases emissions by management of terrestrial ecosystem. Ecological Chemistry Engineering 2017, 242, 213–221. [Google Scholar] [CrossRef]
- Keleş, S. An assessment of hydrological functions of forest ecosystems to support sustainable forest management. Journal of Sustainable Forestry 2019, 384, 305–326. [Google Scholar] [CrossRef]
- Ellison, D.; Morris, C.E.; Locatelli, B.; Sheil, D.; Cohen, J.; Murdiyarso, D.; Gutierrez, V.; Van Noordwijk, M.; Creed, I.F.; Pokorny, J. Trees, forests and water: Cool insights for a hot world. Global environmental change 2017, 43, 51–61. [Google Scholar] [CrossRef]
- Ritter, E.; Dauksta, D. Human–forest relationships: ancient values in modern perspectives. Environment, development sustainability 2013, 15, 645–662. [Google Scholar] [CrossRef]
- Melese, S.M. Importance of non-timber forest production in sustainable forest management, and its implication on carbon storage and biodiversity conservation in Ethiopia. International Journal of Biodiversity Conservatio 2016, 811, 269–277. [Google Scholar]
- Ramachandra, T.; Soman, D.; Naik, A. D.; Chandran, M. S. Appraisal of forest ecosystems goods and services: Challenges and opportunities for conservation. Journal of Biodiversity 2017, 81, 12–33. [Google Scholar] [CrossRef]
- Dhar, T.; Bhatta, B.; Aravindan, S. Forest fire occurrence, distribution and risk mapping using geoinformation technology: A case study in the sub-tropical forest of the Meghalaya, India. Remote Sensing Applications: Society Environment 2023, 29, 100883. [Google Scholar] [CrossRef]
- Shao, Y.; Fan, G.; Feng, Z.; Sun, L.; Yang, X.; Ma, T.; Li, X.; Fu, H.; Wang, A. Prediction of forest fire occurrence in China under climate change scenarios. Journal of Forestry Research 2023, 1–12. [Google Scholar] [CrossRef]
- Wu, Z.; He, H. S.; Keane, R. E.; Zhu, Z.; Wang, Y.; Shan, Y. Current and future patterns of forest fire occurrence in China. International journal of wildland fire 2019, 292, 104–119. [Google Scholar] [CrossRef]
- Zigner, K.; Carvalho, L.; Peterson, S.; Fujioka, F.; Duine, G.; Jones, C.; Roberts, D.; Moritz, M. Evaluating the ability of FARSITE to simulate wildfires influenced by extreme, downslope winds in Santa Barbara, California. Fire 2020. [Google Scholar] [CrossRef]
- Dong, X.-m.; Li, Y.; Pan, Y.-l.; Huang, Y.-j.; Cheng, X.-d. Study on urban fire station planning based on fire risk assessment and GIS technology. Procedia engineering 2018, 211, 124–130. [Google Scholar] [CrossRef]
- Zhou, T.; Ding, L.; Ji, J.; Yu, L.; Wang, Z. Combined estimation of fire perimeters and fuel adjustment factors in FARSITE for forecasting wildland fire propagation. Fire safety journal 2020, 116, 103167. [Google Scholar] [CrossRef]
- Phelps, N.; Woolford, D. G. Guidelines for effective evaluation and comparison of wildland fire occurrence prediction models. International journal of wildland fire 2021, 304, 225–240. [Google Scholar] [CrossRef]
- Su, Z.; Zeng, A.; Cai, Q.; Hu, H. Study on prediction model and driving factors of forest fire in Da Hinggan Mountains using Gompit regression method. Journal of Forestry Engineering 2019, 44, 135–142. [Google Scholar]
- D’este, M.; Ganga, A.; Elia, M.; Lovreglio, R.; Giannico, V.; Spano, G.; Colangelo, G.; Lafortezza, R.; Sanesi, G. Modeling fire ignition probability and frequency using Hurdle models: A cross-regional study in Southern Europe. Ecological Processes 2020, 91, 1–14. [Google Scholar] [CrossRef]
- Boubeta, M.; Lombardía, M. J.; Marey-Pérez, M.; Morales, D. Poisson mixed models for predicting number of fires. International journal of wildland fire 2019, 283, 237–253. [Google Scholar] [CrossRef]
- Shao, Y.; Wang, Z.; Feng, Z.; Sun, L.; Yang, X.; Zheng, J.; Ma, T. Assessment of China’s forest fire occurrence with deep learning, geographic information and multisource data. Journal of Forestry Research 2023, 344, 963–976. [Google Scholar] [CrossRef]
- Arif, M.; Alghamdi, K.; Sahel, S.; Alosaimi, S.; Alsahaft, M.; Alharthi, M.; Arif, M. Role of machine learning algorithms in forest fire management: A literature review. Robot. Autom 2021, 5, 212–226. [Google Scholar]
- Mohajane, M.; Costache, R.; Karimi, F.; Pham, Q. B.; Essahlaoui, A.; Nguyen, H.; Laneve, G.; Oudija, F. Application of remote sensing and machine learning algorithms for forest fire mapping in a Mediterranean area. Ecological Indicators 2021, 129, 107869. [Google Scholar] [CrossRef]
- Eslami, R.; Azarnoush, M.; Kialashki, A.; Kazemzadeh, F. GIS-based forest fire susceptibility assessment by random forest, artificial neural network and logistic regression methods. Journal of Tropical Forest Science 2021, 332, 173–184. [Google Scholar] [CrossRef]
- Tang, X.; Machimura, T.; Li, J.; Liu, W.; Hong, H. A novel optimized repeatedly random undersampling for selecting negative samples: A case study in an SVM-based forest fire susceptibility assessment. Journal of Environmental Management 2020, 271, 111014. [Google Scholar] [CrossRef] [PubMed]
- Wang, Y.; Wang, T. Application of improved LightGBM model in blood glucose prediction. Applied Sciences 2020, 109, 3227. [Google Scholar] [CrossRef]
- Ju, Y.; Sun, G.; Chen, Q.; Zhang, M.; Zhu, H.; Rehman, M. U. A model combining convolutional neural network and LightGBM algorithm for ultra-short-term wind power forecasting. Ieee Access 2019, 7, 28309–28318. [Google Scholar] [CrossRef]
- Wang, Z.; Wang, K.; Li, Y.; Li, G. Research on forest fire prediction in Yunnan province based on LightGBM and SHAP. Fire Science and Technology 2023, 4211, 1567–1571. [Google Scholar]
- Tian, L.; Feng, L.; Yang, L.; Guo, Y. Stock price prediction based on LSTM and LightGBM hybrid model. The Journal of Supercomputing 2022, 789, 11768–11793. [Google Scholar] [CrossRef]
- Yang, H.; Chen, Z.; Yang, H.; Tian, M. Predicting Coronary Heart Disease Using an Improved LightGBM Model: Performance Analysis and Comparison. IEEE Access 2023, 11, 23366–23380. [Google Scholar] [CrossRef]
- Wang, H. GDP of 31 provinces in the first half of the year: Guangdong pulls ahead, Anhui continues to overtake Shanghai. China Economic Weekly (newspaper) 2021, 15, 54–57. [Google Scholar]
- Ciesielski, M.; Balazy, R.; Borkowski, B.; Szczesny, W.; Zasada, M.; Kaczmarowski, J.; Kwiatkowski, M.; Szczygiel, R.; Milanovic, S. Contribution of anthropogenic, vegetation, and topographic features to forest fire occurrence in Poland. iForest-Biogeosciences Forestry 2022, 15, 307. [Google Scholar] [CrossRef]
- Flannigan, M. D.; Amiro, B. D.; Logan, K. A.; Stocks, B. J.; Wotton, B. M. Forest fires and climate change in the 21 st century. Mitigation adaptation strategies for global change 2006, 11, 847–859. [Google Scholar] [CrossRef]
- De Rigo, D.; Libertà, G.; Durrant, T. H.; Vivancos, T. A.; San-Miguel-Ayanz, J. Forest fire danger extremes in Europe under climate change: variability and uncertainty; Publications Office of the European Union, 2017. [Google Scholar]
- Tian, X.-r.; Shu, L.-f.; Zhao, F.-j.; Wang, M.-y.; Mcrae, D. Future impacts of climate change on forest fire danger in northeastern China. Journal of Forestry Research 2011, 223, 437–446. [Google Scholar] [CrossRef]
- Chéret, V.; Denux, J.-P. Analysis of MODIS NDVI time series to calculate indicators of Mediterranean forest fire susceptibility. GIScience Remote Sensing 2011, 482, 171–194. [Google Scholar] [CrossRef]
- Hardy, C. C.; Burgan, R. E. Evaluation of NDVI for monitoring live moisture in three vegetation types of the western US. Photogrammetric Engineering Remote Sensing 1999, 65, 603–610. [Google Scholar]
- Laschi, A.; Foderi, C.; Fabiano, F.; Neri, F.; Cambi, M.; Mariotti, B.; Marchi, E. Forest road planning, construction and maintenance to improve forest fire fighting: a review. Croatian Journal of Forest Engineering: Journal for Theory Application of Forestry Engineering 2019, 40, 207–219. [Google Scholar]
- Kim, S. J.; Lim, C.-H.; Kim, G. S.; Lee, J.; Geiger, T.; Rahmati, O.; Son, Y.; Lee, W.-K. Multi-temporal analysis of forest fire probability using socio-economic and environmental variables. Remote Sensing 2019, 111, 86. [Google Scholar] [CrossRef]
- Liu, M.; Jiang, B.; Zhao, Z. Study on the layout method of coal mine ventilation monitoring points under linear constrained kernel density. Science of Surveying and Mapping 2023, 48, 63-71+93. [Google Scholar]
- Jiang, H.; Li, C.; Feng, M.; Luo, M.; Ma, X. Analysis on probabilistic seismic damage characteristics of dry joint prefabricated bridge pier based on kernel density estimation. Journal of Southeast University (Natural Science Edition) 2021, 51, 566–574. [Google Scholar]
- Zhou, Q. Spatial Patterns and Drivers of Forest Fire Occurrence in the Daxing’an Mountains of Inner Mongolia. 2023.
- Zhang, W.; Wang, J.; Wang, Q.; Zhang, X.; Cao, H.; Long, T. Analyses on spatial and temporal characteristies of forest fires in YunnanProvince based on MODIS from 2001 to 2020. Journal of Nanjing Forestry University( Natural Sciences Edition) 2023, 47, 73–79. [Google Scholar]
- Getis, A. A history of the concept of spatial autocorrelation: A geographer’s perspective. Geographical analysis 2008, 403, 297–309. [Google Scholar] [CrossRef]
- Lv, M.; Zhang, H.; He, G.; Zhang, X.; Liu, Y. Dynamic evolution and driving factors of water conservation service function in the Yellow River Basin. ACTA ECOLOGICA SINICA 2024, 07, 1–11. [Google Scholar]
- Gou, A.; Li, W.; Wang, J. Spatiotemporal Correlation Between Green Space Landscape Pattern and PM2.5 Concentration in Chongqing City, China. Journal of Earth Sciences and Environment 2024, 46, 25–37. [Google Scholar]
- Yu, W.; Chen, Y.; Fang, F.; Zhang, J.; Li, Z.; Zhao, L. An analysis of grassland spatial distribution and driving forces of patterns of change in grassland distribution in Guizhou Province from 1980 to 2020. ACTA PRATACULTURAE SINICA 2024, 3301, 1–18. [Google Scholar]
- Sun, Y.; Xu, M.; Wang, X. Spatial-temporal Evolution of Carbon Storage and Spatial Autocorrelation Analysis in Zhengzhou City Based on InVEST-PLUS Model. Bulletin of Soil and Water Conservation 2023, 4305, 374–384. [Google Scholar]
- Moore, T. W.; Mcguire, M. P. Using the standard deviational ellipse to document changes to the spatial dispersion of seasonal tornado activity in the United States. NPJ Climate Atmospheric Science 2019, 21, 21. [Google Scholar] [CrossRef]
- Cheng, Y.; Yang, L. Spatial evolution and differences in driving factors of China’s tourism dual circulation market efficiency. Arid Land Geography 2024, 1–12. [Google Scholar]
- Hu, J.; Yu, J.; Zhang, C. A study on the spatial distribution of China’s aid to Africa based on Standard Deviational Ellipse. World Regional Studies 2024, 1–13. [Google Scholar]
- Li, Y.; Peng, S. Characterisation of industrial agglomeration in the Yangtze River Delta region based on standard deviation ellipses. Statistics and Decision 2024, 4001, 136–141. [Google Scholar]
- Cheng, Y.; Yang, L. Spatial evolution and differences in driving factors of China’s tourism dual circulation market efficiency. Arid Land Geography 2024, 1–12. [Google Scholar]
- Fan, J.; Ma, X.; Wu, L.; Zhang, F.; Yu, X.; Zeng, W. Light Gradient Boosting Machine: An efficient soft computing model for estimating daily reference evapotranspiration with local and external meteorological data. Agricultural water management 2019, 225, 105758. [Google Scholar] [CrossRef]
- Xu, K.; Han, Z.; Xu, H.; Bin, L. Rapid prediction model for urban floods based on a light gradient boosting machine approach and hydrological–hydraulic model. International Journal of Disaster Risk Science 2023, 141, 79–97. [Google Scholar] [CrossRef]
- Guo, J.; Yun, S.; Meng, Y.; He, N.; Ye, D.; Zhao, Z.; Jia, L.; Yang, L. Prediction of heating and cooling loads based on light gradient boosting machine algorithms. Building Environment 2023, 236, 110252. [Google Scholar] [CrossRef]
- Chen, T.; Xu, J.; Ying, H.; Chen, X.; Feng, R.; Fang, X.; Gao, H.; Wu, J. Prediction of extubation failure for intensive care unit patients using light gradient boosting machine. IEEE Access 2019, 7, 150960–150968. [Google Scholar] [CrossRef]
- Cui, Z.; Qing, X.; Chai, H.; Yang, S.; Zhu, Y.; Wang, F. Real-time rainfall-runoff prediction using light gradient boosting machine coupled with singular spectrum analysis. Journal of Hydrology 2021, 603, 127124. [Google Scholar] [CrossRef]
- He, R.; Lu, H.; Jin, Z.; Qin, Y.; Yang, H.; Liu, Z.; Yang, G.; Xu, J.; Gong, X.; Zhang, Q. Construction of forest fire prediction model and driving factors analysis based on random forests algorithm in Southwest China. Acta Ecol. Sin 2023, 4322, 9356–9370. [Google Scholar]
- Yuan, J.; Cao, J.; He, S.; Hu, J. The Design and Research of Air-space-ground Forest Fire Monitoring and Warning System. CHINA EMERGENCY RESCUE 2023, 6, 32-35+53. [Google Scholar]
- Farfán, M.; Dominguez, C.; Espinoza, A.; Jaramillo, A.; Alcántara, C.; Maldonado, V.; Tovar, I.; Flamenco, A. Forest fire probability under ENSO conditions in a semi-arid region: a case study in Guanajuato. Environmental monitoring assessment 2021, 19310, 684. [Google Scholar] [CrossRef]
- Bai, M.; Wang, X.; Yao, Q.; Fang, K. ENSO modulates interaction between forest insect and fire disturbances in China. Natural Hazards Research 2022, 22, 138–146. [Google Scholar] [CrossRef]
- Cordero, R. R.; Feron, S.; Damiani, A.; Carrasco, J.; Karas, C.; Wang, C.; Kraamwinkel, C. T.; Beaulieu, A. Extreme fire weather in Chile driven by climate change and El Niño–Southern Oscillation (ENSO). Scientific reports 2024, 141, 1974. [Google Scholar] [CrossRef] [PubMed]
- Oliva, P.; Schroeder, W. Assessment of VIIRS 375 m active fire detection product for direct burned area mapping. Remote Sensing of Environment 2015, 160, 144–155. [Google Scholar] [CrossRef]
- Veraverbeke, S.; Rogers, B. M.; Goulden, M. L.; Jandt, R. R.; Miller, C. E.; Wiggins, E. B.; Randerson, J. T. Lightning as a major driver of recent large fire years in North American boreal forests. Nature Climate Change 2017, 77, 529–534. [Google Scholar] [CrossRef]
- Krider, E.; Noggle, R.; Pifer, A.; Vance, D. Lightning direction-finding systems for forest fire detection. Bulletin of the American Meteorological Society 1980, 619, 980–986. [Google Scholar] [CrossRef]
- Arndt, N.; Vacik, H.; Koch, V.; Arpaci, A.; Gossow, H. Modeling human-caused forest fire ignition for assessing forest fire danger in Austria. iForest-Biogeosciences Forestry 2013, 6, 315. [Google Scholar] [CrossRef]
- Xiong, Q.; Luo, X.; Liang, P.; Xiao, Y.; Xiao, Q.; Sun, H.; Pan, K.; Wang, L.; Li, L.; Pang, X. Fire from policy, human interventions, or biophysical factors? Temporal–spatial patterns of forest fire in southwestern China. Forest Ecology Management 2020, 474, 118381. [Google Scholar] [CrossRef]
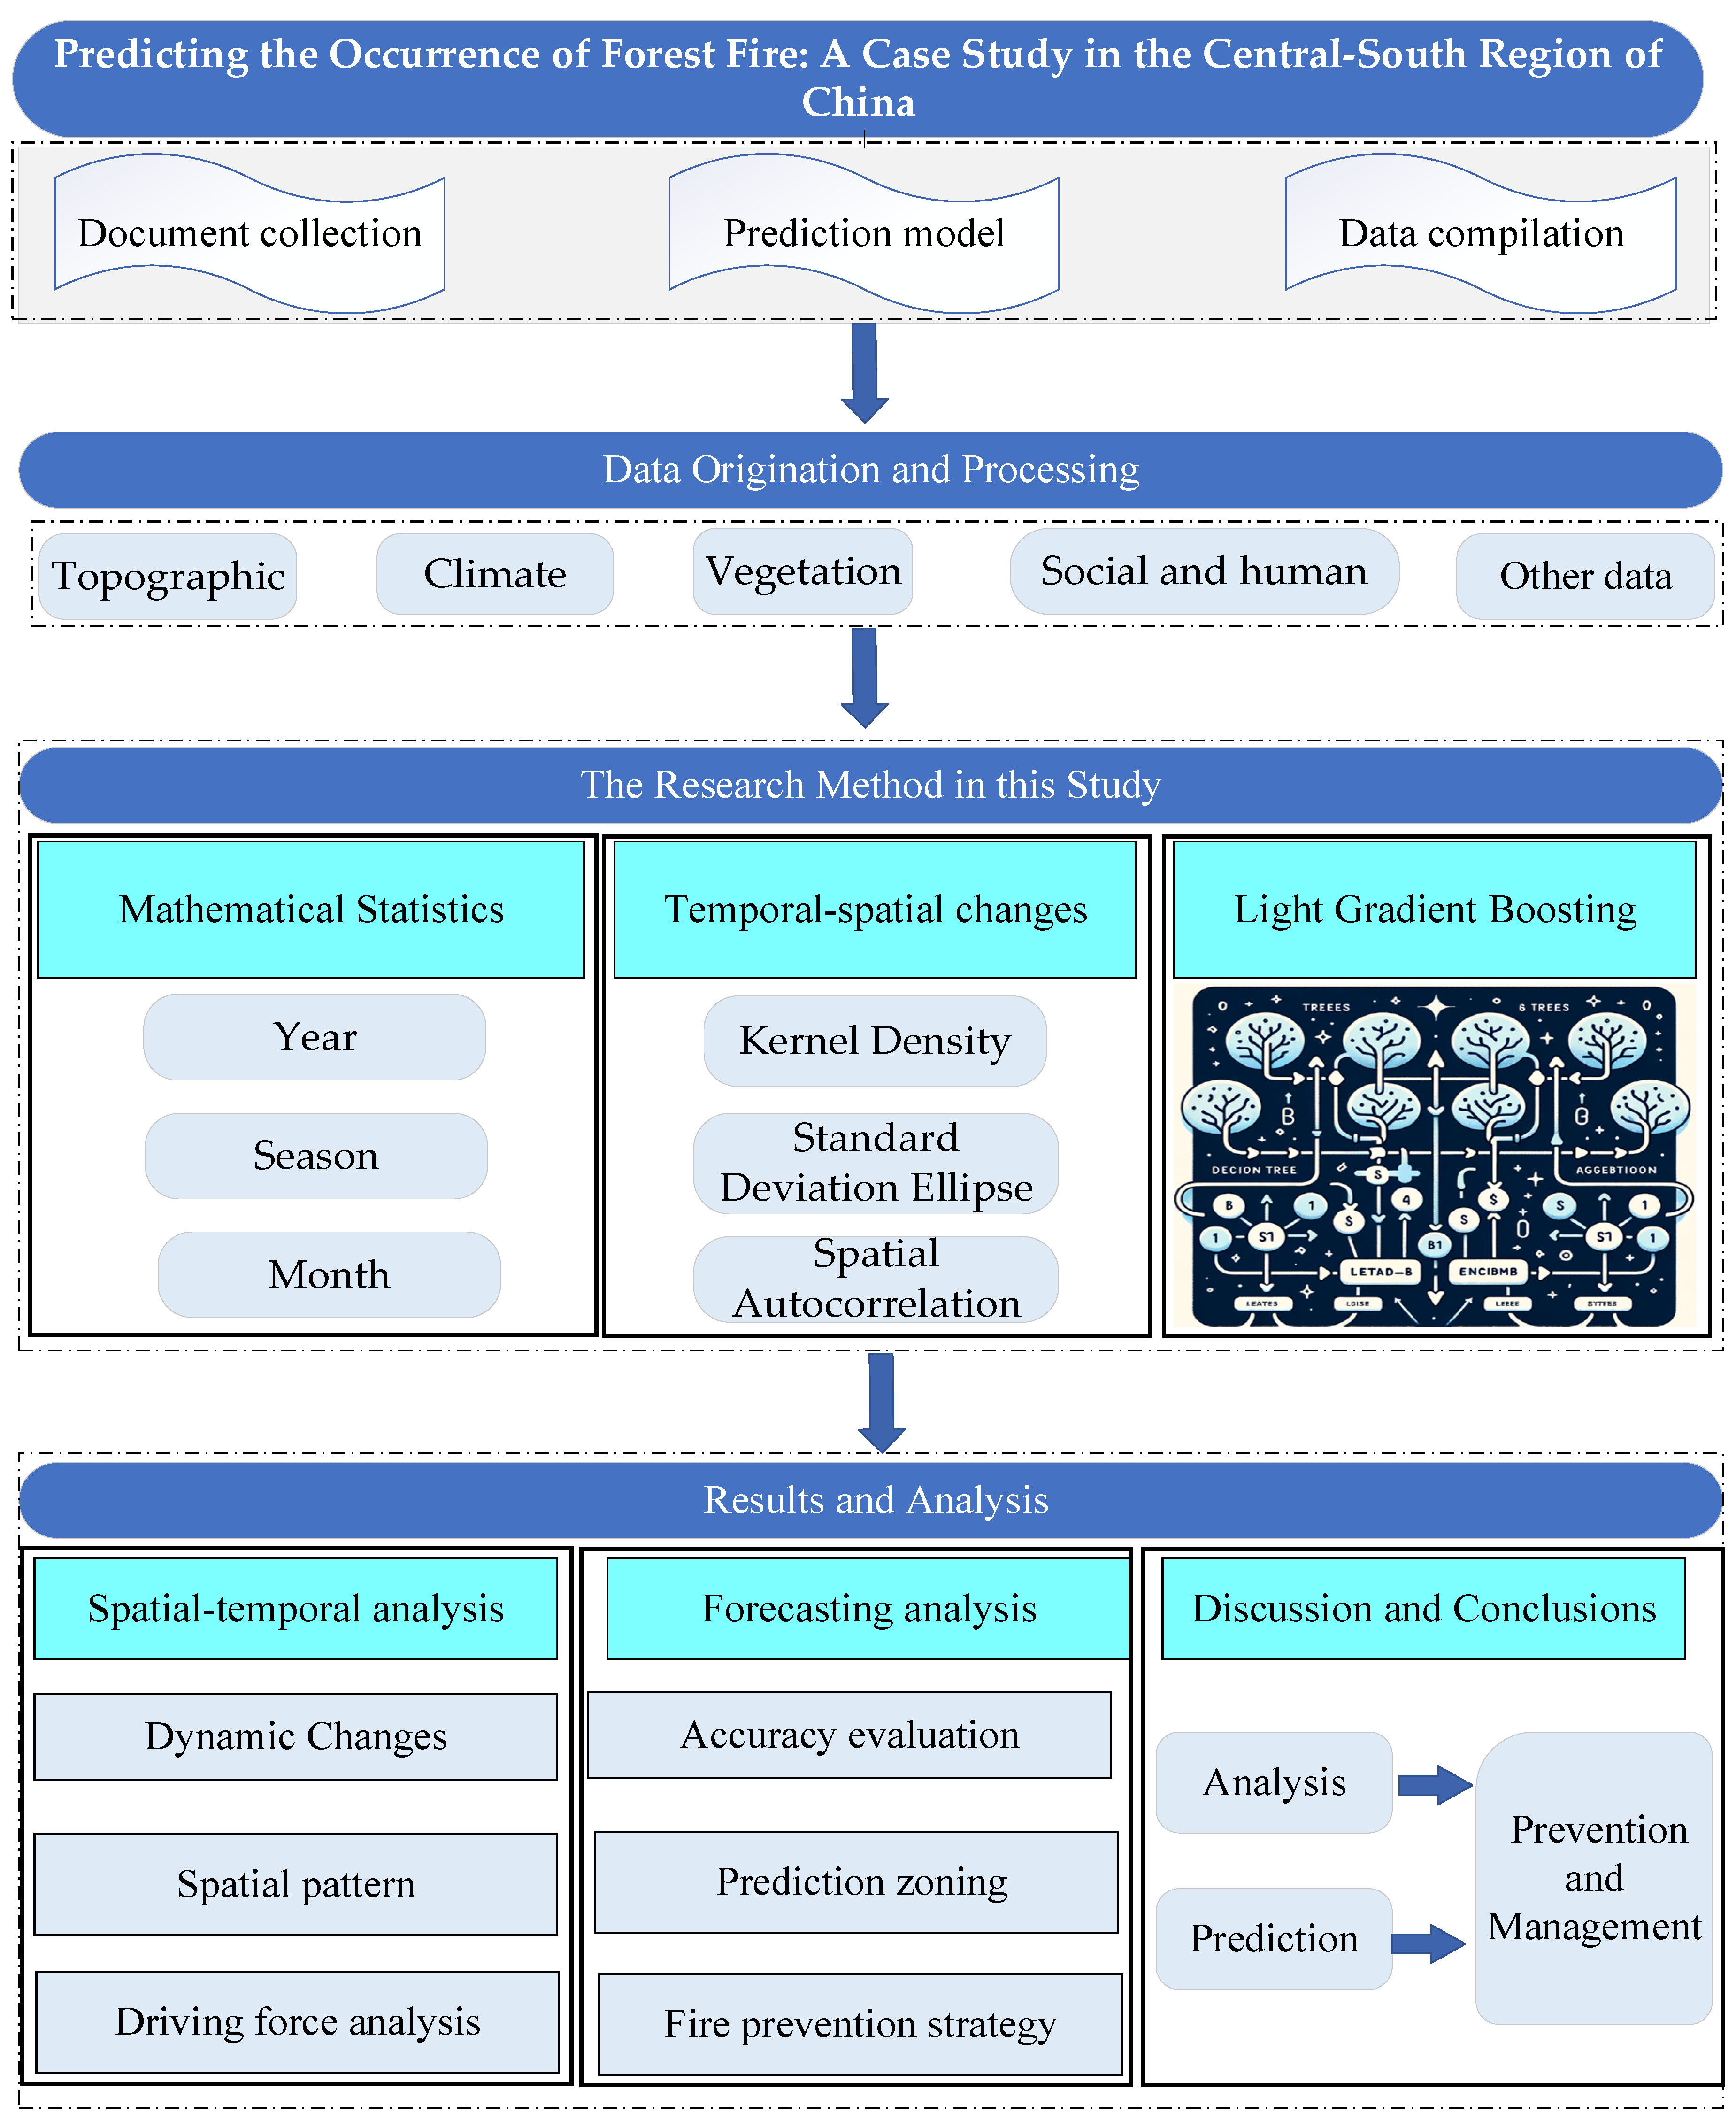
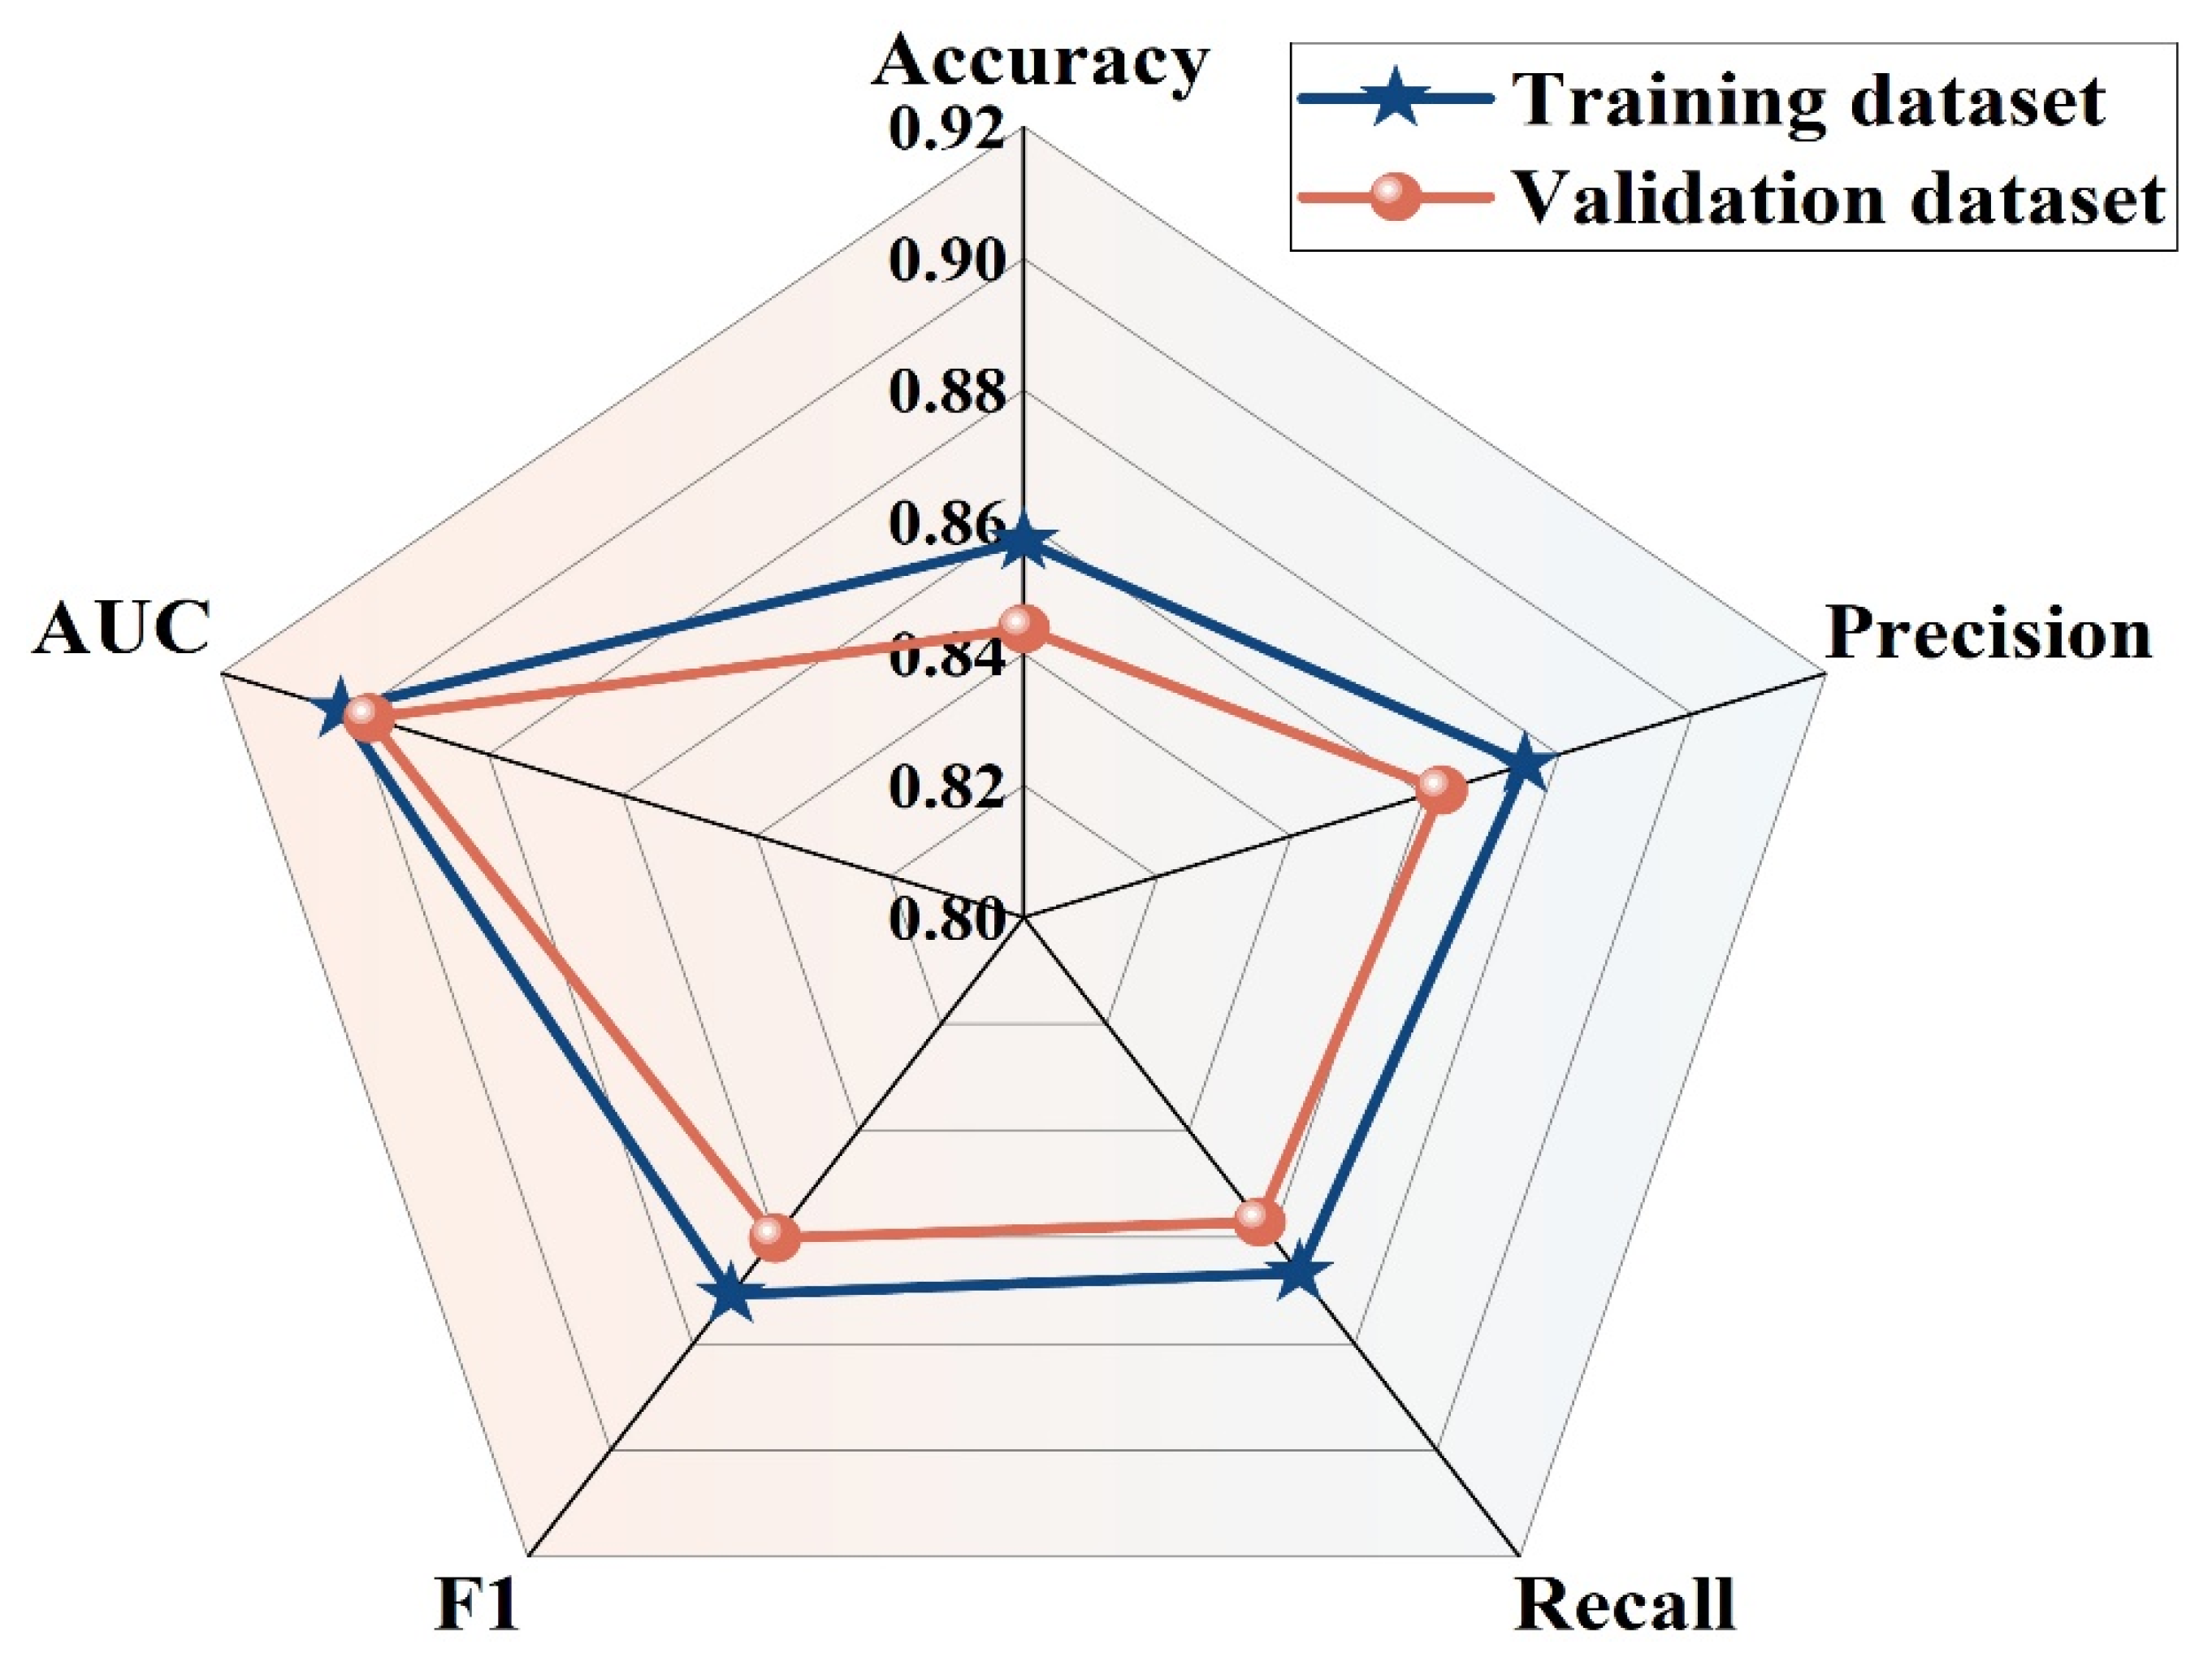
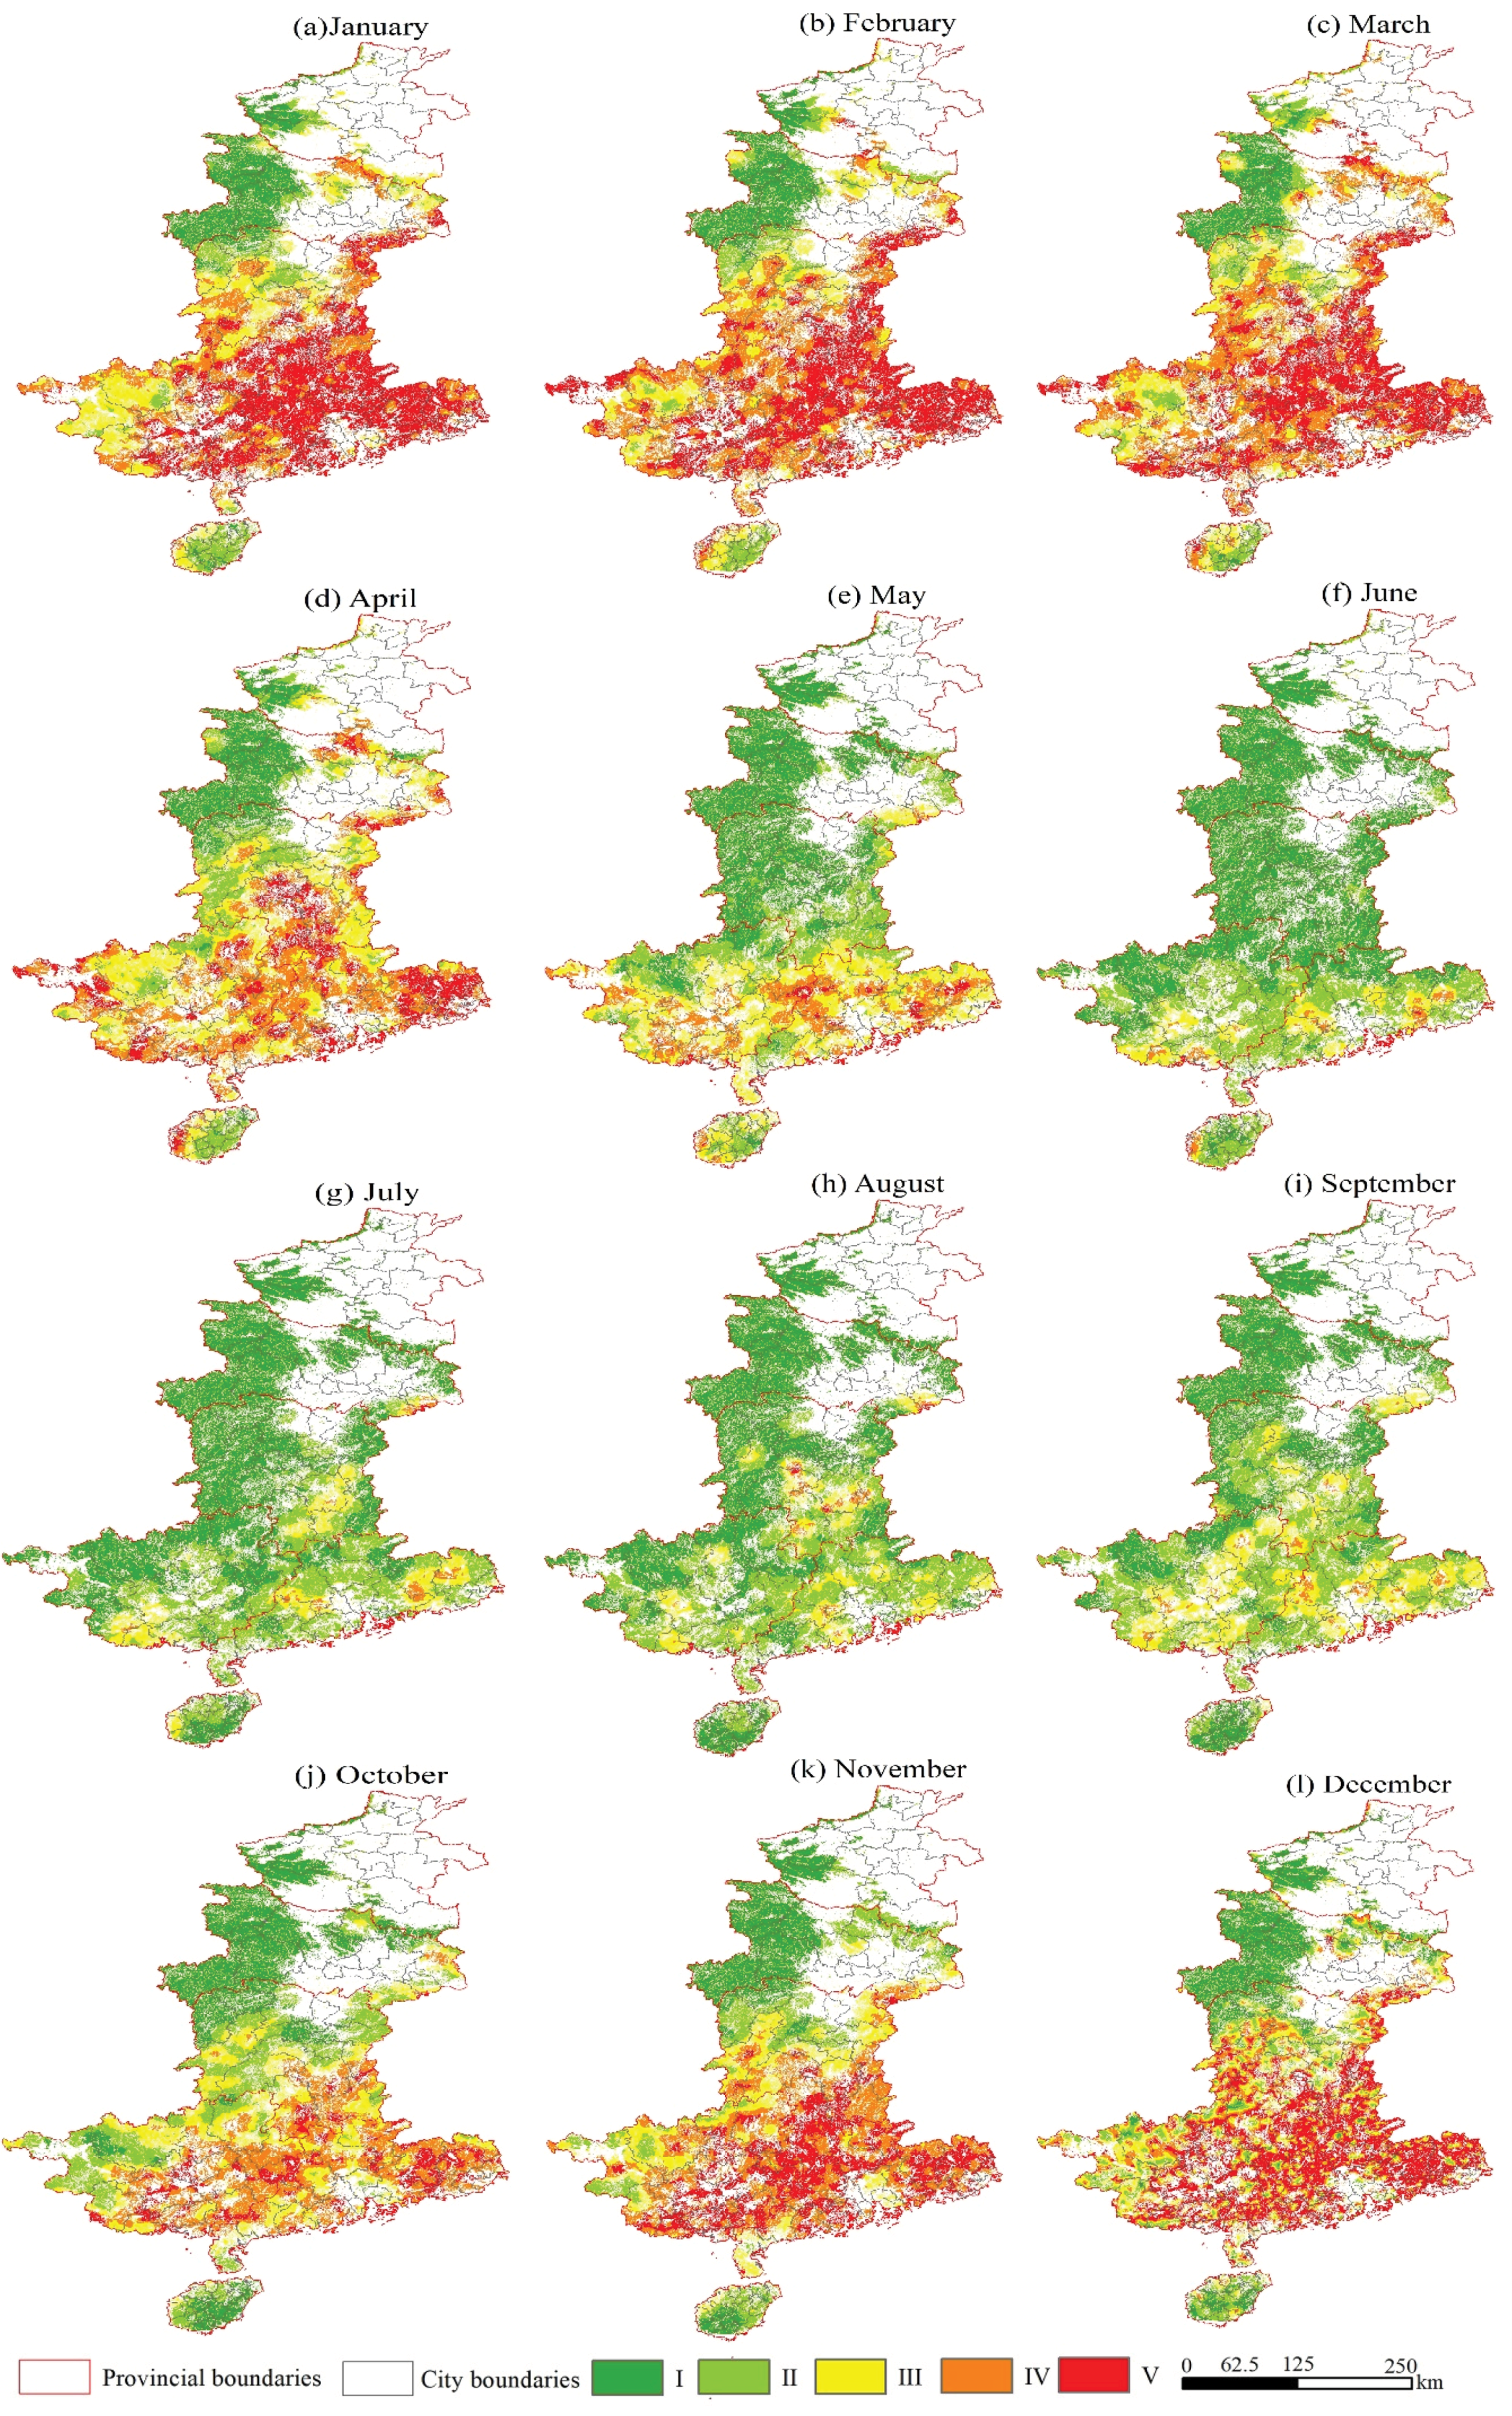
| Classification | Data | Resolution | Source | References |
|---|---|---|---|---|
| Topographic | Slope/Elevation/Slope direction | 1 km | https://www.resdc.cn(Accessed on 5 May 2023) | [19,30] |
| Climate | Average daily surface temperature/ average daily relative humidity/ daily maximum surface temperature, etc. | - | https://data.cma.cn(Accessed on 1 May 2023) | [10,31,32,33] |
| Vegetation | Fractional vegetation cover | - | https://www.resdc.cn(Accessed on 2 May 2023) | [34,35] |
| Social and human factors | Distance from road / Distance from residential area/Gross Domestic Product/ Population | 1:100,000,1:100,000, 1 km, 1 km, | https://www.resdc.cn(Accessed on 8 May 2023) | [19,36,37] |
| Year | XStdDist(km) | YstdDist(km) | Shape_Leng(km) | Shape_Area(km2) | Oblateness | Rotation |
|---|---|---|---|---|---|---|
| 2001 | 372.534 | 268.997 | 2028.542 | 314802.413 | 1.385 | 45.072 |
| 2002 | 388.413 | 296.779 | 2162.196 | 362120.052 | 1.309 | 56.898 |
| 2003 | 373.526 | 258.979 | 2003.366 | 303885.299 | 1.442 | 55.733 |
| 2004 | 381.818 | 285.181 | 2106.417 | 342059.692 | 1.339 | 60.849 |
| 2005 | 436.113 | 317.943 | 2383.464 | 435584.544 | 1.372 | 45.146 |
| 2006 | 376.658 | 271.229 | 2048.857 | 320927.371 | 1.389 | 73.757 |
| 2007 | 370.653 | 286.349 | 2072.507 | 333418.207 | 1.294 | 48.246 |
| 2008 | 303.707 | 380.991 | 2157.867 | 363492.458 | 0.797 | 35.858 |
| 2009 | 345.373 | 287.833 | 1993.357 | 312288.287 | 1.200 | 62.898 |
| 2010 | 491.176 | 339.273 | 2630.753 | 523491.125 | 1.448 | 60.522 |
| 2011 | 348.712 | 398.867 | 2351.203 | 436941.327 | 0.874 | 35.829 |
| 2012 | 297.208 | 422.206 | 2277.155 | 394192.353 | 0.704 | 24.360 |
| 2013 | 308.922 | 461.787 | 2445.076 | 448137.993 | 0.669 | 13.721 |
| 2014 | 300.586 | 424.630 | 2294.988 | 400961.846 | 0.708 | 18.729 |
| 2015 | 415.751 | 283.334 | 2215.941 | 370044.820 | 1.467 | 67.391 |
| 2016 | 317.519 | 470.922 | 2500.411 | 469722.244 | 0.674 | 25.864 |
| 2017 | 275.339 | 369.203 | 2035.607 | 319343.775 | 0.746 | 42.487 |
| 2018 | 431.219 | 305.251 | 2330.600 | 413502.468 | 1.413 | 46.869 |
| 2019 | 276.814 | 562.527 | 2713.722 | 489146.723 | 0.492 | 21.242 |
Disclaimer/Publisher’s Note: The statements, opinions and data contained in all publications are solely those of the individual author(s) and contributor(s) and not of MDPI and/or the editor(s). MDPI and/or the editor(s) disclaim responsibility for any injury to people or property resulting from any ideas, methods, instructions or products referred to in the content. |
© 2024 by the authors. Licensee MDPI, Basel, Switzerland. This article is an open access article distributed under the terms and conditions of the Creative Commons Attribution (CC BY) license (http://creativecommons.org/licenses/by/4.0/).


