
Submitted:
01 March 2024
Posted:
04 March 2024
Read the latest preprint version here
Abstract
Background: Nigeria is among the top 5 countries that have the highest gap between people reported as diagnosed and estimated to have developed Tuberculosis (TB). To bridge this gap, there is a need for innovative approaches to identify geographical areas at high risk of TB transmission and targeted Active Case Finding (ACF) interventions. Leveraging community level data together with granular sociodemographic contextual information can unmask local hotspots which could be otherwise missed. We evaluated if this approach helps to reach communities with higher numbers of undiagnosed TB.
Methodology: We conducted a retrospective analysis of the data generated from an ACF intervention program in 4 south-western states in Nigeria. We subdivided wards (smallest administrative level in Nigeria) into further smaller population clusters. ACF sites and their respective TB screening outputs were mapped to these population clusters. We then combined this data with open source high resolution contextual data to train a Bayesian inference model. The model predicted TB positivity rates on the community level (population cluster level), and these were visualised on a customised geoportal for use by the local teams to identify communities at high risk of TB transmission and plan ACF interventions. The TB positivity yield (proportion) observed at model-predicted hotspots was compared with the yield obtained at other sites identified based on aggregated notification data.
Results: The yield in population clusters that were predicted to have high TB positivity rates by the model was at least 1.75 times higher (Chi-Squared test p-value
Keywords:
Hotspots
; Tuberculosis
; Mapping
; Modelling
; Artificial Intelligence
1. Introduction
According to the World Health Organization (WHO), around 10.6 million people across the world fell ill with Tuberculosis (TB) in 2021. Until the COVID 19 pandemic, there was a yearly 2% decline in TB incidence being observed over the past 20 years, but the post-pandemic world actually saw an increase of 3.6% in the overall incidence of TB between 2020-2021 [1]. Between 2015-2021, the African region where a quarter of all TB occurs, saw a decline of 22% in TB incidence, thus meeting the 2020 target of 20% decline [1]. However, despite all efforts, more than 4 million, approximately 40% of all incident cases remain undiagnosed or unreported to the National TB control programs (NTP). Missing patients, especially the ones who go undiagnosed can unknowingly transmit disease to their families and communities. Interventions need to be strengthened to find these missing TB cases and connect them to care.
Nigeria has the 6th highest burden of TB cases in the world, where 4.4% of all cases are found. The country is also among the top 5 countries that have the highest gap in estimated incidence and reported number of people with newly diagnosed TB [1]. In 2021, only 44% of the estimated number of incident cases were notified in the country. Finding the missing cases early and treating them remains the single most important priority in the country for TB control.
Apart from treating those with existing TB, it is imperative that the halting of transmission is prioritised. A disease like TB which could remain asymptomatic for long periods of time will need more than just passive case finding to control. Active case finding (ACF) is about proactively reaching out to the community, finding people who have undiagnosed infections and connecting them to care [2]. Current evidence supports that ACF interventions can help to reach undiagnosed individuals early and are beneficial in low resource settings. A multi-faceted community based TB case finding intervention in 2 southern states of Nigeria observed that the intervention led to a 138% increase in case detection as compared to the expected notifications in the absence of any intervention [3].
In another study focused on potentially high transmission settings like urban slums, they found a 6.4% TB positivity among the target population, of which 65% were smear positive. They reported that the high transmission could be due to poor living conditions and overcrowding [4]. Another ACF project implemented in Ebonyi state in Nigeria, combined house to house outreach with ACF activity to target attendees of a health facility in the general outpatient departments, ANC and MCH clinics, and people living with HIV (PLHIV) reporting to ART centres - including contact tracing of index clients. They found 3.2% TB positivity among those who were evaluated [5] facility based screening like these can reach a big population in a relatively short period of time, but the overall impact can be variable. While ACF interventions are necessary and impactful, they can be resource intensive. Innovative and data driven approaches can make them more efficient and help to reduce the overall resources consumed. An early warning outbreak recognition system (EWORS) was implemented in 14 states in Nigeria which helped to identify areas with potentially high TB spread at the ward level, and subsequent ACF interventions in the hotspot wards yielded a significantly lower number needed to screen as compared to non-hotspot wards [6].
It is now advocated that communities should use locally tailored interventions to target specific areas which could be at increased risk of TB. Subnational estimation of TB burden though extremely valuable to guide local community based interventions are rather limited in low-middle income countries. Most countries still depend on case notifications, prevalence surveys with small-area estimation and surveys of infection to estimate burden of TB. While such surveys are expensive and time consuming, case notifications are often subject to bias due to differential access to healthcare and under-reporting in low and middle income countries [7]. The MATCH Framework proposed by Rood E et al., emphasises using subnational data such as disaggregated notifications and local screening data for deriving granular insights on a subnational scale [8]. Also, the risk of TB transmission, delayed diagnosis and treatment is determined by several contextual factors like population demographics, socio economic conditions, nutritional status, access to health services and environmental conditions, which are important to take into account along with notification data [9,10,11]. Therefore there is value in leveraging data and available technology to make evidence based decisions for routine programmatic activities and improve effectiveness of interventions [12].
The goal of this paper is to describe the approach taken for developing a TB risk predictive model at the community level and discuss the impact it had on the yield of TB ACF interventions. We compared the ACF yield in clusters that overlap with model predicted hotspot locations with those that do not overlap with hotspots. The research question was, do the clusters that are predicted to be hotspots by the model actually demonstrate increased yield when ACF is conducted as compared to sites that were not predicted to be hotspots? Our hypothesis being if implementers selected sites that had high predicted TB positivity rates for ACF, they would find more cases of undiagnosed TB.
2. Methodology
We conducted a retrospective analysis of the data generated from community based ACF interventions led by Society for Family Health (SFH), Nigeria in 4 south-western states namely Lagos, Oyo, Ogun and Osun. The project was funded by The United States Agency for International Development (USAID), which established the Local Organizations Networks (LON) to increase the level of TB cases detected and treated in Nigeria over five years (2020-2025). The project engages Community Based Organizations (CBOs) and Community Volunteers (CVs) for contact tracing of index TB cases enrolled for treatment, community outreaches, active case finding and sensitization meetings in the communities.
We used principles of Machine Learning to develop an epidemiological digital representation (‘twin model’) of the TB situation in the four states of Nigeria. This digital twin model was based on data generated from local ACF program implementation and contextual data. The outputs generated by the model were visualised on a web interface (hereafter referred to as the geoportal) that was used by the local teams to identify high priority neighbourhoods for routine activities. The new data thus generated from the routine ACF events was regularly incorporated into the training data. Continuous flow of new data from the program formed a feedback loop, improved the model’s ability to learn from data coming in and distinguish better among the low and high TB risk areas and calibrated previous predictions. This method allowed the outputs to become finetuned over time, keeping in mind the need to support program teams in finding the last missing TB cases. We trained the first model in September 2020 with very limited data including only 24 unique ACF locations. This grew to the present 857 unique locations as at June 2022.
The approach used Bayesian networks that provided a powerful machine learning technology to reason with uncertainty in complex environments. In this case it refers to the spatially aware programmatic and socio-economic data, multiple variables with potentially nonlinear relationships, large amounts of natural variation, and missing values. The model was queried for TB positivity rate across the four states, including areas where observations were not available, using known local contextual data at the relevant subnational resolution. The Bayesian framework used was a proprietary Naive Bayes implementation. Naive Bayes is founded on the assumption of conditional independence between predictors - called the Naive Bayes Assumption. The benefits of such an approach are well known in terms of ease of implementation, scalability to number of predictors and data points, and ability to be trained on relatively limited input data.
We received routinely collected TB screening data from ACF sites on a monthly interval. Each row corresponded to a unique location or community where the screening activity took place and contained corresponding information on the state, local government area (LGA) and ward name. We used Google maps to manually look up geo coordinates of each community, and the ones that did not show up Google maps were excluded.
We derived the TB positivity rate (proportion) from the number diagnosed with bacteriologically positive TB and absolute number screened at each ACF event. Similar proportions were also calculated for contact investigations (close contacts of index TB clients diagnosed positive over total contacts screened) and facility based screening (number of attendees diagnosed positive over number of attendees screened).
Indicators of sociodemographic situation and human development known to be associated with TB [10,13] were accessed from open source platforms. Data on age and gender related population estimates [14], population density [15], poverty [16], night-time lights [17] and elevation [17] was obtained from WorldPop. We used spatially modelled data from the Demographic and Health Surveys (DHS) platform on literacy, access to clean water, sanitation services, stunting in children (proxy for nutritional status), vaccination coverage (indicator of access to care and health seeking behaviour) [18]. Travel time to health care facilities [19], distance to major roads [17] and health facility density [20] were also used as indicators of access to care. Modelled estimates of Human Immunodeficiency Virus (HIV) prevalence [21] and child mortality [22] were available from The Institute for Health Metrics and Evaluation (IHME) and Global Health Data Exchange (GHDx) platform. A more detailed view on the variables used has been provided in Table 1.
In highly populous countries like Nigeria, the usual administrative units like the wards can be very large in some regions. In order to provide a model output that is able to guide neighbourhood level interventions, we divided the wards into further smaller units. This was done by a k-means clustering algorithm that divided the population in a given ward into polygons of varying shape and population, such that each polygon contained approximately 10,000 population and did not cross the ward borders. This way the four states are disaggregated into 7,088 population clusters (also called thiessen polygons) [23] of variable sizes. High population density areas had smaller size clusters while low density areas like rural areas had comparatively large sized clusters. The model was trained to produce an output for each of these 7,088 population clusters.
Each variable mentioned in Table 1 was aggregated to match the resolution of the newly designed polygon level and scaled to a rate form, such that each population cluster had a unique profile defined by its local contextual information.
The model was trained on the TB positivity rate derived from ACF events that took place in a limited number of population clusters, to predict a TB positivity rate for all other clusters. The predicted output thus allowed identification of other clusters that could be prioritised for ACF activities. The geoportal allowed the local teams to activate a filter and select sites with the highest predicted TB positivity rate in their region of activity. The location was then communicated to the field teams responsible for organising TB screening events in the community. The yield obtained at the ACF event (observed TB positivity rate) was allocated to the respective population cluster to calculate the new average observed rate. If the site had never been screened, the new yield obtained after ACF was included as a new data point on the dataset. The model was dynamic in nature, receiving new ACF data at regular intervals and retrained every 2-3 months. The outputs were expected to improve over time and the model identified ‘hotspots’ or population clusters that could be at risk of increased TB positivity driven by the local contextual conditions such as poverty, access to health facilities or population density.
The hotspot predictions were being used in the 4 States since early 2021 for selecting the most optimal sites for ACF, however the uptake was variable across the region. Some of the ACF events are planned using the model predictions, while others were selected based on the conventional approach. The latter was based on facility level TB notifications, aggregated to the LGA level which serves as the functional unit of the TB control program in Nigeria. LGA level data was submitted to the State TB and Leprosy Control Officer (STBLCO), who then reported to the NTP [24]. Thus facility level notifications were used to identify the catchment areas with potentially high TB burden, which were then targeted for active case finding. The project implementers who preferred to select their ACF sites using the geoportal commonly chose sites with high predicted TB positivity rates, between the top 10% to top 50%.
We compared the ACF yield in population clusters that overlap with model predicted hotspot locations with those that were not predicted as hotspots (other sites). These other sites were chosen based on the conventional approach of using facility level notifications. The comparison was done between proportions of TB positivity (yield) using chi square test. For the sake of uniformity we set the threshold at 30%, all clusters that had a TB positivity rate falling in the top 30% range of predicted values in each state were classified to be hotspots.
3. Results
We predicted TB positivity rate at population cluster level (below ward level) in 4 south western states of Nigeria, Figure 1. The predicted outputs were used to select more suitable ACF sites, a step towards making data driven decisions.
Figure 2 shows a further refined view of Figure 1, limited only to the areas that are inhabited by individuals after eliminating all unsettled areas such as fields, forests and barren land. The areas with ‘clustering’ of a large number of settlements represent major cities and urban areas, surrounded by less densely packed settlements in peri urban and rural areas.
Table 2 describes the overall administrative division, the number of population clusters further created during this modelling exercise and the total number of ACF locations that could be mapped using the approach described earlier. In the four states combined the mappable population clusters form 12% of the total 7088 clusters and the respective data generated was used for model training.
Figure 3 shows the geographical distribution of ACF sites mapped across the four states (in Blue) together with the population clusters identified as ‘hotspots’ (in Red) by the model. The geoportal allowed the user to visualise several layers of their interest such as their previous ACF activity, locations of TB diagnostic services and newly predicted hotspots.
Figure 4 shows the graphical representation of median TB positivity yield obtained when ACF activity happened in the predicted hotspots in comparison with other sites for each of the states. The median yield in hotspot clusters was higher than the non-hotspot clusters in three out of four states. The lowest median yield was observed in Lagos in the hotspot locations, albeit with exceptionally high yield in some locations, thus the average yield was still higher than the non hotspot group for the state as a whole. Outliers seemed to be common in all states and in both groups.
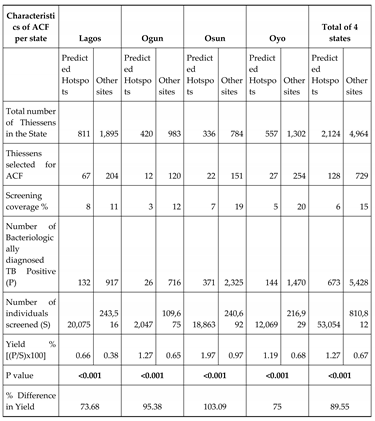
Table 3 shows the comparative analysis of average ACF yields obtained in each of the states. For each state, the table depicts outcome of ACF in the predicted hotspots, sites that were identified by the model to be at high risk of TB and other sites which were not predicted to be among high TB positivity locations but were nevertheless chosen for ACF by the local teams based on the conventional approach.
In terms of ACF coverage of the predicted hotspots within each state, Lagos had the highest coverage at 8%, while Ogun state only selected 3% of its predicted hotspots for screening. Fewer sites were selected based on the model predictions (128), and the conventional approach (729) seemed to be more popular overall in the 4 states. Even though much less screening happened in the predicted hotspots, the proportion of TB positive individuals diagnosed was at least 1.7 times higher individually in each state and the difference was statistically significant. In Osun state, the yield obtained in the predicted hotspots was more than double as compared to that in the other sites. While Ogun state had the lowest uptake of predictive sites for ACF, they reported the second highest overall yield that was 95% more than that observed in the other sites selected conventionally.
4. Discussion
We used routine ACF data generated at the community level to make a high resolution TB predictive model for the four southwestern states in Nigeria. The outputs were accessible to the local team via a customised Geoportal which allowed the ground teams to visualise the hotspots on a mapping portal and make data driven decisions for their ACF activities. Apart from planning community based TB screening, the predictive outputs were also used for other program objectives such as to identify priority areas for engaging private care providers and community engagements.
This predictive model is the first of its kind in Nigeria which predicts hotspots on specially designed population clusters below the ward level. These population clusters were designed in discussion with the local teams such that each cluster contained a manageable size of population (up to 10,000) for ACF. Identifying the high TB transmission areas on the basis of facility level notification data alone can be challenging. This model does not depend heavily on the number of registered TB clients at the facility level, which is often affected by the capacity and quality of diagnostic and treatment services available in an area. Areas that are rather remote and located away from quality TB diagnostic facilities can have low notification rates and might be mistaken for low TB transmission [7,13,25].
In contrast, a study in Kampala, Uganda reported that facility based passive case finding could predict high TB prevalent settings and was sufficient to effectively guide ACF. However, their study area was a 2.2 KM^2 region with a population of approximately 49,000 individuals with quite homogenous access to TB diagnostic and treatment services. The author’s remarks that facility based notifications may be less useful in bigger regions where access to health services is variable [26]. We therefore believe our approach is well suited for these populous southwestern states in Nigeria.
This model leveraged community based screening data from a limited number of locations, enriched it with other local determinants of TB transmission and predicted the TB positivity rate at the community level across the whole geographic region. The advantage of using ACF data could be that it reflected the TB transmission among the people who live or frequent the screened location. The model thus ‘predicted’ and helped to identify even those communities that were traditionally not known to report many TB cases or were not reached by any previous ACF activities. This can also be seen as an added advantage over the commonly used spatial clustering techniques. These techniques are able to identify statistically significant clustering patterns from heterogenous disease distributions. While they would detect significant clusters if several data points fell adjacent to each other, they can fail to identify small areas of TB transmission if they exist in an isolated and remote location [27]. Identification of disease hotspots at the local level is believed to be one of the important components of epidemic elimination [7]. Thus, the local teams could make informed decisions for selecting ACF sites and reach out to the communities to find a higher proportion of undiagnosed TB.
It can be seen that the most high TB risk areas were predicted to be in and around the densely populated urban centres. While urban centres are often characterised by high accessibility to better health care services, they also typically have overcrowded houses and people living in lower socioeconomic conditions, determinants of TB transmission [28,29].
We compared the TB positivity yield obtained at the ACF sites that were also predicted by the model to be at high risk of TB to other sites that were selected based on the conventional approach for ACF planning (using notification data). The overall yield in predicted hotspots was 73% higher in Lagos, 95% higher in Ogun, 103% higher in Osun and 75% higher in Oyo state as compared to the other sites, and the results were statistically significant. The results were especially impressive because the model-recommended ACF sites only form a very small proportion of the total ACF that happened across the four states. This supports the fact these model predicted hotspots were in fact better suited for ACF while the non hotspot sites did not find as many new TB cases with extensive screening. Ogbudebe et al. who used their EWORS system to identify TB hotspots in 14 states of Nigeria reported that the number needed to screen to diagnose a TB case in the hotspot and non–hotspot areas was 146 and 193 per 10,000 people, respectively, that translated to almost 24% higher yield [6].
Looking at Lagos state, the median yield observed in the predicted hotspots is almost zero, that means up to 50% ACF events did not find any TB cases. Although the overall yield (average) is higher as compared to the other sites, it could have been potentially driven by the locations that found an extremely high yield. Lagos is the most densely populated state in Nigeria with a population density of almost 3,791 per square kilometre. The state is also the centre of focus for the National TB control program with several government and non-government organisations implementing their TB case finding interventions programs across the state. It is possible that some population clusters were repeatedly screened by separate organisations at different points of time over the past few years. This could have been one of the reasons for the lowest median yield among the four states despite the highest extent of screening. This also points towards a need for increasing collaboration among locally active organisations that perform ACF and sharing of data to make evidence based decisions. Pooling of data from different ACF programs across the state could further boost predictive models like these and benefit the whole community. A recent study from Pakistan which retrospectively analysed their ACF program data, found that among more than 1500 individual ACF events conducted in and around Karachi city, almost three fourth did not find any TB cases. However a small proportion of 5% events accounted for 40% of the TB cases diagnosed. The authors concluded that a more targeted approach for ACF in high population metropolitan cities can increase the yield and cost-effectiveness of interventions [30].
The interquartile range of yield as observed in sites other than hotspots reflects that the sites selected by the local teams could have been similar in their local context and TB burden. It is common practice that in most states ACF sites are chosen based on facility level notifications. However the broader range and extreme values of yield found in predicted hotspot locations shows that even with much fewer sites, these were potentially different from those selected by conventional approach (non-hotspot sites) and had a much higher number of undiagnosed TB. The reason could be that the predictive model learnt from local contextual and ACF data to uncover TB transmission sites which could have been easily missed if only aggregated notification data was used. Further, training models with local context could potentially ameliorate the effects of underreporting or other systematic reasons for low notification rates, that may not accurately reflect the true disease burden on their own.
Another reason for these high yields could be that the predicted hotspots were previously seldom targeted based on reluctance of the local teams to explore communities which are not justifiably represented on the treatment registers (facility notification registers). This leaves a pool of undiagnosed TB waiting to be diagnosed at the earliest opportunity.
Similarly, a study in Peru mapped geographic coordinates of individuals treated for TB in an urban district over five years and analysed their spatial distributions. They reported heterogeneous distributions of TB with clustering of local hotspots and cold spots across the 74 neighbourhoods in the district. The study found that while the median rate of reported cases in the district was 123.6, the range among neighbourhoods varied from 0 to 800 cases per 100,000 population. While the study utilised notification registers alone, it highlights the possibility of local epidemics and relevance of geographic mapping of individual cases from their addresses to identify areas at risk of TB transmission and its practical implications for decision making [31].
However, there are a number of challenges associated with deployment of the geoportal and model driven case finding. It took some hand-holding and mentorship before the local teams could trust the predictions as a number of the predicted hotspots were not known as high yielding in the past. Also, limited digital literacy of some of the local teams particularly restricted the use to some cadres of field staff. Additionally, it was challenging getting data back into the model as reporting was basically paper based with sparse electronic data capturing.
The main strength of this approach was that the local ACF data allowed predictive models to learn about the distribution of undiagnosed TB cases in the community, thus improving their potential of predicting new ACF sites, as opposed to the facility level notification data. This approach leverages incremental learning and does not require large volumes of data from the beginning, allowing data driven decision making in low resource settings.
Our results should be interpreted in light of certain limitations and assumptions. Individuals screened at a certain population cluster or community were assumed to be belonging to that location, the routine data collection sheets reported aggregated data and not individual level. The geo-coordinates of ACF sites were manually searched online and mapped; this could have led to some discrepancies in precise mapping. Also, it was not possible to find all communities on Google maps and thus they had to be excluded. The uptake of using models for ACF planning was variable across the states and we had no control on how frequently or the way this approach was being used. The retrospective nature of this analysis did not allow us to control for any biases that could have an impact on the way the screening events were planned. For example, if the community volunteers knew that they were screening in a predicted hotspot, it could have affected some of their practices. Also, because the total training data at population cluster level was very limited as compared to the total number of clusters the model was predicting for, it was not possible to perform further disaggregation into age groups, gender or train the model on unseen data. We were unable to show the overall impact of this case finding intervention on the total notifications in the 4 states as the TB-LON 3 program did not have access to all the notification data on the state level. Nevertheless, notifications to the National TB control program are affected by a number of factors including the diagnostic and treatment initiation capacities, while the model predictions were only used to guide the ACF site selection. Finally, as the analysis was done retrospectively, hotspots predicted from the final training set may not have been predicted as hotspots at the time of screening and could have been selected by the conventional approach, and thus prospective studies are needed to more accurately quantify the improvement in yield of the data driven approach when used for targeted ACF.
We believe that for future ACF programs and interventions, recording of geographic information such as coordinates should be promoted as much as possible. These results are motivating enough to increase confidence in such data driven approaches. A more systematic and large scale comparison in a prospective intervention design can provide stronger evidence for advocating this approach in other regions.
5. Conclusion
This approach leveraged local data, looked beyond facility level aggregated notification and enabled outreach to previously underserved locations. The program implementers were able to find much higher yields when ACF activity happened in the model-predicted ‘hotspots’.
List of Abbreviations
ACF: Active Case Finding
CBO: Community Based Organization
CV: Community Volunteers
DHS: Demographic and Health Surveys
EWORS: Early Warning Outbreak Recognition System
GHDX: Global Health Data Exchange
HIV: Human Immunodeficiency Virus
IHME: The Institute for Health Metrics and Evaluation
LGA: Local Government Area
LON: Local Organizations Network
NTP: National Tuberculosis Control Program
SFH: Society for Family Health
STBLCO: State Tuberculosis and Leprosy Control Officer
TB: Tuberculosis
USAID: The United States Agency for International Development
WHO: World Health Organization
Author Contributions
Abiola Alege: Conception or design of the work. Data analysis and interpretation. Drafting the article. Sumbul Hashmi: Conception or design of the work. Data analysis and interpretation. Drafting the article. Rupert Eneogu: Critical revision of the article. Final approval of the version to be published. Vincent Meurrens: Conception or design of the work. Anne-Laure Budts: Conception or design of the work. Data collection. Data analysis and interpretation. Michael Pedro: Data collection. Olugbenga Daniel: Critical revision of the article. Omokhoudu Idogho: Conception or design of the work. Austin Ihesie: Critical revision of the article. Matthys Potgieter: Conception or design of the work. Critical revision of the article. Obioma Chijioke Akaniro: Final approval of the version to be published. Omoshalewa Oyelaran: Final approval of the version to be published. Mensah Olalekan Charles: Conception or design of the work. Aderonke Agbaje: Conception or design of the work. Data analysis and interpretation. Critical revision of the article.
Funding
The TBLON 3 program is funded by USAID but the funder has no role in the conceptualization, design, data collection, analysis, decision to publish, or preparation of the manuscript.
Institutional Review Board Statement
Not applicable.
Informed Consent Statement
Not applicable.
Data Availability Statement
The data that support the findings of this study are available from the Institute of Human Virology but restrictions apply to the availability of these data, which were used under licence for the current study, and so are not publicly available. Data are however available from the authors upon reasonable request and with permission of the Institute of Human Virology.
Acknowledgments
Not applicable.
Conflicts of Interest
The authors declare that they have no competing interests.
References
- Organization GWH. Global tuberculosis report 2022. 2022.
- Yuen CM, Amanullah F, Dharmadhikari A, Nardell EA, Seddon JA, Vasilyeva I, et al. Turning off the tap: Stopping tuberculosis transmission through active case-finding and prompt effective treatment. Lancet, 2015; 386, 2334–2343. [CrossRef]
- Eyo AS, Obot VO, Onyedinachi O, Vasquez NA, Bigio J, Sanaie A, et al. A multi-faceted approach to tuberculosis active case finding among remote riverine communities in southern Nigeria. Int J Environ Res Public Health, 2021; 18, 9424. [CrossRef]
- Ogbudebe CL, Chukwu JN, Nwafor CC, Meka AO, Ekeke N, Madichie NO, et al. Reaching the underserved: Active tuberculosis case finding in urban slums in southeastern Nigeria. Int. J. Mycobacteriology, 2015; 4, 18–24. [CrossRef]
- Daniel, C. Oshi, Joachim C. Omeje, Sarah N. Oshi, Isaac N. Alobu, Ngozi E. Chukwu, Chukwuemeka Nwokocha OFE, Chidubem L. Ogbudebe, Anthony O. Meka1 KNU. An Evaluation of Innovative Community-based Approaches and Systematic Tuberculosis Screening to Improve Tuberculosis Case Detection in Ebonyi State, Nigeria. Int J Mycobacteriology. 2017, 6:246–52. [CrossRef]
- Ogbudebe C, Jeong D, Odume B, Chukwuogo O, Dim C, Useni S, et al. Identifying Hot Spots of Tuberculosis in Nigeria Using an Early Warning Outbreak Recognition System: Retrospective Analysis of Implications for Active Case Finding Interventions. JMIR public Heal Surveill. 2023, 9:e40311. [CrossRef]
- Theron G, Jenkins HE, Cobelens F, Abubakar I, Khan AJ, Cohen T, et al. Data for action: Collection and use of local data to end tuberculosis. Lancet. 2015, 386(10010):2324–33. [CrossRef]
- Rood E, Khan AH, Modak PK, Mergenthaler C, Van Gurp M, Blok L, et al. A spatial analysis framework to monitor and accelerate progress towards SDG 3 to end TB in Bangladesh. ISPRS Int J Geo-Information. 2019, 8(1):1–11. [CrossRef]
- Cai J, Wang X, Ma A, Wang Q, Han X, Li Y. Factors associated with patient and provider delays for tuberculosis diagnosis and treatment in Asia: A systematic review and meta-analysis. PLoS One. 2015 Mar 25;10(3). [CrossRef]
- Carter DJ, Glaziou P, Lönnroth K, Siroka A, Floyd K, Weil D, et al. The impact of social protection and poverty elimination on global tuberculosis incidence: a statistical modelling analysis of Sustainable Development Goal 1. Lancet Glob Heal. 2018; 6(5):e514–22. 1 May. [CrossRef]
- Lönnroth K, Jaramillo E, Williams BG, Dye C, Raviglione M. Drivers of tuberculosis epidemics: The role of risk factors and social determinants. Soc Sci Med [Internet]. 2009, 68(12):2240–6. Available online: https://www.sciencedirect.com/science/article/pii/S0277953609002111. [CrossRef]
- Shrestha S, Reja M, Gomes I, Baik Y, Pennington J, Islam S, et al. Quantifying Geographic Heterogeneity in TB Incidence and the Potential Impact of Geographically Targeted Interventions in South and North City Corporations of Dhaka, Bangladesh: A model-based Study. Epidemiol Infect. 2021. [CrossRef]
- Maciel ELN, Pan W, Dietze R, Peres RL, Vinhas SA, Ribeiro FK, et al. Spatial patterns of pulmonary tuberculosis incidence and their relationship to socio-economic status in Vitoria, Brazil [Internet]. 2010. Available online: http://www.dpi.inpe.br/terraview.
- Bondarenko M., Kerr D., Sorichetta A., and Tatem AJ. Estimates of total number of people per grid square broken down by gender and age groupings for 51 countries across sub-Saharan Africa in 2020 using Ecopia.AI and Maxar Technologies. WorldPop, University of Southampton, UK building footprints. 2020.
- School of Geography and Environmental Science, University of Southampton; Department of Geography and Geosciences, University of Louisville; Departement de Geographie, Universite de Namur) and Center for International Earth Science Information Network (CI CU. Global High Resolution Population Denominators Project - Funded by The Bill and Melinda Gates Foundation [Internet]. 2018. Available online: www.worldpop.org.
- Tatem AJ, Gething PW, Bhatt S WD and PC. Pilot high resolution poverty maps. [Internet]. University of Southampton/Oxford. 2013. Available online: https://hub.worldpop.org/geodata/summary?id=1267.
- School of Geography and Environmental Science, University of Southampton; Department of Geography and Geosciences, University of Louisville; Departement de Geographie, Universite de Namur) and Center for International Earth Science Information Network (CI CU. Global High Resolution Population Denominators Project - Funded by The Bill and Melinda Gates Foundation (OPP1134076). [Internet]. 2018. Available online: www.worldpop.org.
- Demographic and Health survey (DHS) [Internet]. 2018. Available online: https://spatialdata.dhsprogram.com/modeled-surfaces/#survey=NG%7C2018%7CDHS.
- Weiss DJ, Nelson A, Vargas-Ruiz CA, Gligorić K, Bavadekar S, Gabrilovich E, et al. Global maps of travel time to healthcare facilities. Nat Med [Internet]. 2020, 26(12):1835–8. [CrossRef]
- Africa E-H. Nigeria: Health facilities [Internet]. HDX. 2020 [cited 2020 Jul 5]. Available online: https://data.humdata.
- (IHME) I for HM and E. Sub-Saharan Africa HIV Prevalence Geospatial Estimates 2000-2018 [Internet]. HDX. 2022 [cited 2022 Jan 20]. Available online: https://ghdx.healthdata.org/record/ihme-data/sub-saharan-africa-hiv-prevalence-geospatial-estimates-2000-2018.
- (IHME) I for HM and E. Low- and Middle-Income Country Neonatal, Infant, and Under-5 Mortality Geospatial Estimates 2000-2017 [Internet]. HDX. 2019 [cited 2020 Dec 12]. Available online: https://ghdx.healthdata.org/record/ihme-data/lmic-under5-mortality-rate-geospatial-estimates-2000-2017.
- Colston JM, Burgert CR. Using Geospatial Analysis To Inform Decision Making in Targeting Health Facility - Based P Rograms: a Guidance Document. 2014, (June):1–58.
- Onyeonoro UU, Chukwu JN, Nwafor CC, Meka AO, Omotowo BI, Ogbudebe C, et al. Assessment of the quality of tuberculosis surveillance data in six selected states in Southern Nigeria. Ann Trop Med Public Heal. 2015, 8(4):94–100. [CrossRef]
- Dangisso MH, Datiko DG, Lindtjørn B. Accessibility to tuberculosis control services and tuberculosis programme performance in southern ethiopia. Glob Health Action. 2015, 8(1). [CrossRef]
- Robsky KO, Robsky KO, Kitonsa PJ, Mukiibi J, Nakasolya O, Isooba D, et al. Spatial distribution of people diagnosed with tuberculosis through routine and active case finding: A community-based study in Kampala, Uganda. Infect Dis Poverty. 2020, 9(1):1–10. [CrossRef]
- Shaweno D, Trauer JM, Doan TN, Denholm JT, McBryde ES. Geospatial clustering and modelling provide policy guidance to distribute funding for active TB case finding in Ethiopia. Epidemics [Internet]. 2021, 36:100470. [CrossRef]
- Van Gurp M, Rood E, Fatima R, Joshi P, Verma SC, Khan AH, et al. Finding gaps in TB notifications: spatial analysis of geographical patterns of TB notifications, associations with TB program efforts and social determinants of TB risk in Bangladesh, Nepal and Pakistan. BMC Infect Dis. 2020, 20(1):1–14. [CrossRef]
- Ribeiro FKC, Pan W, Bertolde A, Vinhas SA, Peres RL, Riley L, et al. Genotypic and spatial analysis of mycobacterium tuberculosis transmission in a high-incidence urban setting. Clin Infect Dis. 2015 Sep 1;61(5):758–66. [CrossRef]
- Zaidi SMA, Jamal WZ, Mergenthaler C, Azeemi KS, Van Den Berge N, Creswell J, et al. A spatial analysis of TB cases and abnormal X-rays detected through active case-finding in Karachi, Pakistan. Sci Rep [Internet]. 2023, 13(1):1–11. [CrossRef]
- Brooks MB, Millones AK, Puma D, Contreras C, Jimenez J, Tzelios C, et al. Mapping local hot spots with routine tuberculosis data: A pragmatic approach to identify spatial variability. PLoS One [Internet]. 2022, 17(3 March):1–9. [CrossRef]
Figure 1.
A visualisation from the TBLON 3 geoportal showing the four states subdivided into population clusters and the spatial distribution of predicted bacteriological TB positivity rate.
Figure 1.
A visualisation from the TBLON 3 geoportal showing the four states subdivided into population clusters and the spatial distribution of predicted bacteriological TB positivity rate.
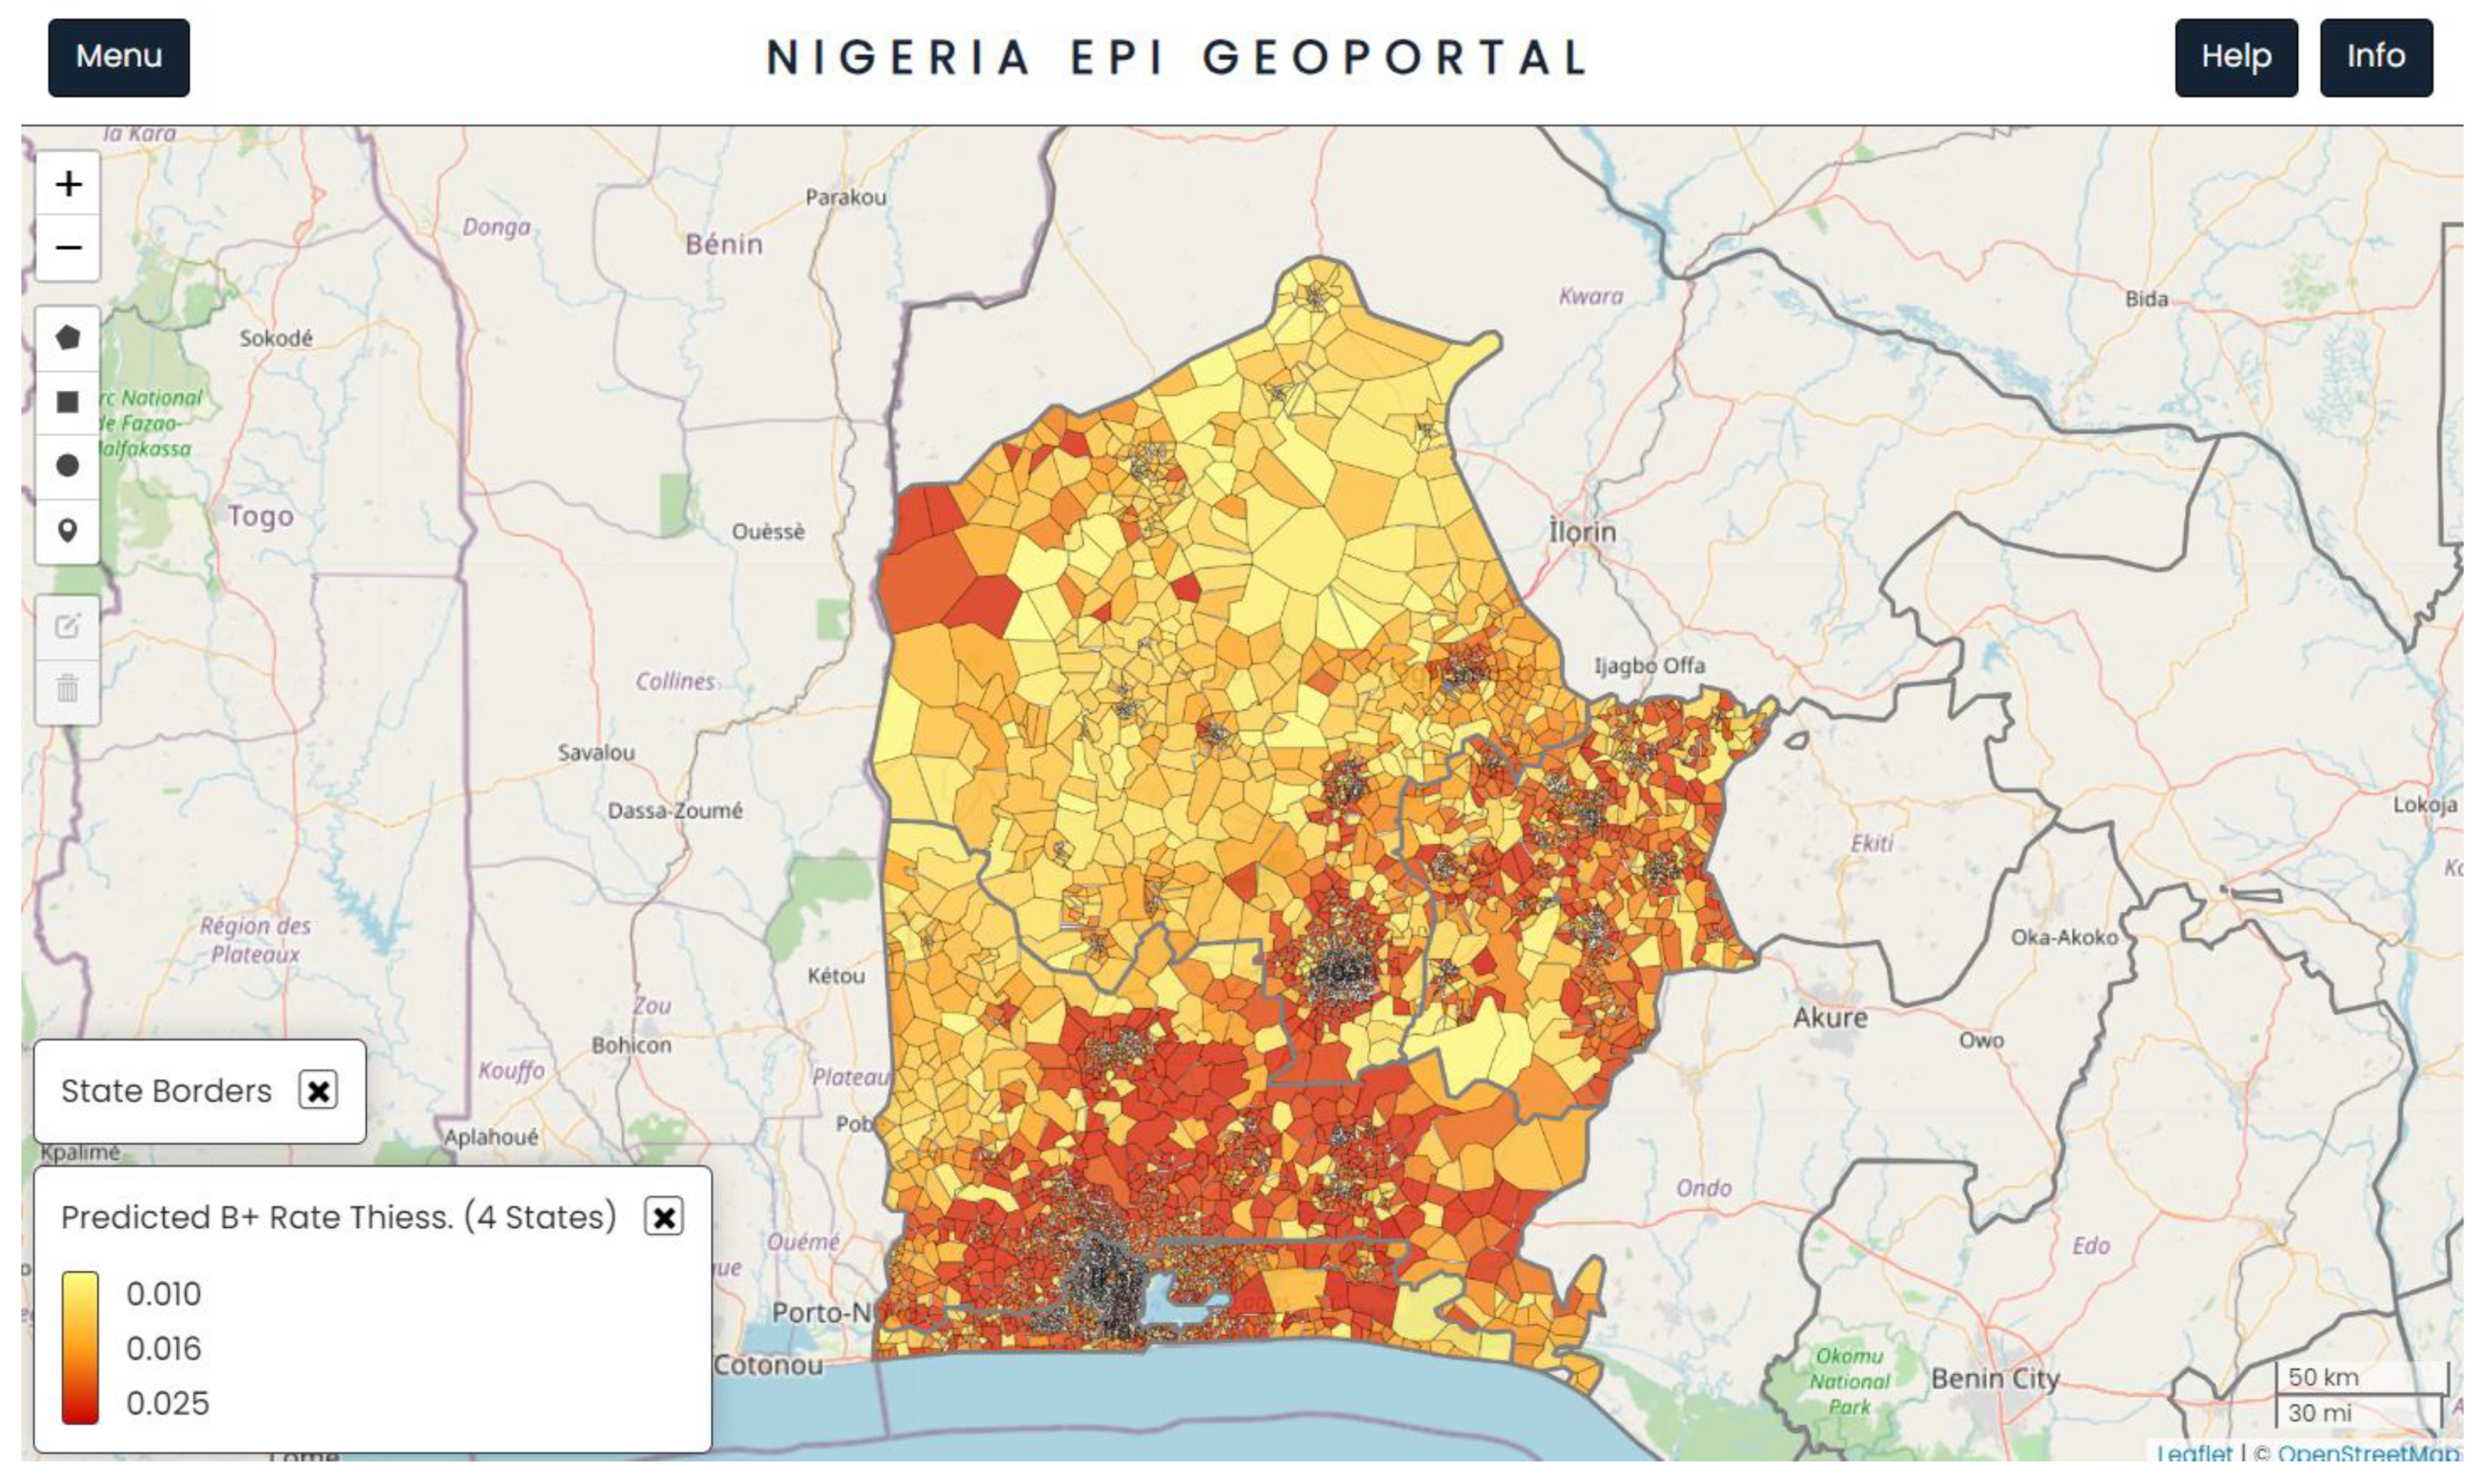
Figure 2.
A visualisation from the TBLON 3 geoportal showing distribution of human settlements across the four states (within the population clusters) and the spatial distribution of predicted bacteriological TB positivity rate.
Figure 2.
A visualisation from the TBLON 3 geoportal showing distribution of human settlements across the four states (within the population clusters) and the spatial distribution of predicted bacteriological TB positivity rate.
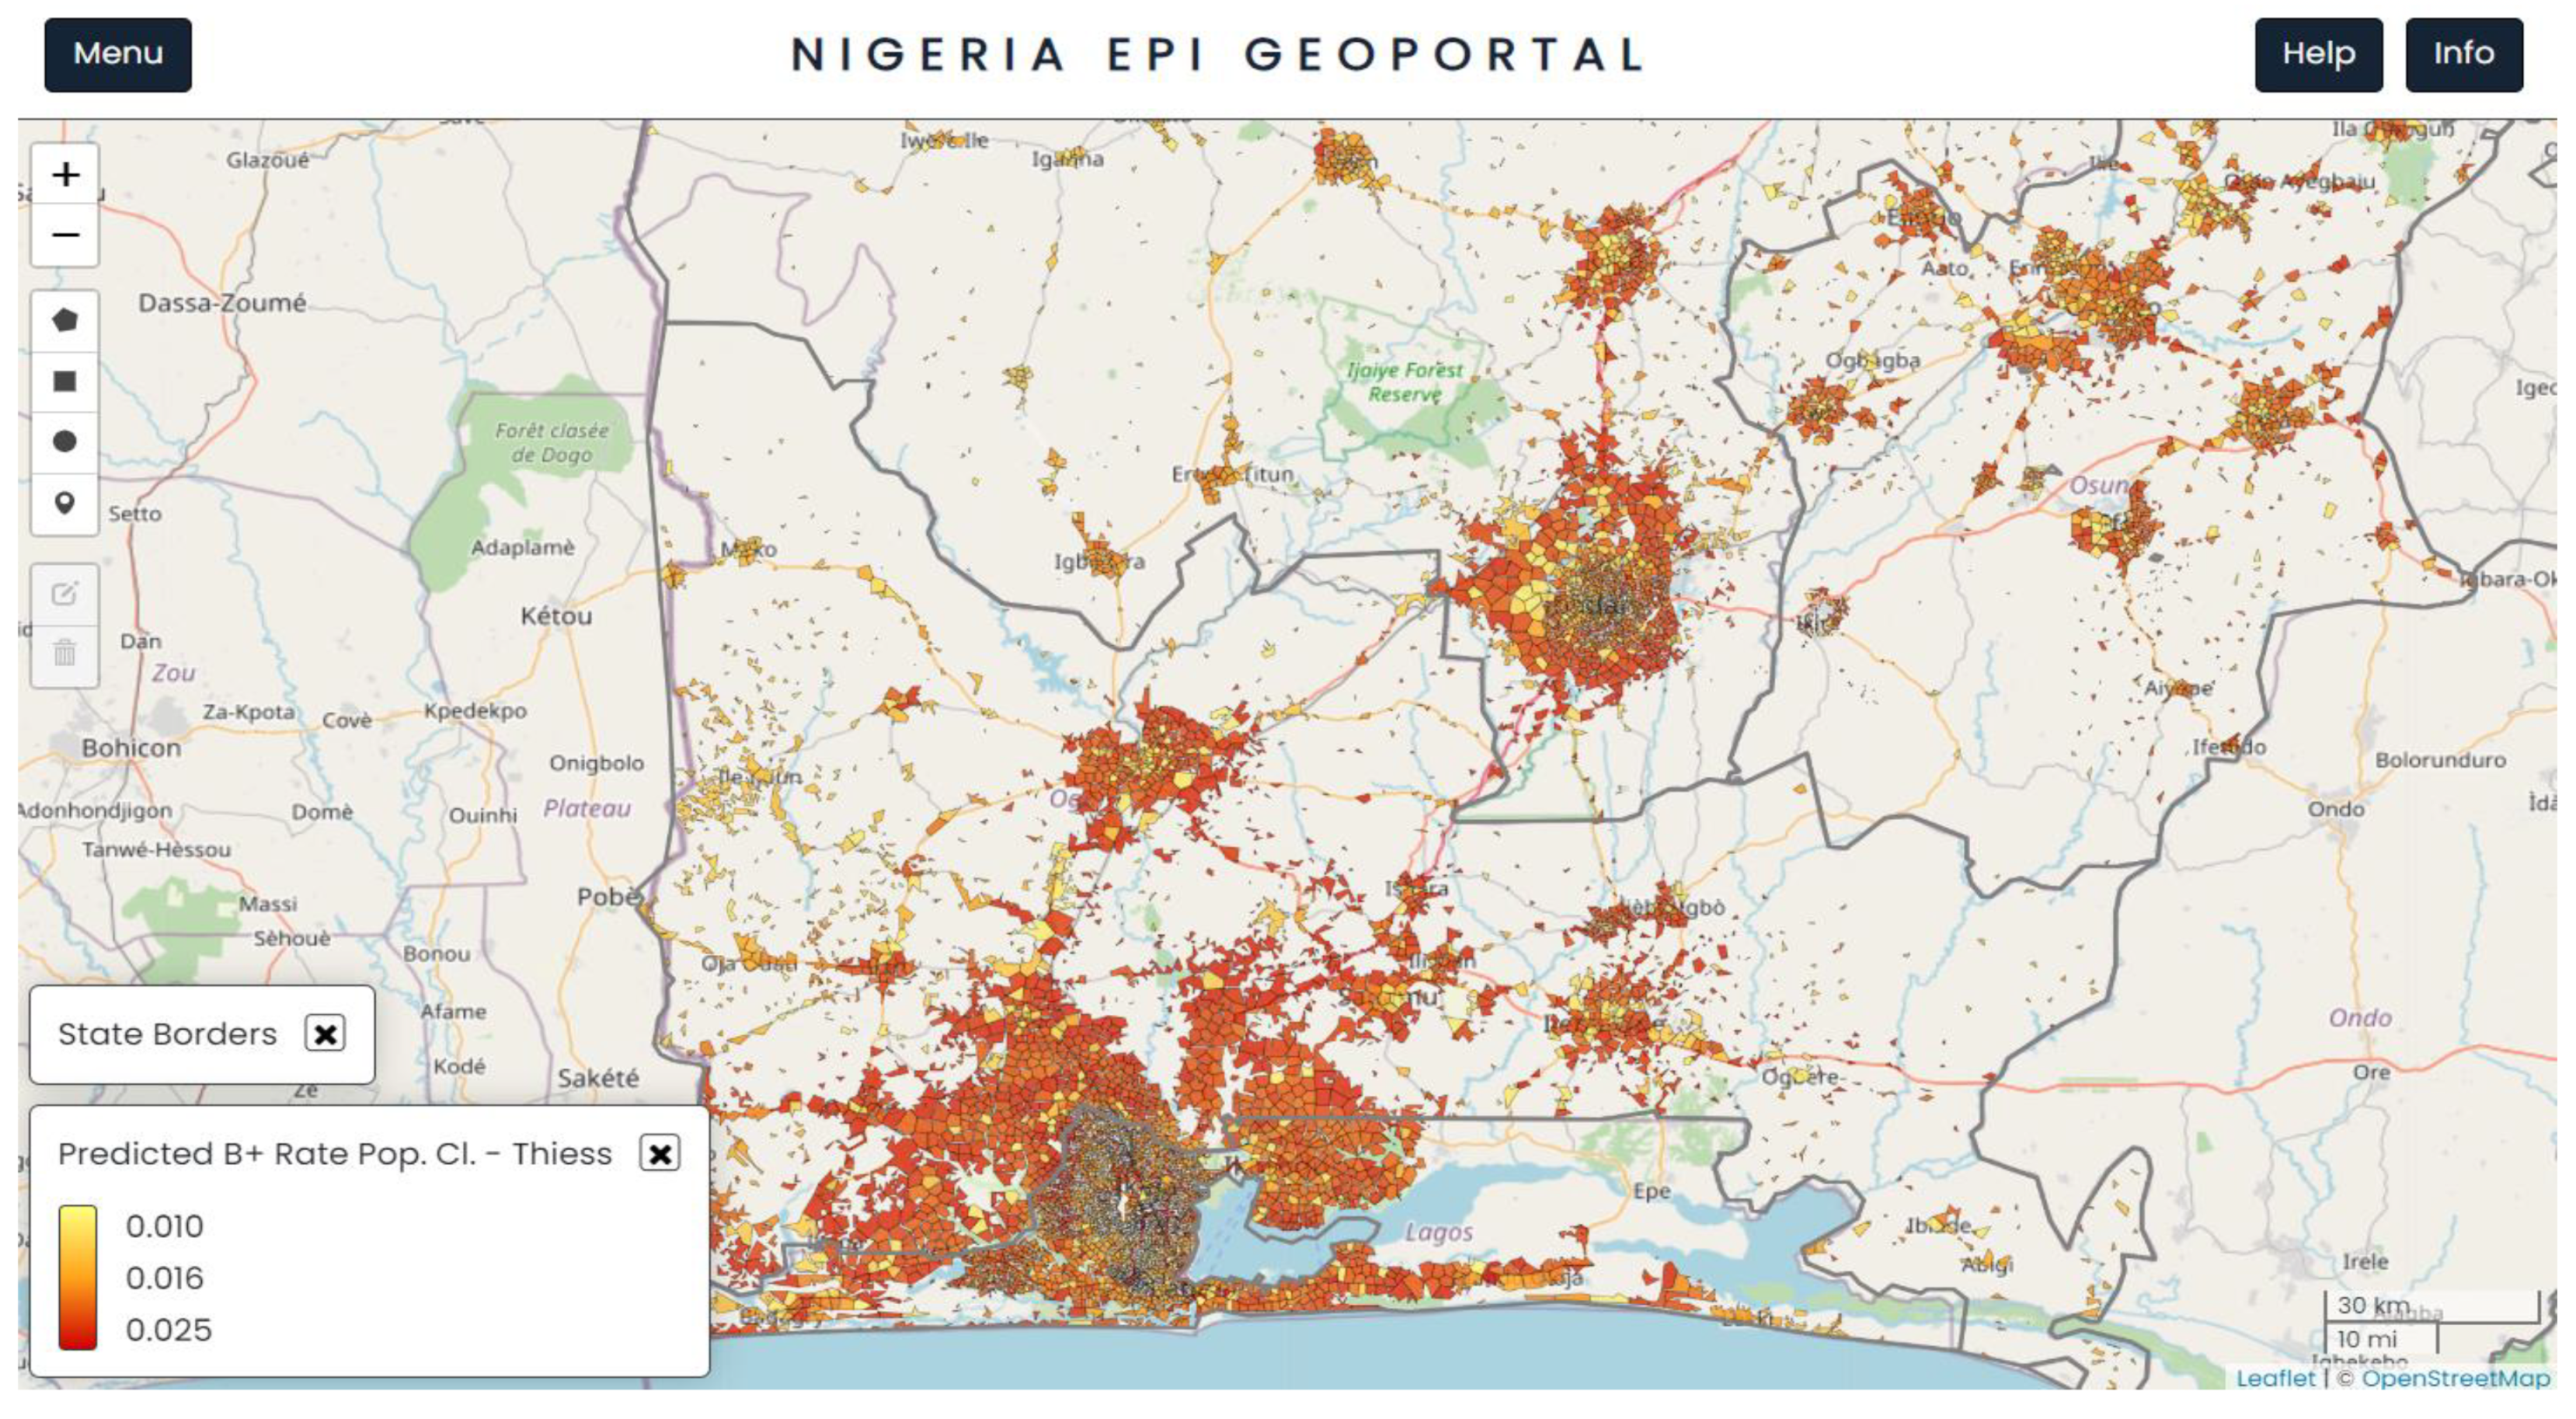
Figure 3.
A visualisation from the geoportal showing the spatial distribution of predicted bacteriological TB positivity rate in red and previous ACF activity in blue.
Figure 3.
A visualisation from the geoportal showing the spatial distribution of predicted bacteriological TB positivity rate in red and previous ACF activity in blue.
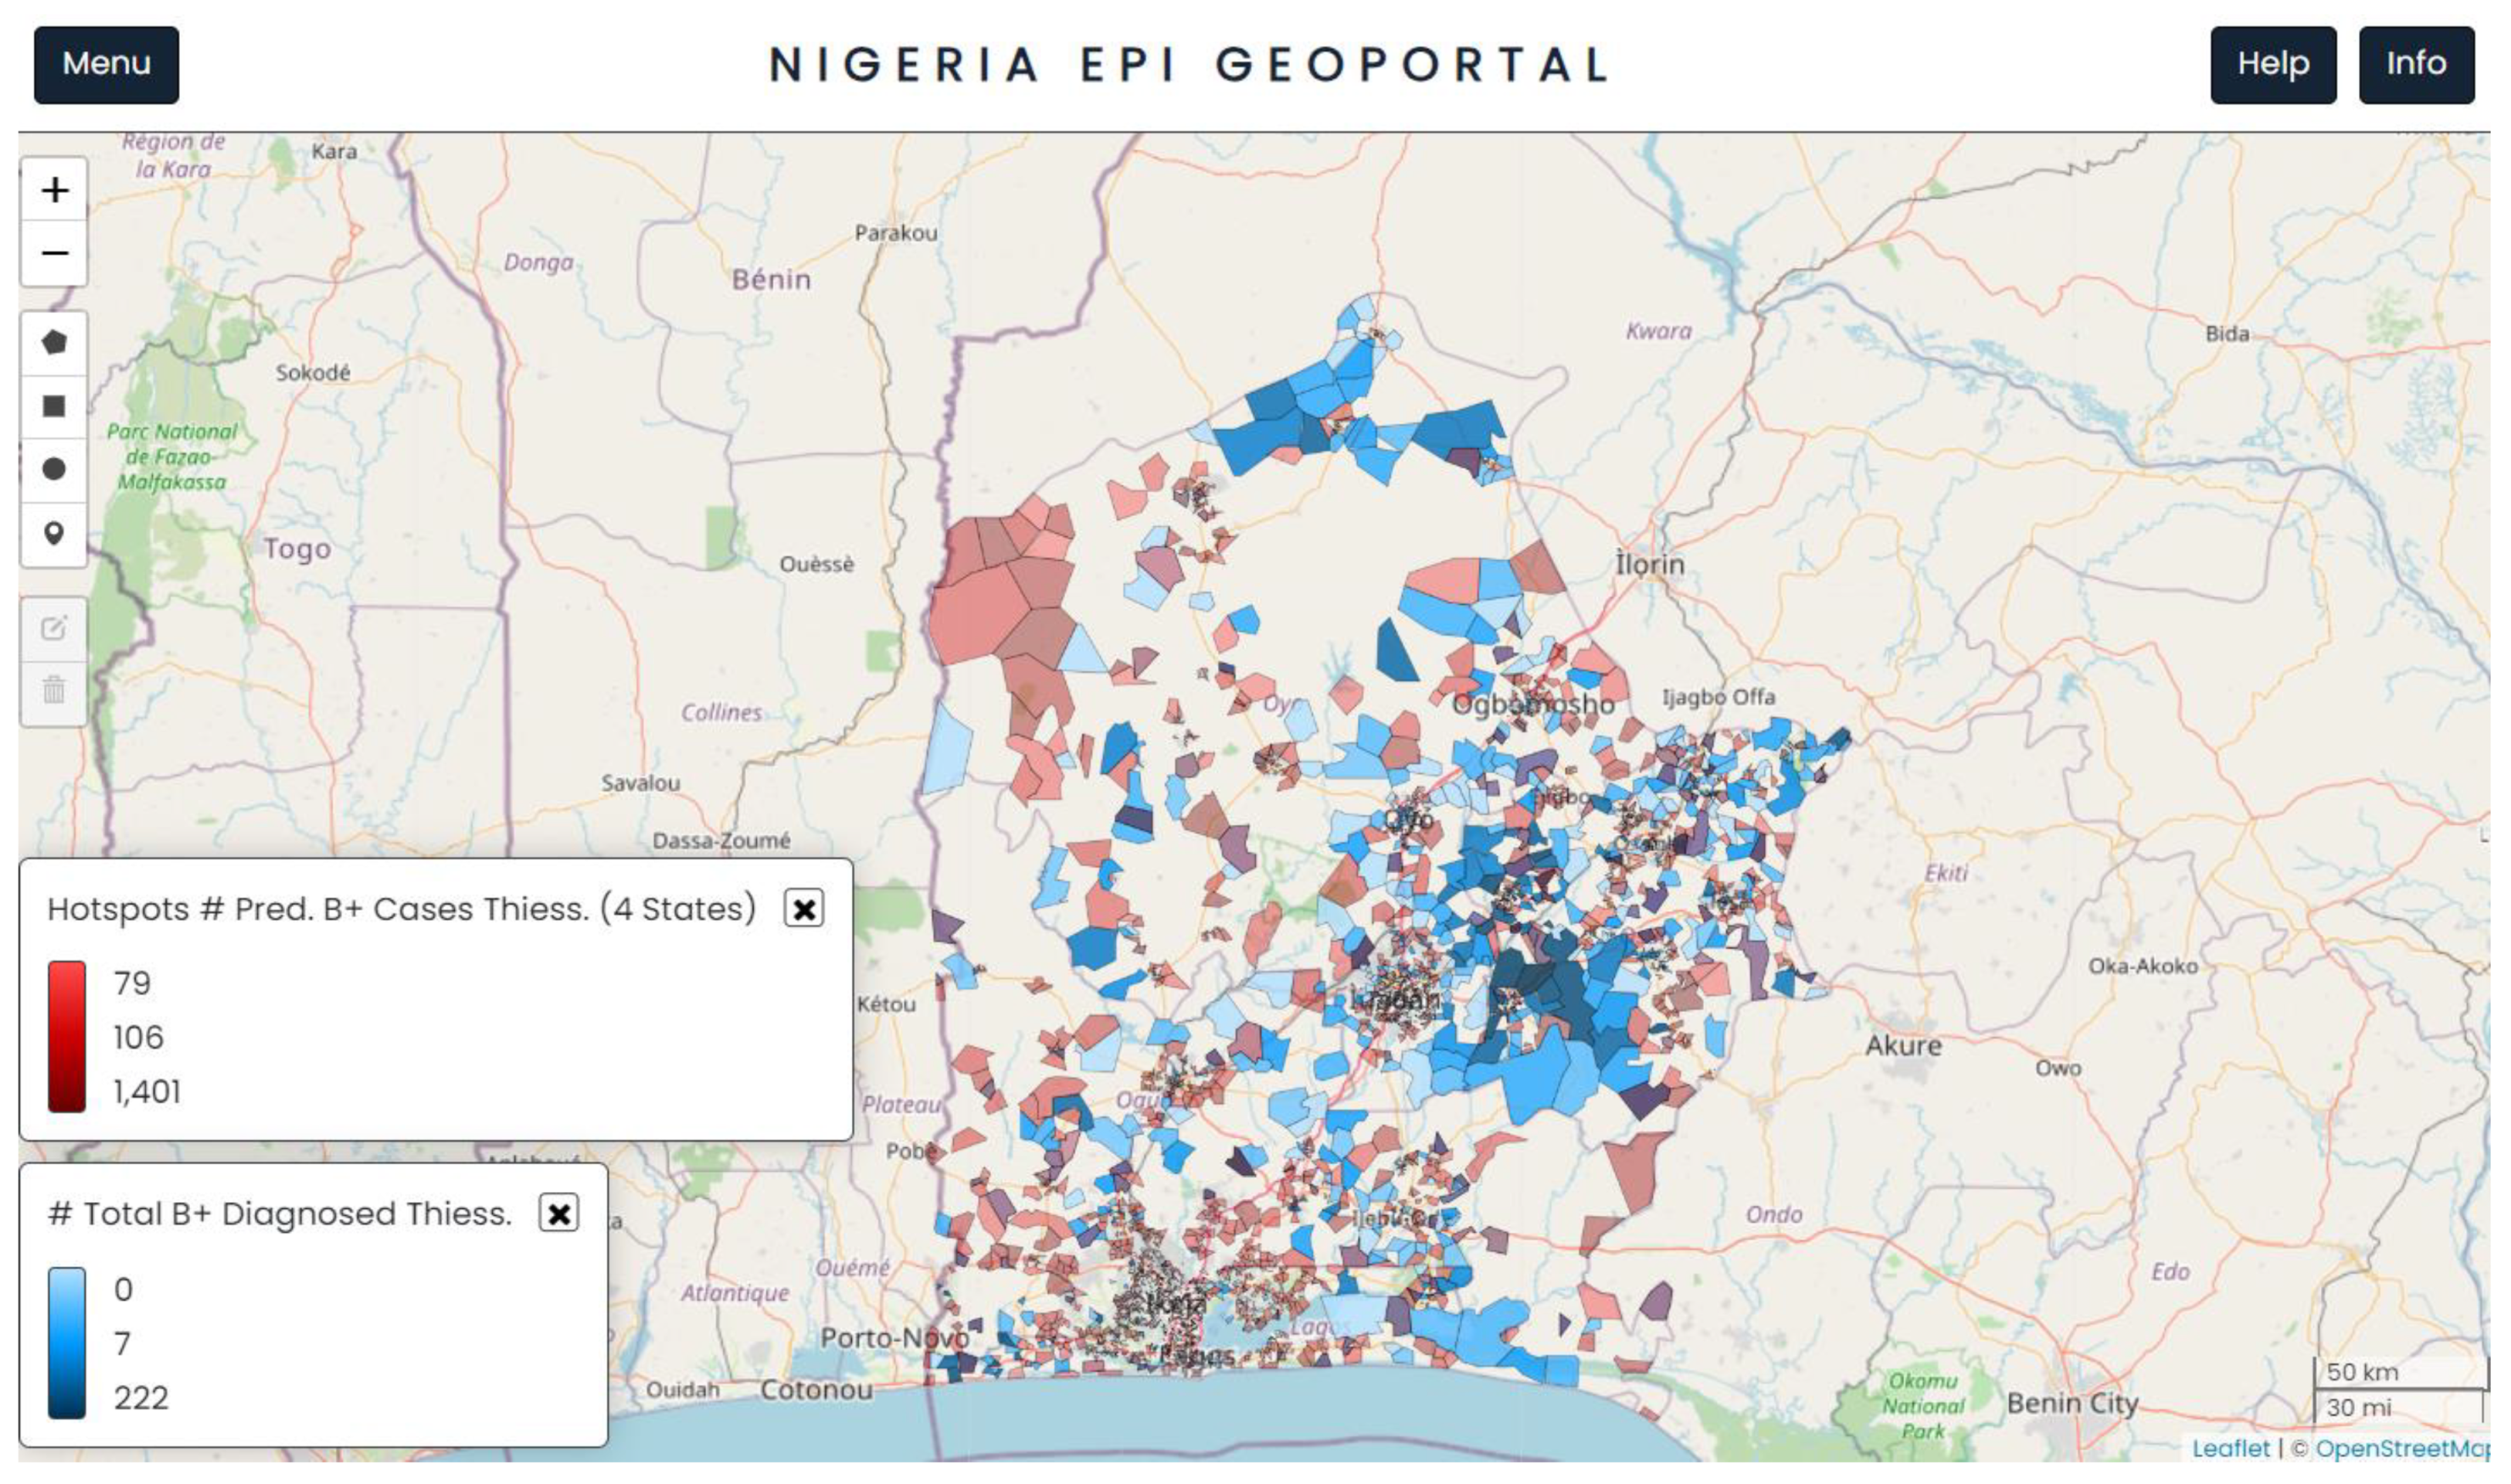
Figure 4.
Graphical comparison of median TB positivity yield obtained when ACF activity happened in the predicted hotspots in comparison with other sites for each of the states.
Figure 4.
Graphical comparison of median TB positivity yield obtained when ACF activity happened in the predicted hotspots in comparison with other sites for each of the states.
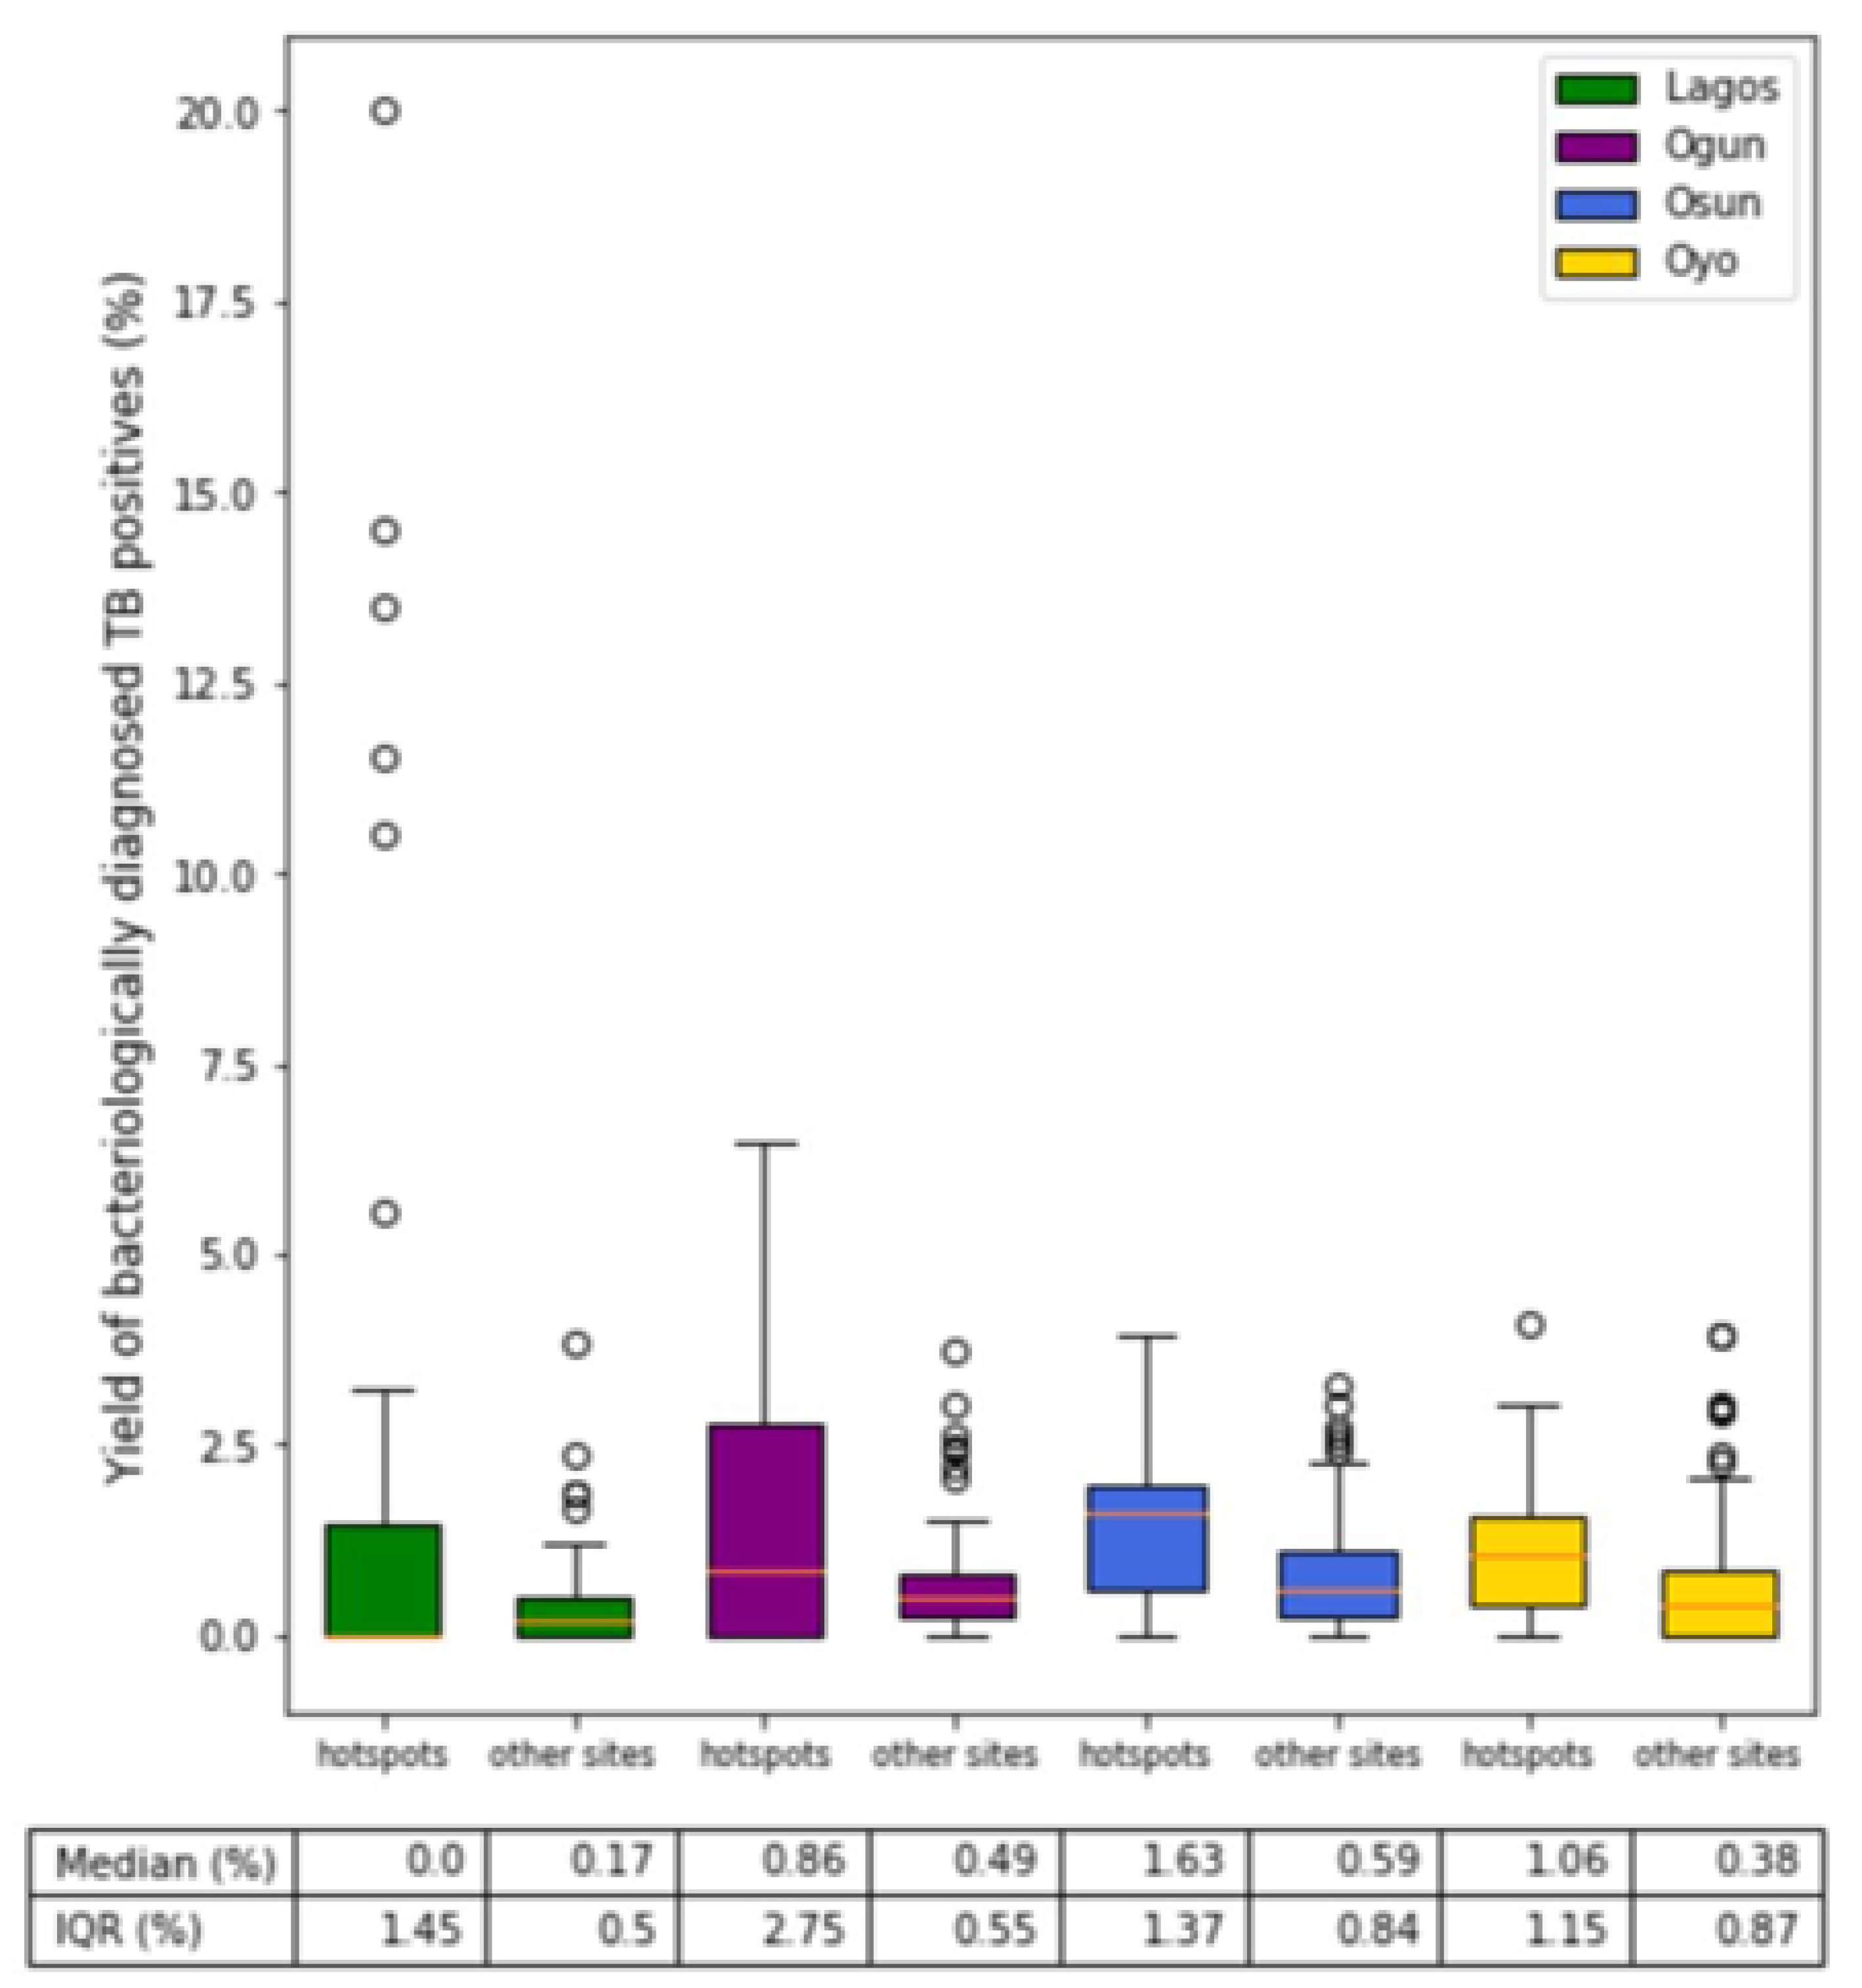

Table 1.
Description and sources of all variables used for training the predictive Bayesian inference model.
Table 1.
Description and sources of all variables used for training the predictive Bayesian inference model.

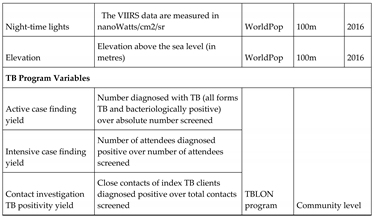
Table 2.
Administrative division and population distribution across the four states.
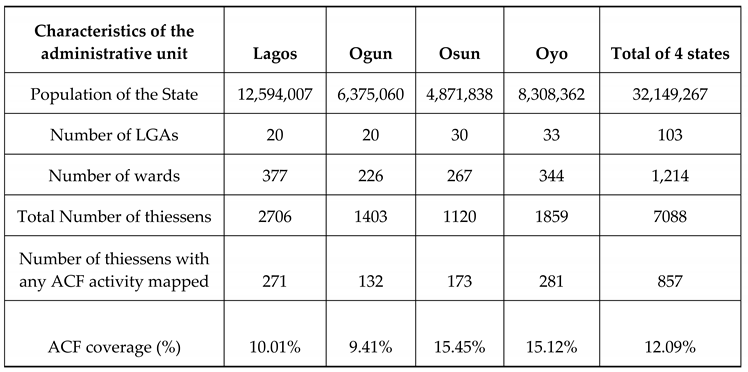
Table 3.
Comparative analysis of average ACF yields obtained in predicted hotspots and other sites separately for each of the states.
Table 3.
Comparative analysis of average ACF yields obtained in predicted hotspots and other sites separately for each of the states.
Disclaimer/Publisher’s Note: The statements, opinions and data contained in all publications are solely those of the individual author(s) and contributor(s) and not of MDPI and/or the editor(s). MDPI and/or the editor(s) disclaim responsibility for any injury to people or property resulting from any ideas, methods, instructions or products referred to in the content. |
© 2024 by the authors. Licensee MDPI, Basel, Switzerland. This article is an open access article distributed under the terms and conditions of the Creative Commons Attribution (CC BY) license (http://creativecommons.org/licenses/by/4.0/).
Copyright: This open access article is published under a Creative Commons CC BY 4.0 license, which permit the free download, distribution, and reuse, provided that the author and preprint are cited in any reuse.


