Preprint
Review

Effectiveness of Maximum, Explosive and Combined Strength Training on Endurance Runners Performance Indicators: A Systematic Review and Meta-Analysis

Altmetrics

Downloads

270

Views

222

Comments

0

A peer-reviewed article of this preprint also exists.

Submitted:

02 March 2024

Posted:

04 March 2024

You are already at the latest version

Alerts
Abstract
The effectiveness of combining strength-specific training with endurance training to enhance the performance of endurance runners remains uncertain. This study aimed to analyze effect of practising maximum-strength (MAX), explosive strength (EXP) or both combined (COMB) on seven runners’ performance-indicators: vertical jump (VJ), one-repetition-maximum-squat (1RM), peak-velocity/peak-running-speed (PV), lactate-threshold (over incremental-test-protocols, LT), middle-distance-time-trial (TT), maximum-oxygen-consumption (VO2max), running-economy (RE). Systematic-review (Scopus, Wed of Science, Sports Discuss, PubMed) with meta-analysis was conducted following PRISMA standards. Inclusion-criteria (PICOS) were: recreational or well-trained athletes aged 18-45 performing concurrent-training ≥five-week. Used search-terms were related to different types of strength/endurance, participants’ age, sport-modality. 20 manuscripts were selected, quality-assessed with PEDro. MAX training is more effective than EXP, COMB in improving VJ, 1RM, PV, while COMB is more effective than MAX, EXP to enhance TT. MAX is more effective than EXP in improving LT. Concurrent-workouts do not provide additional benefits to VO2max. It is unknown which strength-modality (MAX, EXP or COMB) is more effective in improving RE. Concurrent-training is more effective than single-mode-endurance-training for enhancing specific performance-variables in adult-endurance-runners. Middle-, long-distance-runners may consider incorporating MAX-training to target specific goals, e.g., improving VJ, 1RM, LT, PV while utilizing COMB-training to enhance TT. Certain variables may benefit from EXP. New randomized-controlled-trials are required to confirm these findings.
Keywords: 
Subject: Medicine and Pharmacology  -   Orthopedics and Sports Medicine

1. Introduction

The objective of middle- and long-distance running is to enhance athletic performance. Traditionally, the critical factors believed to determine endurance performance have included maximum oxygen uptake (VO2max), running economy (RE) and lactate threshold (LT [1,2]). However, in recent years, regular improvements in endurance performance have been observed without a proportional increase in VO2max [3] and weak correlations have been found between VO2max and endurance performance in experienced athletes [4]. Furthermore, modern endurance runners exhibit VO2max and LT values similar to previously seen [2,5]. Therefore, the current approach uses RE, velocity at VO2max (vVO2max) and endurance-specific muscle power as key indicators of endurance performance [5]. Similarly, Jones et al. [6] note that individual factors like VO2peak, the oxygen cost of running [7], and lactate-related metrics lack significant correlations with marathon performance, combining these variables can predict marathon times effectively. Additionally, some authors argue that peripheral factors such as enhanced neuromuscular function, increases in motor neuron excitability and musculotendinous stiffness are crucial for sustaining high running speeds when a greater contribution of the anaerobic system is required, particularly in the final phases of the race or end-spurt [2,8,9].
Therefore, adding strength training to the endurance training programs of middle- and long-distance runners —known as concurrent training [10]— plays an essential role. When endurance athletes incorporate strength training, they can achieve several important adaptations as described in the literature [3,4,11,12,13,14,15,16]. These adaptations include reducing the required force for the same workload, resulting in energy conservation and delayed onset of fatigue. They include enhanced neuro-muscular function, characterized by improved motor unit recruitment and synchronization, activation frequency, intermuscular coordination, neural inhibition and rate coding. At the muscle-tendon level, there is a delayed activation of type IIa fibres due to the prolonged utilization of type I fibres. This may result in a potential transformation of fast-twitch fibres into intermediate fibres (IIa), an improved muscle stretch-shortening cycle, enhanced muscle-tendon stiffness and an increased cross-sectional area of the Achilles tendon [17].
Furthermore, strength training increases muscle glycogen availability and augments anaerobic enzyme activity. These combined improvements can lead to enhanced performance across key indicators such as LT, RE [3,5], and particularly vVO2max, an essential performance variable that combines VO2max and running economy and allows the identification of aerobic differences among runners, which cannot be attained with VO2max or RE alone [18].
However, successfully combining strength and endurance represents one of the greatest challenges in training prescriptions for coaches due to its complexity [10]. Indeed, strength and endurance events have traditionally been categorized as opposing activities when considering performance duration and energy metabolism [19]. The potential endurance and strength adaptations obtained may be attenuated. This phenomenon is called interference or concurrent training effect [3,20]. Thus, it must be considered that while endurance training increases the capillary luminal diameter and number, increases mitochondrial density and decreases the muscle fibre size [21], strength training generates the opposite effects [19,22].
Whereas there is support for the beneficial effects of incorporating strength training into endurance programs, there is also evidence of potential interference effects. Some studies have found that strength programs improved endurance athletes´ performance [3,23], whereas others have not [24,25,26]. The discrepancies found between studies could be related to the following aspects: developing different types of strength, using different training methods [11,19,27], athletes’ training history, modality of aerobic training, intervention duration [28] and difficulties in transferring strength gains to running technique [13,29].
Thus, there is a lack of consensus on the types of strength training suitable for concurrent programs in endurance athletes. Maximum strength (MAX), explosive strength (EXP) or a combination of both (COMB) are commonly used in concurrent training protocols. Maximum strength refers to the highest force exerted during a single lift or an isometric contraction [30] and explosive strength results from the relationship between the force produced and the needed time for its application [31].
Some previous studies concluded that EXP could yield better results than maximum strength [32], whereas other research reported the opposite [33]. However, due to limited research, it was impossible to determine which type of strength enhances further endurance performance [12]. Moreover, studies recommend combining MAX and EXP with endurance training for better results [2,34]. Therefore, further research is needed [2,5]. New research should include adequate training protocols and assessments, and the interventions should be longer than in the current publications [5]. New studies could also be useful to clarify the effects of adding COMB training to endurance training [2].
Furthermore, it is also necessary to conduct new systematic reviews since recent randomized controlled studies have not been included yet. Also, some systematic reviews included different sports despite the existing differences between activities such as cross-country skiing, cycling and running [11]. Moreover, some reviews have exclusively focused on RE [11,35]. As a result, it is necessary to examine the effect of concurrent training programs on a comprehensive range of endurance performance variables and to compare the effect of adding MAX or EXP strength or COMB to endurance training. Thus, on the one hand, it could be expected that MAX training enhances endurance athletes´ performance by improving agonist-antagonist muscle coactivation [36], intra- and intermuscular coordination and running technique. Additionally, MAX training may reduce the relative workload due to increased strength [37,38]. On the other hand, EXP could enhance endurance athletes' performance by improving motor unit synchronization, increasing muscle power and elastic return and improving muscle-tendon rigidity [37,39]. Finally, combining COMB training with endurance training protocols could benefit both regimens (MAX and EXP) and might be useful to promote a post-activation potentiation response [40].
Therefore, this study aims to systematically review the literature and conduct a meta-analysis to determine the effect of MAX, EXP or COMB on various performance indicators of endurance runners. Specifically, we aimed to compare the effects of these three strength regimes on vertical jump (VJ), one-repetition maximum squat (1RM), peak velocity or peak running speed (PV), LT (measured in incremental test protocols), middle-distance time trial (TT), VO2max and RE. We hypothesized that concurrent training combining endurance and MAX, EXP or COMB strength training would improve specific performance variables of adult endurance runners compared to single-mode endurance training. We further hypothesized that concurrent training would not confer an advantage in improving VO2max. Finally, we hypothesized that adding COMB to resistance training would be more effective than adding only MAX or EXP.

2. Materials and Methods

A systematic review with meta-analysis was conducted following the PRISMA (Preferred Reporting Items for Systematic Reviews and Meta-Analyses) checklist and statement. The study was registered under code PSU IRB-2022-11-0134 at Prince Sultan University's Institutional Review Board.
The PICOS (Population, Intervention, Comparison, Outcomes, Study design) tool for quality systematic reviews was used to elaborate with rigour and accuracy the inclusion and exclusion criteria applied in the selection of the manuscripts finally included in the present study (Table 1 [41]).
For the screening process, the following electronic databases were searched: PubMed, SPORT Discus, Web of Science and Scopus. The period screened was until June 30, 2023.
The search process involved an examination of the title, abstract and full-text fields of the manuscripts. Each of these sections was evaluated according to predetermined inclusion and exclusion criteria. The search algorithm used in the previously mentioned databases was: (adult OR middle-aged OR college-aged) AND (concurrent OR concomitant OR combined OR added OR complex) AND (maximum strength OR explosive strength OR resistance OR plyometric OR reactive strength) AND (performance OR running OR function OR effect OR gain OR improvement OR adaptation OR indicator OR parameter OR variable OR response OR race OR running economy OR energy cost) AND (runner OR endurance athlete OR middle-distance OR long-distance) NOT (youth OR elderly OR adolescent OR patient OR disease OR syndrome OR injury OR sedentary OR obese OR supplementation OR animal).
The screening was limited to articles published in English or Spanish. The search and selection process of the articles was conducted by two of the main researchers of this study, using the double-blind method (PP-G and JS-I) Possible discrepancies between both researchers were solved consensually by another researcher (FHY). The flow diagram of the study selection is shown in Figure 1.
Regarding the data collection process from the selected studies, the means and standard deviations before and after the implementation of the training protocols were recorded (pre- and post-test). This information was obtained directly from the tables provided in the articles. In those publications where the data were not available, the authors of the articles were contacted to request this information. When the authors did not respond, the GetData Graph Digitizer and Plot Digitizer programs obtained means and standard deviations. When the information was flagged or incomplete, it was not included in the meta-analysis. In the cases where more than one measurement of the same variable was provided, we chose the test with the highest validity and reliability index, according to the age and characteristics of the subjects in the present study.
The variables analyzed in the meta-analysis of the present study were seven: vertical jump (VJ), 1RM, RE, VO2max, TT, LT (measured in incremental test protocols) and PV.
The PEDro (Physiotherapy Evidence Database) scale was utilized to examine the internal validity, risk of bias and methodological quality of the studies selected for this research [42]. Two investigators carried out this evaluation process independently, and once completed, the inter-rater reliability was calculated. The PEDro scale is composed of 11 dichotomous items. The first is not evaluable, whereas the remaining 10 are scored with 0 or 1. Therefore, the final result is between 0 and 10. A higher score indicates high methodological quality, and a lower score a risk of bias. PEDro scores were interpreted as follows: 0-3: poor quality, 4-5: fair quality, 6-8: good quality, 9-10: excellent quality [43].
All analyses were performed using the Comprehensive Meta-Analysis software, version 2 (Biostat Inc., Englewood, United States). Hedges' g effect size (ES) —a variation of Cohen's d— was used to correct for sampling bias, considering the small sample size. The values of 0.2, 0.5, 0.8 or 1.2 for ES indicate small, medium, large or very large overall effects, respectively [44]. ES values and their 95% confidence intervals [CI] were calculated using the mean from study groups and pre- and post-test trials, standard deviation and total sample size. Between-group comparisons were performed when the same variable (i.e., VO2max, RE) was reported at least in two different studies for each group (CON, MAX, EXP or COMB). The heterogeneity was determined by examining the Q test and the I2 value. The heterogeneity represents the percentage of variance due to between-study factors rather than sampling error. Therefore, it was calculated as I2 [45]. The heterogeneity (I2) values of 25%, 50, and 75% were used for the small, medium and large levels [46]. The fixed effects model was used when there was no significant heterogeneity between studies, and the random effects model was applied when significant heterogeneity was found [47]. The significance level was set as p<0.05.

3. Results

3.1. Study selection

In the initial search, a total of 1185 articles were identified. Furthermore, three studies were included as they were identified in previously published articles (systematic reviews and primary research). Subsequently, 182 duplicate articles were removed. The publications were then filtered based on title (n=137) and abstract (n=691) and further refined by population (n=53), intervention (n=44), comparison (n=17), outcomes (n=26) and study design (n=38). Consequently, an additional 178 articles were excluded. Thus, the final number of articles included in the present study was 20 (see Figure 1). The interrater reliability (IRR) was estimated at 95.1% and the Cohen's kappa was 0.89.

3.2. Study Characteristics

As explained in Table 1, only the experimental groups that performed MAX, EXP or COMB interventions were included in the meta-analysis. The total number of subjects included in the study was 451 (342 males and 109 females). All of them were middle- or long-distance runners (recreational or well-trained), aged between 18 and 45 (See Table 2).
Moreover, the strength and endurance training programs undergone by the groups included are shown in Table 3. Of all the studies selected, 11 included experimental groups that performed MAX training [2,8,15,24,27,29,34,37,48,49,50], 10 EXP training [1,30,34,39,49,50,51,52,53] and six studies included experimental groups performing COMB training [2,4,20,36,46,54]. The intervention periods in 19 of the 20 studies were between 6 and 12 weeks, whereas, in the remaining research, the intervention lasted 40 weeks [4]. MAX groups performed non-running specific strength training exercises, focusing mainly on the lower extremities, except in four studies [24,36,46,48], where some trunk and upper body exercises were also practised. In most studies, multi- and single-joint exercises were used, except in two studies where only half-squat was performed [29,34]. Regarding the resistance used, in some studies, more emphasis was placed on the neural factors of strength [1,9,24,29] and in two studies on metabolic factors [2,34]. In other articles, the resistance applied was suitable for both neural and metabolic adaptations [26,36,46,48,49]. EXP training protocols included —in some cases — only exercises performed with one's own body, such as jumping, bounding and hopping [30,34,52,53]. In contrast, weight-training machines were also used in other interventions in addition to the previously mentioned exercises [39,46,49,50,51]. Most protocols consisted of performing between two and four sets and between five and 10 repetitions. Finally, the groups that underwent COMB training performed strength sessions where MAX exercises (mainly multi-joint) were combined with EXP exercises (i.e., horizontal or vertical jumps, hops and bounds). As for endurance training, many of the study participants in the 20 selected studies were required to continue their regular endurance training (see Table 3).

3.3. Risk of Bias within Studies

No studies were excluded based on PEDro score. In 19 of the studies included, the PEDro score obtained was 6, which reflects good quality, whereas, in one study, the score assigned was 5, which indicates fair quality (see Table 2). Therefore, the average PEDro score was 5.95±0.21. Moreover, the inter-rater reliability was IRR=96.66%, while Cohen's kappa was k=0.933.

3.4. Synthesis of Results

No significant differences were found at baseline for any parameters included in the meta-analysis. The results of the post-test are detailed below.

3.4.1. Vertical Jump

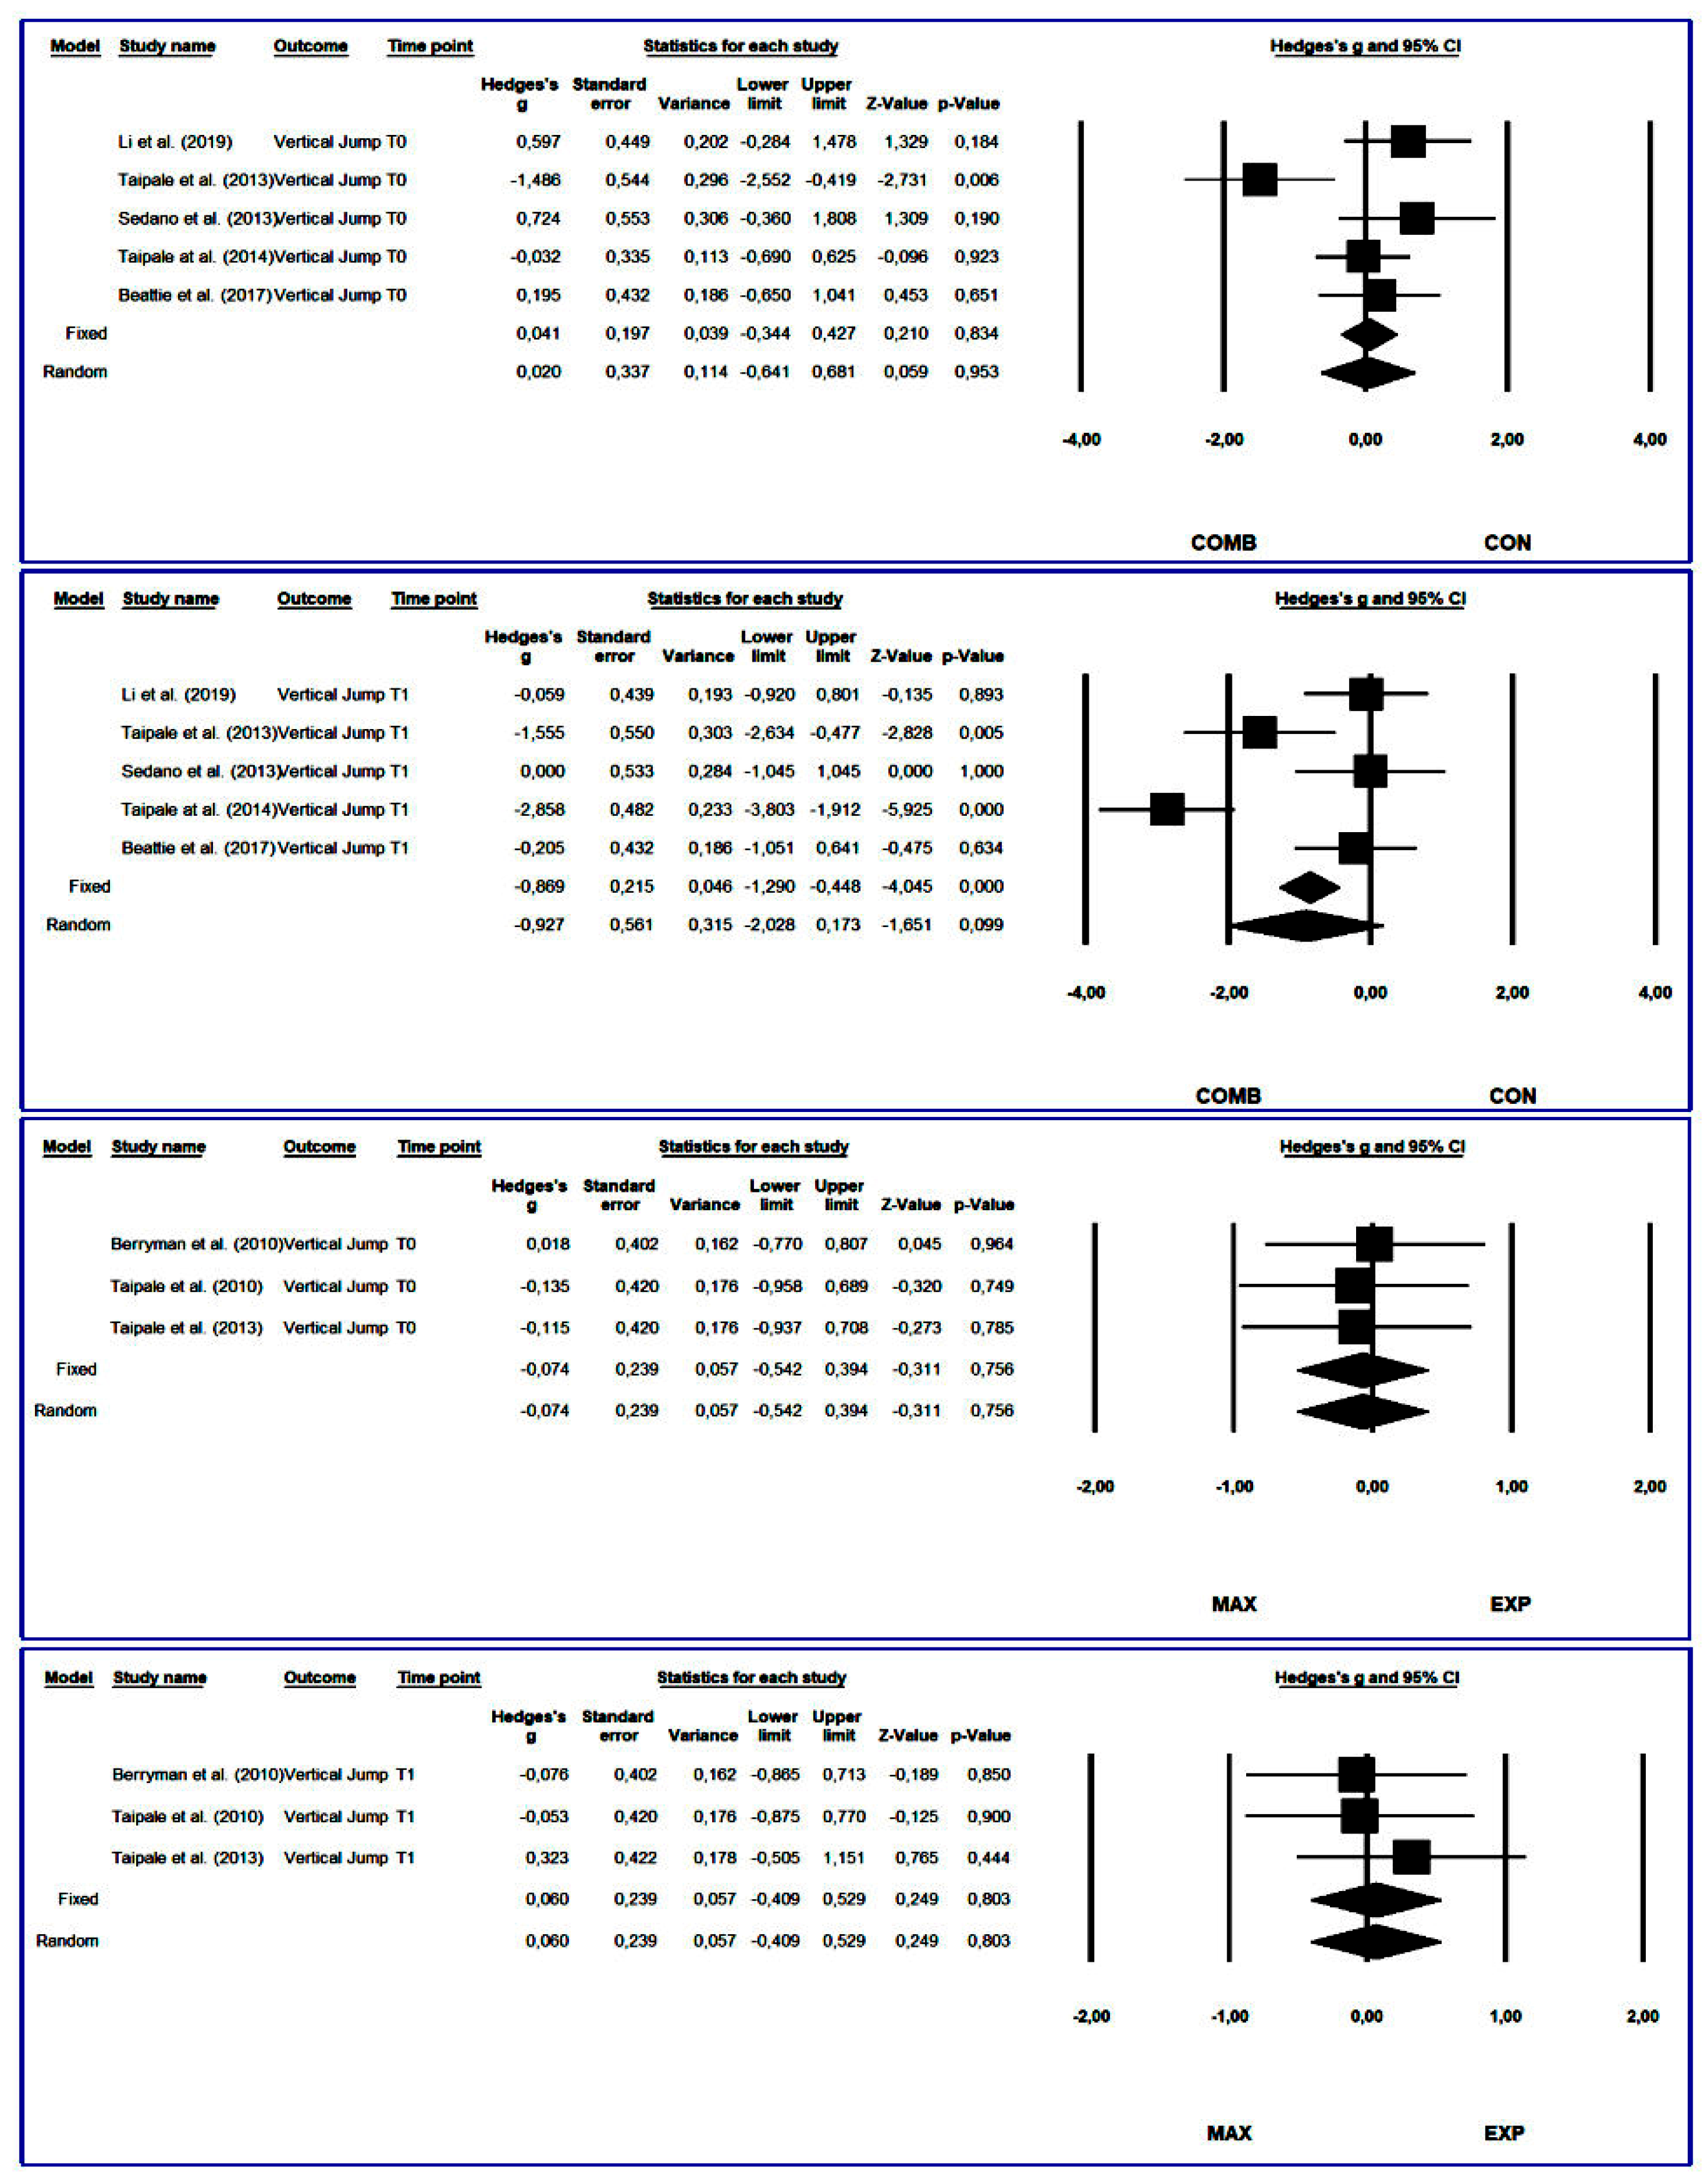
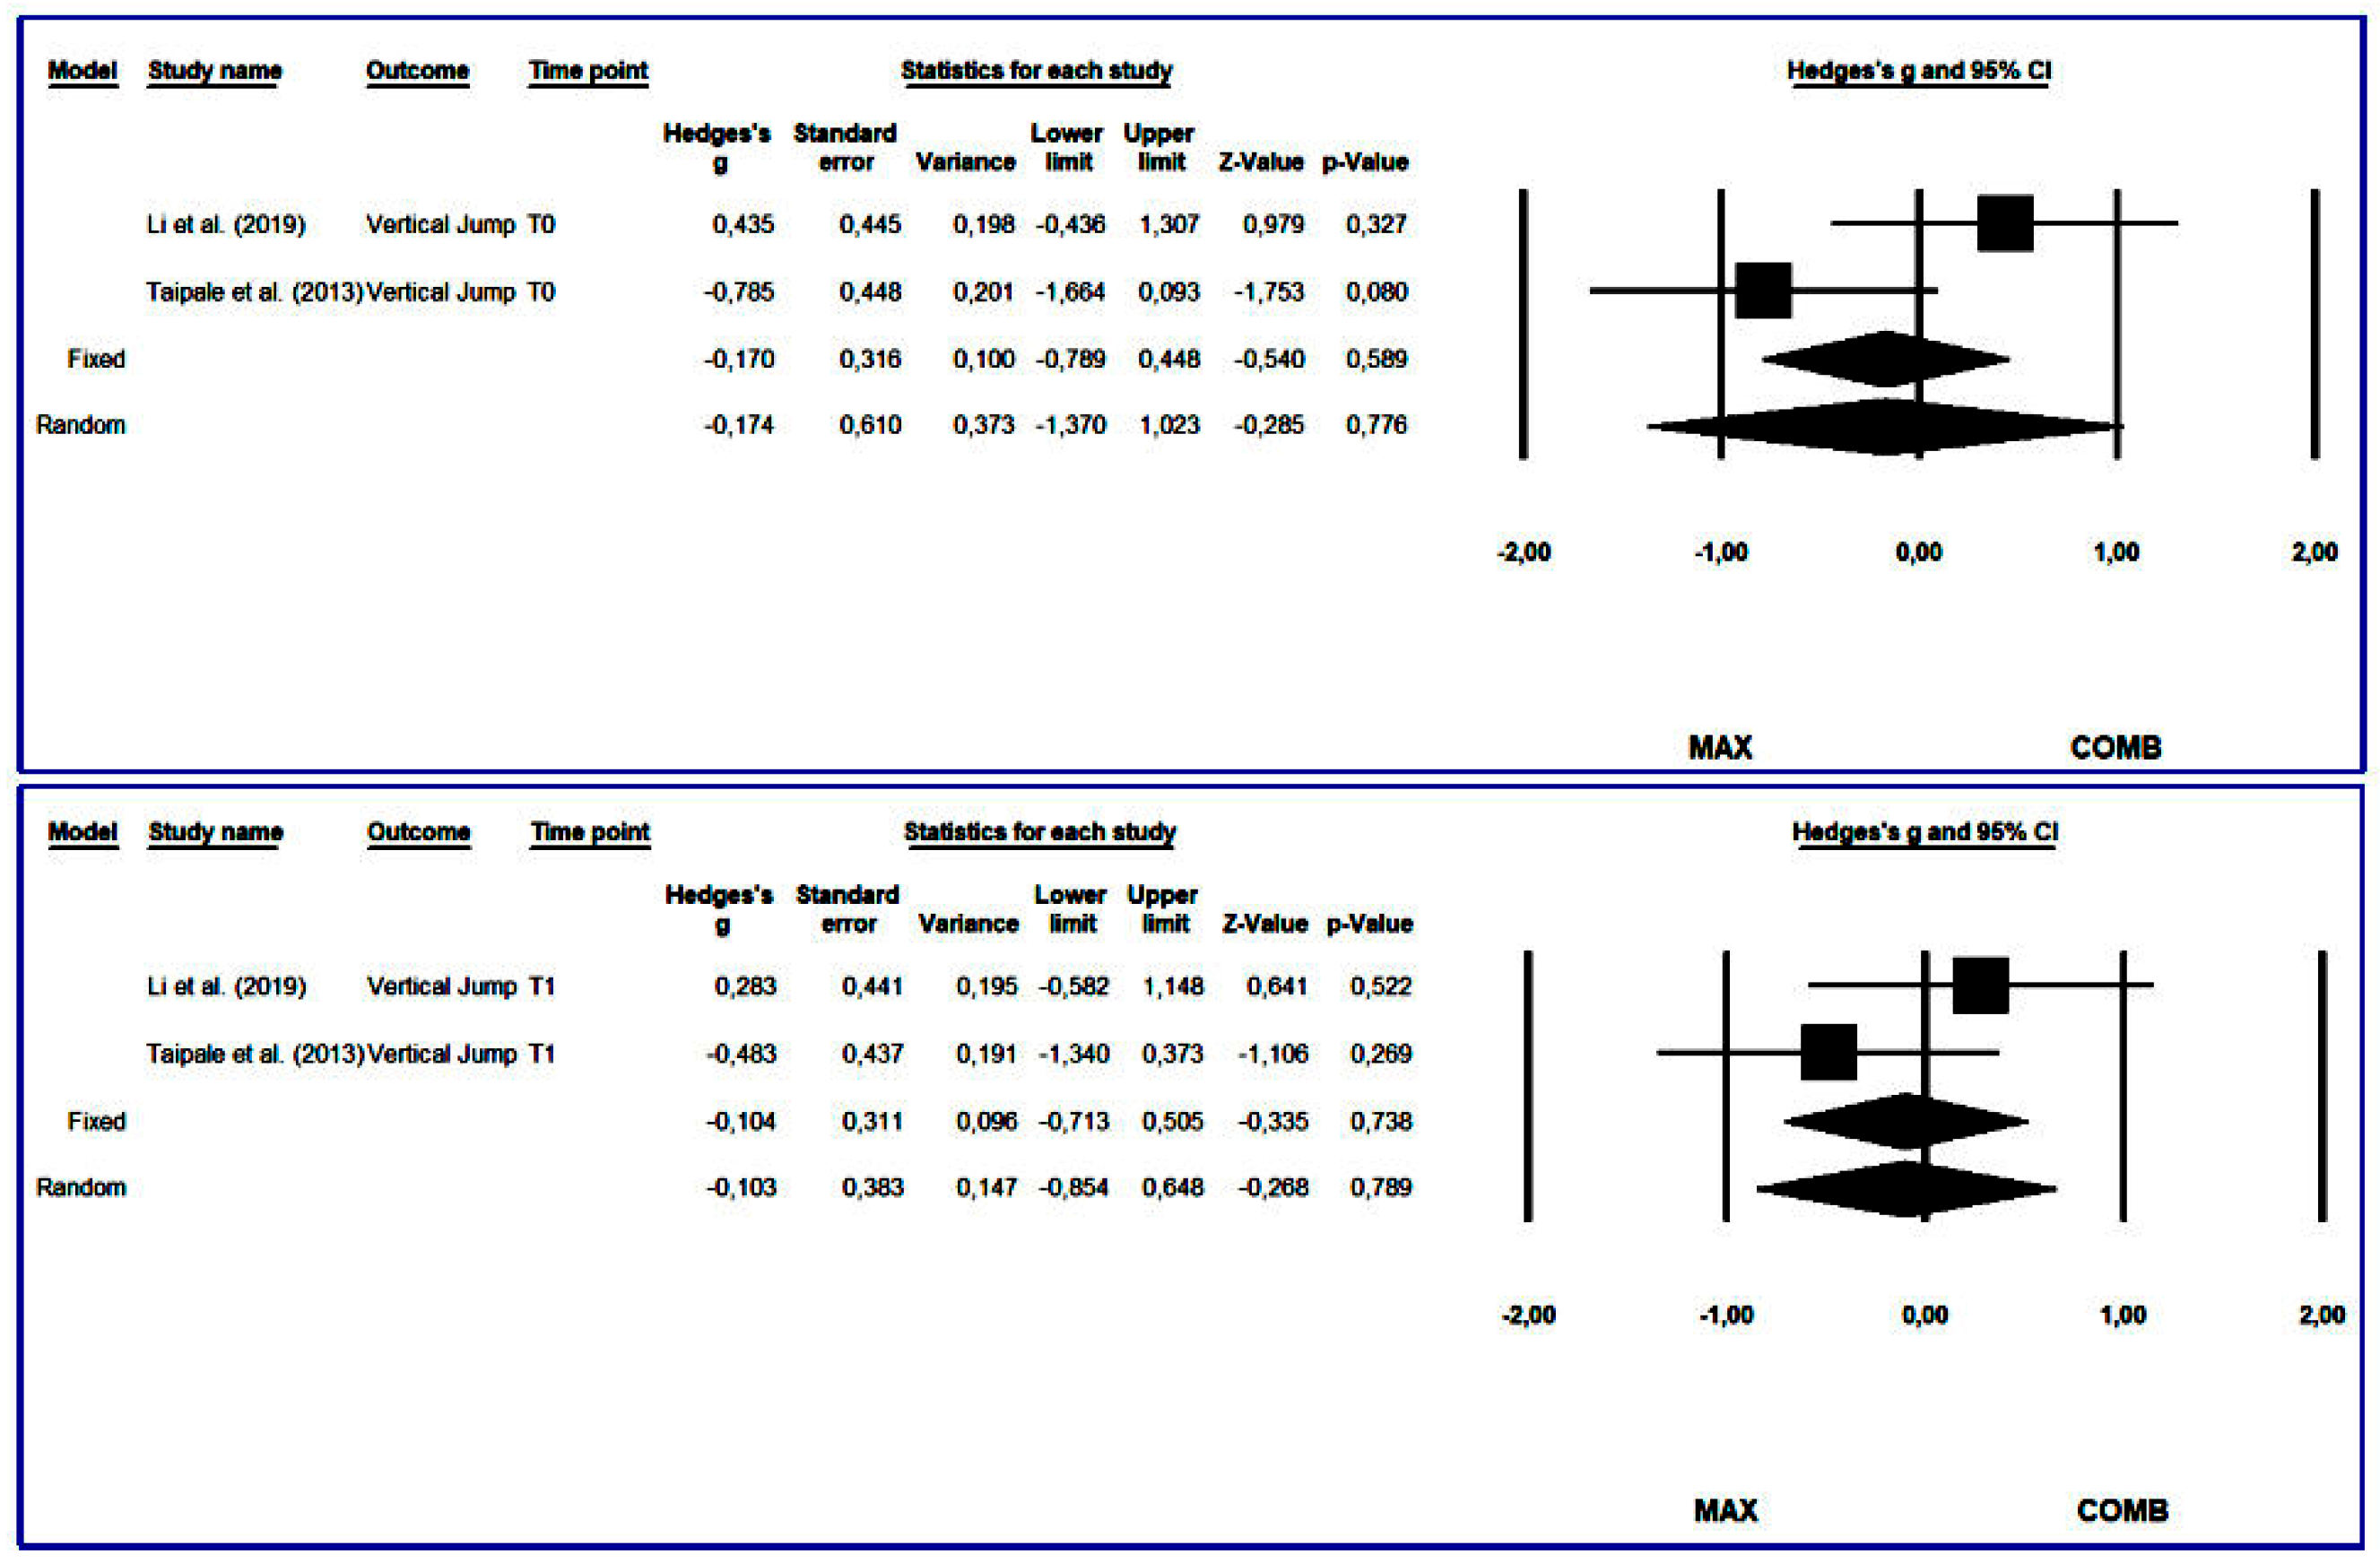
In the meta-analysis, it was found that MAX presented significantly better results than CON in the post-test: Hedges g [95%CI] -0.504 [-0.972--0.036]; ES=0.239; p=0.035; Q=4.097; I2=26.775; Figure 2). The ES and level of heterogeneity were small. Similarly, EXP marks were significantly better than those of CON (Hedges g [95%CI] -0.365 [-0.715--0.016]; ES=0.178; p=0.041; Q=8.469; I2=40.96%) being the ES very small and the heterogeneity small (Figure 2). No significant differences were found between CON and COMB (Figure 3), between MAX and EXP (Figure 3) and between MAX and COMB (Figure 4).
Moreover, of the 20 studies included in the meta-analysis, MAX [1,2,26,34,46,49] and COMB [2,4,20,46,54] training significantly improved VJ in all studies where those training regimes were applied, and VJ was assessed. In contrast, EXP training improved seven of eight studies [1,30,34,39,46,49,52,53]. Additionally, one study observed that the effect size of the improvement was larger in MAX than in EXP [1]. In another research, VJ improved significantly only during the preparatory period [49].

3.4.2. One-Repetition Maximum Squat

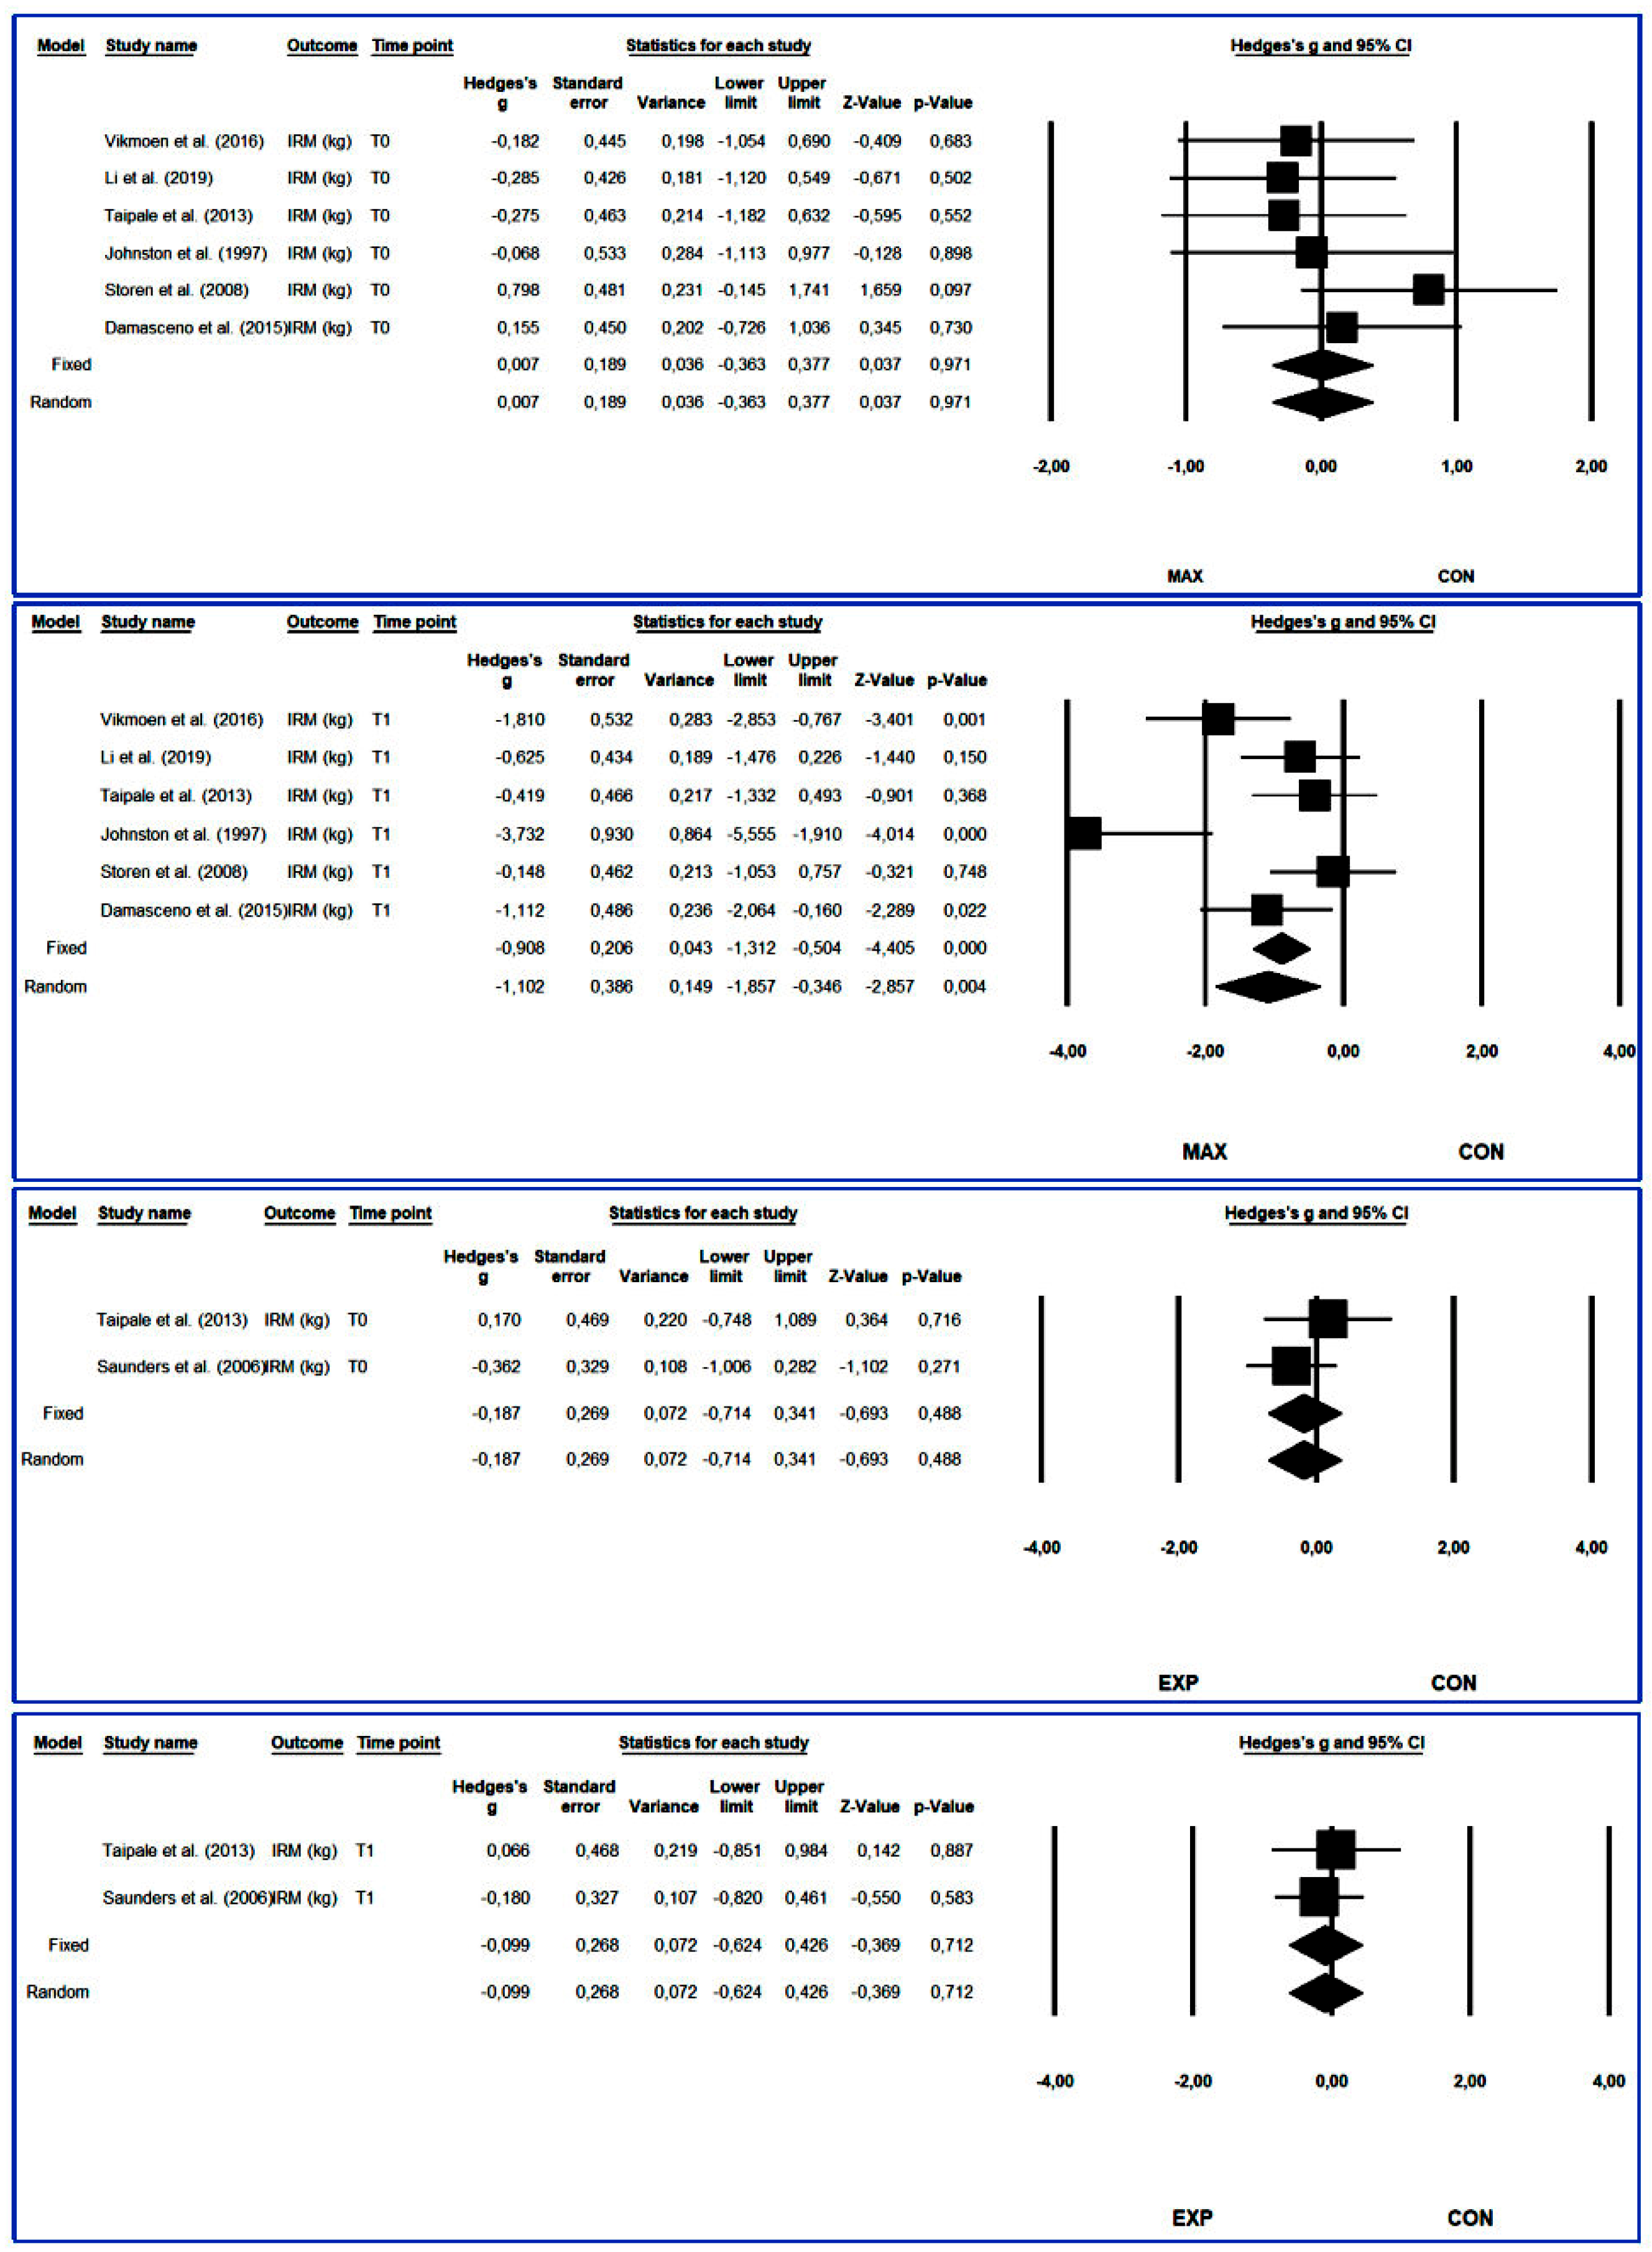
In the meta-analysis, we observed that MAX results were significantly better than those of CON in the post-test (Hedges g [95%CI]=-1.102 [-1.857--0.346]; p=0.004; Q=16.506; I2=69.708), being the effect size large and the level of heterogeneity medium (Figure 5). COMB marks were also significantly better than CON results (Hedges g [95%CI]=-0.653 [-1.043--0.263]; p=0.001); Q=4.967; I2=19.46%) with a medium effect size and low level of heterogeneity (Figure 6). Finally, there were also significant differences between MAX and EXP in favour of the first group (Hedges g [95%CI]=1.108 [0.589-1.628]; p<0.001; Q=3.331; I2=39.955), with a small effect size and low heterogeneity (Figure 6). No significant differences were reported between EXP and CON (Figure 5) and MAX and COMB (Figure 7).
Furthermore, in all the studies included in the meta-analysis where the experimental groups performed MAX and 1RM was assessed [1,2,8,24,26,29,37,46,48], the subjects significantly improved 1RM. In one study, performing MAX produced greater improvements than EXP [1]. Another study also observed that performing MAX training provided larger improvements than COMB training [37]. Likewise, significant improvements were observed in all studies where COMB training was performed and 1RM assessed [2,4,20,37,46,54]. In contrast, in the case of EXP, there were significant improvements in three out of four studies [1,46,49,51].

3.4.3. Running Economy

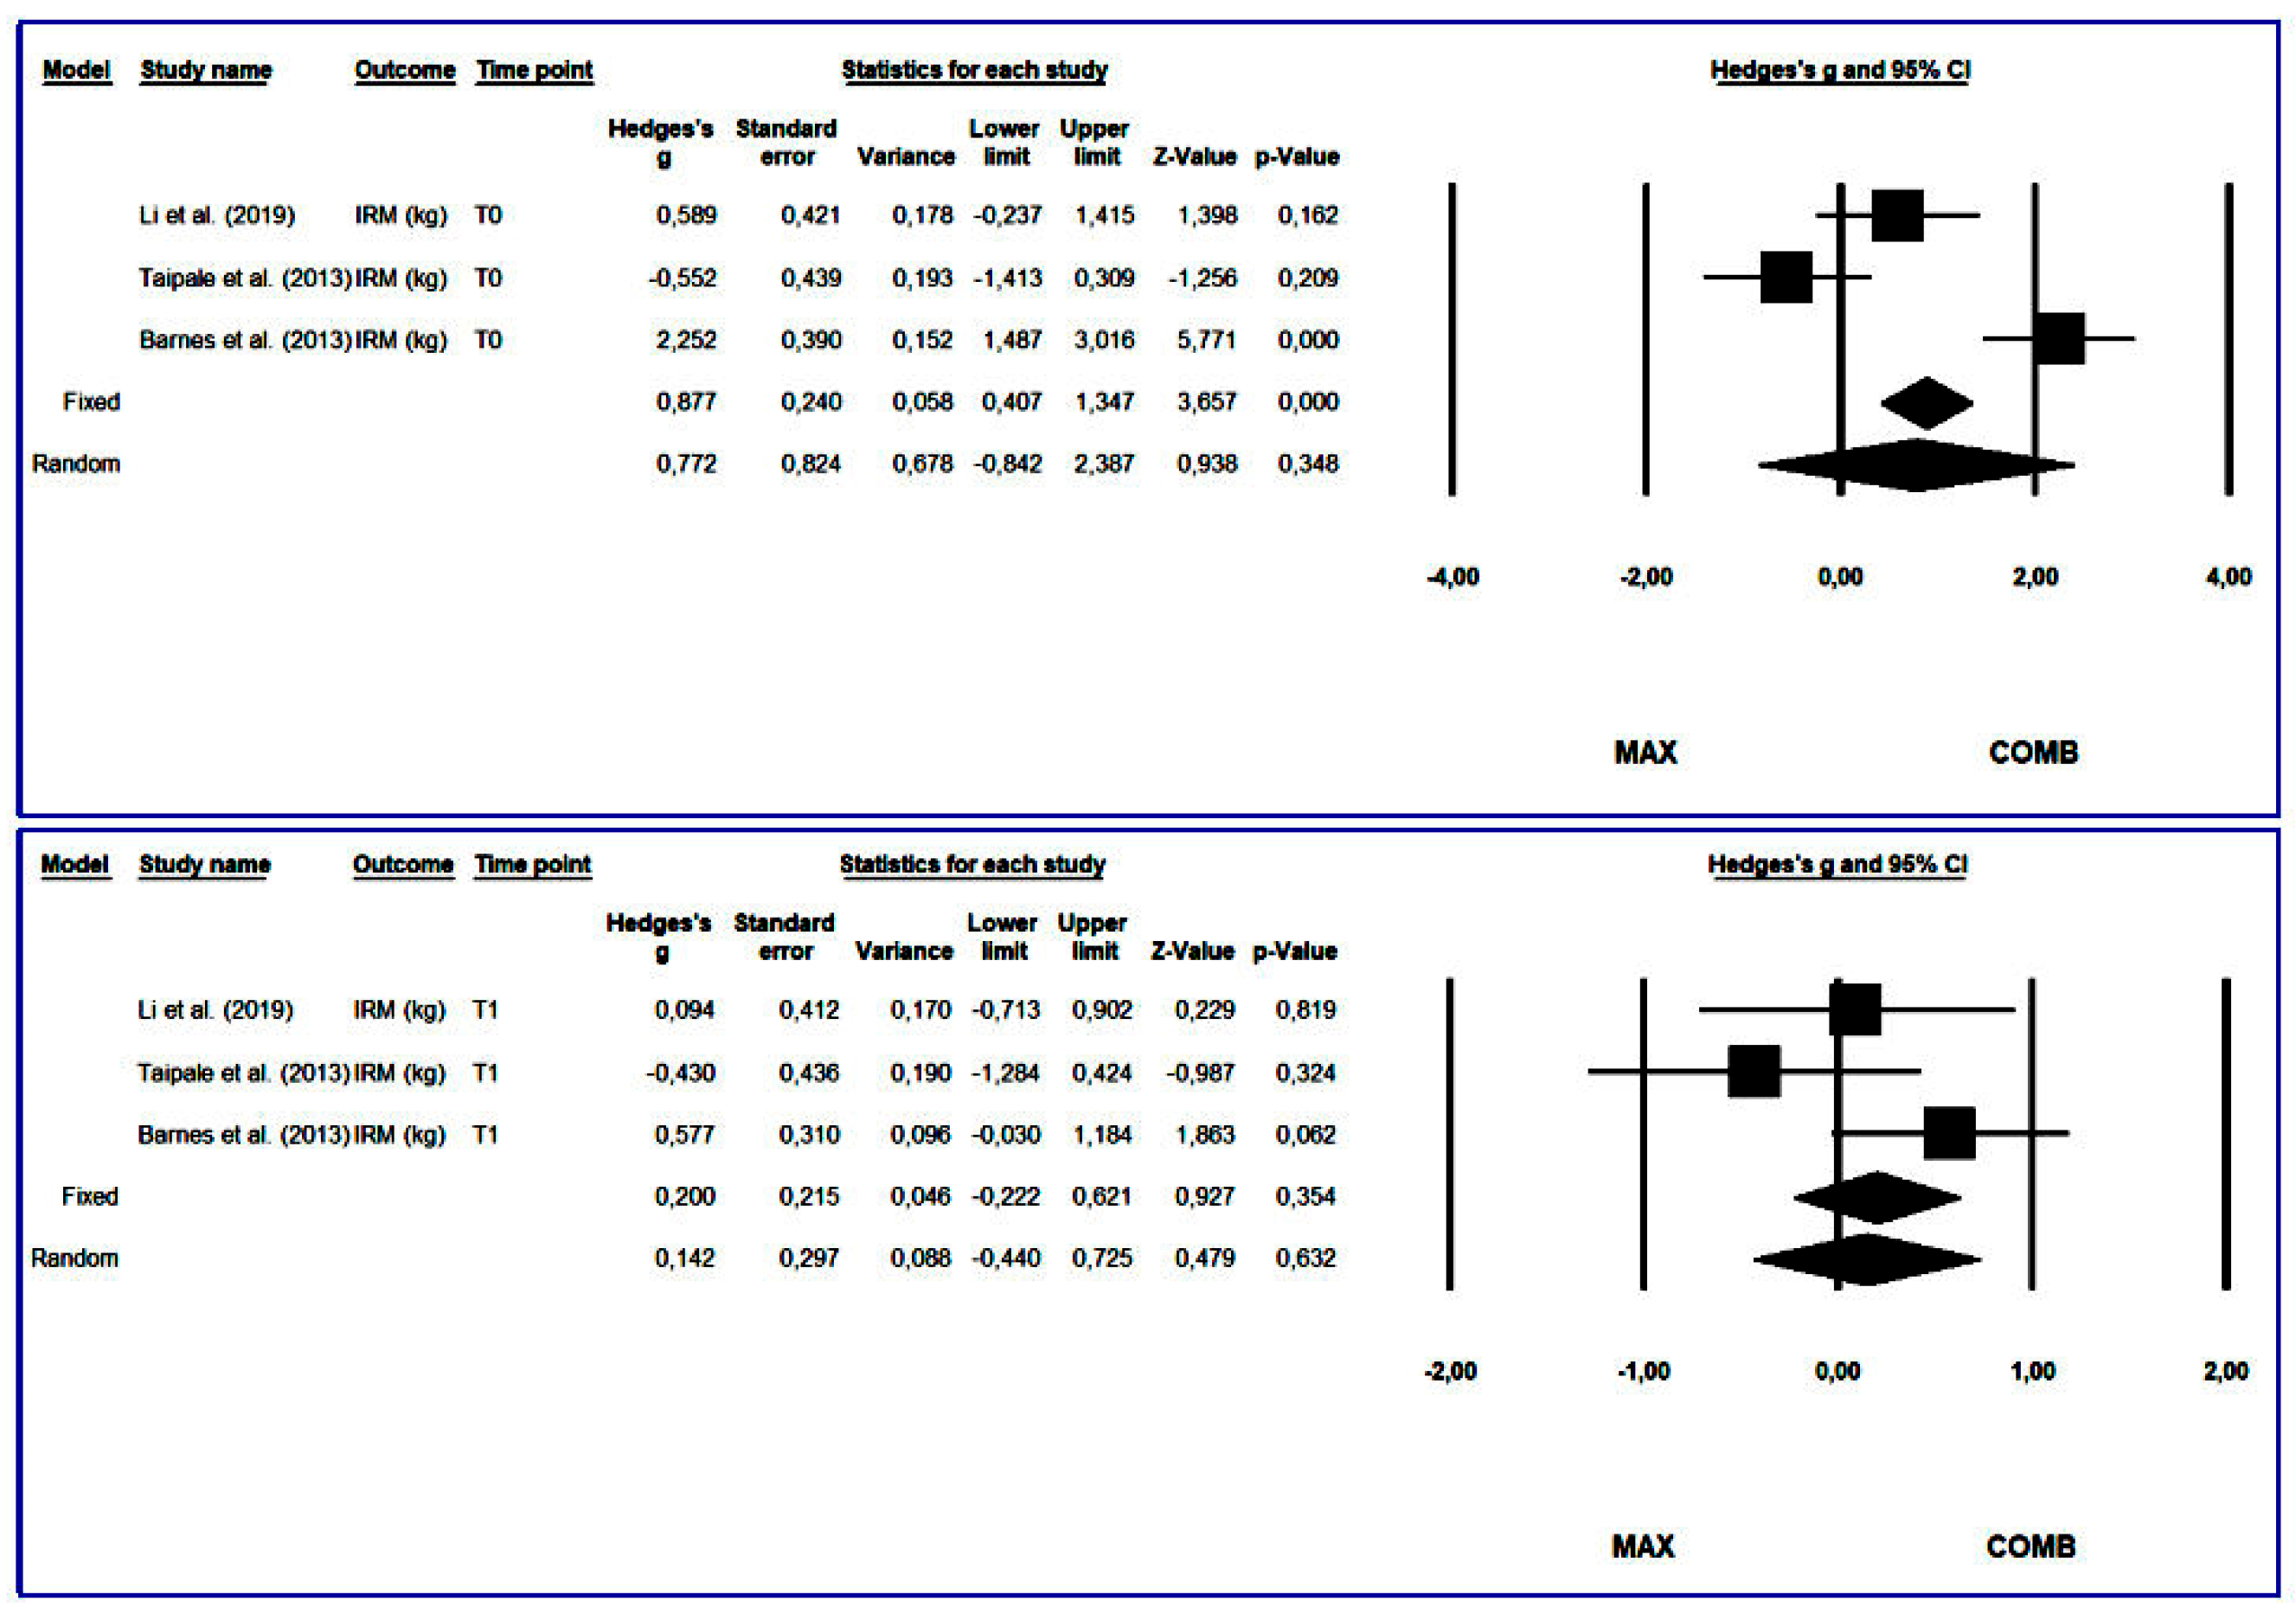
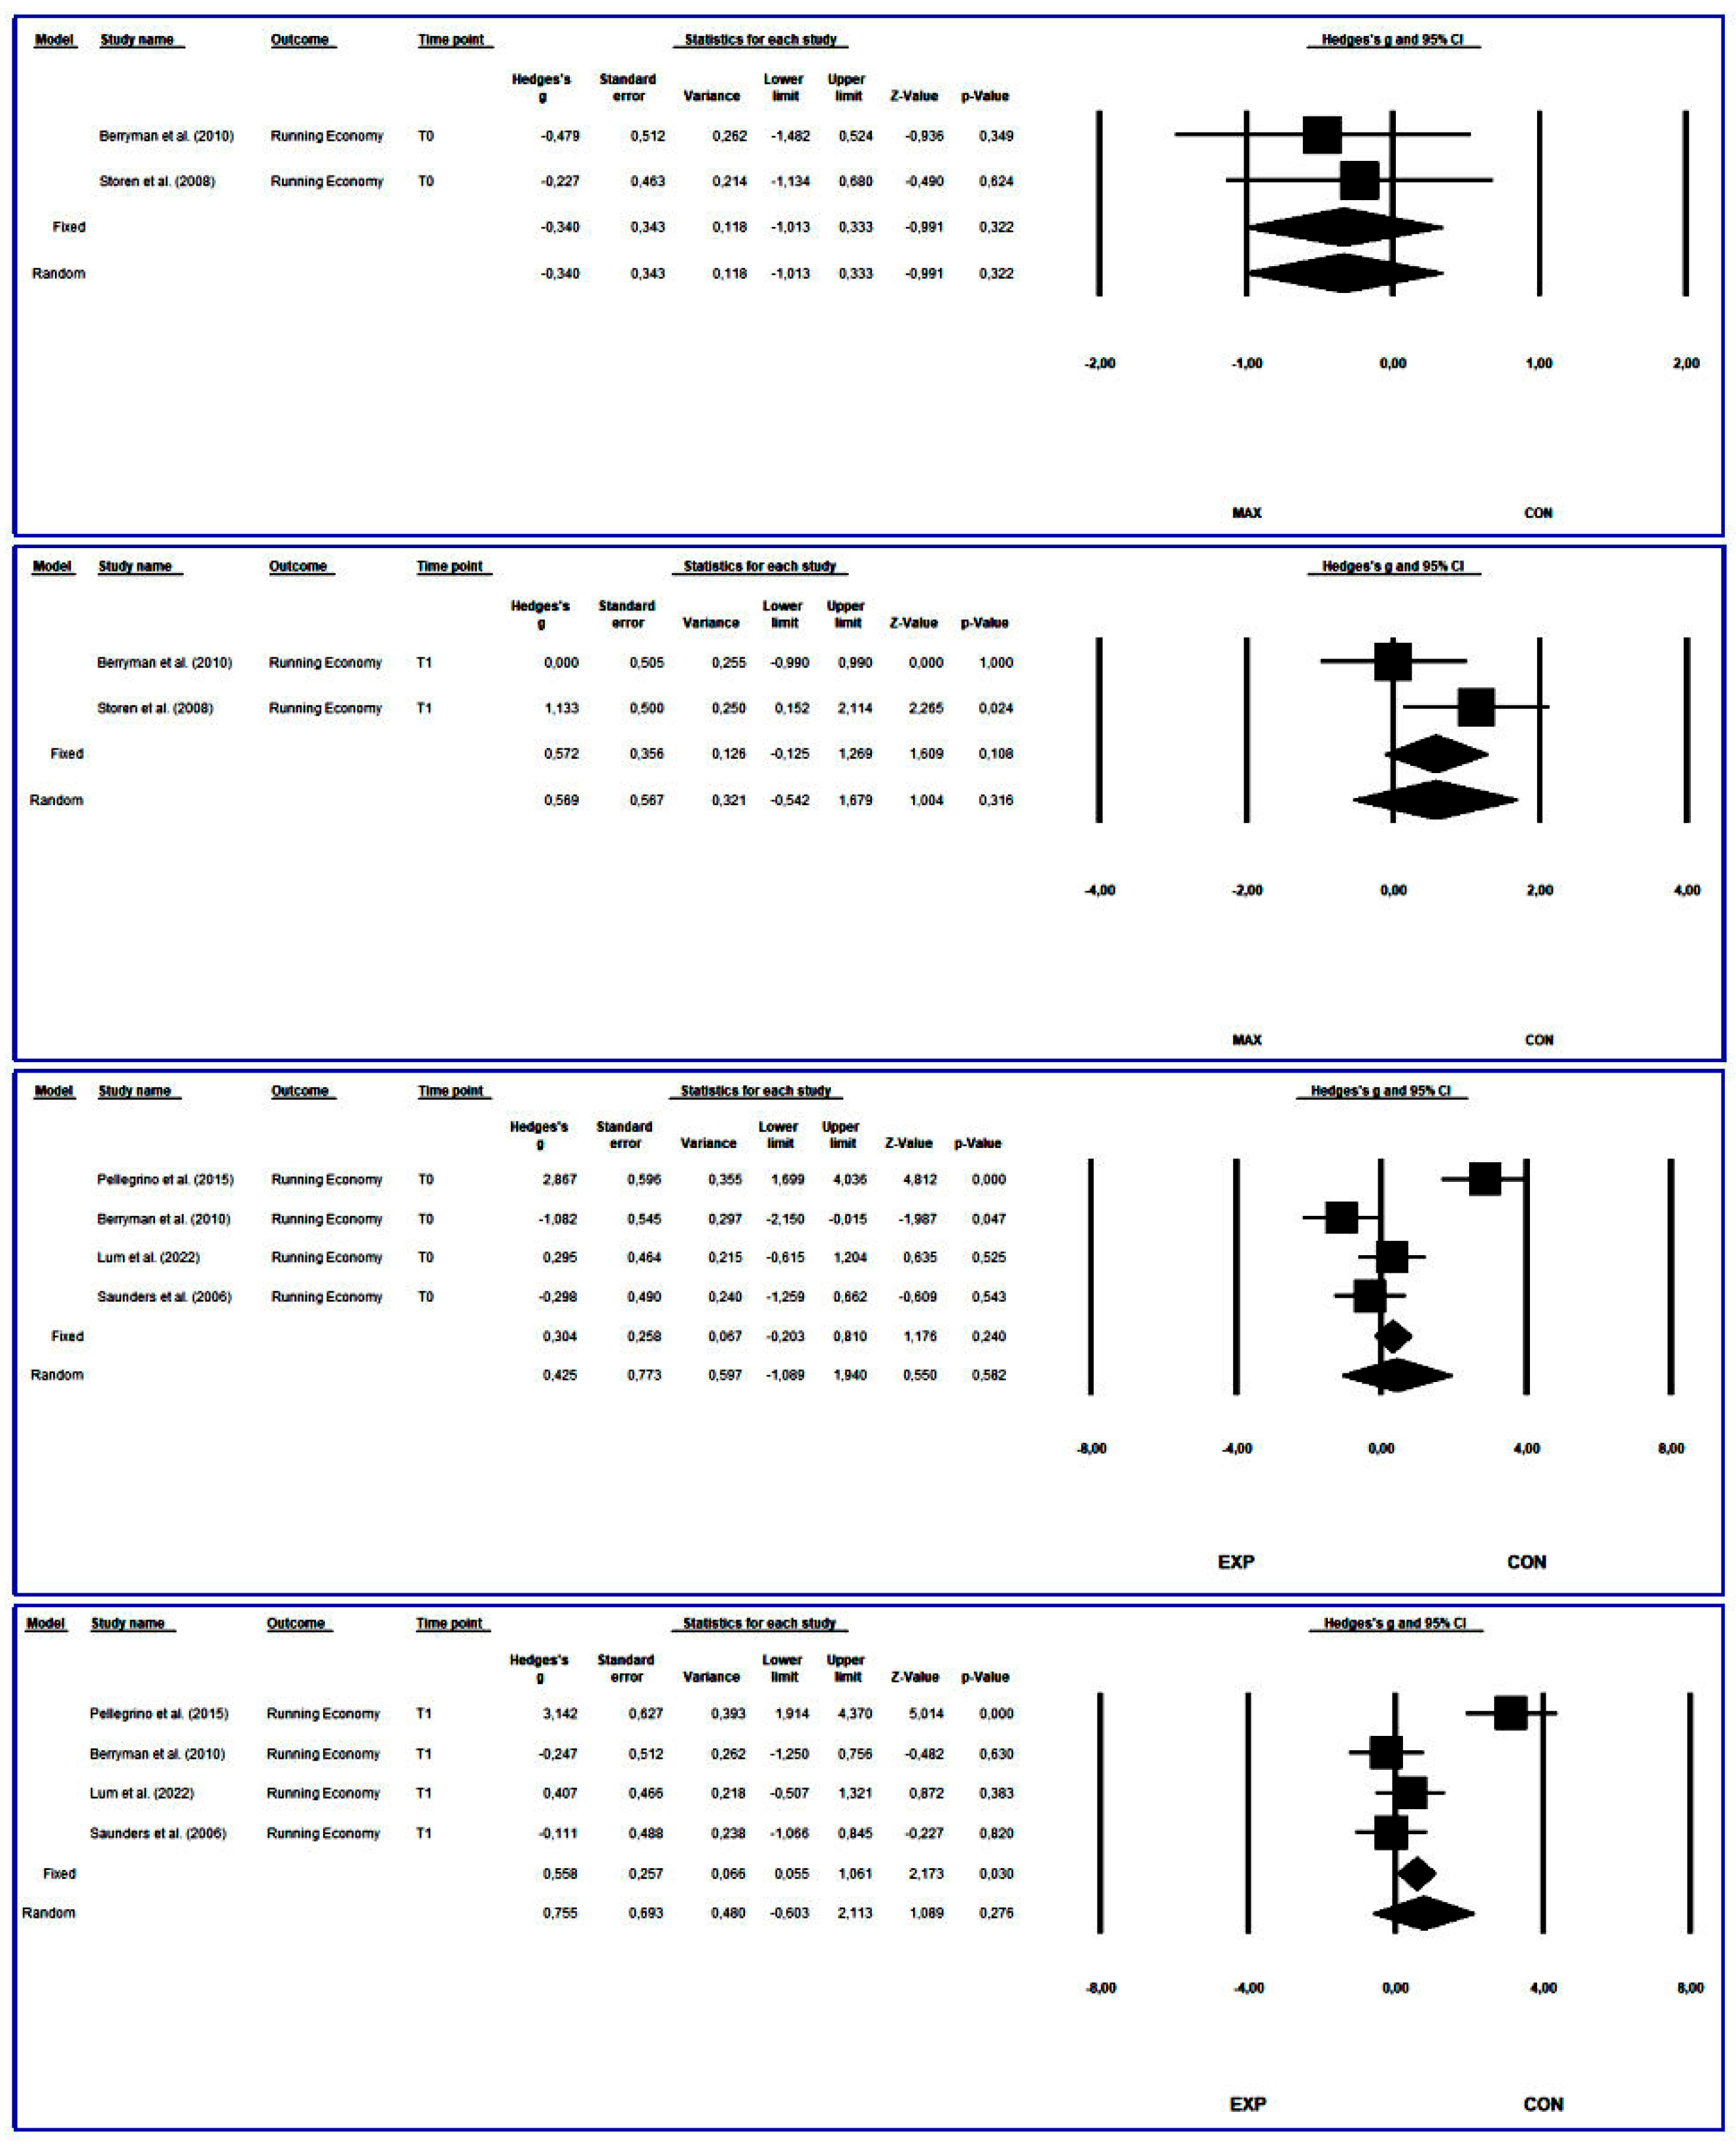
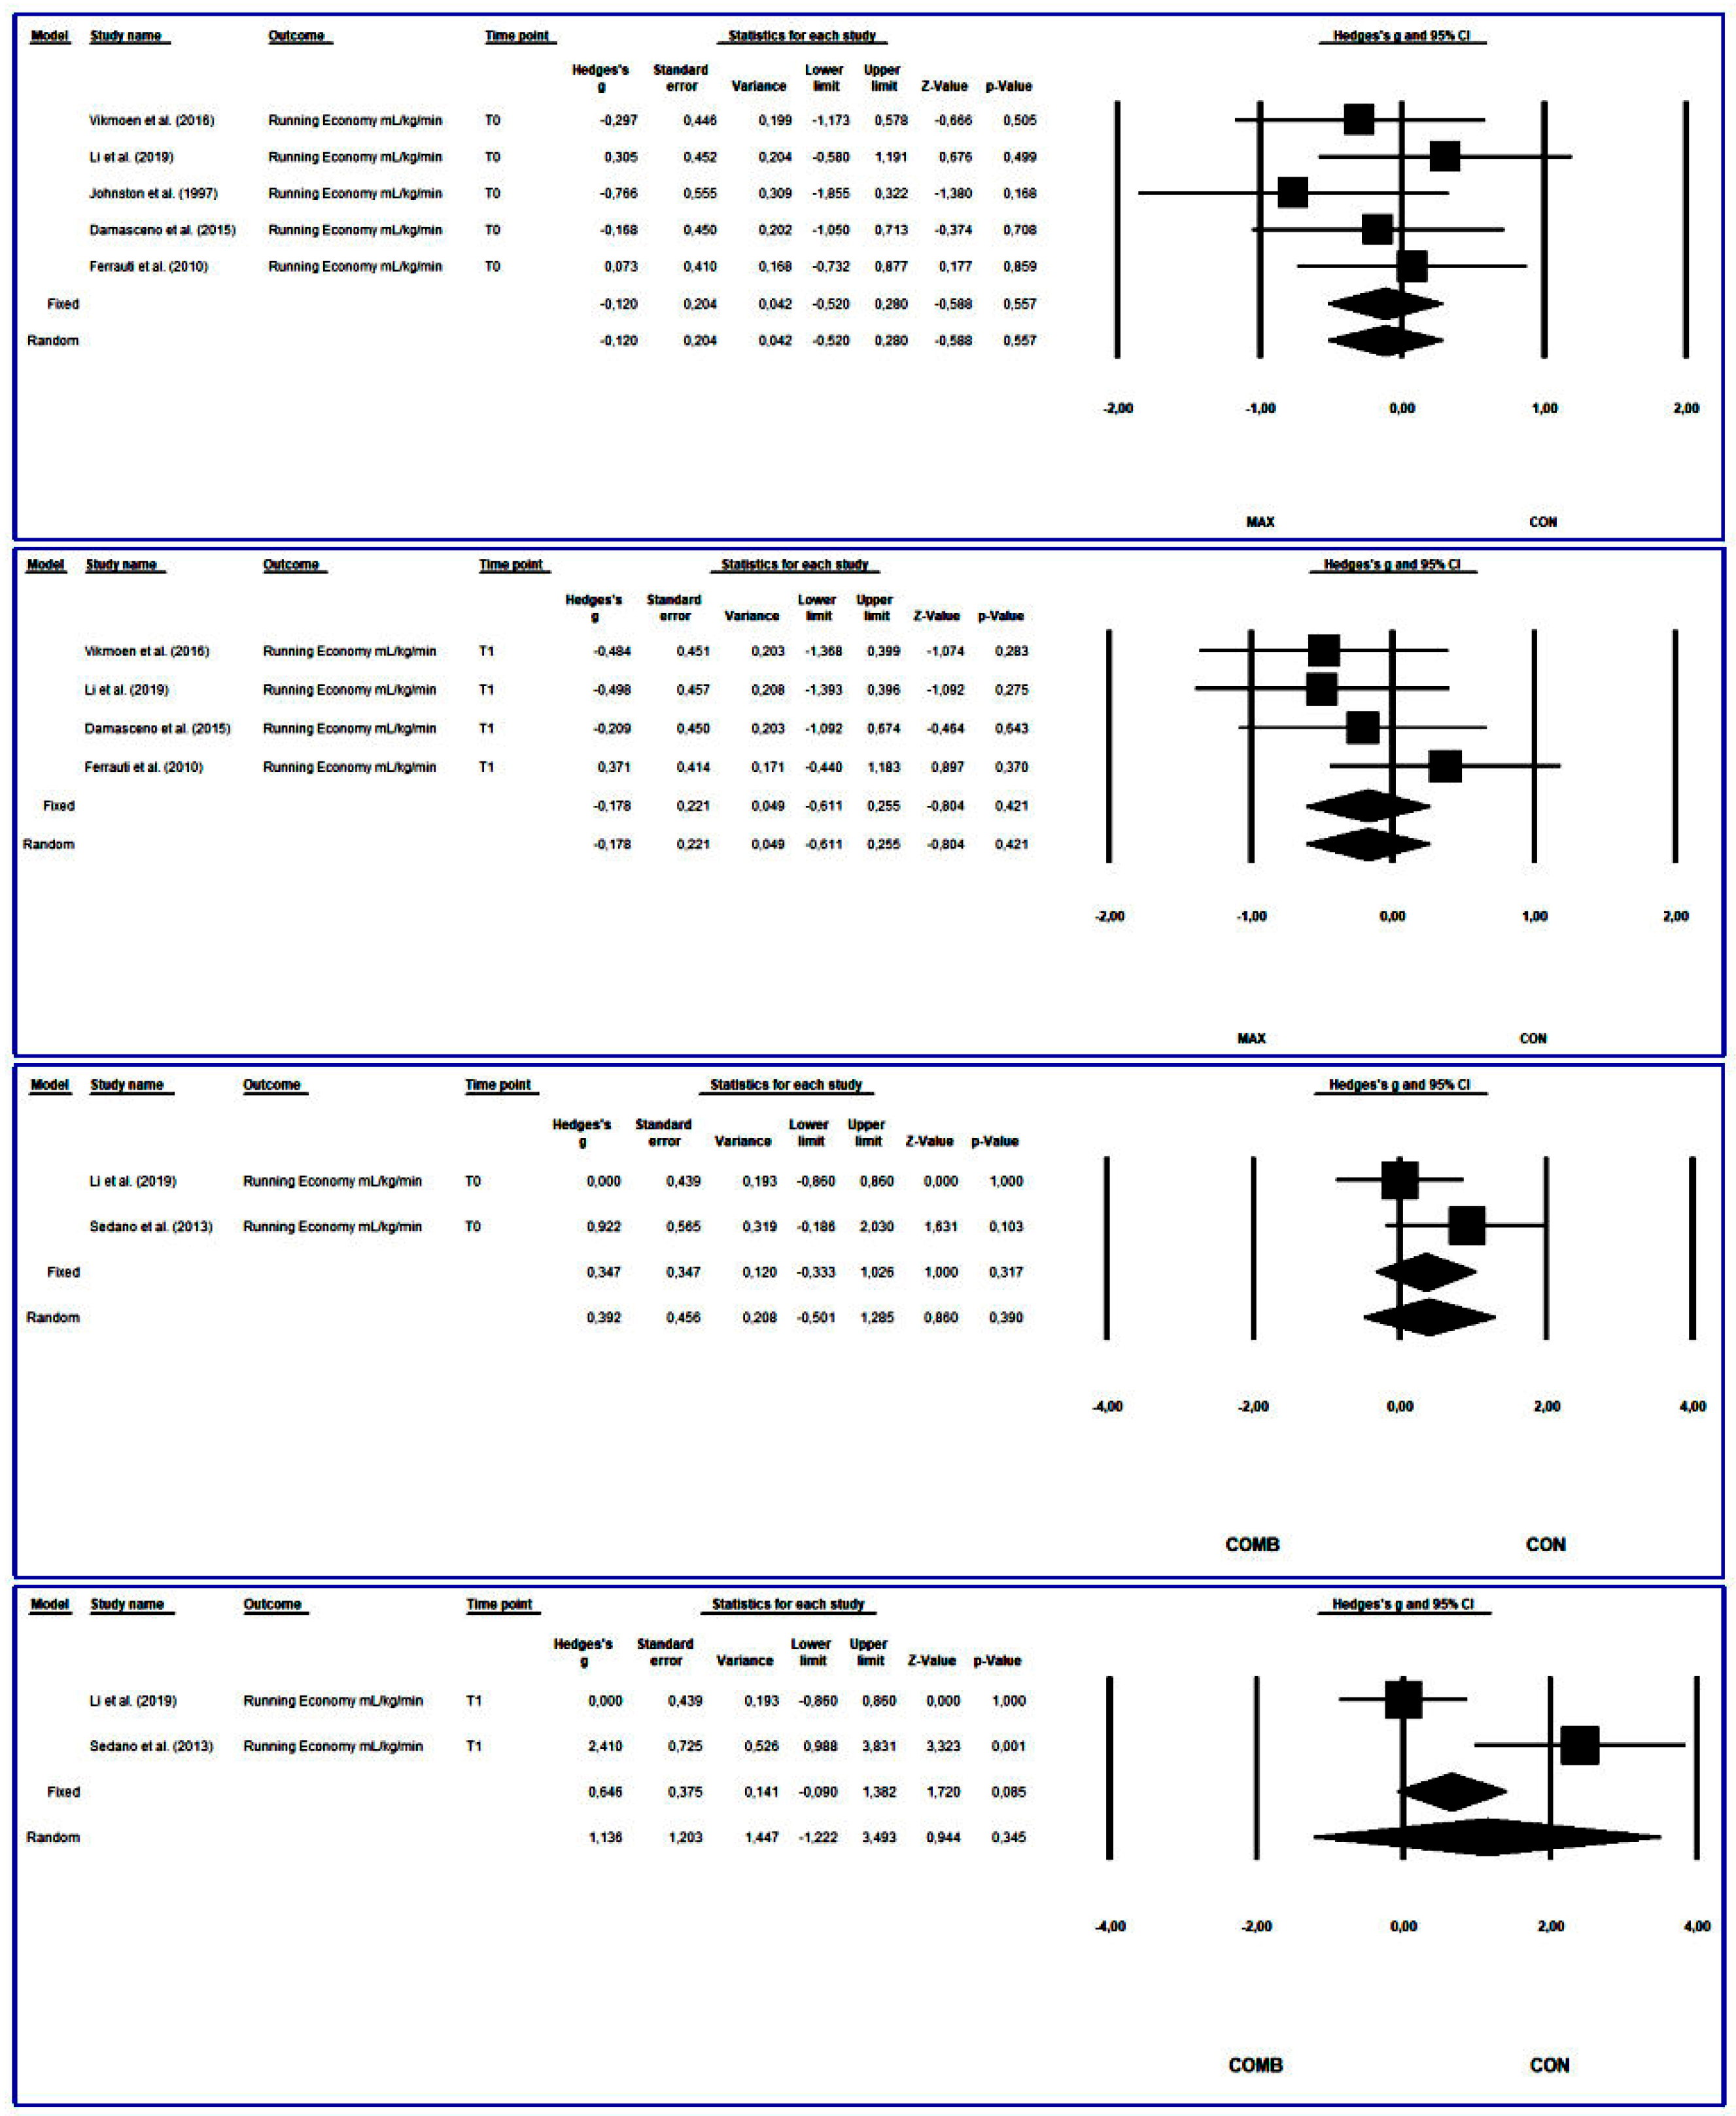
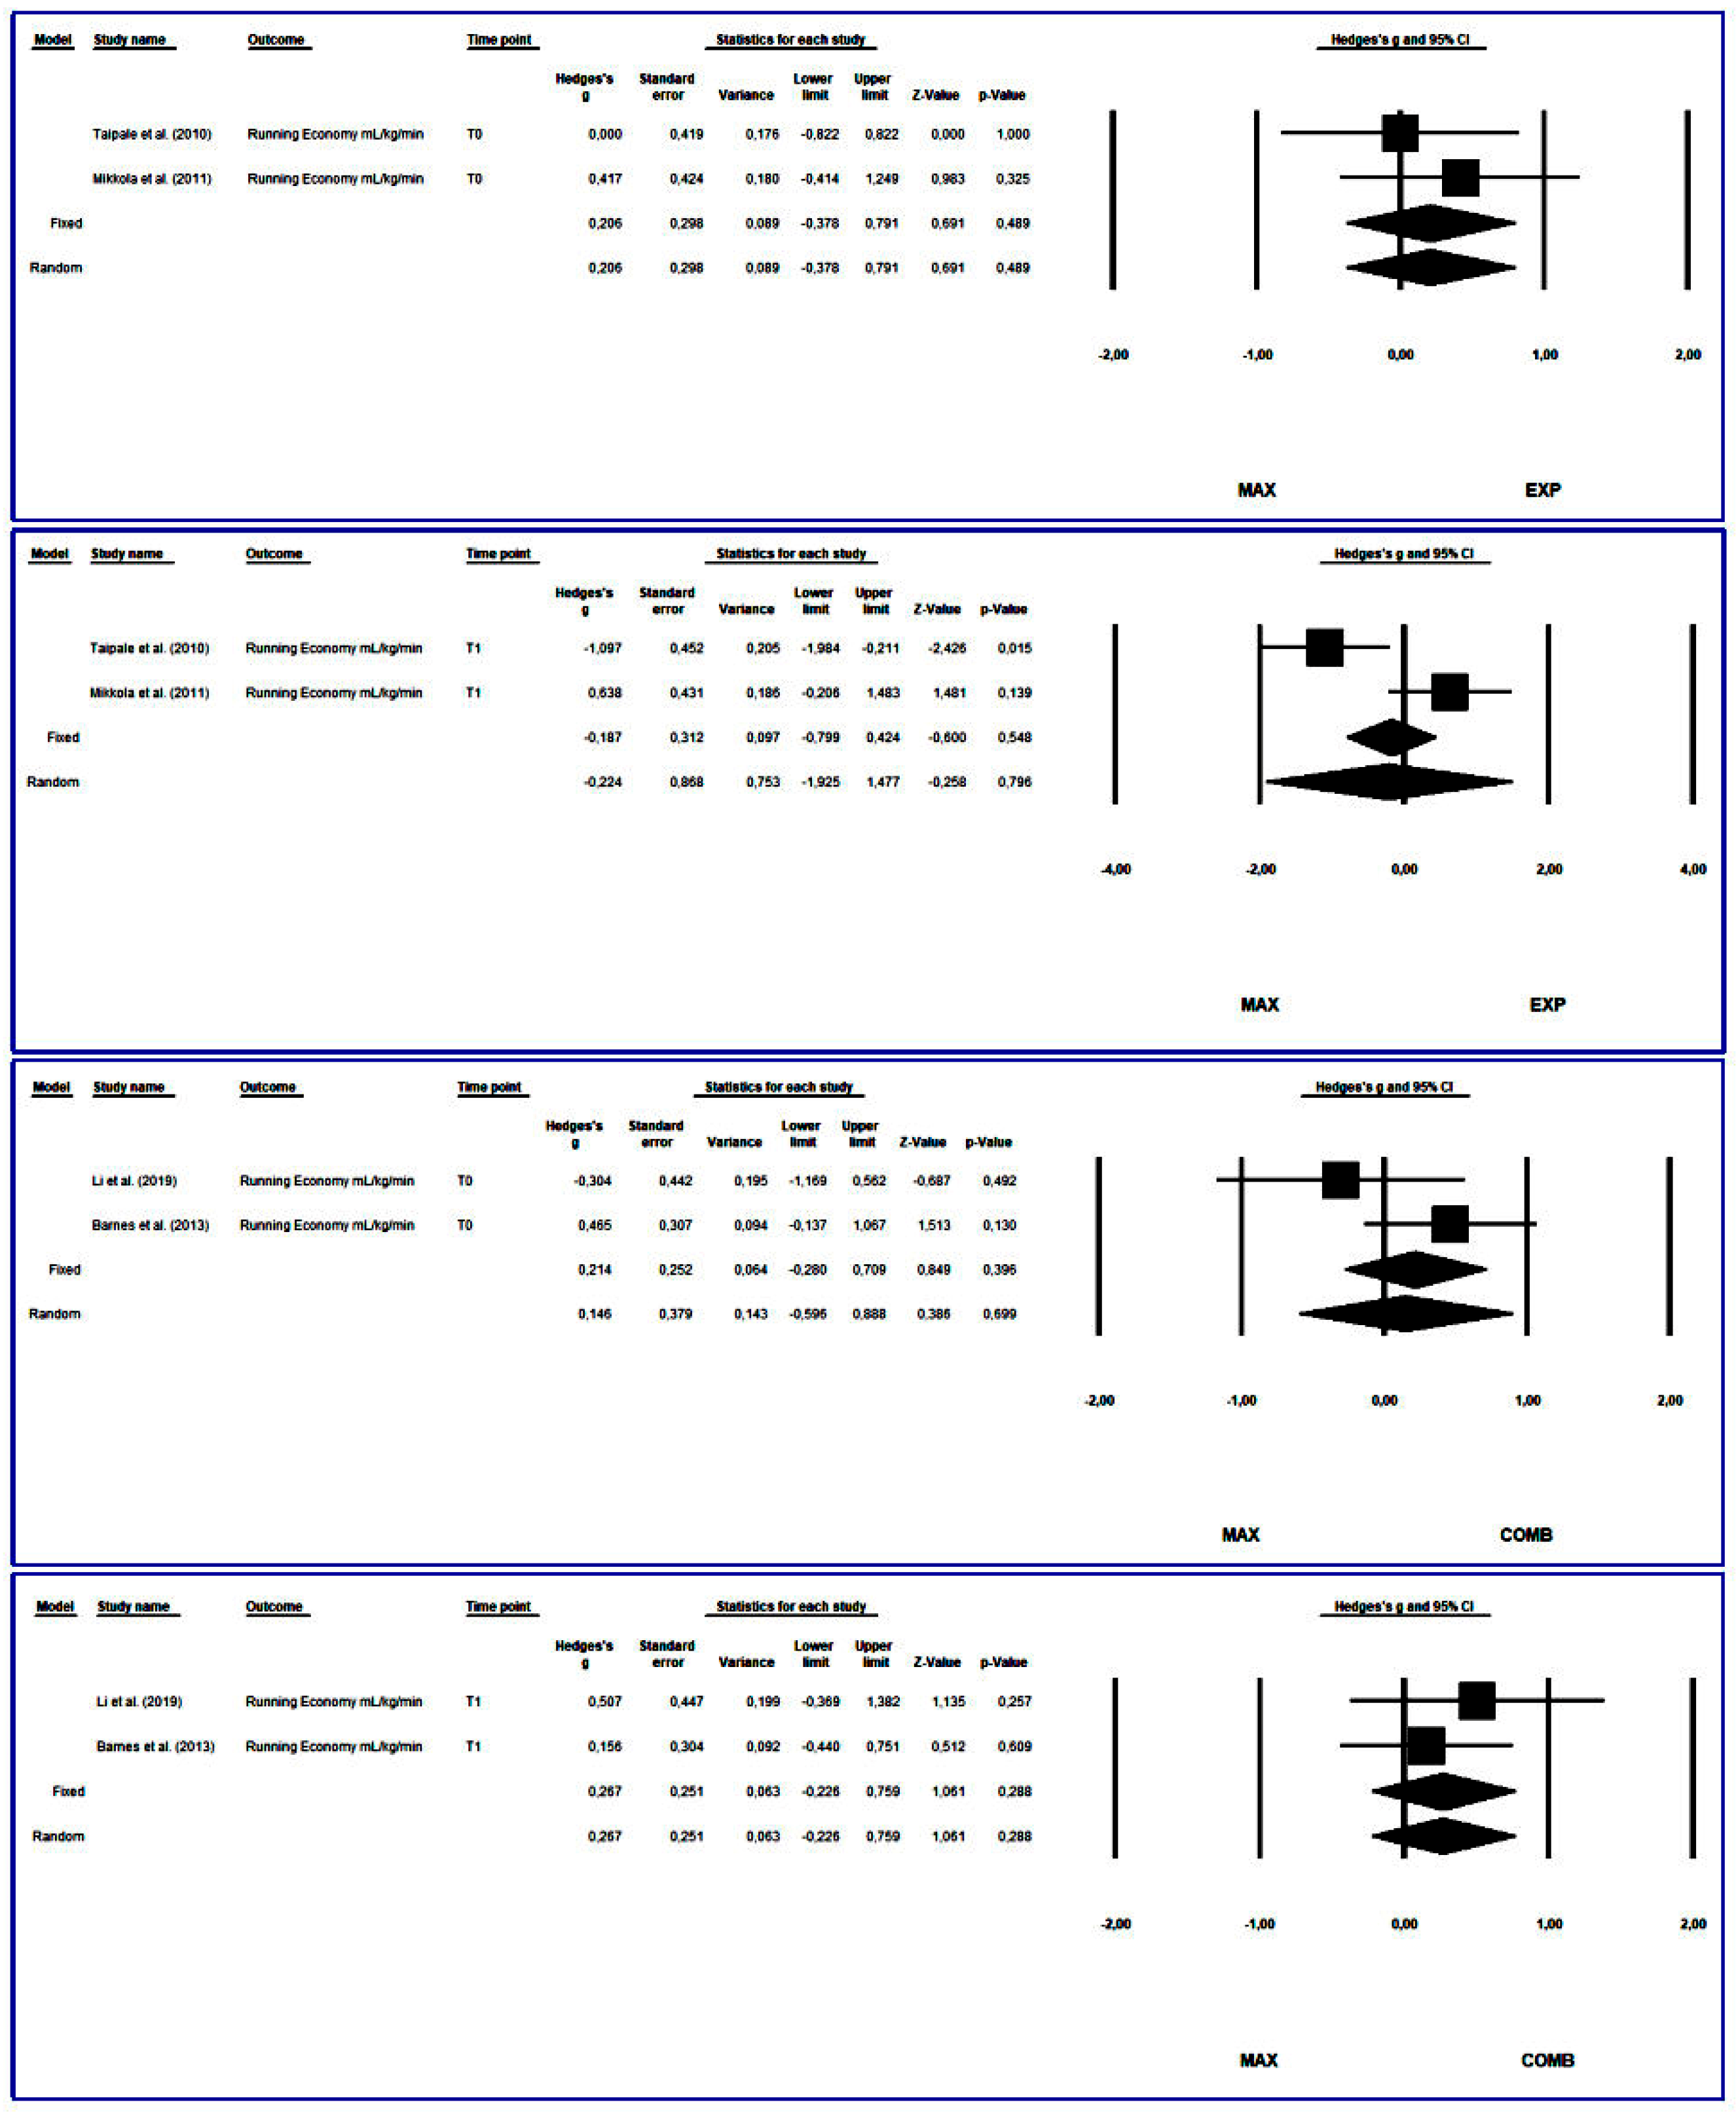
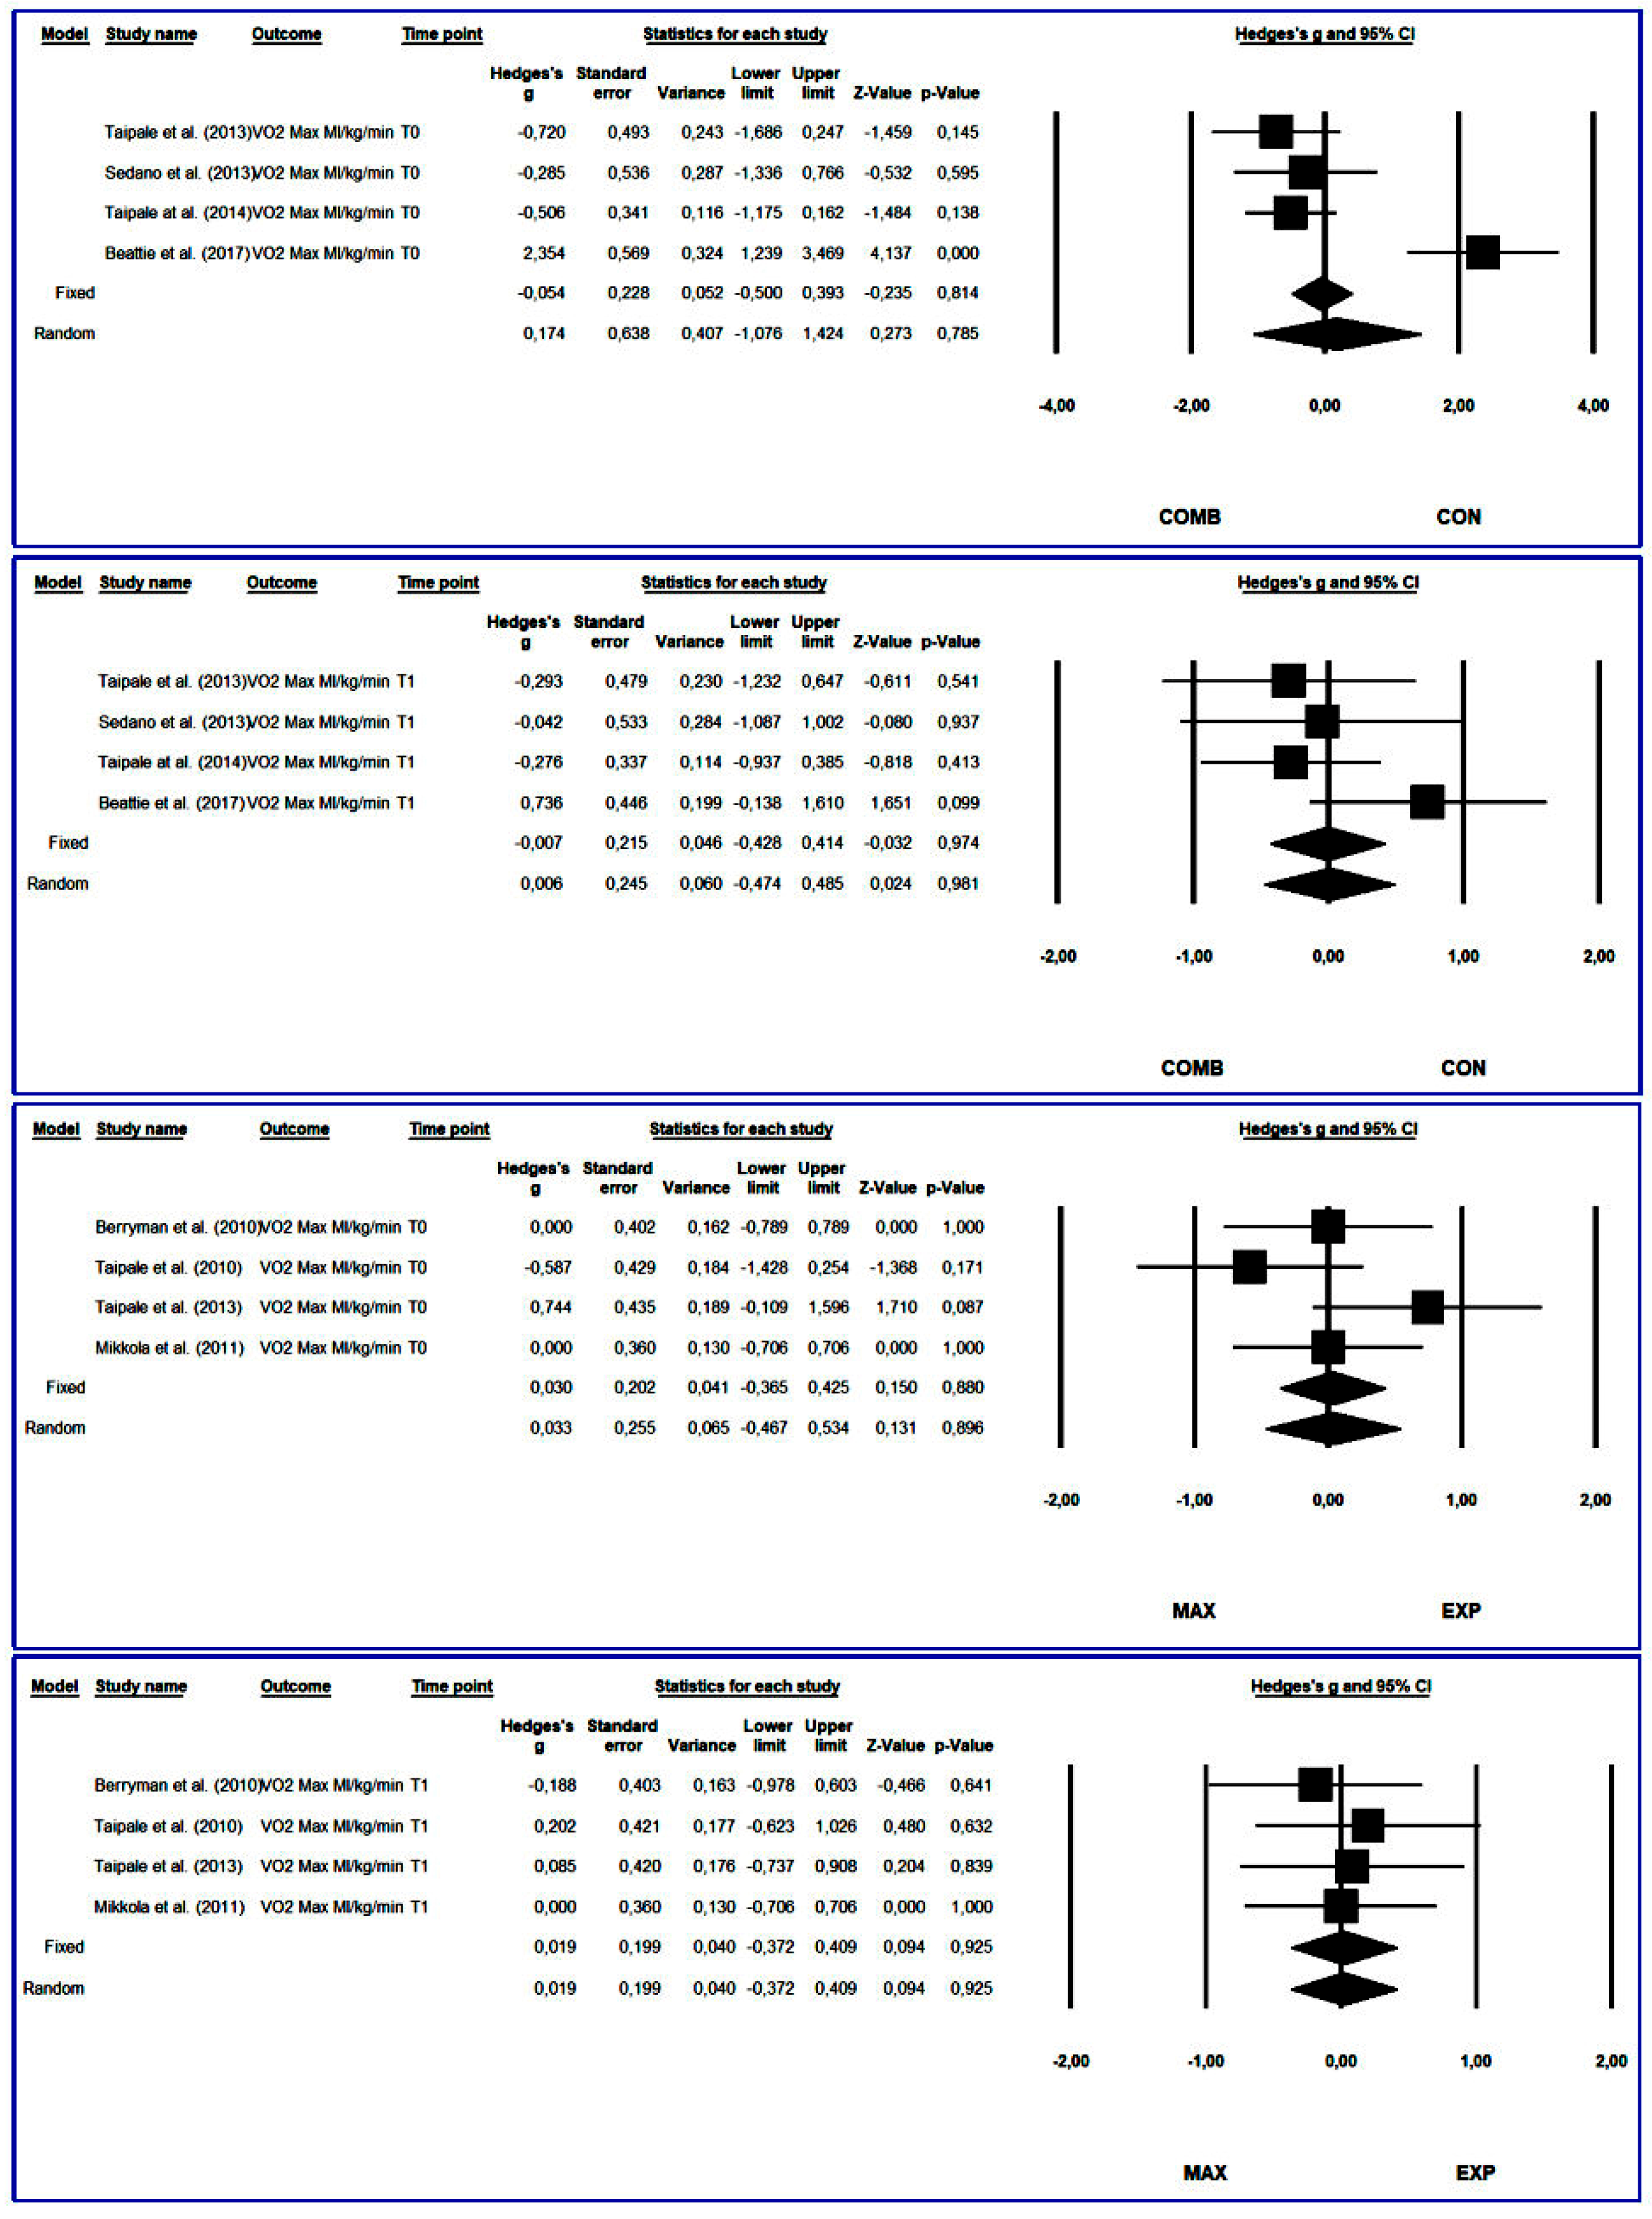
No significant differences were found in the meta-analysis between CON and the three experimental groups (MAX, EXP and COMB; p>0.05). Similarly, no significant differences were found between the three experimental groups (p>0.05; Figure 8, Figure 9 and Figure 10).
Furthermore, 10 of the 20 studies selected for the current meta-analysis included experimental groups that underwent MAX training and RE was assessed [1,2,8,24,26,29,34,37,48,49]. In six of them, MAX training produced significant improvements in RE. EXP training generated improvements in RE in five of the seven studies in which this training protocol was applied [1,30,34,39,49,51,53] and RE was evaluated. Finally, COMB training generated improvements in RE in three of the four studies wherein this training methodology was applied and RE was measured [2,4,37,54]. However, Barnes et al. found that MAX training improved RE significantly better than COMB [37]. Berryman et al. ascertained that EXP was significantly better than MAX [34] in enhancing RE.

3.4.4. Maximum Oxygen Consumption

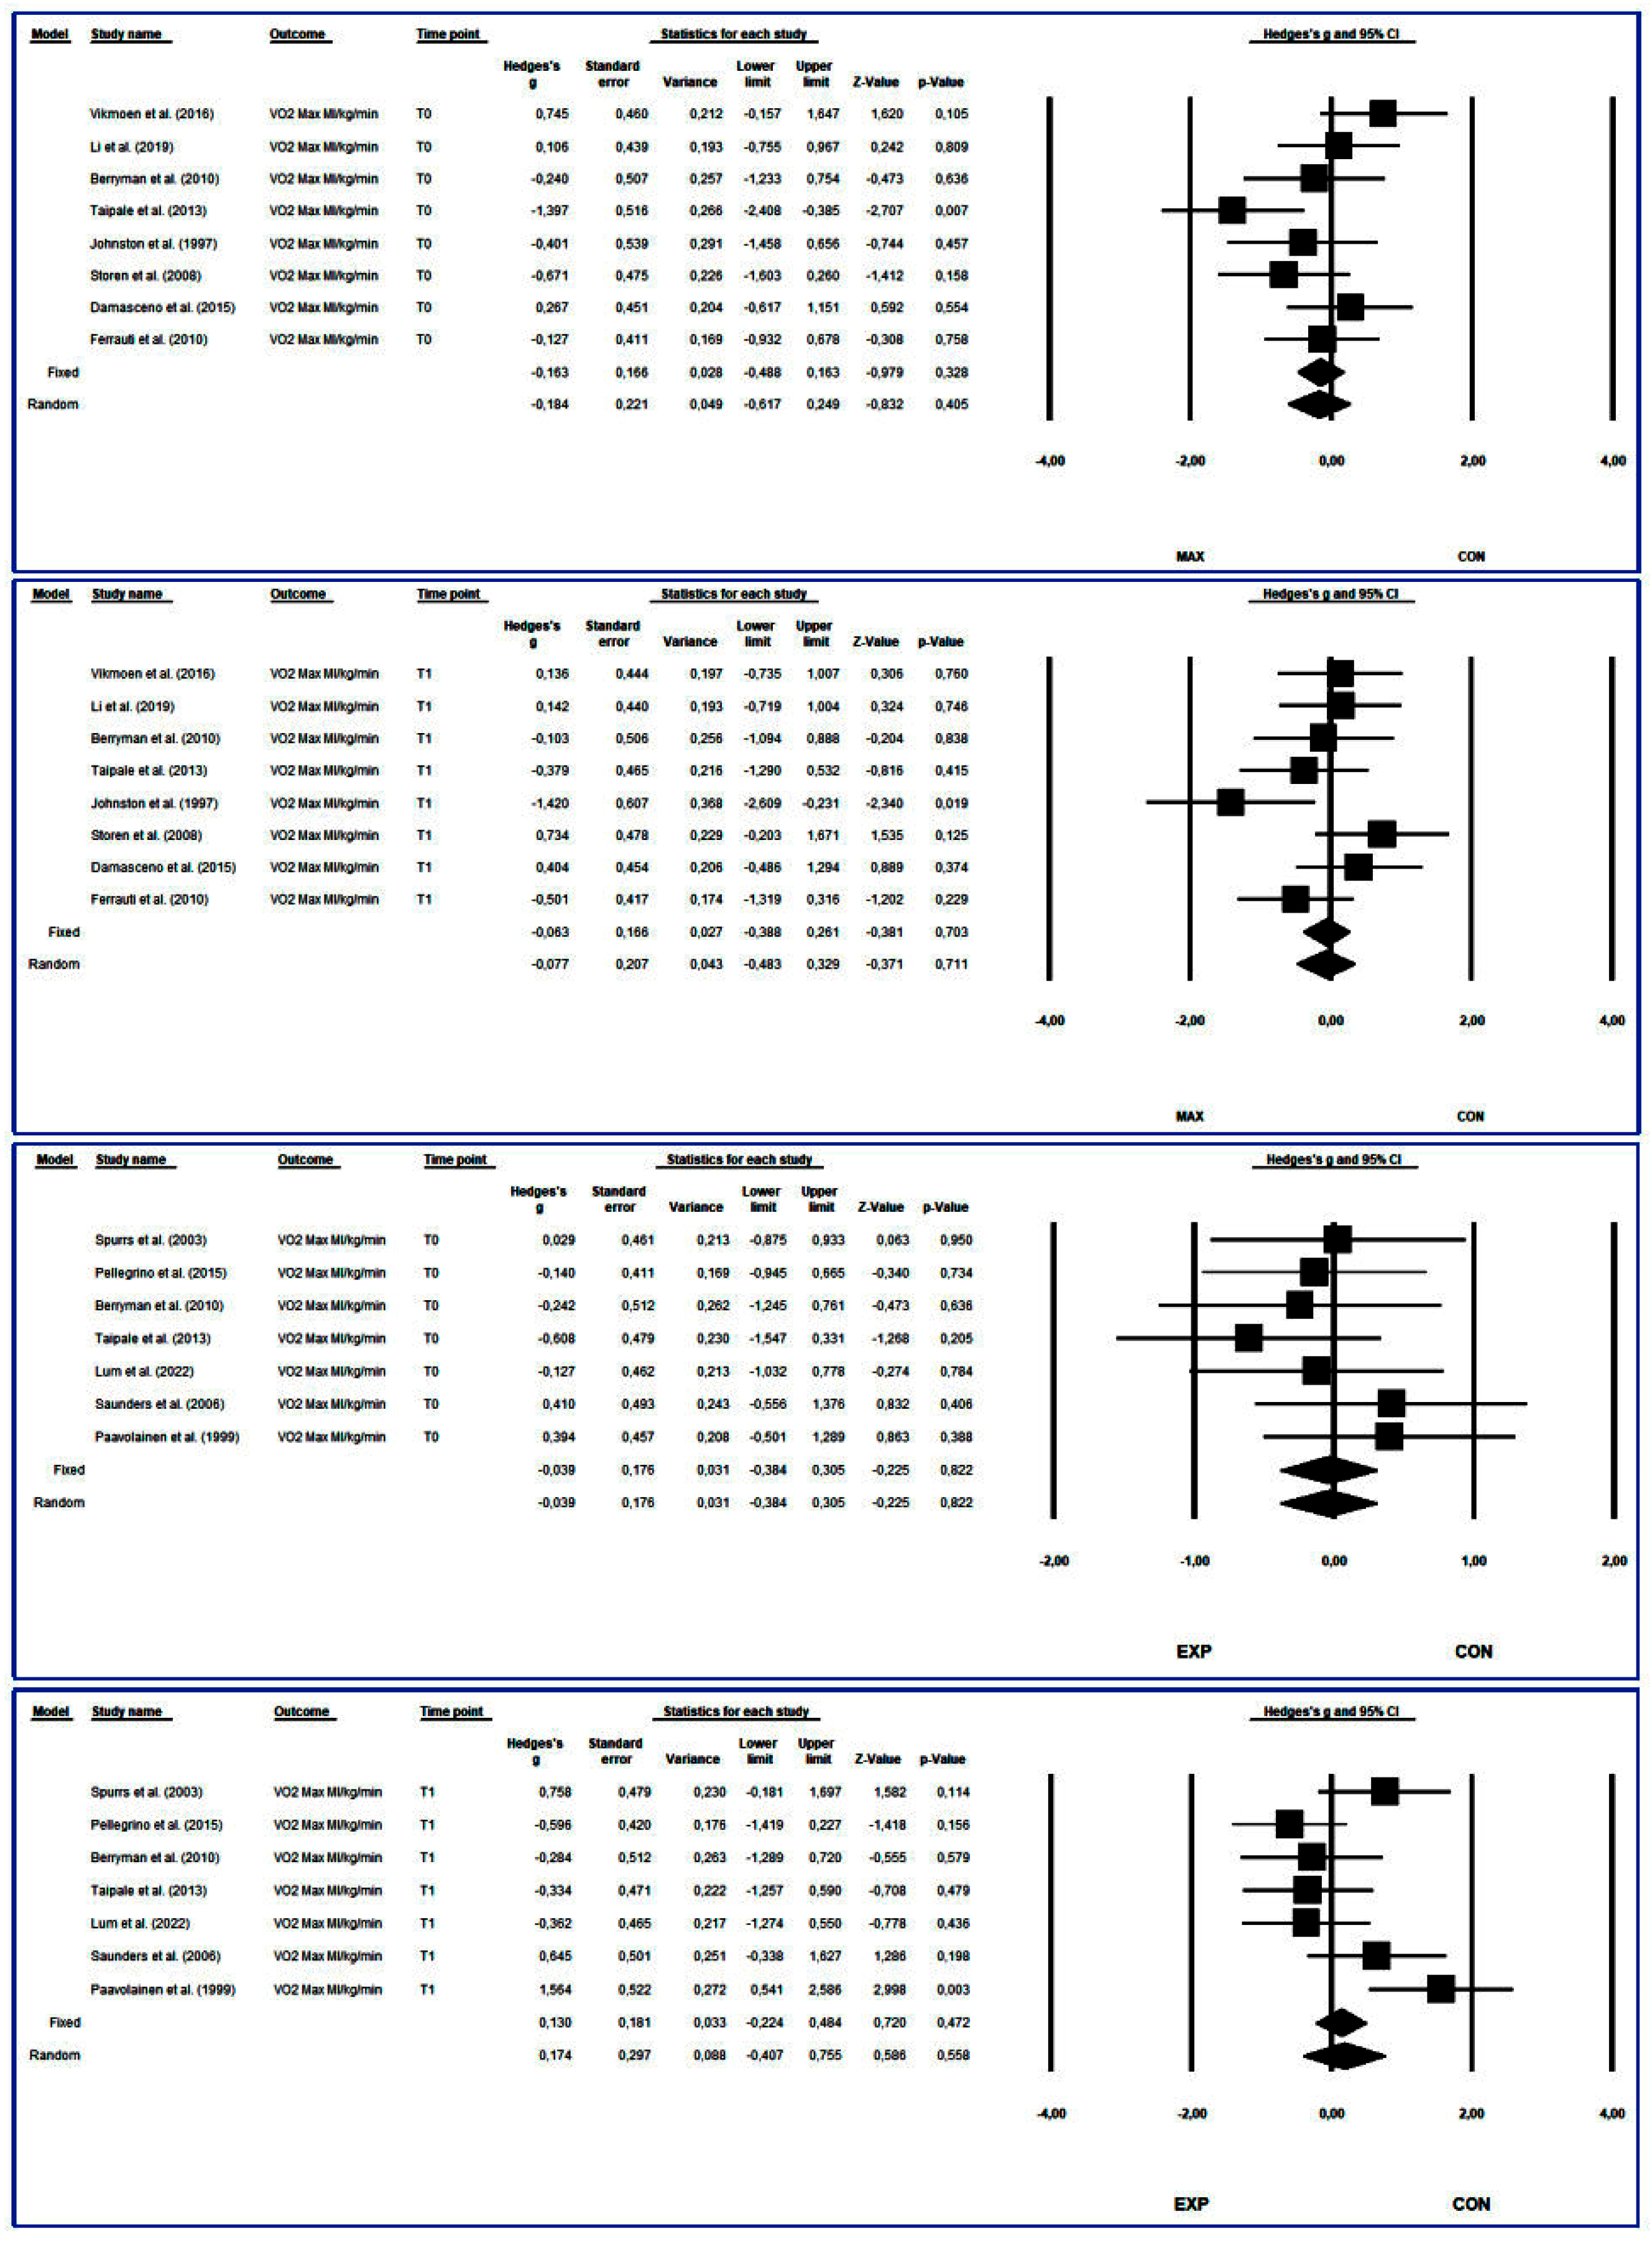
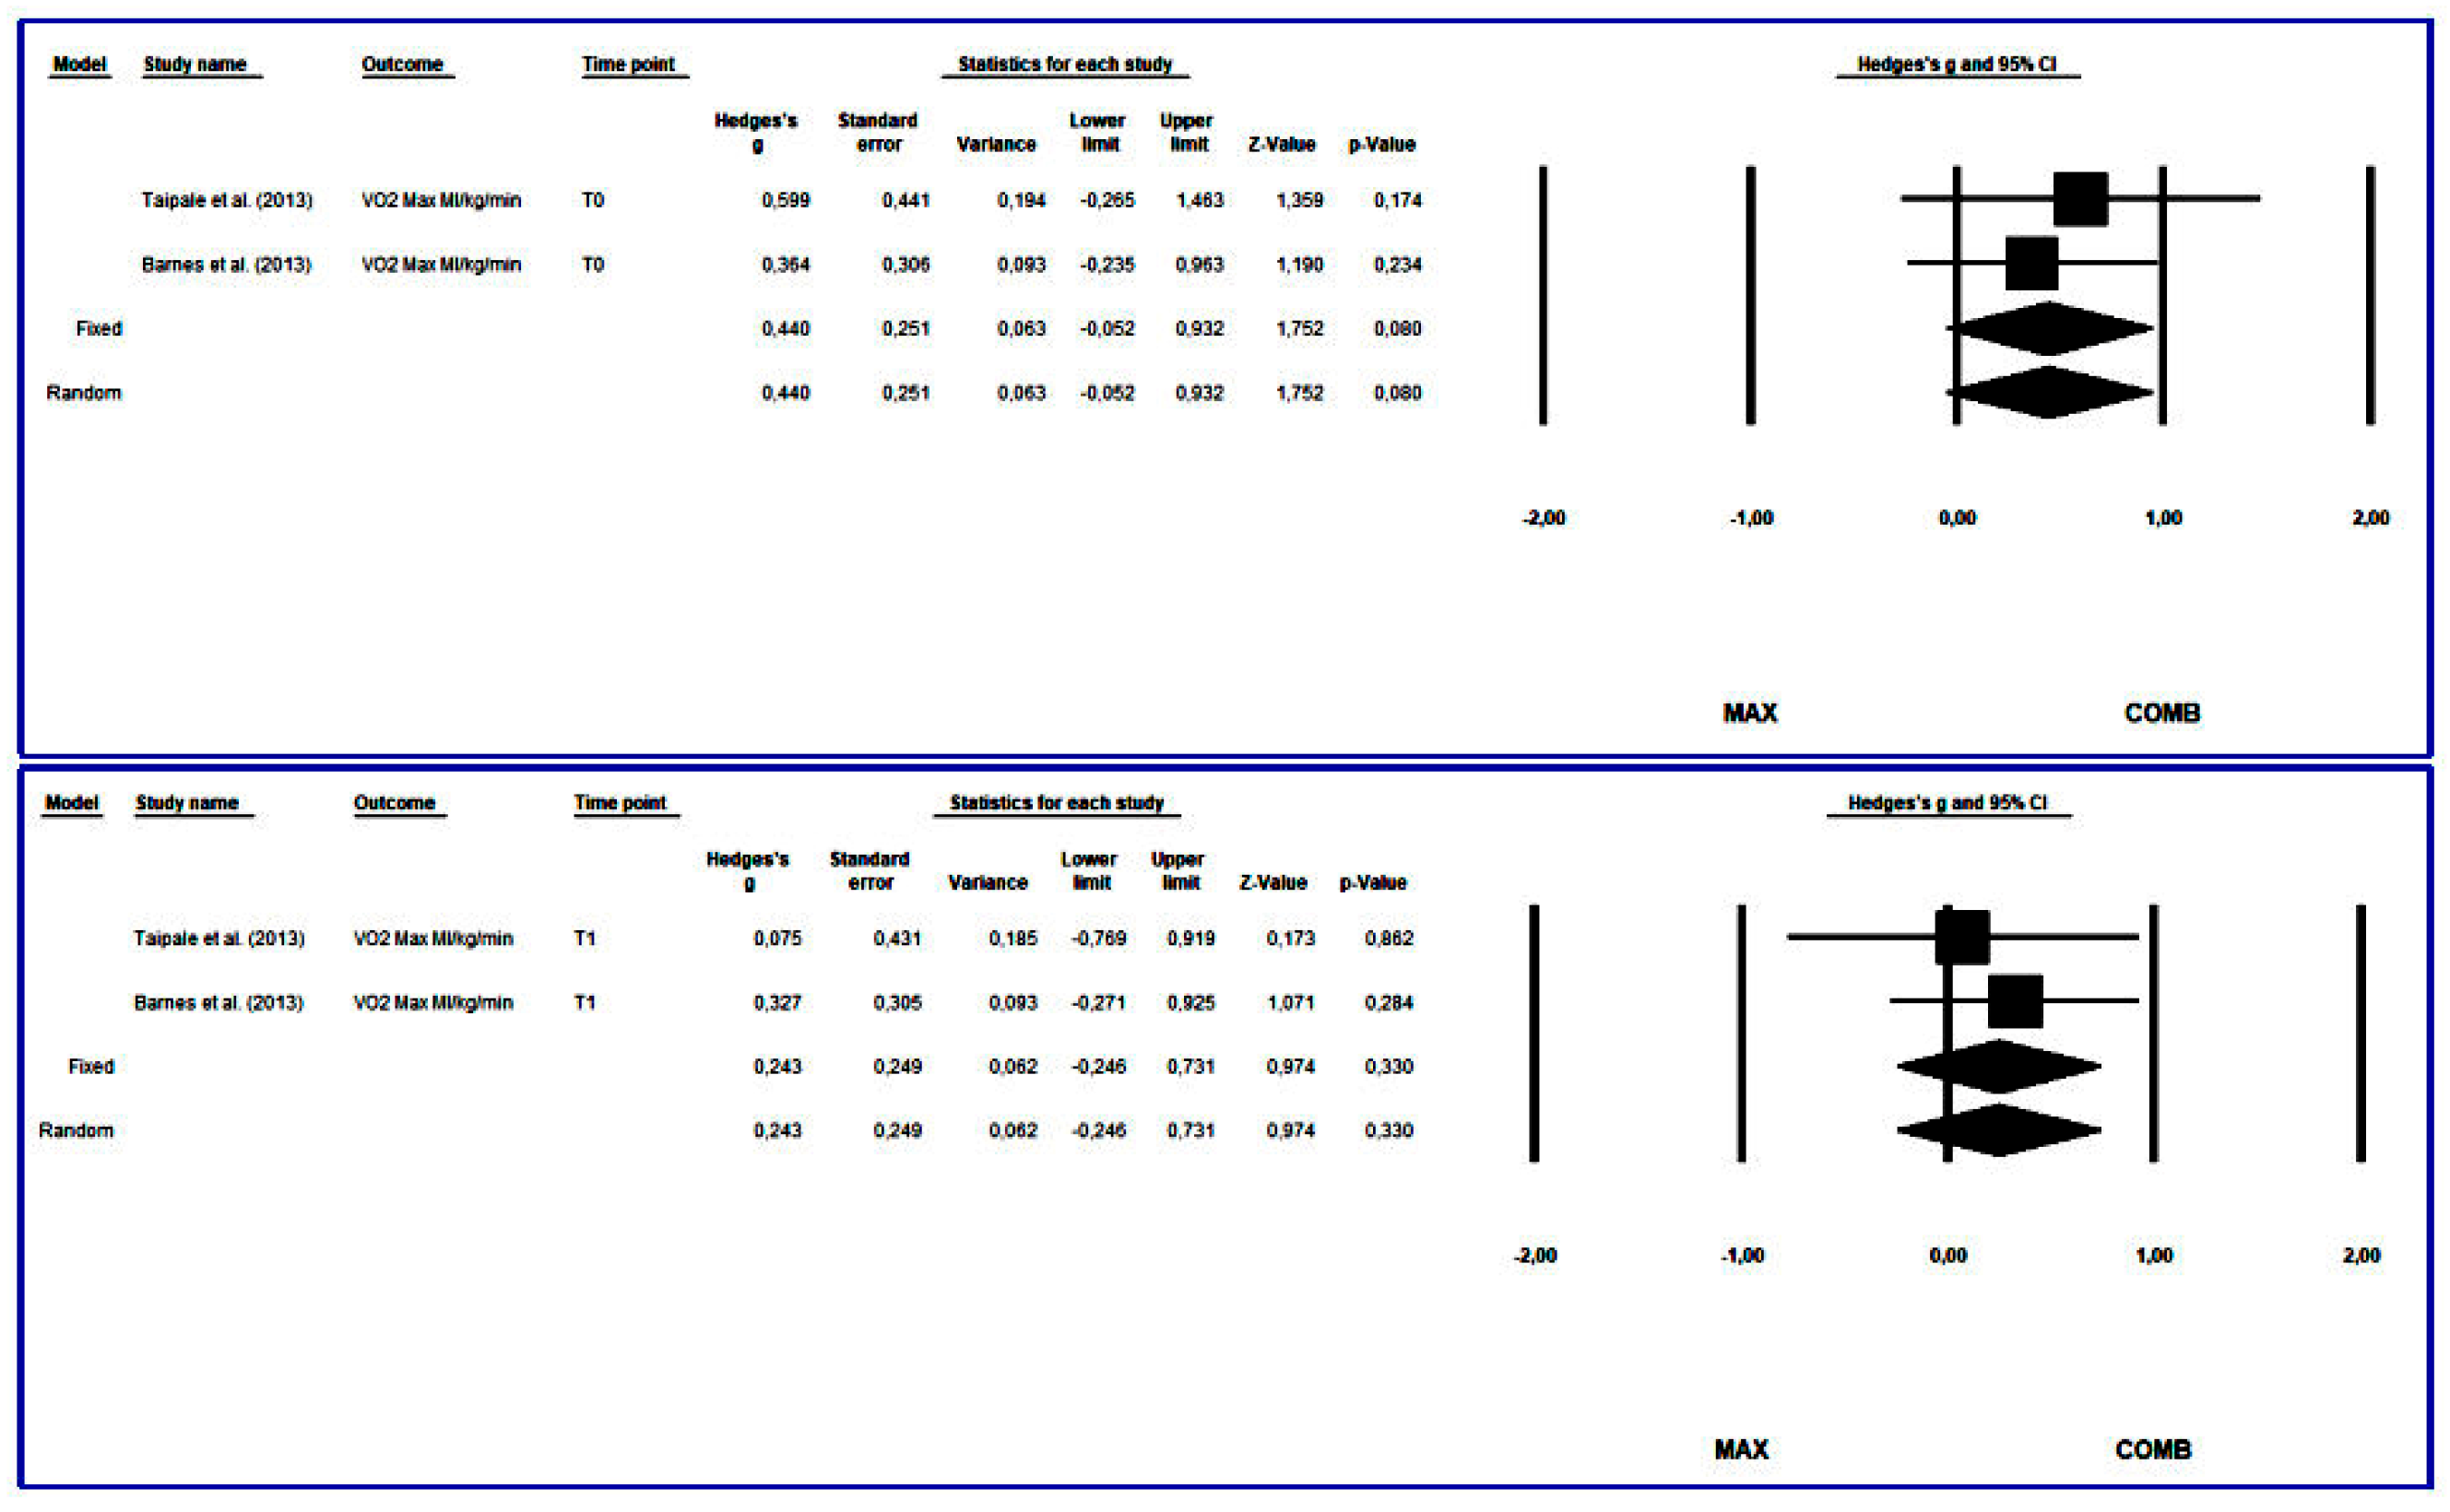
The meta-analysis showed no significant differences in VO2max between study protocols (CON vs. MAX, CON vs. EXP, CON vs. COMB, MAX vs. EXP and MAX vs. COMB; p>0.05; Figure 11, Figure 12 and Figure 13).
Of the 20 studies included in the meta-analysis and where VO2max was assessed, MAX training generated improvements in only one out of nine [1,2,8,24,26,29,34,48,49]. Of the studies where EXP was performed and VO2max evaluated, significant improvements were observed in two out of six [1,34,39,49,51,53]. Additionally, in one research conducted by Taipele et al. [49], it was observed that VO2max improved in the EXP group but not in the MAX group. Significant improvements were observed only in one of the five studies where COMB was applied and VO2max was assessed [2,4,20,37,54]. Finally, significant improvements in VO2max were observed in two studies in the control group (CON [46,50]).

3.4.5. Time Trial

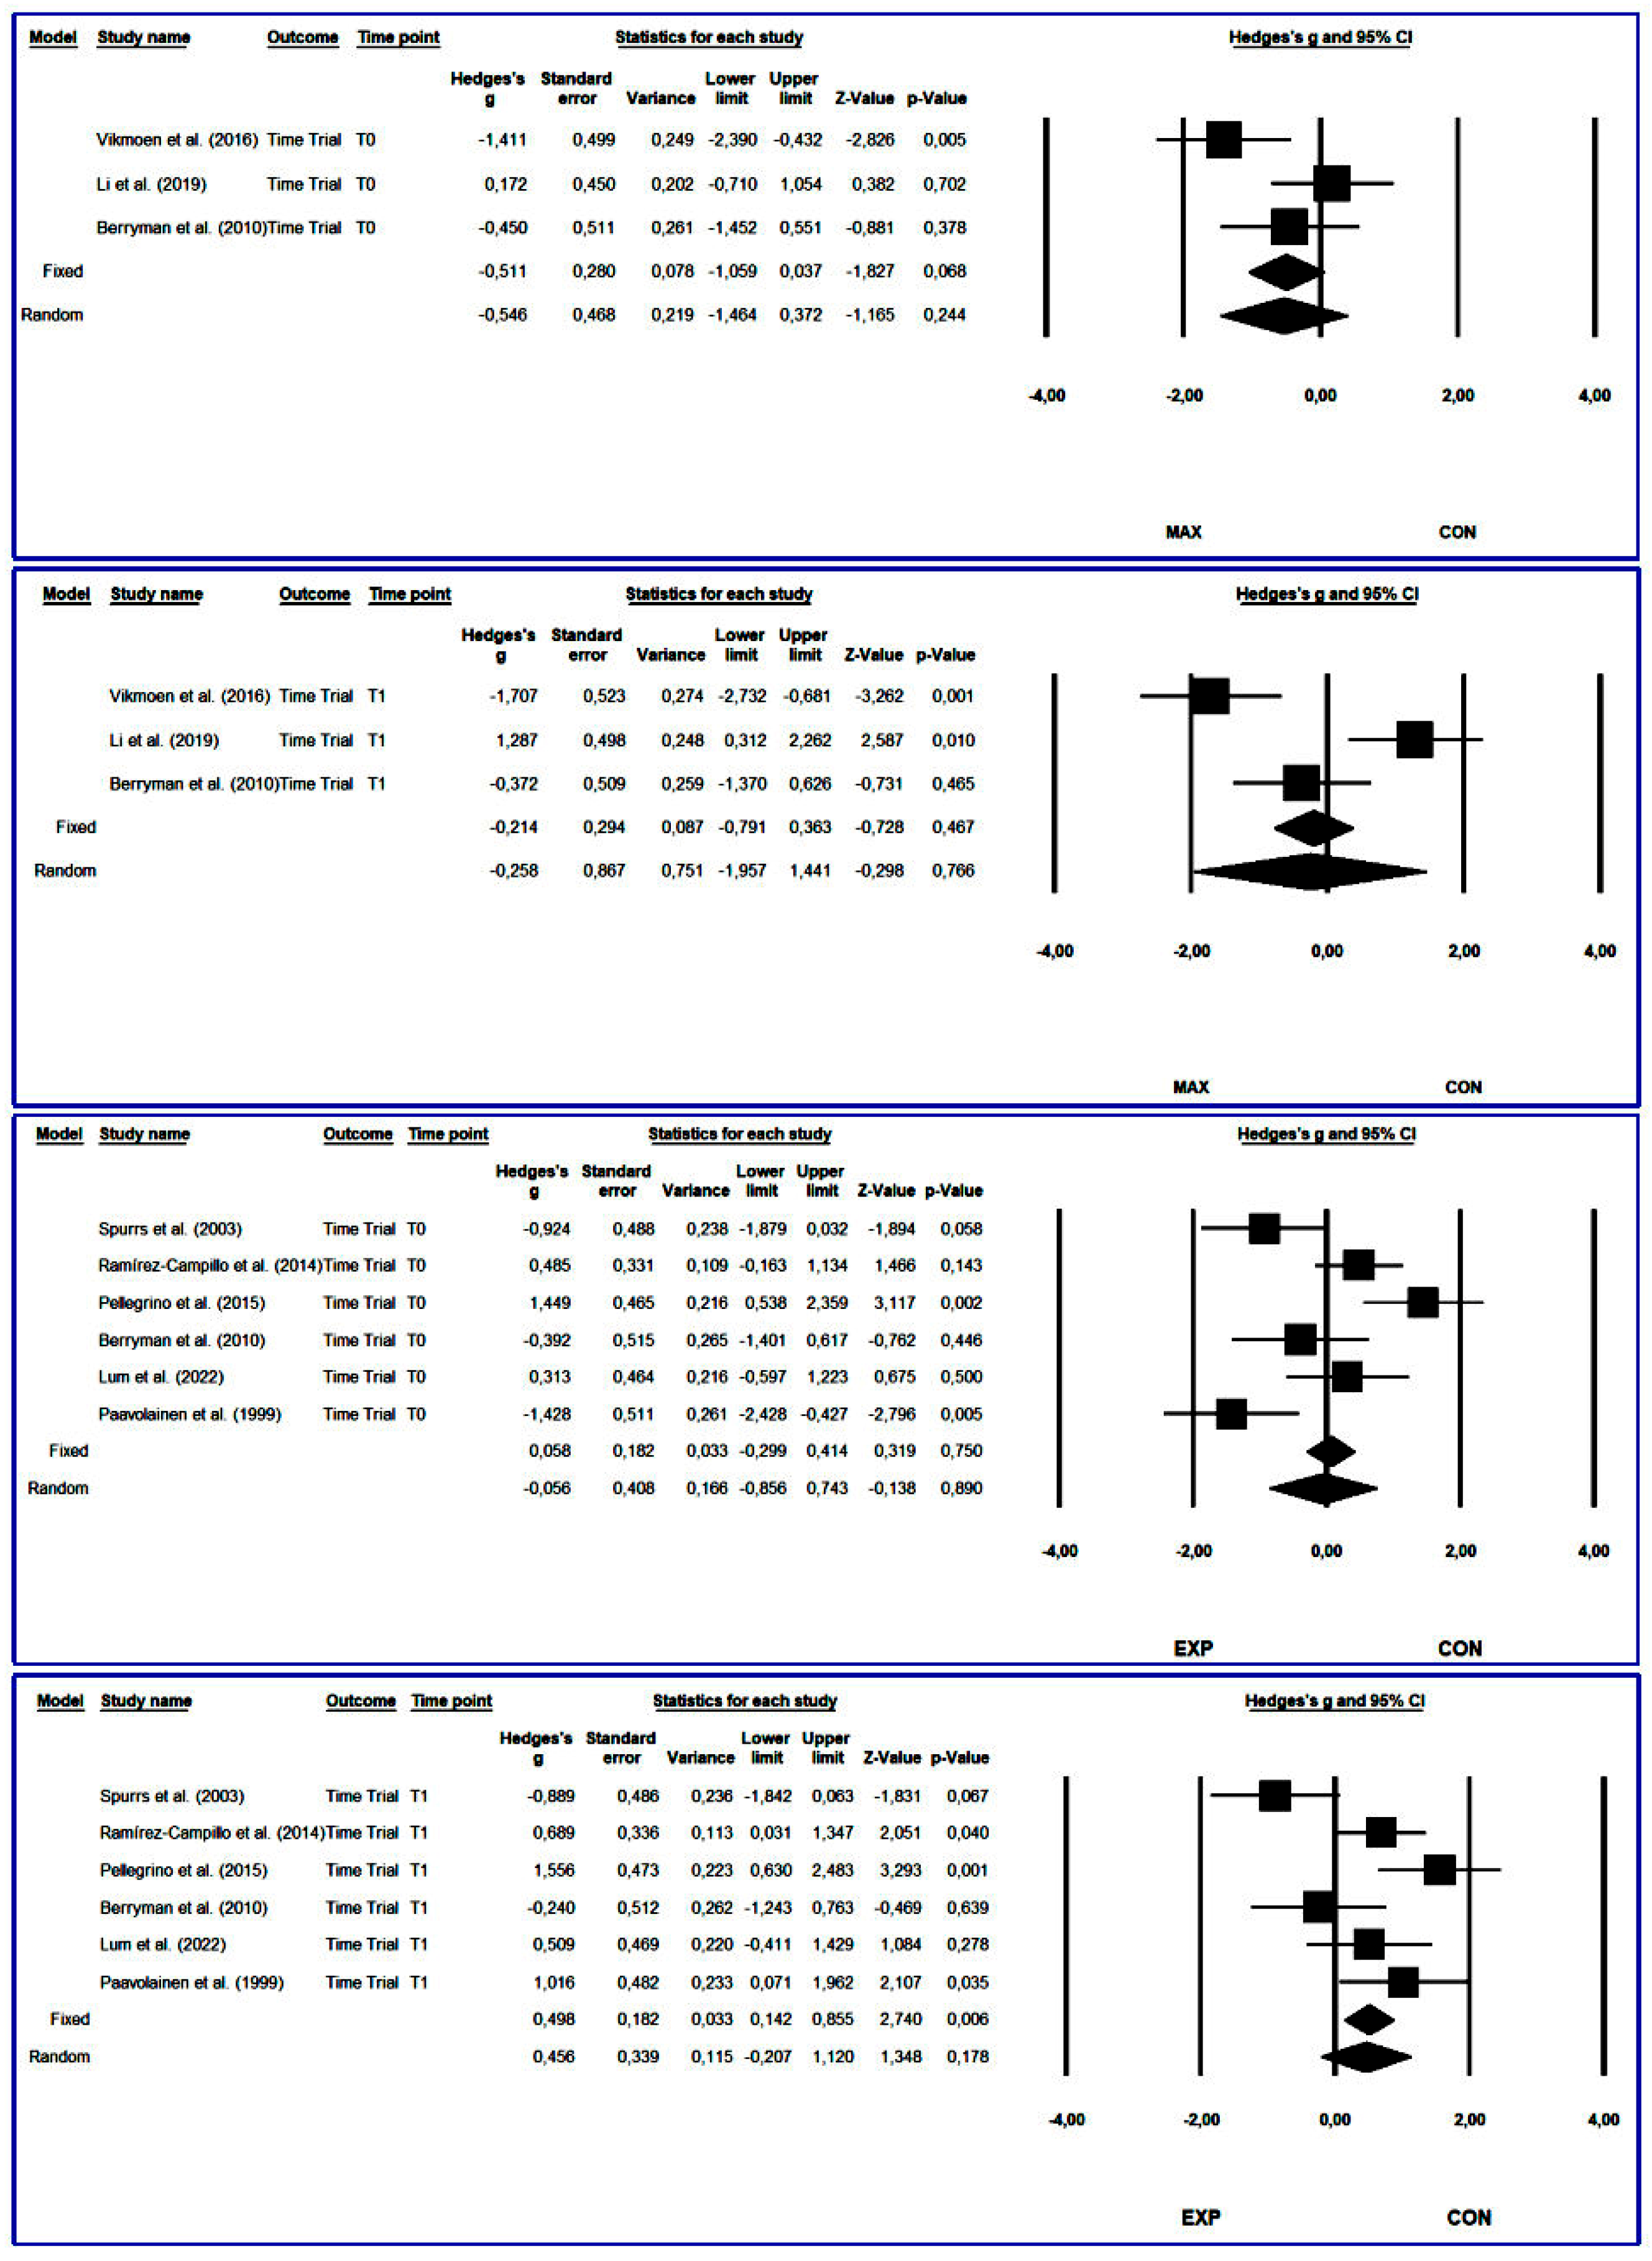
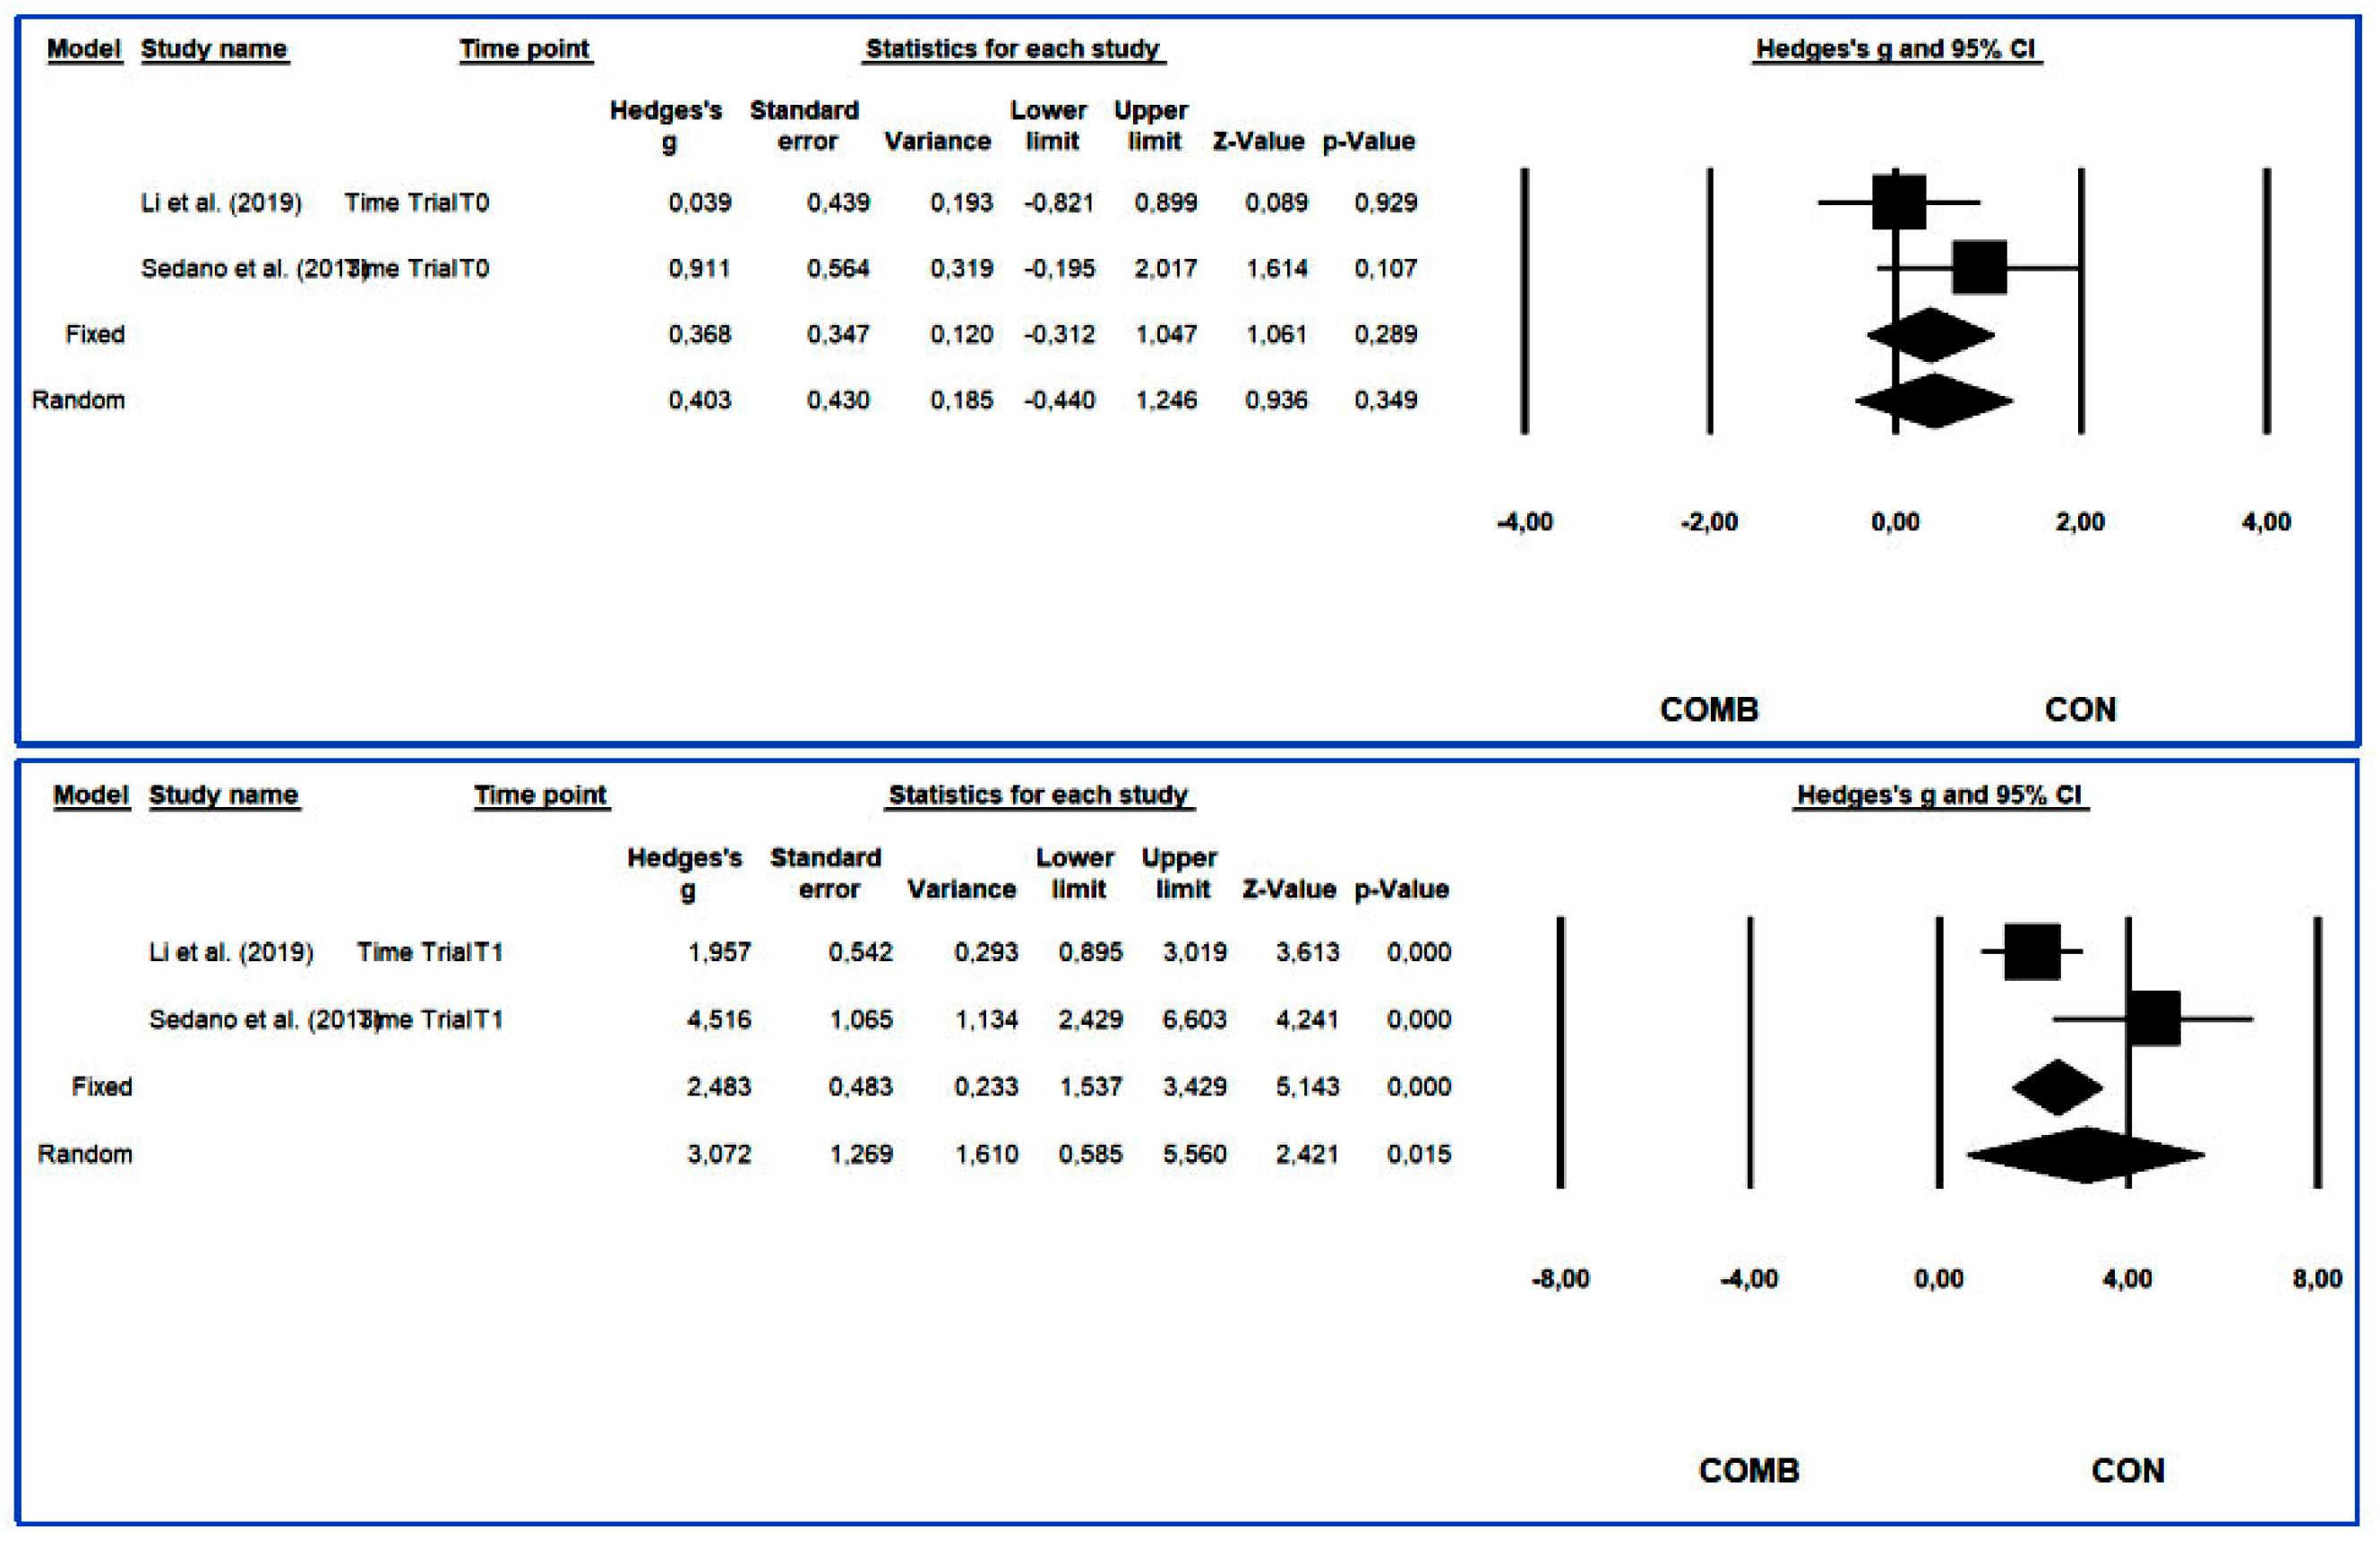
On the one hand, the meta-analysis revealed that MAX and EXP training protocols did not generate significant improvements (p>0.05, Figure 14). However, COMB training produced significant improvements (Hedges g [95%CI]=3.072 [0.585-5.56], ES=1.269; p=0.015; Q=4.589; I2=78.208) with a very large effect side and high heterogeneity (Figure 15). On the other hand, in all studies where EXP [30,34,39,50,52,53] and COMB [2,54] training protocols were applied and TT was measured, significant improvements were observed in this variable. In the case of MAX training, such improvements were observed in two out of three studies [2,26,34].

3.4.6. Peak Velocity

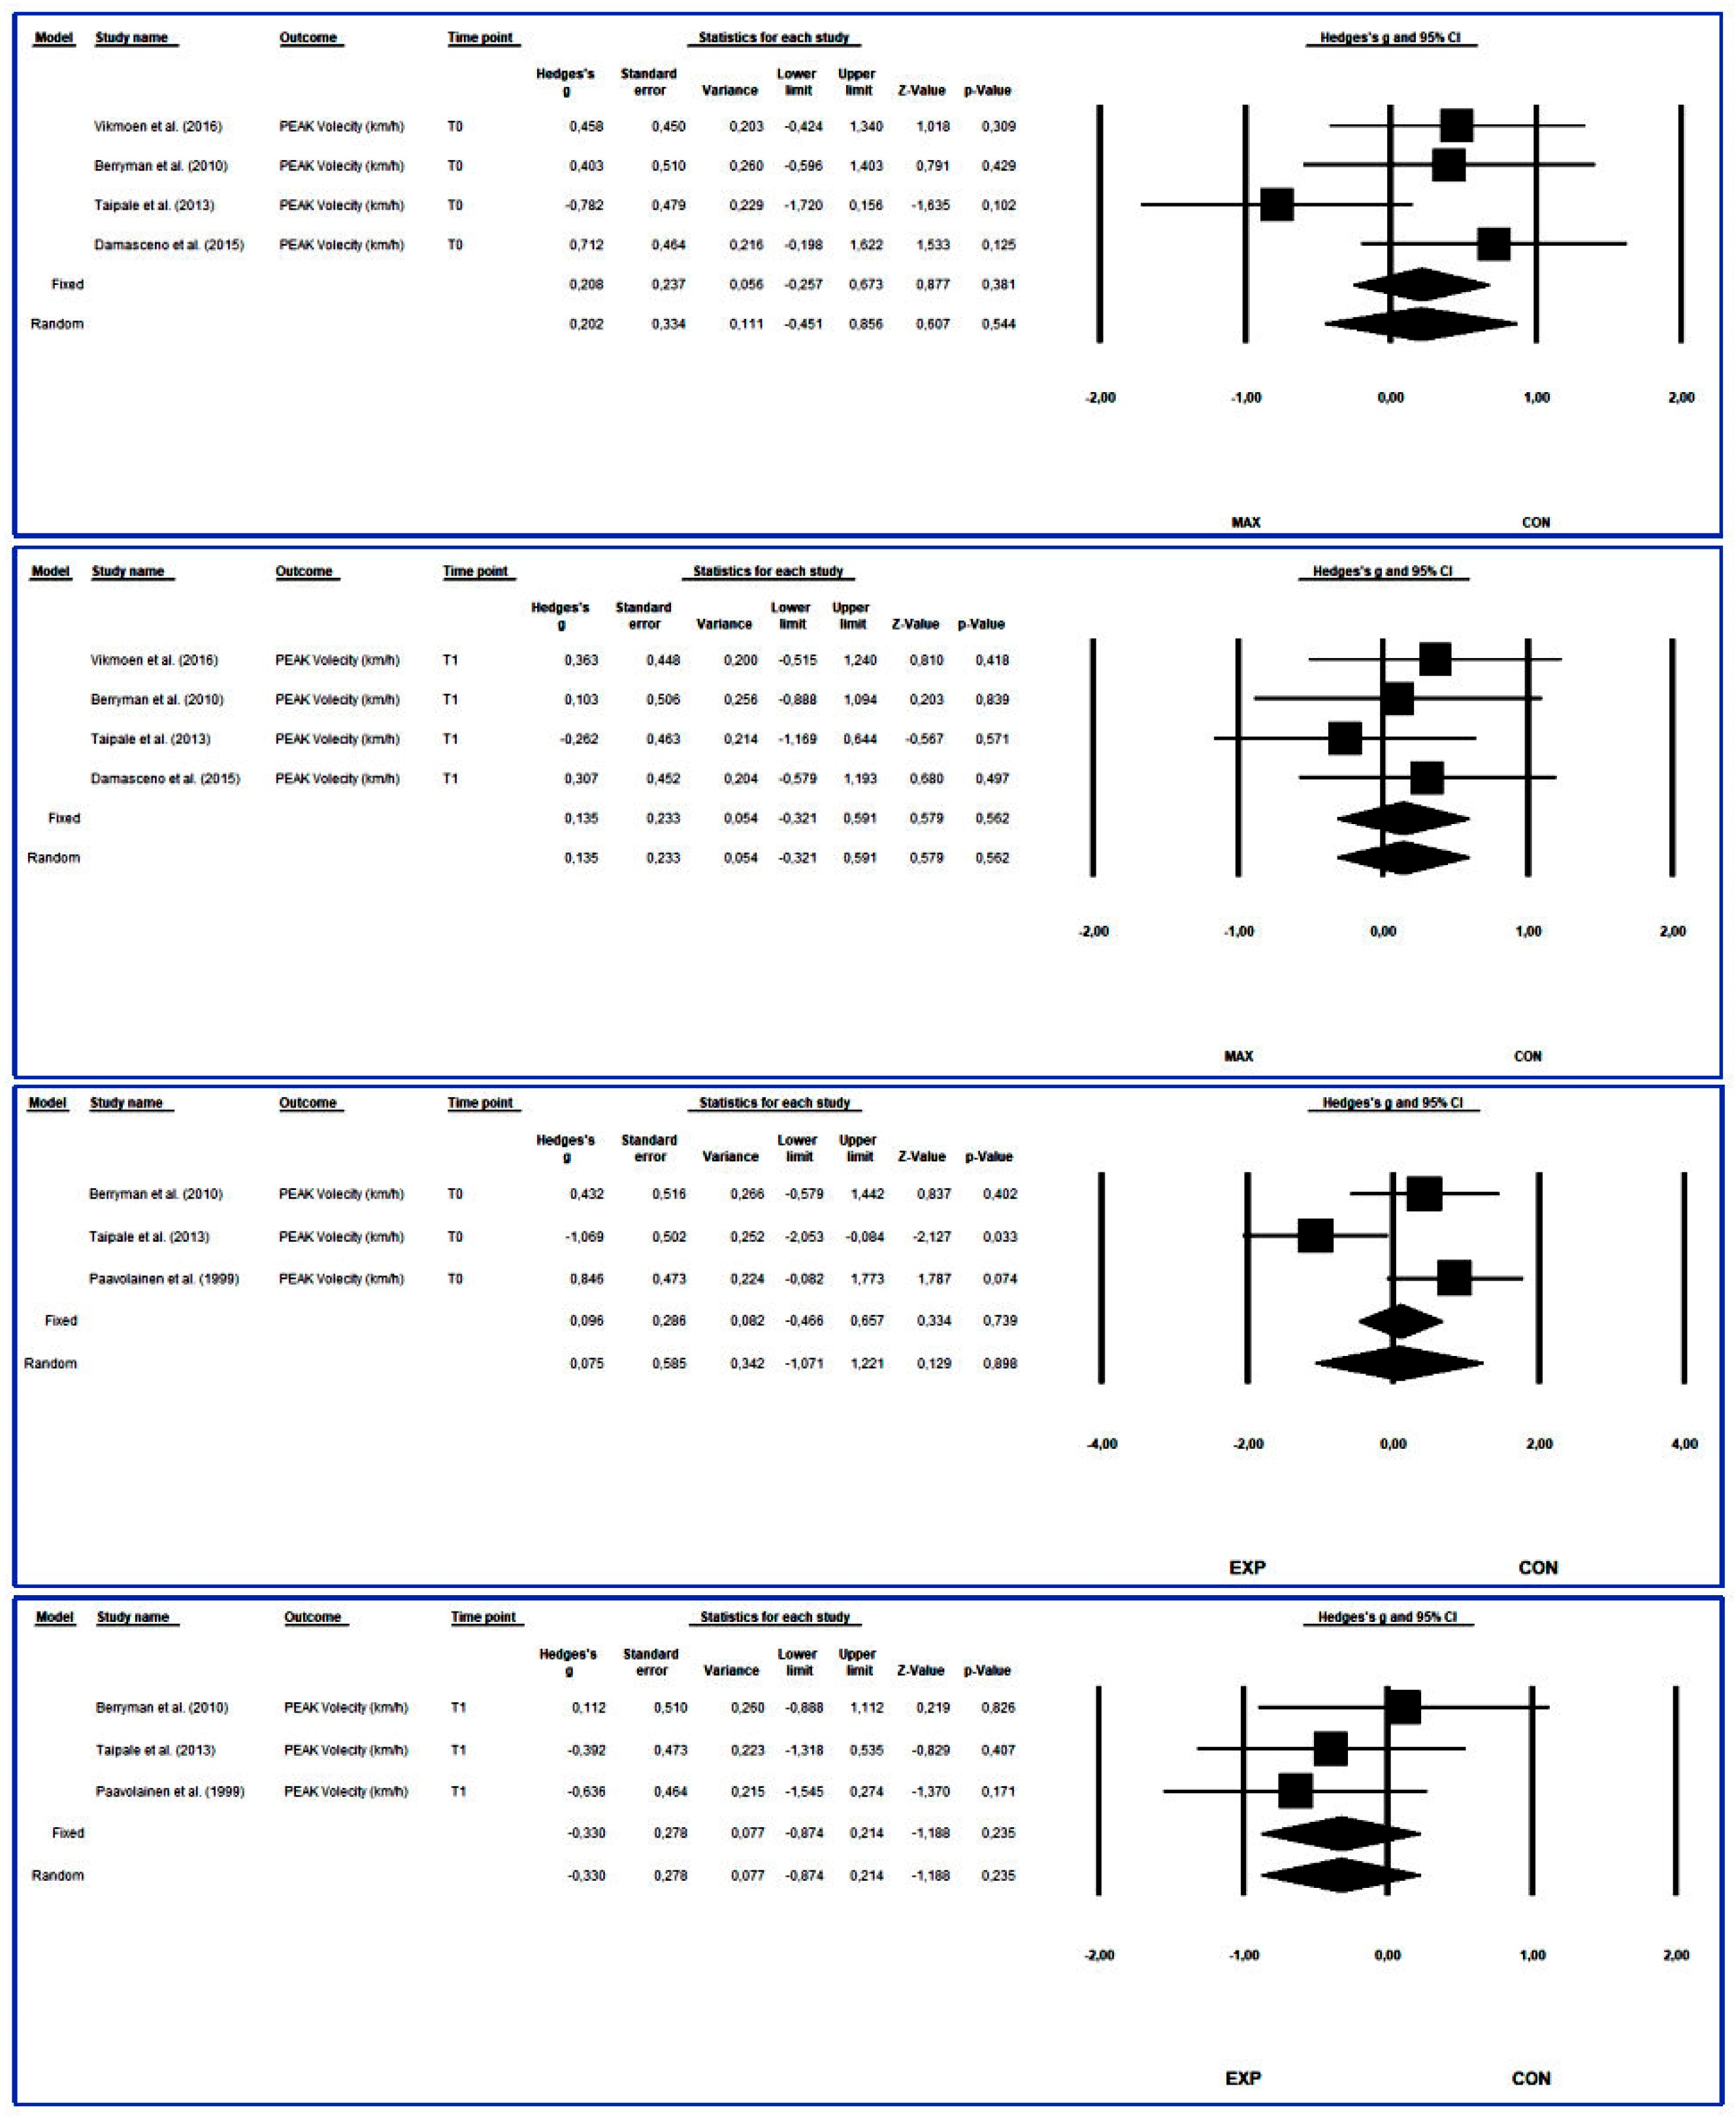
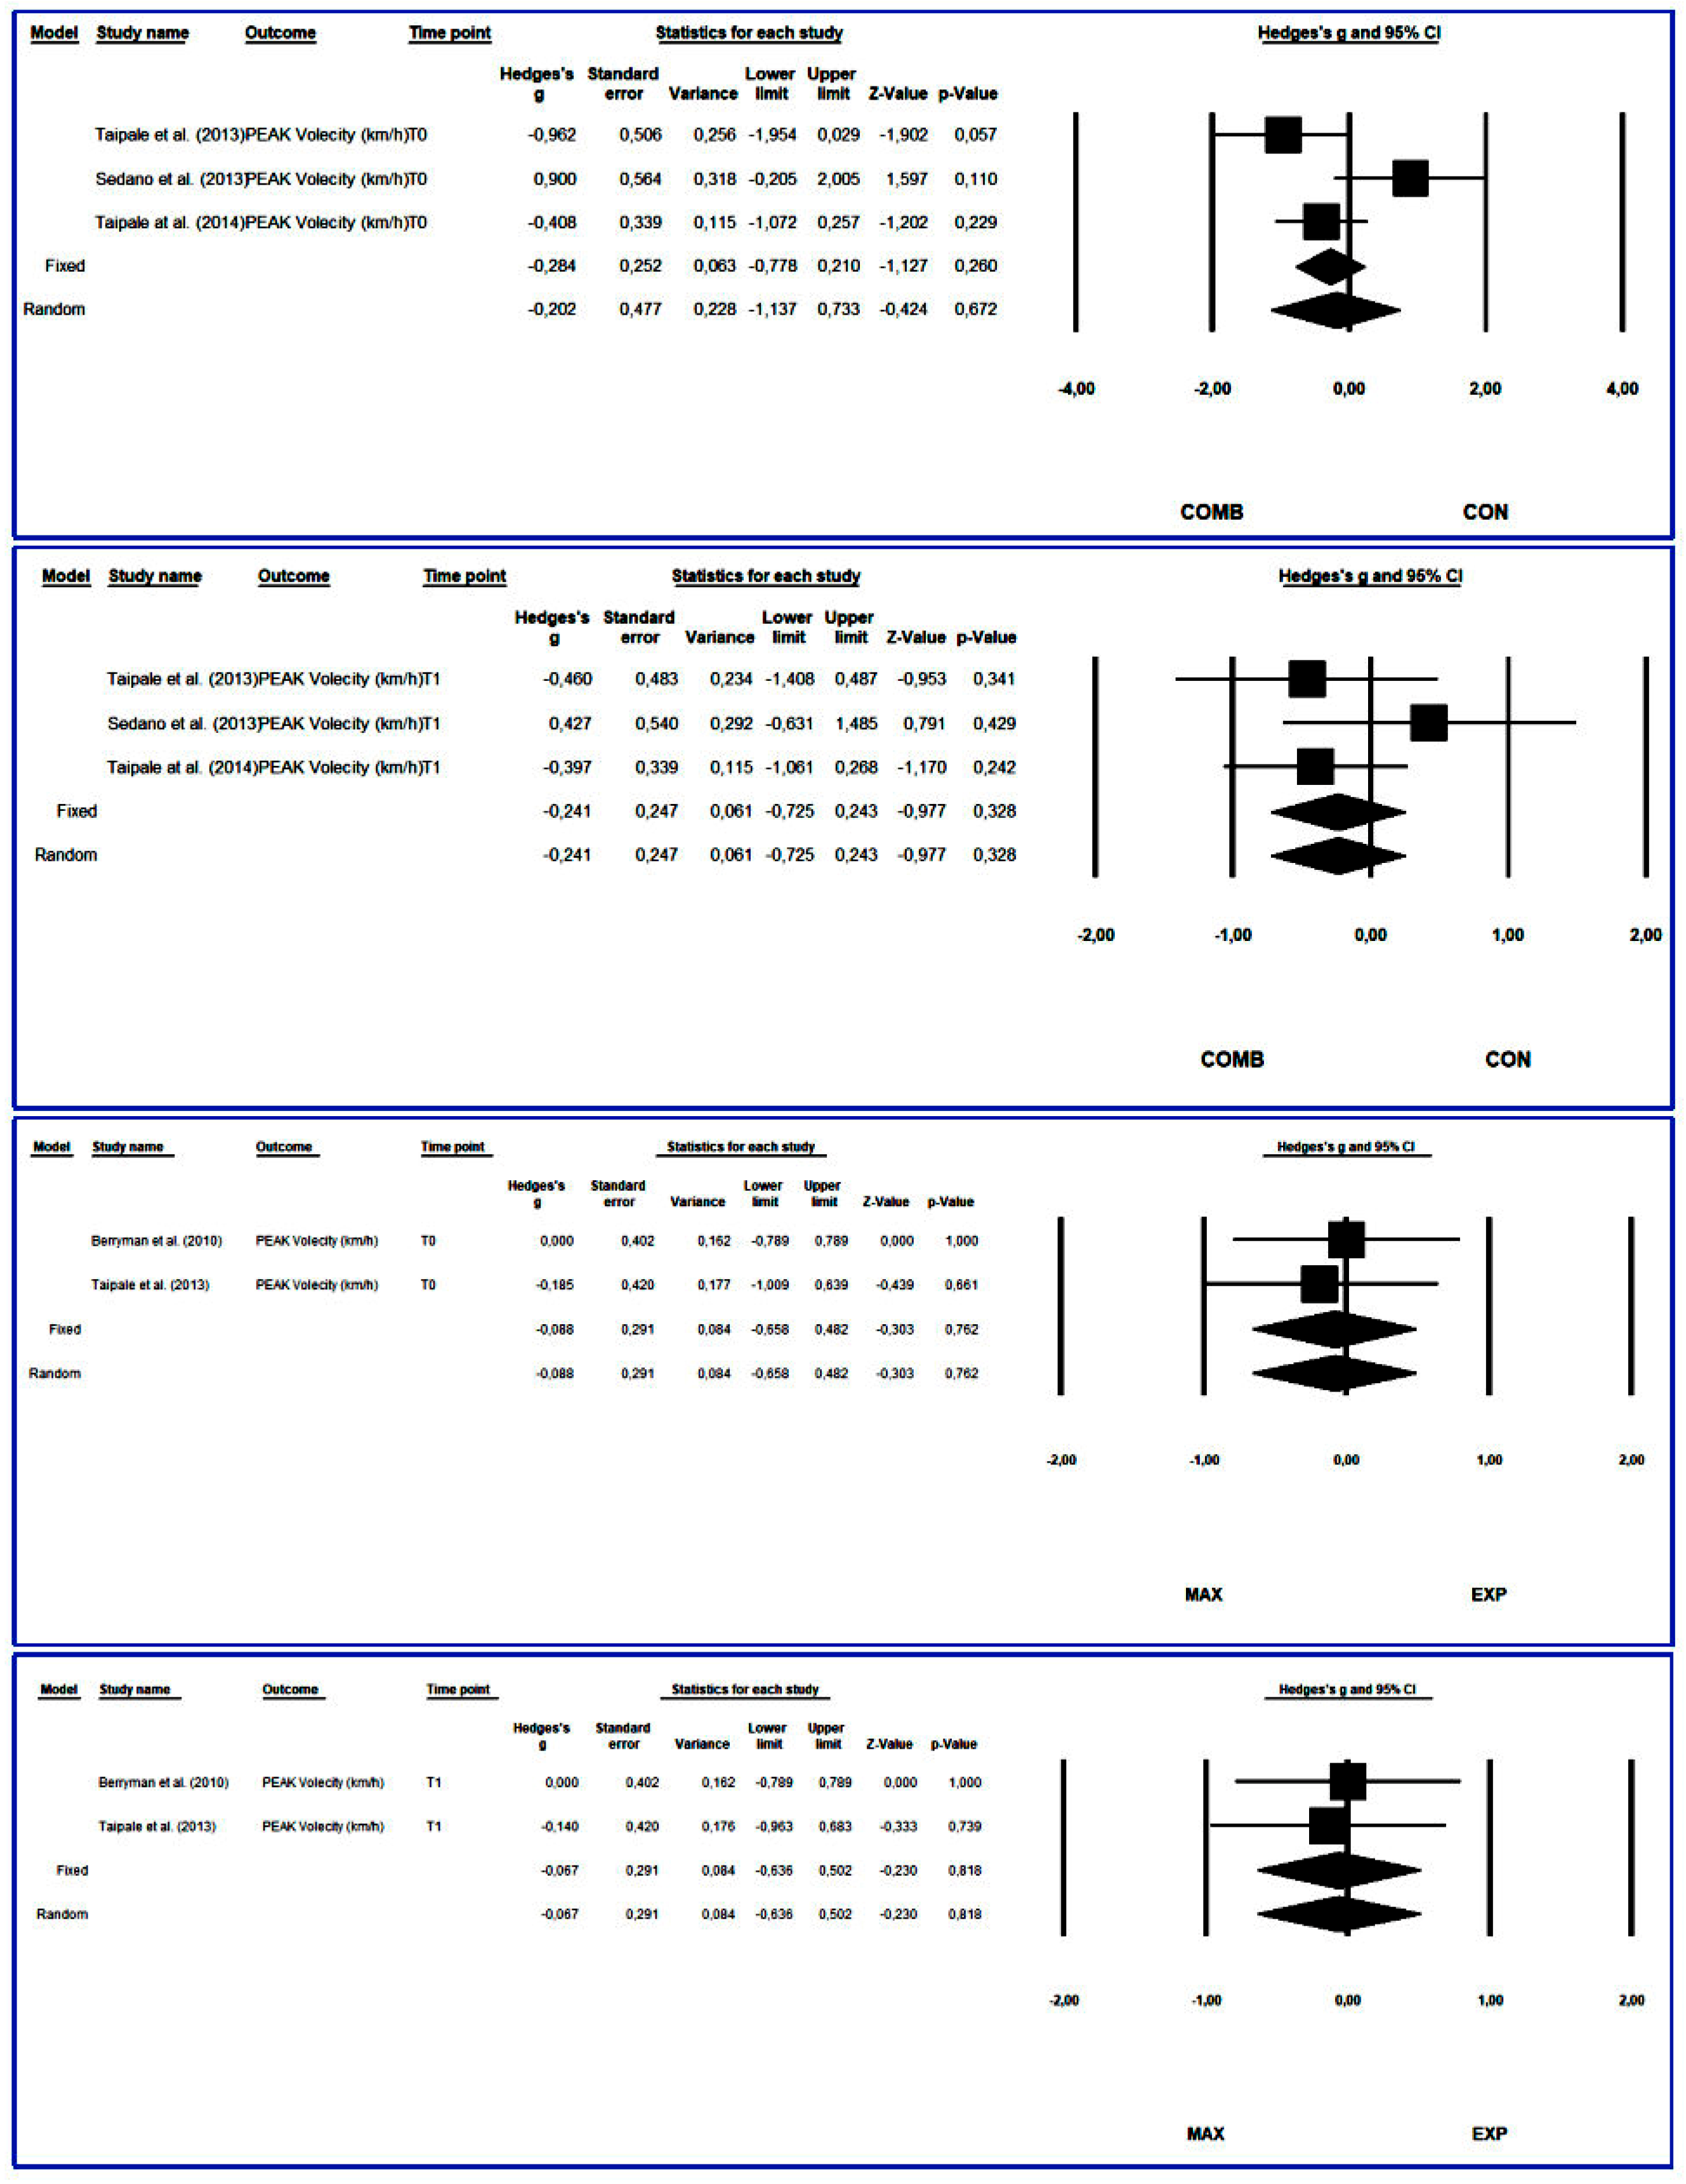
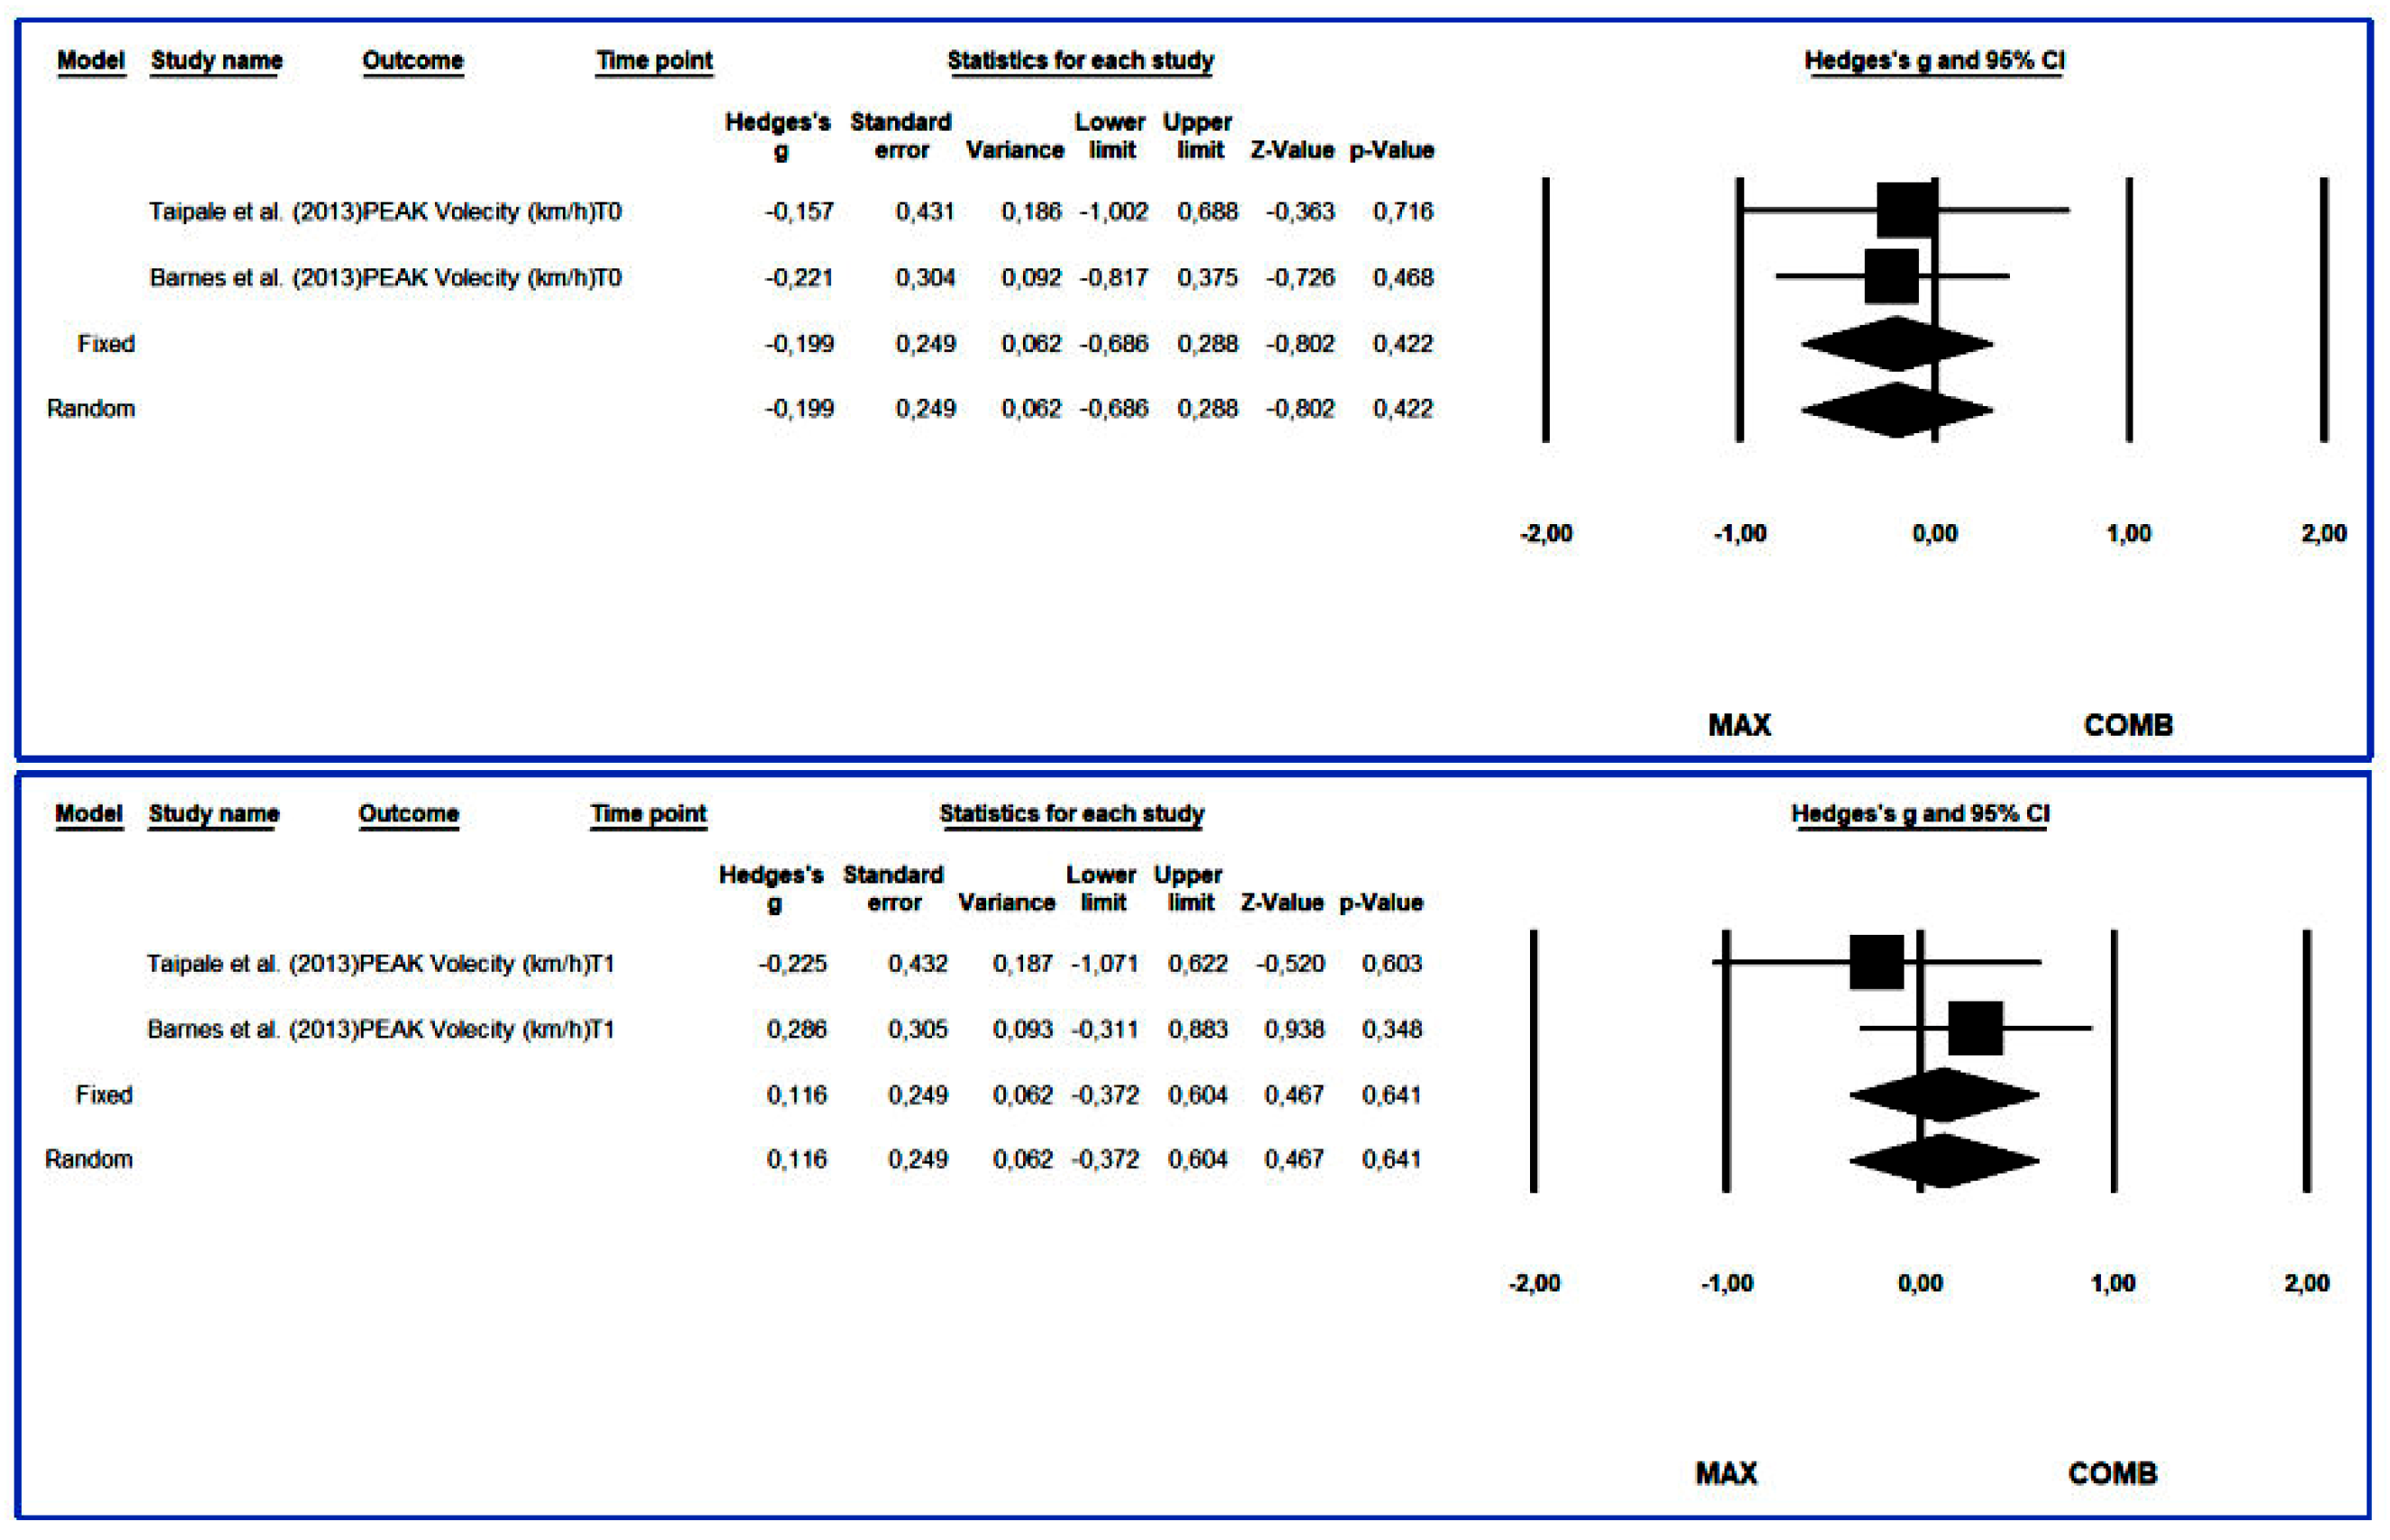
The meta-analysis observed that MAX, EXP and COMB training did not produce significant improvements compared with CON (p>0.05). In addition, no significant differences were found between MAX, EXP and COMB in PV (p>0.05; Figure 16, Figure 17 and Figure 18). In addition, in all the studies where MAX [8,34,37,46], EXP [34,46] and COMB [20,37,46,54] training protocols were used and PV was measured, significant improvements in this variable were observed. Likewise, in the study conducted by Barnes et al. [37], the improvements attained by the MAX group were higher than those of the COMB group.

3.4.7. Lactate Threshold

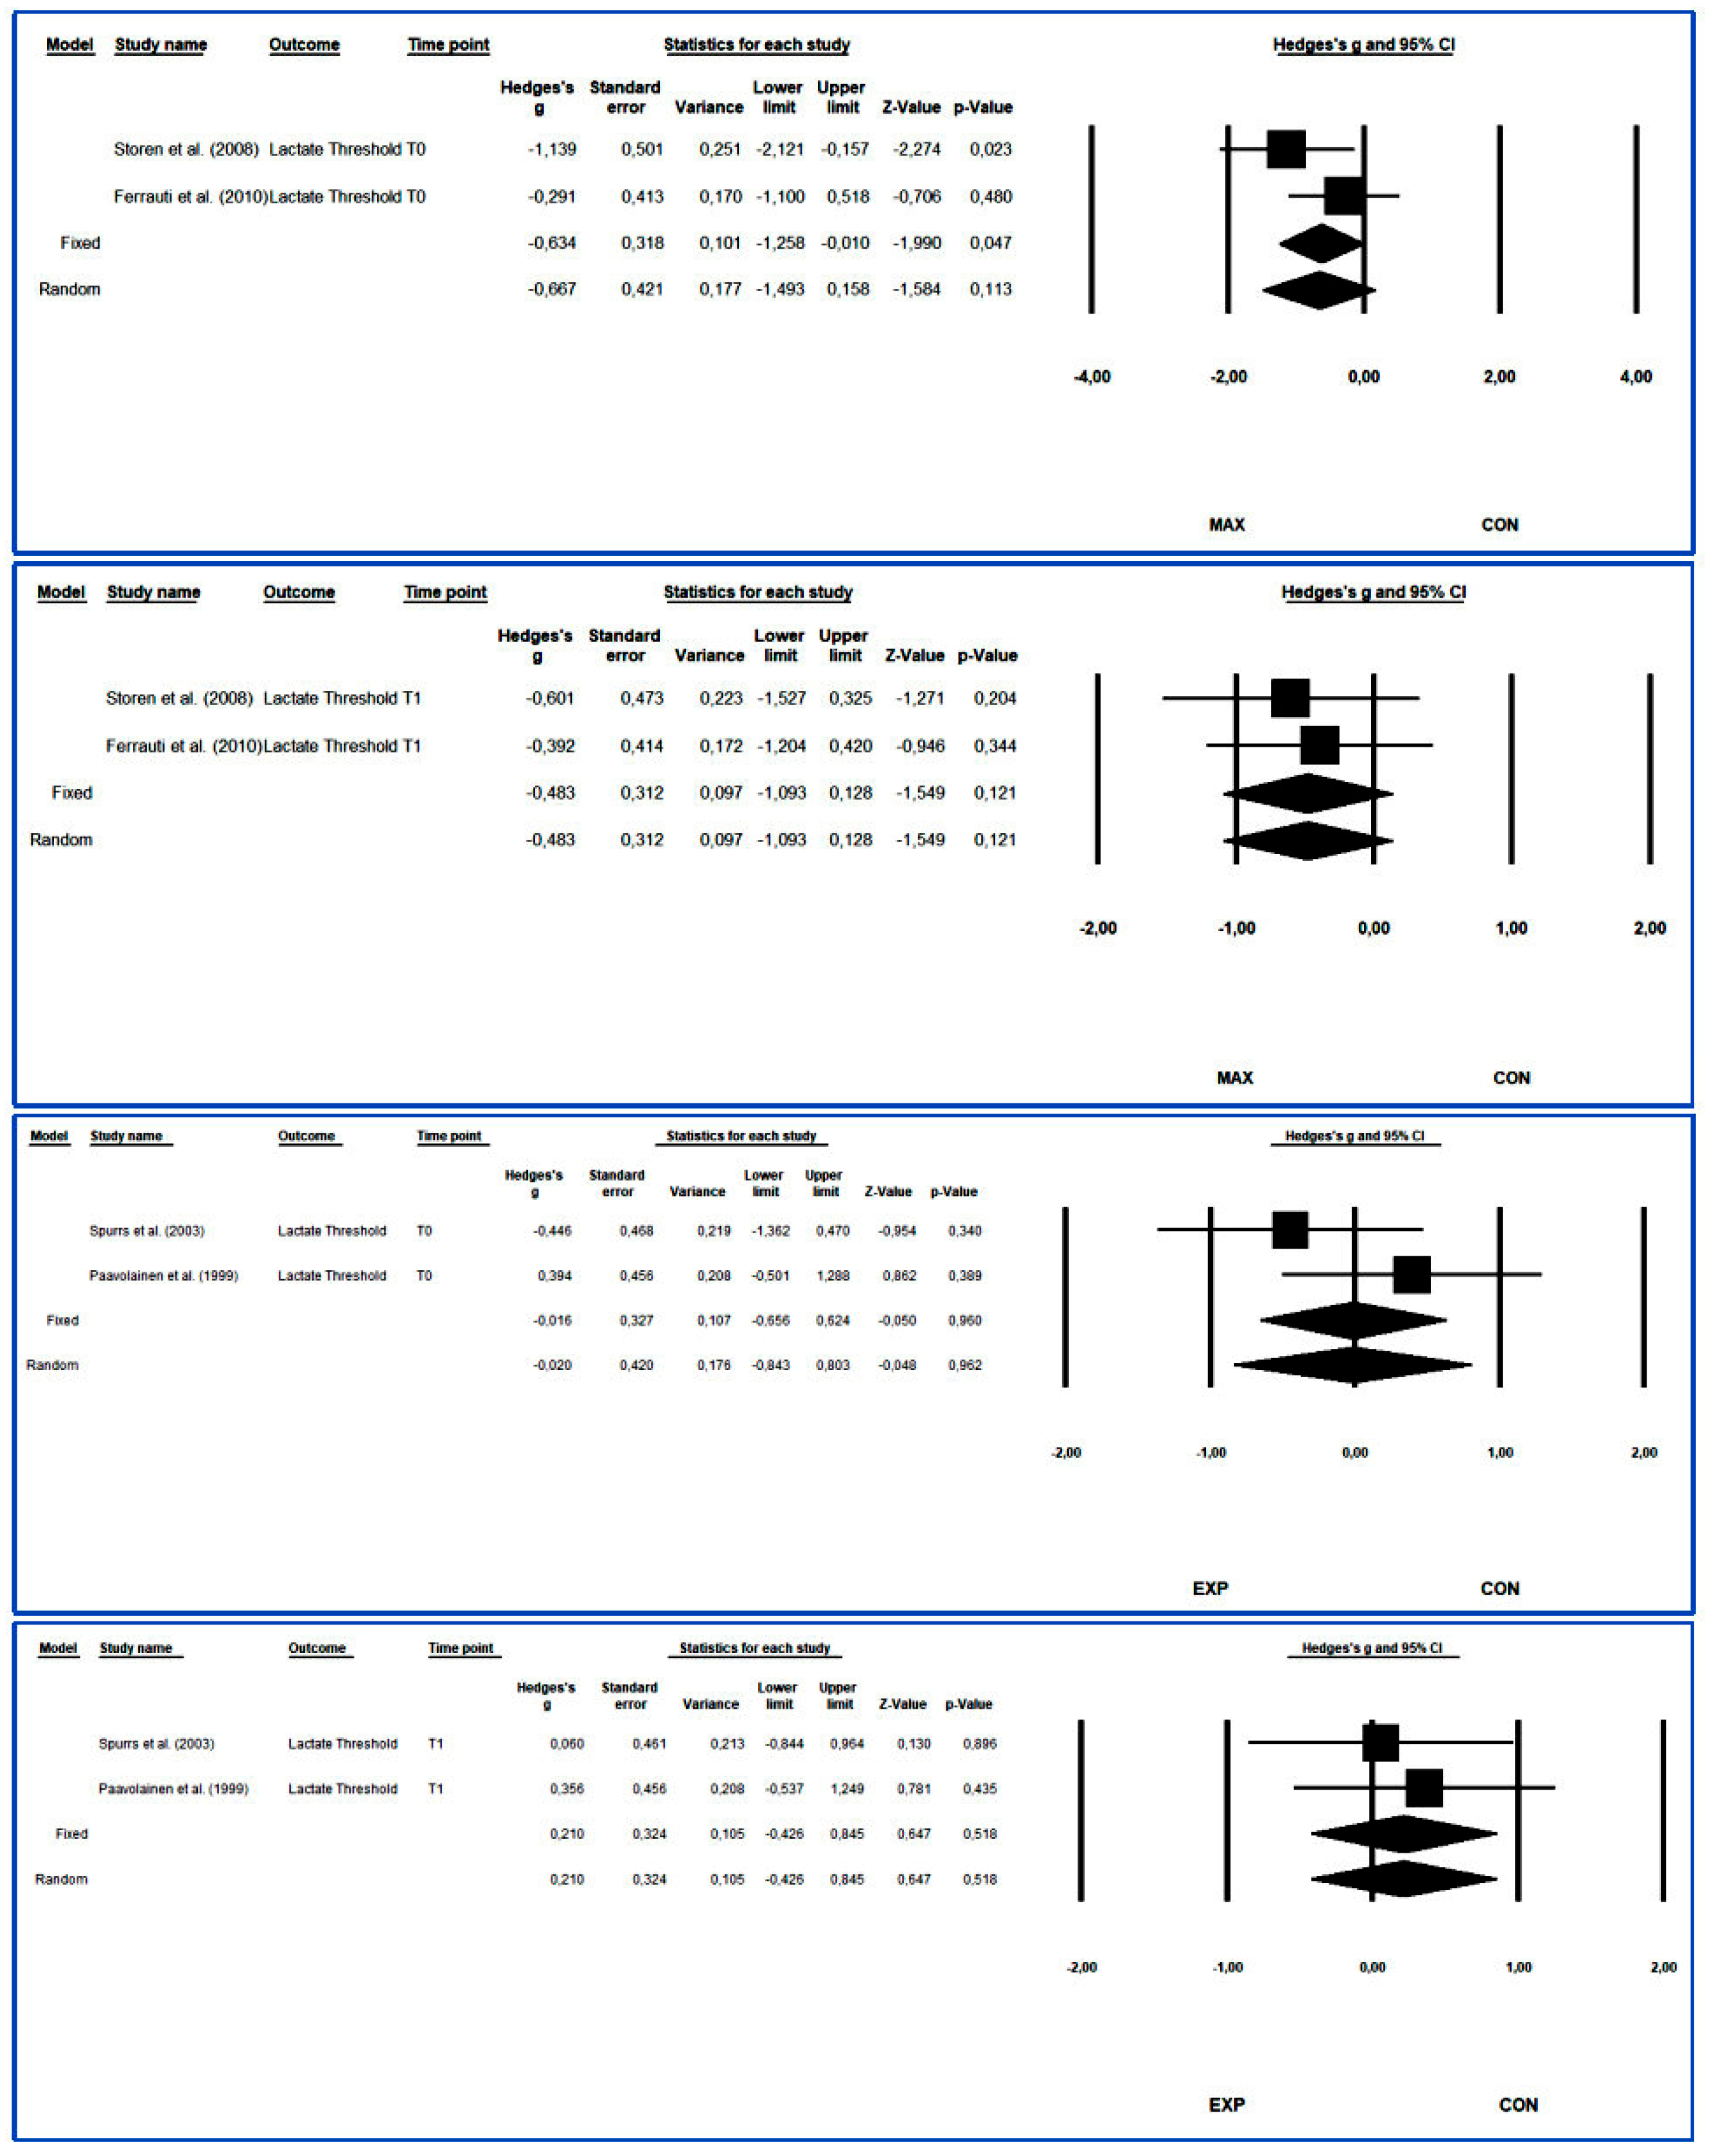
The meta-analysis showed that MAX and EXP training protocols did not significantly improve this variable (p>0.05, Figure 19). Moreover, MAX training significantly improved LT in those studies where this training protocol was applied and LT was assessed [1,24,29]. In contrast, EXP training only improved LT in one of three studies [1,39,50]. Likewise, one study reported improvements in LT in CON [24].

4. Discussion

Based on the results, MAX could be more effective than EXP and COMB in enhancing VJ. This may seem surprising as some of the EXP groups in the meta-analysis did not show significant improvements in VJ, despite performing deep or squat jumps [49,54]. However, evidence indicates that explosive strength training improves VJ [55]. One possible explanation for the lack of VJ improvement in some EXP training studies is the forward movement in the explosive strength exercises (see Table 3 [53]). Moreover, concurrent training protocols might have attenuated the VJ improvements, as seen in previous studies [56,57]. VJ is a valuable indicator for monitoring neuromuscular interferences from concurrent training [56]. Significant VJ improvements cannot occur in recreational [49] and well-trained athletes [53]. Furthermore, the effect size of VJ improvements in the meta-analysis in MAX groups was small and in EXP groups very small. This reinforces the notion of potential attenuation of adaptions due to concurrent training protocols [58,59]. Additionally, evidence suggests that concurrent training is more likely to attenuate power adaptations than MAX adaptations [60].
As for COMB training, although the five studies in the meta-analysis reported significant improvements in VJ after performing COMB protocols [2,4,20,46,54], the pooled effect in the meta-analysis showed no significant improvements. The reason for this discrepancy could be the small size of the improvements. It is plausible that COMB combined with endurance training might not be the most effective strategy to improve VJ since, while COMB can favour post-activation potentiation [40], some studies also indicate that higher weekly concurrent training volume can lead to greater interference with VJ improvements [1,20,33].
Based on the results, it was found that MAX training leads to greater improvements than COMB and EXP protocols in 1RM. These improvements are of great magnitude in both recreational and well-trained athletes. This large increase may be because middle- and long-distance runners do not habitually engage in strength training [63]. After all, they were concerned about developing two opposing fitness components, which could lead to interference effects and potentially deteriorate their performance [54,62]. COMB protocols have also proven effective in enhancing 1RM, but the effect size is smaller than MAX training. This could be attributed to the potential attenuation in maxi-mal strength adaptations when combining three training modalities (MAX, EXP and endurance). In the case of the EXP training protocols included in the present meta-analysis, no significant improvements in 1RM were observed when the study participants were highly trained subjects [53]. This outcome was expected and reflected that experienced athletes may require heavy loads and specific training to enhance their maximal strength.
One of the primary goals of endurance runners when incorporating strength training is to enhance running economy (RE), as it is considered a better indicator of endurance performance than VO2max [4]. Nevertheless, based on the results, none of the three modalities (MAX, EXP, COMB) demonstrated superiority in improving RE. Accordingly, in one study by Barnes et al. [37], MAX was more effective than COMB in improving RE, whereas in the research conducted by Berryman et al. [34], EXP outperformed MAX. Also, the pooled effect was not statistically significant in the three cases (MAX, EXP and COMB). There are a couple of potential reasons for this. Firstly, the magnitude of the improvements in RE was relatively small; secondly, in some studies, significant improvements in RE were observed only at specific running speeds [2]. Researchers such as Lum et al. consider that the absence of significant RE enhancements after EXP training could be attributed to the training methodology due to the reduced percentage of work applied in each stride in trained athletes [30]. Regarding MAX and COMB training, the reasons for the absence of significant improvements in RE observed in some of the 20 studies analyzed remain unclear. Mikkola et al. propose that this might be linked to differences in the athletes´ training backgrounds [1] and the limited improvements in explosive strength, which could hinder the efficient use of elastic energy in the stride.
As expected, the meta-analysis reflected the absence of significant improvements across groups. These results are consistent with the fact that in most of the 20 studies analyzed, no significant improvements were detected either after applying concurrent training protocols or with single-mode endurance training. Moreover, these results align with previous research showing limited enhancements in VO2max with concurrent training in most cases [3]. Thus, concurrent training may not confer a significant advantage in enhancing VO2max compared with single-mode endurance training. Further, it is essential to consider that strength training can lead to undesired adaptations in middle- and long-distance runners, such as muscle hypertrophy and reductions in capillary diameter and number [22]. Therefore, applying concurrent training to these athletes should avoid negatively impacting their VO2max. At this point, it is worth noting that despite VO2max being a key performance variable in endurance runners, its trainability is conditioned by genetic factors [63]. Additionally, specific endurance training methods, like interval training, are essential for improving VO2max [64], and not all of the endurance protocols in the 20 studies included these methods consistently. Also, it is important to acknowledge that improvements in VO2max are more likely to occur in individuals with lower levels of aerobic fitness [65]. However, this statement only partially agrees with the current study´s result. Of the six studies carried out with recreational subjects, significant improvements in VO2max were observed in three of them [20,46,49].
Endurance runners aim to enhance their TT as a primary objective and achieve partial goals like improving LT, VO2max and RE. According to the results of this study, COMB training may be more effective in improving TT than MAX and EXP training. The reason might be that combined MAX and EXP training favors the post-activation potentiation by improving the myosin regulatory light chains phosphorylation [66]. Thus, it is possible that COMB training —which is a time-efficient training method [2]— can be transferable more easily to running technique than EXP and MAX training. This aspect is relevant since transferring strength gains to the actual running performance is a significant challenge for endurance runners practising concurrent training. Currently, there is no clear evidence of this transfer. Researchers like Trowell et al. suggest that improvements in TT following MAX and COMB training could be attributed to exercises like squats, which enhance MAX and peak power, leading to a reduction in the force applied by the runner in each stride [13]. This implies that TT improvements are related to gains in strength rather than improvements in VO2max, which is consistent with the fact that, in most of the 20 studies analyzed, TT improved without a corresponding increase in VO2max [2,34,39,50]. Finally, it is important to highlight that one of the studies included in the meta-analysis did not show a significant improvement in TT after MAX training. The reasons for this are unclear, but the absence of improvements in RE might be related to the lack of statistical significance in TT improvement [26].
PV is a valuable performance indicator in endurance sports [50]. It enables middle- and long-distance runners to sustain a constant velocity or execute technical actions with reduced force application [2]. This variable relates RE and VO2max in a single figure, offering insights into performance [20]. The results of this investigation demonstrate the utility of all three training protocols (MAX, EXP, COMB) in enhancing PV. However, the meta-analysis findings reveal only modest improvements, notably smaller than the substantial gains observed in 1RM. This outcome difference may be because concurrent training may interfere more with anaerobic power-related adaptations than MAX adaptations, as observed in a recent study involving recreationally active males [67]. Moreover, one of the 20 studies analyzed reported that MAX training was more effective than COMB in improving PV. This difference could be because MAX has a greater effect on improving muscle rigidity [37].
Improving LT is one of the main objectives of endurance athletes due to its correlation with sports performance [68]. However, based on the meta-analysis, LT improvements were small in size in this research. The reason could be that neither MAX nor EXP significantly enhances anaerobic enzymes´ functioning and muscle’s buffering capacity [69,70]. Interestingly, MAX training showed improvements in all three studies where it was assessed, whereas EXP training resulted in improvements in only one out of three studies. Consequently, MAX may be more effective than EXP in enhancing LT. Concerning the impact of COMB training on LT, while COMB protocols were included in five of the 20 studies chosen for the meta-analysis, none specifically evaluated LT. Therefore, further research is needed to investigate the effect of COMB training on LT and compare it with the effects of MAX and EXP training.
Additionally, it is important to recognize that one of the primary reasons for implementing concurrent training programs in endurance runners is the role of striated skeletal muscles in managing and eliminating lactic acid [71]. Therefore, based on the findings of this study, focusing on muscular endurance, as opposed to MAX and EXP training, might be a more suitable approach to achieve this physiological objective in middle- and long-distance runners due to its greater specificity regarding lactate concentration, training exercises performed and metabolic pathway used [72,73].
Concurrent training seems more effective than single-mode endurance training for enhancing endurance performance in middle- and long-distance runners. MAX training is more useful than EXP and COMB training in achieving specific objectives. These objectives include increasing maximum and explosive lower body strength and improving LT and PV. These findings are consistent with prior research [1,33,37] and can be attributed to the benefits of MAX training. MAX training improves the recruitment and synchronization of motor units, increases firing frequency, enhances tendon stiffness and enlarges the cross-sectional area of the Achilles tendon. This enlargement improves force distribution in the tendon, reducing both tendon stress and energy expenditure during submaximal speeds [17]. Consequently, these adaptations may reduce athletes' force in each stride [4,74].
The meta-analysis findings also suggest that COMB training may be more effective in improving TT, a critical variable for endurance athletes, given its relevance in real performance scenarios. However, this circumstance is likely to occur only in more highly trained athletes [2,75] as excessive strength training volume can potentially hinder adaptations in recreational athletes [1,20]. In trained athletes, due to the law of diminishing returns [65], that is, their lower margin to attain improvements, higher workloads are required to obtain adaptations [76].
The study results also reveal that, except for 1RM, the pooled effect of the improvements obtained for most performance variables is small. This finding aligns with the research conducted by Blagove et al. [11]. It underscores the importance of incorporating strength training into the regimen of middle- and long-distance runners, and carefully designing training periodization to prevent interferences between strength and endurance adaptations [77]. Furthermore, it is essential to create strength training protocols that are more specific to enhance the transfer of strength gains to running performance [19]. The overall findings of this study only partially align with the conclusions drawn by Beattie et al. [5]. These authors concluded that middle- and long-distance runners with lower strength levels should engage in general strength training. In contrast, athletes with higher strength levels should focus on explosive strength training. However, the present study found that MAX is beneficial not only for recreational athletes, but also for trained athletes in improving VJ, 1RM, PV and LT. The reason could be that experienced athletes may need to enhance their intramuscular coordination to reduce the relative force applied while running, which requires maximum strength training with higher loads. In contrast, explosive strength training often involves bodyweight exercises or lower loads (see Table 3), which may yield different strength adaptations.
The study findings indicate that COMB training might be more effective for enhancing TT, whereas MAX training shows superiority in improving 1RM, VJ, PV and LT. However, considering the study's limitations, it's important to interpret these results cautiously. Whereas the quality of 19 of the 20 included studies is good (and fair in the remaining one), this research has limitations. The screening was conducted in two languages, which can be seen as a strength. However, it also represents a limitation since articles published in languages other than Spanish or English were not considered. Some studies have small sample sizes. The training protocols designed to improve the same performance capacity vary slightly among studies. The duration of the interventions also differs between studies. Likewise, several studies did not measure specific performance variables (i.e., LT, TT, PV). Therefore, future randomized controlled studies are required to address these aspects. Thus, more accurate conclusions can be drawn.

5. Conclusions

Concurrent training is more effective than single-mode resistance training for enhancing selected performance variables in adult endurance runners. Specifically, MAX is more effective than EXP and COMB in improving 1RM, VJ, PV and LT. Conversely, COMB may outperform MAX and EXP in terms of improving TT. However, except for 1RM, the improvements obtained are generally modest. In addition, it remains unclear which type of strength is more effective in improving RE. As for VO2max, including strength training in endurance runners' training regimens may not yield additional benefits. Consequentially, endurance athletes may opt for MAX training to target specific objectives, such as improving their maximal and explosive strength in the lower limb, LT and PV. Subsequently, recreational and well-trained athletes could consider COMB to improve their TT (monitoring the training load for recreational athletes). EXP training can also be a viable choice for improving certain performance variables. Furthermore, the validation of these findings necessitates additional randomized controlled trials.

6. List of Abbreviations

  • 1RM: one-repetition maximum squat
  • IC: confidence interval
  • COMB: combined maximum and explosive strength
  • COMBG: experimental group that underwent concurrent training of maximum
  • and explosive strength and endurance
  • CON: control group
  • ES: effect size
  • END: endurance
  • ET: endurance training
  • EXP: explosive strength
  • EXPG: experimental group that underwent concurrent training of explosive strength and endurance
  • F: female
  • HRmax: maximum heart rate
  • I: intervention group
  • IRR: inter-rater reliability
  • LT: lactate threshold
  • MAX: maximum strength
  • MAXG: experimental group that underwent a concurrent training of maximum strength and endurance
  • M: male
  • n: sample size
  • PICOS: Population, Intervention, Comparison and Outcomes
  • PV: peak velocity
  • PRISMA: Preferred Reporting Items for Systematic Reviews and Meta-Analyses
  • RE: running economy
  • VJ: vertical jump
  • VO2max: maximum oxygen consumption
  • vVO2max: Velocity at VO2max
  • Wk: week

Author Contributions

Conceptualization, P.P.-G.; methodology, P.P.-G, F.H., J.S.-I.; writing—original draft preparation, P.P.-G.; writing—review and editing, P.P.-G., F.H., L.P.A., J.S.-I.. All authors have read and agreed to the published version of the manuscript.

Funding

This research received no external funding.

Institutional Review Board Statement

The study was registered under the following code PSU IRB-2022-11-0134 at Prince Sultan University's Institutional Review Board.

Informed Consent Statement

Not applicable.

Data Availability Statement

The corresponding author makes the data available on reasonable request.

Acknowledgments

The authors thank Prince Sultan University for their support.

Conflicts of Interest

The authors declare no conflicts of interest.

References

  1. Mikkola, J.; Vesterinen, V.; Taipale, R.; Capostagno, B.; Häkkinen, K.; Nummela, A. Effect of Resistance Training Regimens on Treadmill Running and Neuromuscular Performance in Recreational Endurance Runners. J Sports Sci 2011, 29, 1359–1371. [CrossRef]
  2. Li, F.; Wang, R.; Newton, R. U.; Sutton, D.; Shi, Y.; Ding, H. Effects of Complex Training versus Heavy Resistance Training on Neuromuscular Adaptation, Running Economy and 5-Km Performance in Well-Trained Distance Runners. PeerJ 2019, 7, e6787. [CrossRef]
  3. Zamora, A.C.F.; Cedeño, E.M.R.; Blanco, Y. R. Adaptaciones fisiológicas al entrenamiento concurrente de la resistencia con la fuerza muscular (revisión). Revista científica Olimpia 2017, 14, 119–129.
  4. Beattie, K.; Carson, B.P.; Lyons, M.; Rossiter, A.; Kenny, I.C. The Effect of Strength Training on Performance Indicators in Distance Runners. J Strength Cond Res 2017, 31, 9–23. [CrossRef]
  5. Beattie, K.; Kenny, I.C.; Lyons, M.; Carson, B.P. The Effect of Strength Training on Performance in Endurance Athletes. Sports Med 2014, 44, 845–865. [CrossRef]
  6. Jones, A.M.; Kirby, B.S.; Clark, I.E.; Rice, H.M.; Fulkerson, E.; Wylie, L.J.; Wilkerson, D.P.; Vanhatalo, A.; Wilkins, B.W. Physiological demands of running at 2-hour marathon race pace. J Appl Physiol (1985) 2021, 130, 369–379. [CrossRef]
  7. Minetti, A.E.; Ardigò, L.P.; Saibene, F. Mechanical determinants of the minimum energy cost of gradient running in humans. J Exp Biol 1994, 195, 211–25. [CrossRef]
  8. Damasceno, M.V.; Lima-Silva, A.E.; Pasqua, L.A.; Tricoli, V.; Duarte, M.; Bishop, D.J.; Bertuzzi, R. Effects of Resistance Training on Neuromuscular Characteristics and Pacing during 10-Km Running Time Trial. Eur J Appl Physiol 2015, 115, 1513–1522. [CrossRef]
  9. Duffield, R.; Dawson, B.; Goodman, C. Energy System Contribution to 1500- and 3000-Metre Track Running. J Sports Sci 2005, 23, 993–1002. [CrossRef]
  10. Coffey, V.G.; Hawley, J.A. Concurrent Exercise Training: Do Opposites Distract? J Physiol 2017, 595, 2883–2896. [CrossRef]
  11. Blagrove, R.C.; Howatson, G.; Hayes, P.R. Effects of Strength Training on the Physiological Determinants of Middle- and Long-Distance Running Performance: A Systematic Review. Sports Med 2017, 48, 1117–1149. [CrossRef]
  12. Yamamoto, L.M.; Lopez, R.M.; Klau, J.F.; Casa, D.J.; Kraemer, W.J.; Maresh, C.M. The Effects of Resistance Training on Endurance Distance Running Performance Among Highly Trained Runners: A Systematic Review. J Strength Cond Res 2008, 22, 2036–2044. [CrossRef]
  13. Trowell, D.; Vicenzino, B.; Saunders, N.; Fox, A.; Bonacci, J. Effect of Strength Training on Biomechanical and Neuromuscular Variables in Distance Runners: A Systematic Review and Meta-Analysis. Sports Med 2020, 50, 133–150. [CrossRef]
  14. Gäbler, M.; Prieske, O.; Hortobágyi, T.; Granacher, U. The Effects of Concurrent Strength and Endurance Training on Physical Fitness and Athletic Performance in Youth: A Systematic Review and Meta-Analysis. Front Physiol 2018, 9, 1057. [CrossRef]
  15. Rønnestad, B.R.; Mujika, I. Optimizing Strength Training for Running and Cycling Endurance Performance: A Review. Scand J Med Sci Sports 2014, 24, 603–612. [CrossRef]
  16. Blagrove, R.C.; Howe, L.P.; Cushion, E.J.; Spence, A.; Howatson, G.; Pedlar, C.R.; Hayes, P.R. Effects of Strength Training on Postpubertal Adolescent Distance Runners. Med Sci Sports Exerc 2018, 50, 1224–1232. [CrossRef]
  17. Machado, E.; Lanferdini, F.J.; da Silva, E.S.; Geremia, J.M.; Sonda, F.C.; Fletcher, J.R.; Vaz, M.A.; Peyré-Tartaruga, L.A. Triceps Surae Muscle-Tendon Properties as Determinants of the Metabolic Cost in Trained Long-Distance Runners. Front Physiol 2022, 12, 767445. [CrossRef]
  18. Billat, L.V.; Koralsztein, J.P. Significance of the Velocity at &OV0312;O2max and Time to Exhaustion at This Velocity. Sports Med 1996, 22, 90–108. [CrossRef]
  19. Berryman, N.; Mujika, I.; Arvisais, D.; Roubeix, M.; Binet, C.; Bosquet, L. Strength Training for Middle- and Long-Distance Performance: A Meta-Analysis. Int J Sports Physiol Perform 2018, 13, 57–64. [CrossRef]
  20. Taipale, R.S.; Mikkola, J.; Salo, T.; Hokka, L.; Vesterinen, V.; Kraemer, W.J.; Nummela, A.; Häkkinen, K. Mixed Maximal and Explosive Strength Training in Recreational Endurance Runners. J Strength Cond Res 2014, 28, 689–699. [CrossRef]
  21. Hendrickse, P.W.; Venckunas, T.; Platkevicius, J.; Kairaitis, R.; Kamandulis, S.; Snieckus, A.; Stasiulis, A.; Vitkiene, J.; Subocius, A.; Degens, H. Endurance Training-Induced Increase in Muscle Oxidative Capacity without Loss of Muscle Mass in Younger and Older Resistance-Trained Men. Eur J Appl Physiol 2021, 121, 3161–3172. [CrossRef]
  22. Blagrove, R.C.; Howe, L.P.; Howatson, G.; Hayes, P.R. Strength and Conditioning for Adolescent Endurance Runners. Strength Cond J 2020, 42, 2–11. [CrossRef]
  23. Aagaard, P.; Andersen, J. L. Effects of Strength Training on Endurance Capacity in Top-Level Endurance Athletes. Scand J Med Sci Sports 2010, 20, 39–47. [CrossRef]
  24. Ferrauti, A.; Bergermann, M.; Fernandez-Fernandez, J. Effects of a Concurrent Strength and Endurance Training on Running Performance and Running Economy in Recreational Marathon Runners. J Strength Cond Res 2010, 24, 2770–2778. [CrossRef]
  25. García-Manso, J.M.; Arriaza-Ardiles, E.; Valverde, T.; Moya-Vergara, F.; Mardones-Tare, C. Efectos de un entrenamiento concurrente de fuerza y resistencia sobre carreras de media distancia. Cultura, Ciencia y Deporte 2017, 12, 221–227.
  26. Vikmoen, O.; Raastad, T.; Seynnes, O.; Bergstrøm, K.; Ellefsen, S.; Rønnestad, B.R. Effects of Heavy Strength Training on Running Performance and Determinants of Running Performance in Female Endurance Athletes. PLoS One 2016, 11, e0150799. [CrossRef]
  27. Berryman, N.; Mujika, I.; Arvisais, D.; Roubeix, M.; Binet, C.; Bosquet, L. Strength Training for Middle- and Long-Distance Performance: A Meta-Analysis. Int J Sports Physiol Perform 2018, 13, 57–64. [CrossRef]
  28. Leveritt, M.; Abernethy, P.J.; Barry, B.K.; Logan, P.A. Concurrent Strength and Endurance Training. Sports Med 1999, 28, 413–427. [CrossRef]
  29. Støren, O.; Helgerud, J.; Støa, E.M.; Hoff, J. Maximal Strength Training Improves Running Economy in Distance Runners. Med Sci Sports Exerc 2008, 40, 1087–1092. [CrossRef]
  30. Lum, D.; Barbosa, T.M.; Aziz, A.R.; Balasekaran, G. Effects of Isometric Strength and Plyometric Training on Running Performance: A Randomized Controlled Study. Res Q Exerc Sport 2023, 94, 263–271. [CrossRef]
  31. González-Badillo, J.J; Ribas, J. Bases de la programación del entrenamiento de fuerza. Inde: Barcelona, Spain, 2002.
  32. Ambrosini, L.; Presta, V.; Goldoni, M.; Galli, D.; Mirandola, P.; Vitale, M.; Gobbi, G. Are We Able to Match Non Sport-Specific Strength Training with Endurance Sports? A Systematic Review and Meta-Analysis to Plan the Best Training Programs for Endurance Athletes. Applied Sciences 2021, 11, 7280. [CrossRef]
  33. Eihara, Y.; Takao, K.; Sugiyama, T.; Maeo, S.; Terada, M.; Kanehisa, H.; Isaka, T. Heavy Resistance Training Versus Plyometric Training for Improving Running Economy and Running Time Trial Performance: A Systematic Review and Meta-Analysis. Sports Med Open 2022, 8, 138. [CrossRef]
  34. Berryman, N.; Maurel, D.B.; Bosquet, L. Effect of plyometric vs. dynamic weight training on the energy cost of running. J Strength Cond Res 2010, 24, 1818–1825. [CrossRef]
  35. Denadai, B.S.; de Aguiar, R.A.; de Lima, L.C.R.; Greco, C.C.; Caputo, F. Explosive Training and Heavy Weight Training Are Effective for Improving Running Economy in Endurance Athletes: A Systematic Review and Meta-Analysis. Sports Med 2017, 47, 545–554. [CrossRef]
  36. Mian; O.S.; Thom, J.M.; Ardigò, L.P.; Narici, M.V.; Minetti, A.E. Metabolic cost, mechanical work, and efficiency during walking in young and older men. Acta Physiol (Oxf) 2006, 186, 127–139. [CrossRef]
  37. Barnes, K.R.; Hopkins, W.G.; Mcguigan, M.R.; Northuis, M.E.; Kilding, A.E. Effects of Resistance Training on Running Economy and Cross-Country Performance. Med Sci Sports Exerc 2013, 45, 2322–2331. [CrossRef]
  38. Latash, M.L. Muscle Coactivation: Definitions, Mechanisms, and Functions. J Neurophysiol 2018, 120, 88–104. [CrossRef]
  39. Spurrs, R.W.; Murphy, A.J.; Watsford, M.L. The Effect of Plyometric Training on Distance Running Performance. Eur J Appl Physiol 2003, 89, 1–7. [CrossRef]
  40. Carter, J.; Greenwood, M. Complex Training Reexamined. Strength Cond J 2014, 36, 11–19. [CrossRef]
  41. Amir-Behghadami, M.; Janati, A. Population, Intervention, Comparison, Outcomes and Study (PICOS) Design as a Framework to Formulate Eligibility Criteria in Systematic Reviews. Emerg Med J 2020, 37, 387–387. [CrossRef]
  42. Maher, C.G.; Sherrington, C.; Herbert, R.D.; Moseley, A.M.; Elkins, M. Reliability of the PEDro Scale for Rating Quality of Randomized Controlled Trials. Phys Ther 2003, 83, 713–721. [CrossRef]
  43. Cashin, A.G.; McAuley, J.H. Clinimetrics: Physiotherapy Evidence Database (PEDro) Scale. J Physiother 2020, 66, 59. [CrossRef]
  44. Cohen, S. Psychosocial Models of the Role of Social Support in the Etiology of Physical Disease. Health Psychol, 1988, 7, 269–297. [CrossRef]
  45. Vassos, E.; Collier, D.A.; Fazel, S. Systematic Meta-Analyses and Field Synopsis of Genetic Association Studies of Violence and Aggression. Mol Psychiatry 2014, 19, 471–477. [CrossRef]
  46. Taipale, R.S.; Mikkola, J.; Vesterinen, V.; Nummela, A.; Häkkinen, K. Neuromuscular Adaptations during Combined Strength and Endurance Training in Endurance Runners: Maximal versus Explosive Strength Training or a Mix of Both. Eur J Appl Physiol 2013, 113, 325–335. [CrossRef]
  47. 47 DerSimonian, R.; Laird, N. Meta-Analysis in Clinical Trials. Control Clin Trials 1986, 7, 177–188. [CrossRef]
  48. Johnston, R.E.; Quinn, T.J.; Kertzer, R.; Vroman, N.B. Strength Training in Female Distance Runners: Impact on Running Economy. J Strength Cond Res 1997, 11, 224–229. [CrossRef]
  49. Taipale, R.S.; Mikkola, J.; Nummela, A.; Vesterinen, V.; Capostagno, B.; Walker, S.; Gitonga, D.; Kraemer, W.J.; Häkkinen, K. Strength Training in Endurance Runners. Int J Sports Med 2010, 31, 468–476. [CrossRef]
  50. Paavolainen, L.; Häkkinen, K.; Hämäläinen, I.; Nummela, A.; Rusko, H. Explosive-Strength Training Improves 5-Km Running Time by Improving Running Economy and Muscle Power. J Appl Physiol 1999, 86, 1527–1533. [CrossRef]
  51. Saunders, P.U.; Telford, R.D.; Pyne, D.B.; Peltola, E.M.; Cunningham, R.B.; Gore, C.J.; Hawley, J.A. Short-term plyometric training improves running economy in highly trained middle and long distance runners. J Strength Cond Res 2006, 20, 947–954. [CrossRef]
  52. Ramírez-Campillo, R.; Álvarez, C.; Henríquez-Olguín, C.; Baez, E.B.; Martínez, C.; Andrade, D.C.; Izquierdo, M. Effects of Plyometric Training on Endurance and Explosive Strength Performance in Competitive Middle- and Long-Distance Runners. J Strength Cond Res 2014, 28, 97–104. [CrossRef]
  53. Pellegrino, J.; Ruby, B.C.; Dumke, C.L. Effect of Plyometrics on the Energy Cost of Running and MHC and Titin Isoforms. Med Sci Sports Exerc 2016, 48, 49–56. [CrossRef]
  54. Sedano, S.; Marín, P.J.; Cuadrado, G.; Redondo, J.C. Concurrent Training in Elite Male Runners: The Influence of Strength versus Muscular Endurance Training on Performance Outcomes. J Strength Cond Res 2013, 27, 2433–2443. [CrossRef]
  55. Ciacci, S.; Bartolomei, S. The Effects of Two Different Explosive Strength Training Programs on Vertical Jump Performance in Basketball. J Sports Med Phys Fitness 2018, 58. 1375–1382. [CrossRef]
  56. Pattison, K.J.; Drinkwater, E.J.; Bishop, D.J.; Stepto, N.K.; Fyfe, J.J. Modulation of Countermovement Jump–Derived Markers of Neuromuscular Function With Concurrent vs. Single-Mode Resistance Training. J Strength Cond Res 2020, 34, 1497–1502. [CrossRef]
  57. Gäbler, M.; Prieske, O.; Hortobágyi, T.; Granacher, U. The Effects of Concurrent Strength and Endurance Training on Physical Fitness and Athletic Performance in Youth: A Systematic Review and Meta-Analysis. Front Physiol 2018, 9, 1057. [CrossRef]
  58. Vikmoen, O.; Raastad, T.; Ellefsen, S.; Rønnestad, B.R. Adaptations to Strength Training Differ between Endurance-Trained and Untrained Women. Eur J Appl Physiol 2020, 120, 1541–1549. [CrossRef]
  59. García-Orea, G.P.; Elvar, J.R.H.; Campillos, J.A.; Grigoletto, M.E.D.S.; Del Rosso, S. Entrenamiento concurrente de fuerza y resistencia: una revisión narrativa. Int J Phys Exerc Heal Sci Trainers 2016, 1.
  60. Wilson, J.M.; Marin, P.J.; Rhea, M.R.; Wilson, S.M.C.; Loenneke, J.P.; Anderson, J.C. Concurrent Training. J Strength Cond Res 2012, 26, 2293–2307. [CrossRef]
  61. Karp, J.R. Training Characteristics of Qualifiers for the U.S. Olympic Marathon Trials. Int J Sports Physiol Perform 2007, 2, 72–92. [CrossRef]
  62. Fyfe, J.J.; Bishop, D.J.; Stepto, N.K. Interference between Concurrent Resistance and Endurance Exercise: Molecular Bases and the Role of Individual Training Variables. Sports Med 2014, 44, 743–762. [CrossRef]
  63. Williams, C.J.; Williams, M.G.; Eynon, N.; Ashton, K.J.; Little, J.P.; Wisloff, U.; Coombes, J.S. Genes to Predict VO2max Trainability: A Systematic Review. BMC Genomics 2017, 18, 831. [CrossRef]
  64. Helgerud, J.; Høydal, K.; Wang, E.; Karlsen, T.; Berg, P.; Bjerkaas, M.; Simonsen, T.; Helgesen, C.; Hjorth, N.; Bach, R.; Hoff, J. Aerobic high-intensity intervals improve VO2max more than moderate training. Med Sci Sports Exerc 2007, 39, 665–671. [CrossRef]
  65. Fyfe, J.J.; Loenneke, J.P. Interpreting Adaptation to Concurrent Compared with Single-Mode Exercise Training: Some Methodological Considerations. Sports Med 2018, 48, 289–297. [CrossRef]
  66. Boullosa, D.; Del Rosso, S.; Behm, D.G.; Foster, C. Post-Activation Potentiation (PAP) in Endurance Sports: A Review. Eur J Sport Sci 2018, 18, 595–610. [CrossRef]
  67. Shamim, B.; Devlin, B.L.; Timmins, R.G.; Tofari, P.; Lee Dow, C.; Coffey, V.G.; Hawley, J.A.; Camera, D.M. Adaptations to Concurrent Training in Combination with High Protein Availability: A Comparative Trial in Healthy, Recreationally Active Men. Sports Med 2018, 48, 2869–2883. [CrossRef]
  68. Ghosh, A.K. Anaerobic Threshold: Its Concept and Role in Endurance Sport. Malays J Med Sci 2004, 11, 24–36.
  69. Edge, J.; Bishop, D.; Goodman, C. The Effects of Training Intensity on Muscle Buffer Capacity in Females. Eur J Appl Physiol 2006, 96, 97–105. [CrossRef]
  70. Theofilidis, G.; Bogdanis, G.; Koutedakis, Y.; Karatzaferi, C. Monitoring Exercise-Induced Muscle Fatigue and Adaptations: Making Sense of Popular or Emerging Indices and Biomarkers. Sports (Basel) 2018, 6, 153. [CrossRef]
  71. Juel, C.; Halestrap, A.P. Lactate Transport in Skeletal Muscle — Role and Regulation of the Monocarboxylate Transporter. J Physiol 1999, 517, 633–642. [CrossRef]
  72. Esteve-Lanao, J.; Rhea, M.R.; Fleck, S.J.; Lucia, A. Running-Specific, Periodized Strength Training Attenuates Loss of Stride Length During Intense Endurance Running. J Strength Cond Res 2008, 22, 1176–1183. [CrossRef]
  73. Prieto-González, P.; Sedlacek, J. Effects of Running-Specific Strength Training, Endurance Training, and Concurrent Training on Recreational Endurance Athletes’ Performance and Selected Anthropometric Parameters. Int J Environ Res Public Health 2022, 19, 10773. [CrossRef]
  74. Mujika, I.; Rønnestad, B.R.; Martin, D.T. Effects of Increased Muscle Strength and Muscle Mass on Endurance-Cycling Performance. Int J Sports Physiol Perform 2016, 11, 283–289. [CrossRef]
  75. Balsalobre-Fernández, C.; Santos-Concejero, J.; Grivas, G.V. Effects of Strength Training on Running Economy in Highly Trained Runners: A Systematic Review With Meta-Analysis of Controlled Trials. J Strength Cond Res 2016, 30, 2361–2368. [CrossRef]
  76. Petré, H.; Löfving, P.; Psilander, N. The Effect of Two Different Concurrent Training Programs on Strength and Power Gains in Highly-Trained Individuals. J Sports Sci Med 2018, 17, 167–173.
  77. Patoz, A.; Breine, B.; Thouvenot, A.; Mourot, L.; Gindre, C.; Lussiana, T. Does Characterizing Global Running Pattern Help to Prescribe Individualized Strength Training in Recreational Runners? Front Physiol 2021, 12, 631637. [CrossRef]
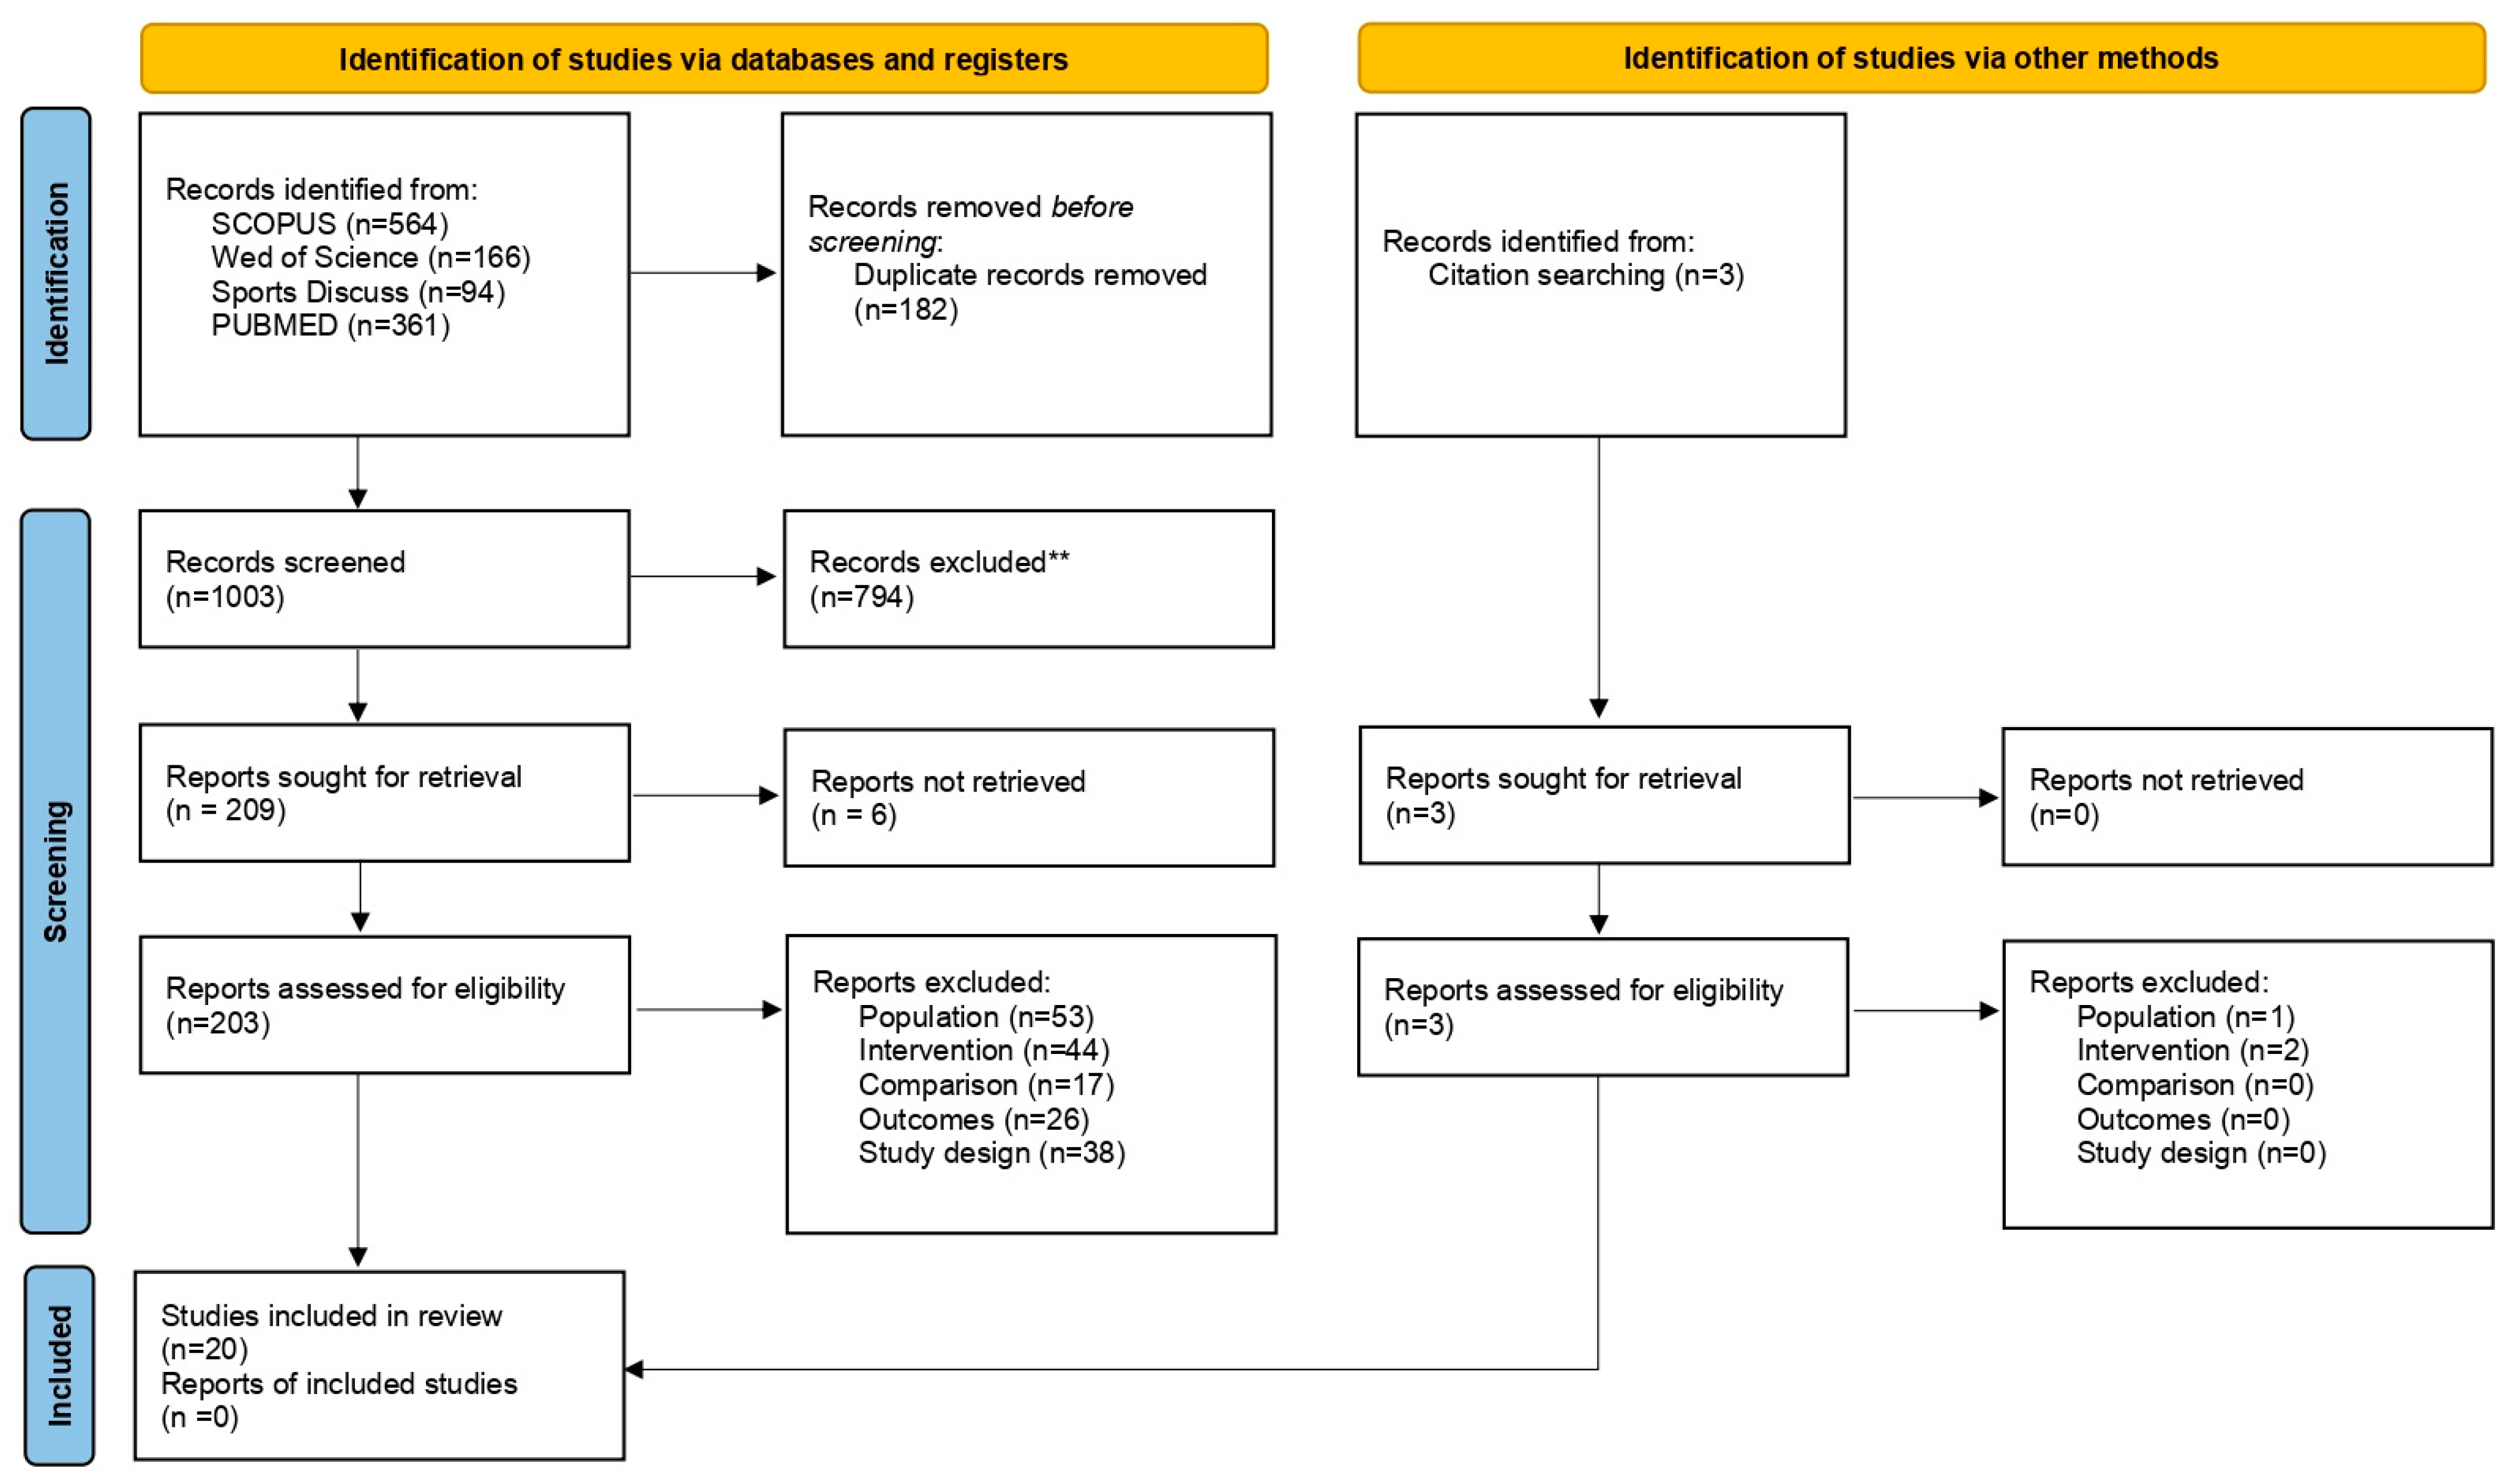
Figure 1. Flowchart of the study search, identification, screening, selection and inclusion.
Preprints 100395 g001
Figure 2. Forest plot comparison between MAX vs. CON and EXP vs. CON groups. Data are reported as Hedges' g with effect sizes (ES) and 95% confidence interval (CI). The diamond at the bottom shows the overall effect. The drawn squares show their 95% CI for ES and whiskers for ES; T0: pre-test; T1: post-test.
Preprints 100395 g002
Figure 3. Forest plot comparison between COMB vs. CON and MAX vs. EXP groups. Data are reported as Hedges' g with effect sizes (ES) and 95% confidence interval (CI). The diamond at the bottom shows the overall effect. The drawn squares show their 95% CI for ES and whiskers for ES; T0: pre-test; T1: post-test.
Preprints 100395 g003
Figure 4. Forest plot comparison between MAX vs. COMB groups. Data are reported as Hedges' g with effect sizes (ES) and 95% confidence interval (CI). The diamond at the bottom shows the overall effect. The drawn squares show their 95% CI for ES and whiskers for ES; T0: pre-test; T1: post-test.
Preprints 100395 g004
Figure 5. Forest plot comparison between MAX vs. CON and EXP vs. CON groups. Data are reported as Hedges' g with effect sizes (ES) and 95% confidence interval (CI). The diamond at the bottom shows the overall effect. The drawn squares show their 95% CI for ES and whiskers for ES; T0: pre-test; T1: post-test.
Preprints 100395 g005
Figure 6. Forest plot comparison between COMB vs. CON and MAX vs. EXP groups in the pre- and post-measurements in 1RM. Data are reported as Hedges' g with effect sizes (ES) and 95% confidence interval (CI). The diamond at the bottom shows the overall effect. The drawn squares show their 95% CI for ES and whiskers for ES; T0: pre-test; T1: post-test.
Preprints 100395 g006
Figure 7. Forest plot comparison between MAX vs. COMB groups in the pre- and post-measurements in 1RM. Data are reported as Hedges' g with effect sizes (ES) and 95% confidence interval (CI). The diamond at the bottom shows the overall effect. The drawn squares show their 95% CI for ES and whiskers for ES; T0: pre-test; T1: post-test.
Preprints 100395 g007
Figure 8. Forest plot comparison between MAX vs. CON and EXP vs. CON groups in the pre- and post-measurements in running economy. Data are reported as Hedges' g with effect sizes (ES) and 95% confidence interval (CI). The diamond at the bottom shows the overall effect. The drawn squares show their 95% CI for ES and whiskers for ES; T0: pre-test; T1: post-test.
Preprints 100395 g008
Figure 9. Forest plot comparison between MAX vs. CON and COMB vs. CON groups in the pre- and post-measurements in running economy mL/kg/min. Data are reported as Hedges' g with effect sizes (ES) and 95% confidence interval (CI). The diamond at the bottom shows the overall effect. The drawn squares show their 95% CI for ES and whiskers for ES; T0: pre-test; T1: post-test.
Preprints 100395 g009
Figure 10. Forest plot comparison between MAX-EXP, and MAX vs. COMB groups in the pre- and post-measurements in running economy mL/kg/min. Data are reported as Hedges' g with effect sizes (ES) and 95% confidence interval (CI). The diamond at the bottom shows the overall effect. The drawn squares show their 95% CI for ES and whiskers for ES; T0: pre-test; T1: post-test.
Preprints 100395 g010
Figure 11. Forest plot comparison between MAX vs. CON and EXP vs. CON groups in the pre- and post-measurements in VO2max. Data are reported as Hedges' g with effect sizes (ES) and 95% confidence interval (CI). The diamond at the bottom shows the overall effect. The drawn squares show their 95% CI for ES and whiskers for ES; T0: pre-test; T1: post-test.
Preprints 100395 g011
Figure 12. Forest plot comparison between COMB vs. CON and MAX vs. EXP groups in the pre- and post-measurements in VO2max. Data are reported as Hedges' g with effect sizes (ES) and 95% confidence interval (CI). The diamond at the bottom shows the overall effect. The drawn squares show their 95% CI for ES and whiskers for ES; T0: pre-test; T1: post-test.
Preprints 100395 g012
Figure 13. Forest plot comparison between MAX vs. COMB groups in the pre- and post-measurements in VO2max. Data are reported as Hedges' g with effect sizes (ES) and 95% confidence interval (CI). The diamond at the bottom shows the overall effect. The drawn squares show their 95% CI for ES and whiskers for ES; T0: pre-test; T1: post-test.
Preprints 100395 g013
Figure 14. Forest plot comparison between MAX vs. CON and EXP vs. CON groups in the pre- and post-measurements in TT. Data are reported as Hedges' g with effect sizes (ES) and 95% confidence interval (CI). The diamond at the bottom shows the overall effect. The drawn squares show their 95% CI for ES and whiskers for ES; T0: pre-test; T1: post-test.
Preprints 100395 g014
Figure 15. Forest plot comparison between COMB vs. CON groups in the pre- and post-measurements in TT. Data are reported as Hedges' g with effect sizes (ES) and 95% confidence interval (CI). The diamond at the bottom shows the overall effect. The drawn squares show their 95% CI for ES and whiskers for ES; T0: pre-test; T1: post-test.
Preprints 100395 g015
Figure 16. Forest plot comparison between MAX vs. CON and EXP vs. CON groups in the pre- and post-measurements in PV. Data are reported as Hedges' g with effect sizes (ES) and 95% confidence interval (CI). The diamond at the bottom shows the overall effect. The drawn squares show their 95% CI for ES and whiskers for ES; T0: pre-test; T1: post-test.
Preprints 100395 g016
Figure 17. Forest plot comparison between COMB vs. CON and MAX vs. EXP groups in the pre- and post-measurements in PV. Data are reported as Hedges' g with effect sizes (ES) and 95% confidence interval (CI). The diamond at the bottom shows the overall effect. The drawn squares show their 95% CI for ES and whiskers for ES; T0: pre-test; T1: post-test.
Preprints 100395 g017
Figure 18. Forest plot comparison between MAX vs. COMB groups in the pre- and post-measurements in PV. Data are reported as Hedges' g with effect sizes (ES) and 95% confidence interval (CI). The diamond at the bottom shows the overall effect. The drawn squares show their 95% CI for ES and whiskers for ES; T0: pre-test; T1: post-test.
Preprints 100395 g018
Figure 19. Forest plot comparison between MAX vs. CON and EXP vs. CON groups in the pre- and post-measurements in LT. Data are reported as Hedges' g with effect sizes (ES) and 95% confidence interval (CI). The diamond at the bottom shows the overall effect. The drawn squares show their 95% CI for ES and whiskers for ES; T0: pre-test; T1: post-test.
Preprints 100395 g019
Table 1. PICOS strategy for the inclusion and exclusion criteria.
Category Inclusion criteria Exclusion criteria
Population Recreational and professional endurance runners of both sexes aged between 18 and 45. Recreational or professional athletes under the age of 18 or above 45. Non-runners. Individuals suffering from injuries or medical conditions.
Intervention Concurrent strength training (MAX, EXP, or COMB) combined with endurance training. Training protocols of at least five weeks. Concurrent training protocols or cohorts that underwent muscular endurance, body weight, or isometric training sessions. Strength interventions performed using electrical muscle stimulation or vibratory plates. Training protocols of less than five weeks.
Comparison Research involving a minimum of two groups, either one experimental and one control group, or two experimental groups. Absence of a minimum of two groups, either one experimental and one control group, or two experimental groups. Studies where different experimental groups perform the same concurrent training at different times or days. Studies using ergogenic aids.
Outcomes Studies wherein at least one performance parameter (i.e., VO2max, running economy, lactate threshold) was reported. Studies that did not report any performance parameter, and it was not possible to obtain such data after contacting their authors.
Study design Randomized and nonrandomized controlled studies. Cross-sectional studies. Interventions published in sources classified as grey literature, such as reports, conference proceedings not subjected to peer review, or publications not issued by commercial publishers.
Table 2. Descriptive characteristics of the subjects and the studies included in the present research.
Authors n Age (years) Level Intervention Randomized Duration
(weeks)
PEDro score
Johnston et al. (1997) 12F 30.30 Endurance runners I: MAX+END
CON: END
Yes 10 6
Støren et al. (2008) [29] 17(9M,8F) 29.18 Well-trained endurance runners I: MAX+END
CON: END
Yes 8 6
Ferrauti et al. (2010) 22(16M,6F) 40 Recreational runners I: MAX+END
CON: END
Yes 8 6
Damasceno et al. (2015) 19M 33.50 Recreational endurance runners I: MAX+END
CON: END
Yes 8 6
Vikmoen et al. (2016) 19F 32.93 Well-training endurance athletes I: MAX+END
CON: END
Yes 11 6
Li et al. (2019) 28M 20.71 Well-trained endurance runners I1: MAX+END
I2:COMB+END
CON: END
Yes 8 6
Paavolainen et al. (1999) 18M 23.44 Elite cross-country runners I: EXP+END
CON: END
Yes 9 6
Spurrs et al. (2003) 17M 25 Endurance runners I: EXP+END
CON: END
Yes 6 6
Saunders et al. (2006) 15M 24.20 Highly-trained endurance runners I: EXP+END
CON: END
Yes 9 6
Ramírez-Campillo et al. (2014) 36(22M,14F) 22.10 Highly competitive endurance runners I: EXP+END
CON: END
Yes 6 6
Pellegrino et al. (2016) 22(14M,8F) 33.35 Experienced endurance runners I: EXP+END
CON: END
Yes 6 6
Berryman et al. (2010) 28M 29.85 Moderately to well-trained endurance runners I1:EXP+END I2:MAX+END
CON: END
Yes 8 6
Taipale et al. (2010) 28M 35.37 Recreational endurance runners I1:EXP+END
I2:MAX +END
Yes 8 6
Mikkola et al. (2011) 27M 35.55 Recreational endurance runners I1:EXP+END
I2:MAX +END
Yes 8 6
Barnes et al. (2013) 42(23M,19F) 19.72 Cross-country runners I1: MAX+END
I2: COMB+END
Yes 10 6
Taipale et al. (2013) 30M 34.57 Recreational endurance runners I1: MAX+END
I2: EXP+END
I3: COMB+END
CON: END
Yes 8 6
Lum et al. (2022) 26(18M,8F) 26 Endurance runners I1:EXP+END
CON: END
Yes 6 6
Sedano et al. (2013) 18M 23.70 Well-training runners I1:COMB+END
CON: END
Yes 12 6
Taipale at al. (2014) 34(16M,18F) 32.14 Recreational endurance runners I: COMB+END
CON: END
Yes 8 6
Beattie et al. (2017) 20M 28.55 Competitive distance runners I: COMB+END
CON: END
No 40 5
Legend: n: sample size; F: Female; M male; I intervention group; CON: Control group; MAX maximum strength; EXP Explosive strength; END: Endurance; COMB: Combined maximum and explosive strength.
Table 3. Study characteristics and training programs undergone by the different experimental groups.
Study Duration//
Frequency
Training parameters Exercises
Johnston et al. (1997) 10 weeks// ST:3/wk; E:4-5/wk ST: (MAXG) 2x20/2´ (bent-leg heel raise); 2x12/2´ (straight-leg heel raise); 2x15/2´ (sit-up, abdominal curl); 3x8/2´ (Leg extension, leg curl, seated row, lat pulldown; 3x6/2´ (squat, lunge, bench press, seated press, hammer curl)
ET:20-30km/week at steady pace
Squat, knee flexion, knee extension, seated press, lat pulldown, hummer curl, sit-up, lunge, heel raise, bench press
Støren et al. (2008) 8 weeks// ST:3/wk ST: (MAXG) 4x4RM/3´
ET: Continue with their normal endurance training (60-95%HRmax)
Half-squat
Ferrauti et al. (2010) 8 weeks// ST:2/wk ST: (MAXG) 4x3-5RM/3´ (leg press, leg extension, leg curl, ankle extension, hip extension); 3x20-25RM/90´´ (bench press, lateral flexion, trunk flexion, trunk extension, trunk rotation, reverse fly).
ET: 240(121) min/wk
Leg press, leg extension, leg curl, hip extension, ankle extension, reverse fly bench press, trunk flexion, trunk extension, lateral flexion, trunk rotation
Damasceno et al. (2015) 8 weeks// ST:2/wk ST: (MAXG) Wks 1–2: 3x8–10RM/3´; wks 3–4: 3x6–8 RM/3´; wks 5–6: 3x4–6 RM/3´; wks 7–8: 2x3–5 RM/3´
ET: Maintained their endurance training program on different days than ST
Half-squat, leg-press, plantar flexion, and knee extension
Vikmoen et al. (2016) 11 weeks// ST:3/wk; ET: 6/wk
ST: (MAXG) Wks 1–3: 3x10RM and 6RM; wks 4–6: 3x8RM and 5RM; wks 7–11: 3x6RM and 4RM
ET: Weekly training: 1:3.7(1.6) h at 60%-82% HRmax; 1.1(0.5) h at 83%-87%, 3:0.8(0.5) h; 88%-100% of maximal HR
Half squat, leg press, standing one-legged hip flexion, ankle plantar flexion
Li et al. (2019) 8 weeks// ST:3/wk ST: MAXG: 5x5(80-85%1RM)/3´; COMBG: 3x5(80-85%1RM)/4´ (Back squat, Bulgarian squat, Romanian deadlift); 3x6/4’ (drop jump, single leg hop, double leg hurdle hop)
ET: Continuous training (70-85%HRmax), and interval training (90-95% HRmax). Total distance: 77.25(2.33) km/wk
MAXG: Back squat, Bulgarian squat, Romanian deadlift
COMBG: Back squat, drop jump, Bulgarian squat, single leg hop, Romanian deadlift, double leg hurdle hop
Paavolainen et al. (1999) 9 weeks ST: (EXPG) Alternative jumps, bilateral countermovement, drop and hurdle jumps, and 1-legged 5-jump, leg-press, leg extension, leg curl without additional weight or with the barbell on the shoulders. Leg-press, leg extension, leg curl: 5-20reps(0-40%1RM)
ET: 30-120´ at <84%HRmax
Alternative jumps, bilateral countermovement, drop and hurdle jumps, and 1-legged 5-jump, leg-press, leg extension, leg curl
Spurrs et al. (2003) 6 weeks// ST:2/wk the first 3 wks, and 3/wk the last 3 wks ST: (EXPG) 2x10 (Squat jump); 2x10-12 (split scissor jump); 2-3x10-12 (double leg bound); 2-3x10-15 (alternate leg bound, single leg forward hop); 2-3x6-10 (depth jump); 2-3x10 (double leg hurdle jump, single leg hurdle hop)
ET: 60-80km/wk
Squat jump, split scissor jump, double leg bound, alternate leg bound, single leg forward hop, depth jump, double leg hurdle jump, single leg hurdle hop
Saunders et al. (2006) 9 weeks// ST:3/wk ST: (EXPG) 1-2x15 (back extension); 2-5x6-8 (leg press); 1-3x6 (countermovement jumps); 1-3x20 (knee lifts); 1-3x10 (ankle jumps); 1-3x10 (hamstring curls); 4-6x10m (alternate-leg bounds); 1-5x20-30m (skip for height); 1-4x20 (single-leg ankle jumps); 5x5 (continuous hurdle jumps); 5x8 (scissor jumps for height)
ET: 107(43) km/wk including continuous training and interval training
Back extension, leg press, countermovement jumps, knee lifts, ankle jumps, hamstring curls, alternate-leg bounds, skip for height, single-leg ankle jumps, continuous hurdle jumps, scissor jumps for height
Ramírez-Campillo et al. (2014) 6 weeks// ST:2/wk ST: (EXPG) 2x10/2´ from a 20cm box; 2x10/2´ from a 40cm box; 2x10/2´ from a 60 cm box
ET: 67.2(18.9) km/wk
Bounce drop jumps
Pellegrino et al. (2016) 6 weeks// ST:15sessions/6wks ST: (EXPG) 60-228 jumps/session Deep and box jumps
Berryman et al. (2010) 8 weeks// ST:1/wk; ET:3/wk ST: MAXG: 3x8/3´; EXPG: Drop jumps from 20, 40, or 60 cm boxes
ET: Session 1: 10-6x200-800m at 96-105% of peak treadmill speed; session: 6-1x5-30min at 70-80% of peak treadmill speed; session 3: 30-60min at 70% peak treadmill speed
MAXG: Concentric half-squat; EXPG: drop jumps
Taipale et al. (2010) 8 weeks// ST:2/wk; ET: in non-strength training days ST: MAXG: 3x4-6 (80-85%1RM) (squat and leg press) and 2x12-15 (50-60%1RM) (calf exercise); EXPG group: 3x6 (30-40%1RM) (explosive squats and leg press); 2-3x10 (20kg) (scissor jump); 2-3x5 (maximal individual squat jumps); 2-3x5 (20kg between wks 4-8) (maximal squat jumps)
ET: Wks 0-4: 20(5)-26(4.6) km/wk; wks 4-8: 29.8(7.8)-38.3(4.8) km/wk
MAXG: squat, leg press, calf exercise; EXPG: explosive squats, scissor jump, maximal individual squat jumps, maximal squat jumps
Mikkola et al. (2011) 8 weeks// ST:2/wk ST: MAXG: Wks 1-4: 3x6/2-3´; wks 5-8: 3x4/2-3´. EXPG group: 3x6/2-3´ (squat and leg press); 2x5/2-3´ (squat jumps (singles and non-stop)); 2x10/2-3´ (scissor jumps)
ET: Most of the endurance training (>95%) was of low intensity and was performed below the lactate aerobic threshold
MAXG: Squat and leg press; EXPG: squat, leg press, squat jumps (singles and non-stop), scissor jumps
Barnes et al. (2013) 10 weeks// ST:1-2/wk; ET: 6/wk ST: MAXG: 2-4x6-20; COMBG: 1-4x6-20 MAXG: Back squat, calf raise, dumb bell military press, glute/hamstring raise, lateral pull down, box step-up, dead lift, calf raise, dumb bell incline bench press, resisted monster walk, pull-up, Bulgarian split squat.
COMBG: Same exercises as MAXG plus: forward hop, countermovement jump, alternate leg bound, tuck jump, box jump, side shuffle, scissor jump
Taipale et al. (2013) 8 weeks// ST:1-2/wk; ET: On non-strength training days ST: MAXG: 3x4–6(80–85%1RM)/2´ (squat and leg press); 2x12–15(50–60%1RM)/2´ (calf exercise); 3x20-30(body weight)/2´ (Sit-ups, back-extension); EXP+END: 3x6(30-40%1RM)/2´ (squat and leg press); 2–3x10sec (20kg) (scissor jump); 2-3x5 (body weight)/2´ (maximal squat jump); 3x20-30 (body weight)/2´ (Sit-ups, back-extension); COMBG: wks 0-4: 2x6RM/2´ (squat and leg press); wks 4-8: 3x4RM/2´ (squat/leg press); 2-3x8-10/2´ (box jumps, vertical jumps); 3x20-30 (body weight)/2´ (Sit-ups, back-extension)
ET: 5:38(0:56) h per week below lactate threshold
MAXG: Squat, leg press, calf exercise, sit-ups, back-extension. EXPG: Leg press, scissor jump, maximal squat jump, single body weight, maximal squat jump, sit-ups, back-extension. COMBG: Squat and leg press, box jumps, vertical jumps, sit-ups, back-extension
Lum et al. (2022) 6 weeks// ST:2/wk ST (EXPG): 2-4x5/3´
Depth jump, single leg bounding, side split jump
Sedano et al. (2013) 12 weeks// ST: 2/wk; ET: 6/wk ST (COMBG): 3x7 reps (70 %1RM) + 10 reps/5´
ET: cross-country or road running (0.5-1.5h), fartlek (0.5-1.5h), and interval training.
Barbell squat + Vertical jumps over hurdles (40 cm); Lying leg curl + Horizontal jumps; Seated calf raises + Vertical jumps over hurdles (40cm); leg extension + horizontal jumps
Taipale at al. (2014) 8 weeks// ST:1-2/wk; ET:2-4/wk ST (COMBG): Wks 1-4: 2x6RM/3´ (squat and leg press); 2X8/2-3´ (box jumps, vertical jumps), 3x20-30/2´ (sit-ups and back extension). Wks 5-8: 2x4RM/3´ (squat and leg press); 2X10/2-3´ (box jumps, vertical jumps), 3x20-30/2´ (sit-ups and back extension)
ET: M: 18(11) km/wk; F: 23(13) km/wk
Squat, leg press, box jumps, vertical jumps, sit-ups, back extension
Beattie et al. (2017) 40 weeks// ST:2/wk ST (COMBG): Wks 1-12: 2-3x3-6 (pogo jumps); 2-3x3-8 (back squat); 2-3x6-12 (romanian deadlift); 1-3x6-12 (split squat). Wks 13-20: 3x5-6 (drop jump); 2-3x3-8 (back squat); 1-3x5-12 (romanian deadlift); 1-3x5-10 (split squat). Wks 21-32: 1-5x4-5 (drop jump); 1-3x3 (jump squat); 1-3x3-5 (back squat); 1-3x5-8 (single leg Romanian deadlift); 1x8 (single leg squat). Wks 33-40: 1-3x4-5 (drop jump); 1-3x3 (jump squat); 1-3x3-5 (back squat); 1-3x5-8 (single leg Romanian deadlift); 1x8 (single leg squat) Pogo jumps, back squat, Romanian deadlift, split squat, drop jump, countermovement jump, reverse lunge, skater squat, jump squat,
Legend: n: sample size; F: Female; M: Male; I intervention group; C: control group; MAXG: experimental group that underwent a concurrent training of maximum strength and endurance; EXPG: experimental group that underwent a concurrent training of explosive strength and endurance; COMBG: experimental group that underwent a concurrent training of maximum and explosive strength and endurance; ET: endurance training; HRmax: maximum heart rate; 1RM: one-repetition maximum squat; Wk: week.
Disclaimer/Publisher’s Note: The statements, opinions and data contained in all publications are solely those of the individual author(s) and contributor(s) and not of MDPI and/or the editor(s). MDPI and/or the editor(s) disclaim responsibility for any injury to people or property resulting from any ideas, methods, instructions or products referred to in the content.
Copyright: This open access article is published under a Creative Commons CC BY 4.0 license, which permit the free download, distribution, and reuse, provided that the author and preprint are cited in any reuse.
Prerpints.org logo

Preprints.org is a free preprint server supported by MDPI in Basel, Switzerland.

Subscribe

© 2024 MDPI (Basel, Switzerland) unless otherwise stated