1. Introduction
A copper mine in Zambia uses the downward filling method for stratified mining. The ore body in this area is characterized by a large change in dip angle, a thin medium thickness and a broken ore rock, which is a difficult to mine unstable sharply inclined high water-bearing ore body [
1,
2]. The existing surface filling system of the mine cannot meet the strength requirements of the graded cemented filler for the filling process, and the existing filling system needs to be modified to increase the cost. In addition, the long maintenance time of the cemented paste backfill reduces the production efficiency [
3,
4]. Therefore, the use of a low-strength full tailing sand paste backfill for the upper cover and a high-strength concrete for the lower cover as the downward approach filling of the false top can not only utilize the existing filling system, but also improve the stability and efficiency of the artificial false top.
At present, many scholars have mainly used fixed beam mechanical model, safety factor method, and reliability analysis for paste backfill false top [
5,
6,
7,
8]. Yang [
9] analyzed the factors affecting the stability of the downward approach by sensitivity analysis, and found that the thickness of the false roof has the highest sensitivity to the stability of the approach. Guo et al. [
10] used the “embedded beam” model as the overlying filler mechanics model and obtained the maximum deflection of the filler bearing layer of 23.04 cm by theoretical calculation and FLAC3D numerical simulation. Wu et al. [
11] showed that the ultimate strength of the plaster dummy roof decreased polynomially with the increase of the plaster dummy roof thickness and the economic reinforcement rate decreased polynomially with the increase of the plaster dummy roof thickness by establishing the simple support beam model. The economic reinforcement rate increases logarithmically with the increase of the strength of the plaster false roof.
The above analysis is based on the analysis of cemented filler as artificial dummy roof, when the cemented filler is used as artificial dummy roof, its strength requirement is low and thickness requirement is large, so the modeling is mainly based on the “beam” model at this time. When the concrete is used as the bearing layer of the artificial roof, the strength requirement is higher and the thickness requirement is smaller, so the “beam” model is not applicable, and it can be regarded as the “thin plate” model according to the elasticity analysis [
12]. Liu et al. [
13] conducted a theoretical analysis of the destabilization mechanism of the artificial false roof through the thin plate theory, and obtained that the maximum tensile stress is distributed in the middle of the false bottom, and the vertical displacement of the false bottom is unevenly settled. Shang et al. [
14] studied the tensile stress of the artificial false roof by thin plate theory, reliability theory and safety factor method, and found that the width of the approach has a greater influence on the tensile stress of the bearing layer, and the idea of “small width, large height” can be used to optimize the section. At present, there is no complete mechanical model for the strength of reinforced concrete false roof in the analysis of thin slab of artificial false roof, and the relationship between the ultimate strength of concrete and small thickness has been rarely reported.
Based on this, this paper takes the broken ore body of this copper mine as the research object and derives a detailed mechanical model of reinforced concrete false top based on the electrodynamics-thin plate model. Finally, the danger point of the false top is analyzed based on the bending moment. The relationship between the location of the dangerous surface and the dangerous point in the hard-supported weak slab structure and the soft-supported weak slab structure is analyzed, the type of uniform load and calculation model of the concrete thin slab false top are improved, the law of the ultimate strength of the concrete false top and the thickness of the false top are investigated, and the rationality of the theoretical analysis is verified by finite element analysis. This paper provides a theoretical basis for the design of the concrete false roof of a downward approach to a copper mine in Zambia, and the research results have some significance for the design of artificial false roofs in other mines.
2. Concrete Thin Slab False Top Small Deflection Deformation and Model Basic Assumptions
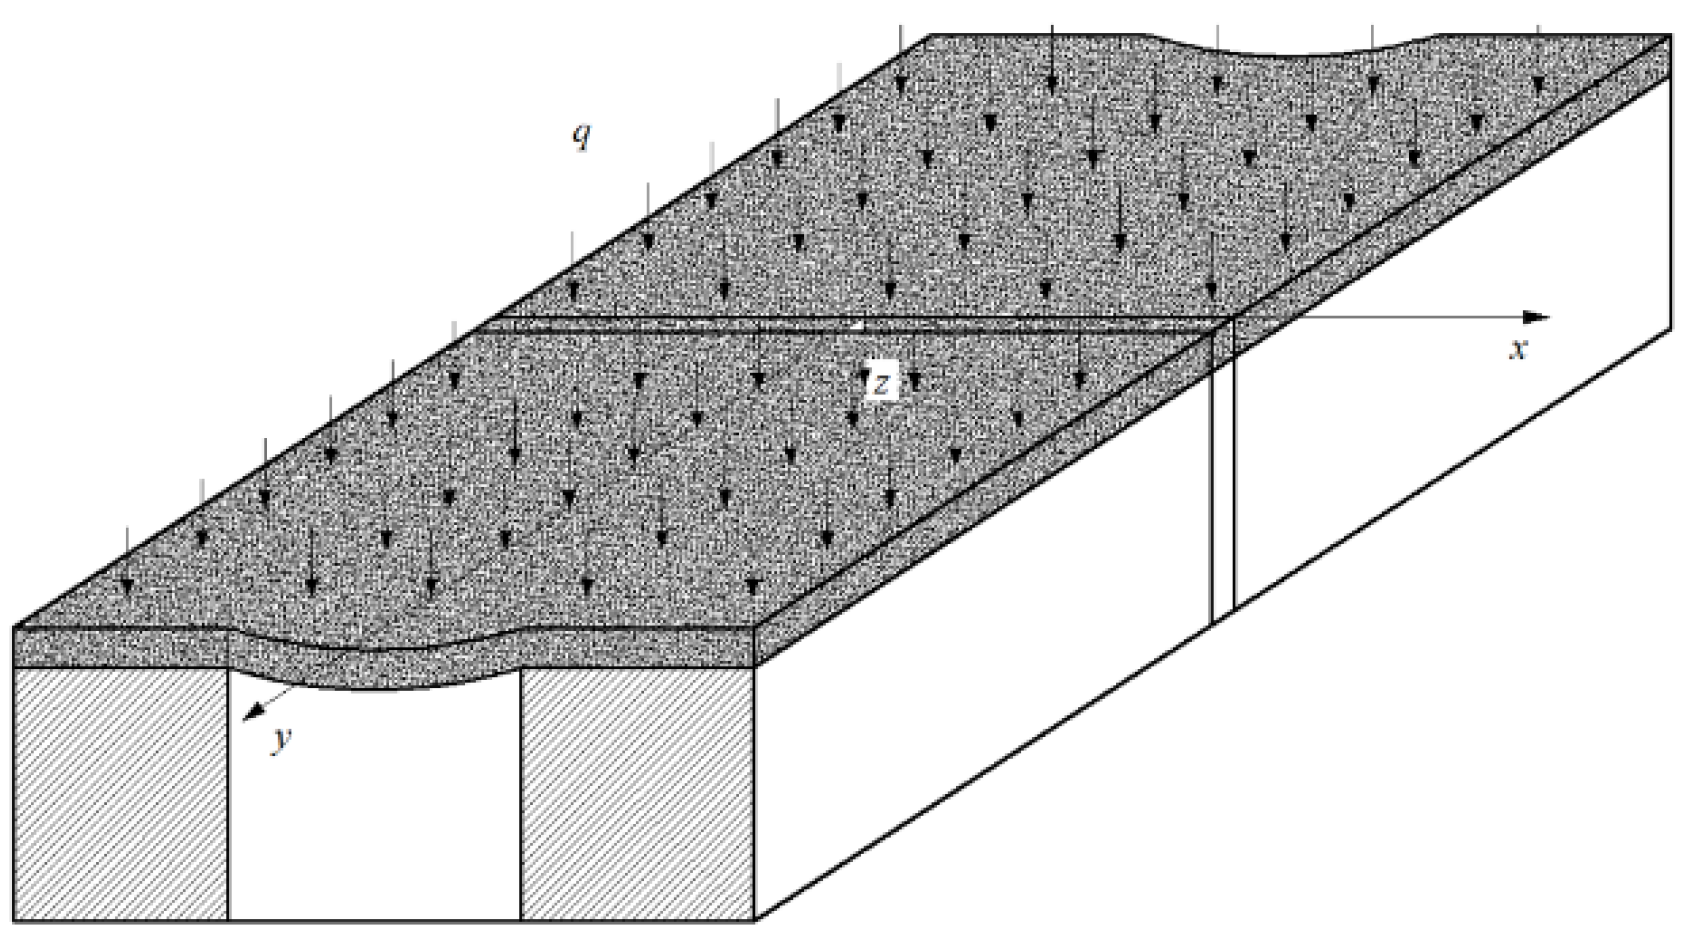
According to the knowledge of elasticity, if the thickness h of a plate is much smaller than the width b, it is called a thin plate. When the thin plate is subjected to external loads, it will undergo bending phenomenon (as shown in
Figure 1). When a thin plate is bent, the curved surface bent by the midplane becomes the elastic surface of the plate, and the displacement of each point in the midplane perpendicular to the midplane direction (z-axis) is called deflection ω Represent. The elastic surface formed by a thin plate is also called a torsion surface, when ω/ When h ≤ 1/5, it is called small deflection bending [
15].
The bending problem of thin plates belongs to spatial problems. In order to establish the theory of small deflection bending of thin plates, in addition to citing the basic assumptions of elastic mechanics, three additional calculation assumptions have been proposed (these assumptions have been confirmed by a large number of experiments) [
16]. According to
Figure 1, the midplane of the thin plate is taken as the
x y plane, assuming the following:
① The positive strain perpendicular to the midplane direction can be disregarded, i.e., the displacement component w is only a function of x and y and is independent of z.
②Stress component, the The strain induced can be disregarded, i.e.,.
(③) The points on the midplane of the thin plate have only the displacement w perpendicular to the midplane and no displacement parallel to the midplane. That is.
Based on the above basic assumptions, the surrounding rocks on both sides of the mining area are considered as elastic foundations, and the bearing layer is considered as a “thin plate” layer. In practical environments and calculations, vertical load is the main load for the bending of thin plates. Due to the stress isolation effect of the two surrounding rocks, the horizontal stress on the thin plate layer is relatively small, which is ignored.
3. Derivation of Mechanical Model of Concrete Thin Slab False Roof
3.1. Derivation of Differential Equations for the Deflection Curve of a Thin Concrete Slab False Top
3.1.1. Establishment of Differential Equations for Deflection Curves of Thin Concrete Slab Dummy Roofs
According to elasticity [
17], the deflection w of the midplane of a thin plate is a function of the coordinate axis. However, in actual mining operations, the width of the access road is generally much smaller than the length of the access road, and the false roof of the thin plate is subjected to a uniform load q. For cylindrical curved plates, at any position on the cross-section, the deflection w of the plate changes only in the x-axis direction, resulting in the deflection equation:
where w is the deflection of the dummy roof, D is the bending stiffness of the dummy roof, and q(x) is the external load of the dummy roof.
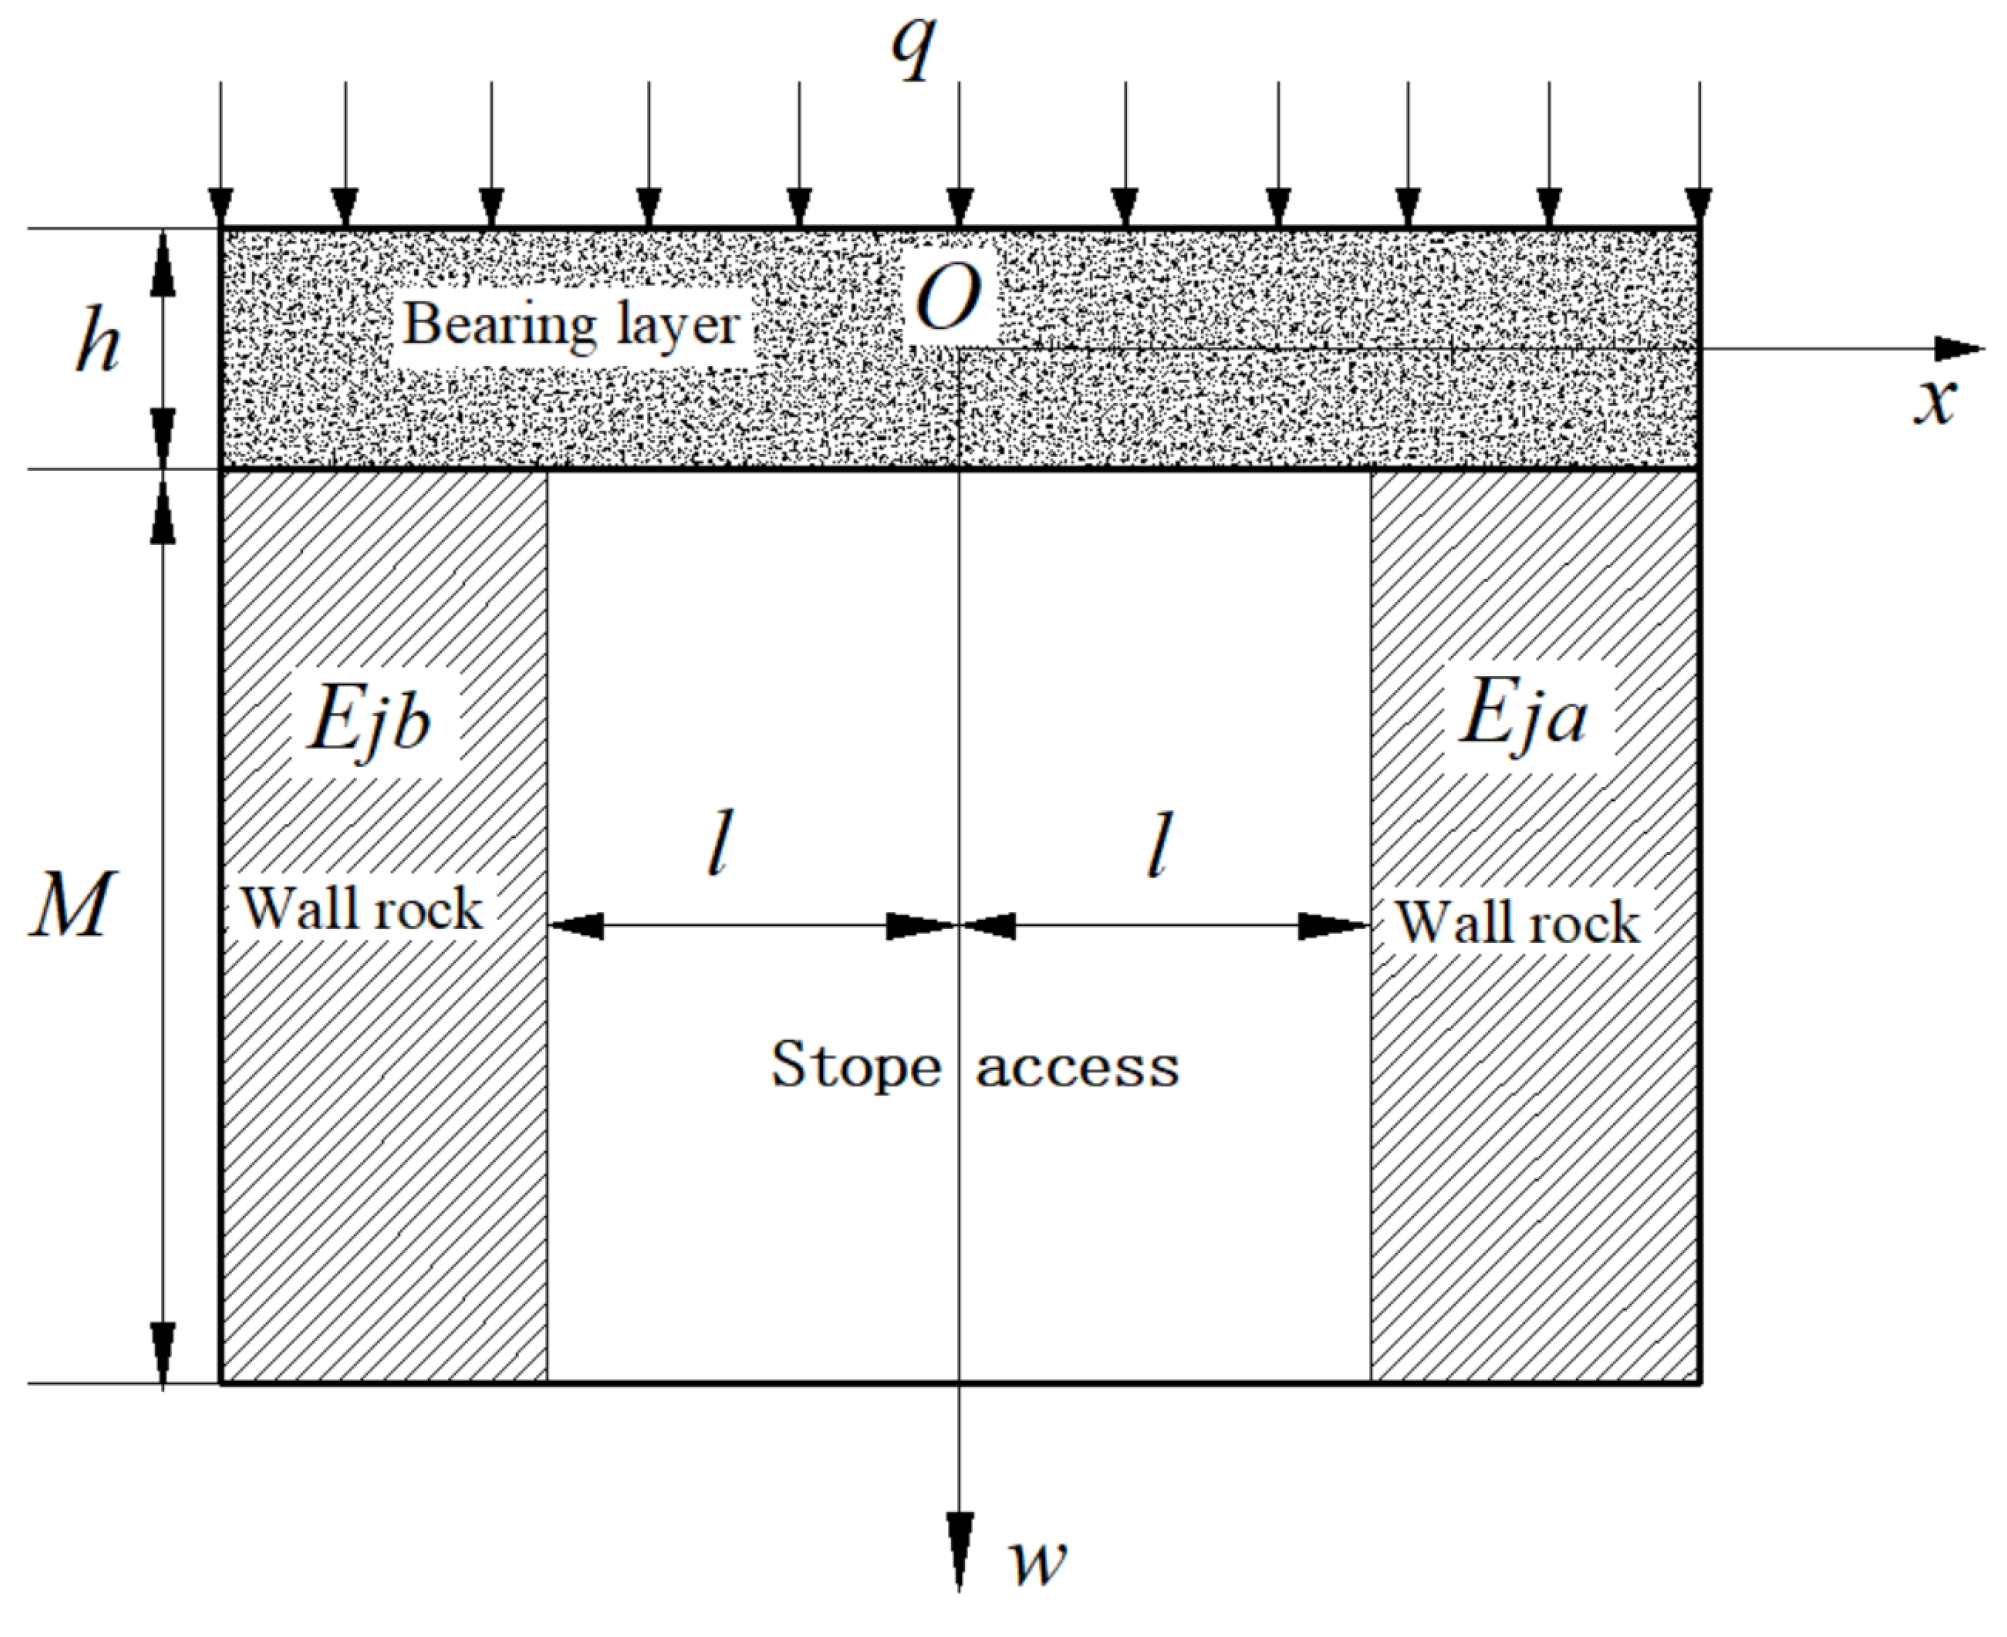
For the above column surface bending plate, it can be studied with unit width slats, and the unit length is taken along the approach direction (
y direction) on
Figure 1 to obtain
Figure 2.
The supporting force p(
x) that will generate upward action on the contact surface between the false top layer of the thin plate and the foundation:
where is the modulus of elasticity of the elastic foundation. is the vertical strain of the elastic foundation. is the subsidence of the elastic foundation at point x; M is the height of the quarry approach.
Assuming an ideal contact between the thin plate and the surrounding rocks on both sides, i.e., “w”_ J (x)=w (x). Thin plate q (x)=q-p (x) on elastic foundations on both sides of the route. The differential equation of the deflection curve of the plate on the elastic foundation of both sides of the route (x ≤ - l and x ≥ l) can be obtained:
Taking x ≥ l as an example, the solution of a fourth order linear non-homogeneous differential equation is:
According to the boundary conditions, when
x tends towards ∞,
. Substituting (4) into the above equation can obtain: A
3=A
4=0. The deflection curve equation of the plate is the sinking equation of the plate,
has no practical significance before the excavation of this route and can be omitted. Directly above the route, the external load of the board is
q(
x)=
q. Based on the same principle, it can be concluded that:
Eq., and, Ai, Bi, Ci (i-1~4) are the coefficients.
3.1.2. Determination of Pending Parameters A1, A2, B1, B 2
According to
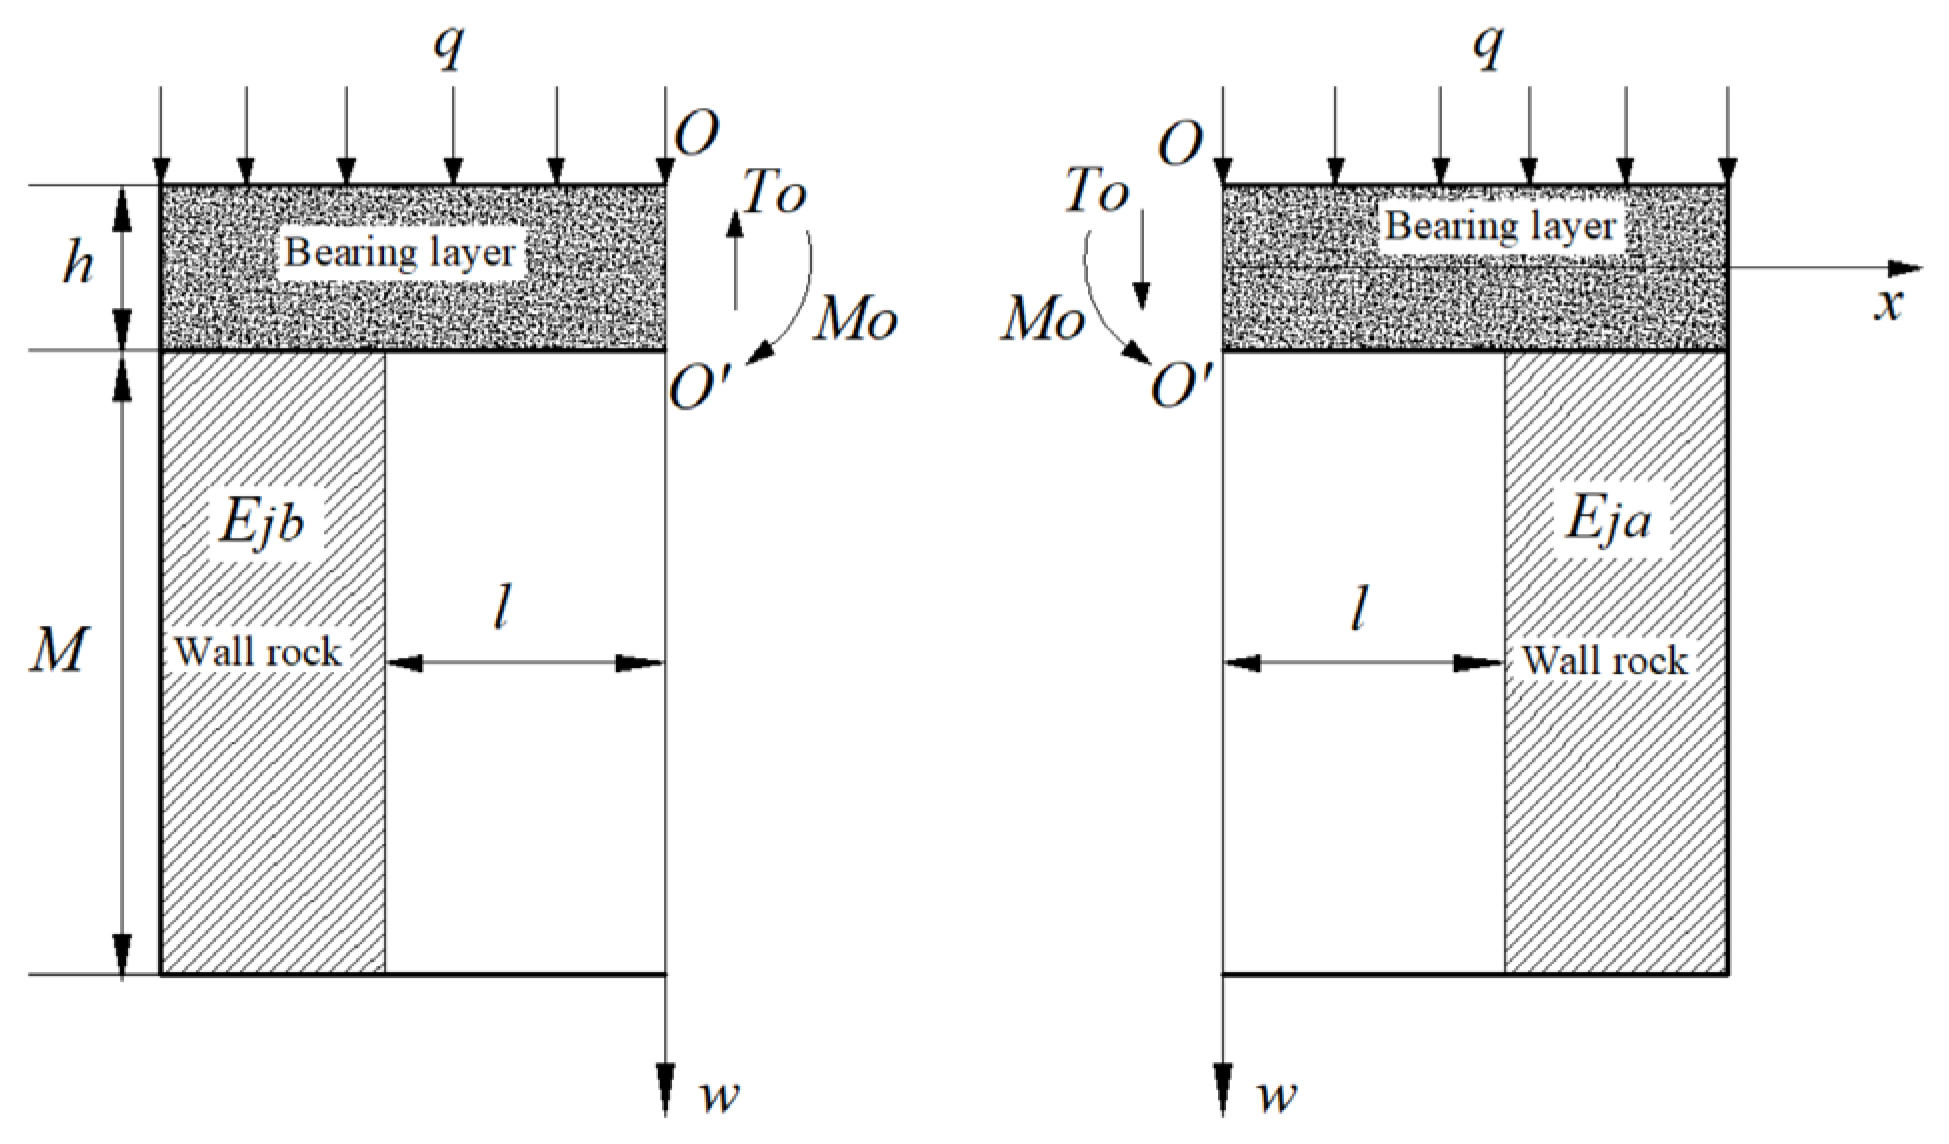
Figure 2, replace the y axis with the w direction of the Flat noodles, and make a section along the Ow axis to divide the Flat noodles into two parts: x ≥ 0 and x ≤ 0, as shown in
Figure 3. On the OO section, taking the right side as an example, in the vertical direction, under uniformly distributed loads and supporting forces, if the bearing layer is balanced, there will inevitably be shear force T0 and bending moment M0 on the section. At the section x=l, there is:
Figure 3.
Internal force model of slat profile.
Figure 3.
Internal force model of slat profile.
where is the total bending moment of the bearing layer. is the total shear force of the bearing layer. is the bearing layer OO′ profile bending moment. is the bearing layer OO′ profile tangential shear force, q is the uniform load; l is half of the approach width.
According to the thin plate theory, substituting
x=l into (5) and (6), the deflection equation of the bearing layer under the conditions of
x≥
l(formula 8) and
x≤-
l (formula 9) is obtained:
3.1.3. Determination of Mo and to from Deformation Coordination Conditions
Take the right half of
Figure 3 for analysis. Take the section EE’, and the intersection point between the section and the middle surface layer is e, which is:
where is the deflection of the right half at point o. is the deflection of the right half at point e. is the deflection of point o with respect to point e. is the corner of the right half in the OO’ profile. is the corner of the right half in the EE’ profile. is the turning angle of the OO’ profile with respect to the EE’ profile.
From Equation (10), we can obtain that the deflection at point
e (x =
l)
and the turning angle in the
EE’ profile: According to the deformation coordination conditions,
; The corners of the OO ‘section are equal, i.e
Simplified:
3.1.4. Determination of Parameters c1, c2, c3, c4
Substituting
x =
l into the third equation of the deflection Equation (5) for
-l x≤≤ l yields, also substituting
x =
l into the deflection Equation (8) for
x ≥
l yields
Coupling (12) and (5), it can be obtained that the differential equation of the deflection curve of the bearing layer on
-l≤x≤l is:
In summary, (8), (9) and (13) are the differential equations of the deflection curve for x≥l, x ≤ -l, -l≤x≤l bearing layer, respectively.
3.2. Analysis of Bending Moment of Concrete Thin Slab False Roof
In the thin plate bending problem, the bending moment caused by the external load is the main stress that causes the damage of the false top structure, therefore, when calculating the internal force of the thin plate, the bending moment is mainly analyzed. Taking -l≤x≤l as an example: when -l≤x≤l, the differential equation (13) of the deflection curve of the bearing layer shows that the bending moment on it can be expressed as . Let, and solve for. Let, when x > xc, the>0; when x<xc, < 0. So, on -l≤ x≤ xc, is a decreasing function; on xc≤x≤l, is an increasing function. Therefore, the bending moment has an extreme value on. Therefore, on -l≤x≤l, there is an extreme value M(xc) for the bending moment.
Similarly, it can be concluded that when x≥l, there is also an extreme value for the bending moment at . On x≤-l, there is also an extreme value for the bending moment at .
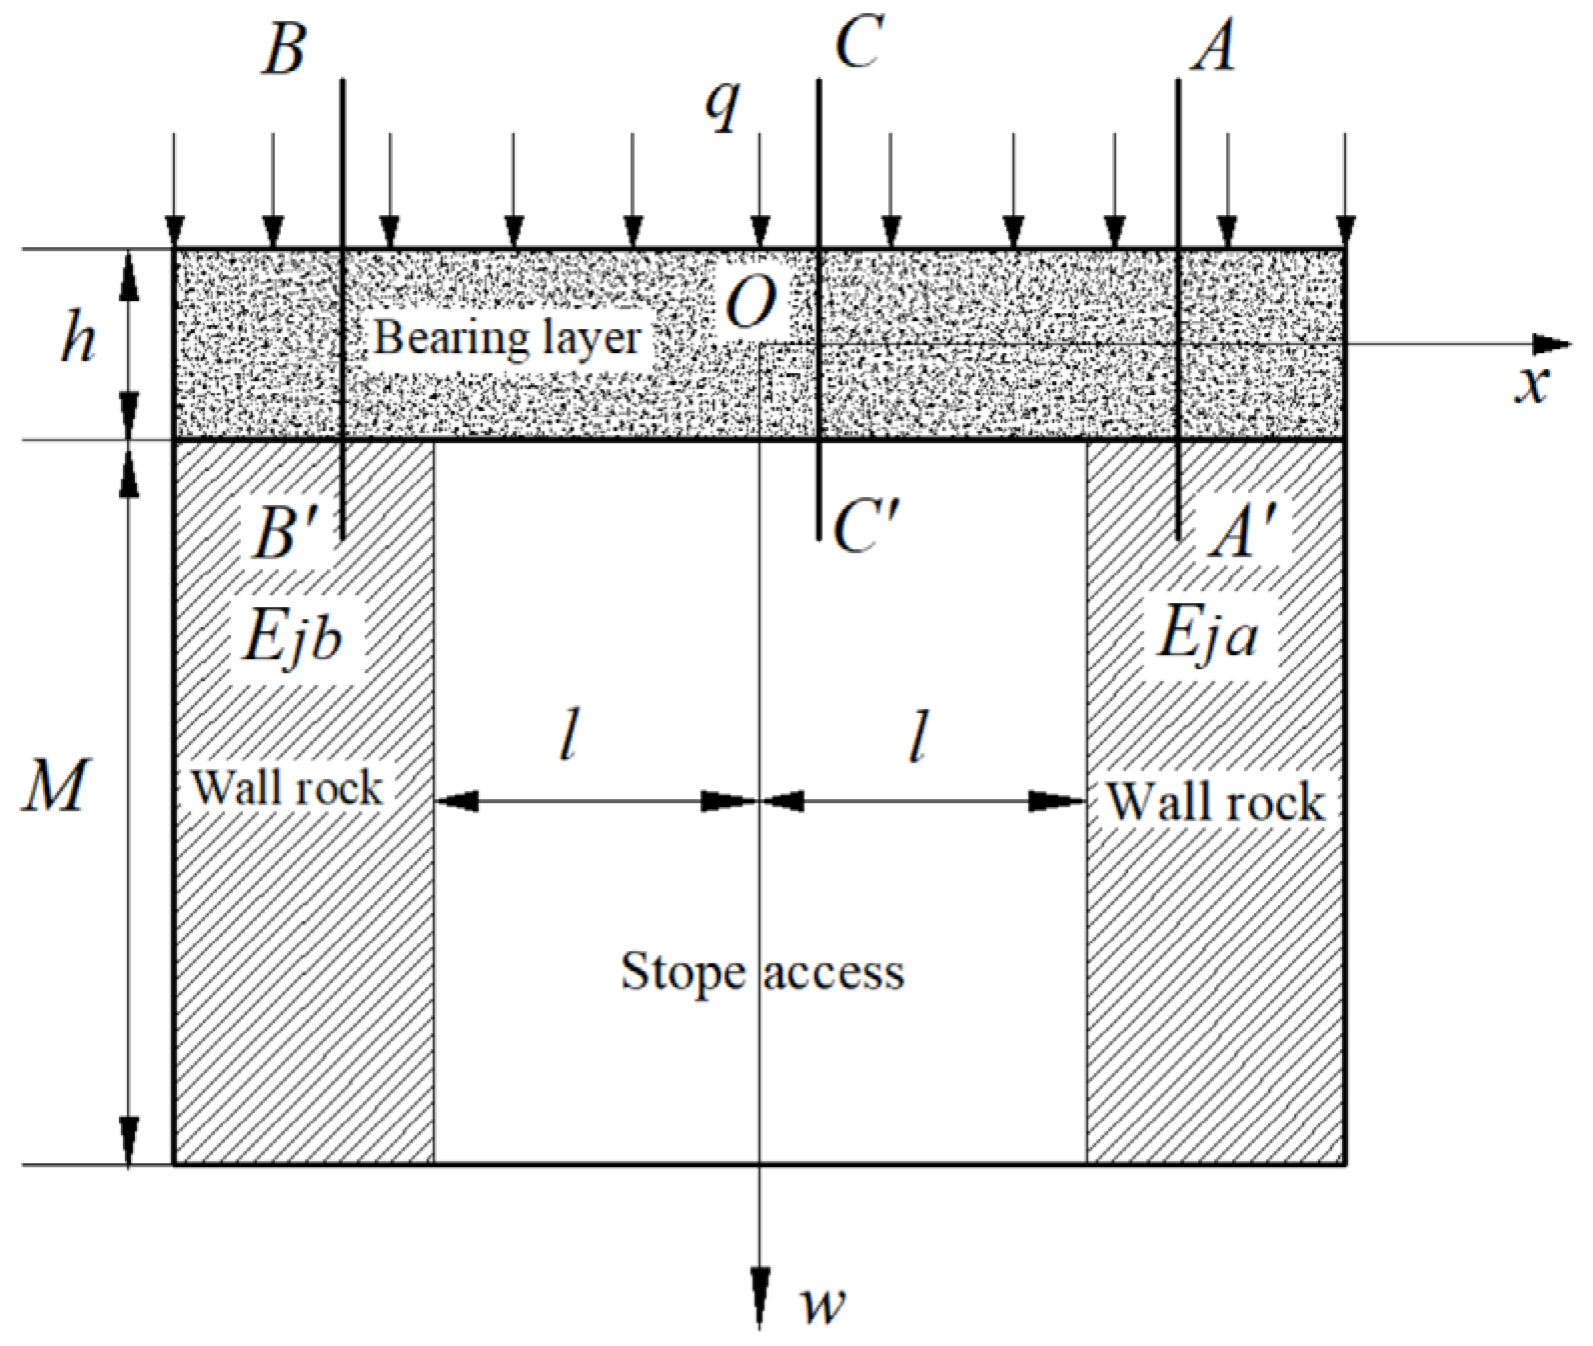
Based on the above analysis, there are three extreme bending moment points (sections) in the bearing layer near the mining route, M
c, M (
xA), and M (
xB), as shown in
Figure 4.
3.3. Concrete Thin Slab False Roof Hazard Point Analysis
The elastic modulus of the two sides of the copper mine paste backfill and the false roof is relatively small. This type of paste backfill is formed on both sides, and the top plate is called the “soft support weak plate” structure. Due to the same mechanical properties of the two foundations, i.e.,
,
,Substitute (11) to obtain the bending moment M at the OO ‘section (x=0) of the central false top of the route
and shear force
:
On
-l x≤≤ l, according to Equations (13) and (14) we get
At x = 0, the bending moment has a minimal value.
In order to determine the danger point of the soft-supported weak-slab structure, a comparative analysis of the three bending moment values determined by (20) is required. Due to the symmetry of the structure, the right half is taken for the analysis, i.e., the extreme value of the bending moment
M(xA) in the right half. Let
M(0) =
M(
xA), where only the numerical magnitudes are considered, and set
and
Substitute the obtained extreme value points
and
yields.The solution gives.
where is the modulus of elasticity of the approach side gang foundation. is the modulus of elasticity of the false top. is the Poisson’s ratio of the filled dummy roof; h is the thickness of the dummy roof; l is half of the width of the approach; M is the height of the approach.
That is: when when M(0) < M(xA), there is a maximum bending moment in the AA’ section. When when M(0) > M(xA), there is a maximum bending moment in the OO’ section.
In the approach of soft-supported weak plate structures, there are generally <0.8, the <3.44, i.e., M(0) > M(xA), there is a maximum bending moment in the OO’ section. Therefore, the maximum bending moment is in the dummy top OO’ section in the center of the approach, and there is a maximum compressive stress at the point O on the upper surface of the dummy top and a maximum tensile stress at the point O’ on the lower surface of the dummy top. For the paste backfill, the tensile strength is much less than the compressive strength, so it may send the pull-off damage at the point O’ on the lower surface of the false top.
4. Concrete Thin Slab False Roof Model Field Application
The actual size of the approach to the Kimbishi copper mine is a parallelogram structure with a vertical height and width of 4 m and a length of 30 m. Based on the analysis of the nature of the surrounding rocks and the concrete dummy roof of the two gangs of the downward approach to the Kimbishi copper mine, it is known that the approach structure is a soft-supported weak slab structure. According to the results of the previous analysis the maximum bending moment within the false roof is at
x=0, i.e., the mechanical model equation of the concrete false roof of the downward approach to the Kumbishi copper mine is as follows.
where is the value of the maximum bending moment, is the value of bending moment at the point x = 0, q is the mean load of the load bearing layer, and is the correlation coefficient, the is the maximum tensile strength value, and is the compressive strength value, and -density of the filling layer, -thickness of the filling layer -the thickness of the filling layer -half of the arch width of the natural fall arch modulus of elasticity of the lateral rock surround, - modulus of elasticity of the bearing layer modulus of elasticity of the bearing layer is the density of the ore body, f rock solidity coefficient, and -The density of the concrete bearing layer, l is half of the width of the approach, h is the thickness of the bearing layer, D is called the bending stiffness of the bearing layer, and M is the height of the approach.
The surrounding rocks of the downward approach to the Qimbishi copper mine are basically marl, and their modulus of elasticity
is between 3658~7316MPa. The concrete grade of the bearing layer is basically
C10-C25, and its modulus of elasticity
The modulus of elasticity is between 17,500 and 28,000 MPa, and the Poisson
’s ratio is 0.1 to 0.2.
basically between 0.13~0.41. Therefore, substituting the second equation in (17) yields.
From the first equation of (17),
is
decreasing function of alpha. Based on (18), it can be seen that an increase in the elastic modulus Ej of the surrounding rock on the side of the access road is conducive to the stability of the false roof structure, while an increase in the height M of the access road is not conducive to the stability of the false roof structure. Therefore, in the design, for safety reasons, α The minimum value should be taken. The minimum compressive strength value of the bearing layer that can be obtained:
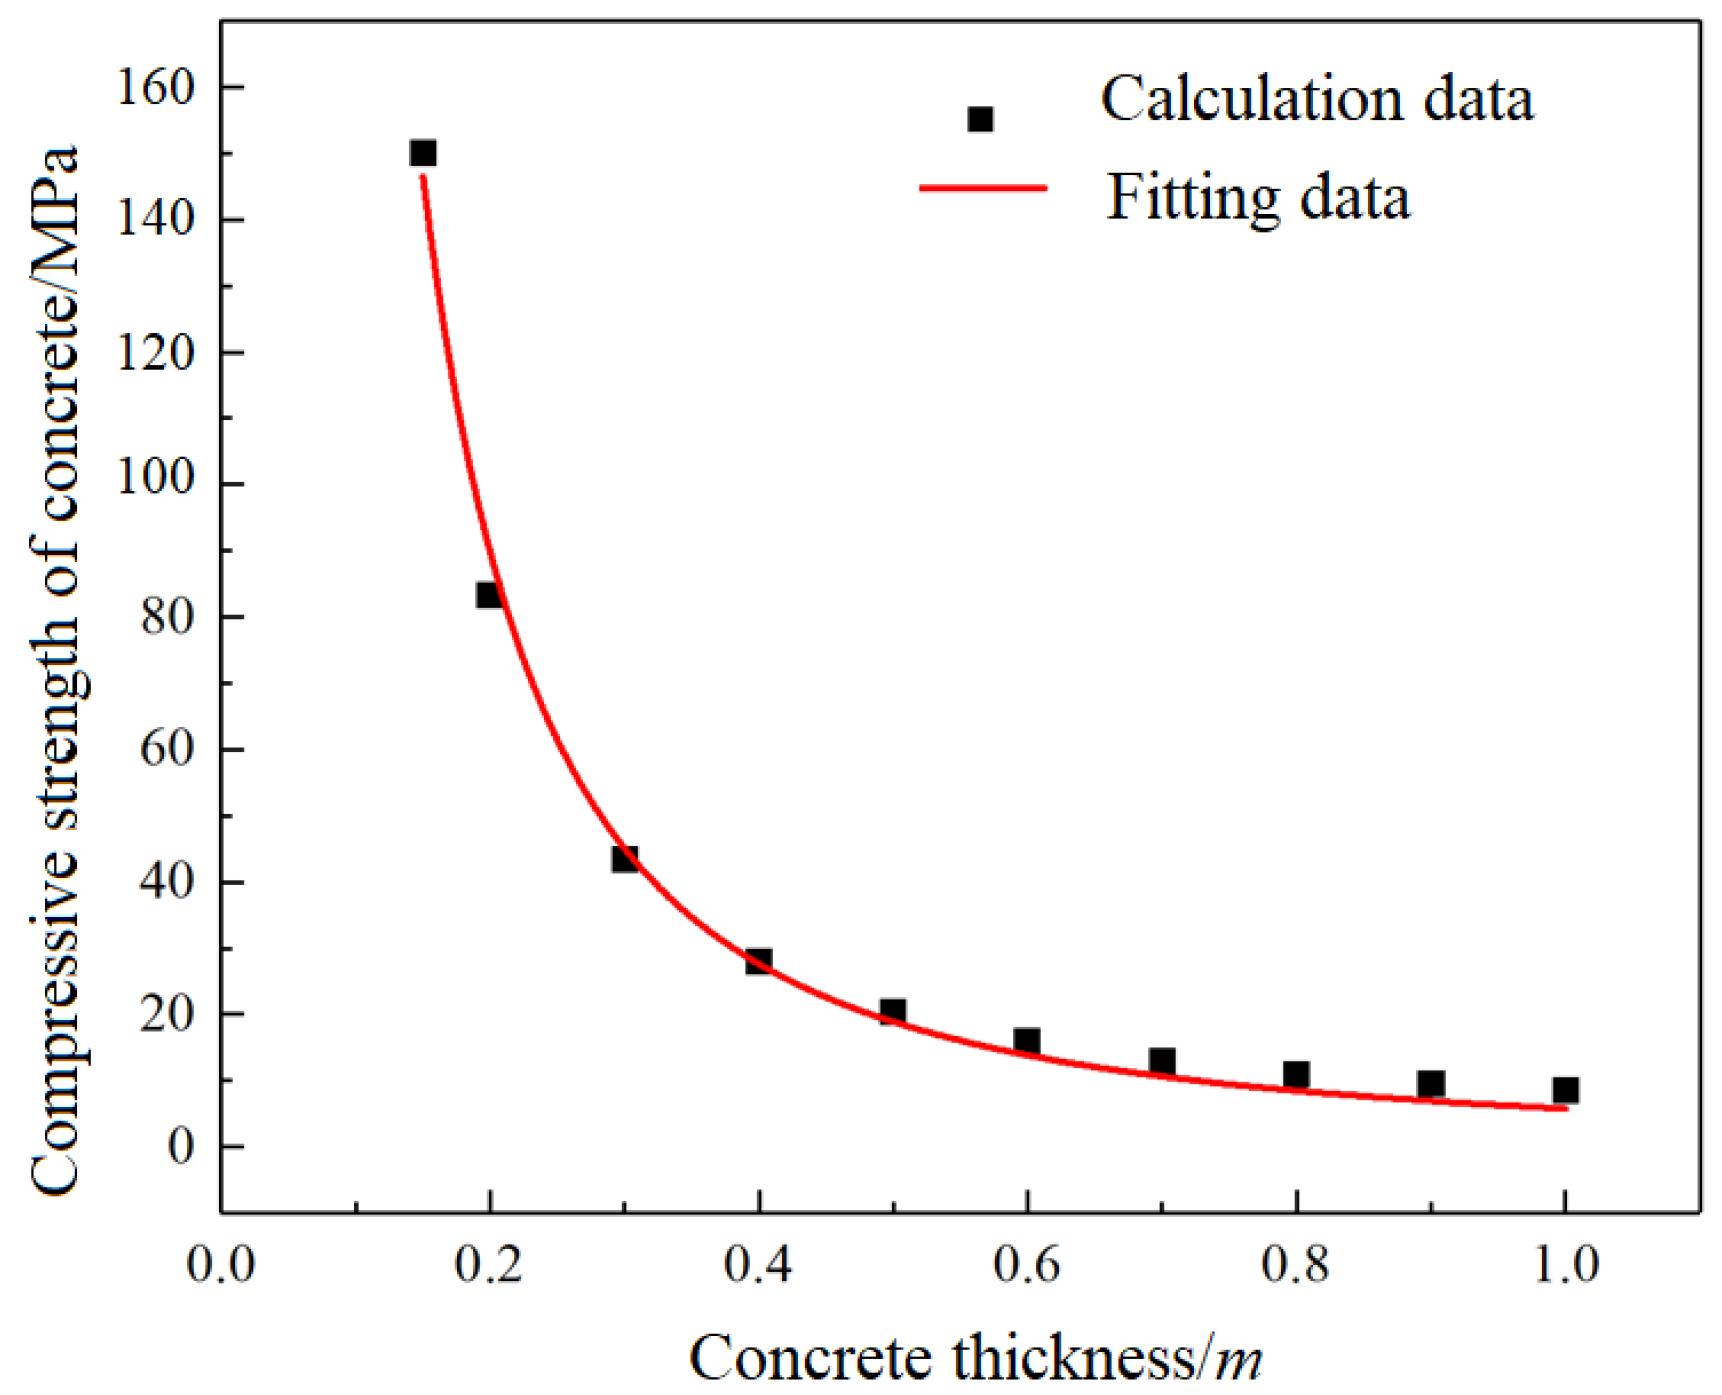
Combining the parameters of the downward approach to the Qimbishi copper mine by substituting (19), the relationship between the minimum compressive strength of the concrete dummy roof and the thickness of the concrete dummy roof can be obtained as shown in
Figure 5.
From
Figure 5, it can be seen that the concrete false top compressive strength value shows a gradual decrease with the increase of concrete false top thickness, and the change rate of concrete false top compressive strength value changes very little when the thickness exceeds 0.5
m, and gradually tends to equilibrium, so it is recommended that the concrete false top thickness
h is selected as 0.5
m. The regression analysis of some of the calculated data was performed using SPSS software, and the regression formula (20) was determined. where the regression coefficient
R2 =0.9944, indicating a good fit. The minimum compressive strength value required for the concrete false top at this time calculated by substituting h=0.
5m into formula (20) is 18.89 MPa, which is converted into a minimum tensile strength value of 1.41 MPa, so the recommended concrete grade is C20.
Where: y is the concrete false top compressive strength value, MPa; x is the concrete false top thickness, m.
5. Finite Element Verification of Artificial False Top Thin Plate
5.1. Finite Element Model
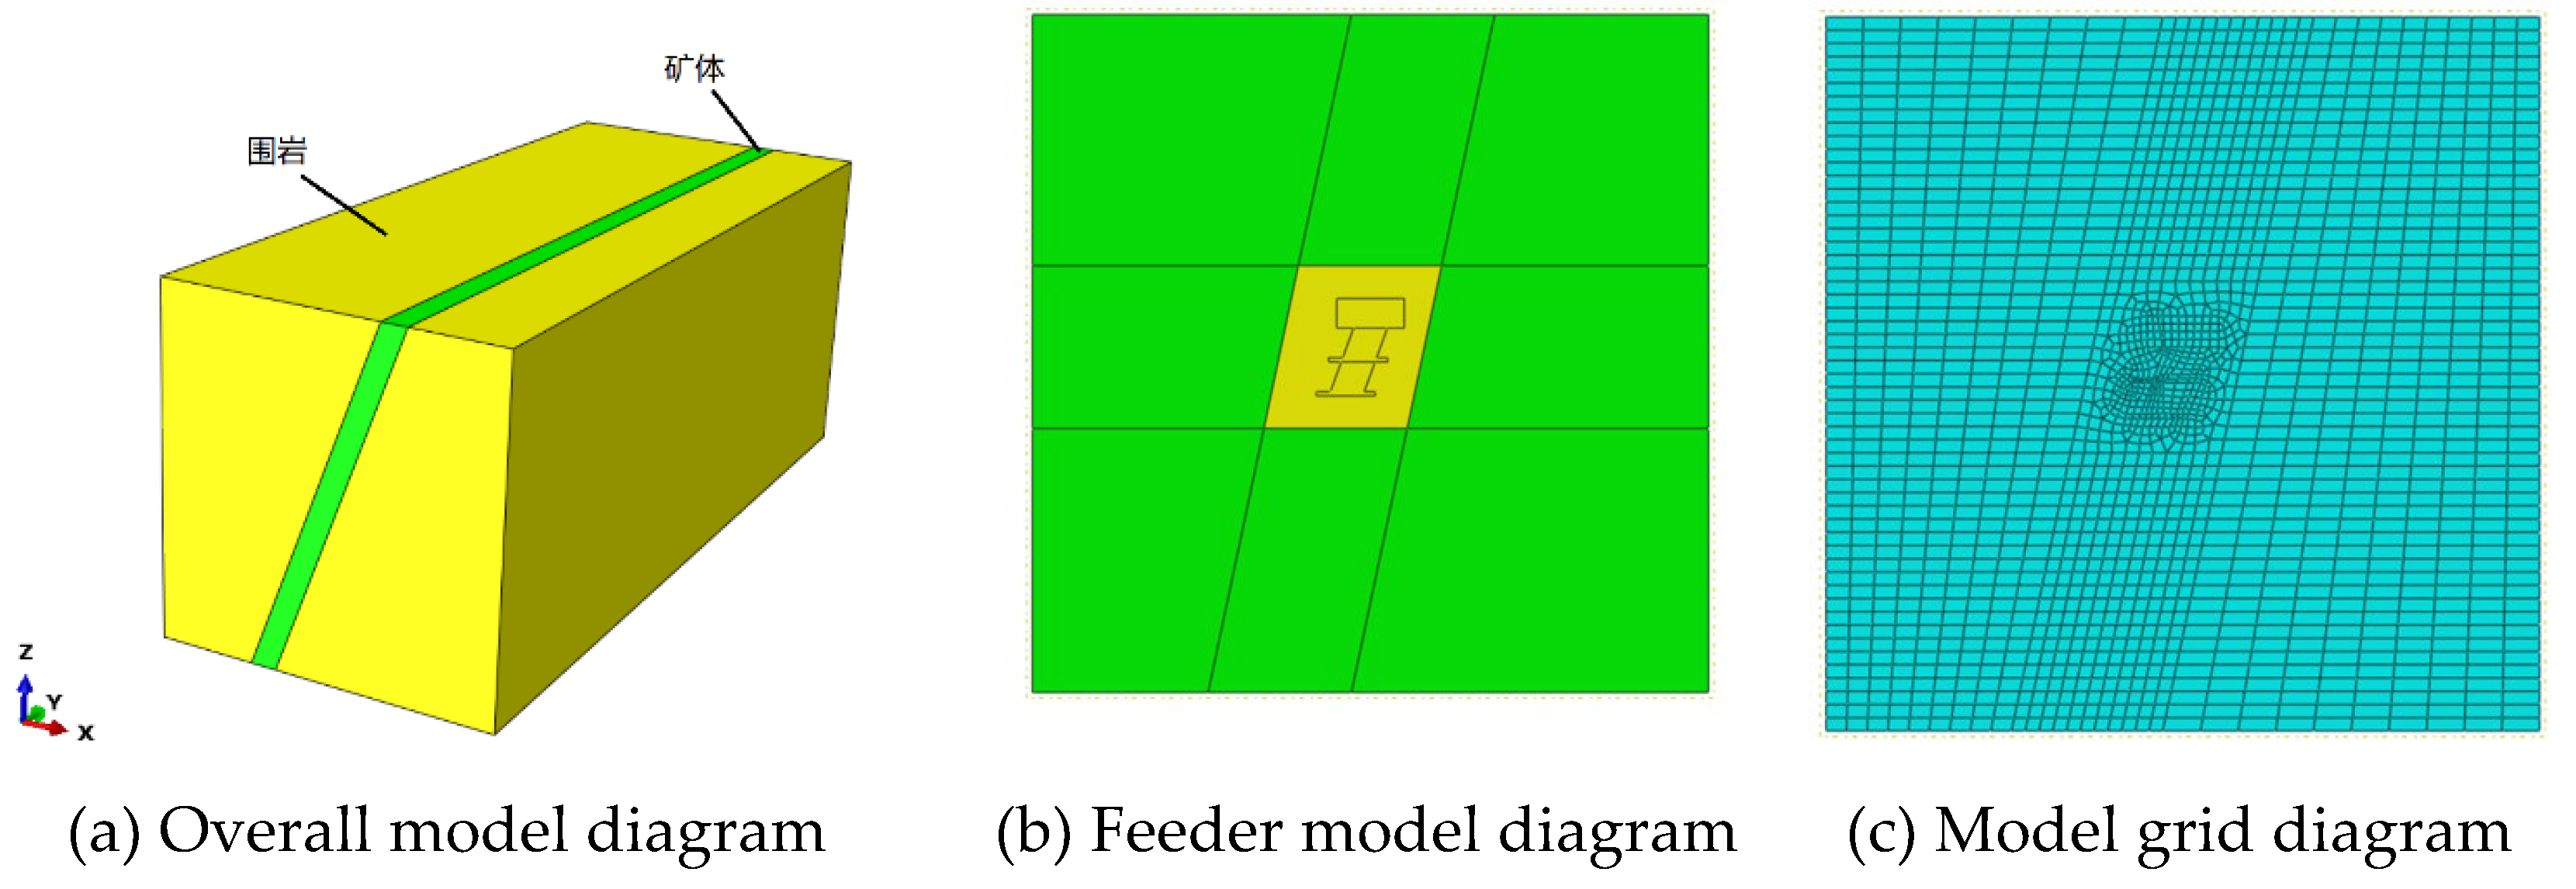
Based on the above theoretical results the concrete damage criterion in the finite element analysis software ABAQUS was applied for modeling and analysis. The model size is more than three times the excavation size according to the St. Venant principle. The three-dimensional numerical calculation model of the mining of the main ore body 770~878ml western unstable area of the main ore body in Qimbishi, Zambia was established, which has a length of 80m along the X-direction, 200m along the Y-direction and a height of 108m along the Z-direction. Since the actual mine opening approach is similar to a parallelogram structure, the design is shown below in order to bias the division of the grid as shown in
Figure 6. The lower part of each layer is in the form of niches. The density of concrete is
2360kg/m³, the modulus of elasticity is 28GPa, and Poisson’s ratio is 0.2. The Mohr-Coulomb principal structure model is chosen. The stress applied to the model in the vertical direction is calculated to be 20.79 MPa.
5.2. Finite Element Analysis Results
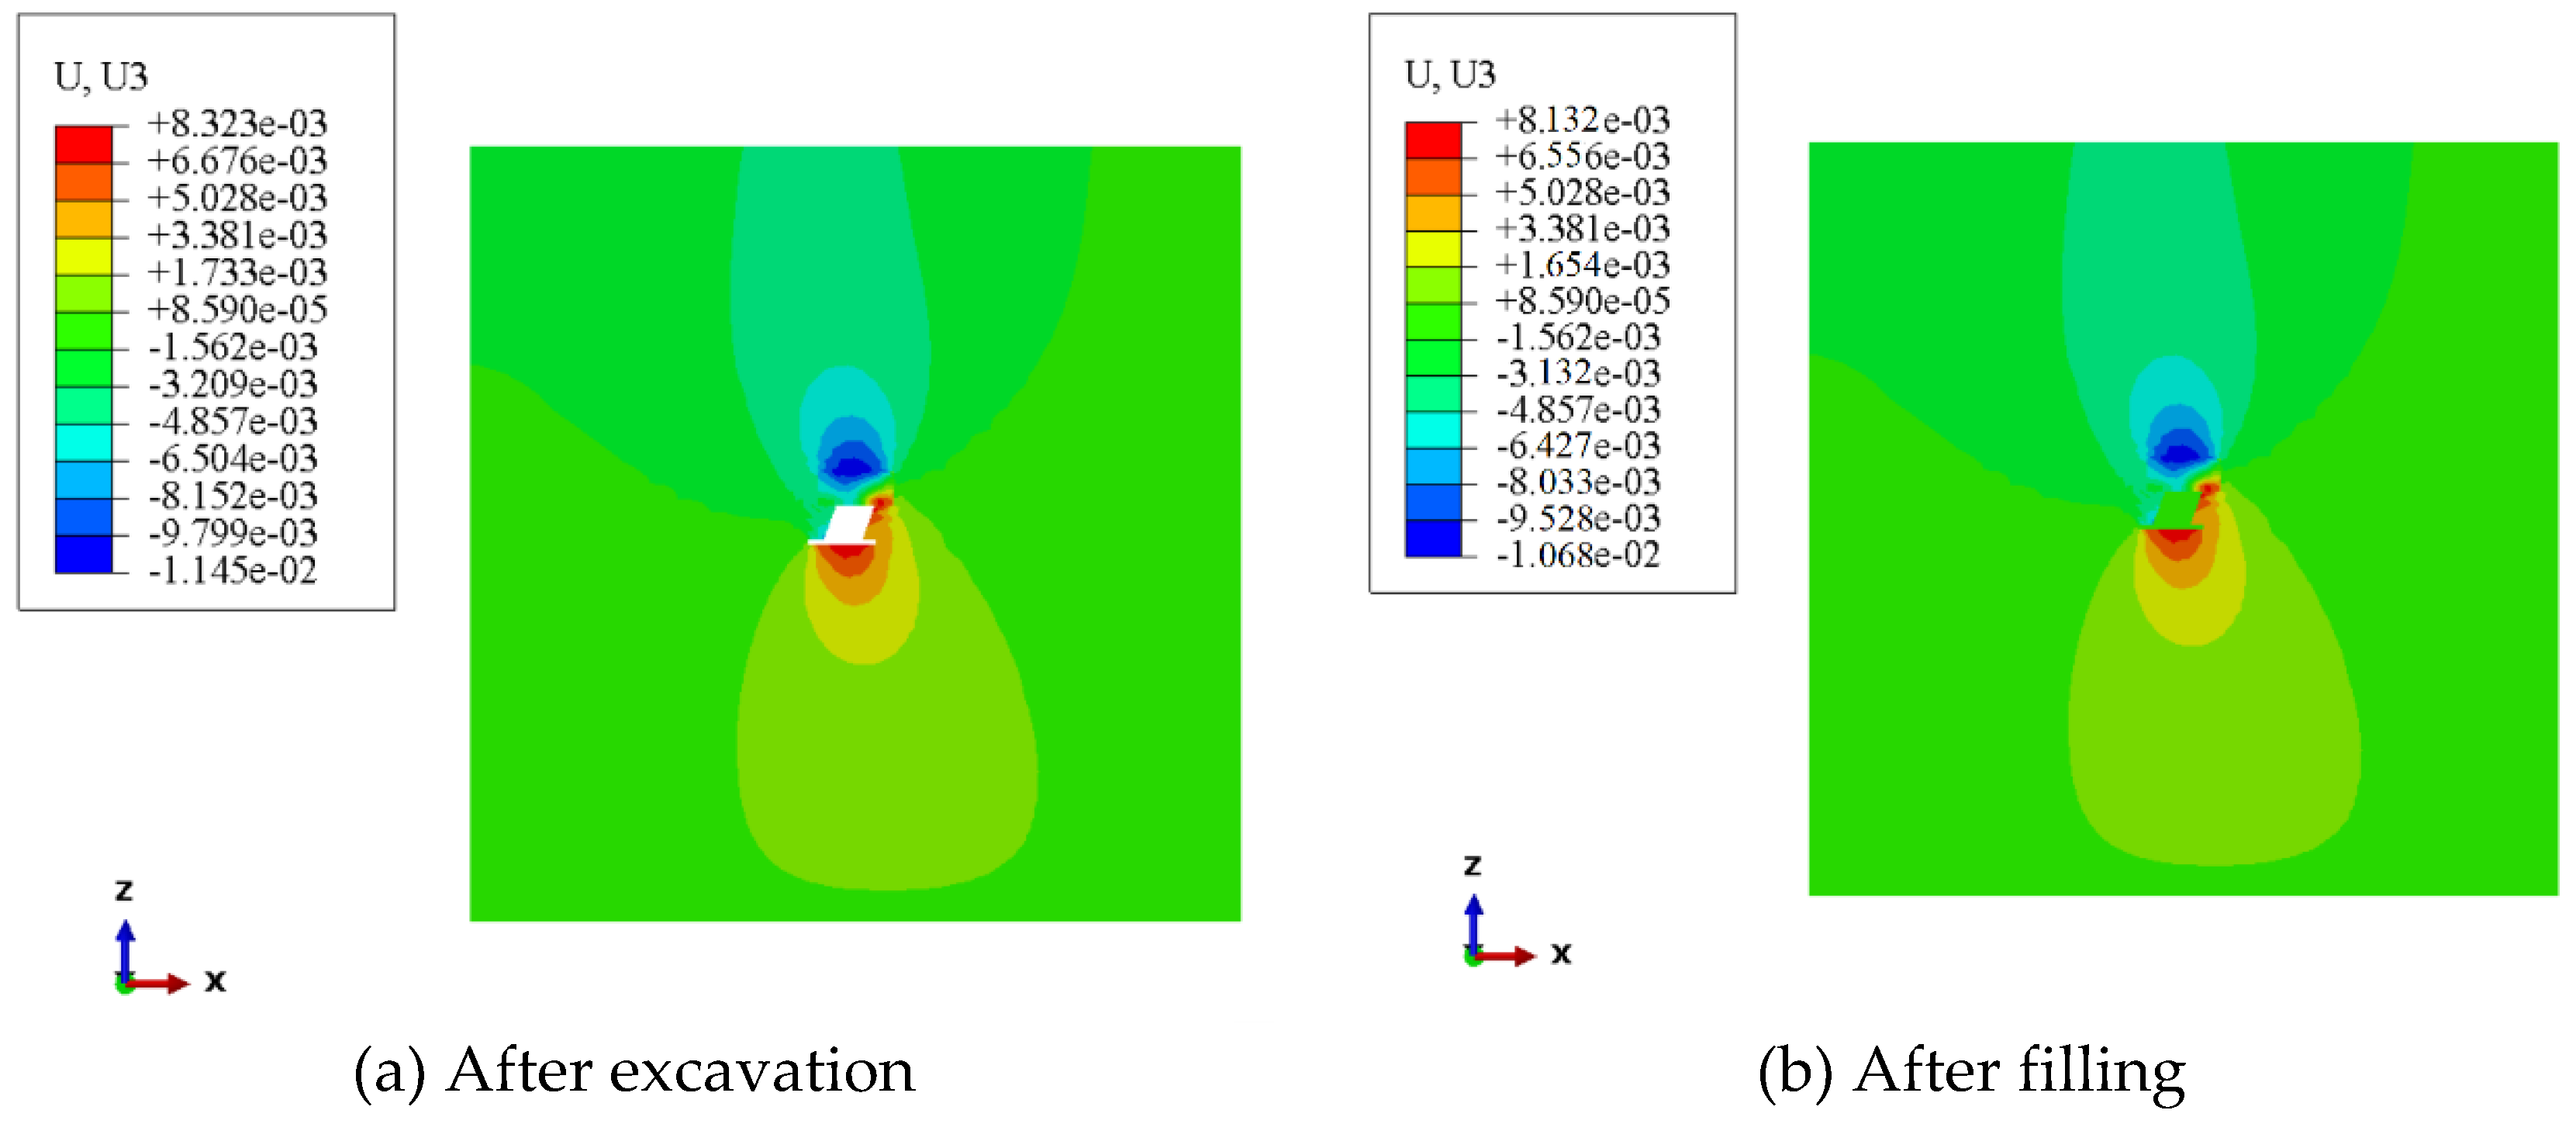
The unit in
Figure 7 is m. For the convenience of analysis, the following analysis is unified cm. “+” indicates the positive direction of z-axis, i.e., vertical upward; “-” indicates the negative direction of z-axis, i.e., vertical downward.
When the approach was mined and filled, the top and bottom slabs were also displaced, with the maximum displacement value of 1.15 cm for the top slab and 0.83 cm for the bottom slab, indicating that the concrete false top was deformed with small deflection under self-weight and uniform load. The maximum displacement occurs in the middle position of the false roof, where it is consistent with the results in the previous theoretical analysis section. This can be explained by the formation of disturbance after the excavation of the ore body, which inevitably leads to the redistribution of stresses and the achievement of a new equilibrium. In this process, due to the unloading effect, the rock body, due to its elastic nature, also leads to the displacement of the rock body, moving towards the direction of self-weight action, i.e., the exposed surface, and sinking deformation occurs. Similarly, the bottom slab is more prone to uplift after being subjected to extrusion. Although the paste backfill has a certain bearing capacity, although it is subsequently filled, the strength and capacity of the paste backfill differ greatly from the original rock, which is not enough to inhibit the release of the surrounding rock stress, so it is impossible to completely stop the displacement.
The unit in
Figure 8 is Pa, and for the convenience of analysis, the following analysis is unified MPa. “+” indicates tensile stress, and “-” indicates compressive stress. When the approach is mined and filled, different stress values appear in both the top and bottom slabs, and tensile stresses appear in both the top slab, with the maximum tensile stress value of 0.65 MPa, and the maximum tensile stress appears in the middle position, which is consistent with the results in the previous theoretical analysis section here. According to the previous theoretical analysis, the tensile strength of the concrete is 1.41 MPa, i.e., the tensile stress value does not exceed the tensile strength value of the top bearing layer. The compressive stresses appear in the bottom slab, and the maximum compressive stress value is 4.15 MPa, which does not exceed its compressive strength value of 18.89 MPa.
According to the above analysis of the stress field and displacement field of the concrete false top, it can be seen that the maximum stress and maximum displacement appear in the middle position of the cross section of the false top under the uniform load, and the maximum tensile stress is less than its own tensile strength value, and the displacement belongs to the small deflection deformation, which is consistent with the theoretical analysis results and verifies the reasonableness of the concrete mechanical model.
6. Conclusion
(1) In this paper, the mechanical model of the concrete false roof is derived based on the elastodynamic thin-slab model, citing that the concrete thin-slab false roof has three types of deflection curve differential equations perpendicular to the strike, and three extreme points exist in the thin-slab mid-section and on both sides of the surrounding rock.
(2) The dangerous surface of the hard-supported weak-slab structure appears at the junction of the surrounding rock and the thin-slab false top, and the dangerous point is at the top of the dangerous surface; the dangerous surface of the soft-supported weak-slab structure appears in the middle section of the thin-slab false top, and the dangerous point appears at the bottom of the dangerous surface, and the damage mode of both structures is maximum tensile stress damage.
(3) The calculation model of the ultimate strength of the concrete false roof and its thickness was derived, and the two were in a power function relationship, which gradually decreased with the increase of the false roof thickness, and the false roof strength value gradually tended to equilibrium when the false roof thickness exceeded 0.5m. Combined with the specific situation of a mine in Zambia, the optimum thickness of concrete false roof was determined to be 0.5m, with compressive strength of 18.89 MPa and tensile strength of 1.41 MPa.
(4) The numerical simulation results of the stress field obtained that the maximum tensile stress of the concrete dummy top appeared in the middle of the lower surface of the concrete dummy top, and the maximum tensile stress was 0.65 MPa, which was less than the tensile strength of the concrete dummy top and the steel reinforcement. The numerical simulation results of the displacement field obtained that the maximum displacement of the concrete dummy roof appeared in the middle of the concrete dummy roof cross-section, and the trend of displacement from the two ends to the middle gradually became larger. The maximum displacement of the concrete dummy roof is 1.15cm, all of which belong to small deflection deformation. Combined with the theoretical analysis and ABAQUS analysis, it can be obtained that the concrete false roof can work safely and stably under the action of uniform load, and also verifies the reasonableness of the mechanical model of the false roof.
Author Contributions
LH conducted indoor design and analysis, W HJ conducted theoretical analysis, L CK established a model. All authors read and approved the final manuscript.
Funding
This work was supported by the Key Program of National Natural Science Foundation of China (Grant No. 51834001); Key Program of National Natural Science Foundation of China (Grant No. 52130404).
Ethics Approval and Consent to Participate
This research does not involve any ethical issues and all participants have agreed.
Consent for Publication
All participants in the paper have agreed to publish.
Availability of Data and Materials
The datasets used and/or analyzed during the current study are available from the corresponding author on reasonable request.
Competing Interests
The authors declare that they have no competing interests.
References
- C. Zhou, Analysis of geological characteristics and ore-controlling factors of copper ore belts in Zambia. World. Non. Metals. 10(2018) 150-151.
- H. Ma, Geology and ore mineral characteristics of Kabula copper mine in Copperbelt Province Province, Zambia. World. Non. Metals. 02(2022) 82-84.
- H.G. Jiang, T.C. Yu, G.S. Liu, Application of Strength Requirements for Filling Bodies with Downward Rectangular Drift. Non. fer. Metals, 74(2022) 42-49.
- Y.C. Zhou, L.S. Liu, L.X. Wan, Research and application of artificial false roof optimization in downward drift filling mining method. Min. Res. Dev, 43(2023) 53-58.
- X.M. Wei, Research on the strength characteristics of high stage all-tailed sand cemented fill and fill ratio design. Beijing: University of Science and Technology Beijing (2018).
- D. Huang, Z.J. Zheng, S. Cui, Study on the strength and reinforcement parameters of artificial false roof by downward approach filling mining method. Modern Min, 35(2019)43-46.
- G.S. Liu, S.C. Yang, L.J. Guo, Optimization study on the strength requirement of the paste backfill after the empty field based on the mining and filling time sequence. Non. Fer. metal. eng., 9(2019) 85-94.
- Q.H. Tian, K. Wang, N.Y. Wang, J.X. Chen, Z.J. Ren, Study on optimization of structural parameters of backfill false roof under coupling optimization of Linear elasticity and numerical simulation. Min. Res. Dev., 42(2022) 20-28.
- C.C. Yang, Sensitivity analysis of factors influencing the stability of downward approach. Min. Res. Dev., 39 (2019) 22-25.
- Z.P. Guo, F. Feng, R.F. Huang, C. Wang, W. Li, E.Y. Wang, Study on the physical behavior and stability of overburden filling in single tunnel approach type back mining. Metal. Min, 39(2019)22-25.
- A.X. Wu, A.Q. Zhang, H.J. Wang, G.C. Li, K.W. Rong, Study on the mechanical model of paste false roof and finite element analysis. J. Min. Safety Eng., 34(2017)587-593.
- X.B. Xie, D.X. Li, L.Y. Kong, Stability analysis model of mine wall based on elastic thin plate theory and its application. J. Min. Safety Eng., 37(2020) 698-706. [CrossRef]
- Z.Y. Liu, Z. Gan, D.Q. Gan, Z.L. Xue, H.X. Ren, Optimization of artificial false bottom thickness for offshore ore body mining and engineering application. Metal. Min, 8(2016)54-57.
- X.Y. Shang, X.B. Li, K. Peng, X. Xu, Optimization of very crushed ore body approach based on safety factor and reliability. J. Cen. Sou. Uni., 47(2016) 2390-2397.
- M. Qin, Y.H. Huang, C. Liu, Application study on stability of multi-layer overlapping goaf based on small deformation thin plate theory. Min. Tech., 21(2021) 80-83/. [CrossRef]
- X.R. Fu, P. Chen, Z.L. Sun, M.W. Yuan, Balance and coordination theory in finite element analysis of Linear elasticity. Applied mechanics, 40(2023) 8-16. [CrossRef]
- X. Luo, Research on safe thickness of laminated roof based on improved Pratt’s equilibrium arch theory. Coal. Sci. Tech., 49(2021)73-80.
|
Disclaimer/Publisher’s Note: The statements, opinions and data contained in all publications are solely those of the individual author(s) and contributor(s) and not of MDPI and/or the editor(s). MDPI and/or the editor(s) disclaim responsibility for any injury to people or property resulting from any ideas, methods, instructions or products referred to in the content. |
© 2024 by the authors. Licensee MDPI, Basel, Switzerland. This article is an open access article distributed under the terms and conditions of the Creative Commons Attribution (CC BY) license (http://creativecommons.org/licenses/by/4.0/).
