Submitted:
03 March 2024
Posted:
04 March 2024
You are already at the latest version
Abstract
Keywords:
1. Introduction
1.1. Generality
1.2. Aim
2. Materials and Methods
2.1. Study Context
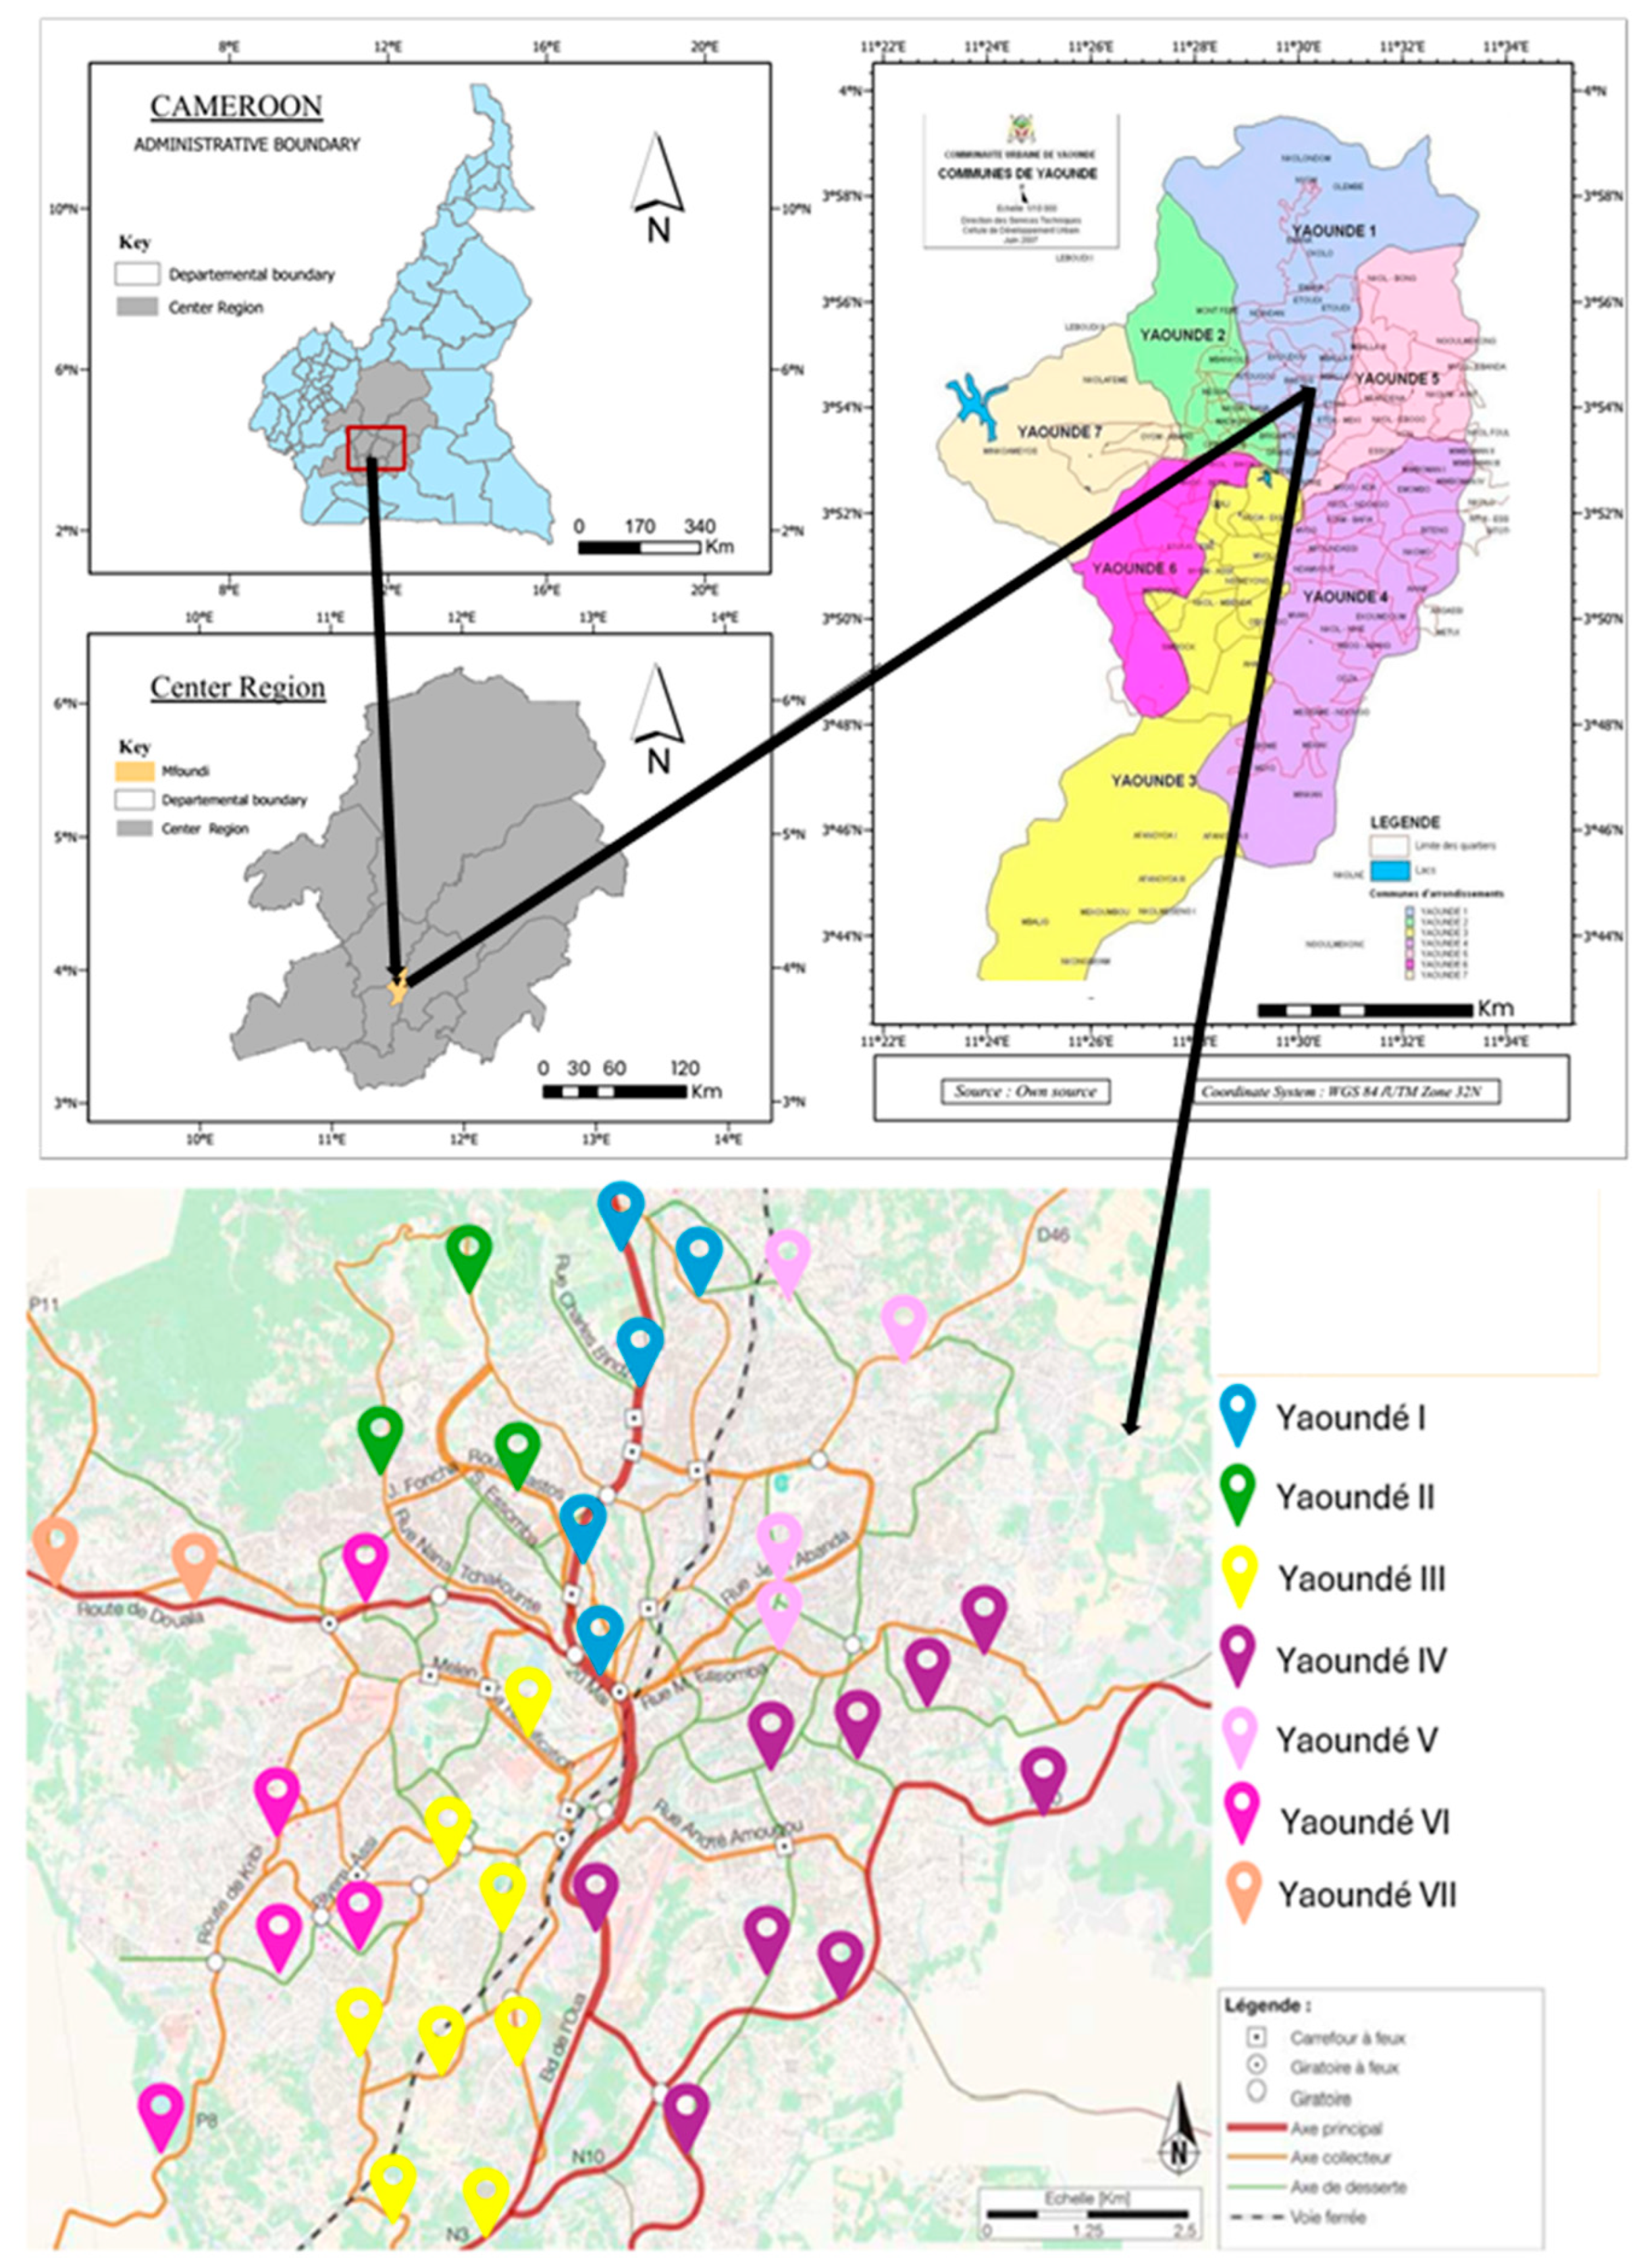
2.2. Site Selection and Timing
- Safe and inconspicuous place along the roadside for the observer to watch all the drivers safely and clearly inside their car without being noticed by them.
- Location away from complex situations requiring drivers’ full attention (road works, traffic calming measures, pedestrian crossing, enforcement).
- Location preferably away from intersection but if nearby, only drivers who are driving would be observed, not drivers who are stationary.
- Location with undisturbed traffic and a traffic flow greater than 10 vehicles per hour.
2.3. Definition of Data of Interest
2.4. Measurement Procedure
2.5. Minimun Sample Size
- Mssr is the Minimum sample size required.
- is the prevalence, i.e. the percentage of distracted drivers, generally assumed or taken from similar previous studies on a similar population.
- depends on the confidence level. For a 95% confidence level, the is 1.96 [77].
- is the precision.
2.6. Quality Control and Data Treatment
2.7. Data Analysis
2.7.1. Computation of the Distraction SPI
-
Prevalence of distracted driving (P1)This prevalence was computed using Equation 2
-
Prevalence of handheld mobile device distracted driving (P2)This prevalence was computed using Equation 3
-
Prevalence of interaction distracted driving (P3)This prevalence was computed using Equation 4
-
Prevalence of eating/smoking/drinking distracted driving (P4)This prevalence was computed using Equation 5
2.7.2. Weighted Distraction SPI
- SPIweighted is the weighted SPI.
- Pi is the SPI at each observation point.
- Wi is the 60min traffic volume at each observation point.
- n is the number of observation points.
2.7.3. Analysis Conducted
3. Results and Discussion
3.1. Description of the Study Sample
3.2. General Results of the Safety Performance Indicators
3.3. Handheld Mobile Device
3.3.1. Global Prevalence and Per Vehicle Type
3.3.2. Prevalence per Councils
3.3.3. Prevalence per Road Type
3.3.4. Prevalence per Time Period

3.3.5. Prevalence per Age Group
3.3.5. Prevalence per Gender
3.3.6. Prevalence per Passenger Presence
3.4. Interaction
3.5. Eating/Smoking/Drinking
3.6. Comparision with Other Countries
4. Recommendation
5. Conclusion
Author Contributions
Funding
Institutional Review Board Statement
Informed Consent Statement
Data Availability Statement
Acknowledgments
Conflicts of Interest
References
- World Health Organization. Global status report on road safety 2023. 2023. Available online: https://www.who.int/teams/social-determinants-of-health/safety-and-mobility/global-status-report-on-road-safety-2023 (accessed on 18 February 2024).
- World Bank Group. Saving lives through private investment in Road Safety. 2022. Available online: http://documents.worldbank.org/curated/en/099525002222214332/P1750030e6c58506b08d5b05ccba3311628 (accessed on 08 February 2024).
- J. C. Stutts, D. W. Reinfurt, and E. A. Rodgman, “The role of driver distraction in traffic crashes,” 2001. Available online: https://www.researchgate.net/publication/247981075_The_Role_of_Driver_Distraction_in_Traffic_Crashes (accessed on 15 February 2024).
- J.-S. Wang, R. R. Knipling, and M. J. Goodman, “The role of driver inattention in crashes: New statistics from the 1995 crashworthiness data system,” Assoc. Adv. Automot. Med., 1996. [CrossRef]
- S. P. Mcevoy, M. R. Stevenson, and M. Woodward, “The contribution of passengers versus mobile phone use to motor vehicle crashes resulting in hospital attendance by the driver,” Accid. Anal. Prev. 39, vol. 39, pp. 1170–1176, 2007. [CrossRef]
- A. S. Hasan, D. Patel, R. Alfaris, and M. Jalayer, “Identifying distracted-driving events from on-road observations using a moving vehicle: A case study in New Jersey,” Accid. Anal. Prev., vol. 177, no. January, p. 106827, 2022. [CrossRef]
- Stewart, “Overview of Motor Vehicle Crashes in 2020,” 2022. Available online: https://crashstats.nhtsa.dot.gov/Api/Public/Publication/813266 (accessed on 18 January 2024).
- M. Gjorgjievski, V. Khanna, B. Petrisor, C. S. Li, and B. Ristevski, “Roadside evaluation of distracted driving – Driver limitations in recognizing traffic light transitions ( REDD – LIGHT ),” vol. 21, no. June 2020, 2021. [CrossRef]
- S. Boets, “European Road Safety Observatory Road Safety Thematic Report – Driver distraction,” 2022. Available online: https://road-safety.transport.ec.europa.eu/document/download/662f244a-b3ad-442a-aa60-50f8437c86f2_en?filename=Road_Safety_Thematic_Report_Driver_Distraction_2022.pdf (accessed on 14 January 2024).
- W. Deng and R. Wu, “Real-Time Driver-Drowsiness Detection System Using Facial Features,” IEEE Access, vol. 7, pp. 118727–118738, 2019. [CrossRef]
- M. Ngxande, M. Burke, and J. Tapamo, “Driver drowsiness detection using Behavioral measures and machine learning techniques: A review of state-of-art techniques,” Pattern Recognit. Assoc. South Africa Robot. Mechatronics Int. Conf., 2017. [CrossRef]
- F. Prat, M. Planes, M. E. Gras, and M. J. M. Sullman, “An observational study of driving distractions on urban roads in Spain,” Accid. Anal. Prev., vol. 74, pp. 8–16, 2014. [CrossRef]
- G. Chen, L. Hong, J. Dong, and P. Liu, “EDDD: Event-Based Drowsiness Driving Detection Through Facial Motion Analysis With Neuromorphic Vision Sensor,” IEEE Sens. J., vol. 20, no. 11, pp. 6170–6181, 2020. [CrossRef]
- M. J. M. Sullman, “An observational study of driver distraction in England,” Transp. Res. Part F Psychol. Behav., vol. 15, no. 3, pp. 272–278, 2012. [CrossRef]
- Thomas A. Ranney, “Driver Distraction: A Review of the Current,” 2008. Available online: https://www.nhtsa.gov/sites/nhtsa.gov/files/810787_0.pdf (accessed on 22 February 2024).
- M. A. Regan and D. L. Strayer, “Towards an Understanding of Driver Inattention: Taxonomy and Theory,” Ann. Adv. Automot. Med., vol. 58, no. March 2014, pp. 5–14, 2014.
- M. Pettitt, G. Burnett, and A. Stevens, “Defining Driver Distraction,” World Congr. Intell. Transp. Syst., vol. 12, no. November, 2005. [CrossRef]
- V. Beanland, M. Fitzharris, K. L. Young, and M. G. Lenné, “Driver inattention and driver distraction in serious casualty crashes: Data from the Australian National Crash In-depth Study,” Accid. Anal. Prev., vol. 54, pp. 99–107, 2013. [CrossRef]
- K. L. Young and P. M. Salmon, “Examining the relationship between driver distraction and driving errors: A discussion of theory, studies and methods,” Saf. Sci., vol. 50, no. 2, pp. 165–174, 2012. [CrossRef]
- F. A. Drews, M. Pasupathi, and D. L. Strayer, “Passenger and Cell Phone Conversations in Simulated Driving,” J. Exp. Psychol. Appl., vol. 14, no. 4, pp. 392–400, 2008. [CrossRef]
- Y. Ishigami and R. M. Klein, “Is a hands-free phone safer than a handheld phone?,” J. Safety Res., vol. 40, no. 2, pp. 157–164, 2009. [CrossRef]
- W. Consiglio, P. Driscoll, M. Witte, and W. P. Berg, “Effect of cellular telephone conversations and other potential interference on reaction time in a braking response,” Accid. Anal. Prev., vol. 35, pp. 495–500, 2003. [CrossRef]
- J. K. Caird, C. R. Willness, P. Steel, and C. Scialfa, “A meta-analysis of the effects of cell phones on driver performance,” Accid. Anal. Prev., vol. 40, no. 4, pp. 1282–1293, 2008. [CrossRef]
- K. E. Beede and S. J. Kass, “Engrossed in conversation: The impact of cell phones on simulated driving performance,” Accid. Anal. Prev., vol. 38, no. 2, pp. 415–421, 2006. [CrossRef]
- M. E. Rakauskas, L. J. Gugerty, and N. J. Ward, “Effects of naturalistic cell phone conversations on driving performance,” J. Safety Res., vol. 35, no. 4, pp. 453–464, 2004. [CrossRef]
- M. F. Lesch and P. A. Hancock, “Driving performance during concurrent cell-phone use: Are drivers aware of their performance decrements?,” Accid. Anal. Prev., vol. 36, no. 3, pp. 471–480, 2004. [CrossRef]
- D. L. Strayer and F. A. Drews, “Profiles in driver distraction: Effects of cell phone conversations on younger and older drivers,” Hum. Factors, vol. 46, no. 4, pp. 640–649, 2004. [CrossRef]
- B. Donmez, L. N. Boyle, J. D. Lee, and I. City, “The Impact of Distraction Mitigation Strategies on Driving Performance,” Hum. Factors, vol. 48, no. 4, pp. 785–804, 2006. [CrossRef]
- T. L. Bunn, S. Slavova, T. W. Struttmann, and S. R. Browning, “Sleepiness / fatigue and distraction / inattention as factors for fatal versus nonfatal commercial motor vehicle driver injuries,” Accid. Anal. Prev., vol. 37, pp. 862–869, 2005. [CrossRef]
- P. A. Hancock, M. Lesch, and L. Simmons, “The distraction effects of phone use during a crucial driving maneuver,” Accid. Anal. Prev., vol. 35, pp. 501–514, 2003. [CrossRef]
- D. M. Neyens and L. N. Boyle, “The influence of driver distraction on the severity of injuries sustained by teenage drivers and their passengers,” Accid. Anal. Prev., vol. 40, pp. 254–259, 2008. [CrossRef]
- S. P. McEvoy, M. R. Stevenson, and M. Woodward, “The prevalence of, and factors associated with, serious crashes involving a distracting activity,” Accid. Anal. Prev., vol. 39, no. 3, pp. 475–482, 2007. [CrossRef]
- J. Hunton and J. M. Rose, “Cellular telephones and driving performance: The effects of attentional demands on motor vehicle crash risk,” Risk Anal., vol. 25, no. 4, pp. 855–866, 2005. [CrossRef]
- A. R. Mcgarva, M. Ramsey, and S. A. Shear, “Effects of driver cell-phone use on driver aggression,” J. Soc. Psychol., vol. 146, no. 2, pp. 133–146, 2006. [CrossRef]
- K. A. Braitman and A. L. Braitman, “Patterns of distracted driving behaviors among young adult drivers: Exploring relationships with personality variables,” Transp. Res. Part F Traffic Psychol. Behav., vol. 46, pp. 169–176, 2017. [CrossRef]
- V. Beanland, M. Fitzharris, K. L. Young, and M. G. Lenné, “Driver inattention and driver distraction in serious casualty crashes: Data from the Australian National Crash In-depth Study,” Accid. Anal. Prev., vol. 54, pp. 99–107, 2013. [CrossRef]
- T. A. Dingus et al., “Driver crash risk factors and prevalence evaluation using naturalistic driving data,” Proc. Natl. Acad. Sci. U. S. A., vol. 113, no. 10, pp. 2636–2641, 2016. [CrossRef]
- K. Kircher. “Driver distraction - A review of the literature (VTI rapport 594A),” VTI Rapp. 594A, p. 64, 2007. Available online: http://www.erskine-mcmahon.com/files/cell.phone.driving.distraction.article.10.pdf (accessed on 25 November 2023).
- R. Salamé, “Les sources de distraction au volant et leur dangerosité: Enquête auprès des membres de la communauté universitaire de l’Université Saint-Joseph de Beyrouth,” Rech. Transp. Secur., vol. 2015, no. 3–4, pp. 199–210, 2015. [CrossRef]
- I. M. Harms, M. Dicke, J. A. Rypkema, and K. A. Brookhuis, “Position paper. Verkeersveilig gebruik van smart devices én Smart Mobility Toegang tot Smart Mobility-diensten met aandacht voor het verkeer,” 2017. Available online: https://verkeersveiligheidscoalitie.nl/wp-content/uploads/2018/09/CommunitySP-HB_2017_Position-paper-Verkeersveilig-gebruik-van-Smart-Mob....pdf (accessed on 05 September 2023).
- A. Katharina, M. Schumacher, M. Mennecke, and M. Vollrath, “Systematic review of observational studies on secondary task engagement while driving,” Accid. Anal. Prev., vol. 119, no. July, pp. 225–236, 2018. [CrossRef]
- T. L. Overton, T. E. Rives, C. Hecht, S. Shafi, and R. Rajesh, “Distracted driving: prevalence, problems, and prevention,” Int. J. Inj. Contr. Saf. Promot., vol. 22, no. 3, pp. 187–192, 2015. [CrossRef]
- Carlos Pires, A. Areal, and J. Trigoso, “Distraction (mobile phone use). ESRA2 Thematic report Nr. 3. ESRA project (E-Survey of Road users’ Attitudes),” 2019. Available online: file:///C:/Users/flori/Downloads/esra2018thematicreportno3distraction(1).pdf (accessed on 12 February 2024).
- United Nations Economic Commission for Africa. Etude de cas sur la securite routiere au Cameroun. 2010. Available online: https://repository.uneca.org/bitstream/handle/10855/41496/Bib 47884.pdf?sequence=1&isAllowed=y (accessed on 18 February 2024).
- United Nations Economic Commission for Africa. Évaluation de la performance en matière de sécurité routière ( EPSR ). 2018. Available online: https://unece.org/fr/transport/publications/evaluation-de-la-performance-en-matiere-de-securite-routiere-epsr-cameroun (accessed on 18 January 2024).
- T. A. Dingus, “Estimates of Prevalence and Risk Associated with Inattention and Distraction Based Upon In Situ Naturalistic Data,” Ann. Adv. Automot. Med., vol. 58, no. March 2014, pp. 60–68, 2014.
- A. T. Mccartt et al., “Cell Phones and Driving: Review of Research,” Traffic Inj. Prev., vol. 7, no. 2, pp. 89–106, 2007. [CrossRef]
- B. Olsson, H. Pütz, F. Reitzug, and D. K. Humphreys, “Evaluating the impact of penalising the use of mobile phones while driving on road traffic fatalities, serious injuries and mobile phone use: a systematic review,” Inj. Prev., pp. 1–8, 2020. [CrossRef]
- S. Kończak, “Handhaving van het verbod op handheld telefoongebruik Ongevallen voorkomen Letsel beperken Levens redden,” 2020. Available online: https://swov.nl/nl/publicatie/handhaving-van-het-verbod-op-handheld-telefoongebruik (accessed on 18 February 2024).
- Vlakveld, “Maatregelen tegen afleiding bij automobilisten Ongevallen voorkomen Letsel beperken Levens redden,” 2018. Available online: https://swov.nl/nl/publicatie/maatregelen-tegen-afleiding-bij-automobilisten (accessed on 18 February 2024).
- Kaiser S and A. Breuss, “Effectiveness of Road Safety Campaigns, European Road Safety Decision Support System, developed by the H2020 project SafetyCube,” 2017. Available online: https://www.roadsafety-dss.eu/assets/data/pdf/synopses/Effectiveness_of_Road_Safety_Campaigns_26072017.pdf (accessed on 08 January 2024).
- Y. Huang, D. Zohar, M. M. Robertson, A. Garabet, J. Lee, and L. A. Murphy, “Development and validation of safety climate scales for lone workers using truck drivers as exemplar,” Transp. Res. Part F Psychol. Behav., vol. 17, pp. 5–19, 2013. [CrossRef]
- Weekley, “Minimising distraction from roadside advertising Recommendations for road authorities CEDR Call 2016: Safety,” 2019. Available online: https://www.cedr-adverts.eu/storage/minisites/d2-1-adverts-recommendations-final.pdf (accessed on 18 February 2024).
- Vlakveld, “Veiligheidseffecten van rijtaakondersteunende systemen” 2019. Available online: https://swov.nl/nl/publicatie/veiligheidseffecten-van-rijtaakondersteunende-systemen (accessed on 18 February 2024).
- J. B. Claveria, S. Hernandez, J. C. Anderson, and E. L. Jessup, “Understanding truck driver behavior with respect to cell phone use and vehicle operation,” Transp. Res. Part F Psychol. Behav., vol. 65, pp. 389–401, 2019. [CrossRef]
- T. A. Dingus, F. Guo, S. Lee, J. F. Antin, M. Perez, and M. Buchanan-king, “Driver crash risk factors and prevalence evaluation using naturalistic driving data,” Proc. Natl. Acad. Sci. U. S. A., vol. 113, no. 10, pp. 2636–2641, 2016. [CrossRef]
- A. S. Hasan, M. Jalayer, E. Heitmann, and J. Weiss, “Distracted Driving Crashes: A Review on Data Collection, Analysis, and Crash Prevention Methods,” Transp. Res. Rec., vol. 2676, no. 8, pp. 423–434, 2022. [CrossRef]
- M. Asbridge, J. R. Brubacher, and H. Chan, “Cell phone use and traffic crash risk: a culpability analysis,” Int. J. Epidemiol., vol. 42, no. November 2012, pp. 259–267, 2013. [CrossRef]
- I. J. Reagan and J. B. Cicchino, “Do Not Disturb While Driving – Use of cellphone blockers among adult drivers,” Saf. Sci., vol. 128, no. March, p. 104753, 2020. [CrossRef]
- B. R. K. Shevlin and K. A. Goodwin, “Past behavior and the decision to text while driving among young adults,” Transp. Res. Part F Traffic Psychol. Behav., vol. 60, pp. 58–67, 2019. [CrossRef]
- J. K. Engelberg, L. L. Hill, J. Rybar, and T. Styer, “Distracted driving behaviors related to cell phone use among middle-aged adults,” J. Transp. Heal., vol. 2, no. 3, pp. 434–440, 2015. [CrossRef]
- J. Stutts et al., “Driver’s exposure to distractions in their natural driving environment,” Accid. Anal. Prev., vol. 37, no. 6, pp. 1093–1101, 2005. [CrossRef]
- C. Huisingh, R. Griffin, and T. Science, “The prevalence of distraction among passenger vehicle drivers: a roadside observational approach,” Traffic Inj. Prev., vol. 16, no. 2, pp. 140–146, 2016. [CrossRef]
- M. Vollrath, A. K. Huemer, C. Teller, A. Likhacheva, and J. Fricke, “Do German drivers use their smartphones safely?—Not really!,” Accid. Anal. Prev., vol. 96, pp. 29–38, 2016. [CrossRef]
- M. B. Johnson, R. B. Voas, J. H. Lacey, A. S. McKnight, and J. E. Lange, “Living Dangerously: Driver Distraction at High Speed,” Traffic Inj. Prev., vol. 5, no. 1, pp. 1–7, 2004. [CrossRef]
- F. Sagberg, O. J. Johansson, and H. B. Sundfør, “Combining roadside interviews and on-road observation for assessing prevalence of driver inattention,” Transp. Res. Part F Traffic Psychol. Behav., vol. 62, pp. 305–315, 2019. [CrossRef]
- European Commission, “Baseline Policy Report. Conclusions and recommendations,” 2023. Available online: https://www.baseline.vias.be/storage/minisites/baseline-policy-report-digital-1.pdf (accessed on 14 February 2024).
- S. Boets, N. Wardenier, N. Moreau, and M. De Roeck, “Deuxième mesure nationale de comportement « distraction au volant »,” 2023. Available online: https://www.vias.be/publications/2de nationale gedragsmeting afleiding tijdens het rijden/2eme_mesure_de_comportement_distraction_au_volant.pdf (accessed on 05 September 2023).
- E. E. Tuekam-Bopda, J. G. Tamba, and A. Fopah-Lele, “Impacts of mobile phone use while driving on the performance of petroleum product drivers in Cameroon,” Transp. Saf. Environ., vol. 5, no. 2, pp. 1–10, 2023. [CrossRef]
- O. M. Arrey and A. N. Ndifontiayong, “Prevalence and Risk Factors Associated with Road Traffic Crash among Bus Drivers in the Southern Region of Cameroon: A Cross Sectional Study,” Austin J. Public Heal. Epidemiol., vol. 10, no. 3, 2023.
- N. Padison and O. Tiafack, “Atmosphere of Accidents along the Douala-Yaounde National Road in Cameroon: Hoofmarks, Drivers, Challenges and Proactive Options,” J. Transp. Technol., vol. 12, no. 03, pp. 323–345, 2022. [CrossRef]
- A. Katharina, M. Schumacher, M. Mennecke, and M. Vollrath, “Systematic review of observational studies on secondary task engagement while driving,” Accid. Anal. Prev., vol. 119, no. May, pp. 225–236, 2018. [CrossRef]
- General Delegation for National Security. “Usage du téléphone au volant comme deuxième principale cause d’accidents de la circulation,” 2020.
- Bachmann et al., “Plan de Mobilité Urbaine Soutenable pour la Communauté Urbaine Rapport de de Yaoundé synthèse,” 2019. Available online: https://www.mobiliseyourcity.net/sites/default/files/2020-01/PMUS Yaoundé-Septembre 2019.pdf (accessed on 5 February 2024).
- S. Boets, M. Schumacher, and S. Agnieszka, “Methodological guidelines – KPI Distraction,” 2021. Available online: https://baseline.vias.be/storage/minisites/baseline-kpi-distraction.pdf.
- M. Vollrath, M. Schumacher, Boets, and Meesmann, “Guidelines for assessing the prevalence of mobile phone use in traffic,” 2019. Available online: https://fersi.org/wp-content/uploads/2019/11/Guidelines-prevalence-mobile-phone-use.pdf (accessed on 11 September 2023).
- A. Hazra, “Using the confidence interval confidently,” J. Thorac. Diseas, vol. 9, no. 10, pp. 4125–4130, 2017. [CrossRef]
- P. Binda and K. Muronga, “Distracted driver behaviour in south african townships: a roadside observation study,” in 38th Annual Southern African Transport Conference 2019, 2019. Available online: https://repository.up.ac.za/handle/2263/74254 (accessed on 18 February 2024).
- P. Silverans and S. Boets, “Considerations for sampling weights in Baseline,” 2021. Available online: https://baseline.vias.be/storage/minisites/baseline-considerations-for-sampling-weights.pdf (accessed on 18 September 2023).
- Y. M. Kuete, “Framing the change: Analysing employment change, (in) adequacy, and (de) feminization in Cameroon’s tertiary firms,” United Nations Univ. World Inst. Dev. Econ. Res., no. August, 2023. [CrossRef]
- Boets, “Baseline report on the KPI Distraction,” 2023. Available online: https://baseline.vias.be/storage/minisites/baseline-kpi-distraction.pdf (accessed on 18 September 2023).

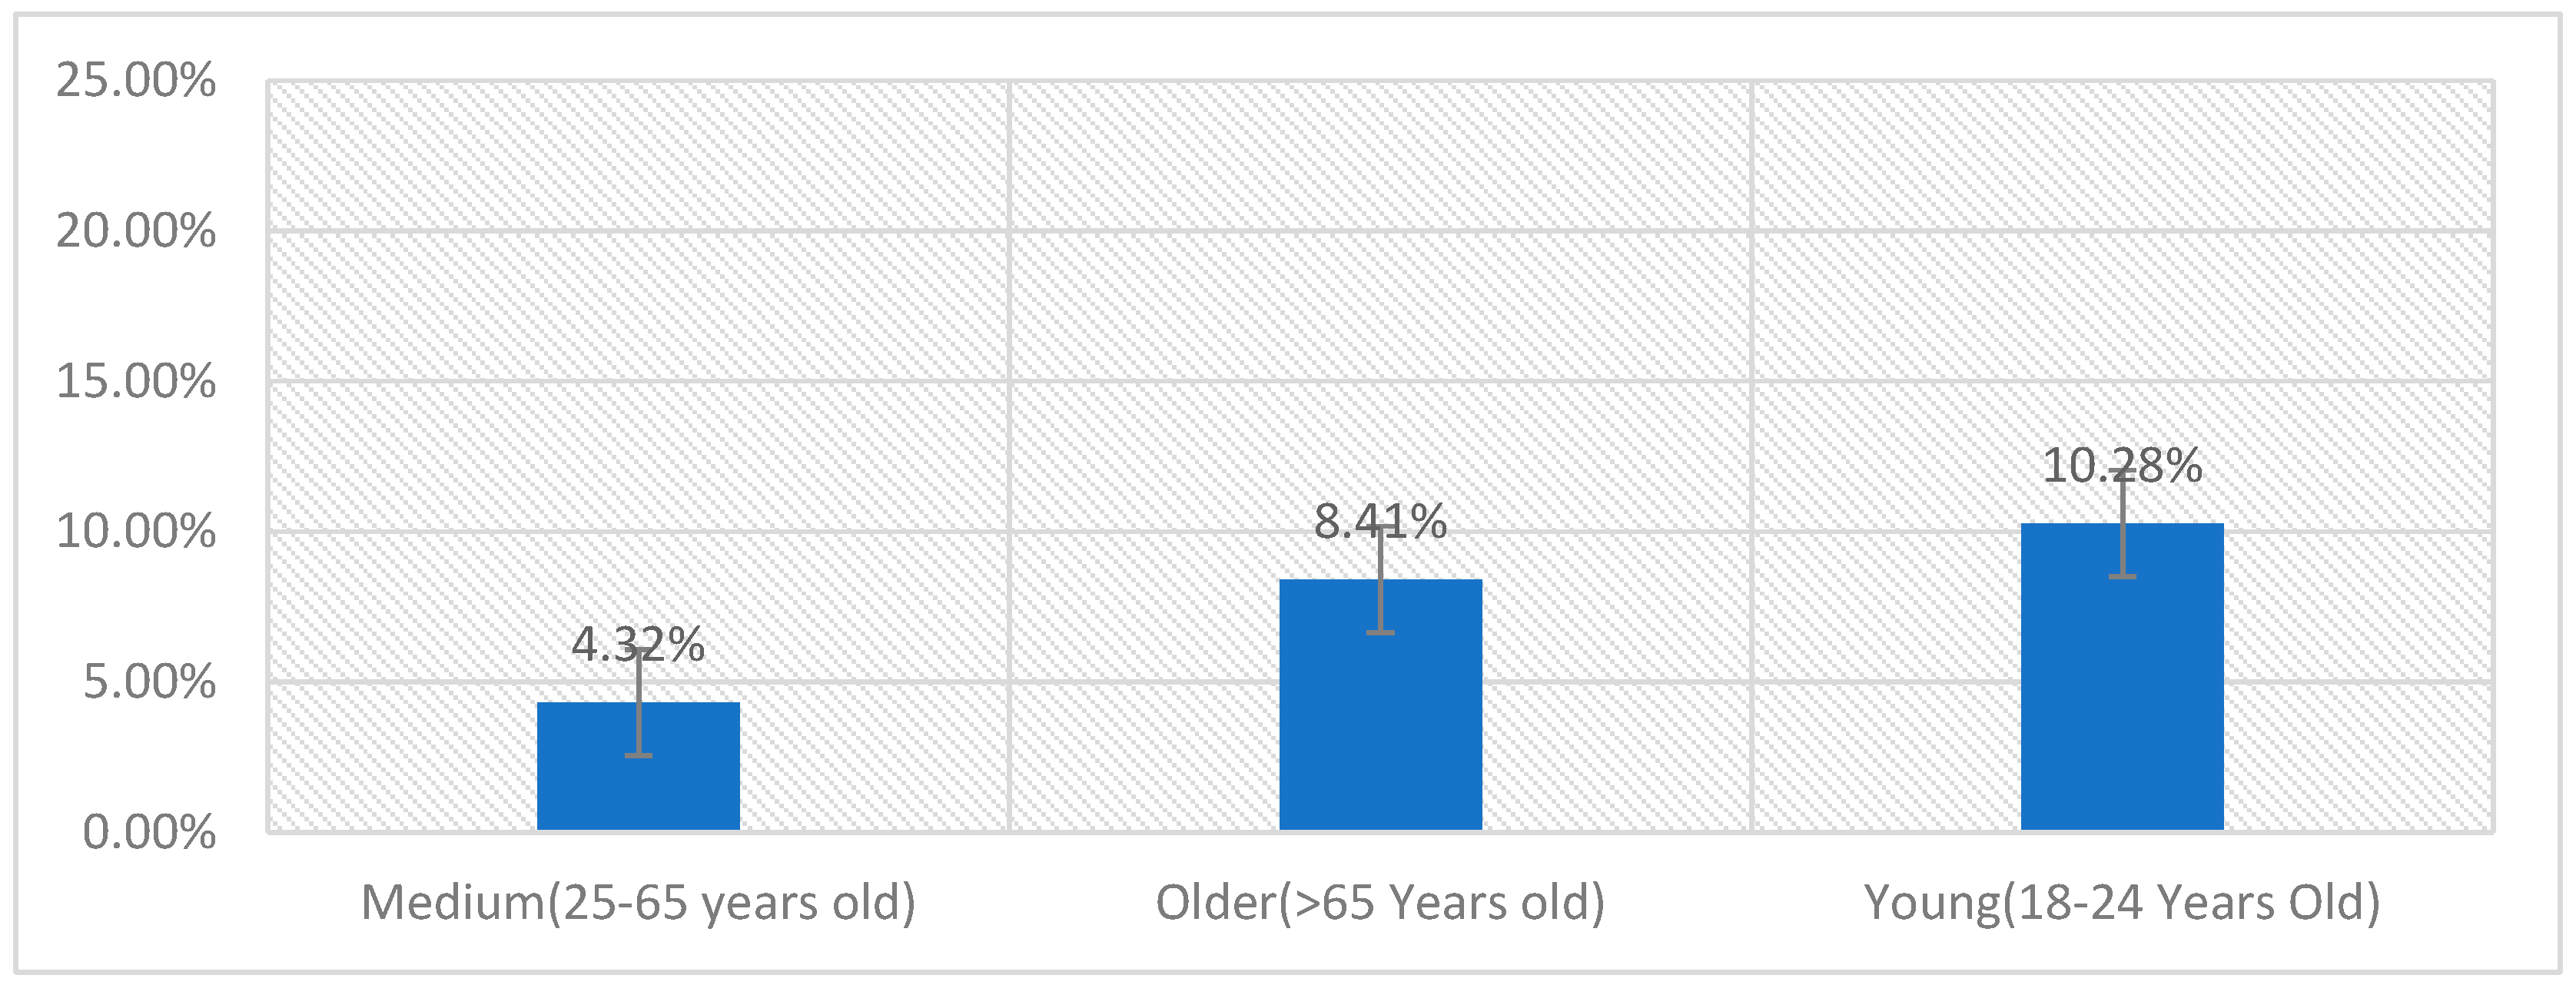
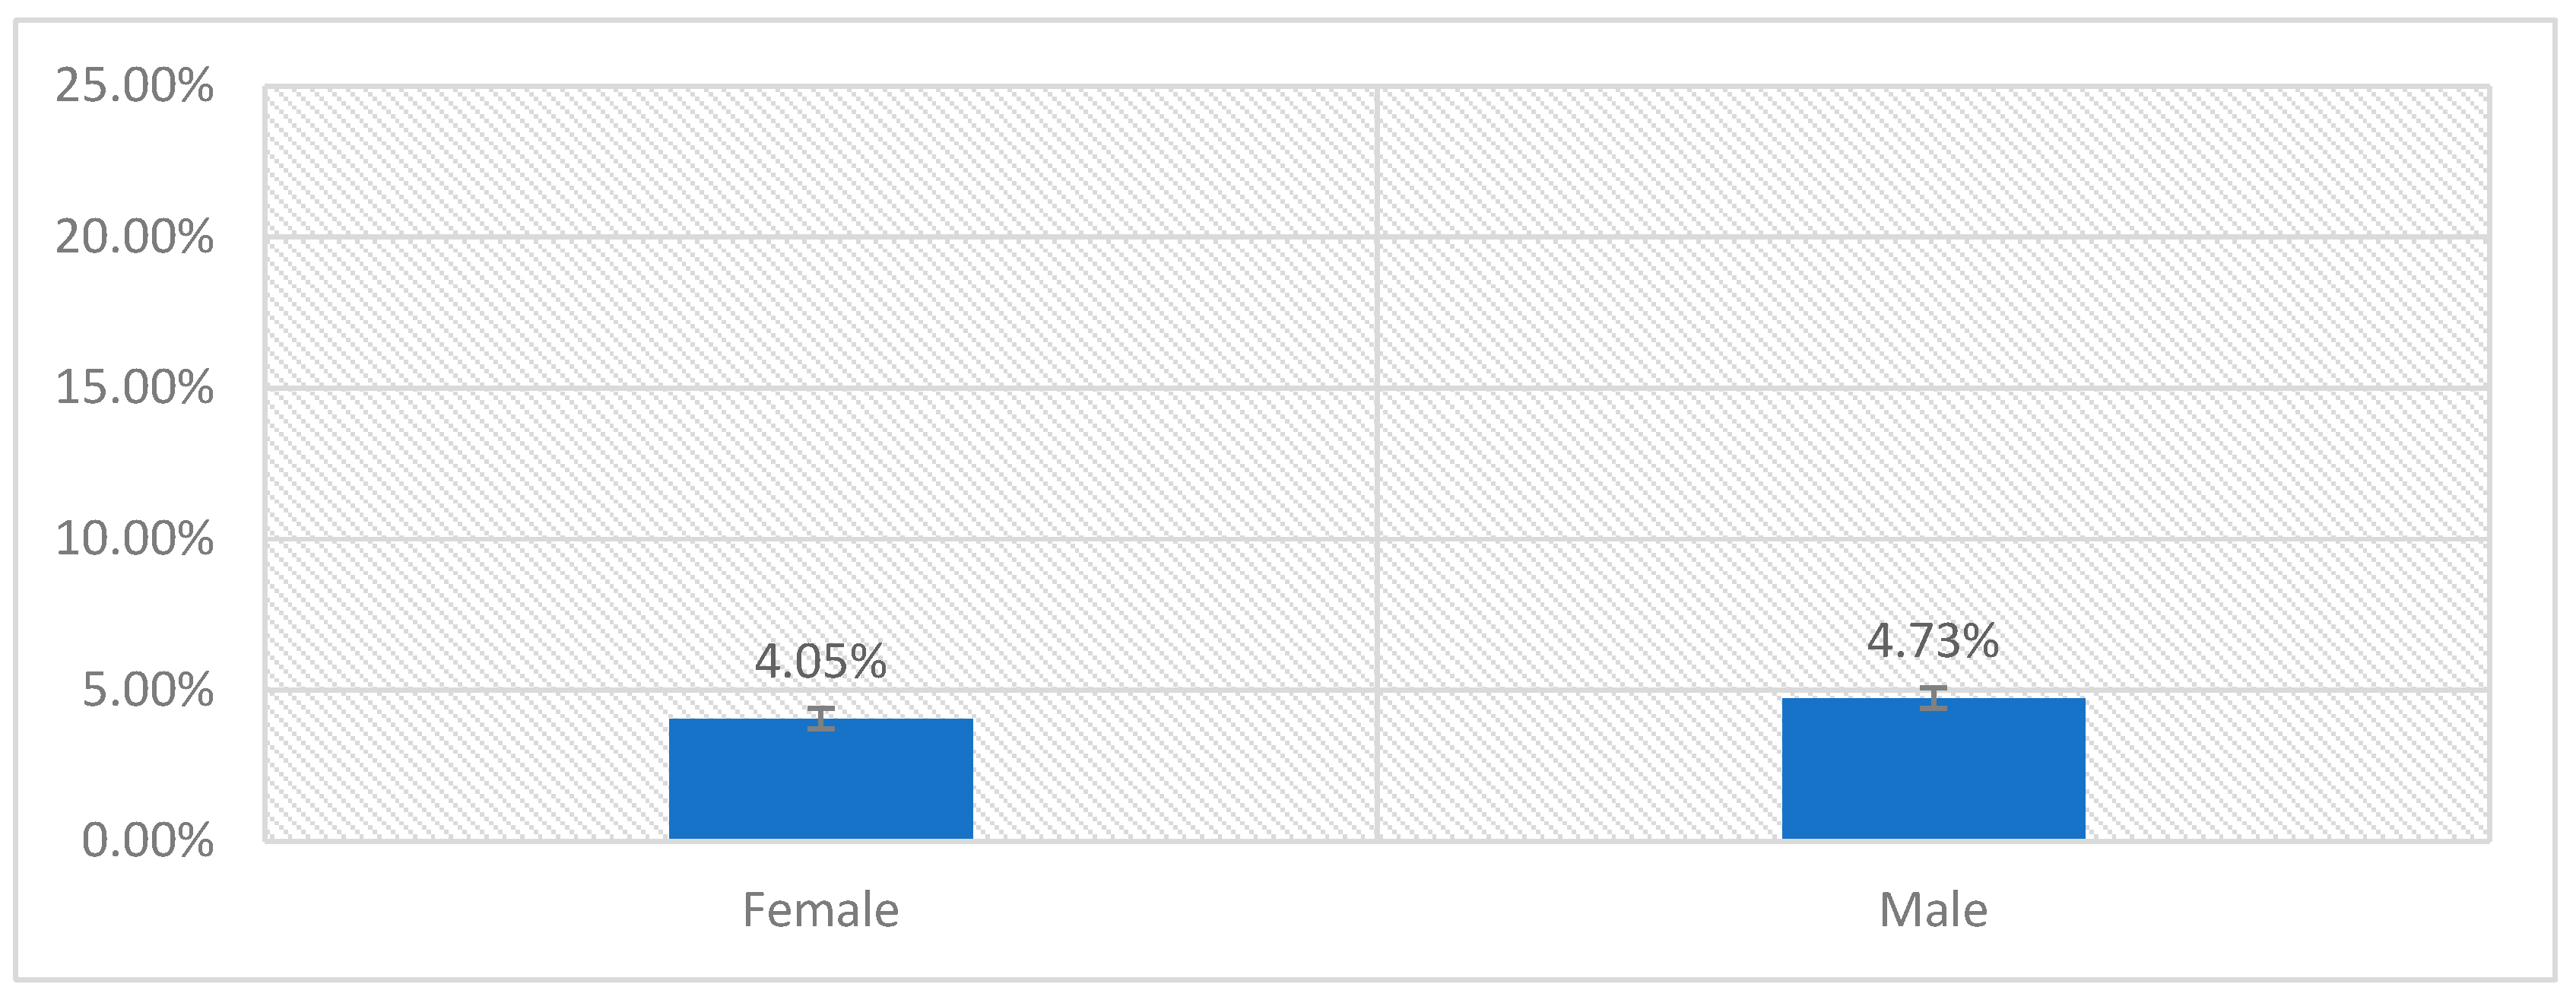
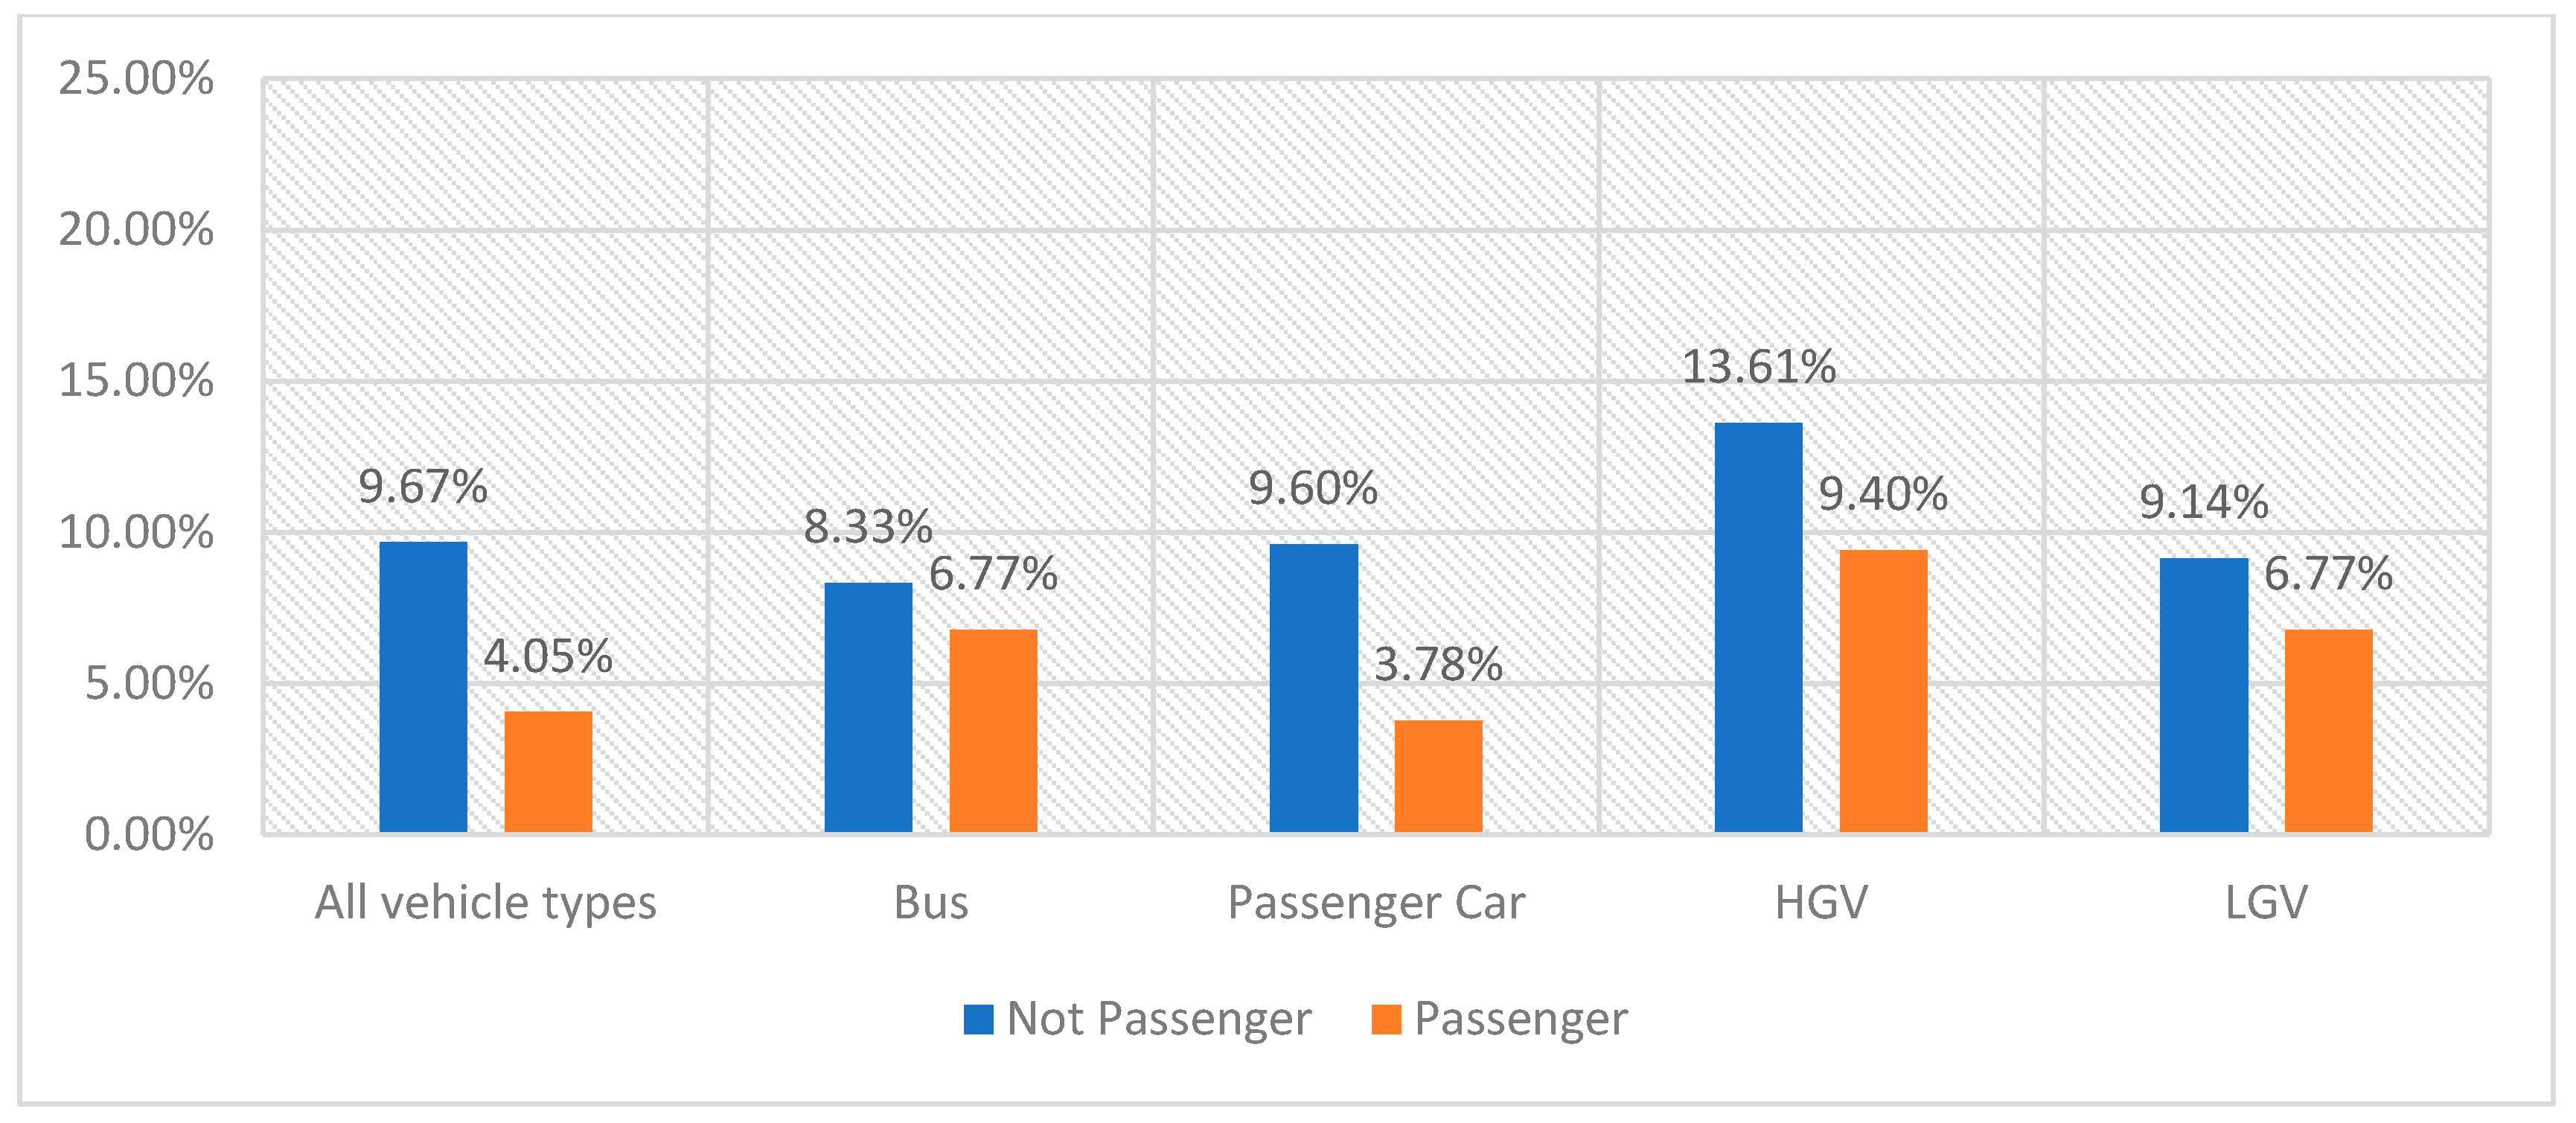
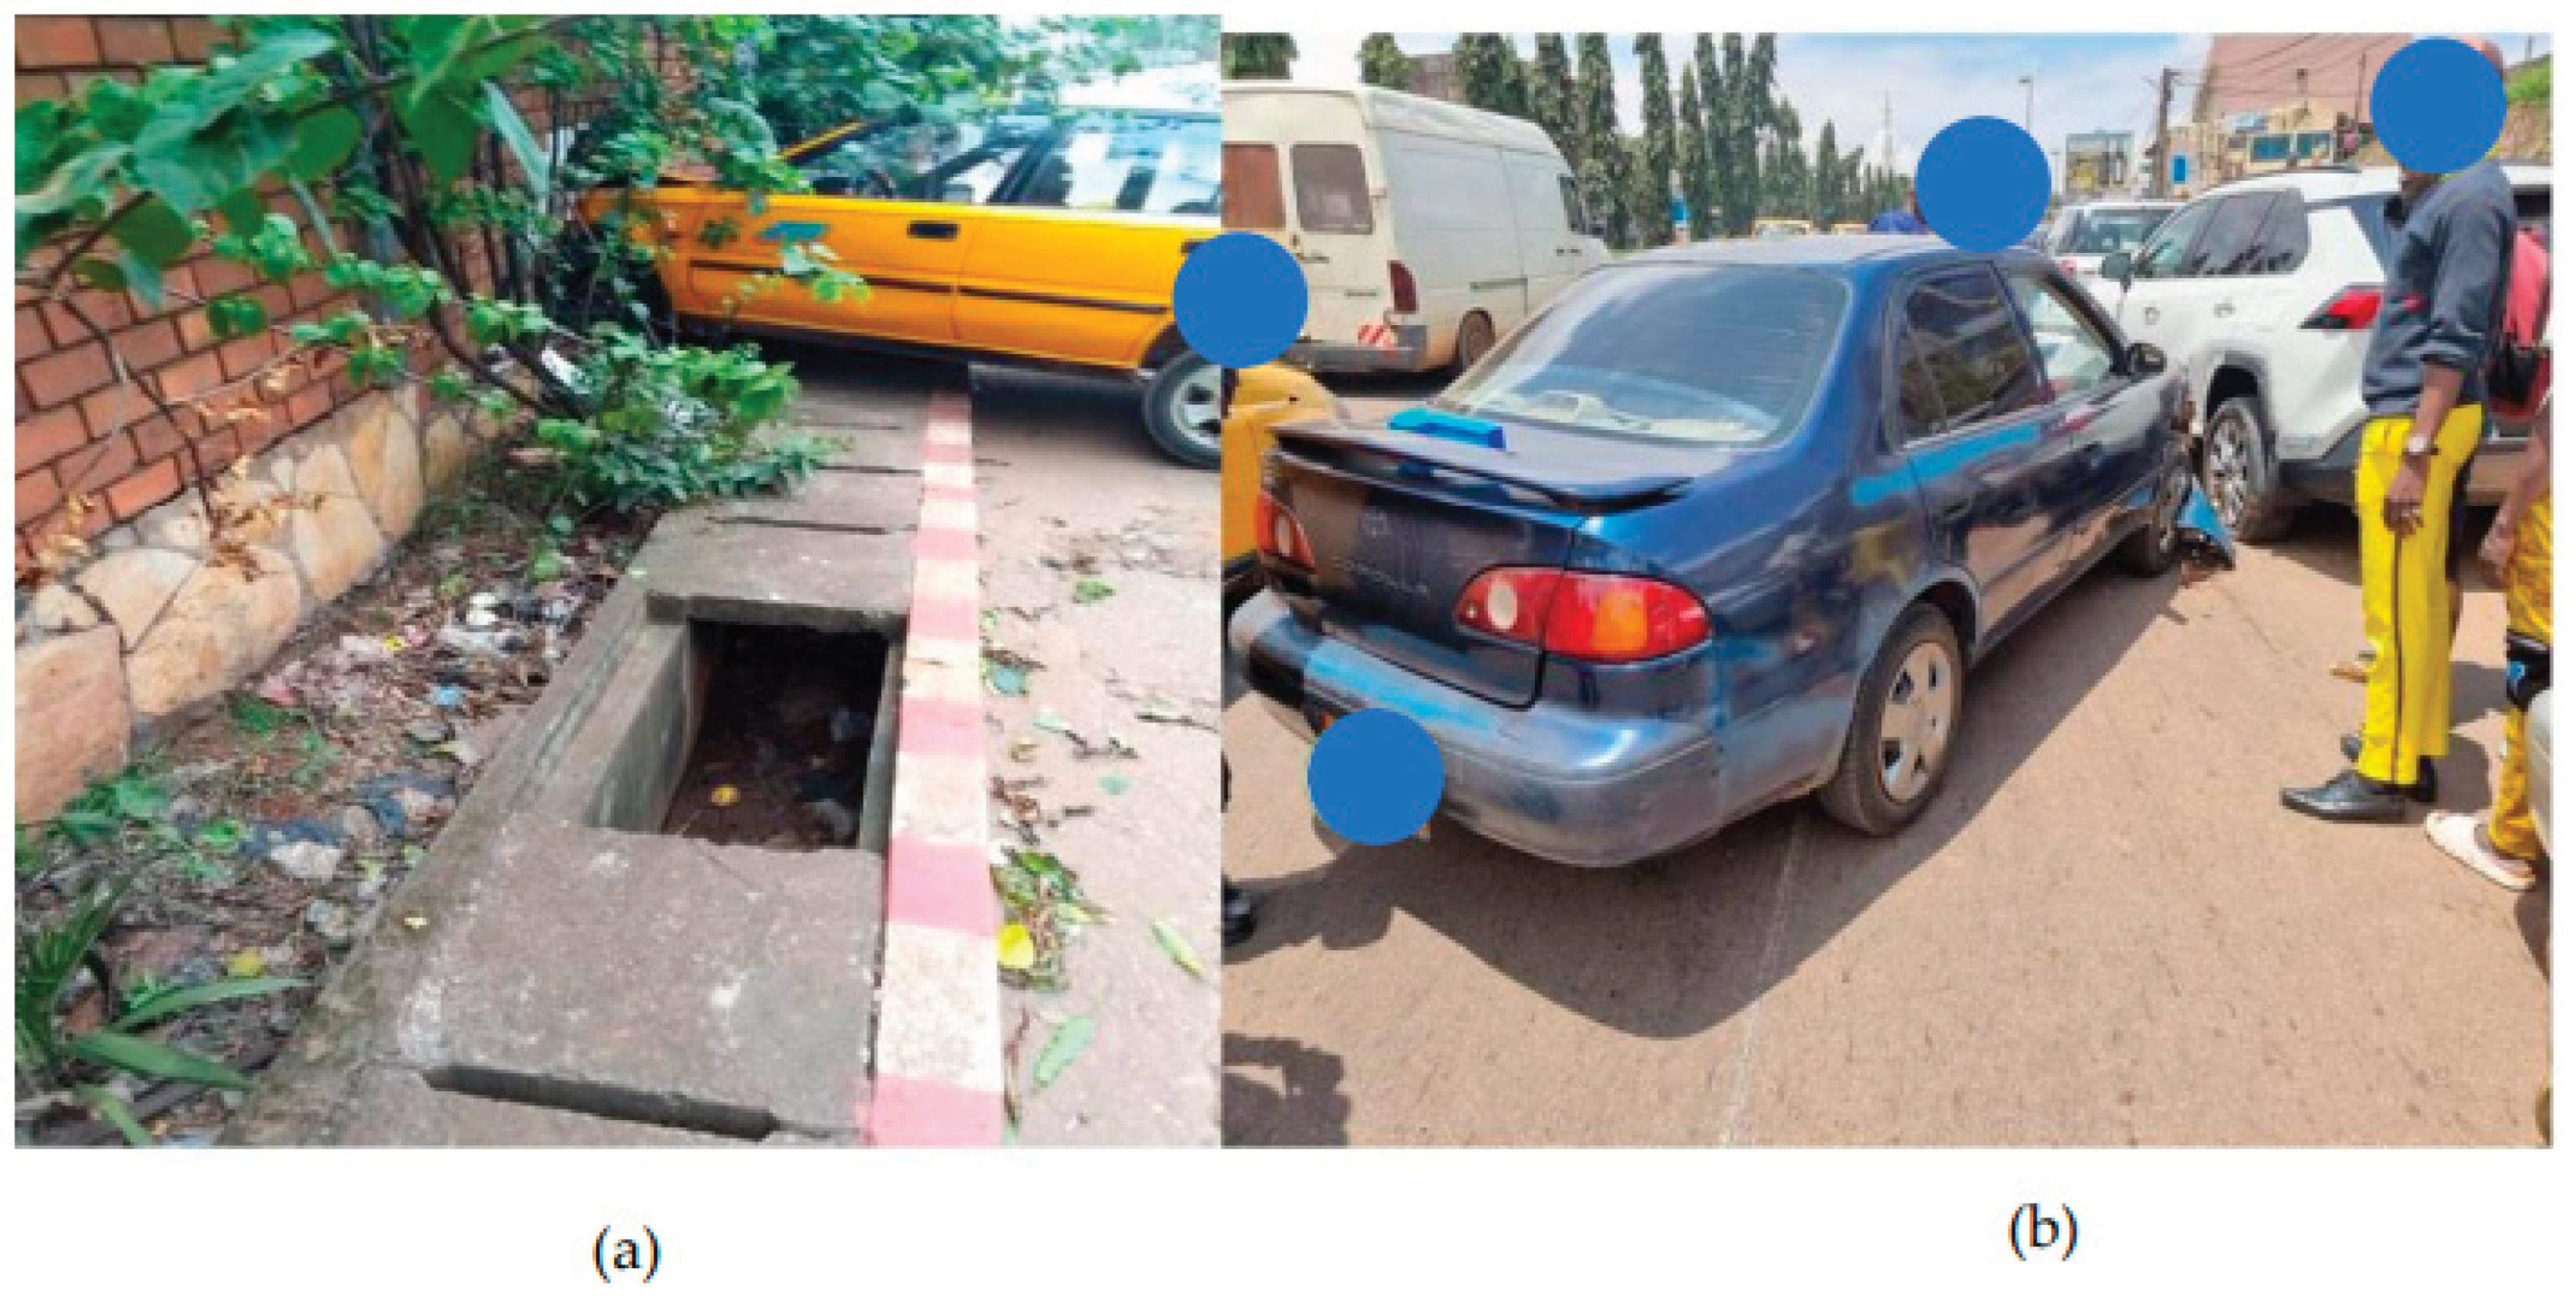
| Variables of interest | Additional information |
|---|---|
| Distraction type | |
| Type 1: Using a handheld mobile device (mainly smartphone) | |
| Handheld phoning: the driver is visibly holding a mobile phone in the hand and is pressing it at his/her ear or is holding it in front of the mouth. He/she is either talking or listening. | |
| Texting/keying numbers handheld (mobile phone): the driver is visibly holding a mobile phone in the hand and is operating it (typing, changing sim card, etc.). | |
| Handheld reading/watching without operating (mobile phone): the driver is visibly holding a mobile phone in the hand and is looking at the phone without operating or handling it (watching or reading) | |
| Any combination of the above situations | |
| Type 2: Interaction with passengers | |
| Talking to the passenger. | |
| Communicating with the passenger by gesticulating or making body movements. | |
| Looking at the passenger. | |
| Any combination of the above situations | |
| Type 3: Eating/smoking/drinking | |
| The driver is considered distracted if he is eating, drinking water or any other beverage or smoking. | |
| Vehicle types (relevant vehicles) | |
| Passenger cars: Tourism vehicles | |
| Light goods vehicles (LGV; often from companies): utility vehicle, van | |
| Heavy goods vehicles (HGV): Trucks, special machinery, semi-trailers, road tractors, agricultural machinery, public works machinery | |
| Buses/coaches: Minibus (less than 20 seats), Buses (more than 20 seats) | |
| Driver characteristics | |
| Gender of the driver (Male, female) | |
| Estimated driver age category: young (18-24 years), medium (25 to 65 years), older (> 65 years) | |
| Presence of passenger (yes/no) | |
| Road and environmental features | |
| Road type: Primary, secondary, tertiary | |
| Road condition: Good, average, bad (visually checked) | |
| Number of lanes | |
| Speed limit | |
| Weather condition: sun, rain, in between |
| All vehicles | % | Bus | % | Passenger Car | % | HGV | % | LGV | % | ||
|---|---|---|---|---|---|---|---|---|---|---|---|
| Councils | Yaoundé I | 12 059 | 29,40 | 289 | 43,60 | 11 139 | 29,10 | 367 | 37,60 | 264 | 23,70 |
| Yaoundé II | 1 615 | 3,90 | 17 | 2,60 | 1 574 | 4,10 | 14 | 1,40 | 10 | 0,9 | |
| Yaoundé III | 8 924 | 21,80 | 132 | 19,90 | 8 389 | 21,90 | 135 | 13,80 | 268 | 24 | |
| Yaoundé IV | 10 544 | 25,70 | 164 | 24,70 | 9 741 | 25,50 | 333 | 34,10 | 306 | 27,40 | |
| Yaoundé V | 2 981 | 7,30 | 23 | 3,50 | 2 903 | 7,60 | 26 | 2,70 | 29 | 2,60 | |
| Yaoundé VI | 3 234 | 7,90 | 30 | 4,50 | 3 097 | 8,10 | 48 | 4,90 | 59 | 5,30 | |
| Yaoundé VII | 1 647 | 4 | 8 | 1,2 | 1 405 | 3,70 | 54 | 5,50 | 180 | 16,10 | |
| Principal | 22 514 | 54,90 | 436 | 65,80 | 20 741 | 54,20 | 668 | 68,40 | 669 | 60 | |
| Road type | Secondary | 16 403 | 40 | 209 | 31,50 | 15 521 | 40,60 | 277 | 28,40 | 396 | 35,50 |
| Tertiary | 2 087 | 5,10 | 18 | 2,70 | 1 986 | 5,20 | 32 | 3,30 | 51 | 4.5 | |
| Time period | Off peak hour | 17 576 | 42,90 | 286 | 43,10 | 16 298 | 42,60 | 441 | 45,10 | 551 | 49,40 |
| Peak hour | 23 428 | 57,10 | 377 | 56,90 | 21 950 | 57,40 | 536 | 54,70 | 565 | 50,60 | |
| Passanger presence | No passenger | 6 175 | 15,05 | 72 | 10,86 | 5 770 | 15,08 | 147 | 15,05 | 186 | 16,58 |
| Passenger | 34 829 | 84,95 | 591 | 89,14 | 32 478 | 84,91 | 830 | 84,95 | 930 | 83,33 | |
| Age group | Medium | 39 679 | 96.76 | 648 | 97.73 | 36 958 | 96.63 | 963 | 98.57 | 1 110 | 99.46 |
| Older | 203 | 0,50 | 7 | 1, | 191 | 0,50 | 4 | 0,41 | 1 | 0,09 | |
| Young | 1 122 | 2,74 | 8 | 1,21 | 1 099 | 2,87 | 10 | 1,02 | 5 | 0,45 | |
| Gender | Female | 3 836 | 9,36 | 42 | 6,33 | 3 733 | 9,76 | 35 | 3,58 | 26 | 2,33 |
| Male | 37 168 | 90,64 | 621 | 93,67 | 34 515 | 90,24 | 942 | 96,42 | 1 090 | 97,67 | |
| TOTAL | 41 004 | 100 | 663 | 38 248 | 977 | 1 116 |
| Distraction: interaction between drivers and passengers | ||||||
|---|---|---|---|---|---|---|
| All vehicle types | Bus | Passenger Car | HGV | LGV | ||
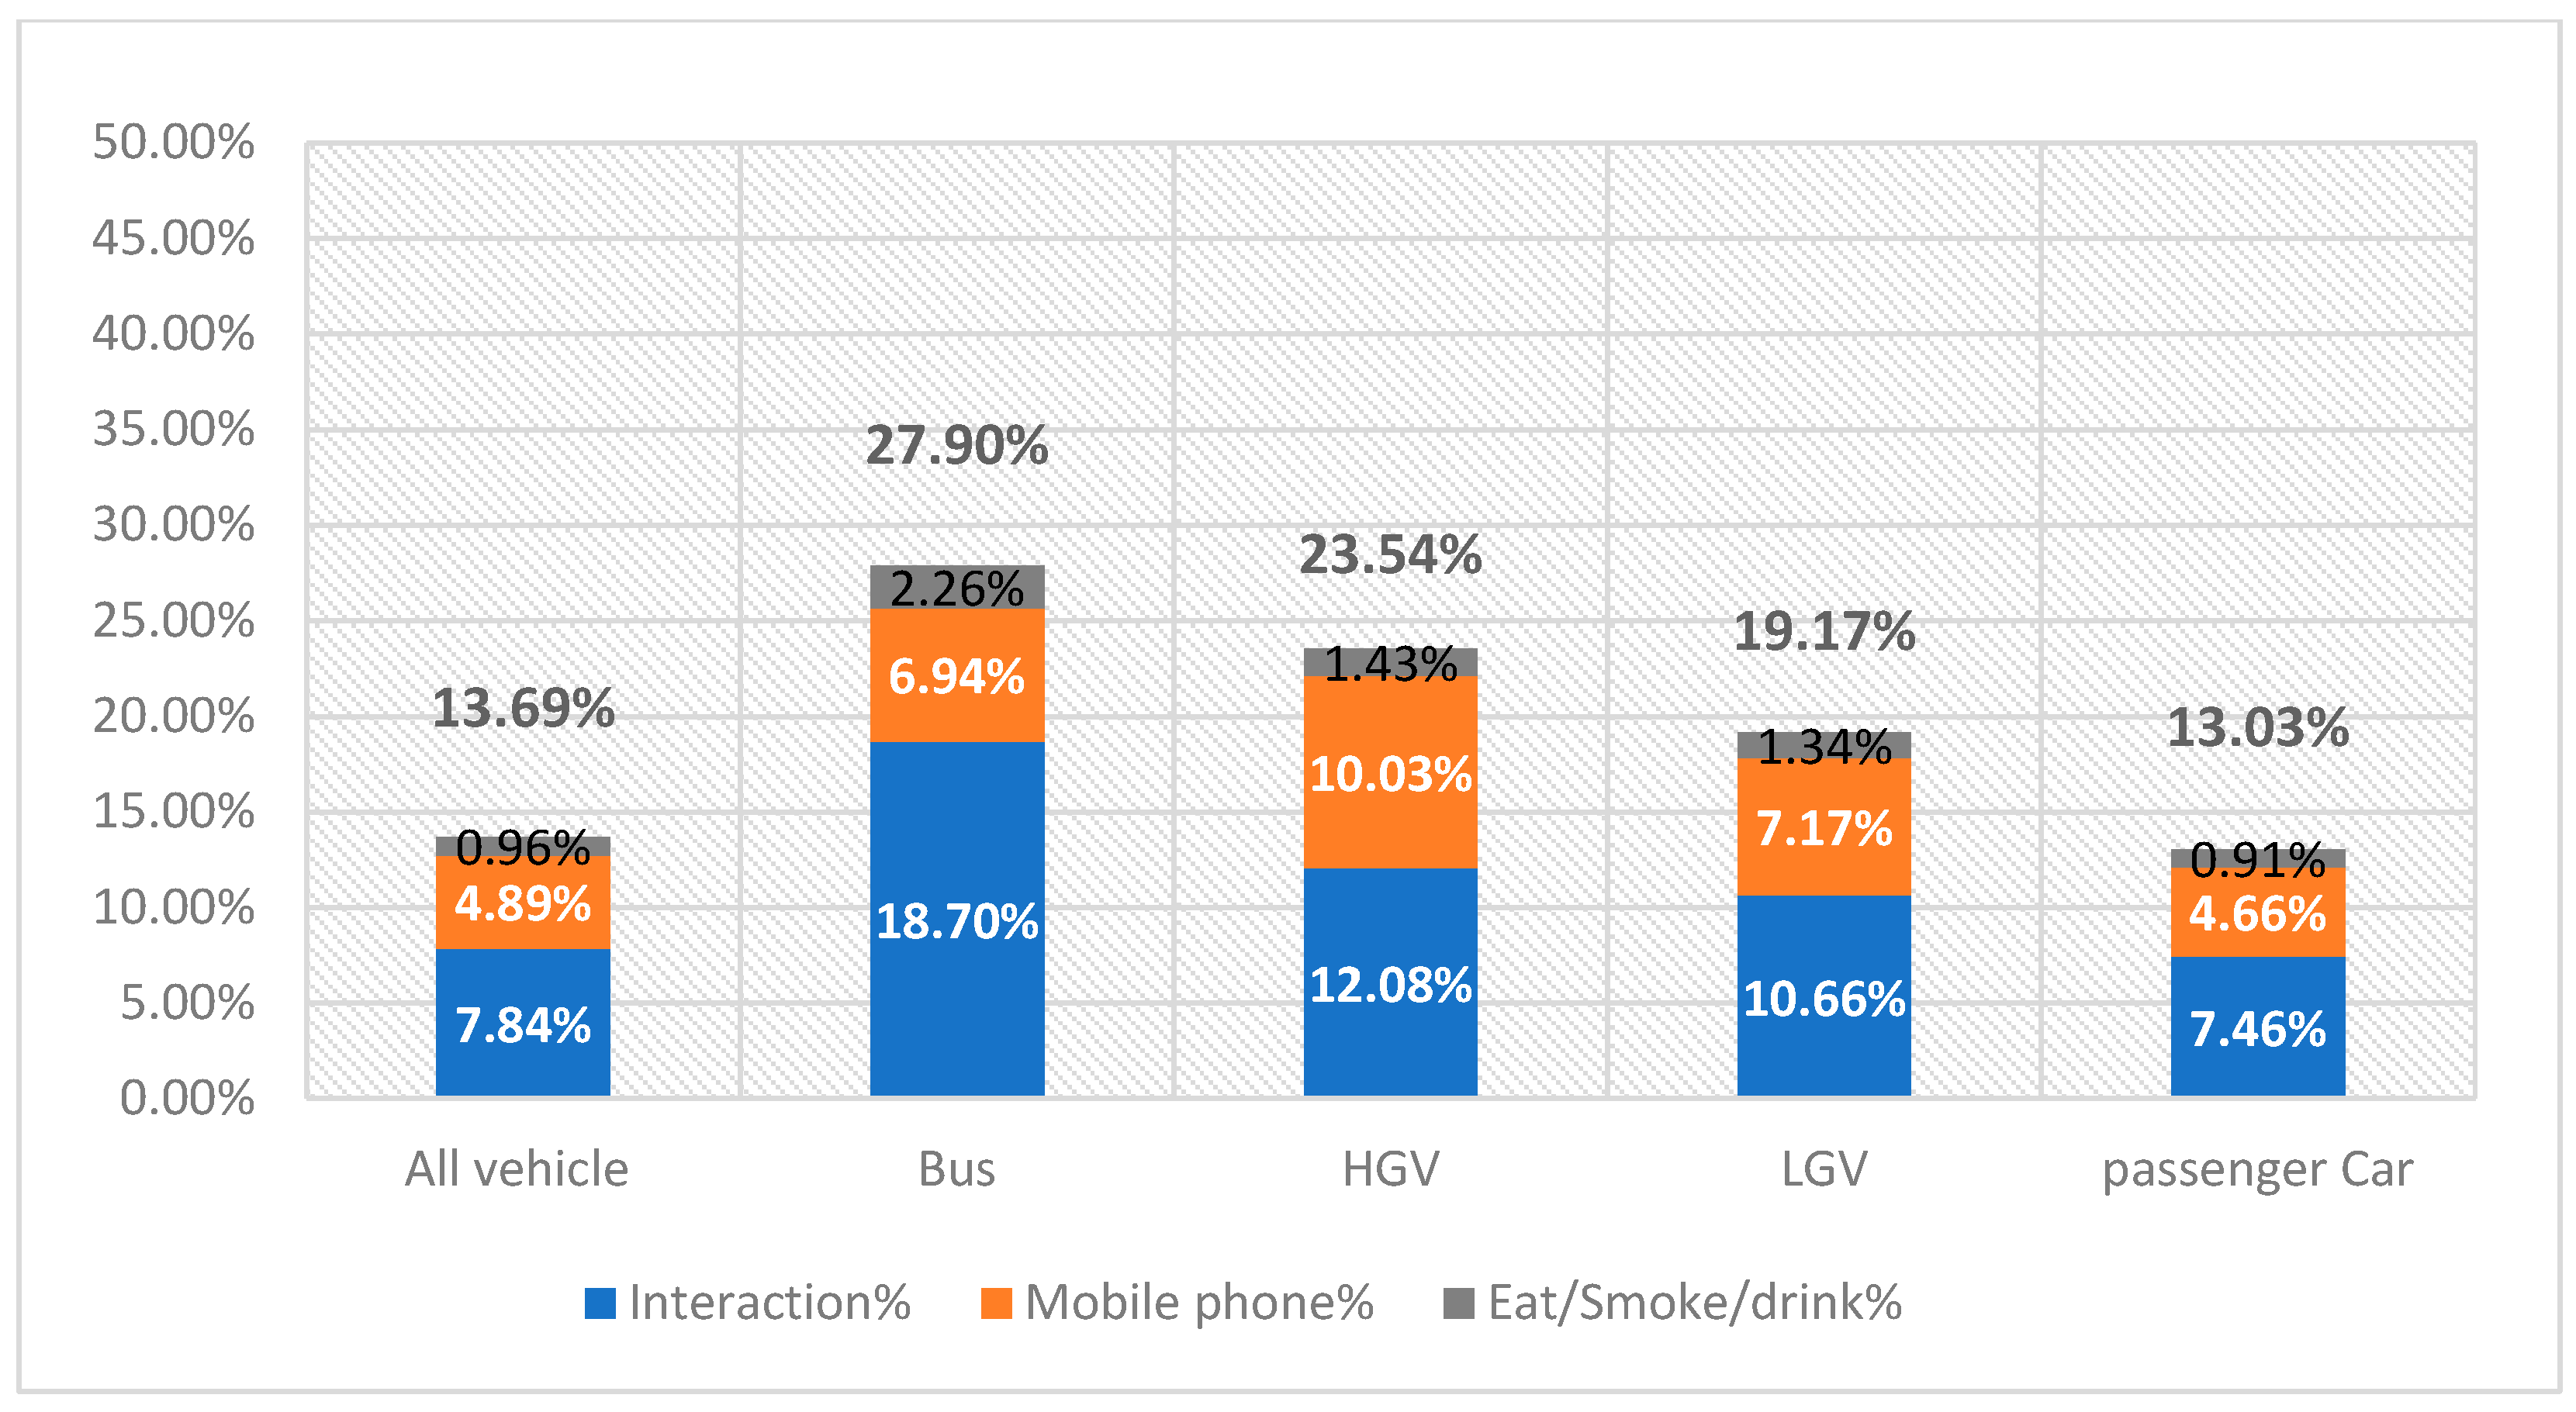
| Yaoundé | 7,84% | 18,70% | 7,46% | 12,08% | 10,66% | |
| Councils | Yaoundé I | 7,58% | 11,42% | 7,18% | 10,35% | 16,29% |
| Yaoundé II | 7,55% | 17,65% | 7,31% | 21,43% | 10,00% | |
| Yaoundé III | 7,31% | 18,94% | 7,22% | 5,93% | 4,85% | |
| Yaoundé IV | 8,78% | 29,88% | 8,09% | 13,21% | 14,71% | |
| Yaoundé V | 5,97% | 13,04% | 5,89% | 11,54% | 3,45% | |
| Yaoundé VI | 8,01% | 16,67% | 7,39% | 35,42% | 13,56% | |
| Yaoundé VII | 9,90% | 87,50% | 10,18% | 9,26% | 4,44% | |
| Road type | Principal | 8,32% | 19,72% | 7,73% | 13,32% | 14,35% |
| Secondary | 7,23% | 18,18% | 7,09% | 10,11% | 5,05% | |
| Tertiary | 7,38% | 5,56% | 7,50% | 3,13% | 5,88% | |
| Time period | Off peak hour | 7,45% | 21,68% | 7,01% | 12,70% | 8,89% |
| Peak hour | 8,13% | 16,71% | 7,79% | 11,57% | 12,39% | |
| Passenger presence | Not passenger | 0,00% | 0,00% | 0,00% | 0,00% | 0,00% |
| Passenger | 7,84% | 18,70% | 7,46% | 12,08% | 10,66% | |
| Age group | Medium | 7,41% | 17,75% | 7,04% | 11,32% | 10,18% |
| Older | 58,62% | 71,43% | 57,07% | 100,00% | 100,00% | |
| Young | 13,90% | 62,50% | 12,83% | 50,00% | 100,00% | |
| Gender | Female | 5,40% | 0,00% | 5,52% | 2,86% | 0,00% |
| Male | 8,09% | 20,13% | 7,67% | 12,42% | 10,92% | |
| Distraction: eating, smoking, or drinking | ||||||
|---|---|---|---|---|---|---|
| All vehicle types | Bus | Passenger Car | HGV | LGV | ||
| Yaoundé | 0,96% | 2,26% | 0,91% | 1,43% | 1,34% | |
| Councils | Yaoundé I | 0,80% | 1,39% | 0,78% | 1,63% | 0,00% |
| Yaoundé II | 1,24% | 0,00% | 1,27% | 0,00% | 0,00% | |
| Yaoundé III | 1,08% | 2,27% | 1,05% | 1,48% | 1,12% | |
| Yaoundé IV | 1,06% | 3,05% | 0,98% | 1,80% | 1,96% | |
| Yaoundé V | 1,11% | 17,39% | 0,93% | 0,00% | 6,90% | |
| Yaoundé VI | 1,39% | 10,00% | 1,13% | 6,25% | 6,78% | |
| Yaoundé VII | 1,09% | 12,50% | 1,21% | 0,00% | 0,00% | |
| Road type | Principal | 0,93% | 2,30% | 0,86% | 2,10% | 0,90% |
| Secondary | 1,15% | 4,78% | 1,07% | 1,08% | 2,27% | |
| Tertiary | 1,15% | 0,00% | 1,21% | 0,00% | 0,00% | |
| Time period | Off peak hour | 0,92% | 2,45% | 0,91% | 0,45% | 0,91% |
| Peak hour | 1,11% | 3,46% | 1,01% | 2,80% | 1,77% | |
| Passanger presence | No passenger | 1,57% | 2,78% | 1,54% | 4,08% | 0,00% |
| Passenger | 0,93% | 3,05% | 0,86% | 1,33% | 1,61% | |
| Age group | Medium | 0,99% | 2,78% | 0,93% | 1,77% | 1,35% |
| Older | 6,40% | 28,57% | 5,76% | 0,00% | 0,00% | |
| Young | 1,43% | 0,00% | 1,46% | 0,00% | 0,00% | |
| Gender | Female | 0,50% | 0,00% | 0,51% | 0,00% | 0,00% |
| Male | 1,08% | 3,23% | 1,01% | 1,80% | 1,38% | |
| Category | Actions | Indicators | Target value |
|---|---|---|---|
| Legislation and Enforcement | Strengthen legislation for distracted driving offences by 2030 | Types of distraction considered | Handheld mobile device, not only mobile phone. Any risky behaviours identified to impaired safe driving by the law enforcement officer (interaction, eating, smoking/drinking, etc.). |
| Double the fine related to distracted driving by 2027 | Amount of the fine | 50,000 XAF by 2027. | |
| Develop a complete training program for distracted driving enforcement for law enforcement officers by 2025 | Number of training program developed | 2 complete training programs developed (1 theoretical and 1 practical) by 2025 based on international best practices. | |
| Implement a mandatory distracted driving enforcement training for law enforcement officers by 2030 | % of law enforcement officers trained | 75% of each police unit staff trained by 2030 (45% by 2027). 100 % of traffic control officer trained by 2030 (50% by 2027). |
|
| Increase the intensity of field enforcement by 2030 | Number of enforcements per week per location | At least 1 enforcement of 2h per week in each of the identified location (the 36 of this study + additional location to be defined) by 2028. | |
| Regular unobtrusive enforcement | Number of enforcements per week per location | At least 1 enforcement of 2h every two weeks in each of the identified location (the 36 of this study + additional point to be defined) by 2028. | |
| Strengthening monitoring by 2025 | Number of detailed enforcement report | 1 detailed enforcement report for each field enforcement operation. To be submitted within two days. 1 annual report for all enforcement operation |
|
| Increase awarness among law enfoemcen officer by 20230 | % of law enformcent officers attending awerness camapihn | 75% of each police unit staff by 2030 (45% by 2027). 100 % of traffic control officer staff (50% by 2027). |
Disclaimer/Publisher’s Note: The statements, opinions and data contained in all publications are solely those of the individual author(s) and contributor(s) and not of MDPI and/or the editor(s). MDPI and/or the editor(s) disclaim responsibility for any injury to people or property resulting from any ideas, methods, instructions or products referred to in the content. |
© 2024 by the authors. Licensee MDPI, Basel, Switzerland. This article is an open access article distributed under the terms and conditions of the Creative Commons Attribution (CC BY) license (https://creativecommons.org/licenses/by/4.0/).


