1. Introduction
Nowadays sentiment analysis or opinion mining is a common AI tool in many disciplines. The possibility of measuring and therefore quantifying the emotions expressed by its author in a text can have many applications. For example, the analysis of the conversation (Lahoz-Beltra and López 2021) held by a chatbot with a human or with a non-human interlocutor, i.e. other chatbot; the analysis of news published in the press about a natural disaster (Navarro et al. 2023), etc.
In this paper we explain step by step a procedure introduced in (Lahoz-Beltra and López 2021) that allows to take advantage of the result of the sentiment analysis in a set of texts for their subsequent classification into two or more clusters. The contribution of the method is the way in which the results or output of sentiment analysis are used to build the data matrix which is the input to the classification method. Once the classifier is obtained we will be able to classify a given text into a cluster. The classification methods we use are techniques of machine learning and/or multivariate statistical analysis. In order to illustrate the general method, we will use an example from (Navarro et al. 2023).
2. Materials and Methods
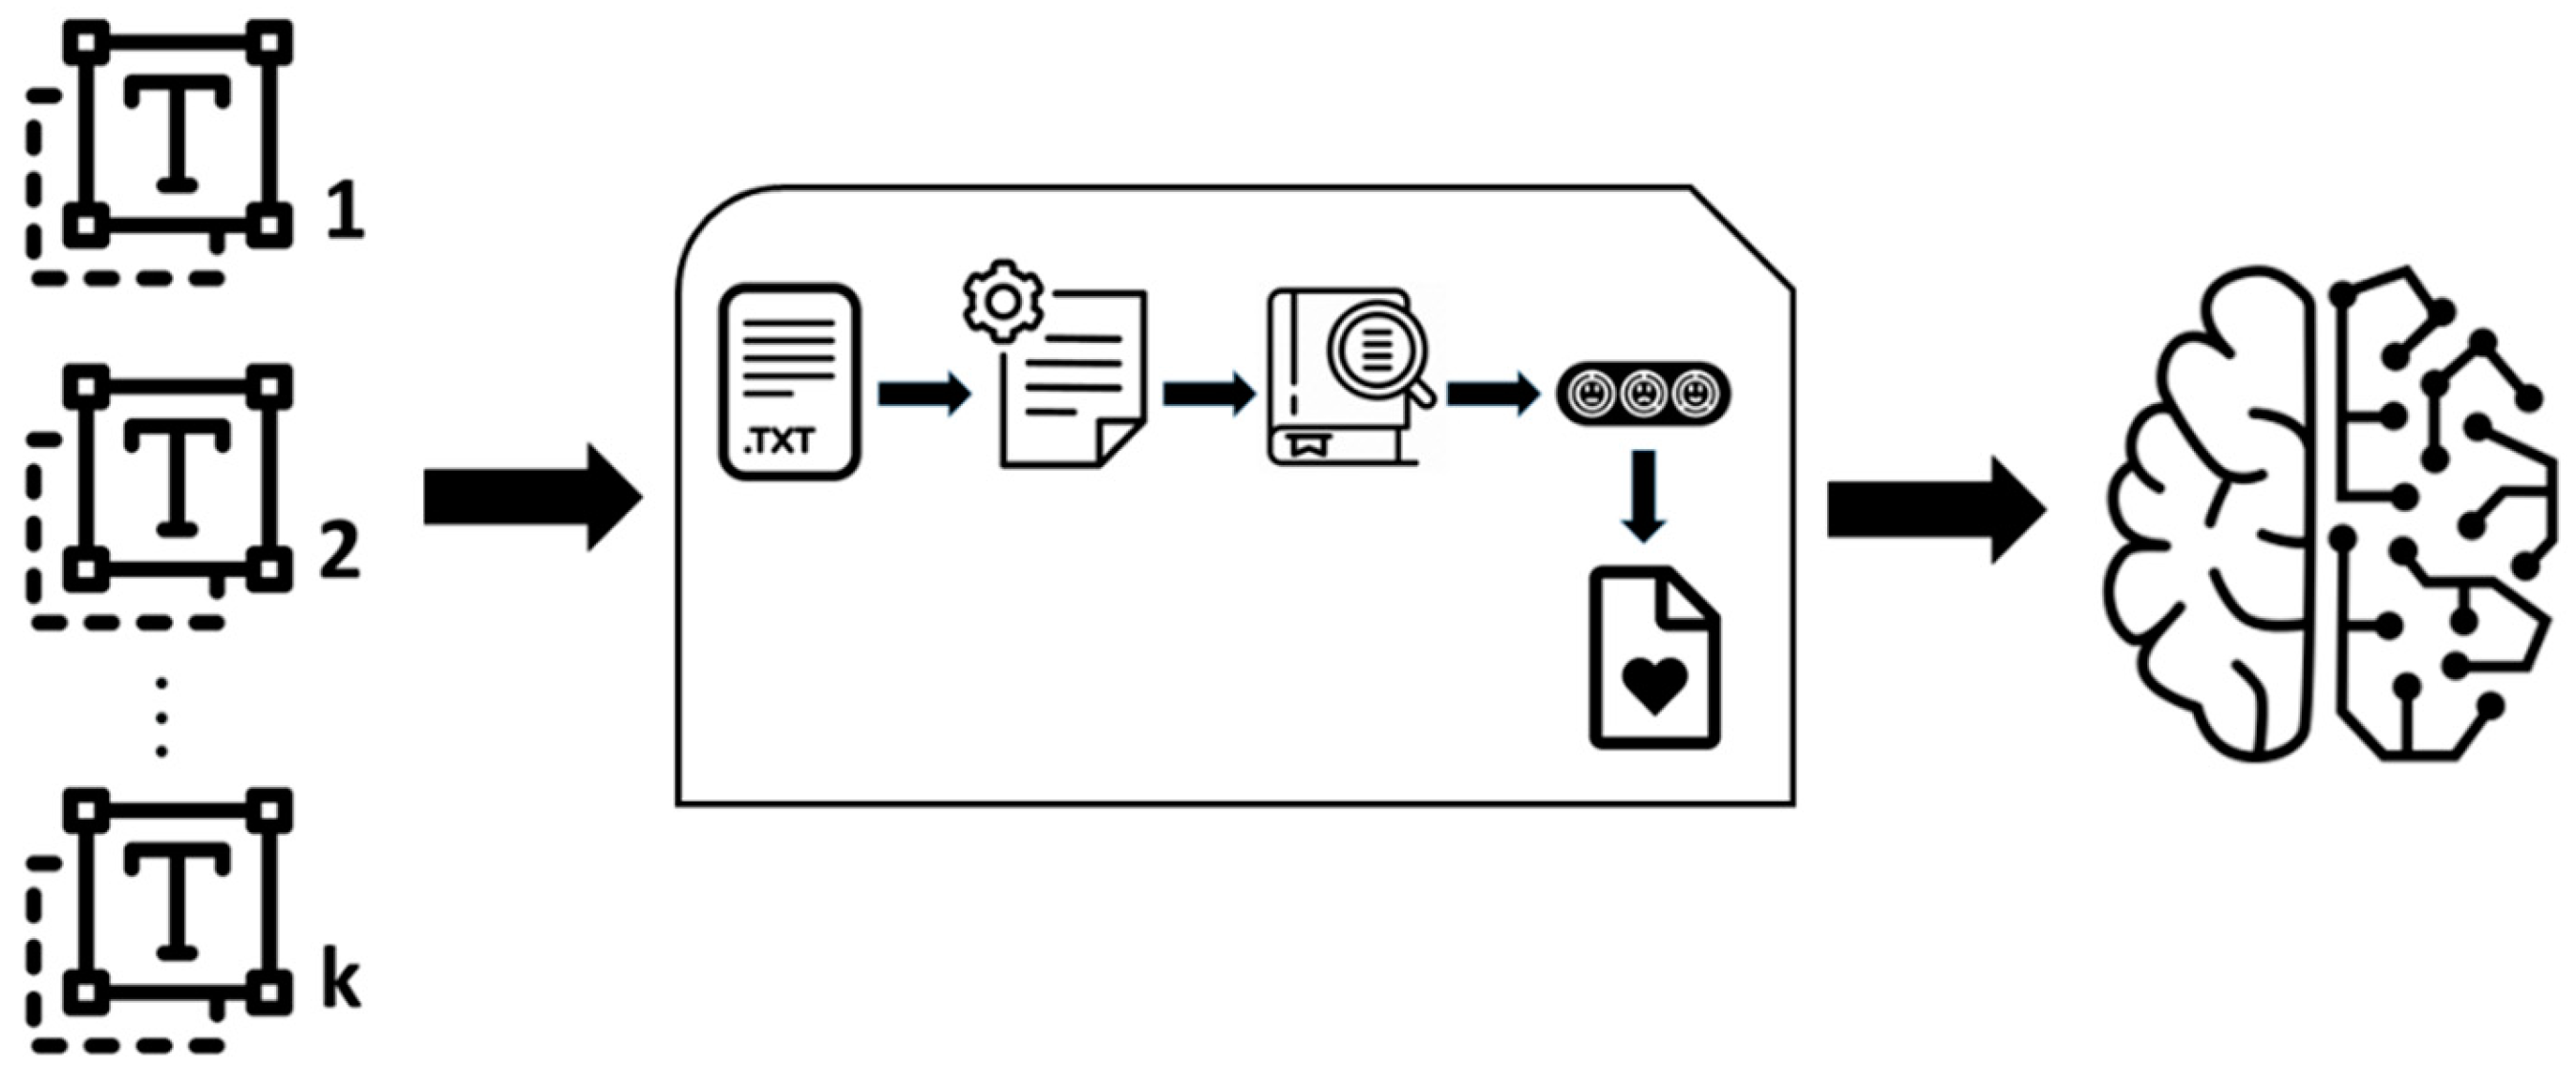
Let’s assume that we want to classify a collection of texts into two groups. In this paper, as mentioned above, we will use an example from (Navarro et al. 2023). In this study, the goal was to classify into different groups or clusters the press articles reporting on the eruption during 2021 of the Cumbre Vieja volcano on the island of La Palma (Canary Islands, Spain). For different purposes the press articles were classified in two or more groups or clusters. For example, the news were successfully classified by distinguishing those published in the national press from those published in the foreign press. Likewise, the news were also classified into more than two clusters, successfully identifying for one newspaper item the month during the volcanic eruption in which it was published. Thus, the news were classified in the month in which it was published based on the emotions expressed by the journalist during the writing of the story.
Figure 1 shows the work flow of the methodology. In accordance with the protocol, the texts were classified with different criteria and classification techniques. In particular, in the studies (Lahoz-Beltra and López 2021), (Navarro et al. 2023) we applied the following classification techniques: discriminant analysis, perceptron neural network, logistic regression model and probabilistic neural network. Obviously, other classification techniques could also be applied.
2.1. Sentiment Analysis or Opinion Mining
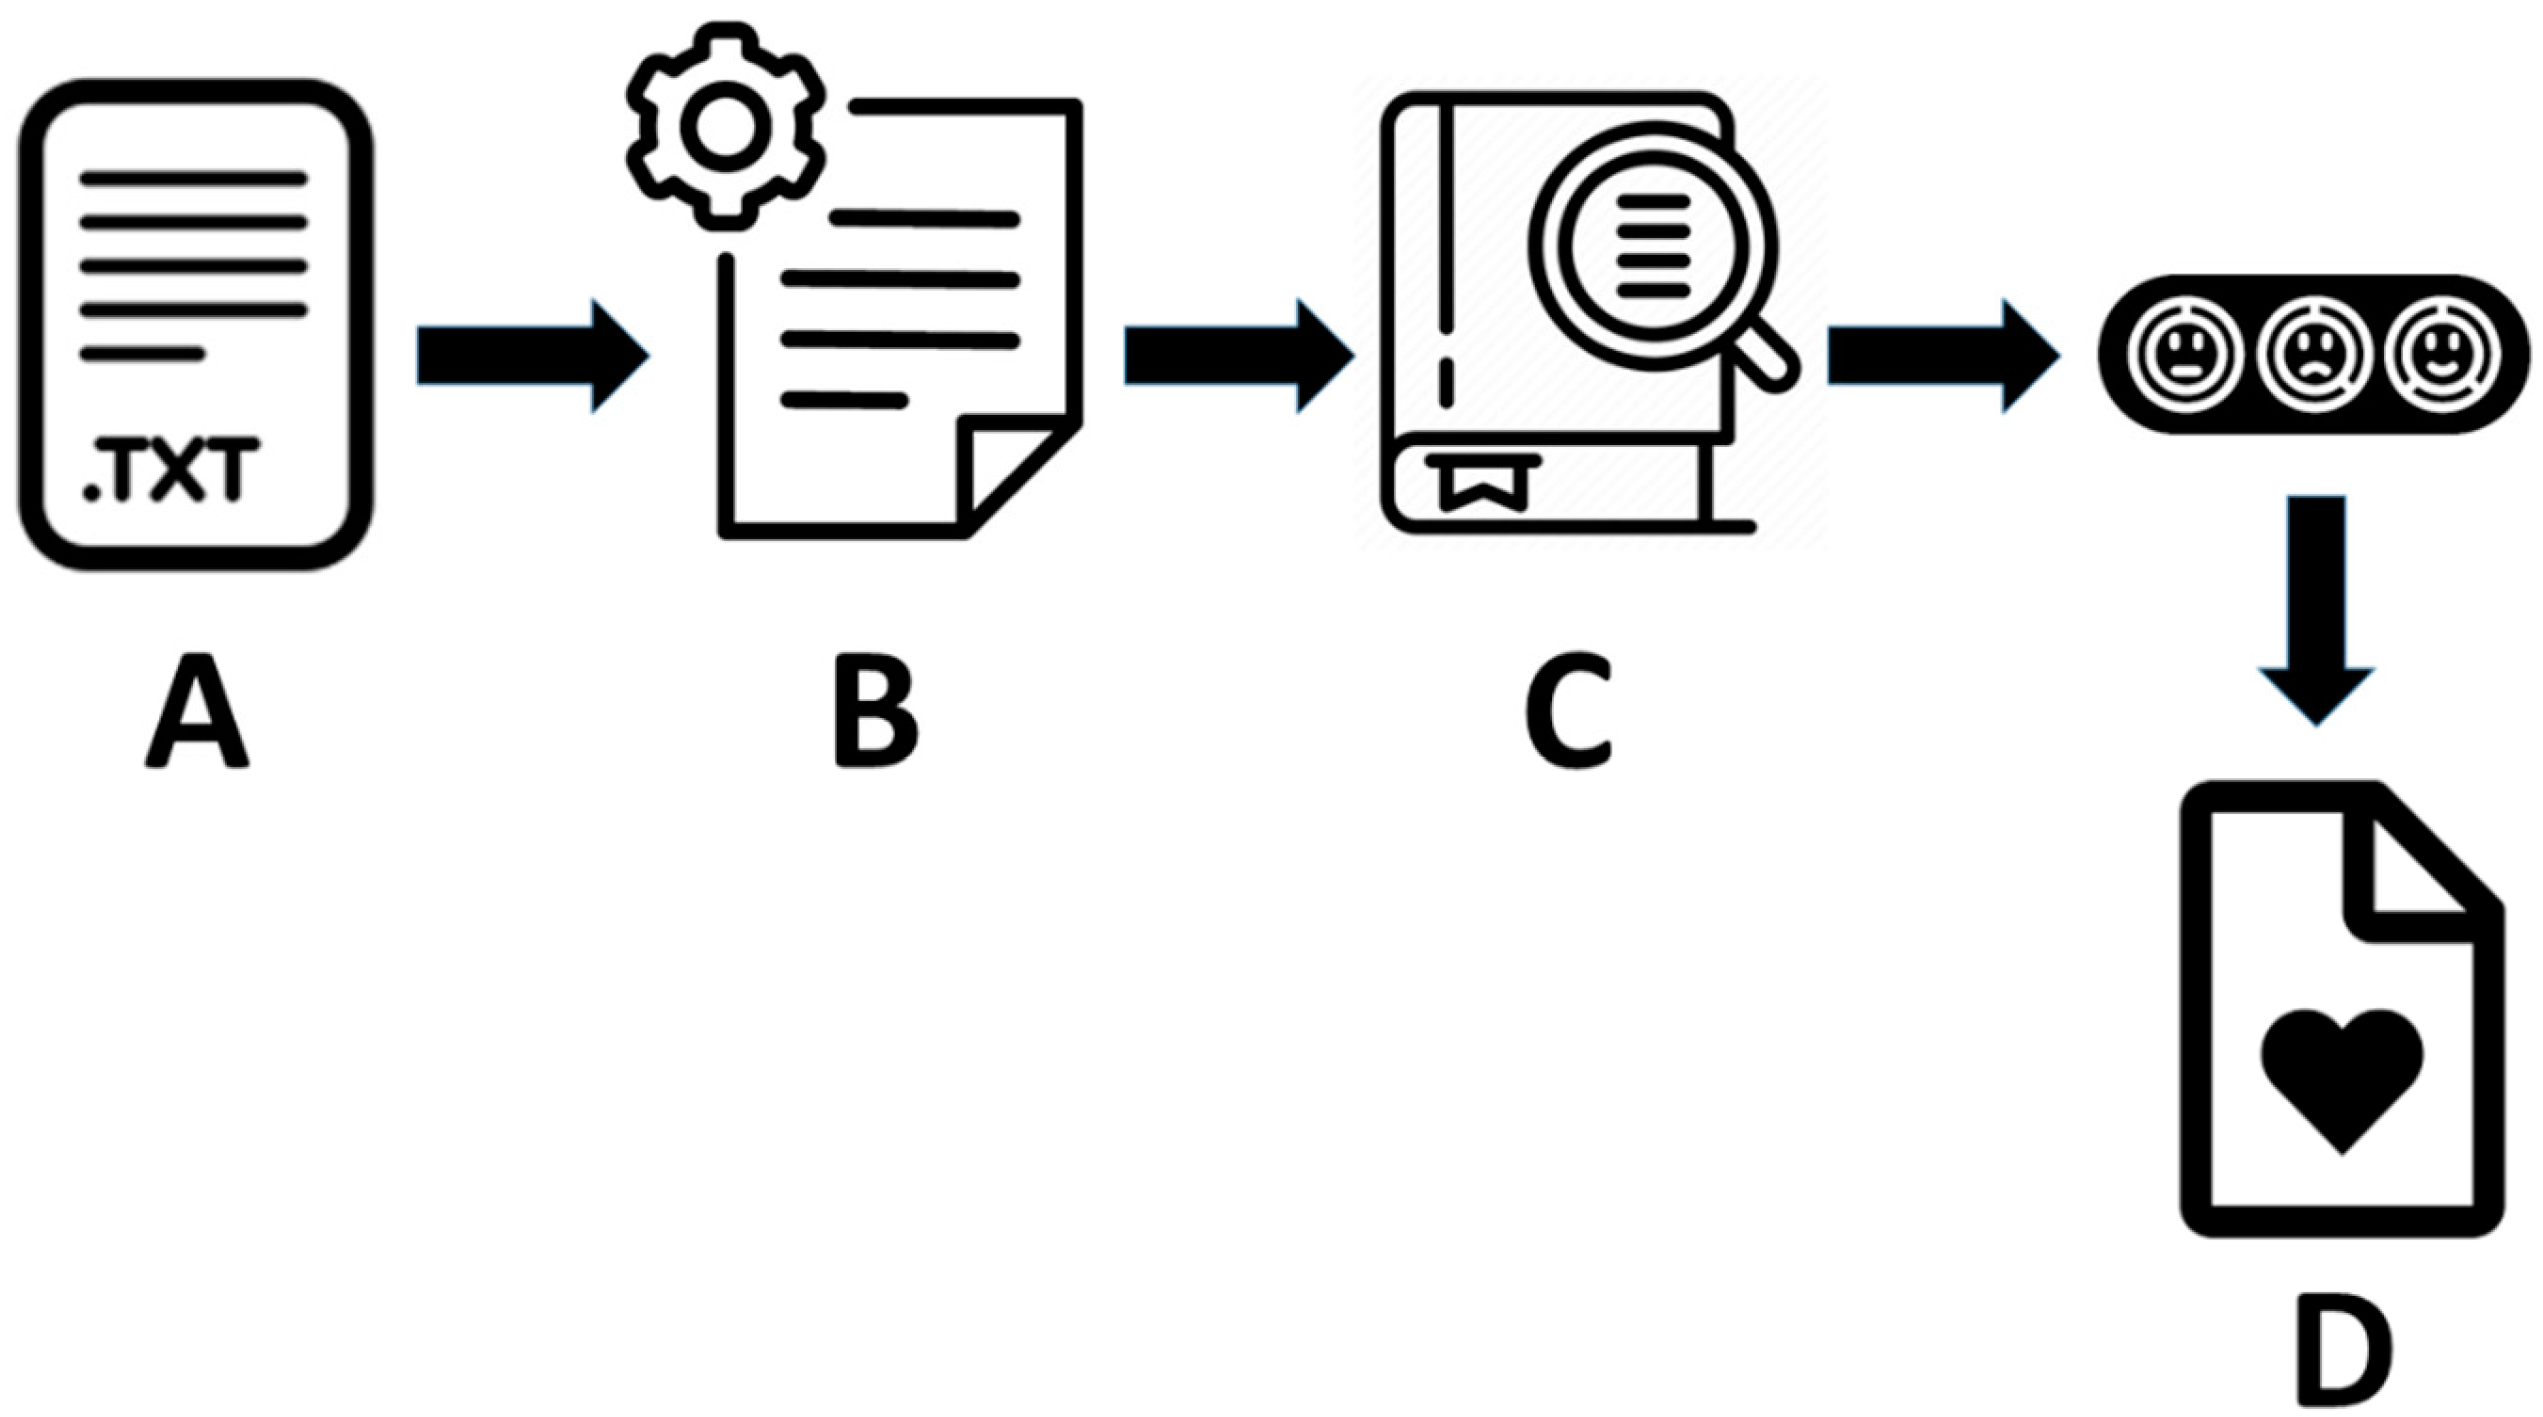
The aim of the sentiment analysis is the quantitative analysis of a text by extracting subjective information from an analysis of the polarity, i.e. the positive or negative connotation of the words in the text. By applying this technique, it is possible deduce the emotional or affective state expressed by the person or persons who wrote the text. The procedure was conducted according to the following experimental protocol (
Figure 2).
In the studies (Lahoz-Beltra and López 2021), (Navarro et al. 2023) in which we have applied this methodology, the selected texts were analyzed by applying text mining techniques with Syuzhet 1.0.6 (Jockers 2023) and RStudio 1.1.419 packages (
Figure 2). Text mining methodology based on R was taken and adapted from (Mhatre 2020), publishing as supplementary material in (Lahoz-Beltra 2024) the R script that we applied in the aforementioned studies and in the present work.
The sentiment analysis was performed with version 0.92 of the NRC Word-Emotion Association Lexicon (Bravo-Marquez et al. 2016), (Mohammad 2013). This lexicon is a list of English/Spanish words and their associations with eight basic emotions (anger, fear, anticipation, trust, surprise, sadness, joy, and disgust) and two sentiments (negative and positive). In total, the lexicon contains 14,182 unigrams (words) and more than 25,000 meanings. The NRC lexicon can be explored in depth through an interactive visualization on the NRC website (Mohammad 2024), where the number of words associated with each emotion, word-feeling associations, and word-emotion associations can be looked up.
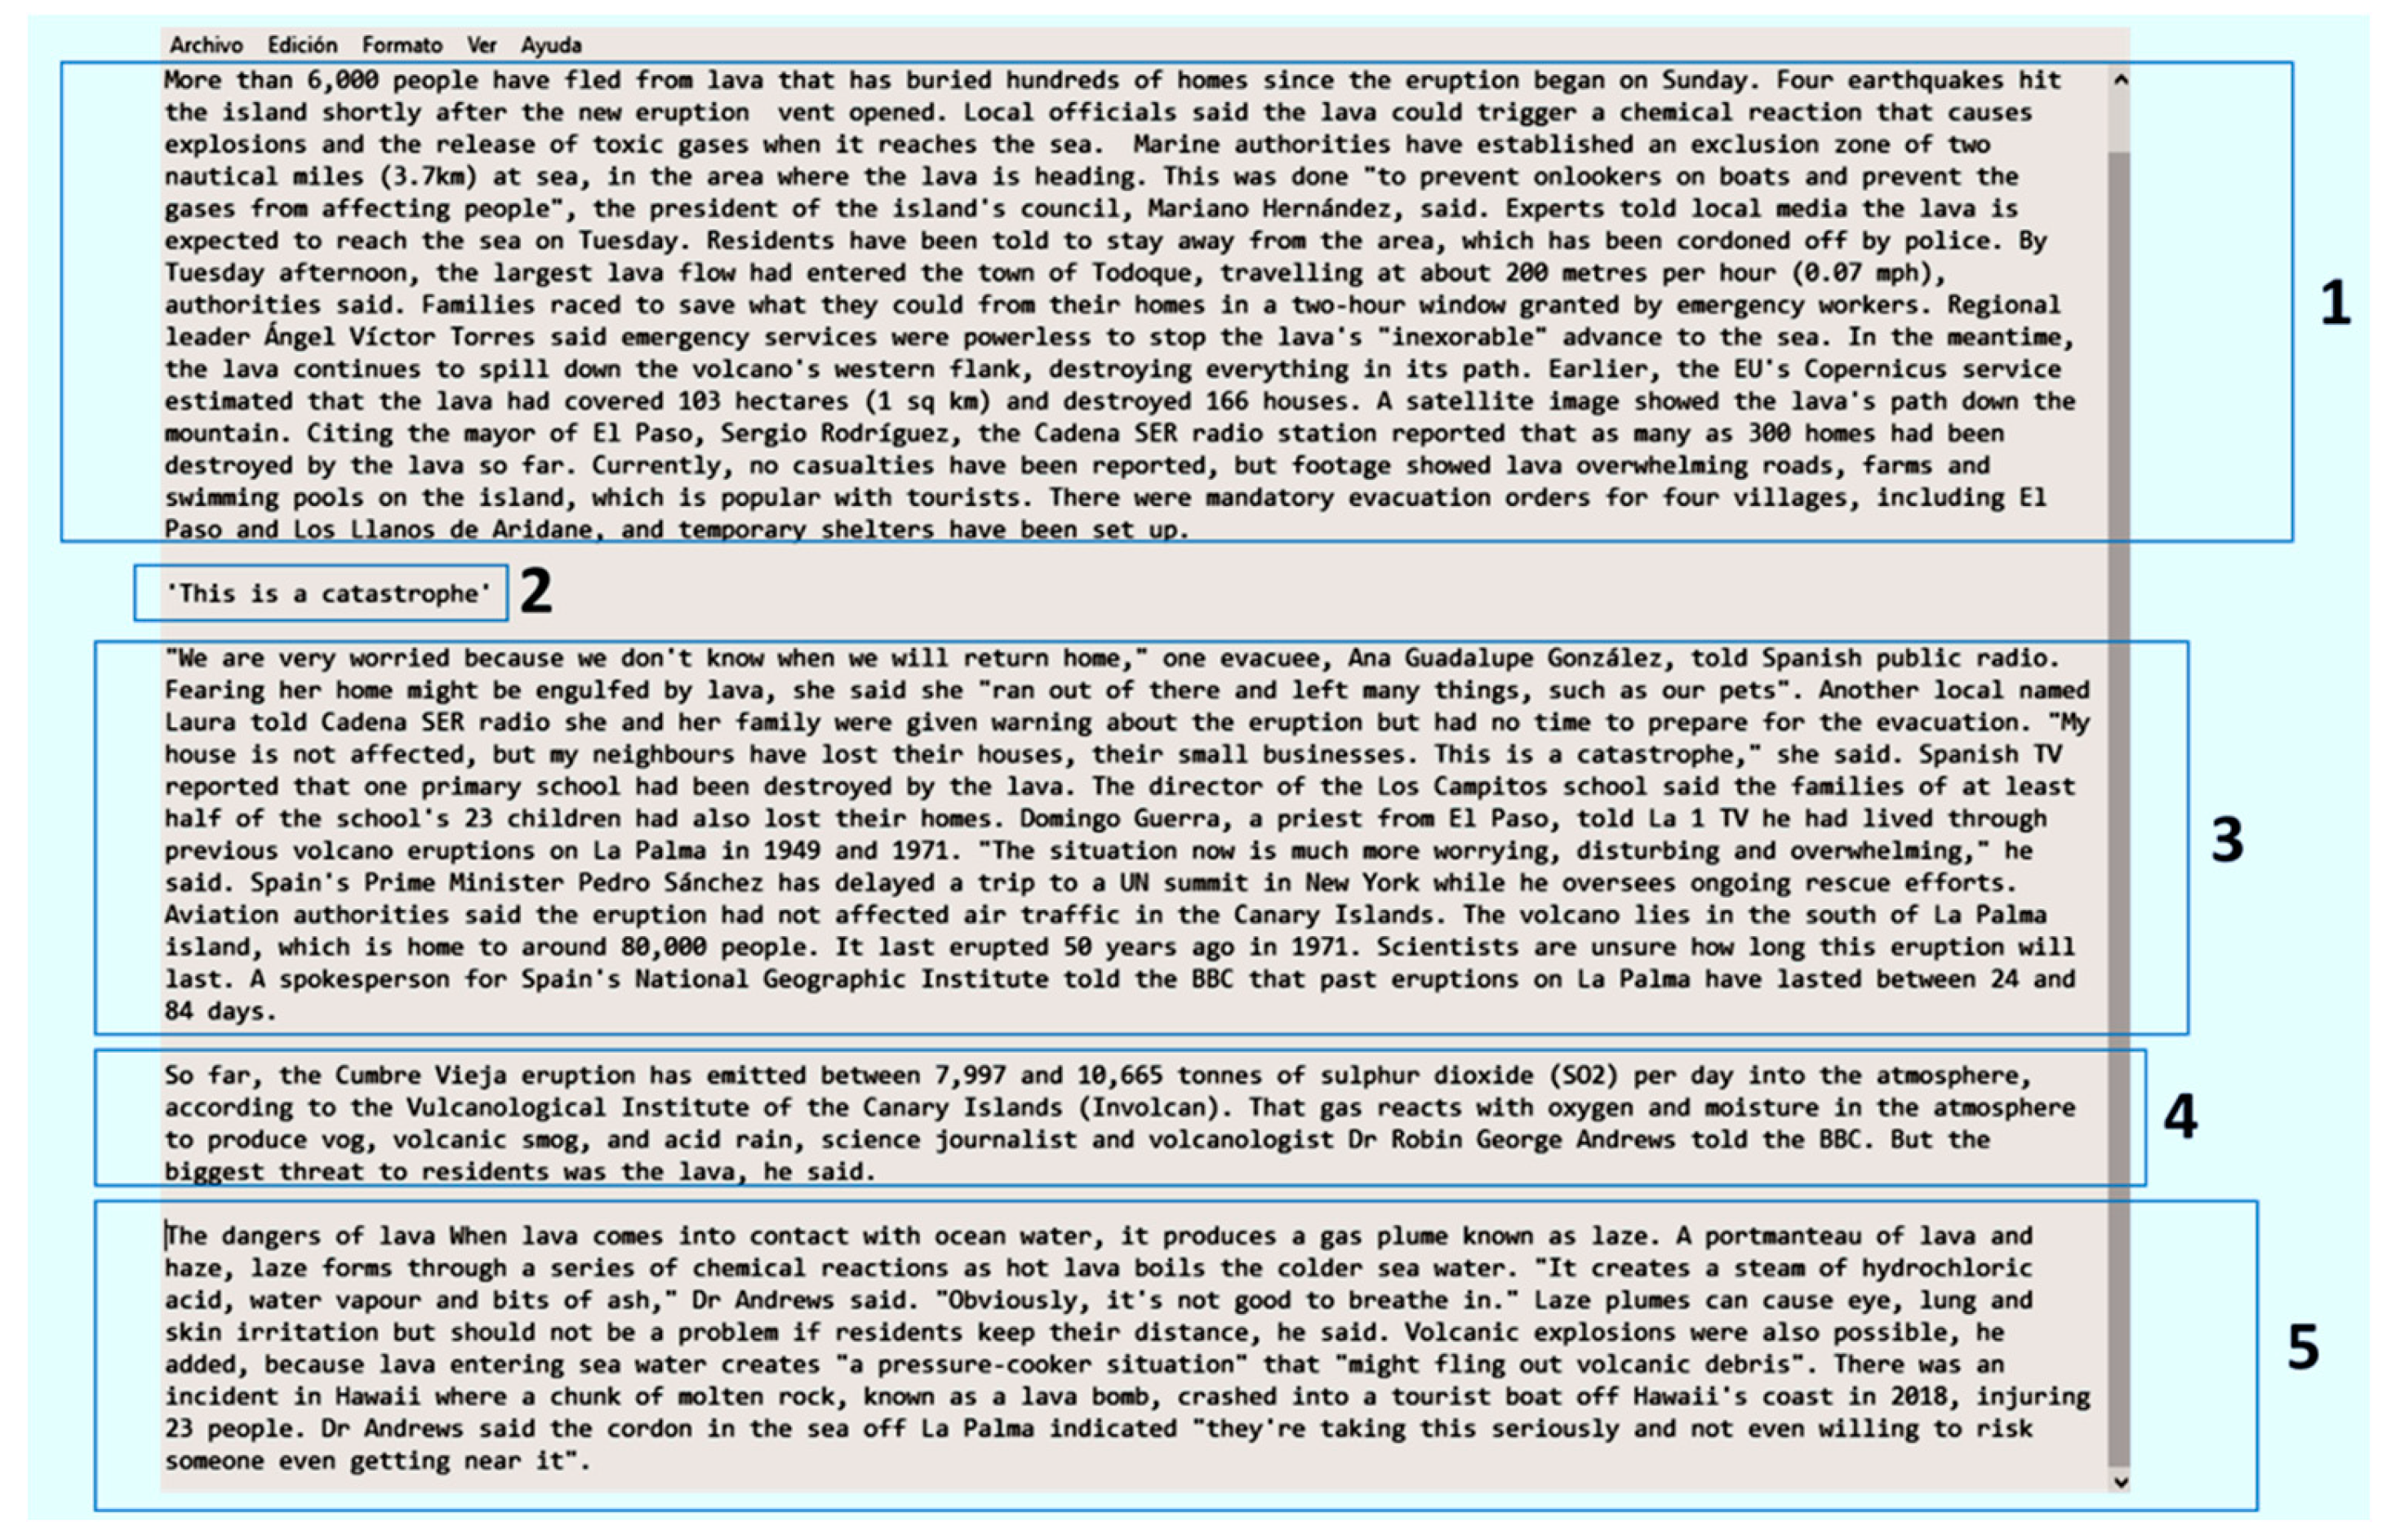
Suppose we wish to classify the news (Navarro et al. 2023) in two or more groups or clusters. Next, using the R script (Lahoz-Beltra 2024) we will describe the main steps of the sentiment analysis method (
Figure 2) that we applied to the above mentioned studies, and how we obtained the data matrix that we later used to classify the texts into different groups. We will use as an example to illustrate the method the text of the press release shown in
Figure 3:
2.1.1. Text Normalization
First, the text was normalized, i.e. depurated and cleaned, and then broken down into smaller strings or sentences. Normalization is necessary because a text contains words in different tenses, plurals or words derived from other words. This process involves different tasks such as correcting spelling, removing punctuation marks and special characters, converting acronyms to regular expressions, converting uppercase to lowercase, etc. The result of this step resulted in what is known as a sentiment vector. A sentiment vector is a vector whose length or number of elements is the number of paragraphs (
Figure 3 and
Figure 4) comprising the text to be analyzed.
2.1.2. Sentiment Vector
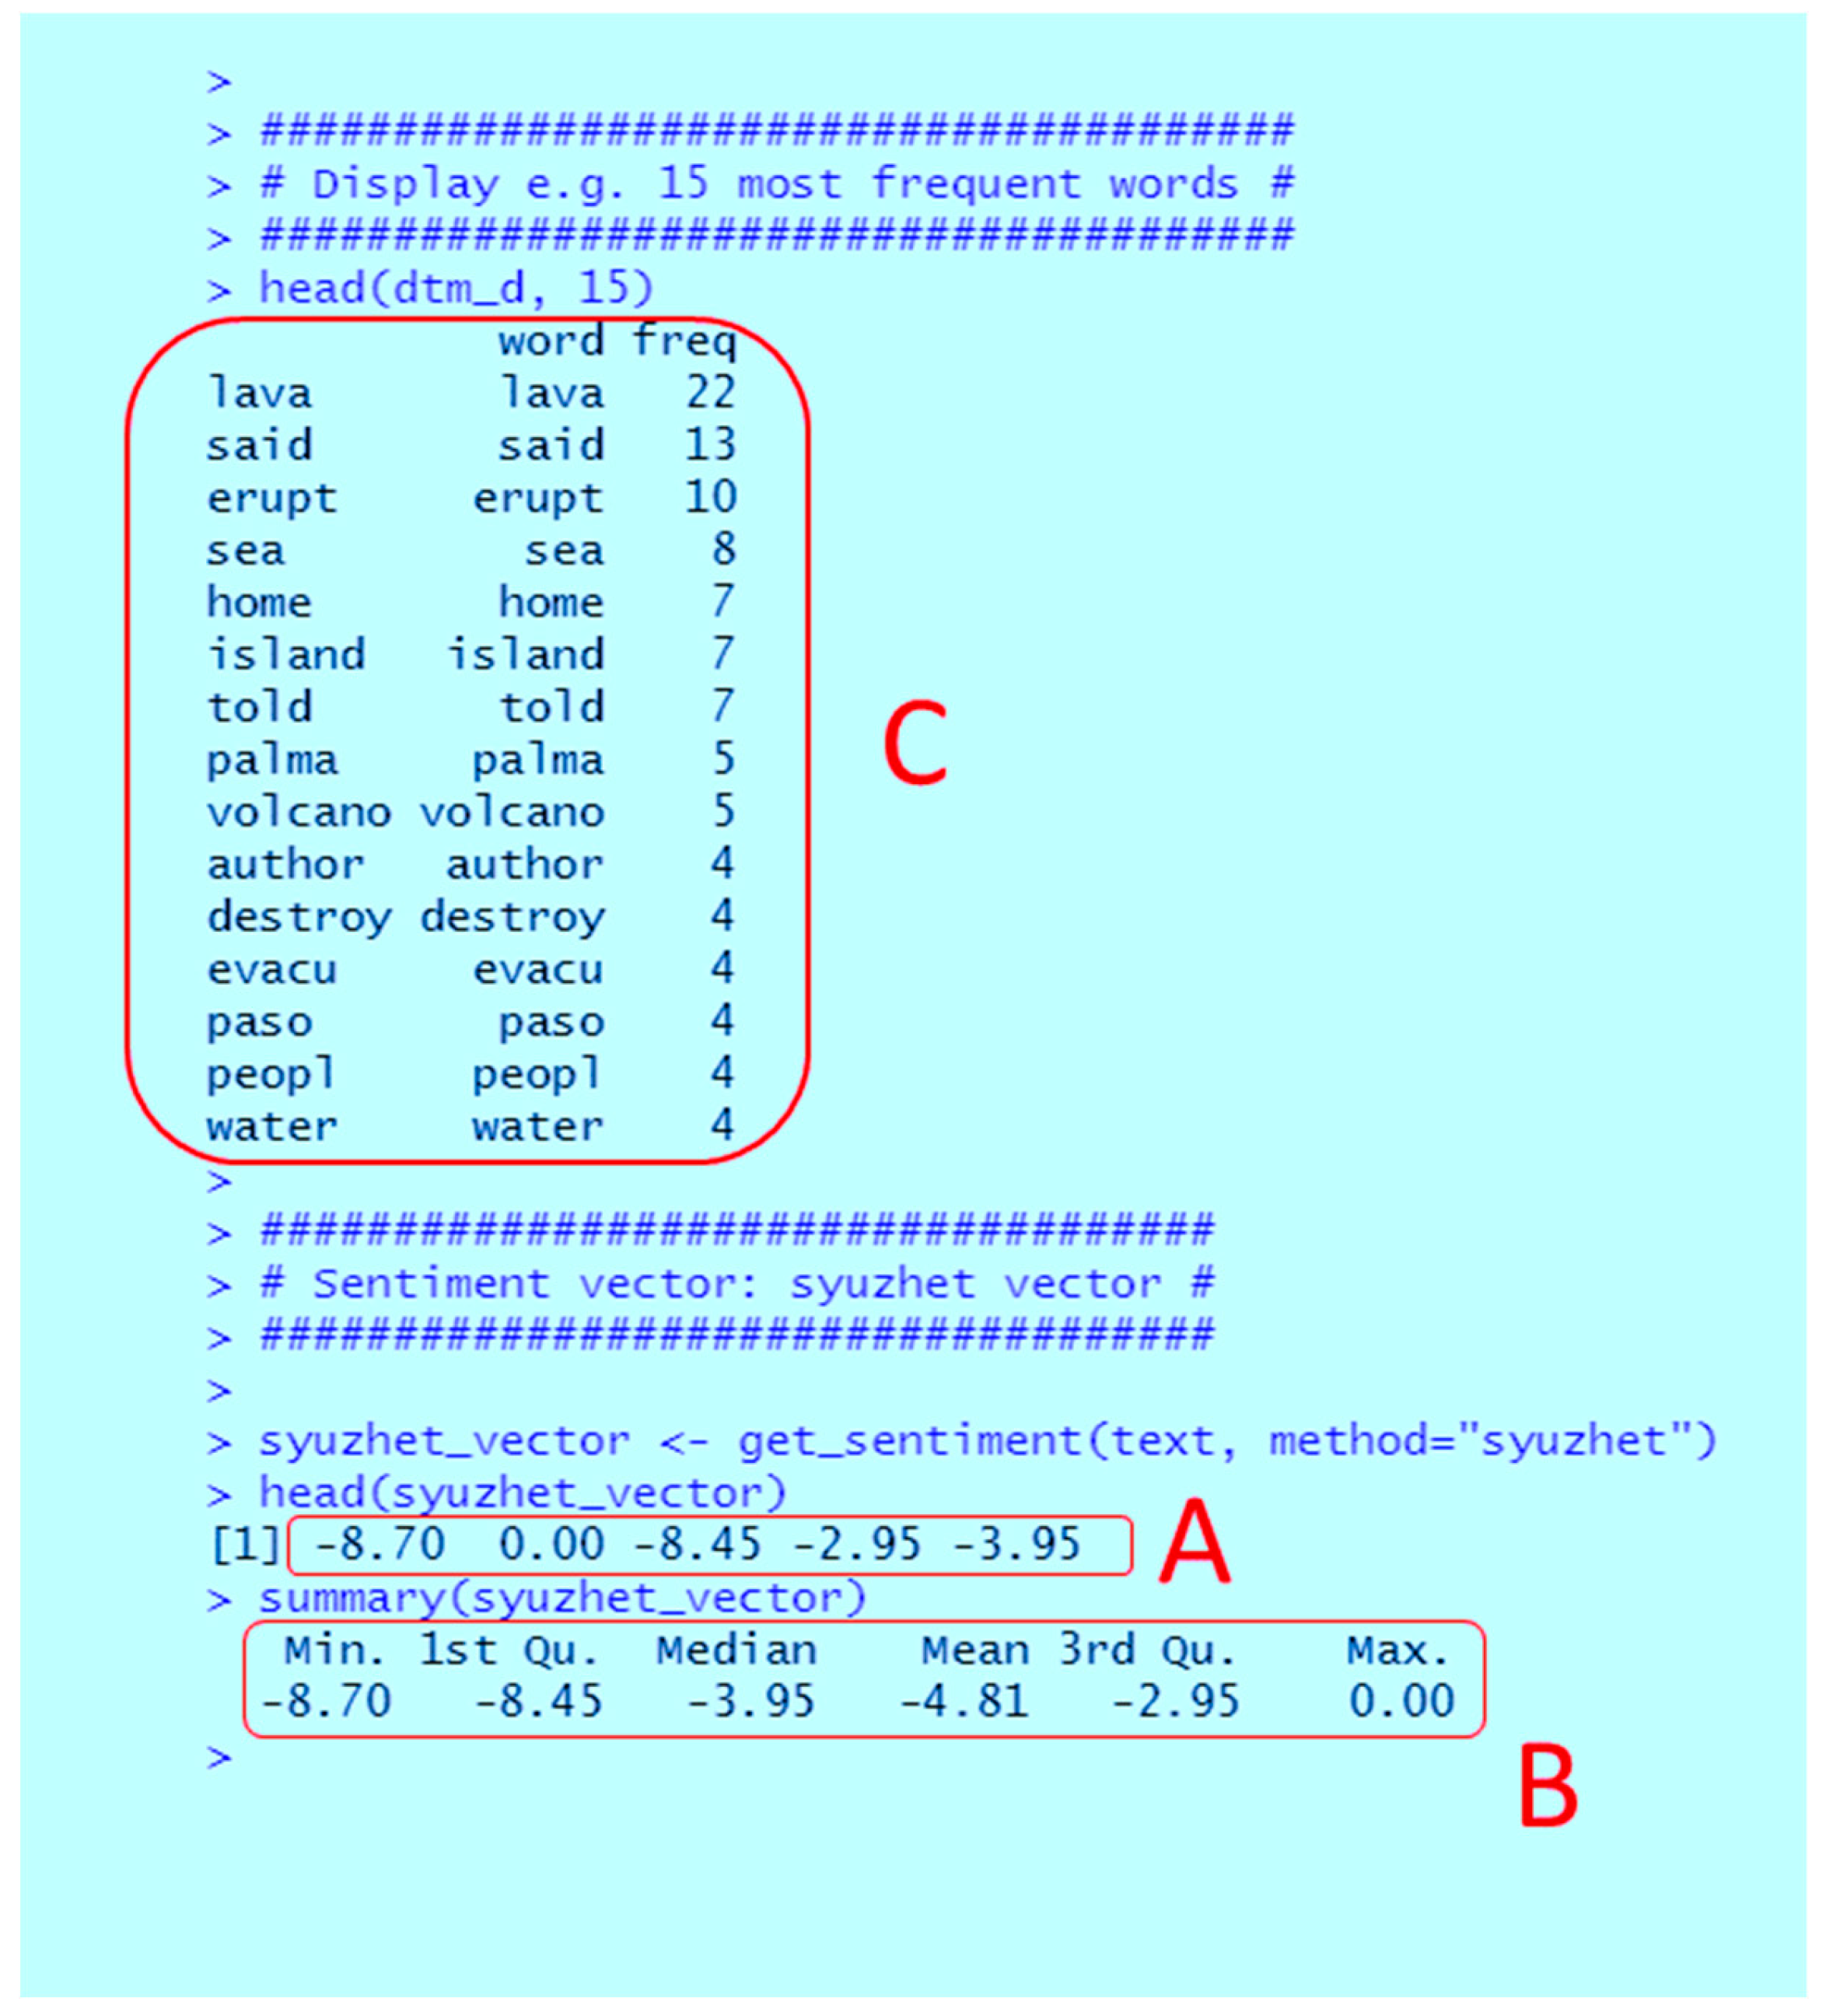
Next, and secondly, a numerical value was obtained for each element (or paragraph) of the sentiment vector (
Figure 4). The resulting numerical value represents the rating received by the words of the paragraph according to their emotional load or sentimental charge. In addition, and at this step, from the values of the sentiment vector an overall statistical evaluation (
Figure 4) of each text is obtained. This global statistical evaluation of a text comprises the following univariate sample statistics which are calculated from the numerical values of the sentiment vector: the minimum value (Min), the first quartile (Q
1), the median (Me), the mean (
), the third quartile (Q
3) and the maximum value (Max).
2.1.3. Emotions and Sentiments
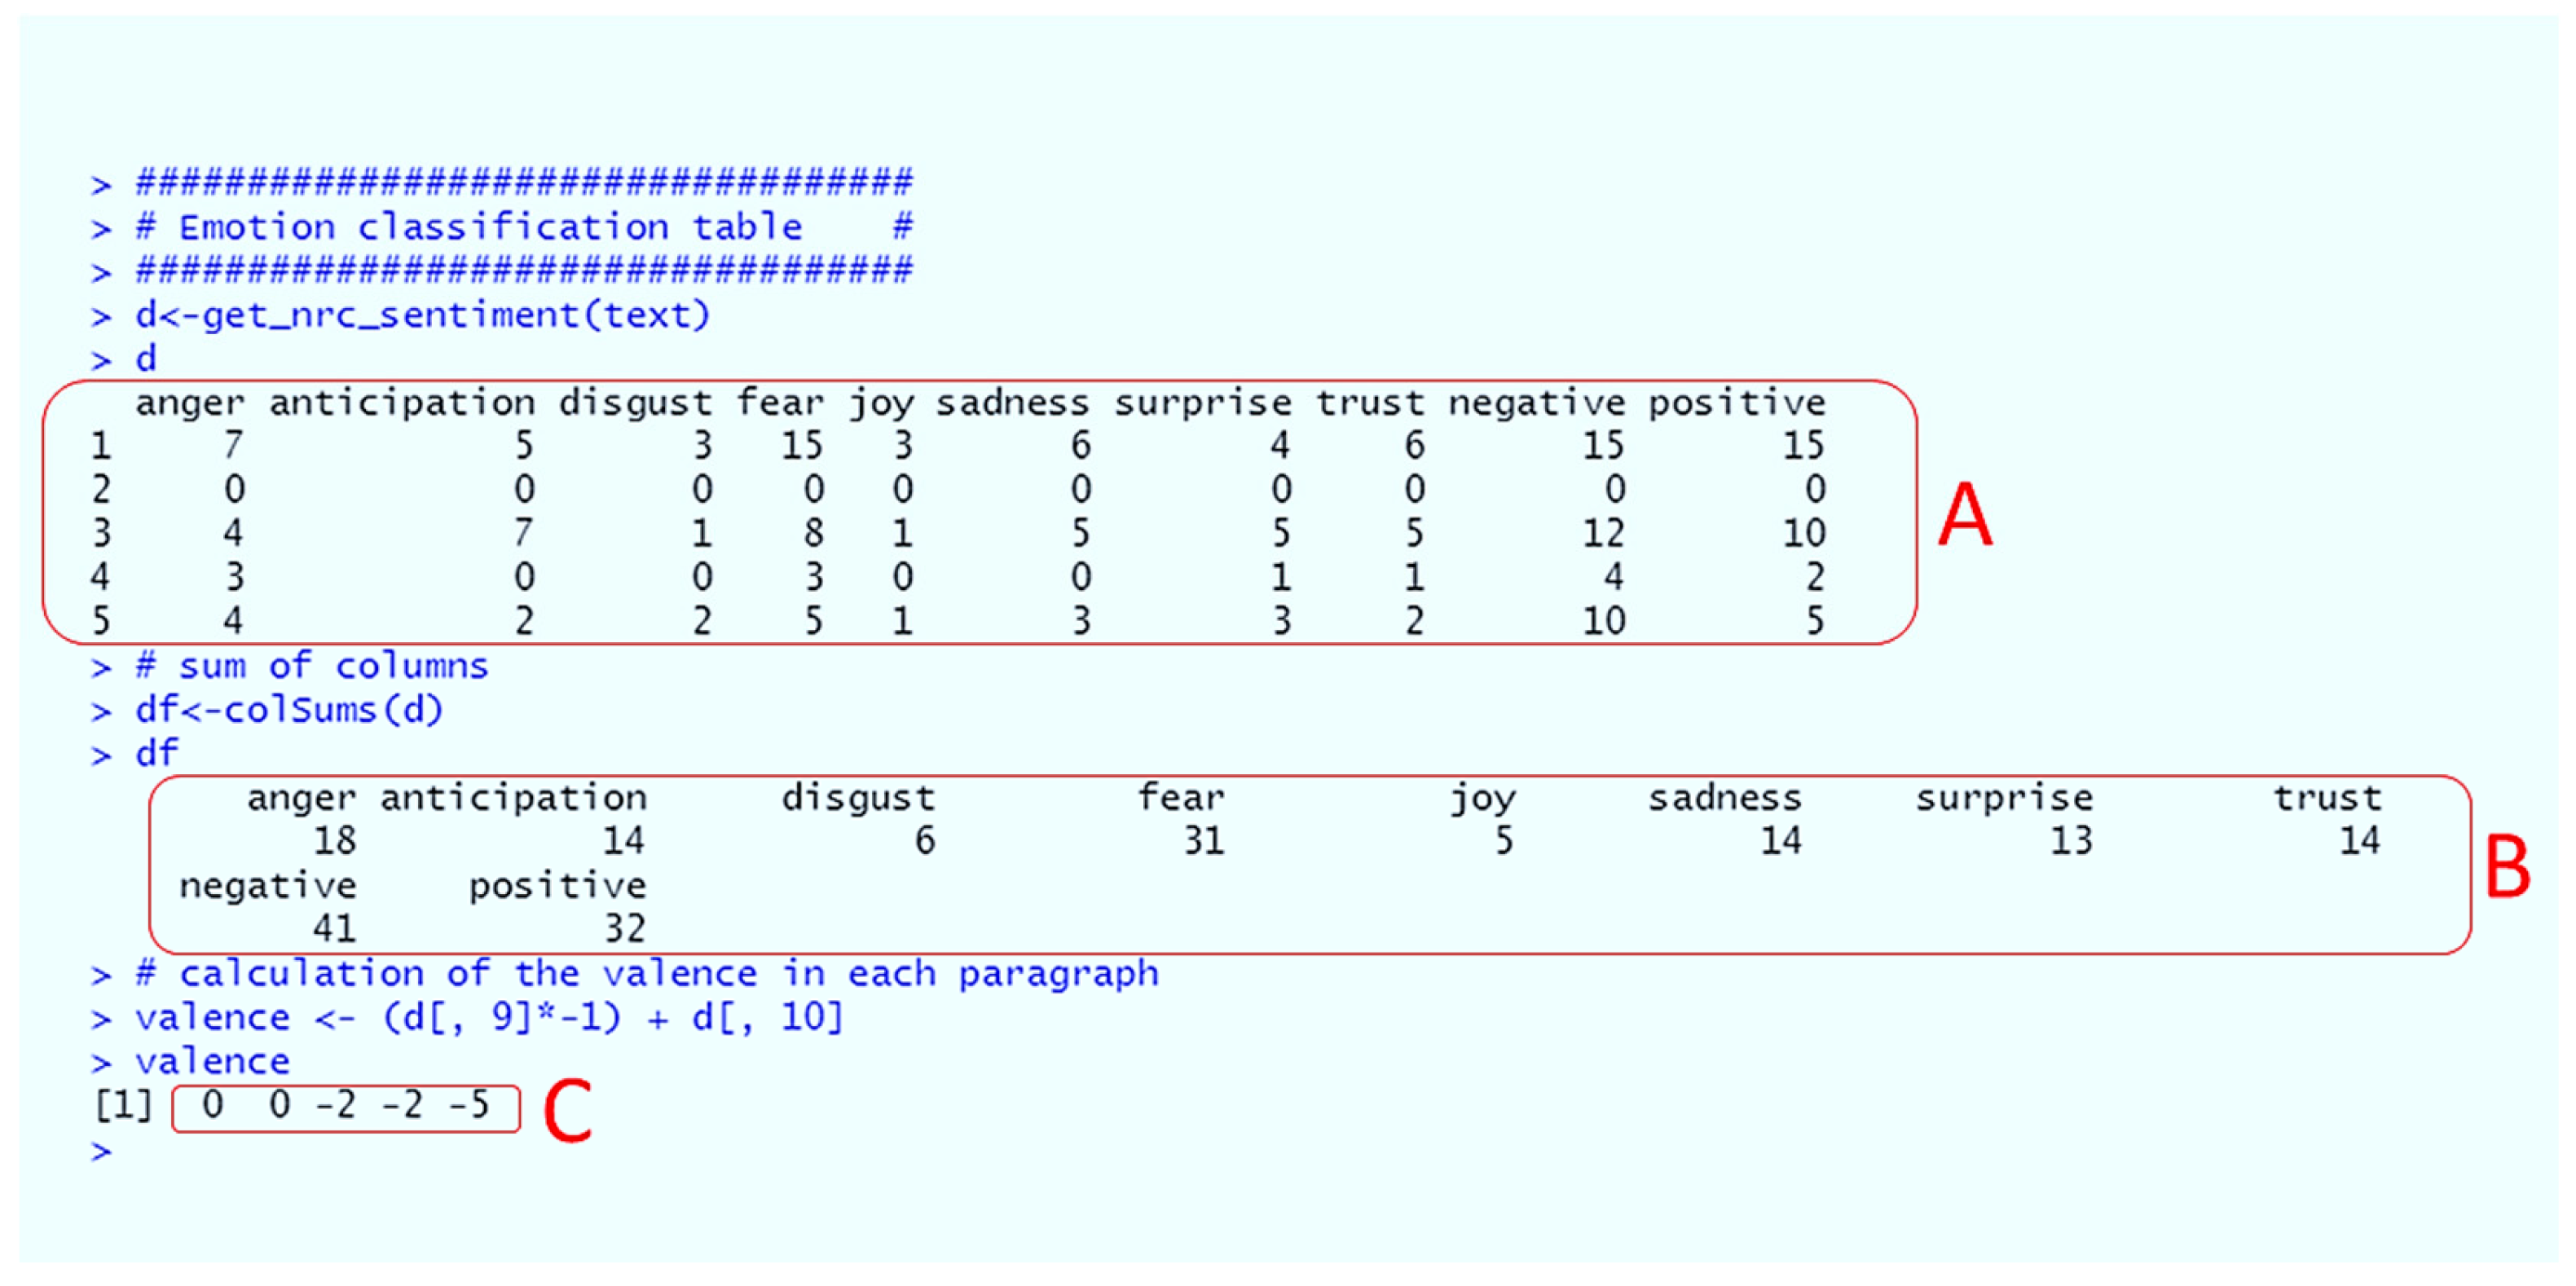
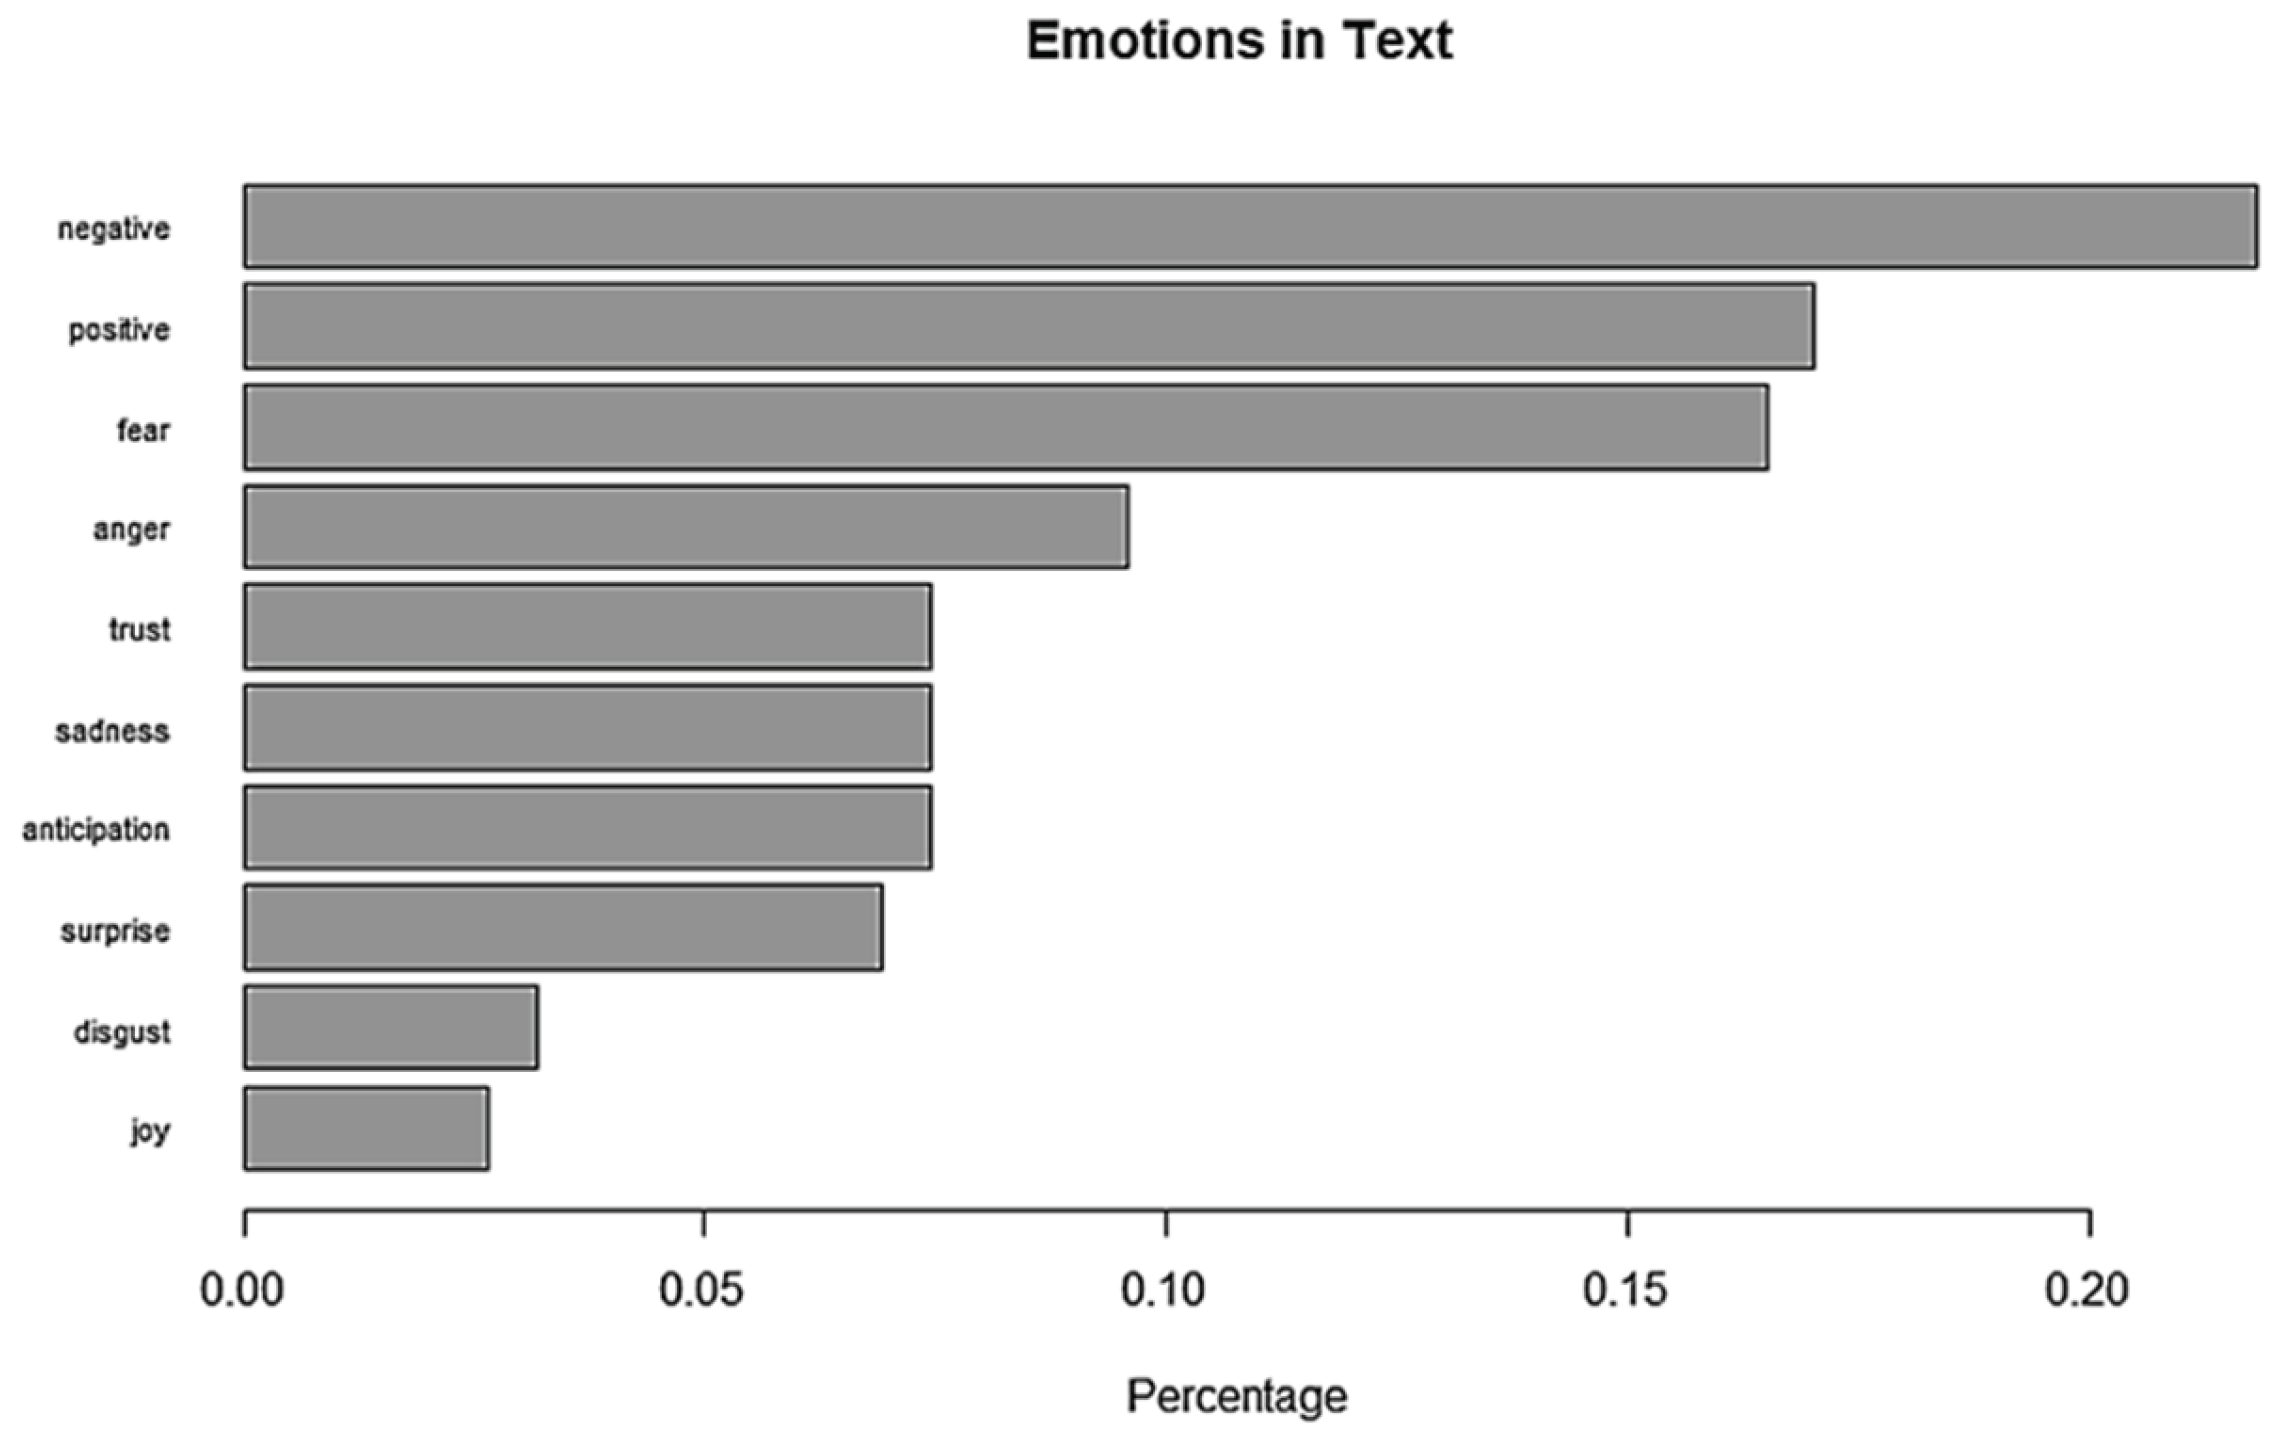
Following, and in third place, the number of words associated with the basic emotions was also calculated (
Figure 4), obtaining the percentage of words associated with each of the emotions expressed in the text. In this step, we also obtained the total number of words (
Figure 5) associated with the eight emotions (anger, fear, anticipation, trust, surprise, sadness, joy and disgust) and two sentiments (negative and positive).
We calculated the valence as shown in
Figure 5. The valence or hedonic tone is a feature of emotions, which can be positive, negative or neutral. Positive emotions are expressed by words such as good, great, etc. while negative emotions are expressed by words as for example bad, hate, etc. The value is obtained in each paragraph by subtracting the number of words expressing negative feelings from the number of words expressing positive feelings.
2.2. Data or Training Matrix
Sentiment analysis was carried out on the selected texts, regardless of the group or cluster assigned. Consequently, once the procedure (
Figure 2) has been applied to a given text, e.g. the text shown in
Figure 3, its emotional and sentimental content is summarized in an output vector with the following elements: the number of words expressing emotions - anger, fear, anticipation, confidence, surprise, sadness, joy and disgust – as well as the number of words reflecting negative and positive sentiments. In addition, this vector also includes the values of the univariate sample statistics of the sentiment vector, i.e. the minimum value (Min), the first quartile (Q
1), the median (Me), the arithmetic mean (
), the third quartile (Q
3) and the maximum value (Max).
In summary, the ‘emotional baggage’ of a text, e.g. the text of
Figure 3, is transformed with the script (Lahoz-Beltra 2024) into the elements of an ‘output vector’ which summarize the results of sentiment or opinion analysis. Information contained in the output vector has a descriptive and predictive value which will be useful for classifying texts into different groups or clusters. Once the output vectors of the analyzed texts have been obtained, the data matrix is constructed, and the texts will be classified into one or more groups through machine learning methods or multivariate statistical analysis.
The output vector (
Figure 6) of a given text is defined with the following array of numerical values. Let
Xij be a predictor value
j (
j= 1, 2… 16) of the text
i that has been analyzed with (Lahoz-Beltra 2024). The descriptor variables state the number of words from text
i expressing:
In addition, the following values calculated from sentiment vector are also included:
Xi11: minimum value (Min).
Xi12: first quartile (Q1).
Xi13: median (Me).
Xi14: arithmetic mean ().
Xi15: third quartile (Q3).
Xi16: maximum value (Max).
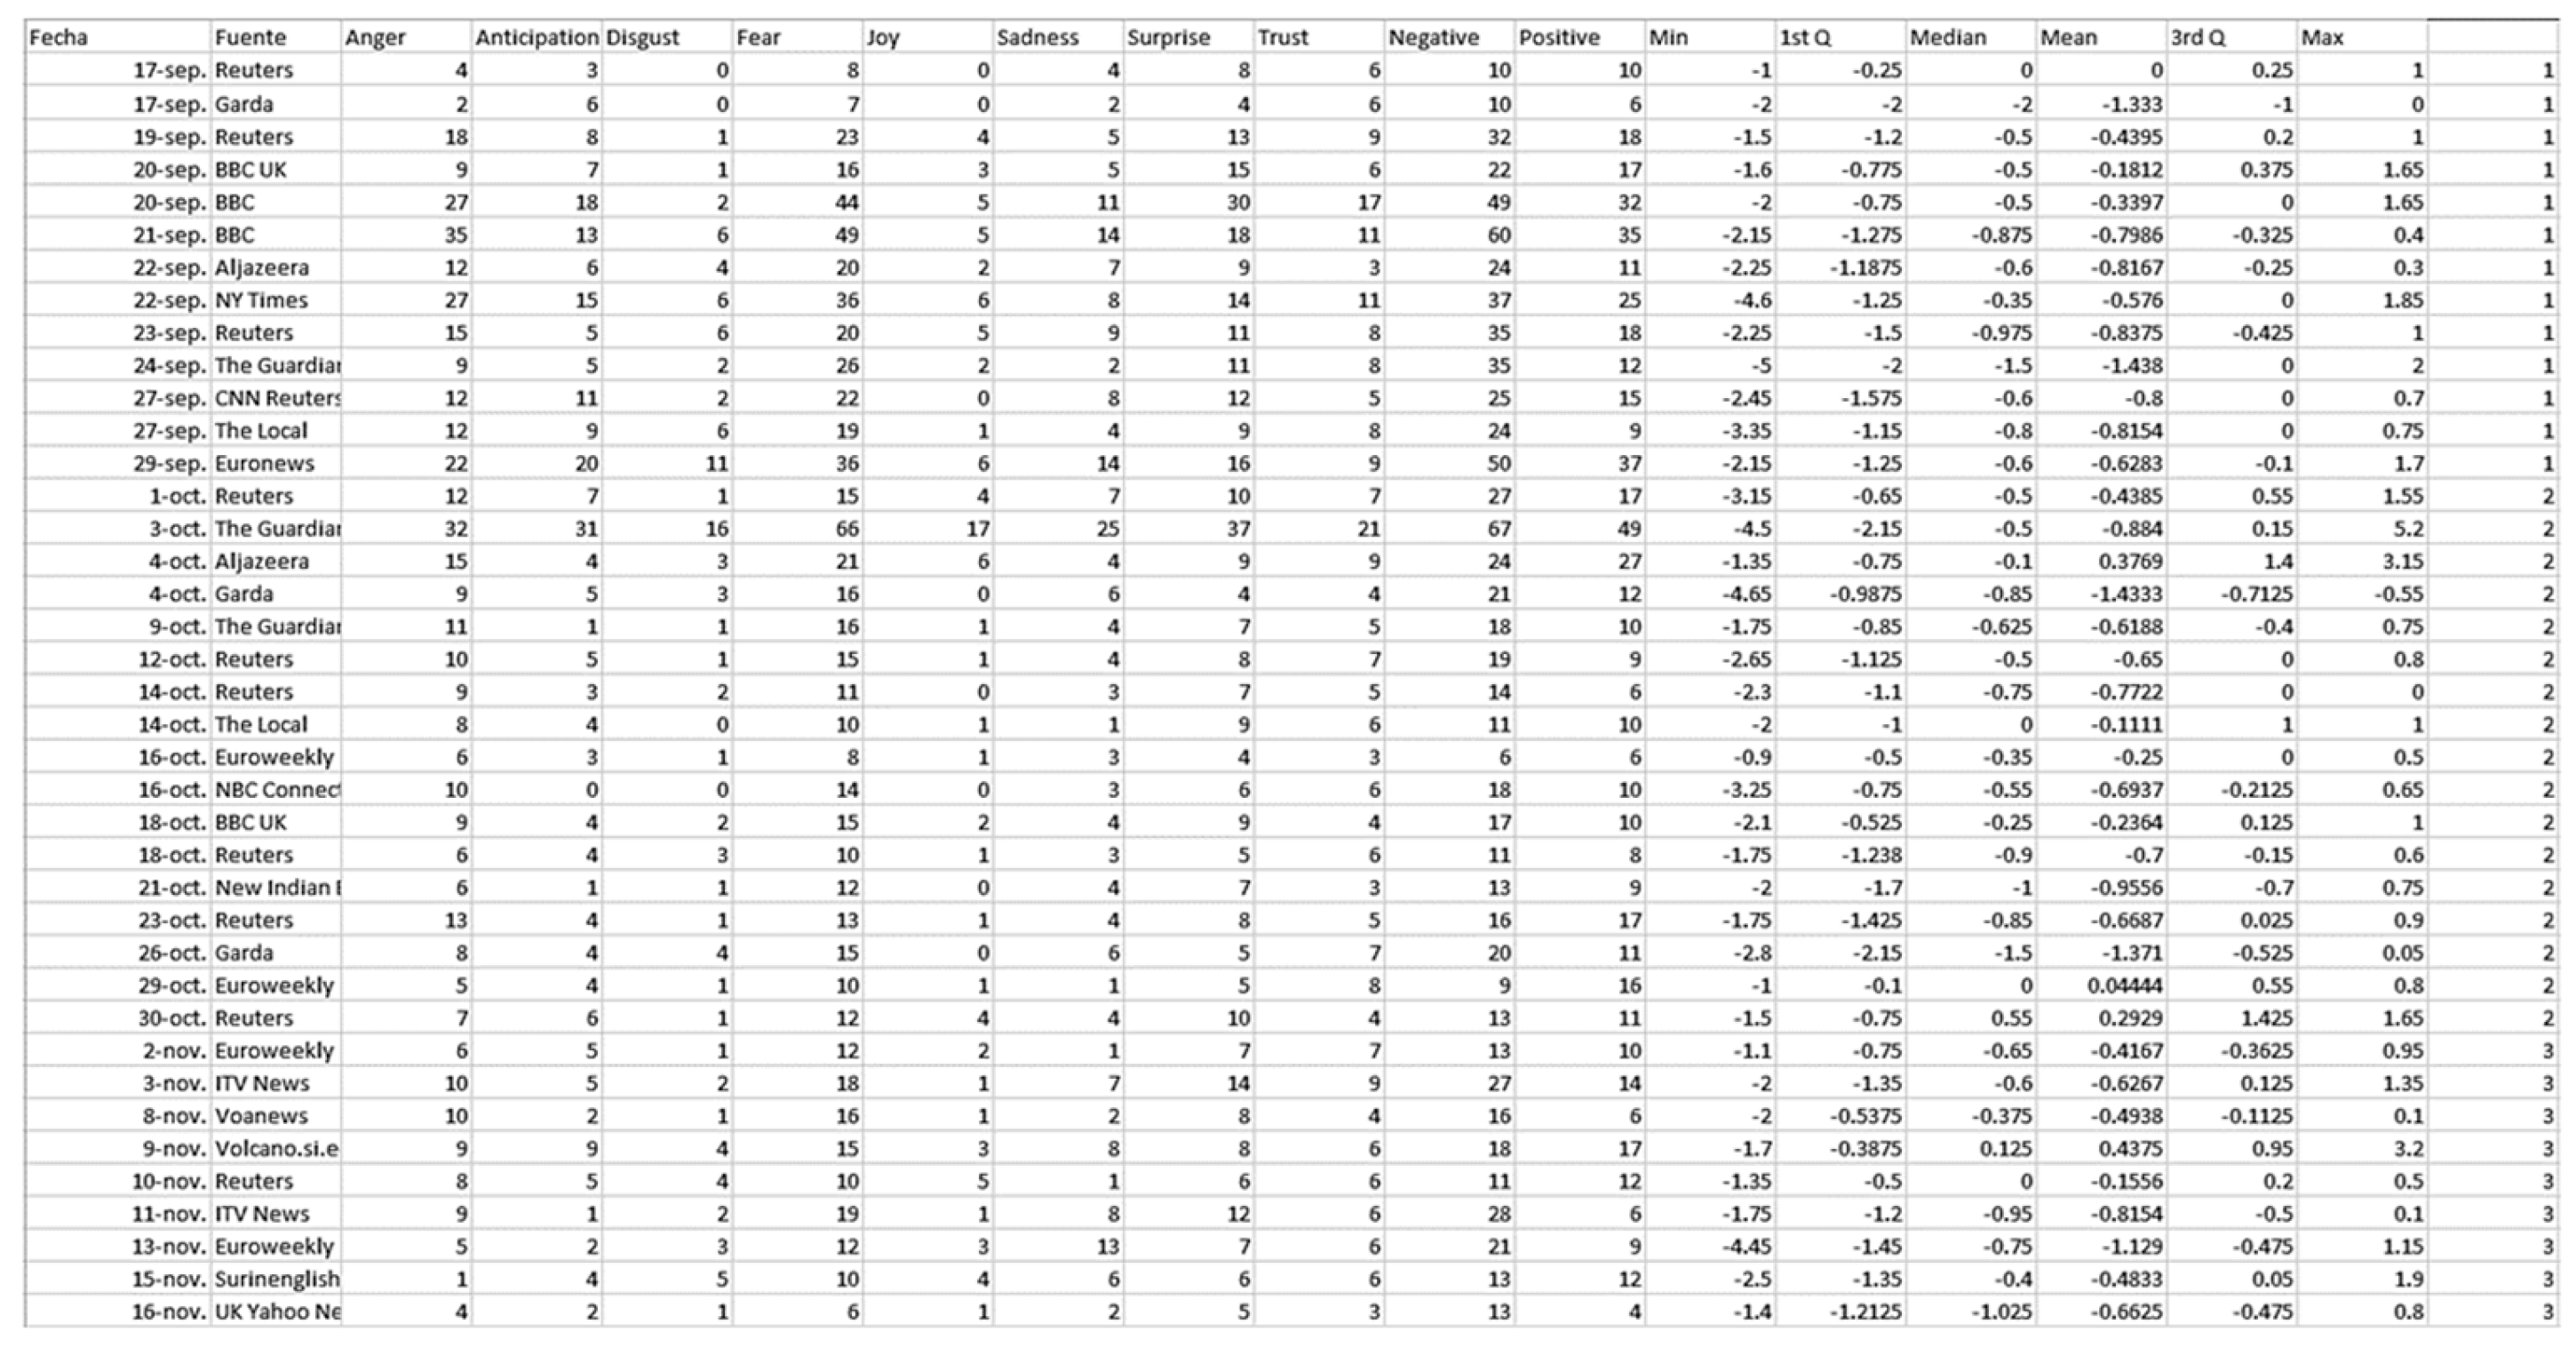
As a result of the application of sentiment analysis to a collection or sample of
N texts, a data or training matrix (
Figure 7) is obtained for the sample of texts analyzed. In this matrix we place in sixteen columns (
j= 1, 2… 16) the predictor values and the texts items in rows (
i= 1…
N).
Since the data matrix is in the present example a training matrix, i.e. we use supervised classification methods, we included a seventeenth column for a group variable labeling the group or cluster number. For instance, in the study (Navarro et al. 2023) which we have chosen to explain the method Xi17 is the group variable. Thus, Xi17=1 for news published in the first month of eruption (September), Xi17=2 for press releases printed in the second month of eruption (October), etc.
2.3. Classification of the Texts
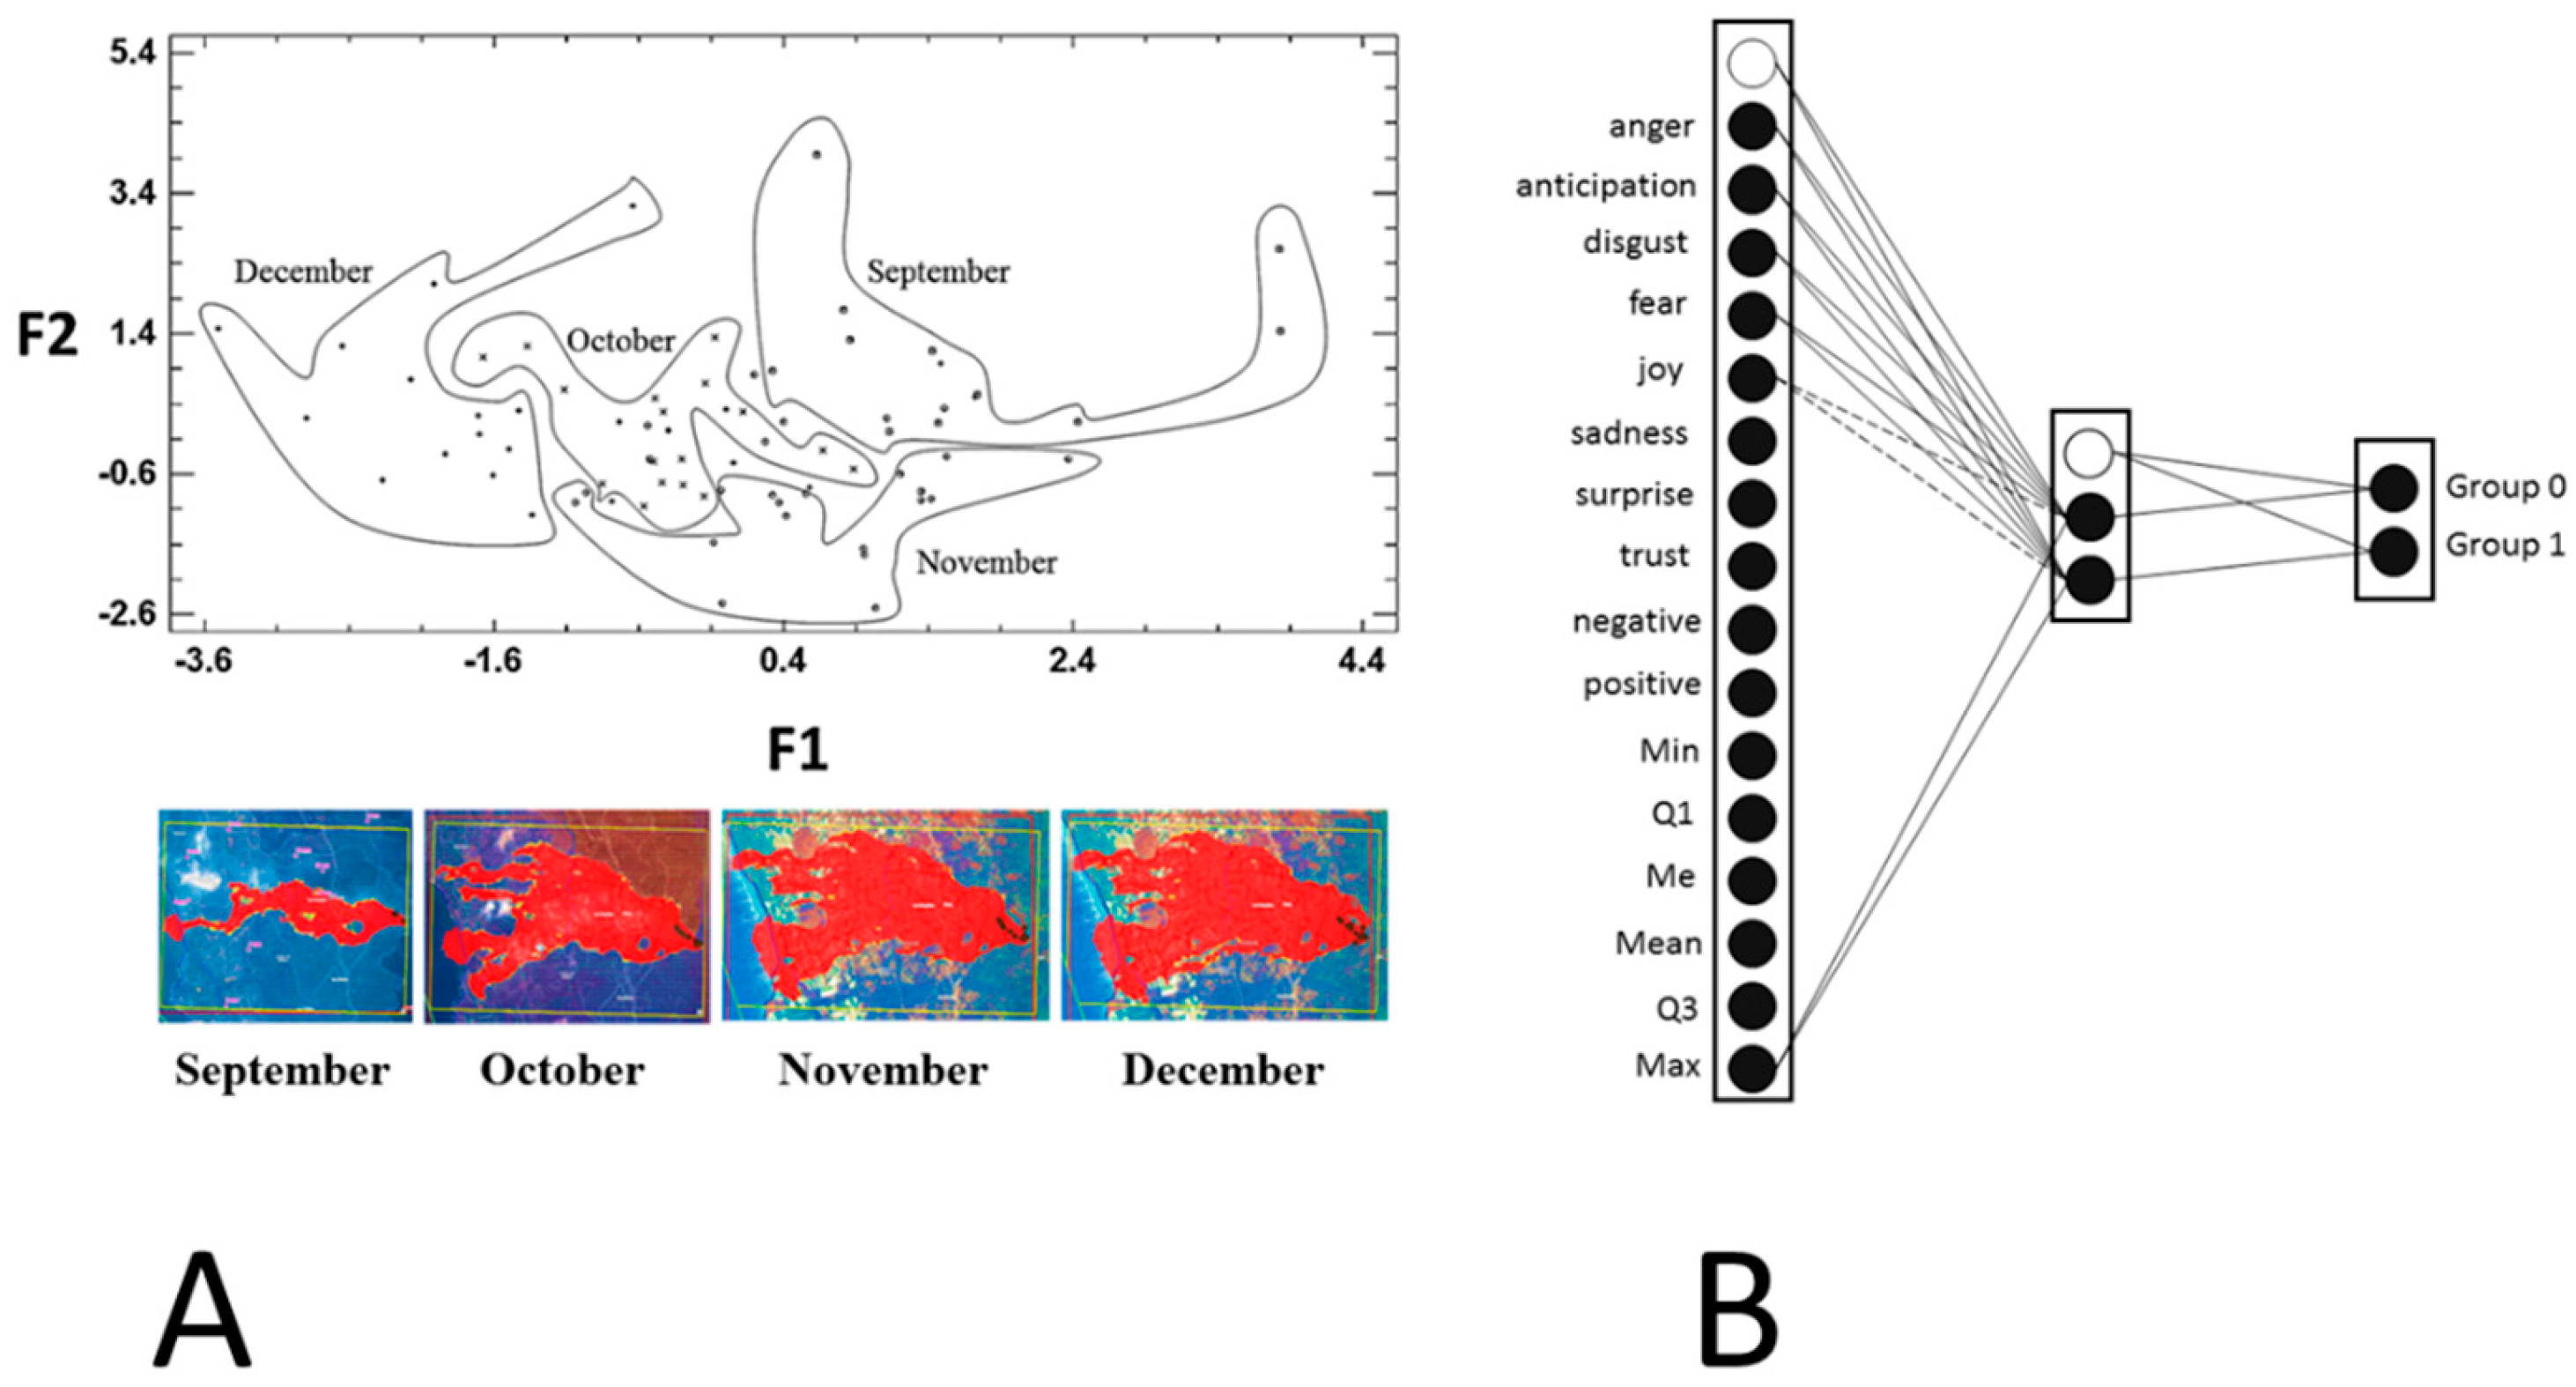
Once the data matrix is obtained, the texts are classified into two or more clusters by applying different multivariate analysis or machine learning techniques (
Figure 8 and
Figure 9). For example, as shown in
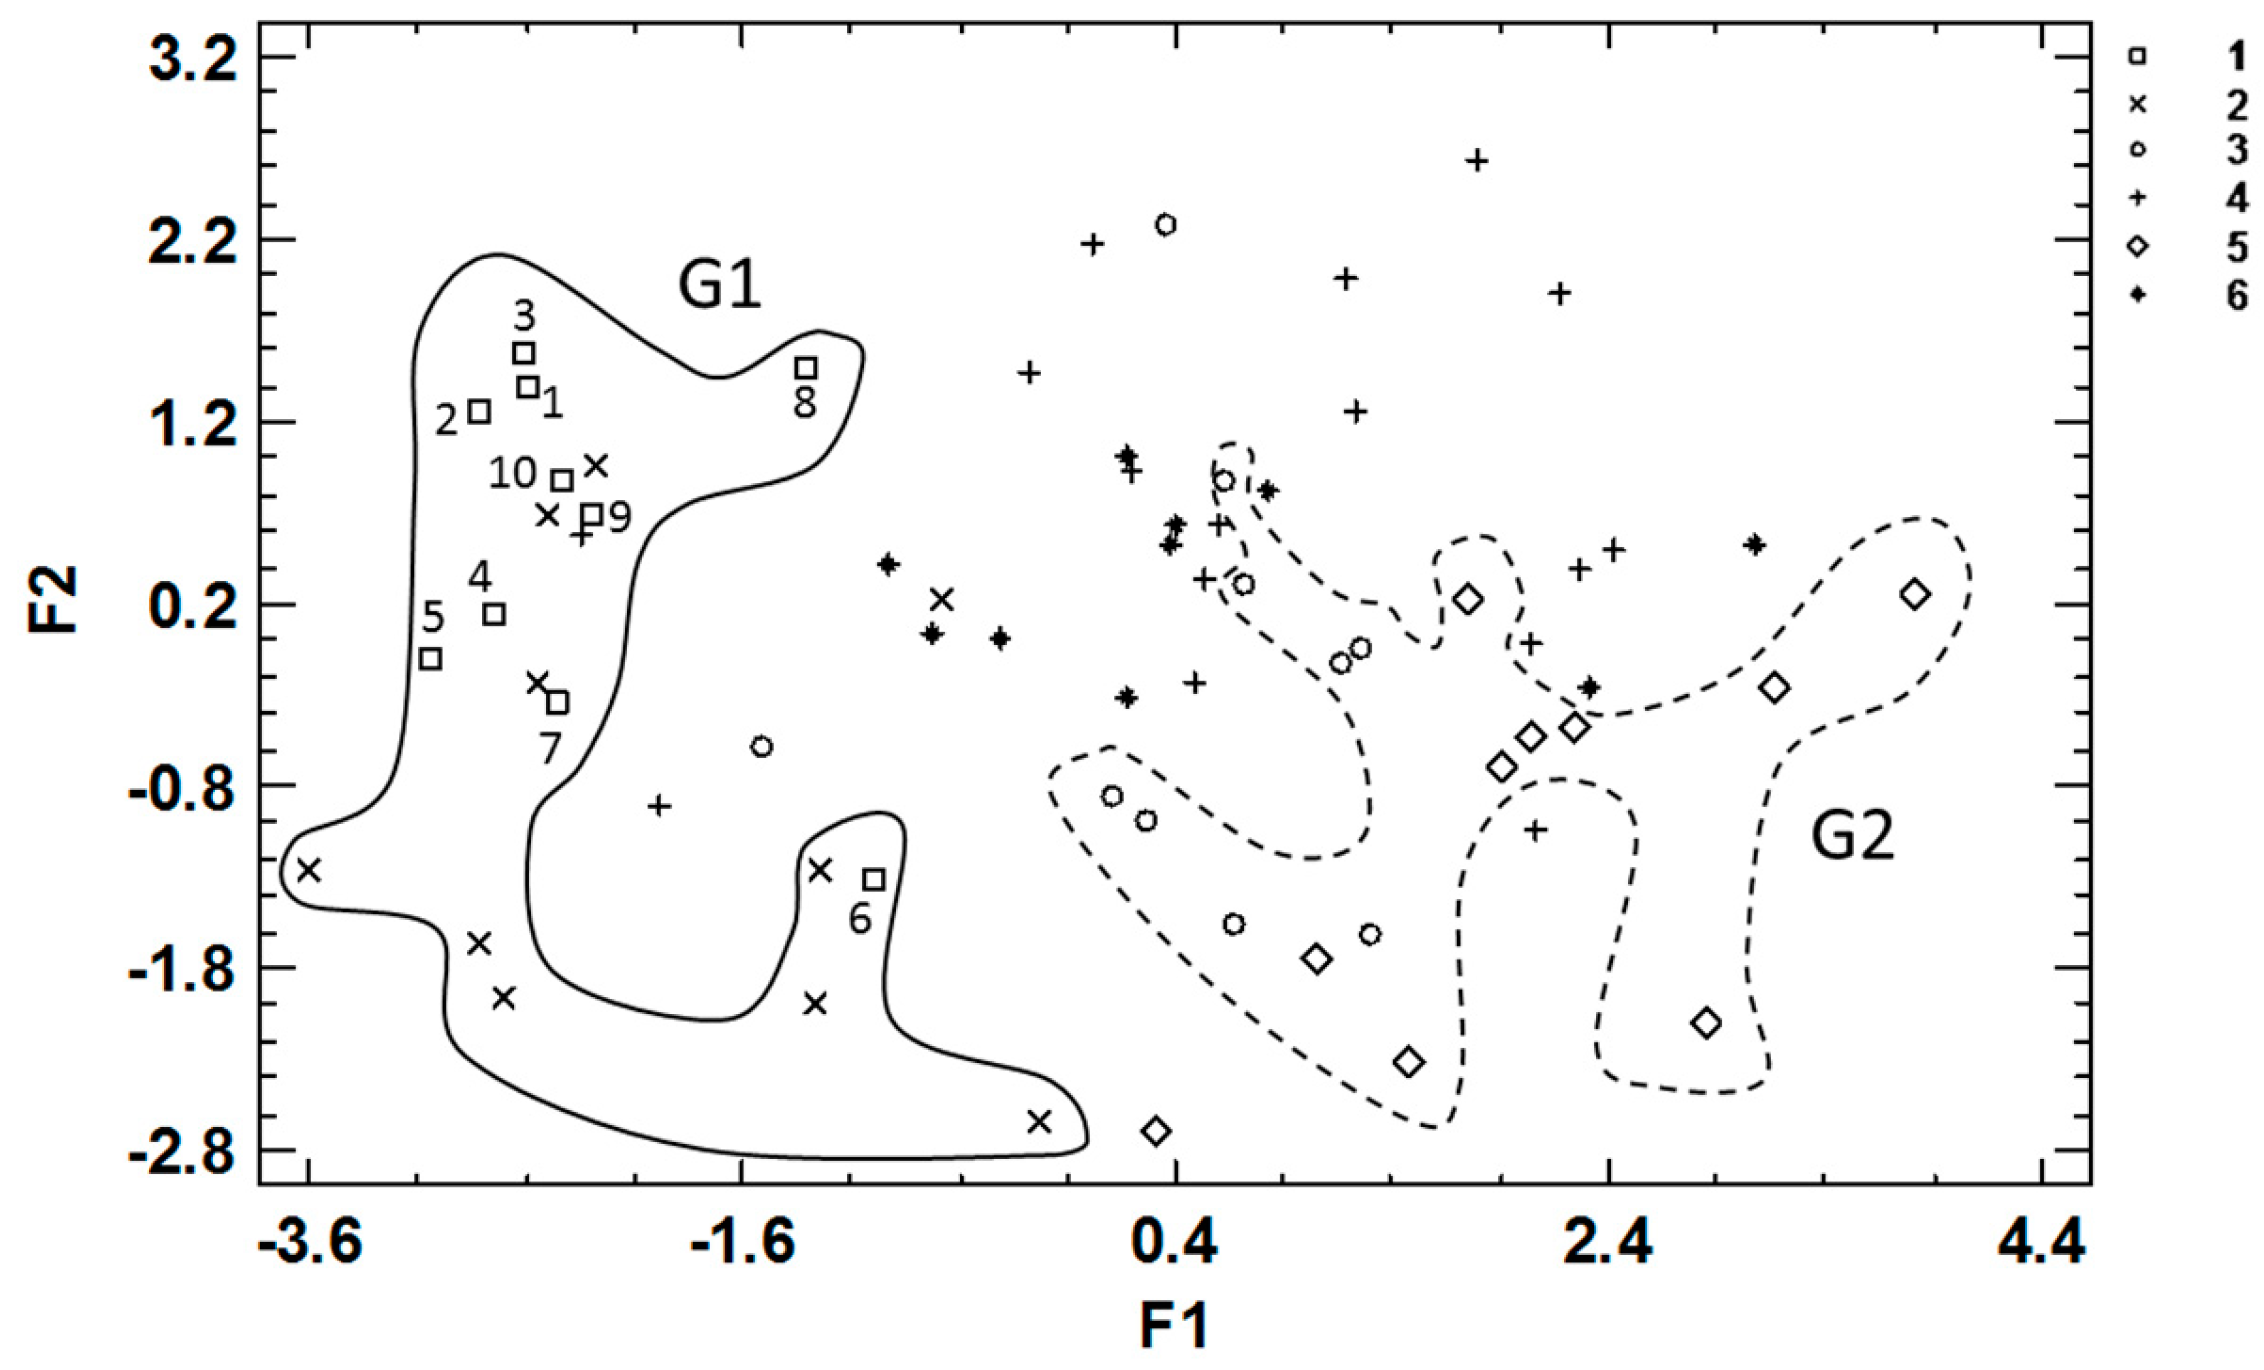
Figure 8, applying discriminant analysis we can classify the news published about the eruption of the Cumbre Vieja volcano in the month in which the news were written and published. Therefore, the combination of two methods, sentiment analysis and discriminant analysis, allowed us to study how the volcanic eruption had an impact on the journalist. Thus, how such a spectacular natural phenomenon could be reflected in the emotions and sentiments expressed in the articles published throughout the months of September, October, November and December.
Similarly, if we train a multilayer perceptron network (MLP) with the data matrix shown in
Figure 7, we can classify the news in two groups or clusters (
Figure 8). A Group 0 representing the first half of the eruption and to which belong the press articles published in September and October, and Group 1 corresponding to the second half of the eruption that includes the articles published in November and December.
Moreover, the classification into two groups of news (Groups 0 and 1) that we have obtained with MLP can also be obtained with a logistic regression model. In the present study the equation of the fitted model was:
with x being equal to:
Obviously other techniques and classification models are available. For instance,
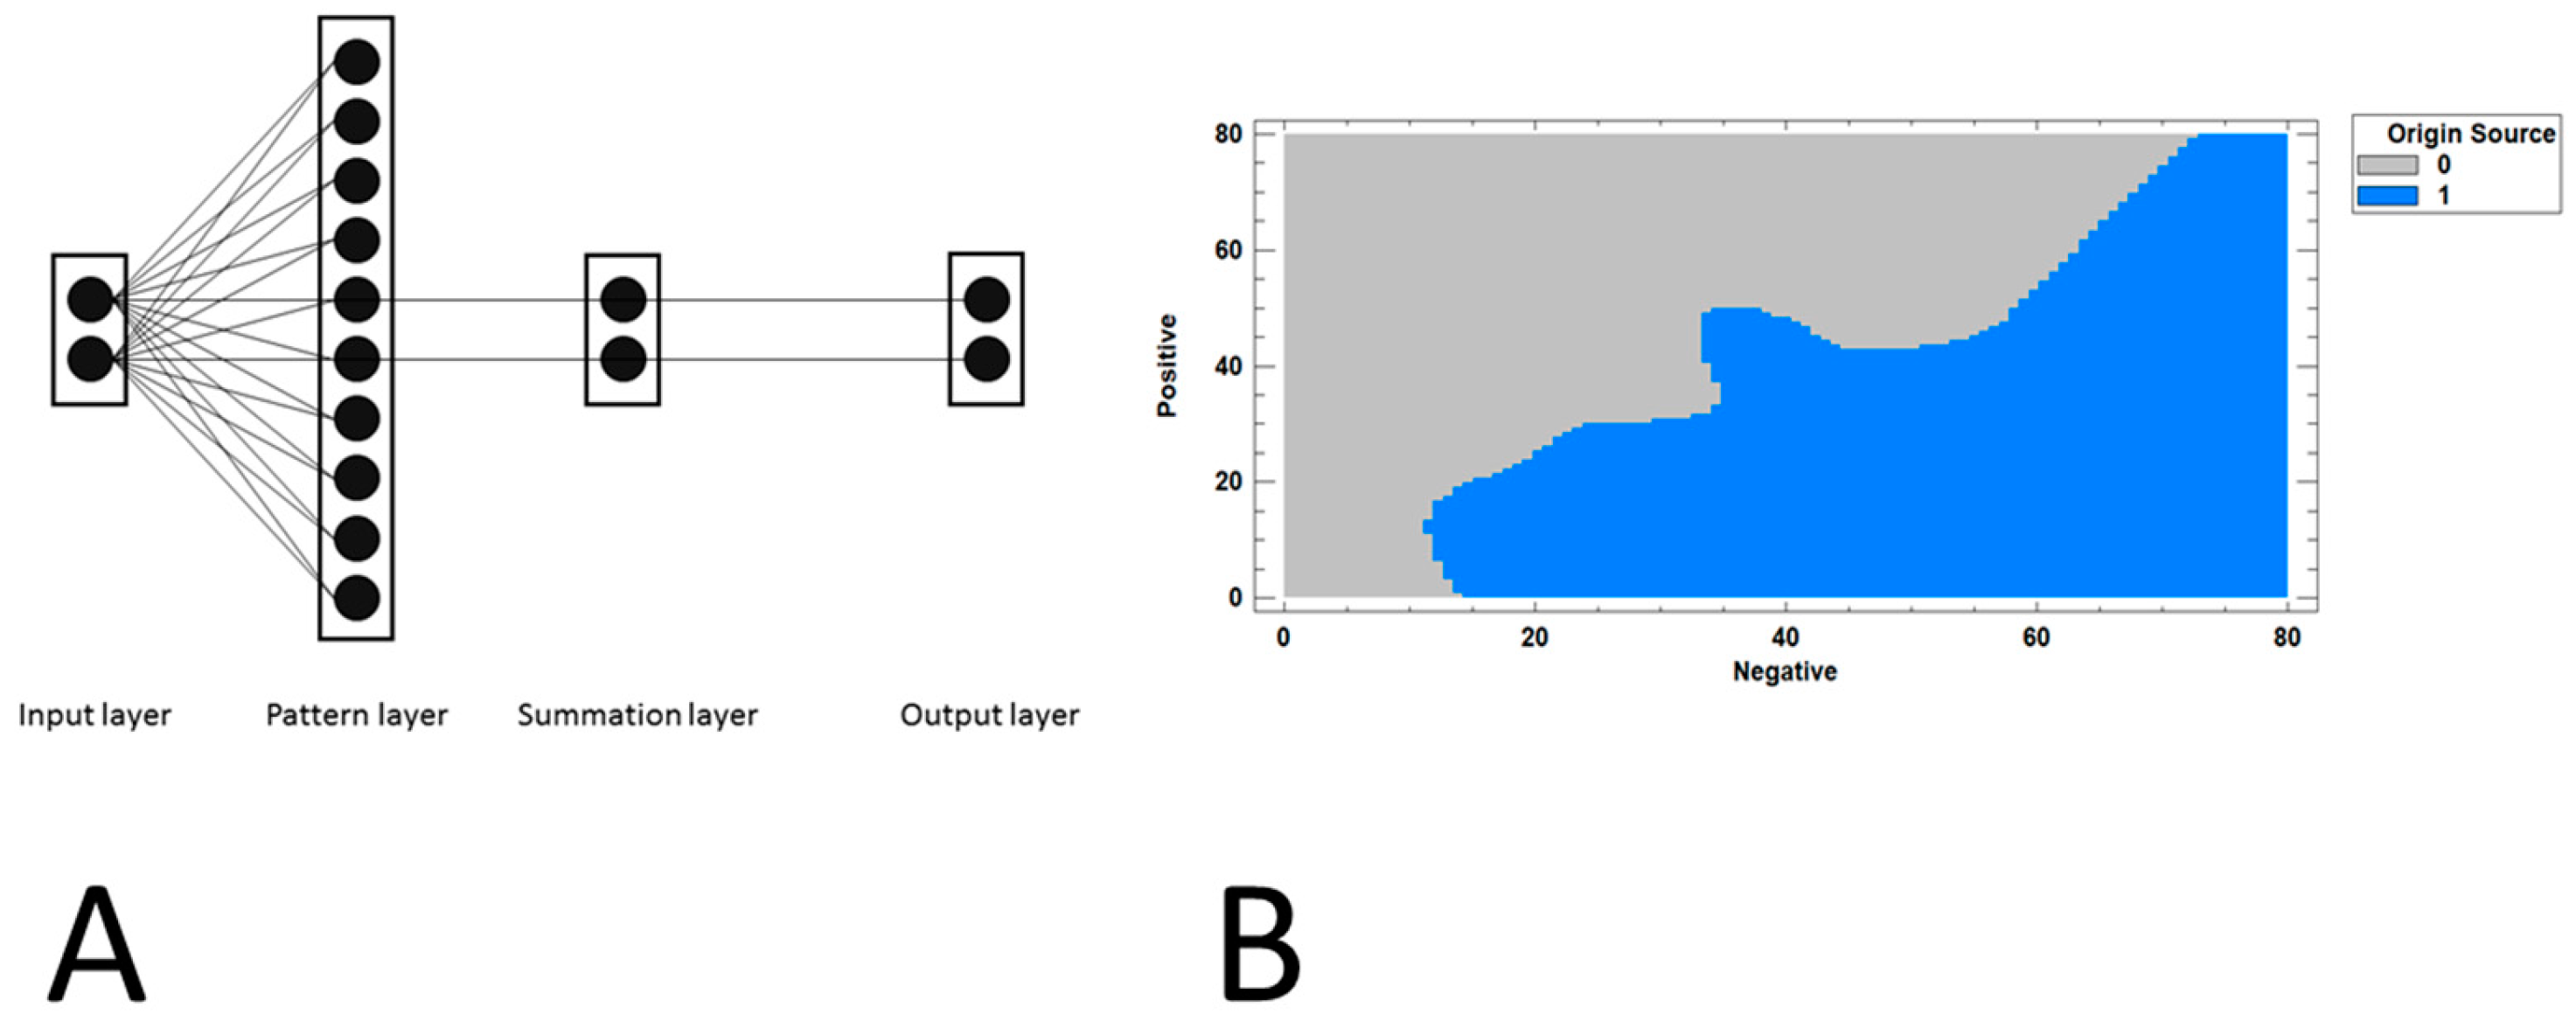
Figure 9 shows a probabilistic neural network (PNN) that was designed to classify the news into two clusters. One cluster for news published in 'English' language for the foreign press, and the other cluster for news published in 'Spanish' for the local press. In contrast to the MLP network the input layer only included two neurons that received as input the value of the positive and negative sentiments, respectively.
Figure 9 shows the classification plot for the PNN, displaying how the region defined by the variables of the input layer, i.e. the prescriptive variables, is split into two areas. Press articles written in Spanish are in the gray region (0) while those written in English are in the blue region (1).
In the examples we have used in this paper, the classification of the texts into two or more groups was performed using the appropriate statistical package. The discriminant analysis, the logistic regression model and the probabilistic neural network were built with the package STATGRAPHICS Centurion 18 version 18.1.12. In addition, the perceptron neural network was trained with the package IBM SPSS Statistics version 22.
The general approach described throughout this article was introduced by (Lahoz-Beltra and López 2021). In this paper we designed a prototype of an empathic chatbot named LENNA. The chatbot held conversations with other bots, and with people. Conversations with people were held in two experimental groups. On the one hand, people who knew the vocabulary used by LENNA, and on the other hand, subjects who were unaware of the vocabulary that LENNA knows and therefore uses in a conversation. Consequently, the data or training matrix was similar to
Figure 7 but in this study rows, i.e. the texts items, were the recorded conversations between LENNA and an interlocutor.
In this study we introduce Shannon entropy to measure the emotional state changes experienced by the chatbot during a conversation, including the entropy values along with the sixteen prescriptive variables. Finally, conducting a discriminant analysis with the resulting data matrix, we obtained the classification of the conversations shown in
Figure 10.
2.3. Complementary Tests
The methodology we have described above allows us to classify a set of texts into two or more groups or clusters using the R script (Lahoz-Beltra 2024), and the procedure described to compose the data matrix that will be the input of the method we use to build the classifier. However, in many practical applications, the classification can be supplemented with some of the following complementary tests.
2.3.1. Fourier Plot of the Story Arc
One of the features to be analyzed in a text is how the number of words expressing positive or negative emotions changes with narrative time. The result of this analysis is a graph representing the emotional valence with respect to story time. In order to be able to compare the graphs of different texts, e.g. two different books, two press articles on the same topic published with different political views, letters written in the past, etc. we used the procedure described in (Jockers 2015). The method involves the application of the Fourier transform to the ‘story arc’ by converting the graph depicting the variation of valence over time into an equivalent graph that is independent of the length of the analyzed text. The application of this technique to (Lahoz-Beltra and López 2021) led us to identify different patterns (
Figure 11) of variation of emotional valence as a function of the narrative time expressed in Fourier terms. Thus, for example, when in a Fourier plot we observe at the beginning a peak expressing positive emotions, concluding the graph with an opposite peak expressing negative emotions, we will conclude that the text was written in the context of what in theatrical language is known as a 'tragedy'. In contrast, if at the beginning of the graph there is a negative peak ending the graph with a positive peak reflecting positive emotions, then the text under analysis is a 'comedy'.
The usefulness of Fourier plot patterns is that they can be dependent on the time when a text was written, a fact that can be tested with a chi-square test of independence (Navarro et al. 2023). These and other Fourier patterns can also be used to assign a grouping variable to each text, defining as many categories of texts as different Fourier patterns we have found. For example, one class or cluster can be assigned to texts with a comedy pattern, and another class or cluster will be used for texts whose story is a tragedy.
2.3.2. Exploratory Analysis
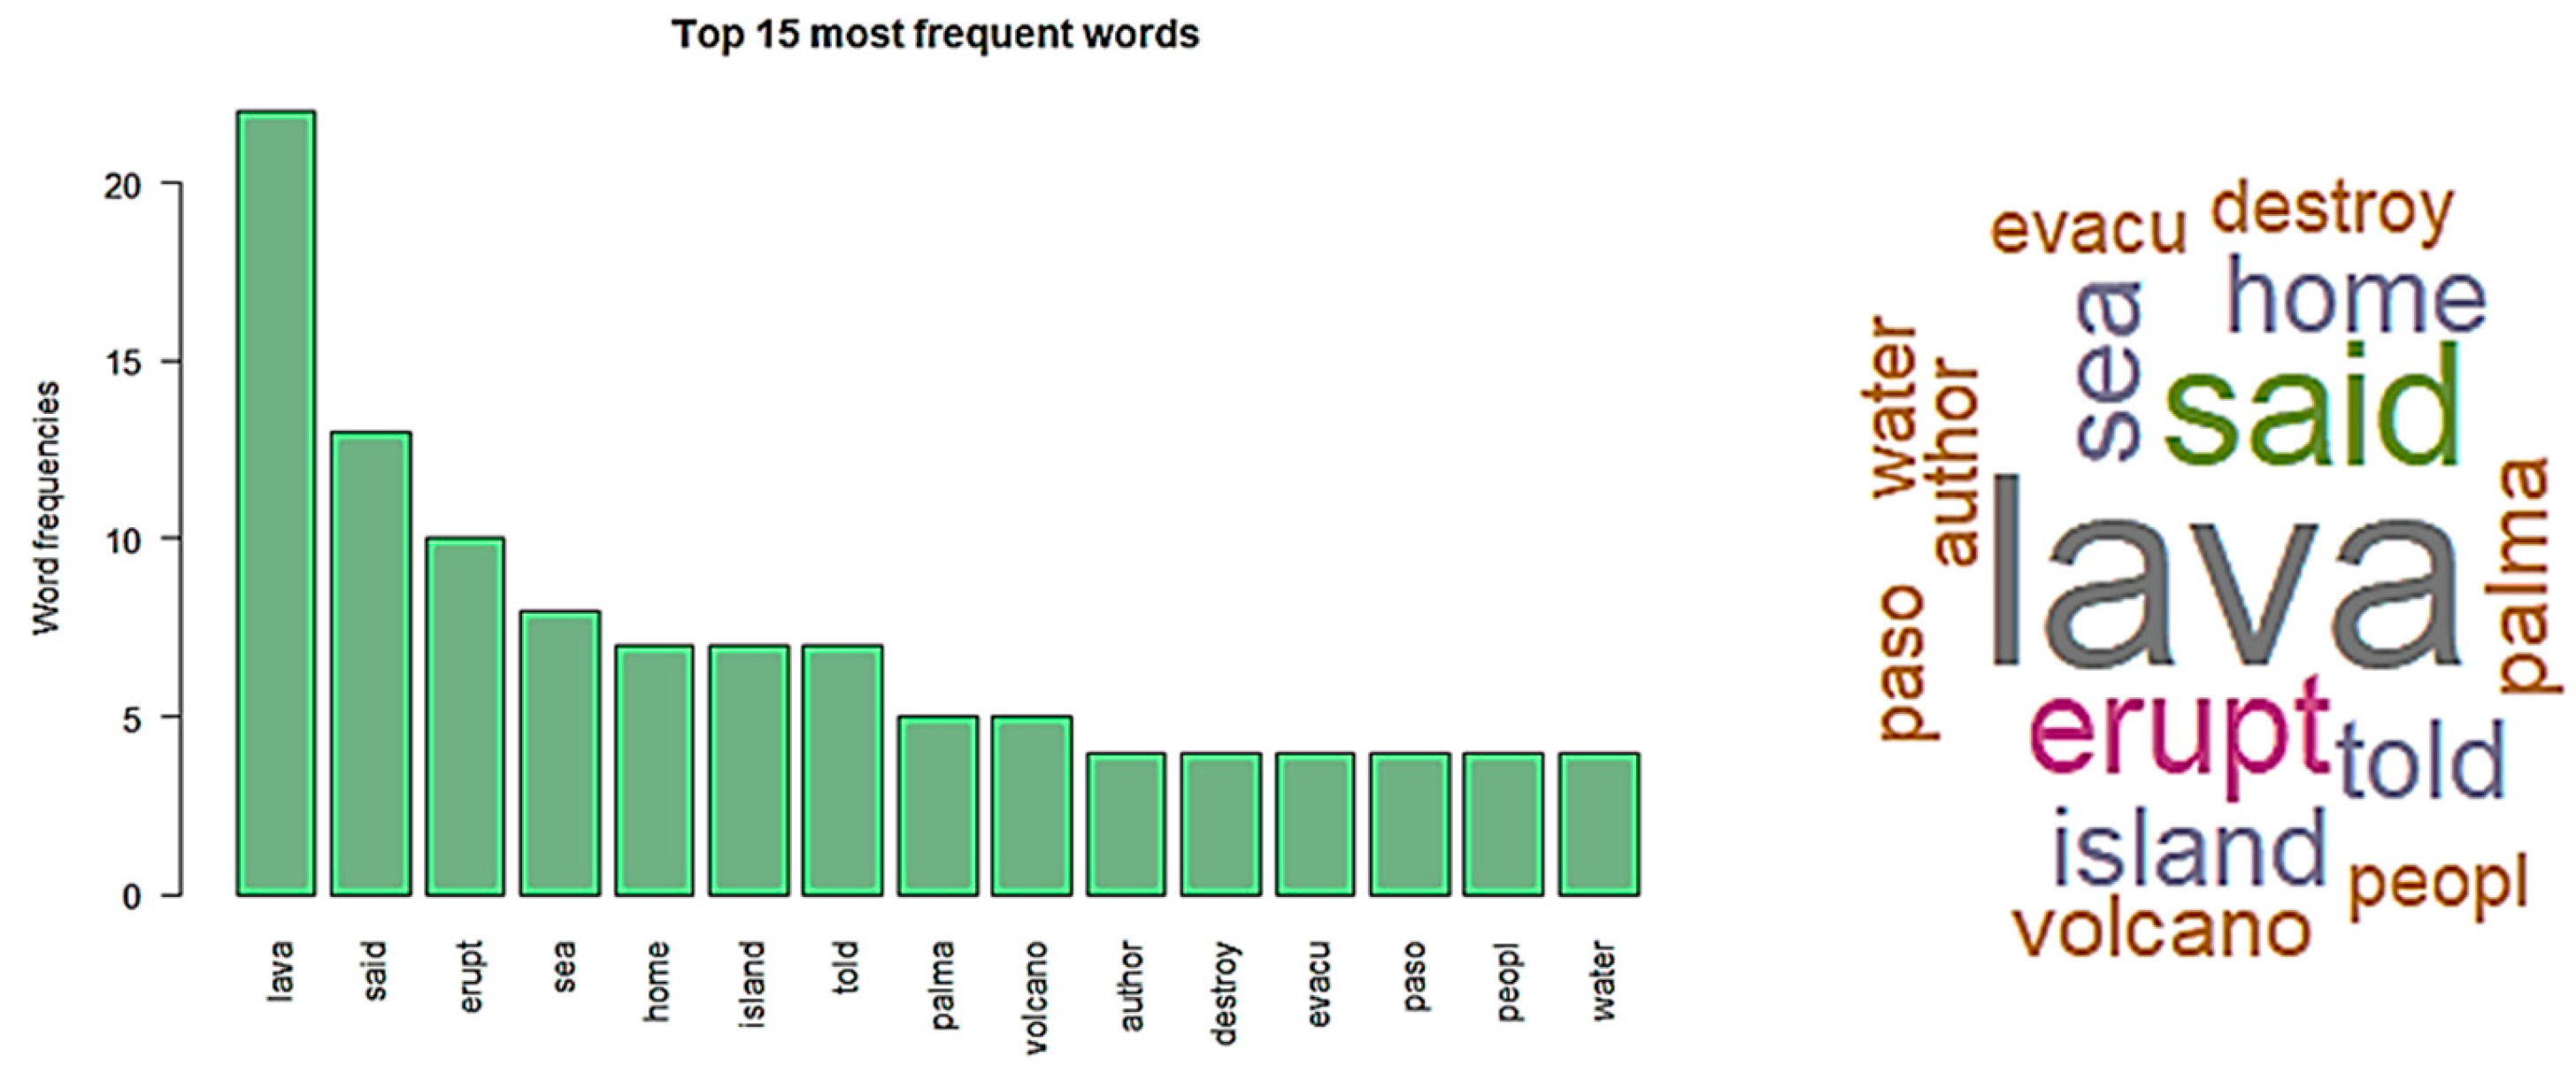
Once the sentiment analysis of each text has been concluded, it may be interesting to obtain the graph of the most frequent words, the word cloud, the bar chart of the percentage of words associated with each emotion, etc. These exploratory techniques (
Figure 12 and
Figure 13) can be helpful when interpreting the results of the sentiment analysis in each text as well as their classification into two or more clusters.
3. Conclusions and Future Research
The methodology described in this paper aims at classifying texts into one or more groups or clusters. In the article we show how to classify a collection of texts using as input of the machine learning technique or multivariate statistical analysis a training matrix constructed from the output of the sentiment analysis conducted with a collection of texts. In our case, the classification technique is supervised, requiring us to previously define the groups or clusters. Once the classifier is obtained, this will allow us to assign an unknown or 'problem' text to one of the groups that have been defined beforehand. Obviously, beyond discriminant analysis or perceptron neural networks, among other classification techniques, there are unsupervised classification methods such as the K-means classifier, hierarchical cluster analysis, Hopfield neural network, etc. Using the output vector of
Figure 6 it is possible to construct a data matrix without a grouping variable, classifying the texts in an unsupervised manner. For example, conducting a hierarchical cluster analysis we could obtain a dendrogram showing the taxonomical relationships among the texts.
Although we have used syuzhet to define the sentiment vector, other definitions for calculating the sentiment value of a paragraph can be used instead, such as bing, afinn, nrc, etc. Now, this implies that the results of conducting sentiment analysis with one or the other may have an effect on the results of the analysis of a text. This issue is reviewed in (Mhatre 2020), (Puschmann and Haim 2019) discussing the differences between one and another definition of sentiment vector due to the way of calculating a sentiment value, which depends on the purpose for which it was designed.
Other interesting issues at the experimental level is for example the use of auxiliary variables such as entropy. In (Lahoz-Beltra and López 2021) we used entropy as a measure of the change of emotions during a conversation. That is, we included entropy (Kozlowski 2024) together with the 16 prescriptive variables obtained from sentiment analysis. In this case we could for example analyze the conversation between a patient suffering from a mental health problem, e.g. depression or after a psychotic break, with a psychiatrist or psychologist. Something very similar to this scenario was simulated in (Lahoz-Beltra and López 2021), classifying the dialogue between two bots, LENNA and another bot called PARRY (Wikipedia contributors 2024), suffering from paranoid schizophrenia. Therefore, we believe that the methodology introduced here could be relevant in psychiatric diagnosis.
Moreover, in (Navarro et al. 2023) we were able to assess the environmental impact of a volcanic eruption by applying a multiple linear regression model. Applying the model we found that the prescriptive variables resulting from sentiment analysis of press news had a stochastic relationship with the surface area occupied by lava.
In summary, the classification of a text by applying the described methodology can be useful in different real-world problems, e.g. diagnosing a health problem through the recorded text of a dialogue, finding out the date on which a given text was written and published, environmental impact studies, etc.
Author Contributions
C.C.L. has collaborated in the Introduction and carried out simulation experiments that were used in her Master of Healthcare Biology 2020–2021, Complutense University of Madrid. J.U.P. performed the sentiment analysis of the 158 press releases about Cumbre Vieja volcano eruption and collaborated in their subsequent classification by applying machine learning and multivariate analysis techniques. The work conducted and the results were used in his undergraduate final project in the Biology Bachelor’s Degree from the Faculty of Biology, Complutense University of Madrid. R.L.-B. devised the general problem, wrote and adapted the R script with which the sentiment analysis was performed, and classified the texts by applying machine learning and multivariate analysis. He supervised the work of the first and second authors, and wrote this paper. All authors have read and agreed to the published version of the manuscript.
Funding
“This research received no external funding”.
Conflicts of Interest
“The authors declare no conflicts of interest.”.
References
- (Bravo-Marquez et al. 2016) Bravo-Marquez, Felipe, Eibe Frank, Saif M. Mohammad, Bernhard Pfahringer. 2016. Determining word-emotion associations from Tweets by multi-label classification. In IEEE/WIC/ACM International Conference on Web Intelligence (WI): 536–539. [CrossRef]
- (Jokkers 2015) Jokkers, Matthew L. 2015. Revealing sentiment and plot arcs with the Syuzhet package. https://www.matthewjockers.net/2015/02/02/syuzhet/ (Accessed on February 16, 2024).
- (Jokkers 2023) Jokkers, Matthew L. 2023. Syuzhet Release 1.0.7. https://cran.r-project.org/web/packages/syuzhet/syuzhet.pdf (Accessed on February 16, 2024).
- (Kozlowski 2024) Kozlowski, Lukasz. 2024. Shannon entropy calculator, https://www.shannonentropy.netmark.pl/ (Accessed on February 16, 2024).
- (Lahoz-Beltra and López 2021) Lahoz-Beltra, Rafael, and Claudia Corona López. 2021. LENNA (Learning Emotions Neural Network Assisted): An empathic chatbot designed to study the simulation of emotions in a bot and their analysis in a conversation. Computers 10(12), 170. [CrossRef]
- (Lahoz-Beltra 2024) Lahoz-Beltra, Rafael. 2024. Script in R for sentiment analysis. figshare. Software. [CrossRef]
- (Mhatre 2020). Mhatre, Sanil. 2020. Text mining and sentiment analysis: Analysis with R. https://www.red-gate.com/simple-talk/da tabases/sql-server/bi-sql-server/text-mining-and-sentiment-analysis-with-r/ (Accessed on February 16, 2024).
- (Mohammad and Turney 2013) Mohammad, Saif M. and Peter D. Turney. 2013. Crowdsourcing a word-emotion association lexicon, Comput. Intell. 29: 436–465. [CrossRef]
- (Mohammad 2024) Mohammad, Saif M. https://saifmohammad.com/WebPages/NRC-Emotion-Lexicon.htm. (Accessed on February 16, 2024).
- (Navarro et al. 2023) Navarro, Jorge, Jesús Urias Piña, Fernando Magdaleno Mas, and Rafael Lahoz-Beltra. 2023. Press media impact of the Cumbre Vieja volcano activity in the island of La Palma (Canary Islands): A machine learning and sentiment analysis of the news published during the volcanic eruption of 2021. International Journal of Disaster Risk Reduction 91, 103694. [CrossRef]
- (Puschmann and Haim 2019) Puschmann, Cornelius and Mario Haim. 2019. Automated content analysis with R https://content- analysis-with-r.com/3-sentiment.html (Accessed on February 16, 2024).
- (Wikipedia contributors 2024) Wikipedia contributors. PARRY. Wikipedia, The Free Encyclopedia. February 3, 2024, 14:24 UTC. Available at: https://en.wikipedia.org/w/index.php?title=PARRY&oldid=1202790115 (Accessed on February 16, 2024).
|
Disclaimer/Publisher’s Note: The statements, opinions and data contained in all publications are solely those of the individual author(s) and contributor(s) and not of MDPI and/or the editor(s). MDPI and/or the editor(s) disclaim responsibility for any injury to people or property resulting from any ideas, methods, instructions or products referred to in the content. |
© 2024 by the authors. Licensee MDPI, Basel, Switzerland. This article is an open access article distributed under the terms and conditions of the Creative Commons Attribution (CC BY) license (http://creativecommons.org/licenses/by/4.0/).
