Preprint
Article

Genetic Variability and Genetic Differentiation of Populations in the Carpet Shell Clam (Ruditapes decussatus) Based on Intron Polymorphisms

Altmetrics

Downloads

74

Views

39

Comments

0

A peer-reviewed article of this preprint also exists.

This version is not peer-reviewed

Submitted:

29 February 2024

Posted:

04 March 2024

You are already at the latest version

Alerts
Abstract
The grooved carpet-shell clam is one of the most economically relevant shellfish species living in the Mediterranean and nearby Atlantic coasts. Previous studies using different types of genetic markers showed a remarkable genetic divergence of the Eastern Mediterranean, Western Mediterranean and Atlantic populations, but important details remained unclear. Here, data from six nuclear introns scored for restriction fragment size polymorphisms in eight populations that have not been studied before have been pooled for the analysis with data scattered through three previous studies, totaling 32 samples from 29 locations. The results show lower levels of heterozygosity, higher mean number of alleles, and alleles with restricted distribution in the Mediterranean populations, suggesting the existence of a large isolated population in the eastern Mediterranean at the middle Pleistocene. The data also confirm the similarity of populations from Tunisia to western Mediterranean populations. Finally, a genetic mosaic is apparent in the Atlantic coasts of the Iberian Peninsula, with a divergence of Rias Baixas populations from more northern populations and Central Portugal populations. The effects of oceanic fronts, seasonal upwellings, river plumes and/or fishery management operations could explain this and other features of the Atlantic populations.
Keywords: 
Subject: Biology and Life Sciences  -   Aquatic Science

1. Introduction

The grooved carpet shell clam (Ruditapes decussatus) lives in estuaries, lagoons and tidal flats along the coasts of the Northwest Atlantic Ocean and the Mediterranean Sea. It is one of the main commercial clam species native to this area. However, catches have decreased along this century in the European fishing grounds due to overfishing, recruitment failure, and mortality [1,2,3]. Clam fishery management practice has changed with the time. In the second half of the past century, when the market grew, spat was collected and translocated to areas were the environment favored survival and growth. In the 1970’s, overfished stocks in Spain were replenished with juveniles taken in wild populations from other regions or other countries. European regulations now set limits to daily catches and a minimum size at harvest. Since the 1990’s bivalve hatcheries have been producing clam juveniles, especially in France, Spain and Italy, making hatchery seed available for population restocking and grow-out in licensed coastal areas. These developments in management have raised an interest on the genetic aspects of wild and captive populations.
One of the tools to refine the management is the knowledge of the species’ population genetic structure. The population genetic data for R. decussatus are spread across several publications, each based on a handful of populations, often restricted to particular regions, and based on different types of genetic markers (protein polymorphisms, sequences of mitochondrial DNA fragments, restriction fragment length polymorphisms of introns in nuclear genes, and microsatellites), which, all together, make it difficult to reach general conclusions. Early studies based on protein polymorphisms indicated a high level of genetic variability and a low genetic differentiation of the populations [4,5]. With the availability of DNA-based genetic markers and increased population sampling, it was possible to detect a remarkable genetic differentiation among wide regions along the distribution range of the species. Using sequences of the mitochondrial cytochrome oxidase I gene (COI), and restriction fragment length polymorphisms in sequences of introns of six genes, Cordero et al. reported a phylogeographic break (a sharp change in the sequences that appear in a DNA phylogeny between two or more geographic regions) located between the Western Mediterranean Sea and the Adriatic and the Aegean seas [6]. The genetic structure reported by Cordero et al. from the mitochondrial marker was corroborated later by Sanna et al. [7]. Cordero et al. also reported a strong genetic differentiation between the populations located on the Atlantic coasts of southern Europe and the Western Mediterranean Sea, but only for the intronic markers. The intronic markers also showed the strong differentiation between the populations in the eastern and western basins of the Mediterranean Sea. The pattern of differentiation between Atlantic populations and West and East Mediterranean populations has been reported in many species and is usually interpreted as the result of a secondary contact between an Atlantic and Mediterranean subpopulations that were separated once or more times in the Pleistocene, when the sea level dropped because of the glaciations, cutting the connection between the Atlantic Ocean, the West Mediterranean Sea and the East Mediterranean Sea. Present day oceanographic features such as the Almeria –Oran oceanographic front (AOOF) (Figure 1) and the patterns of marine circulation past the Siculo-Tunisian Strait are thought to contribute to the persistence of the genetic differentiation[8,9]. The effect of natural selection could favor the coincidence of allele frequency changes with oceanographic barriers[10,11].
The study of microsatellite markers in grooved carpet-shell clam populations from the Spanish Atlantic and Mediterranean coasts by Arias-Pérez et al. confirmed the genetic differentiation between the Atlantic and West Mediterranean populations, and suggested the genetic differentiation of the populations living in the central and northern Atlantic façade of the Iberian Peninsula with respect to those from the Bay of Biscay and the SW of the Iberian Peninsula [12]. Gharbi et al. studied 12 populations from Tunisia using sequences of COI and the internal transcribed spacers of the ribosomal RNA genes (ITS), and found little differentiation between populations [13]. Later, in a study focused on Atlantic Spanish and Portuguese coasts using microsatellites, Cruz et al. discovered an increased genetic differentiation of two populations located in the coasts of central Portugal, with respect to those from Rias Baixas and Bay of Biscay (including one population from Rias Medias) [14]. Finally, Saavedra et al. scored four populations for intron polymorphisms, including one in southern France, an area that had not been studied before with nuclear markers, where they found alleles typical of the Eastern Mediterranean in very low frequency [15].
There are several aspects of the previous studies that require more detailed scrutiny. Here we will deal with three of them. Firstly, Cordero et al. found a strong genetic differentiation between the Eastern and the Western Mediterranean basins. This is a common observation in genetic studies of populations of many species of marine organisms [8,9,10]. However, in the study by Cordero et al. only populations from the northern coasts of the eastern Mediterranean (Adriatic and Aegean seas) were included. The observation of the Tunisian population joining the western Mediterranean populations in several analyses suggests that northern African populations could be more related to the western Mediterranean populations than to the Aegean and Adriatic ones. Therefore, it remains to be clarified if the clam populations from the southern part of the Eastern Mediterranean (Africa) are more similar to their western or to their northern counterparts. A second finding reported by Cordero et al., which is related with the previous one, was that the single population from Tunisia included in their study clustered with the Western Mediterranean populations, and Gharbi et al. found that populations from the northern and the eastern coasts of Tunisia did not differ markedly in the frequencies of COI and ITS haplotypes [6,13]. This is in contrast to the majority of studies of other species, which usually report a genetic break placed at the Siculo –Tunisian strait (Figure 1), with the populations on the eastern coasts of Tunisia clustering with other Eastern Mediterranean populations [e.g.: references [16,17]. As the result reported by Cordero et al. from a single Tunisian population could be due to sampling artifacts or to the introduction of clams from the Western Mediterranean in the sampled locality by ballast waters or for population restocking, additional sampling in Tunisia is necessary to corroborate that finding. Finally, the findings by Arias-Pérez et al. and Cruz et al. of a mosaic of genetically differentiated areas in central and N Portugal, and in the estuaries of NW Spain, is especially important, as it affects one of the regions where exploitation of the species is most intensive. From the point of view of fisheries management, it is therefore very interesting to know in more detail the pattern of genetic differentiation in that area and their potential causes.
The goals of this study are to clarify the aspects referred to above, and to provide a comprehensive and up to date report of the genetic structure of Ruditapes decussatus populations and its potential causes, based on a much larger number of populations than those considered so far. We present restriction fragment length polymorphism (RFLP) new data of six introns in seven populations from NW Spain, Portugal, Tunisia and Egypt that had not been studied before. For the analysis, these data have been pooled with those collected in our previous works [6,12,15], totaling 32 samples from 29 locations distributed from the Eastern Mediterranean to NW France. This approach has led to the discovery of new aspects of the genetic structure of the clam that had remained hidden due to the limited geographic sampling of previous studies, which may be important for the management of the species’ genetic resources in fisheries and aquaculture.

2. Materials and Methods

2.1. Clam Sampling and DNA Extraction

Eight new locations from Spain (2), Portugal (3), Tunisia (2) and Egypt (1) have been sampled for this study (Figure 1 and Table 1). Clams from most locations were obtained from local fishermen and transported live to the IATS-CSIC facilities. Animals were euthanized and tissues of three organs (mantle, siphons, gills) were preserved in ethanol 90%. The samples from Egypt (EM4) and Tunisia (WM4 and WM6) were sent to the IATS as a piece of mantle or siphons preserved in ethanol. DNA extraction was performed by using the EZNA Mollusc DNA extraction kit (Omega Bio-tek) following the protocol of the manufacturer. DNA quality and concentration were checked with agarose gel electrophoresis and by using a NanoDrop instrument. After extraction, DNA was kept frozen at -20 ⁰C until further use.

2.2. Intron Amplification and DNA Polymorphism Detection

The methods for amplification of the introns and restriction fragment length-polymorphism detection were exactly the same used in our previous studies [6]. Six introns from different genes were amplified in an Applied Biosystems GeneAmp PCR System 9700 thermocycler using intron-specific primer pairs, and the digestion of the PCR products was conducted with a single restriction enzyme. DNA fragments were separated in an agarose gel and stained with GreenSafe Premium (Nzytech), and photographed under UV light. Individuals of known genotypes from previous studies were run together with the newly scored samples as controls. Fragment sizes were estimated by comparison with the NZYDNA Ladder III (Nzytech). Samples showing low frequency alleles or potentially new alleles were amplified, digested and run again all together at the end of the study to check for identical or different RFLP patterns.

2.3. Data Analysis

The data obtained from the eight new populations were pooled with those from our previous studies [6,12,15]. Table 1 gives the list of all localities, and the acronyms employed in the original references and along this paper. This population set includes 29 locations, and 32 population samples, as three locations have been sampled twice, in different years. Four populations come from the Eastern Mediterranean, eight form the Western Mediterranean and 20 from the Atlantic coasts. Allele and genotype frequencies were calculated with the software Genepop 4.8.3 [18]. The goodness-of-fit test to the Hardy-Weinberg proportions was carried out with the software Arlequin ver. 3.11 [19,20]. Deviations from the expected Hardy-Weinberg equilibrium proportions was measured with the statistics FIS in each population, which was estimated by means of GenPop 4.8.3 program [18]. Statistical differences in allele frequencies among populations were tested with an exact G test in GenPop 4.8.3. Null alleles were detected at some loci and the allele frequencies were calculated by applying the correction derived from the Ramdom Mutation Model [21,22] with the software INEst [23]. FST was used to measure the amount of differentiation in different geographic regions and between pairs of populations. The statistical significance for the null hypothesis of FST = 0 was carried out by using a non-parametric permutation approach run for 20000 replicates [24]. A hierarchical analysis of F –statistics was employed to estimate the amount of genetic differentiation among populations within regions, and among regions within the total area sampled. All F-statistics were estimated using the AMOVA routine in Arlequin with the option Locus by locus with the distance method Pairwise differences. AMOVA results are given as a weighted average F-Statistics over all loci.
FST values between pairs of populations were used to construct a neighbor-joining tree [25] with the software MEGA X [26].
A Bayesian analysis of genetic structure was also carried out using the software STRUCTURE version 2.3.3 [27]. The genotypic data of populations was analyzed under an admixture model of correlated allele frequencies among populations [28]. Sampling locations were assumed as a prior information. Data were analyzed with clustering models from K=1 to K=10, with 10 replicates of 400000 iterations and previous burn-in of 300000 each one. Results from STRUCTURE were processed with CLUMPP and DIStruct, and a graphical image of ancestral gene clusters were generated [12,13]. The number of clusters that best explained the data were determined by computing the posterior probability of K supported by the estimates of the posterior probabilities of the data P(X|K) following Pritchard et al. [27], and the maximum posterior probability differences (ΔK) of contiguous K obtained by the Delta method of Evanno et al. [29].

3. Results

3.1. Newly Sampled Populations

Seventeen to 59 individuals were scored in each locality (median = 42). Allelic frequencies, heterozygosity, deviations from Hardy-Weinberg equilibrium (FIS) and sample sizes are shown in Table S1 and Figure S1 (Supplementary Materials), together with those from all populations from previous studies. No new RFLP alleles were found in the new locations. All loci were polymorphic in all populations with the exception of Fas in the Egyptian population EM4. Average heterozygosity showed similar levels as in previous studies. Nine out of 65 tests for Hardy- Weinberg equilibrium were significant, in all cases due to a deficit of heterozygotes (positive values of FIS). Significant heterozygote deficiencies were concentrated at locus Ech, where a null allele is segregating over the whole studied area [6]. Cordero et al. [6] found that most intronic alleles were present in the majority of the populations, but four showed geographic restricted distributions, either to the Mediterranean (Ech-3) or to the Adriatic and Aegean seas (Ech-4 and TBP-3). Later, Arias-Perez et al. found Ech-3 in an Atlantic population in very low frequency [12]. In this study one individual carrying the Ech-3 allele was found in the Atlantic population AT4. In previous studies there were two private alleles (TBP-4 in WM5, and TBP-5 in AT5) (Table S2, Supplementary Materials). Allele TBP-4 has been found in the new Egyptian population EM4 (2 individuals), so it is no longer a private allele, but an allele restricted to the southern Mediterranean.

3.2. Analysis of the Pooled Set of Populations

3.2.1. Genetic Variability

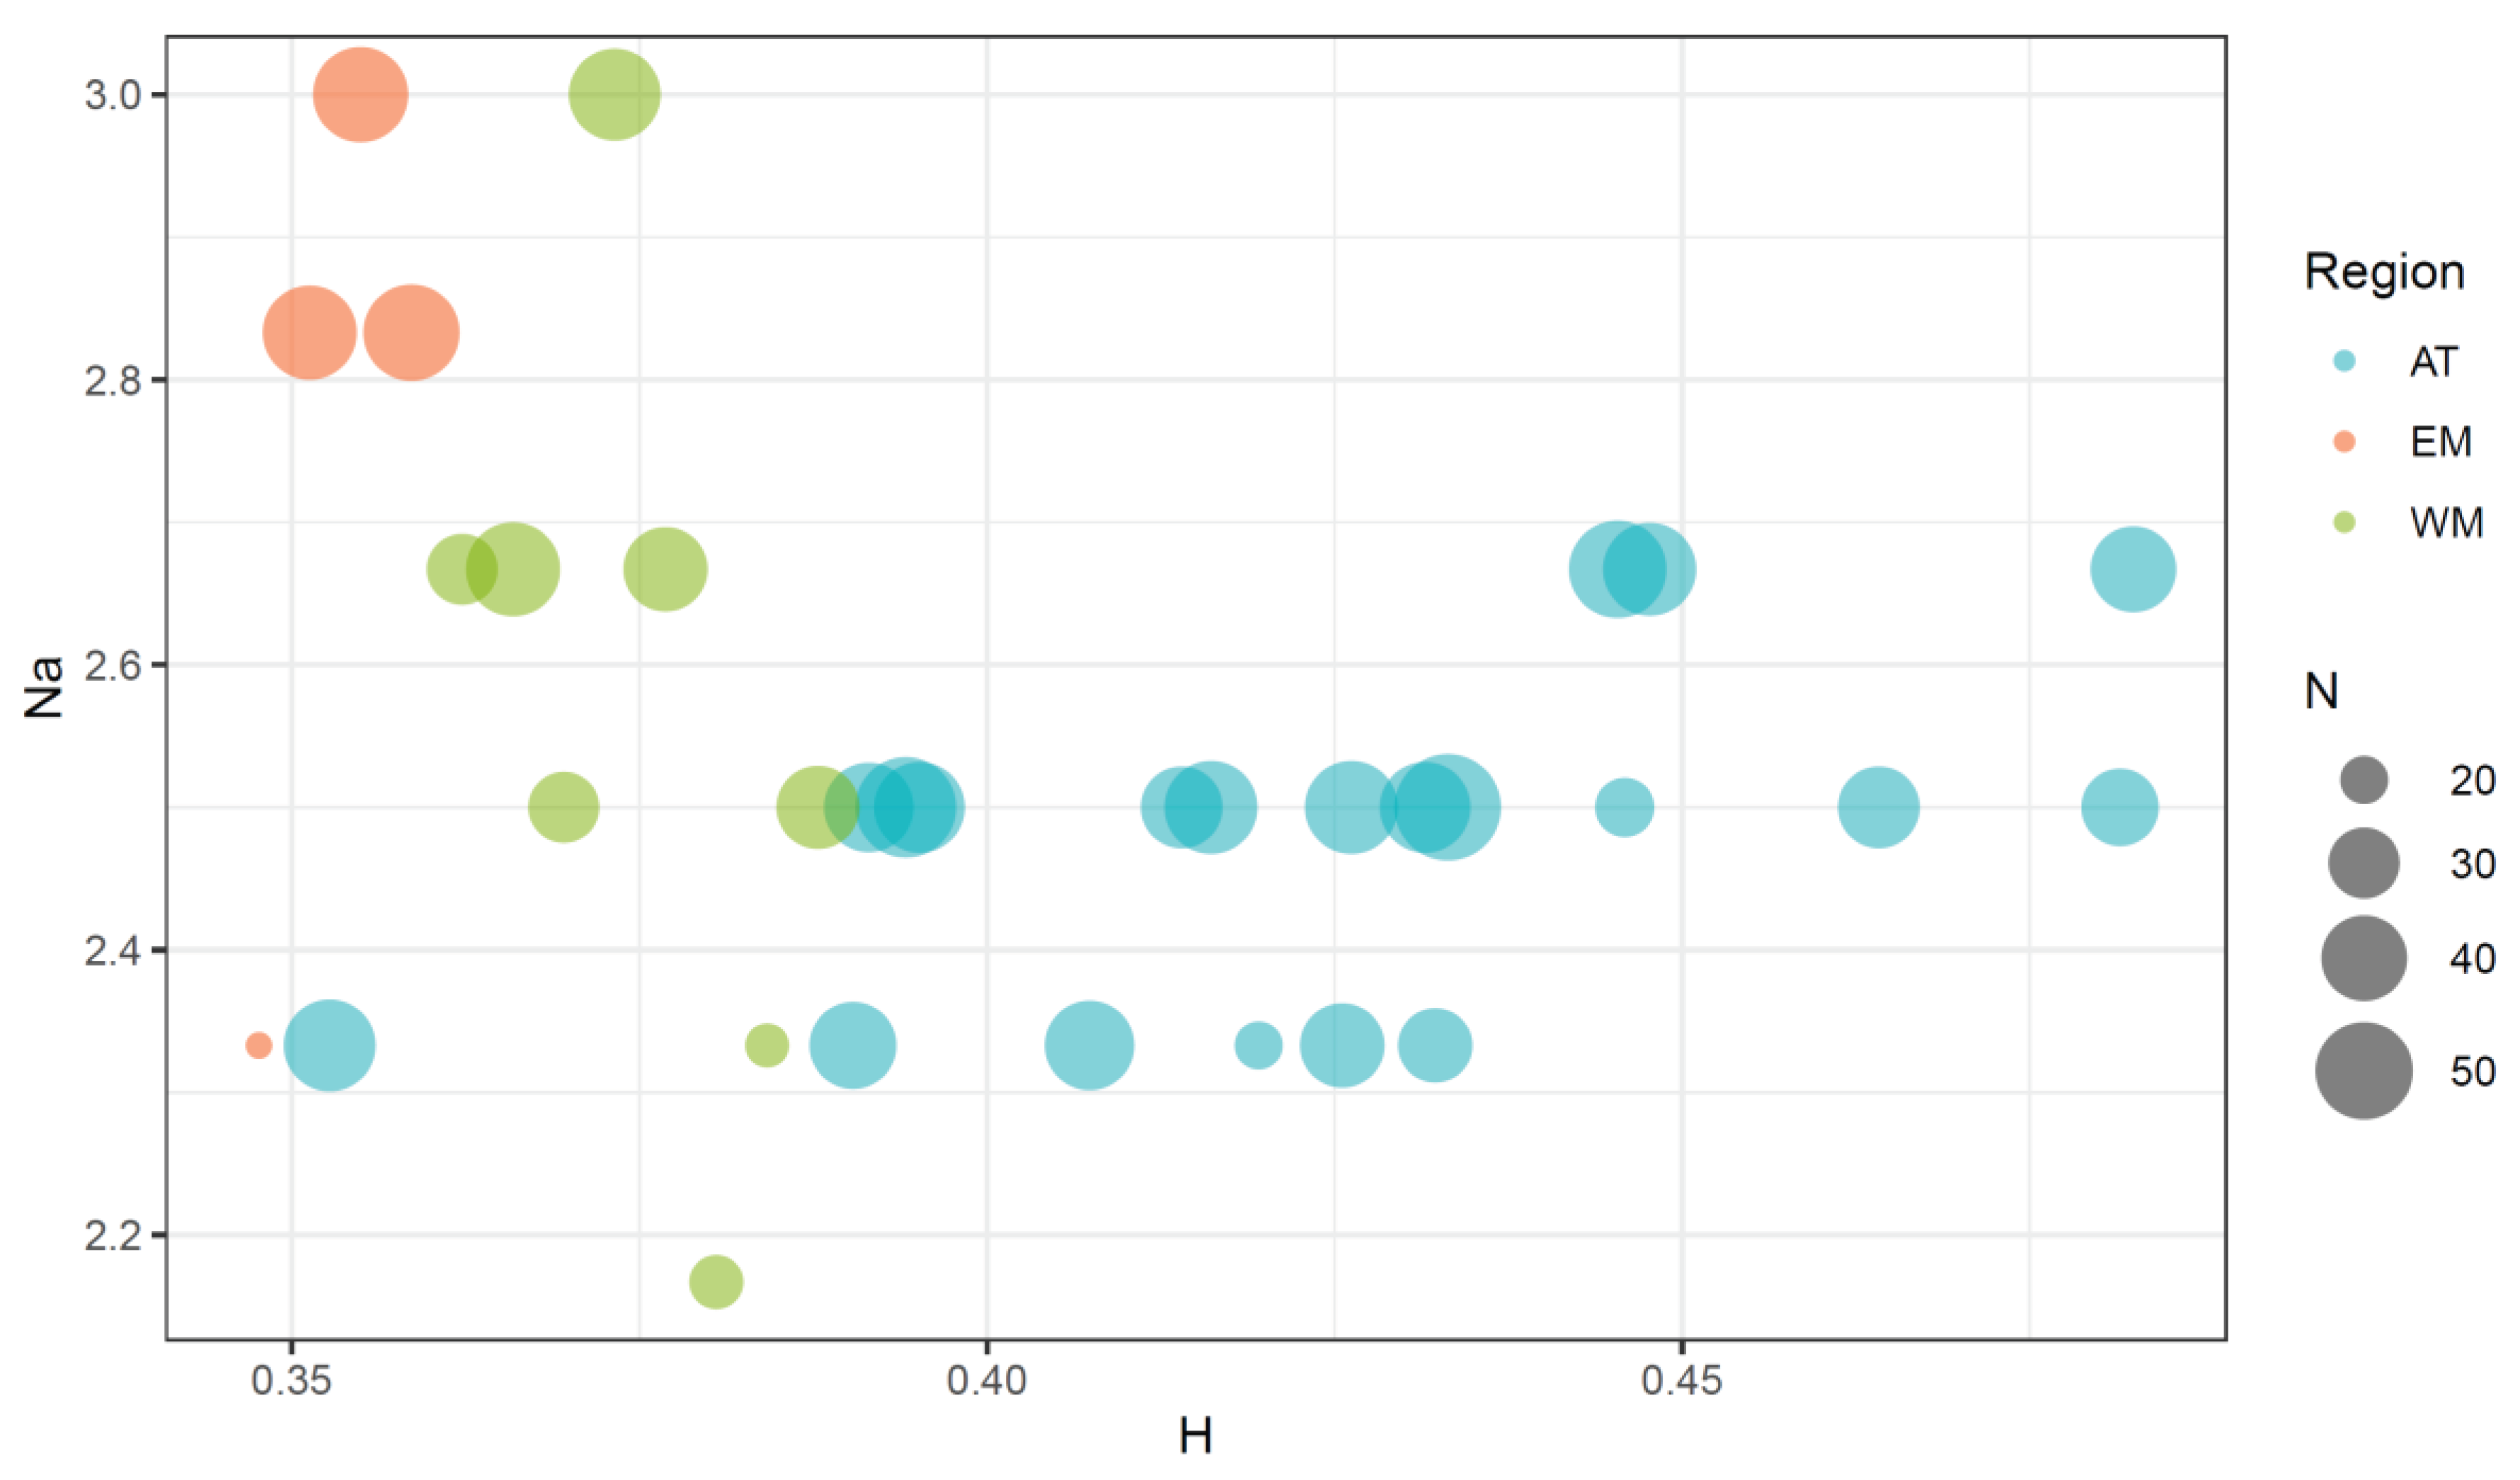
The addition of data from new populations and pooling them with those already published has clarified the distribution of genetic variability across clam populations (Figure 2 and Table S1). The mean heterozygosity per locus (H) ranged from 0.334 to 0.482. The lowest value was found in the EM4 population, and the maximum in AT6. The mean number of alleles per locus (Na) ranged from 2.17 to 3.00, with minimum values registered at WM2a, and maximum values registered at WM3 and EM2. The correlation coefficients of sample size with H (r = 0 0.19) and Na (r = 0.50) were nonsignificantly different from zero, indicating a negligible contribution of sample size differences to variation of the estimates of genetic variability across populations. However, the plot of Na against H clearly shows that Mediterranean populations have lower H values and higher Na values than the Atlantic ones. Only two West Mediterranean populations (WM1b and WM2a) and one East Mediterranean population (EM4) showed Na values equal or lower than the lowest values registered in the Atlantic samples, and these populations were the ones with the lowest sample sizes in the entire study.

3.2.1. FST Statistics and Population Neighbor-Joining Tree

The results of the study of genetic differentiation by means of F-statistics are presented in Table 2. The overall FST for all populations was 0,132. Mediterranean populations showed a higher overall FST (0.080) than the Atlantic populations (FST = 0.065). Within the Mediterranean, the eastern basin showed higher within-basin differentiation (FST = 0.101) than the western basin (FST = 0.036).
Genetic differentiation between pairs of populations ranged between 0 and 0.345 (Table S2, Supplementary Materials). The maximum value in the entire study area was observed between two very distant populations (EM4 and AT14). Zero values were found between geographically close populations (WM3 in SE France, and WM2a, in NE Spain), or between samples taken from the same location in different years (WM2a and WM2b). However, zero values were also observed between pairs of distant populations, such as EM1 (northern Adriatic Sea) and EM4 (Timsah Lake, Egypt). The highest value resulted from the comparison of AT15 (Obidos lagoon, central Portugal) and EM3 (Izmir, Turkey). In the Atlantic populations, pairwise FST values ranged from 0 to 0.209. Two pairs of populations showed FST higher than 0.200. The first pair was composed of two distant populations: AT1, from NW France, and AT12, from NW Spain. The second pair, however, was composed of AT13 and AT14, two nearby locations in northern Portugal. The pairwise FST of Mediterranean populations ranged from 0 to 0.198. The maximum divergence in the Mediterranean was observed between EM2, in Turkey, and EM3, in Egypt.
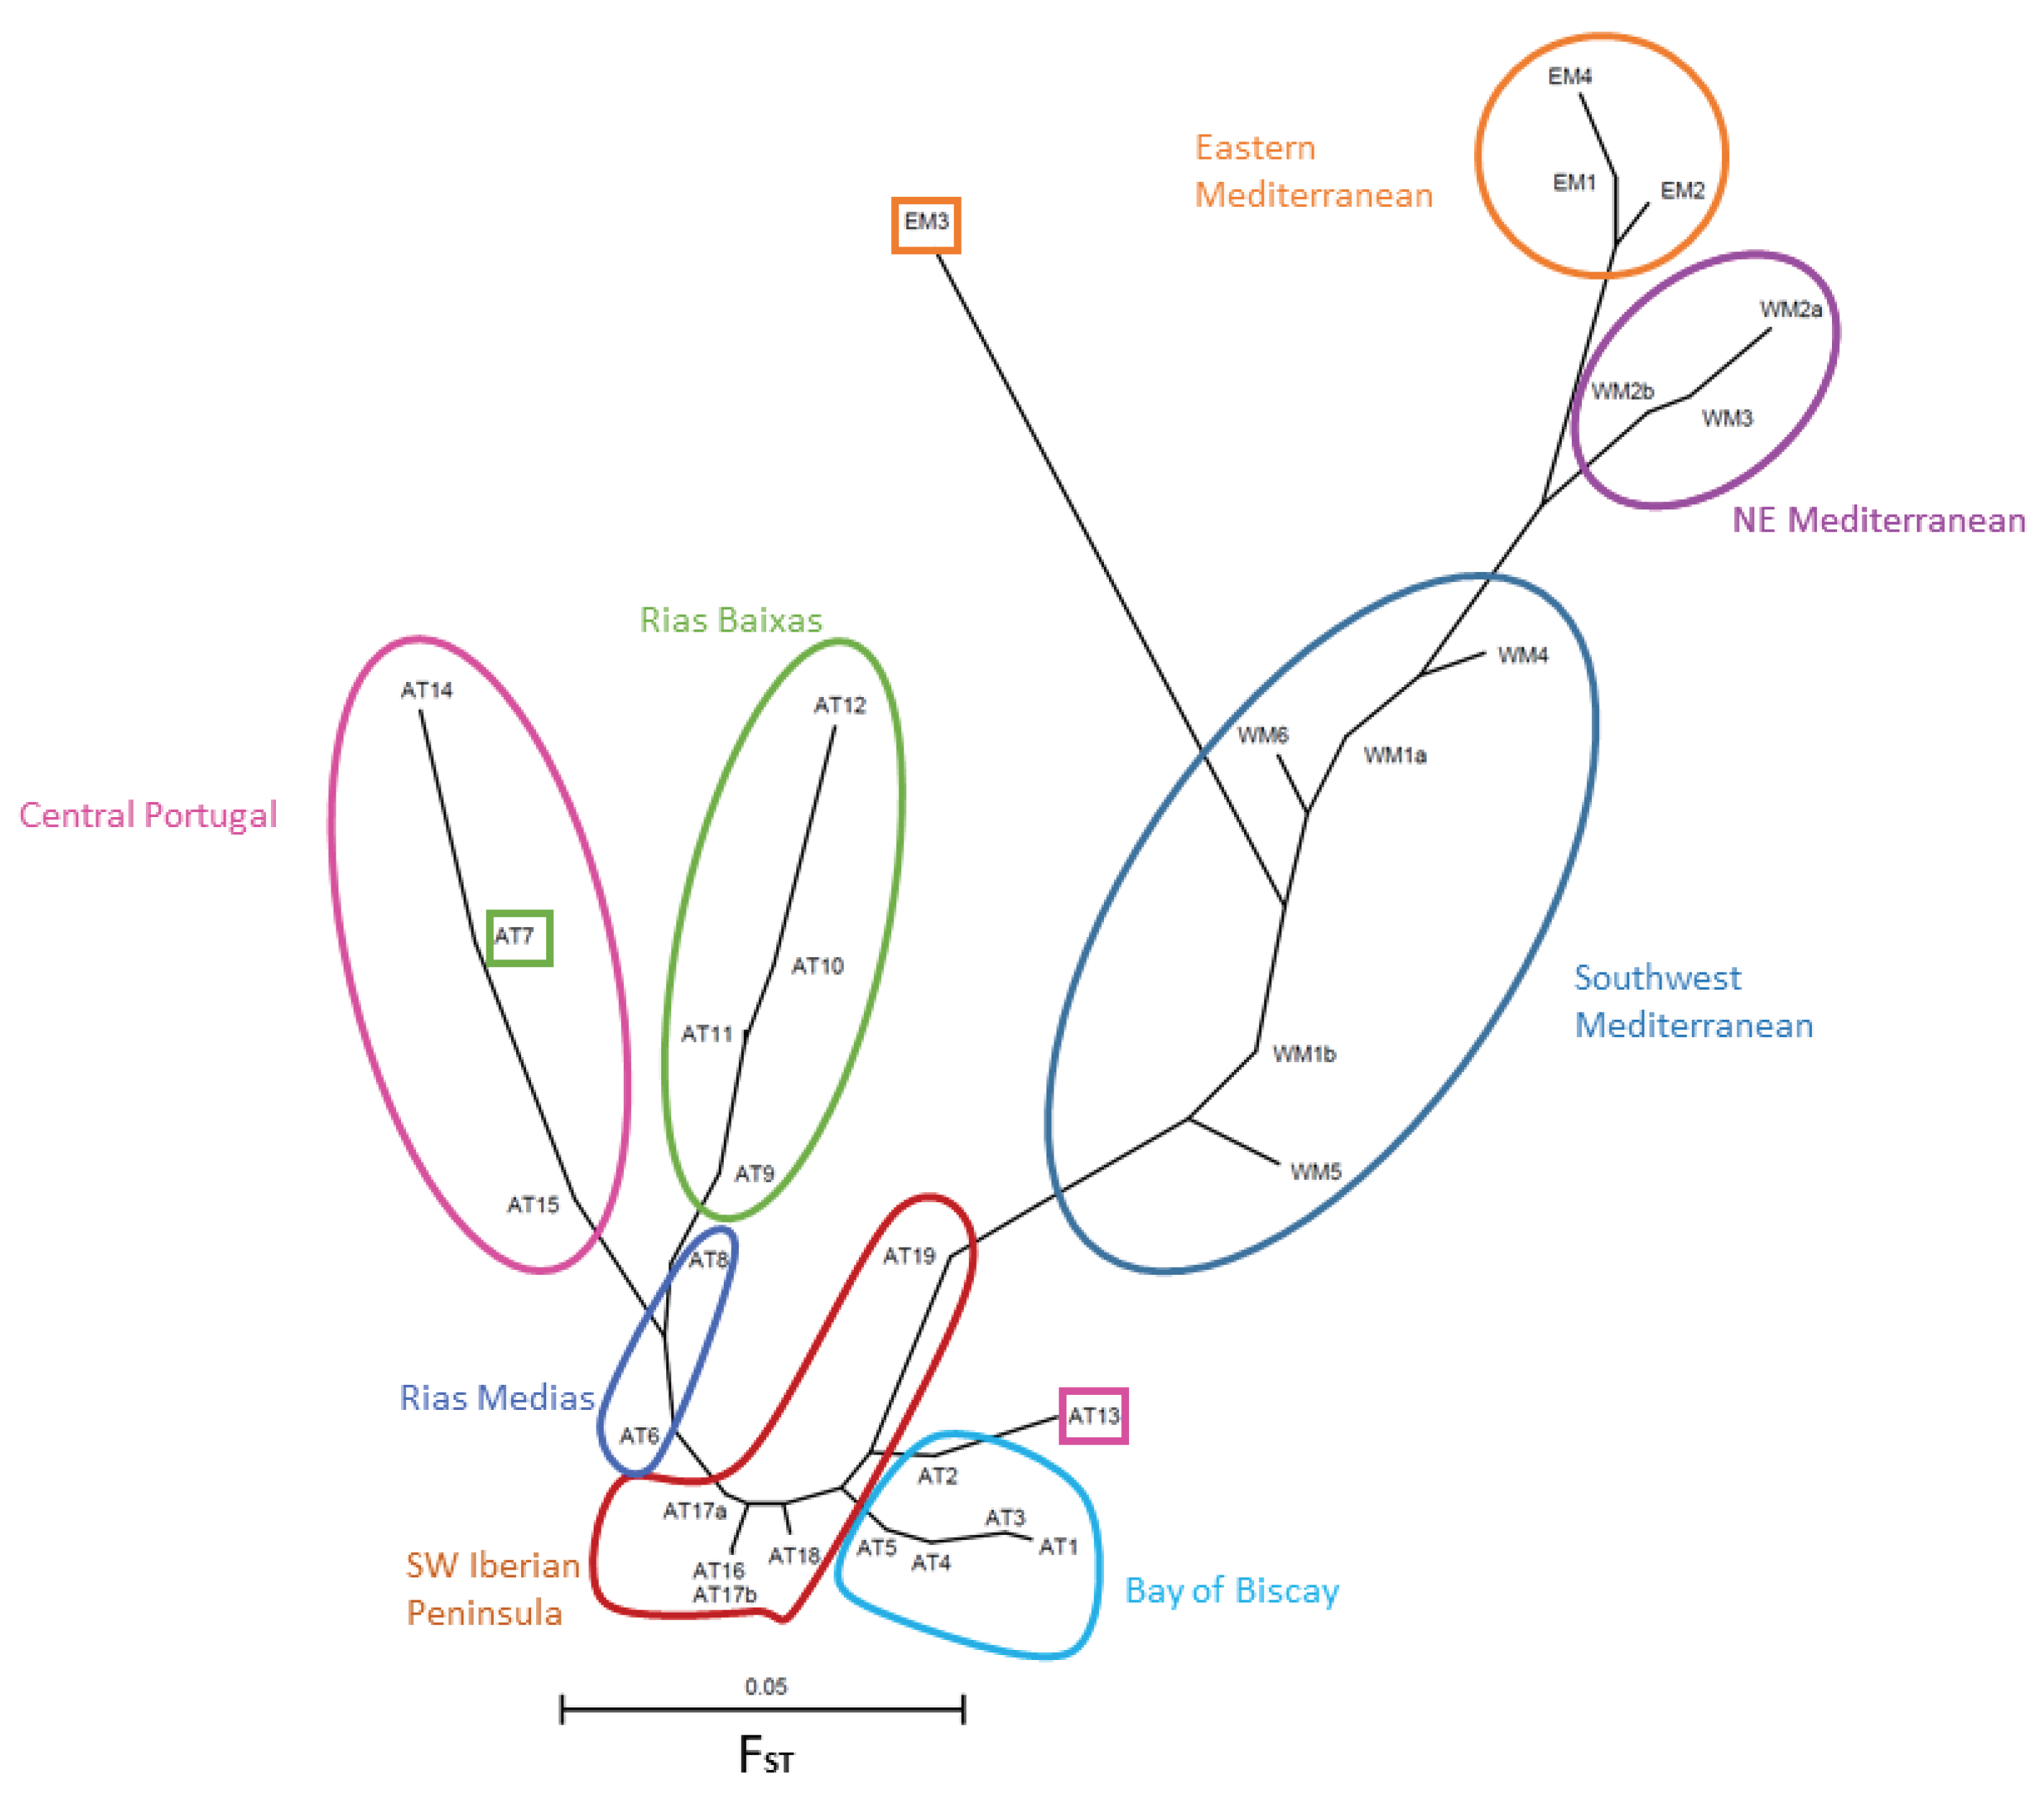
FST distances between pairs of populations have been used to draw an unrooted tree (Figure 3). Geographically close populations tend to be positioned close to each other also in the tree, with very few exceptions (see below). Mediterranean populations occupy the right part of the tree and Atlantic populations appear in the left part. A group of populations from the SW Mediterranean, that includes the two samples from the WM1 population (SE Spain) and the three populations from Tunisia (WM4, WM5, and WM6), occupy the center of the tree. This SW Mediterranean group is characterized by low, and often nonsignificantly different from zero, pairwise FST values (Table S2, Supplementary Materials). They are connected with the other Mediterranean populations through a node common to the northern Tunisian WM4 population, but this node then leads to two other branches. One branch includes the northern W Mediterranean populations WM2a, WM2b and WM3. The other branch includes the eastern Mediterranean populations, excluding EM3 (Smyrna, Turkey). This population appears, surprisingly, at a very long branch that joins the SW Mediterranean central group, indicating a high differentiation of EM3 from all the rest of the Mediterranean populations. Actually, the lowest pairwise FST value for population pairs including EM3 is 0.089, which results from the comparison of EM3 with the Atlantic AT19 population in south Spain, not with another Mediterranean population.
AT19 is precisely the closest Atlantic population to the Mediterranean populations in the tree. The connection of AT19 with the remaining Atlantic populations proceeds through several nodes which lead to two branches that include one population from northern Portugal (AT13) and the populations from the Bay of Biscay in northern Spain and NW France. The tree continues with nodes connecting other populations from SW Spain, southern Portugal and then one population from NW Spain, AT6. At this point the tree divides in two branches. One contains one population from NW Spain (AT7) and two populations from northern Portugal which are relatively distant from it (AT15 and AT16). The other branch contains the remaining populations from NW Spain estuaries, specifically the group of estuaries known as Rías Baixas (AT9, AT10, AT11 and AT12), plus one from a small estuary located a bit further to the north (AT8), which belongs to the group of estuaries known as Rías Medias.

3.2.3. Hierarchical FST Analysis

The hierarchical FST analyses using different models of genetic subdivision are shown in Table 2. The subdivision of the whole area in Atlantic, Western Mediterranean (including Tunisia) and Eastern Mediterranean regions (model 6), gives an overall FST = 0.18. This model also shows that among-regions differentiation (FCT = 0,131) is double than differentiation within regions (FSC = 0,063). Within the Atlantic, one population (AT13, in northern Portugal) showed pairwise FST values (Table S2) and cluster distribution profiles in the Bayesian analysis of genetic structure (see below) that deviate strongly from those of their neighbor populations, and suggest a higher similarity to the populations of the Bay of Biscay (AT1- AT5). Therefore, we tested three models with 4 subdivisions, in which AT13 was included alternatively in the Central Portugal group, the NW Spain group and the Bay of Biscay group (models 8-10 in Table 2). Model 10 gives the highest FCT (0.050), supporting the higher similarity of AT13 to the Bay of Biscay group.

3.2.4. Temporal Genetic Differentiation

The data set contains three locations that were sampled twice, with samplings separated by 4 (AT17) or 7 years (WM1 and WM2) (Table 1). The data obtained from these samplings allow an empirical evaluation of the magnitude of the differences that can be expected to appear among samples taken at different time points. These samples gave an overall FST of 0.129 (Table 2, Model 11), and pairwise values comprised between 0.036 and 0.271 (Table S2, Supplementary Materials). The FST values for between-year comparisons within locations ranged from 0 to 0.007, which are at least 5 times lower. Comparison of these numbers suggests that the changes in allele frequencies in populations over time are very small, compared to the variation in allele frequencies across geographically separated populations that have been sampled at intervals of several years. Even in populations separated by relatively short distances in the same marine basin, such as those in the Mar Menor lagoon (WM1a and WM1b) or the Ebro Delta (WM2a and WM2b) in Mediterranean Spain, FST between populations (FST = 0.036-0.176) is at least five times higher than between temporal samples within each location (FST = 0.00-0.007) (Table S2).

3.2.5. Bayesian Analysis of Genetic Structure
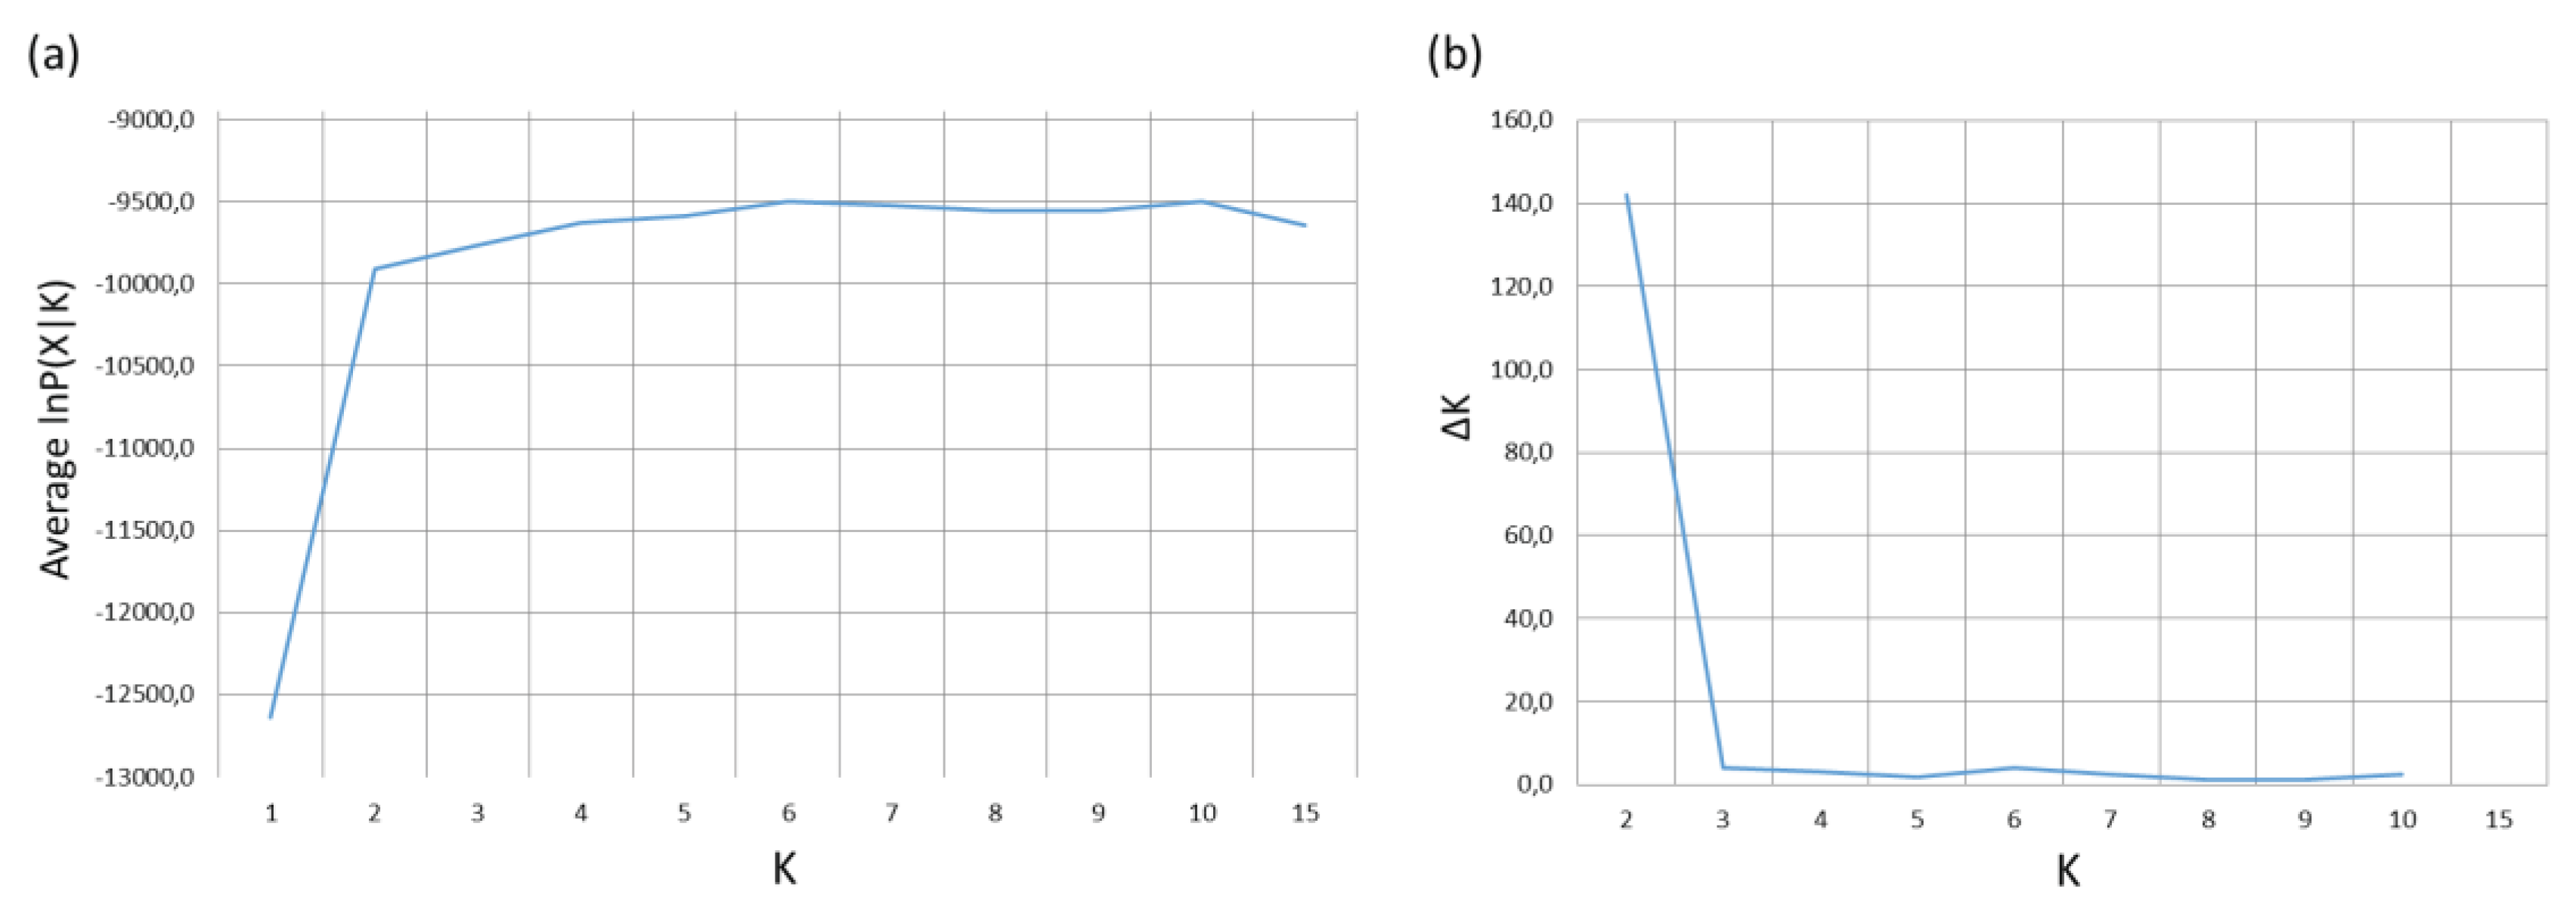
The optimal number of ancestral genetic clusters resulting from the Bayesian analysis of genetic structure are shown in Figure 3. The optimal number of ancestral clusters according to the method of Pritchard et al. is K = 6 (Figure 3a). The method of Evanno et al. gives a very high value for K=2 and values near 0 for other K values, with the exception of a slightly higher value for K=6 (Figure 3b). Pritchard et al.’s method suggests substructuring at different geographic levels, as K= 10 has a similarly high posterior probability as K=6, and gives low posterior probability to K=2.
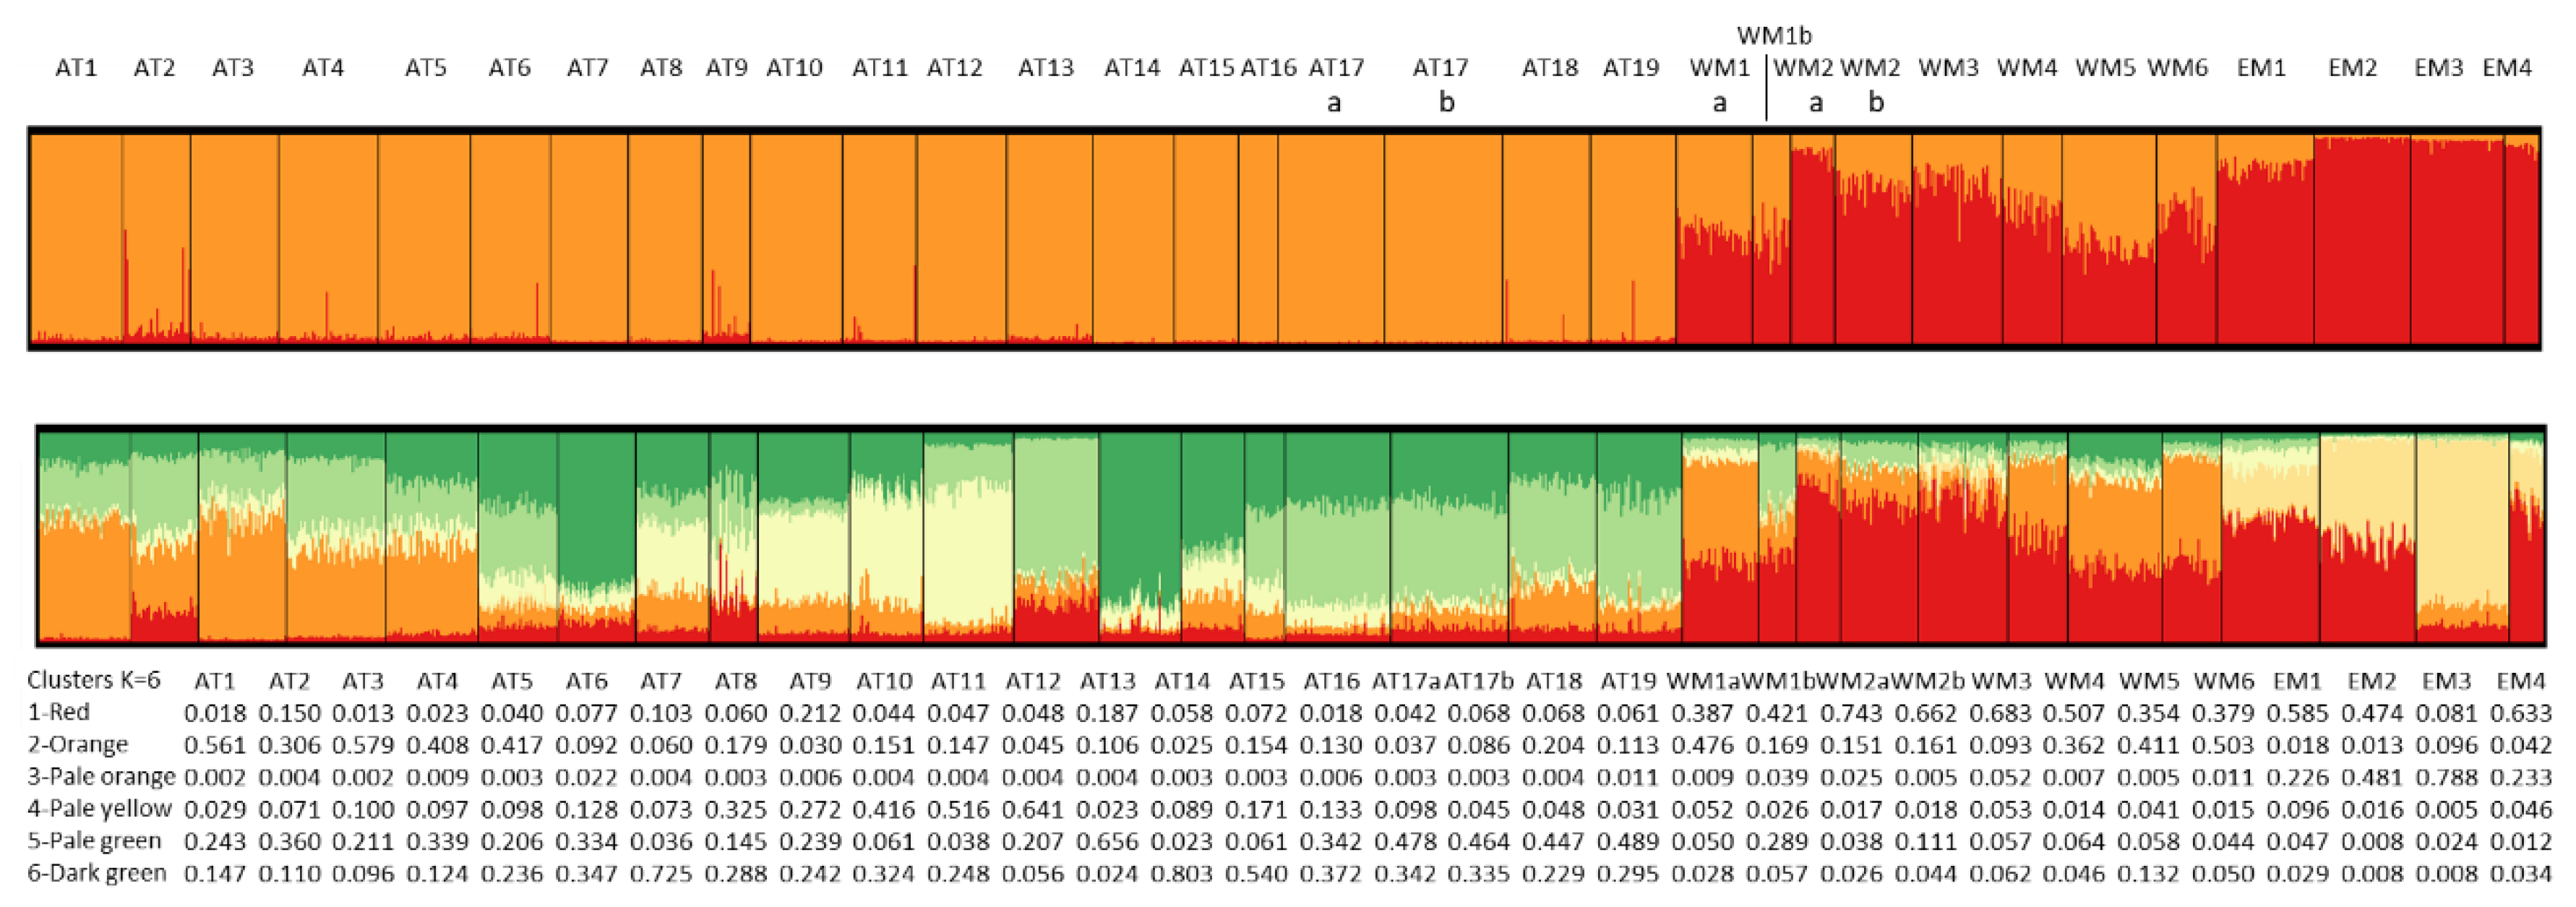
The plots showing the clusters’ proportions for all studied individuals are presented in Figure 5 for K=2 and K = 6. The plot for K= 2 shows that one cluster is almost restricted to the Mediterranean populations, and the other is almost the only one present in the Atlantic coasts. However, this cluster enters the Mediterranean Sea populations in frequencies up to 50% in populations from SE Spain and Tunisia, becoming less frequent in the remaining western Mediterranean and Adriatic populations, and being almost absent from the Aegean Sea populations. The contribution of the alleles of each locus to the clusters’ is presented in Figure S3a (Suppementary Materials). The loci Ech and TBP are the most influencing for K=2.
Figure 4. (a) Plot of the posterior probabilities for each K value from the Bayesian analysis of genetic structure. (b) Plot of ∆K for each K value from the Bayesian analysis of genetic structure.
Preprints 100163 g004
The plot for K=6 shows the same overall picture, but with more substructuring within each basin. Dark green to yellow colored clusters shown in Figure 5 are more frequent in the Atlantic, and red to pale orange colored clusters are more frequent in the Mediterranean. Cluster 3 (pale orange) is present only in the Aegean and the Adriatic seas, and is especially abundant in the EM3 (Smyrna) and EM2 (Halkidiki) populations. However, it is absent from the remaining Mediterranean and Atlantic populations. Cluster 1 (red) is the most abundant in most Mediterranean populations, especially in the north of the Western Mediterranean (WM2a WM2b and WM3), but also in the Adriatic population EM1 (Venice). This cluster is present in very low frequency in the Atlantic populations, but increases slightly in a few of them: AT2, AT9 and AT13. The third most common cluster in the Mediterranean populations is cluster # (orange), especially in the south of the Western Mediterranean (WM1a, WM$, WM5 and WM6), but also in the north of the Western Mediterranean in lower frequency. It is absent from the Eastern Mediterranean populations, with the exception of EM3, where it appears at very low frequencies. In the Atlantic populations, three clusters are especially abundant. Cluster 6 (dark green) appears in all populations at variable frequencies, being the most abundant in AT7 and in AT14. This cluster is present also in the Mediterranean Sea in very low frequencies. Another cluster (5, pale green) is very frequent in southern Portugal and SW Spain (AT16 – AT19), and also in the Bay of Biscay populations (AT1- AT6), but reaches it highest abundance in AT13 (Viana), in strong contrast with the neighbor populations AT12 and AT14, where this cluster is almost absent. Another typical Atlantic cluster is cluster 4 (pale yellow), which is abundant in the estuaries of NW Spain, especially in the Rias Baixas estuaries (AT9-AT12), but also in the neighbor estuary of Camariñas (AT8). This cluster is present in very low frequencies in the remaining Atlantic and in the Mediterranean populations. The most surprising result of the Bayesian analysis of genetic structure is the presence of cluster # (orange) in intermediate to high frequencies in the Bay of Biscay populations (AT1-AT5). This cluster is present also in intermediate frequencies in the Western Mediterranean populations (see above), and appears in low frequencies along the regions that separate the Bay of Biscay from the Western Mediterranean: south Atlantic Spain, Portugal and the NW Spain estuaries. The populations from the Bay of Biscay and the SW of the Iberian Peninsula differ especially in the frequency of cluster 2 (orange).

4. Discussion

4.1. Genetic Variability

The high number of samples included in this study has uncovered a pattern of genetic variability which had not been appreciated in previous studies. The mean heterozygosity per locus (H) is higher in Atlantic populations, and lower in Mediterranean populations, especially in the Eastern Mediterranean region (EMED). However, the mean number of alleles per locus (Na) is higher in the Mediterranean populations, and increased to the East. This contrasting patterns of H and Na are due to the presence of several alleles in the populations from the Mediterranean, especially in the EMED, that are not present in the Atlantic populations, and increase Na in that region. Lower heterozygosity associated to high number of alleles in low frequency is the expected outcome of mutation and genetic drift when a population experiences population size contractions followed by population expansions. The Pleistocene glacial-interglacial provide a framework to explain these observations. If most of the alleles that are restricted to the Eastern Mediterranean were in very low frequencies, a contraction followed by expansion associated to Pleistocene glacial-intergalcial cycles would be a possible explanation for the observed pattern. However, several alleles restricted to the EMED appear in relatively high frequencies (Ech-3, up to 0.35; Ech-4 up to 0.28; TBP-3 up to 0.38), and therefore, other processes are need in order to account for the results. It is possible that the populations in EMED are remnants from an ancient population with a large effective size (Ne), and glacial-interglacial cycles decreased H, but many alleles still remain. Cordero et al. [8] dated the origin of alleles restricted to the WEMED and EMED at the loci Ech and TBP. Alleles Ech-D, TBP-A1 and TBP-C (corresponding to Ech-4, TBP-1 and TBP-3 in this study), gave best estimates for their divergence from the phylogenetically closest alleles of 206, 273 and 416 thousand years before present (KYBP). Allele Ech-A2 (which was a subgroup of sequences of the allele Ech-A (Ech-2 in this study) was present in the whole Mediterranean, and diverged at 424 KYBP. Finally, Ech-C (Ech-3 in this study), which is also widespread in the Mediterranean, diverged at 1078 KYBP. The divergence of the Mediterranean alleles therefore seems to have occurred earlier than the divergence of the alleles that are exclusive to the eastern Mediterranean alleles. The most probable date for this divergence seems to be the late Pleistocene period, but much earlier than the last glacial maximum (20 KYBP). Therefore, it is probable that, between less than 500 KYBP and the last glacial maximum, at two separated times, the Eastern Mediterranean harbored an isolated population of clams that lost part of their genetic variability, but did not lose many alleles. The oldest alleles would have expanded to the whole Mediterranean, while the more recent alleles have been restricted to the EMED. Another factor that could have had a role is natural selection, which could have favored one or more EMED-restricted alleles due to their linkage disequilibrium with other variants in the coding regions of the genes or in nearby genetic locations.

4.2. Temporal Genetic Differentiation

Studies of population genetic differentiation usually are based on data obtained from contemporary sampling conducted in the same year or with just a few years apart. The 32 samples studied in this work have been taken along a period of 17 years, from 2004 to 2021, which is a longer than usual sampling period. An evaluation of the effect of the temporal change in gene frequencies is necessary in order to know whether distant sampling time affects the results. If temporally separated samples from the same locality differ as much, or more, than they do with respect to samples from other locations, the effect of temporal variation and geographic variation would be confounded and no robust conclusions could be taken from the data. In this study, three locations have been sampled twice, at time points separated by four or seven years. In all three cases, the pairwise FST values between temporal samples from each location were not significantly different from zero. Moreover, the hierarchical FST analysis of the six samples also gave a nonsignificant between-years component (FCT). Therefore, we can conclude that the detected differences among geographic populations in this study are not affected by the time distance that separate their collection.

4.3. Geographic Genetic Differentiation

The results of this study agree with previous studies using intron-RFLP and microsatellite markers in showing a subdivision of the species in an Atlantic and two Mediterranean groups, corresponding to the Western and Eastern basins[6,12]. The genetic differentiation found between the Atlantic and the Mediterranean populations is consistent with many other studies showing the same result in other species using several types of genetic markers (enzyme polymorphisms, mitochondrial DNA, microsatellites, SNP), and have been related to the Pleistocene glacial-interglacial cycles and present-day restriction to gene flow at some points ([8,9]).
The inclusion in this study of new samples, and their analysis together with those from previous studies, has allowed to discover new features of the genetic structure of the clam populations living the Mediterranean Sea. In the Eastern Mediterranean, Cordero et al. [6] examined populations from the northern part of the basin only, i.e. the Adriatic and the Aegean seas. They used the initial letters of both seas to create an acronym (AEGAD) to refer to that group of populations. The inclusion of a sample of clams from Egypt in this study has allowed to prove that the southern part of the Eastern Mediterranean basin shares the genetic characteristics of the northern part, and therefore it is possible to speak of an Eastern Mediterranean subpopulation or race (EMED). Further research could help to decide if the EMED populations represents a subspecies of R. decussatus.
Cordero et al. [6] also observed that the Tunisian population WM5 (Sfax), which geographically is located in the Eastern Mediterranean basin, was genetically more similar to Western Mediterranean populations than to the remaining Eastern Mediterranean populations. Gharbi et al. [13] examined the genetics of twelve Tunisian populations with sequences of the mitochondrial gene COI and the nuclear ITS, and found no important differences in haplotype frequencies between the populations from the northern coast of the country, which geographically belong in the Western Mediterranean basin, and the populations from eastern coast, which belong in the Eastern basin. In this study, two of the population samples analyzed by Gharbi et al. have been included, and, together with the population studied by Cordero et al., it can be clearly seen that these populations fall on the Western Mediterranean group. Studies have reported that populations of marine species from the eastern coast of Tunisia can be genetically more similar to western Mediterranean populations in some cases, or to the eastern Mediterranean in others. The reasons for this variability are not well known. A combination of factors might be acting, including the east to west flow of the northern African current favoring dispersal past the Siculo-Tunisian Strait, and the effect of endogenous barriers to gene flow[6,17]. Specific studies, including populations beyond the Tunisian borders to the east, should be carried out in order to understand the mechanisms that explain this situation.
Some aspects of the allelic distributions in the Mediterranean could be due to historical and/or environmental factors, or to anthropogenic causes. For example, the presence in very low frequency of allele TBP-4 in Tunisia (WM4) was interpreted as a private allele by Cordero et al., but in this study it appeared in slightly higher frequency in a population near the Suez Canal (Timsah Lake) in Egypt, some 2500 km away. This finding points to the presence of this allele in low frequency along the northern African coasts, but is also compatible with a spread of this allele from Egypt to Tunisia through ballast waters along one of the busiest maritime routes in the world. This seems also the most plausible explanation for the presence of typical eastern Mediterranean alleles Ech-5 and TBP-3 in the Thau lagoon, near the port of Sète in south east France (WM3 population).
The inclusion of data from a sample from SW France reported by Saavedra et al. [15], along with the addition of two new samples from Tunisia, have allowed to confirm the relative homogeneity of the populations of the southern part of the western Mediterranean (WMED), and to show a slightly higher differentiation of the northern populations in that basin, here represented by samples from the Ebro Delta in NE Spain and from the mentioned Thau lagoon in SW France. These populations formed a separate branch in the NJ tree and showed a higher frequency of cluster 1 and a lower frequency of cluster 2 in the Bayesian analysis of genetic structure. Differentiation of populations from the north and south of the WMED has been shown in other marine species living in that region, and it has been related with the presence of the Balearic oceanographic front [20]. It would be interesting to study samples from other French and Italian populations, as well as from the western Mediterranean Islands, in order to better characterize the genetic structure of the WMED.
This study has increased considerably the sampling along the Atlantic coasts of the Iberian Peninsula, and has found out interesting novelties. Previously, Arias-Pérez et al. had found that the populations from the SW of the Iberian Peninsula were more similar to the populations of the Bay of Biscay than to other populations on the Atlantic façade of the Iberian Peninsula, which are geographically closer [12]. Here we have shown that these two regions are no so similar, as they rendered significant pairwise-FST values and showed different frequencies of clusters in the Bayesian analysis of genetic structure (especially of clusters 2 and 6 for K=6).
Cruz et al. [14] described a set of two populations in central Portugal (Obidos lagoon and Aveiro ) that showed moderate differention with respect to their neighbor Portuguese and Spanish populations. In this study, we have presented a more detailed data set of that part of the Iberian Peninsula. We have confirmed the differentiation of the same two populations from central Portugal (AT14 and AT15) with respect to their sampled neighbor populations, not only the Spanish ones, but also one Portuguese population located in northern Portugal (AT13, from Viana do Castelo). Surprisingly, AT13 is neither more similar to its closest neighbor in the northwest of Spain (AT12, from Redondela in the Ría de Vigo estuary), but rather to the populations of the Bay of Biscay. Moreover, the clams from Obidos and Aveiro have the highest similarity with those from A Coruña (AT7), a more northern population ca. 500 km apart, which is also different from their closest neighbor populations AT6 and AT8. Finally, between A Coruña and Viana do Castelo, there is a group of populations which appear closer to one another in the NJ tree and have in common the sharing of STRUCTURE cluster 4 in higher frequency than any other populations included in this study. These populations belong in the set of estuaries known as Rias Baixas, but also include the northern neighbor population AT8, which is part of the Rias Medias together with AT7 and AT6.
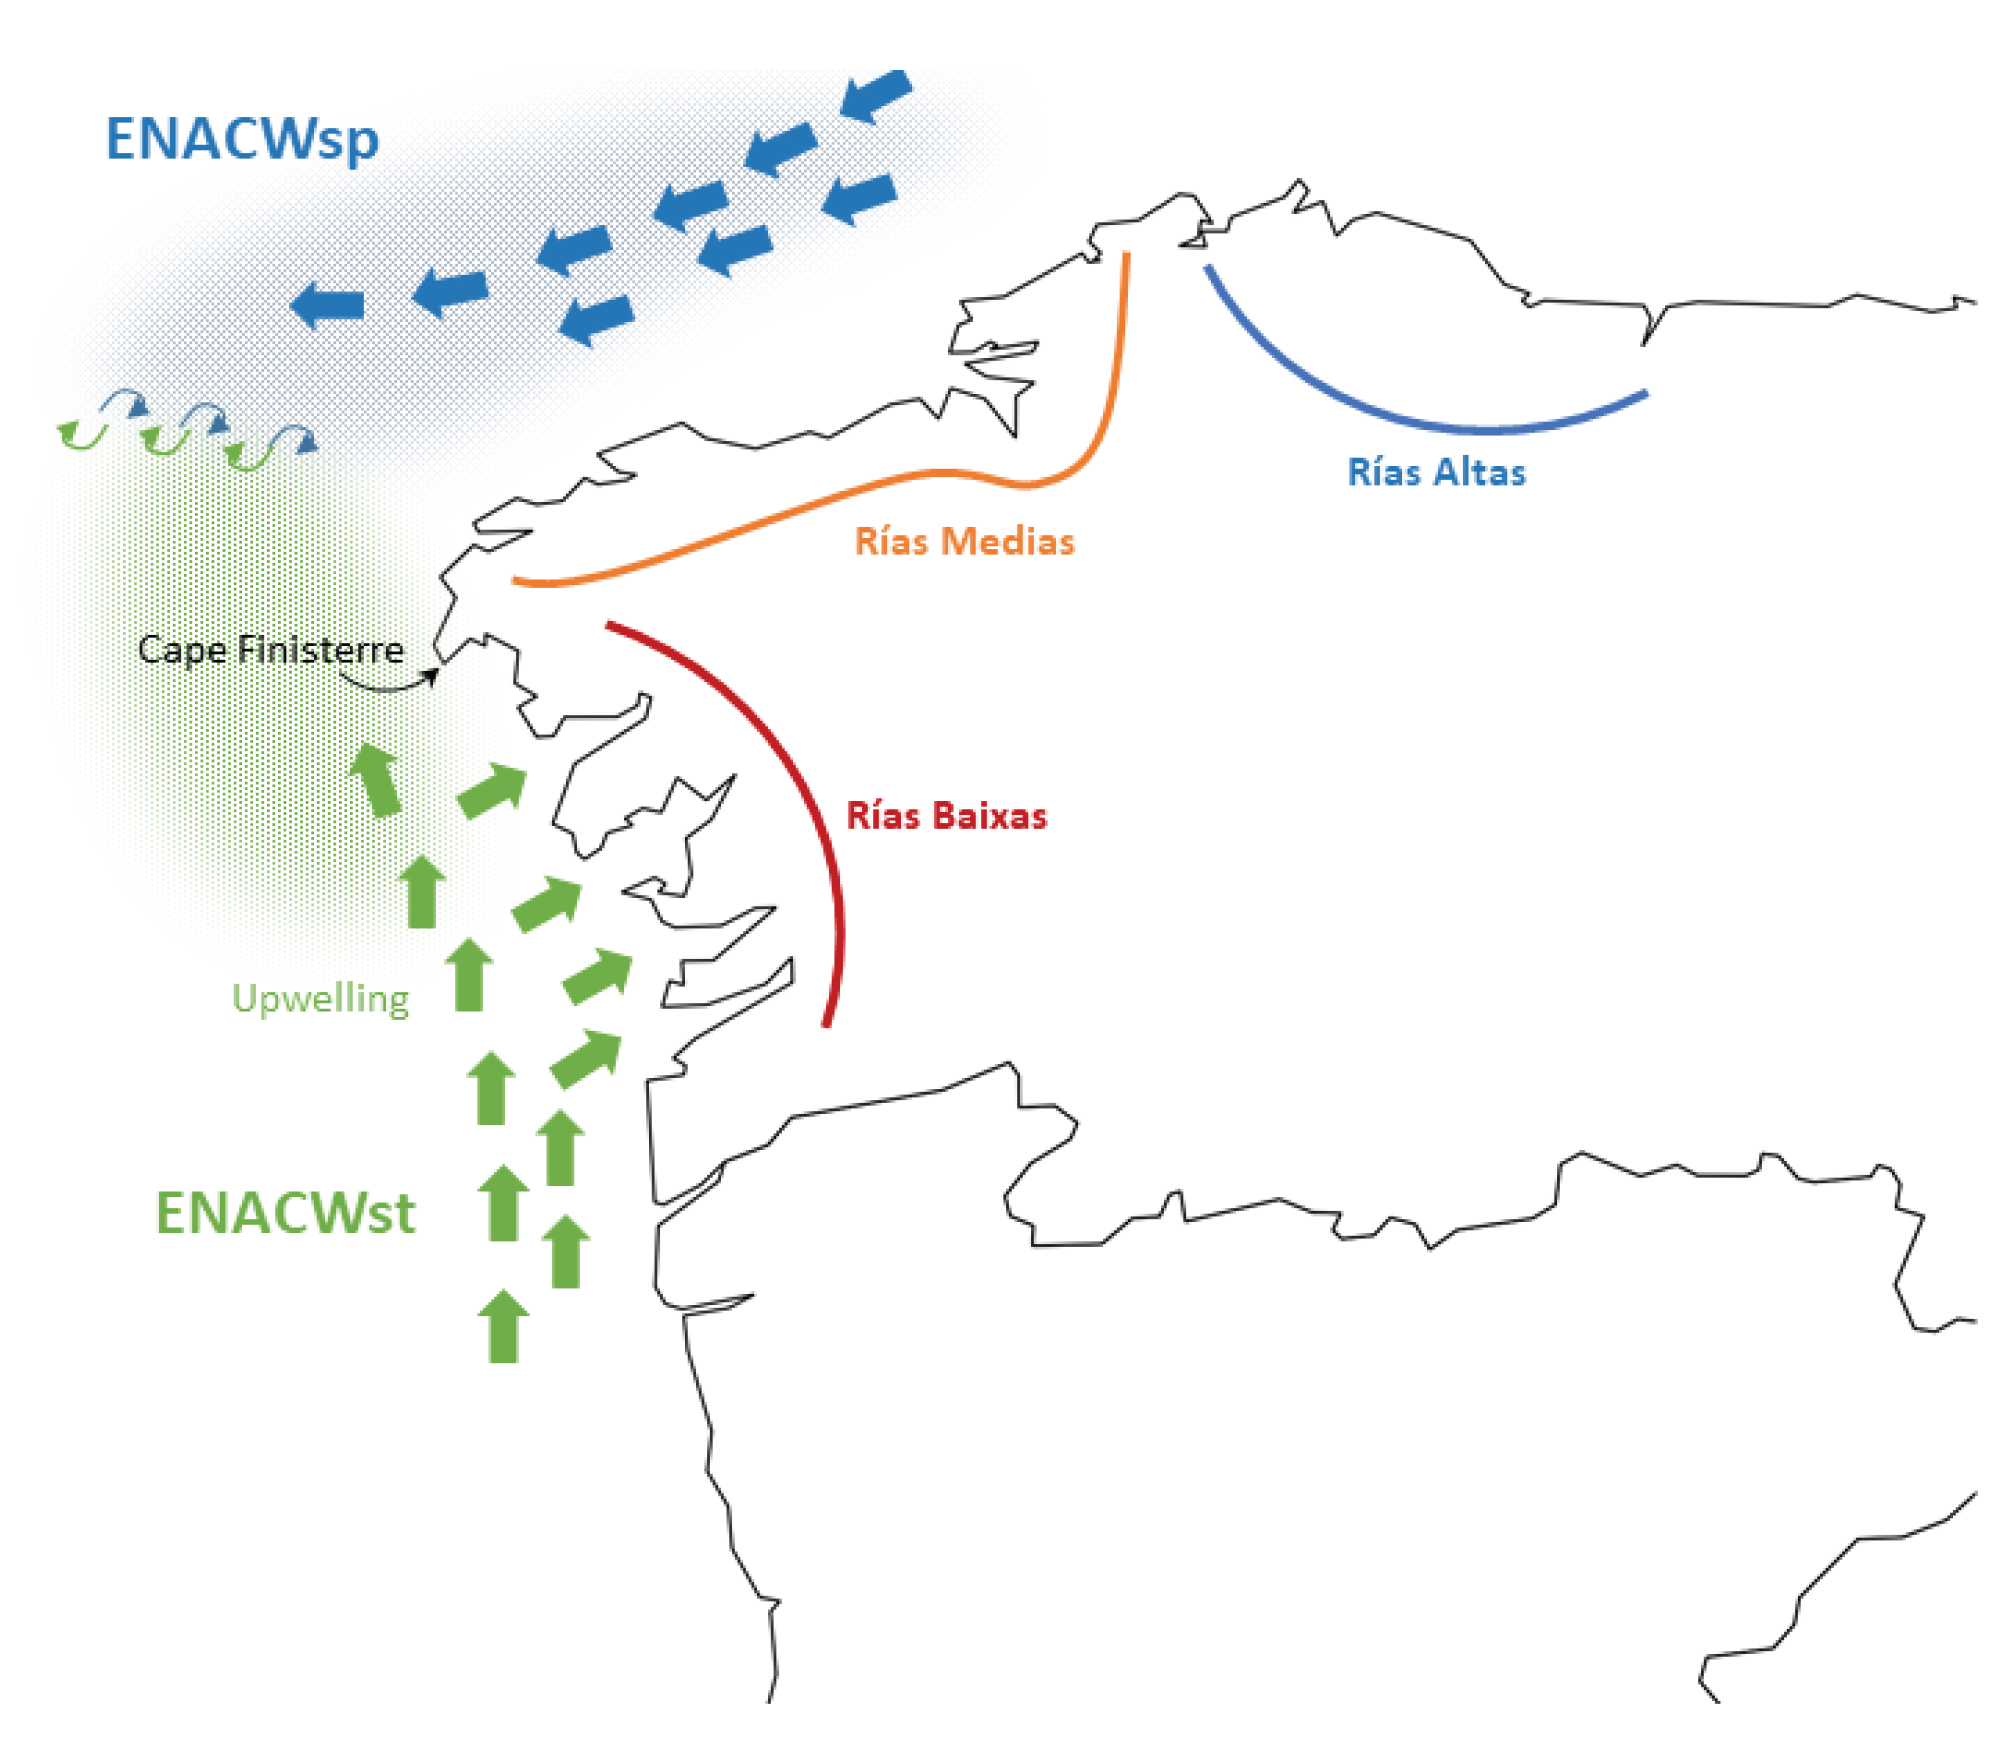
In summary, there is a genetic mosaic along the NW corner of the Iberian Peninsula that had not been described before. This mosaic is partially related to the geographic framework of the different sets of rias, and require specific explanations. The differentiation between populations of species such snails, algae and littoral plants from the NW of the Iberian Peninsula has been explained as the result of the Finisterre oceanographic Front [30,31,32]. This front is formed in summer off the coasts of Cape Finisterre due to the encounter of eastern north Atlantic central waters (ENACW) of subtropical and subpolar origins (Figure 6)[33,34]. The front could affect the transport of the grooved carpet-shell clam larvae, which reproduces in summer months in that region [35,36]. Larval transport disruption could result in limited gene flow, which could account for the differentiation between the AT8-AT12 group from the AT6-AT7 and Bay of Biscay populations. But his would leave unexplained the similarity of A Coruña (AT7) in the Rias Medias with Aveiro (AT14) and Obidos (AT15) in central Portugal, and the similarity of Viana, in northern Portugal (AT13) with the populations in the Bay of Biscay. A possible explanation for this inconsistency is just a higher isolation and lower effective size in these populations, which would result in that distant populations would look alike just by chance. Another possible explanation is the effect of river plumes, which have been proposed in some marine species as causes of genetic differentiation of populations at both sides of the plume [37,38]. In this case, the plumes of rivers Minho and Douro (Figure 1b), which show the highest discharge rates among the Iberian rivers flowing to the Atlantic, could act as barriers to gene flow. The differentiation of AT13 with respect to the populations from Rias Baixas and to AT14 and AT55 would fit this model.
However, since intronic markers are located in protein coding regions (genes), which may be sensitive to natural selection, non-neutral (selective or adaptive) explanations cannot be excluded. One adaptive explanation for the differentiation of Rias Baixas is the upwelling of cold and nutrient rich ENACW water inside these estuaries. The upwelling is favored by N component winds in spring and summer. Upwelling episodes are more frequent in the Rias Baixas than in the more northern estuaries, and induce important differences between the two groups of estuaries in temperature, primary production and phytoplankton communities that may affect both larval and adult clams [39]. Another plausible adaptive explanation is that AT7, AT13 and AT14 locations may be characterized by a more oceanic than estuarine environment, and the differences with respect to their neighbor locations are due to the adaptation to this type of environment.
Finally, anthropogenic causes cannot be left aside, as the concerned populations in the NW Iberian Peninsula are among the most commercially exploited in Europe. The exchange of juvenile clams between locations for fishery management purposes, and the introduction of clam spat obtained in hatcheries could also result in the observed pattern of differentiation. The similarity of the Viana (AT13) population with those of the Bay of Biscay would fit this human intervention, as hatcheries in N Spain and Atlantic France are usual suppliers of seed for the fishermen guilds.

5. Conclusions

This study, based on the largest population genetic dataset obtained so far from the grooved carpet-shell clam, has confirmed previous results showing a remarkable differentiation between the Atlantic, the western Mediterranean and the Eastern Mediterranean groups of populations of the clam R. decussatus, and has added new details to this general framework. The Mediterranean populations showed less heterozygosity, but a higher number of alleles, than the Atlantic populations. The difference was especially intense with regard to the eastern Mediterranean group of samples. Population contractions and gene-flow restrictions during the Pleistocene seem the most reasonable cause of this observation. The study has also shown that one population from northern Africa belongs in the eastern Mediterranean group, which strongly suggests that the AEGAD genetic subdivision described by Cordero et al. [6] actually comprises all or a great extension of the eastern Mediterranean (EMED) basin. Moreover, the data showed clearly that the Tunisian populations should be considered as part of the western Mediterranean group (WMED) described by Cordero et al. The results obtained also indicate that there is some differentiation between the north and the south areas within the western Mediterranean group of populations, that could be related to the Balearic front, but more populations from the region should be studied to be conclusive. As to the populations in the Atlantic, they appeared as a genetic mosaic, with the clams from the SW of the Iberian Peninsula showing limited similarity to the populations of the Bay of Biscay, and a group of rather more genetically subdivided set of populations occupying the north of Portugal and the NW of Spain. In that region, the Rias Baixas estuaries appear as a more homogenous unit with respect to their northern neighbor populations and to the populations in central Portugal. Some populations in this regions show high contrast with their geographic neighbors, which could be due to oceanographic features of the region (oceanic fronts, upwellings), river plumes, environmental differences (oceanic, vs. estuarine), or human actions (translocations, restocking with hatchery seed). Further studies with much larger numbers of genetic markers and intensive geographic sampling will be necessary to decide which of these explanations, or their combinations, account best for the observed genetic population structure of R. decussatus.

Supplementary Materials

The following supporting information can be downloaded at the website of this paper posted on Preprints.org. Figure S1: Bar charts showing allelic frequency variation across the study area; Figure S2: allelic contributions to clusters in the Bayesian analysis of genetic structure. (a) K=2. (b) K = 6. Table S1: Allele frequencies in the populations considered in this study; Table S2: Heterozygosity estimates and mean number of alleles per locus, by locus and population. Table S3: FIS per locus and population; Table S4: FST estimates between pairs of populations.

Author Contributions

Conceptualization, C.S.; methodology, C.S., D.C.; validation, C.S., D.C.; investigation, C.S., D.C.; resources, C.S., D.C.; data curation, D.C.; writing—original draft preparation, C.S., D.C.; writing—review and editing, C.S., D.C.; supervision, C.S.; project administration, C.S.; funding acquisition, C.S. All authors have read and agreed to the published version of the manuscript.

Funding

This research was funded by CSIC.

Data Availability Statement

original data are available on request to the corresponding author.

Acknowledgments

We are indebted to Dr. Miguel B. Gaspar for providing the AT13 sample, to Prof. Nahla El-Shenawy for providing the sample from Egypt, and to Ms. Aicha Gharbi for providing the Tunisian samples. We thank Ms. Martina Tremonti for her technical assistance with the molecular work and artwork.

Conflicts of Interest

The authors declare no conflicts of interest. The funders had no role in the design of the study; in the collection, analyses, or interpretation of data; in the writing of the manuscript; or in the decision to publish the results.

References

  1. Macho, G.; Woodin, S.A.; Wethey, D.S.; Vázquez, E. Impacts of Sublethal and Lethal High Temperatures on Clams Exploited in European Fisheries. Journal of Shellfish Research 2016, 35, 405–419. [Google Scholar] [CrossRef]
  2. Aranguren, R.; Gomez-León, J.; Balseiro, P.; Costa, M.M.; Novoa, B.; Figueras, A. Abnormal Mortalities of the Carpet Shell Clam Ruditapes Decussatus (Linnaeus 1756) in Natural Bed Populations: A Practical Approach. Aquaculture Research 2014, 45, 1303–1310. [Google Scholar] [CrossRef]
  3. Bidegain, G.; Bárcena, J.F.; García, A.; Juanes, J.A. Predicting Coexistence and Predominance Patterns between the Introduced Manila Clam (Ruditapes Philippinarum) and the European Native Clam (Ruditapes Decussatus). Estuarine, Coastal and Shelf Science 2015, 152, 162–172. [Google Scholar] [CrossRef]
  4. Borsa, P.; Jarne, P.; Belkhir, K.; Bonhomme, F. Genetic Structure of the Palourde Ruditapes Decussatus L. the Mediterranean. In Genetics and evolution of aquatic organisms; Chapman and Hall: London, 1994; pp. 103–113. [Google Scholar]
  5. Gharbi, A.; Zitari-Chatti, R.; Van Wormhoudt, A.; Dhraief, M.N.; Denis, F.; Said, K.; Chatti, N. Allozyme Variation and Population Genetic Structure in the Carpet Shell Clam Ruditapes Decussatus across the Siculo-Tunisian Strait. Biochemical Genetics 2011, 49, 788–805. [Google Scholar] [CrossRef] [PubMed]
  6. Cordero, D.; Pe??a, J.B.; Saavedra, C. Phylogeographic Analysis of Introns and Mitochondrial DNA in the Clam Ruditapes Decussatus Uncovers the Effects of Pleistocene Glaciations and Endogenous Barriers to Gene Flow. Molecular Phylogenetics and Evolution 2014, 71, 274–287. [Google Scholar] [CrossRef]
  7. Sanna, D.; Lai, T.; Cossu, P.; Scarpa, F.; Dedola, G.L.; Cristo, B.; Francalacci, P.; Curini-Galletti, M.; Mura, L.; Fois, N.; et al. Cytochrome c Oxidase Subunit I Variability in Ruditapes Decussatus (Veneridae) from the Western Mediterranean. The European Zoological Journal 2017, 84, 554–565. [Google Scholar] [CrossRef]
  8. Patarnello, T.; Volckaert, F.A.M.J.; Castilho, R. Pillars of Hercules: Is the Atlantic-Mediterranean Transition a Phylogeographical Break? Molecular Ecology 2007, 16, 4426–4444. [Google Scholar] [CrossRef] [PubMed]
  9. Pascual, M.; Rives, B.; Schunter, C.; MaCpherson, E. Impact of Life History Traits on Gene Flow: A Multispecies Systematic Review across Oceanographic Barriers in the Mediterranean Sea. PLoS ONE 2017, 12. [Google Scholar] [CrossRef]
  10. Bierne, N.; Welch, J.; Loire, E.; Bonhomme, F.; David, P. The Coupling Hypothesis: Why Genome Scans May Fail to Map Local Adaptation Genes. Molecular Ecology 2011, 20, 2044–2072. [Google Scholar] [CrossRef] [PubMed]
  11. El Ayari, T.; Trigui El Menif, N.; Hamer, B.; Cahill, A.E.; Bierne, N. The Hidden Side of a Major Marine Biogeographic Boundary: A Wide Mosaic Hybrid Zone at the Atlantic–Mediterranean Divide Reveals the Complex Interaction between Natural and Genetic Barriers in Mussels. Heredity 2019, 122, 770–784. [Google Scholar] [CrossRef]
  12. Arias-Pérez, A.; Cordero, D.; Borrell, Y.; Sánchez, J.A.; Blanco, G.; Freire, R.; Insua, A.; Saavedra, C. Assessing the Geographic Scale of Genetic Population Management with Microsatellites and Introns in the Clam Ruditapes Decussatus. Ecology and Evolution 2016, 6. [Google Scholar] [CrossRef]
  13. Gharbi, A.; Chatti, N.; Said, K.; Wormhoudt, A. Genetic Variation and Population Structure of the Carpet Shell Clam Ruditapes Decussatus along the Tunisian Coast Inferred from mtDNA and ITS1 Sequence Analysis. Biologia 2010, 65, 688–696. [Google Scholar] [CrossRef]
  14. Cruz, A.; da Costa, F.; Fernández-Pérez, J.; Nantón, A.; Fernández-Boo, S.; Insua, A.; Méndez, J. Genetic Variability in Ruditapes Decussatus Clam Combined with Perkinsus Infection Level to Support Founder Population Selection for a Breeding Program. PeerJ 2020, 8, 1–24. [Google Scholar] [CrossRef] [PubMed]
  15. Saavedra, C.; Milan, M.; Leite, R.B.; Cordero, D.; Patarnello, T.; Cancela, M.L.; Bargelloni, L. Transcriptional Profiling of Populations in the Clam Ruditapes Decussatus Suggests Genetically Determined Differentiation in Gene Expression along Parallel Temperature Gradients and between Races of the Atlantic Ocean and West Mediterranean Sea. Fishes 2023, 8, 203. [Google Scholar] [CrossRef]
  16. Nikula, R.; V�in�l�, R. Phylogeography of Cerastoderma Glaucum (Bivalvia: Cardiidae) across Europe: A Major Break in the Eastern Mediterranean. Marine Biology 2003, 143, 339–350. [Google Scholar] [CrossRef]
  17. Bahri-Sfar, L.; Lemaire, C.; Hassine, O.K.B.; Bonhomme, F. Fragmentation of Sea Bass Populations in the Western and Eastern Mediterranean as Revealed by Microsatellite Polymorphism. Proceedings of the Royal Society of London Series B 2000, 267, 929–935. [Google Scholar] [CrossRef] [PubMed]
  18. Rousset, F. GENEPOP’007: A Complete Re-Implementation of the GENEPOP Software for Windows and Linux. Molecular Ecology Resources 2008, 8, 103–106. [Google Scholar] [CrossRef] [PubMed]
  19. Guo, S.W.; Thompson, E.A. Performing the Exact Test of Hardy-Weinberg Proportion for Multiple Alleles. Biometrics 1992, 48, 361–372. [Google Scholar] [CrossRef] [PubMed]
  20. Excoffier, L.; Lischer, H.E.L. Arlequin Suite Ver 3.5: A New Series of Programs to Perform Population Genetics Analyses under Linux and Windows. Molecular Ecology Resources 2010, 10, 564–567. [Google Scholar] [CrossRef]
  21. Kalinowski, S.T.; Taper, M.L. Maximum Likelihood Estimation of the Frequency of Null Alleles at Microsatellite Loci. Conserv Genet 2006, 7, 991–995. [Google Scholar] [CrossRef]
  22. Chapuis, M.-P.; Estoup, A. Microsatellite Null Alleles and Estimation of Population Differentiation. Molecular Biology and Evolution 2007, 24, 621–631. [Google Scholar] [CrossRef] [PubMed]
  23. Chybicki, I.J.; Burczyk, J. Simultaneous Estimation of Null Alleles and Inbreeding Coefficients. Journal of Heredity 2009, 100, 106–113. [Google Scholar] [CrossRef]
  24. Excoffier, L.; Smouse, P.E.; Quattro, J.M. Analysis of Molecular Variance Inferred from Metric Distances among DNA Haplotypes: Application to Human Mitochondrial DNA Restriction Data. Genetics 1992, 131, 479–491. [Google Scholar] [CrossRef] [PubMed]
  25. N, S.; Nei, M. The Neighbor-Joining Method: A New Method for Reconstructing Phylogenetic Trees’. Molecular Biology and Evolution 1987, 4, 406–425. [Google Scholar] [CrossRef]
  26. Kumar, S.; Stecher, G.; Li, M.; Knyaz, C.; Tamura, K. MEGA X: Molecular Evolutionary Genetics Analysis across Computing Platforms. Molecular Biology and Evolution 2018, 35, 1547–1549. [Google Scholar] [CrossRef]
  27. Pritchard, J.K.; Stephens, M.; Donnelly, P. Inference of Population Structure Using Multilocus Genotype Data. Genetics 2000, 155, 945–959. [Google Scholar] [CrossRef]
  28. Falush, D.; Stephens, M.; Pritchard, J. Inference of Population Structure Using Multilocus Genotype Data: Linked Loci and Correlated Allele Frequencies. Genetics 2003, 164, 1567–1587. [Google Scholar] [CrossRef]
  29. Evanno, G.; Regnaut, S.; Goudet, J. Detecting the Number of Clusters of Individuals Using the Software STRUCTURE: A Simulation Study. Molecular Ecology 2005, 14, 2611–2620. [Google Scholar] [CrossRef]
  30. Leys, M.; Petit, E.J.; El-Bahloul, Y.; Liso, C.; Fournet, S.; Arnaud, J. Spatial Genetic Structure in Beta Vulgaris Subsp. Maritima and Beta Macrocarpa Reveals the Effect of Contrasting Mating System, Influence of Marine Currents, and Footprints of Postglacial Recolonization Routes. Ecology and Evolution 2014, 4, 1828–1852. [Google Scholar] [CrossRef]
  31. Piñeira, J.; Quesada, H.; Rolán-Alvarez, E.; Caballero, A. Genetic Discontinuity Associated with an Environmentally Induced Barrier to Gene Exchange in the Marine Snail Littorina Saxatilis. Mar. Ecol. Prog. Ser. 2008, 357, 175–184. [Google Scholar] [CrossRef]
  32. Alberto, F.; Santos, R.; Leitão, J. Assessing Patterns of Geographic Dispersal of Gelidium Sesquipedale (Rhodophyta) through RAPD Differentiation of Populations. Mar. Ecol. Prog. Ser. 1999, 191, 101–108. [Google Scholar] [CrossRef]
  33. Fraga, F.; Mouriño, C.; Manríquez, M. Res.Exp.Cient. 1982, pp. 51–77.
  34. Alvarez, I.; Gomez-Gesteira, M.; deCastro, M.; Lorenzo, M.N.; Crespo, A.J.C.; Dias, J.M. Comparative Analysis of Upwelling Influence between the Western and Northern Coast of the Iberian Peninsula. Continental Shelf Research 2011, 31, 388–399. [Google Scholar] [CrossRef]
  35. Rodríguez-Moscoso, E.; Arnaiz, R. Gametogenesis and Energy Storage in a Population of the Grooved Carpet-Shell Clam, Tapes Decussatus (Linne, 1787), in Northwest Spain. Aquaculture 1998, 162, 125–139. [Google Scholar] [CrossRef]
  36. Ojea, J.; Martínez, D.; Novoa, S.; Cerviño-Otero, A. Ciclo Gametogénico de Una Población de Almeja Japonesa Ruditapes Philippinarum (Adams & Reeve, 1850) En La Ría de Camariñas (Noroeste de España) y Relación Con La Composición Bioquímica Mayoritaria. Boletin - Instituto Espanol de Oceanografia 2005, 21, 337–342. [Google Scholar]
  37. Peres, P.A.; Bracken-Grissom, H.; Timm, L.E.; Mantelatto, F.L. Genomic Analyses Implicate the Amazon–Orinoco Plume as the Driver of Cryptic Speciation in a Swimming Crab. Genes 2022, 13, 2263. [Google Scholar] [CrossRef] [PubMed]
  38. Narváez-Barandica, J.C.; Quintero-Galvis, J.F.; Aguirre-Pabón, J.C.; Castro, L.R.; Betancur, R.; Acero Pizarro, A. A Comparative Phylogeography of Three Marine Species with Different PLD Modes Reveals Two Genetic Breaks across the Southern Caribbean Sea. Animals 2023, 13, 2528. [Google Scholar] [CrossRef] [PubMed]
  39. Prego, R.; Barciela, M.D.C.; Varela, M. Nutrient Dynamics in the Galician Coastal Area (Northwestern Iberian Peninsula): Do the Rias Bajas Receive More Nutrient Salts than the Rias Altas? Continental Shelf Research 1999, 19, 317–334. [Google Scholar] [CrossRef]
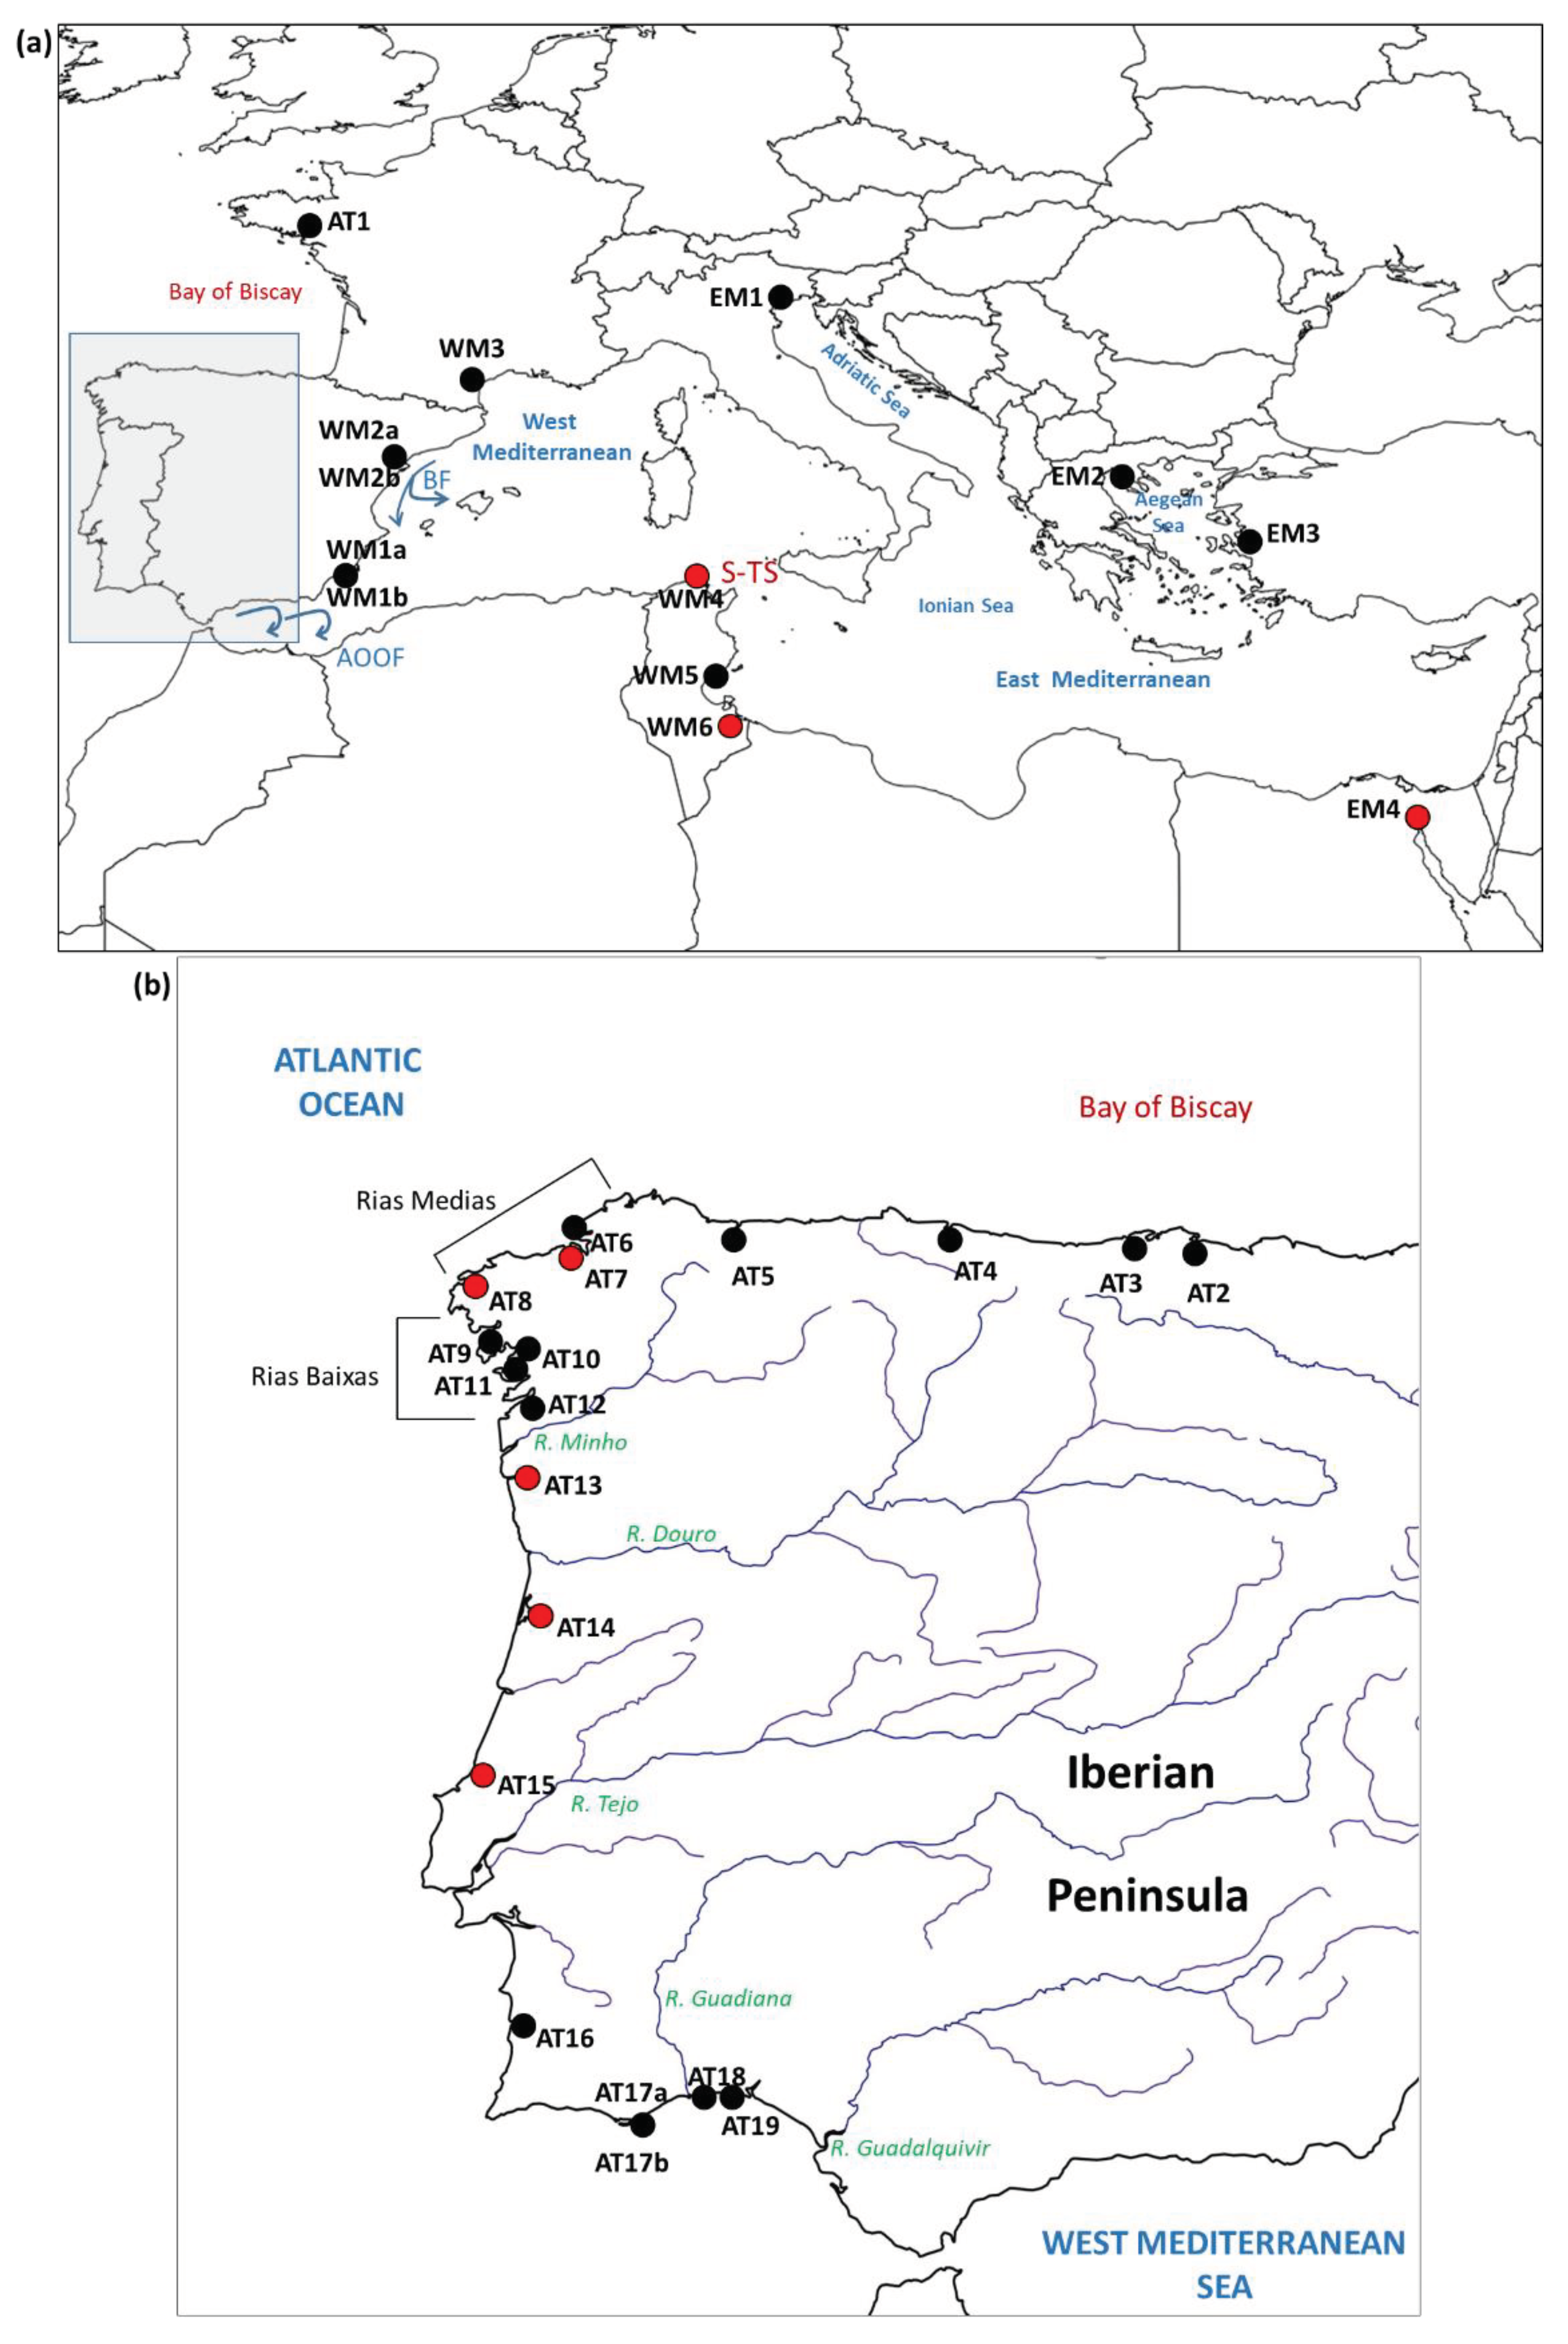
Figure 1. Maps showing the locations considered in this study and the main geographic and oceanographic features cited in the text. Red dots show the new locations sampled for this study. Black dots show locations sampled in previous studies. (a) Locations outside of the Atlantic coasts of the Iberian Peninsula. BF: Balearic Front. AOOF: Almeria-Oran oceanographic front; S-TS: Siculo-Tunisian Strait. (b) Locations on the Atlantic coasts of the Iberian Peninsula.
Preprints 100163 g001
Figure 2. Plot of the mean number of alleles per locus and the mean heterozygosity per locus (H) in the clam populations from the Atlantic (AT), West Mediterranean (WM) and East Mediterranean (EM) regions. Dot sizes are proportional to sample sizes (N).
Preprints 100163 g002
Figure 3. Neighbor-joining tree of the clam populations based on FST distances. Colored lines group populations according to the geographic regions cited in the text. Note the lack of correspondence between genetic distance and geographic position of some populations, marked with squares.
Preprints 100163 g003
Figure 5. Plots of cluster frequencies from the Bayesian analysis of genetic structure for K=2 (above) and K=6 (below), for all individuals and populations. Clusters are defined by colors. The table below gives the average proportions of each cluster in each population for K=6.
Preprints 100163 g005
Figure 6. Currents and fronts at summer near the NW coasts of the Iberian Peninsula. See Discussion for explanations.
Preprints 100163 g006
Table 1. Populations included in this study and, when applicable, references of previous studies where they were first analyzed. Population codes refer to Atlantic coasts (AT), West Mediterranean including eastern Tunisian coasts (WM), and Eastern Mediterranean excluding Tunisian coasts (EM).
Population code Locality Sampling year Reference Population code in reference
AT1 Golfe du Morbihan (France) 2005 [6] GMO
AT2 Carasa (Spain) 2010 [12] Car
AT3 Pontejos (Spain) 2010 [12] Pon
AT4 Villaviciosa (Spain) 2009 [12] Vil
AT5 Ría del Eo (Spain) 2009 [12] Eo
AT6 Mugardos (Spain) 2004 [6] MUG
AT7 A Coruña (Spain) 2005 This study -
AT8 Camariñas (Spain) 2019 This study -
AT9 Ría de Noia (Spain) 2011 [15] AN
AT10 Lombos do Ulla (Spain) 2008 [6] LUL
AT11 Cambados (Spain) 2009 [12] Cam
AT12 Redondela (Spain) 2009 [12] Red
AT13 Viana do Castelo (Portugal) 2021 This study -
AT14 Aveiro (Portugal) 2018 This study -
AT15 Lagoa de Óbidos (Portugal) 2018 This study -
AT16 Milfontes (Portugal) 2008 [6] MLF
AT17a Ria Formosa (Portugal) 2004 [6] FOR
AT17b Ria Formosa (Portugal) 2011 [15] AS
AT18 Isla Cristina (Spain) 2008 [12] Isl
AT19 Río Piedras (Spain) 2008 [12] Rio
WM1a Mar Menor (Spain) 2004 [6] MME
WM1b Mar Menor (Spain) 2011 [15] MS
WM2a Ebro delta (Spain) 2005 [6] EBR
WM2b Ebro delta (Spain) 2009 [12] Del
WM3 Thau lagoon (France) 2011 [15] MN
WM4 Bizerte (Tunisia) 2010 This study -
WM5 Sfax (Tunisia) 2008 [6] SFX
WM6 Biben (Tunisia) 2010 This study -
EM1 Venice (Italy) 2005 [6] VEN
EM2 Halkidiki (Greece) 2008 [6] HAL
EM3 Izmir (Turkey) 2007 [6] IZM
EM4 Suez Canal (Egypt) 2010 This study -
Table 2. Hierarchical F-statistics analysis based on six intron RFLP markers in the grooved carpet-shell clam. Regional groupings of the populations are as in Table 1 except for: Bay of Biscay (AT1, AT2, AT3, AT4, AT5), NW Spain (AT6, AT7, AT8, AT9, AT10, AT11, AT12), North Portugal (AT14, AT15), SW Iberian Peninsula (AT16, AT17a, AT17b, AT18, AT19), and “a” (AT17a, WM1a, WM2a) and “b” (AT17b, WM1b, WM2b) groups in model 11.

Model

F-statistics
 
FST FSC FCT
Models without subdivision
1 - All populations 0,132*** - -
2 - AT populations 0,065*** - -
3 - WM + EM populations 0,080*** - -
4 - WM populations 0,036*** - -
5 - EM populations 0,101*** - -
Models with geographical subdivision
6 - AT/WM/EM 0,186*** 0,063*** 0,131***
7 - WM/EM 0,100*** 0,060*** 0,043**
8 - Bay of Biscay / NW Spain / Central Portugal + AT13 / SW Iberian Peninsula 0,073*** 0,037*** 0,038***
9 - Bay of Biscay / NW Spain + AT13 / Central Portugal / SW Iberian Peninsula 0,075*** 0,033*** 0,043***
10 - Bay of Biscay+AT13 / NW Spain / Central Portugal / SW Iberian Peninsula 0,076*** 0,027*** 0,050***
Model with temporal subdivision
11 – a vs. b 0,129*** 0,185*** -0,068
* P < 0.05; ** P < 0.01; *** P < 0.001
Disclaimer/Publisher’s Note: The statements, opinions and data contained in all publications are solely those of the individual author(s) and contributor(s) and not of MDPI and/or the editor(s). MDPI and/or the editor(s) disclaim responsibility for any injury to people or property resulting from any ideas, methods, instructions or products referred to in the content.
Copyright: This open access article is published under a Creative Commons CC BY 4.0 license, which permit the free download, distribution, and reuse, provided that the author and preprint are cited in any reuse.
Prerpints.org logo

Preprints.org is a free preprint server supported by MDPI in Basel, Switzerland.

Subscribe

© 2024 MDPI (Basel, Switzerland) unless otherwise stated