Submitted:
28 February 2024
Posted:
06 March 2024
You are already at the latest version
Abstract
Keywords:
1. Introduction
2. Materials and Methods
3. Results and Discussion
4. Conclusions
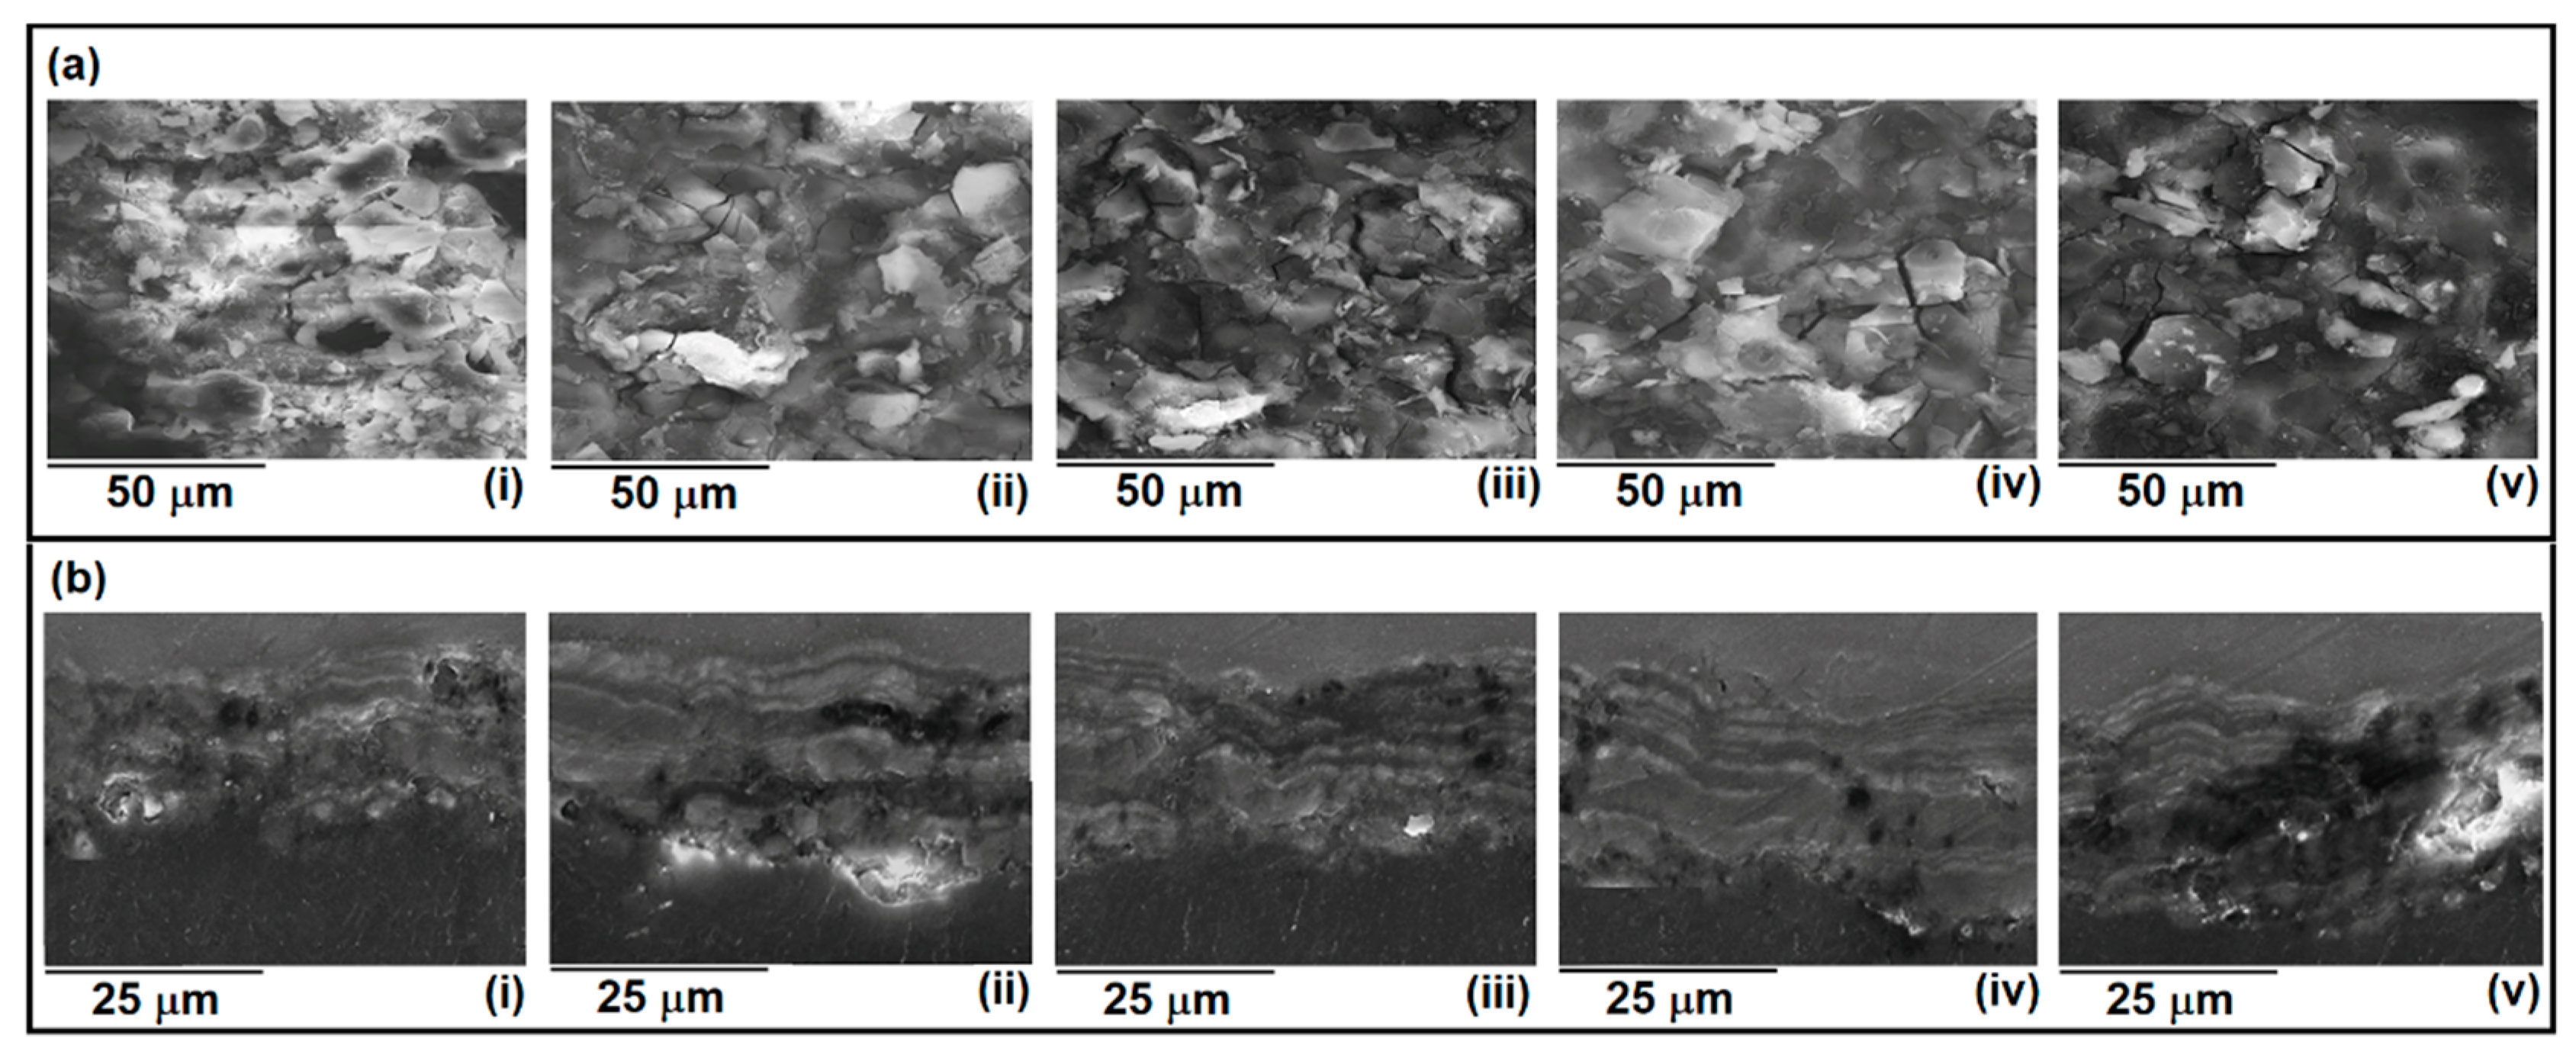
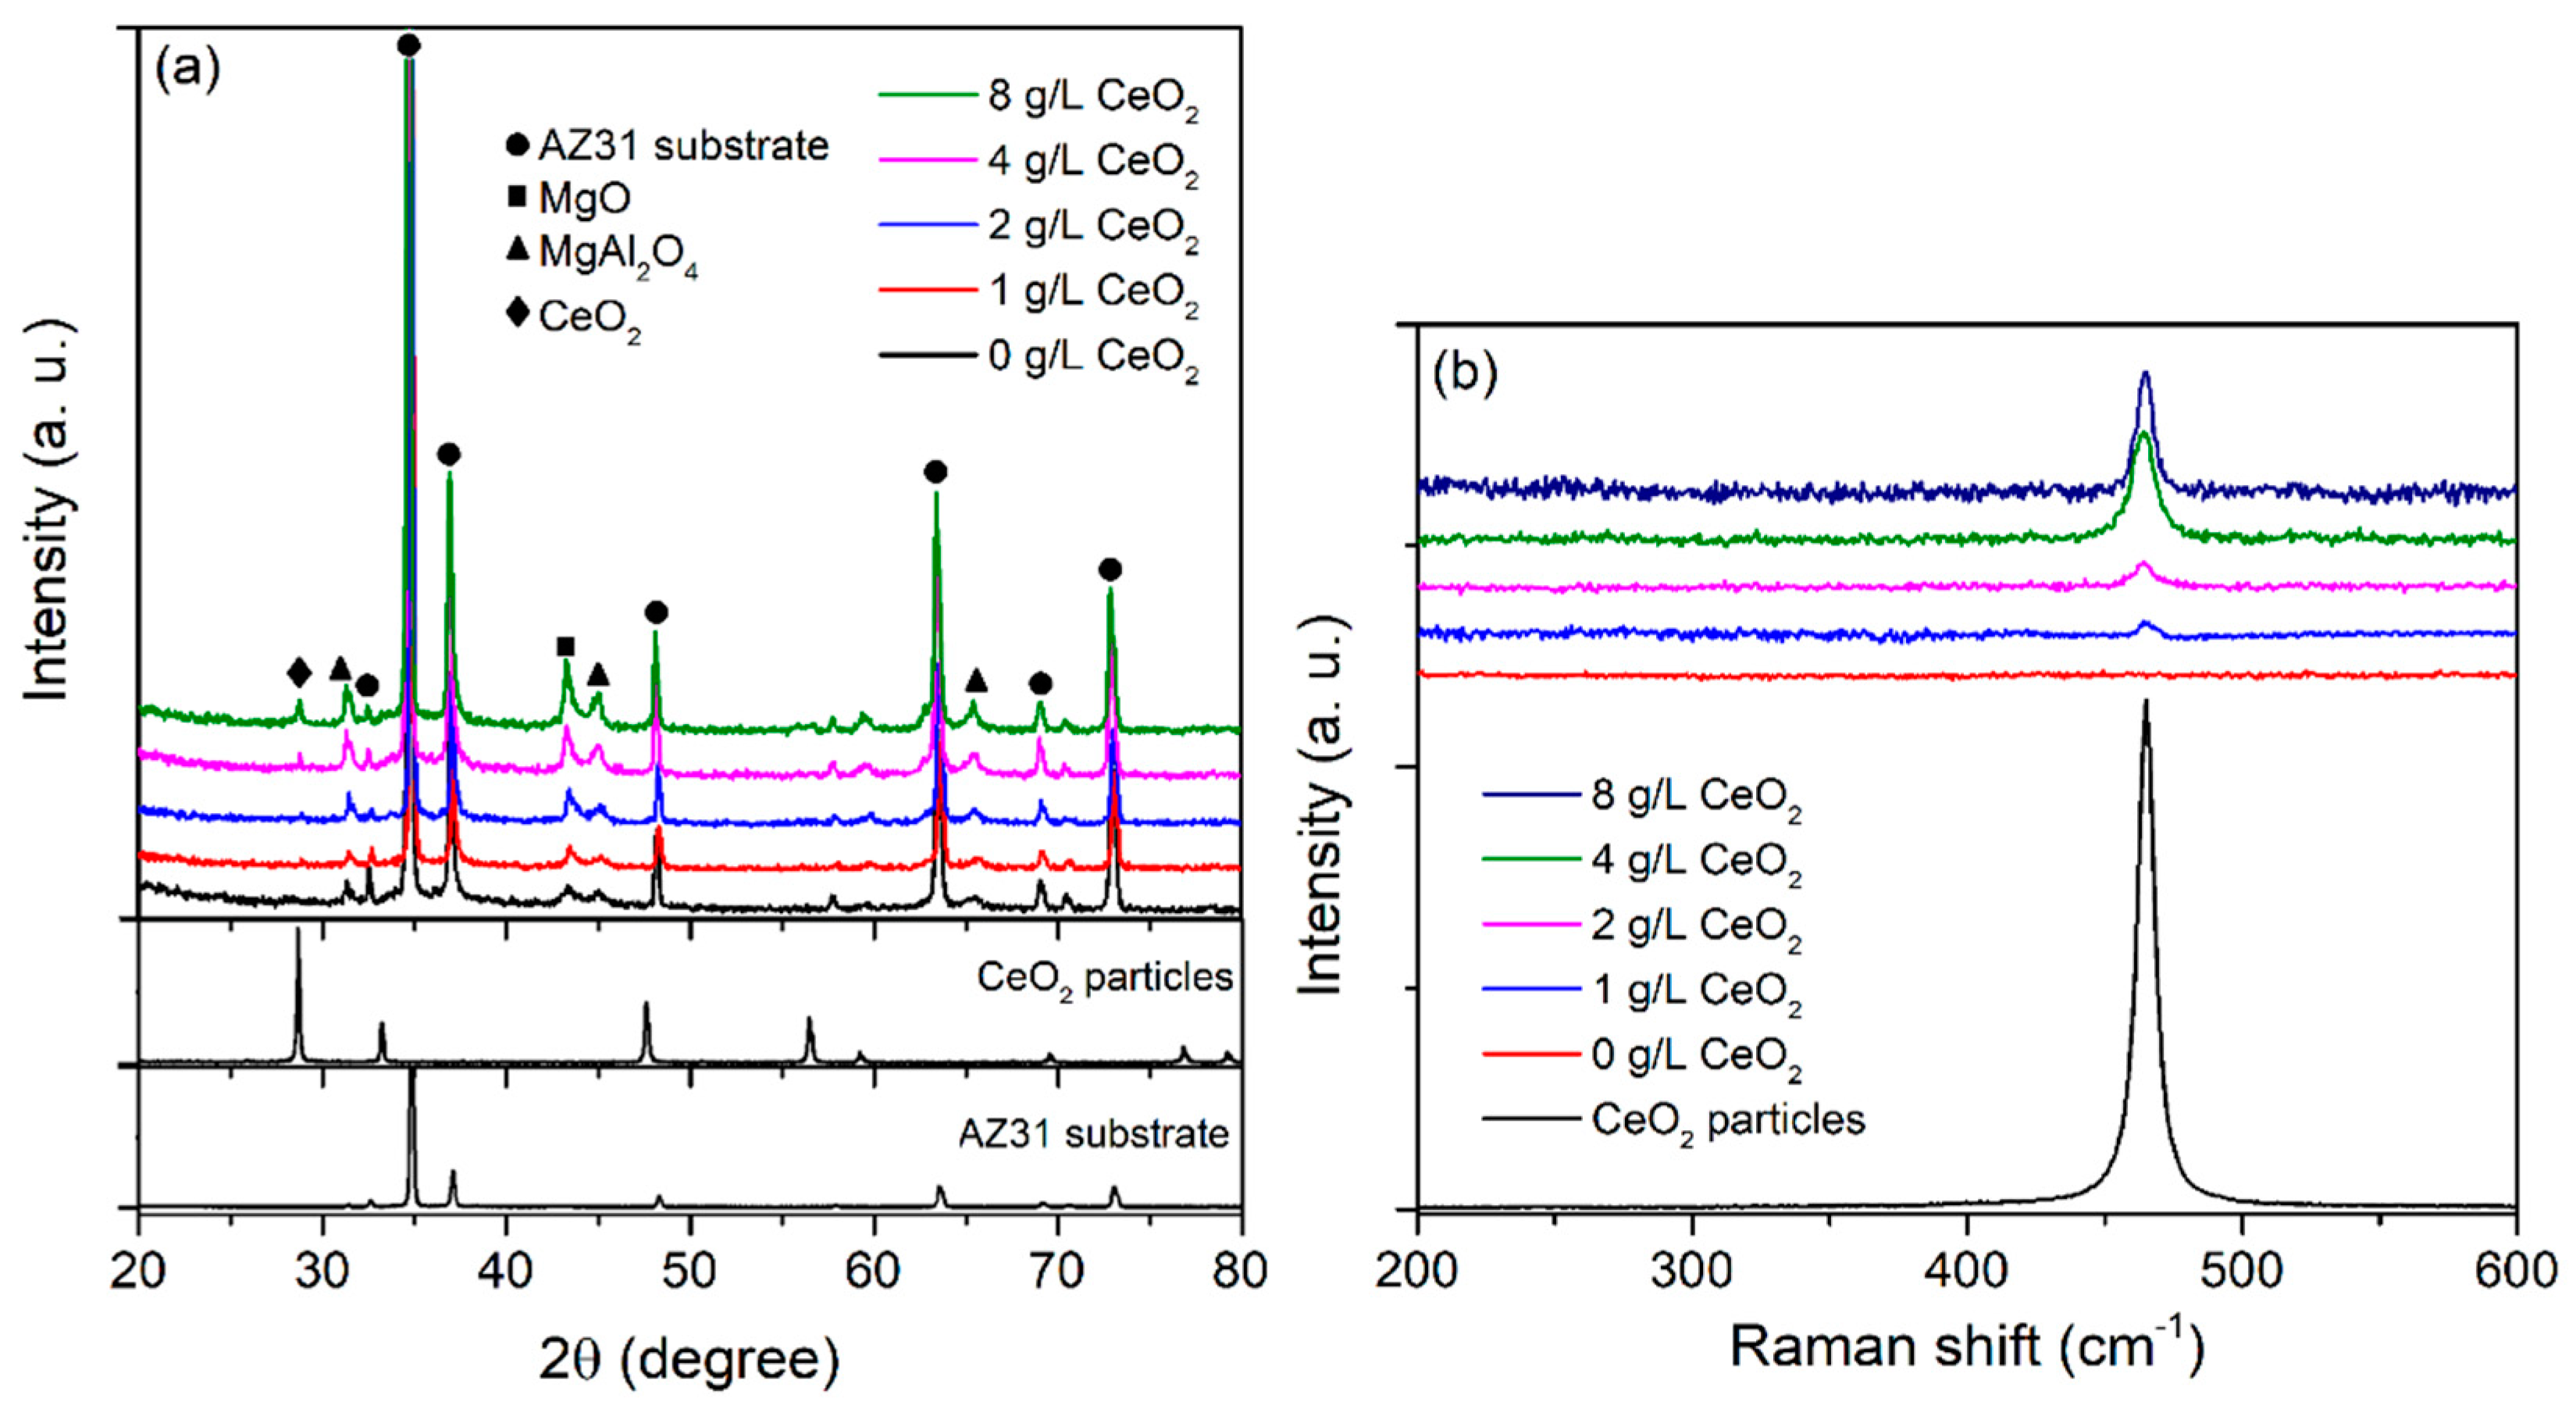
- The surface morphology, thickness, phase structure, and optical absorption of all formed coatings are not significantly affected by the addition of CeO2 particles to the aluminate electrolyte.
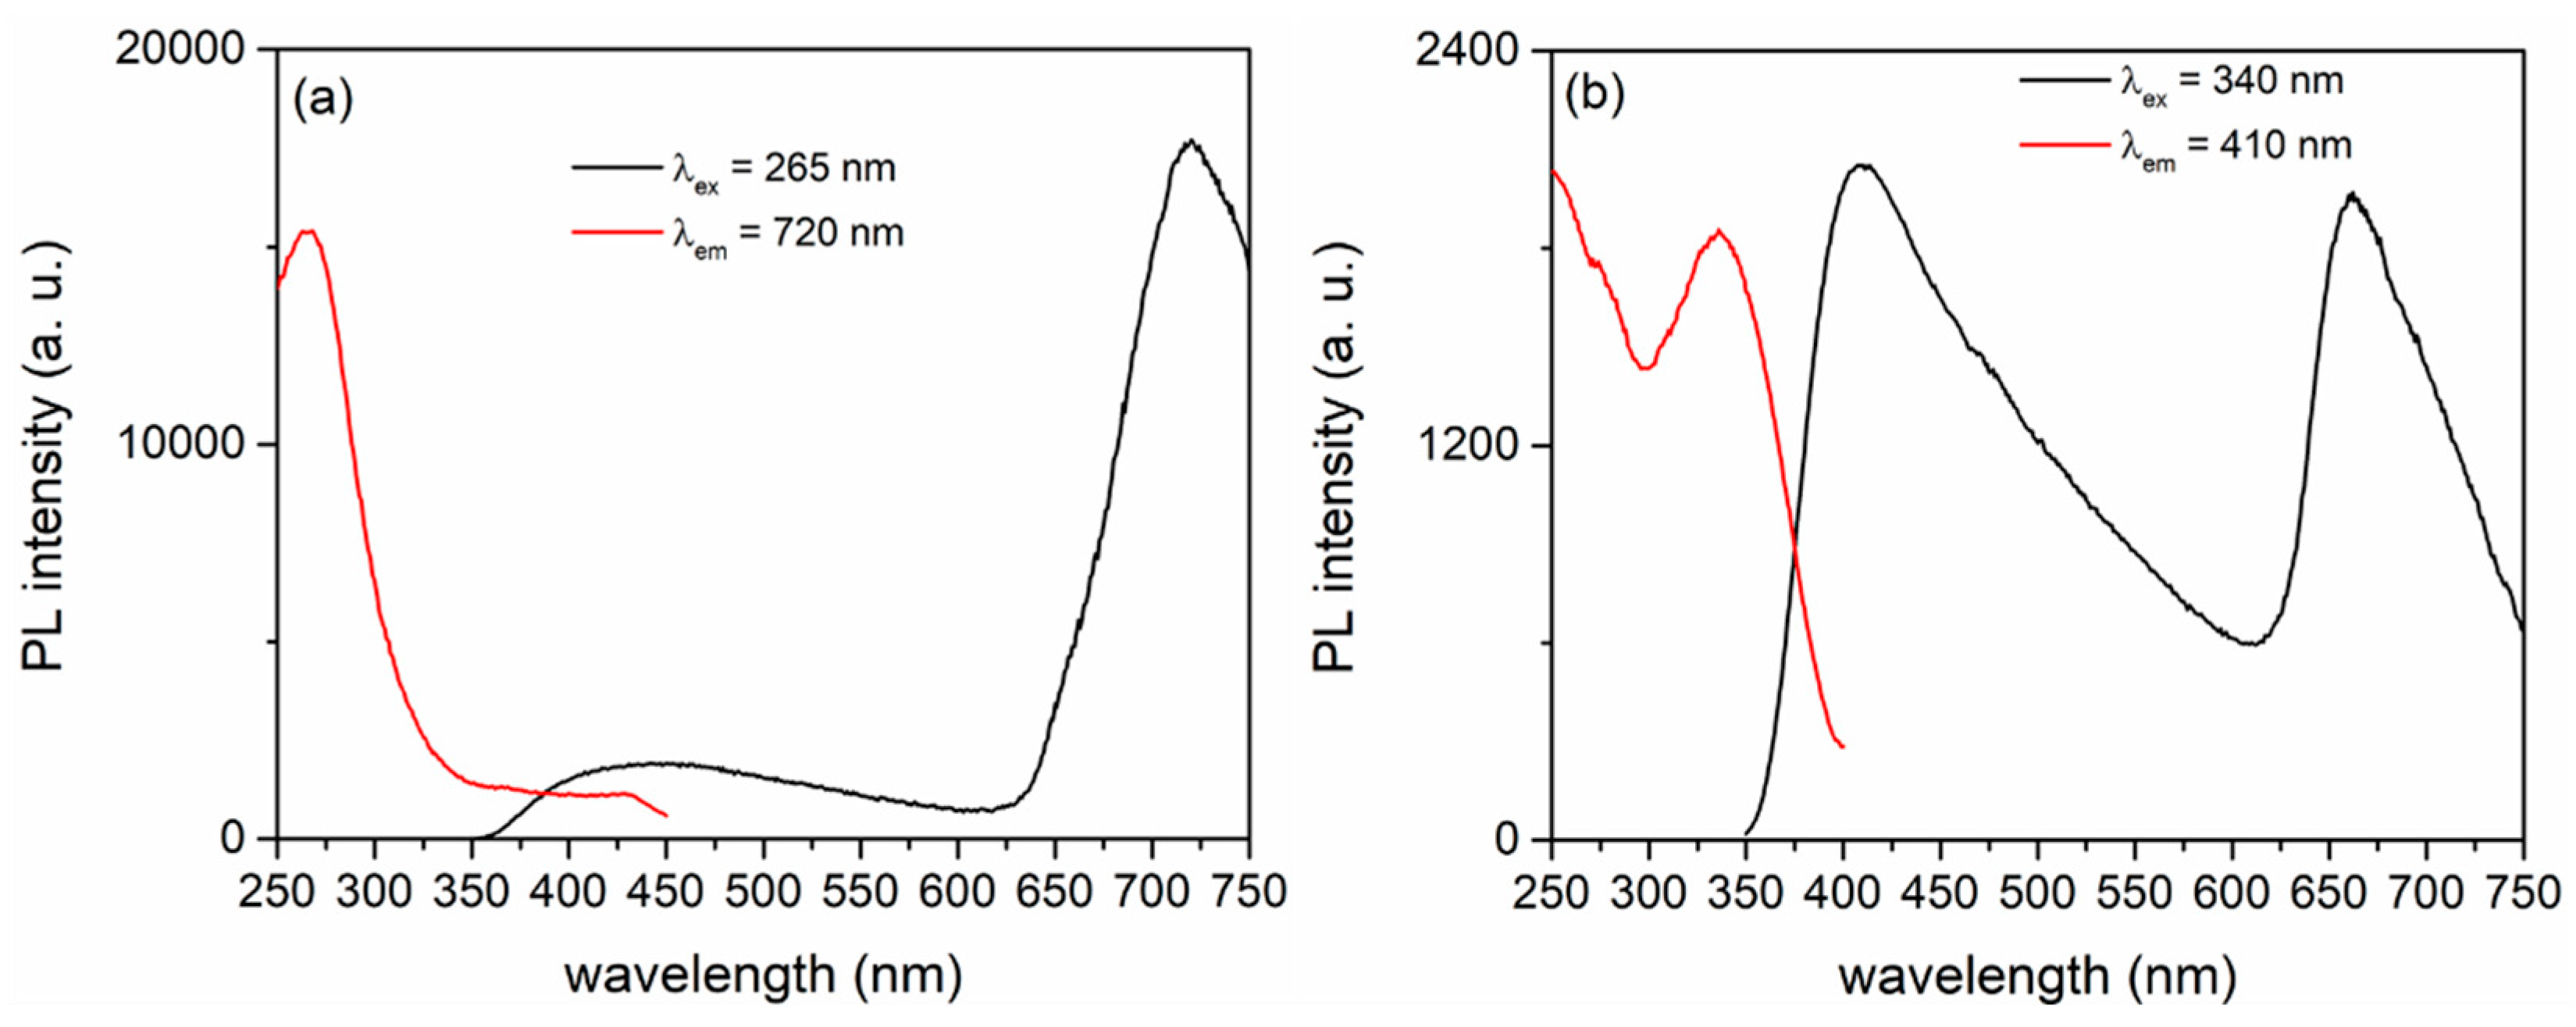
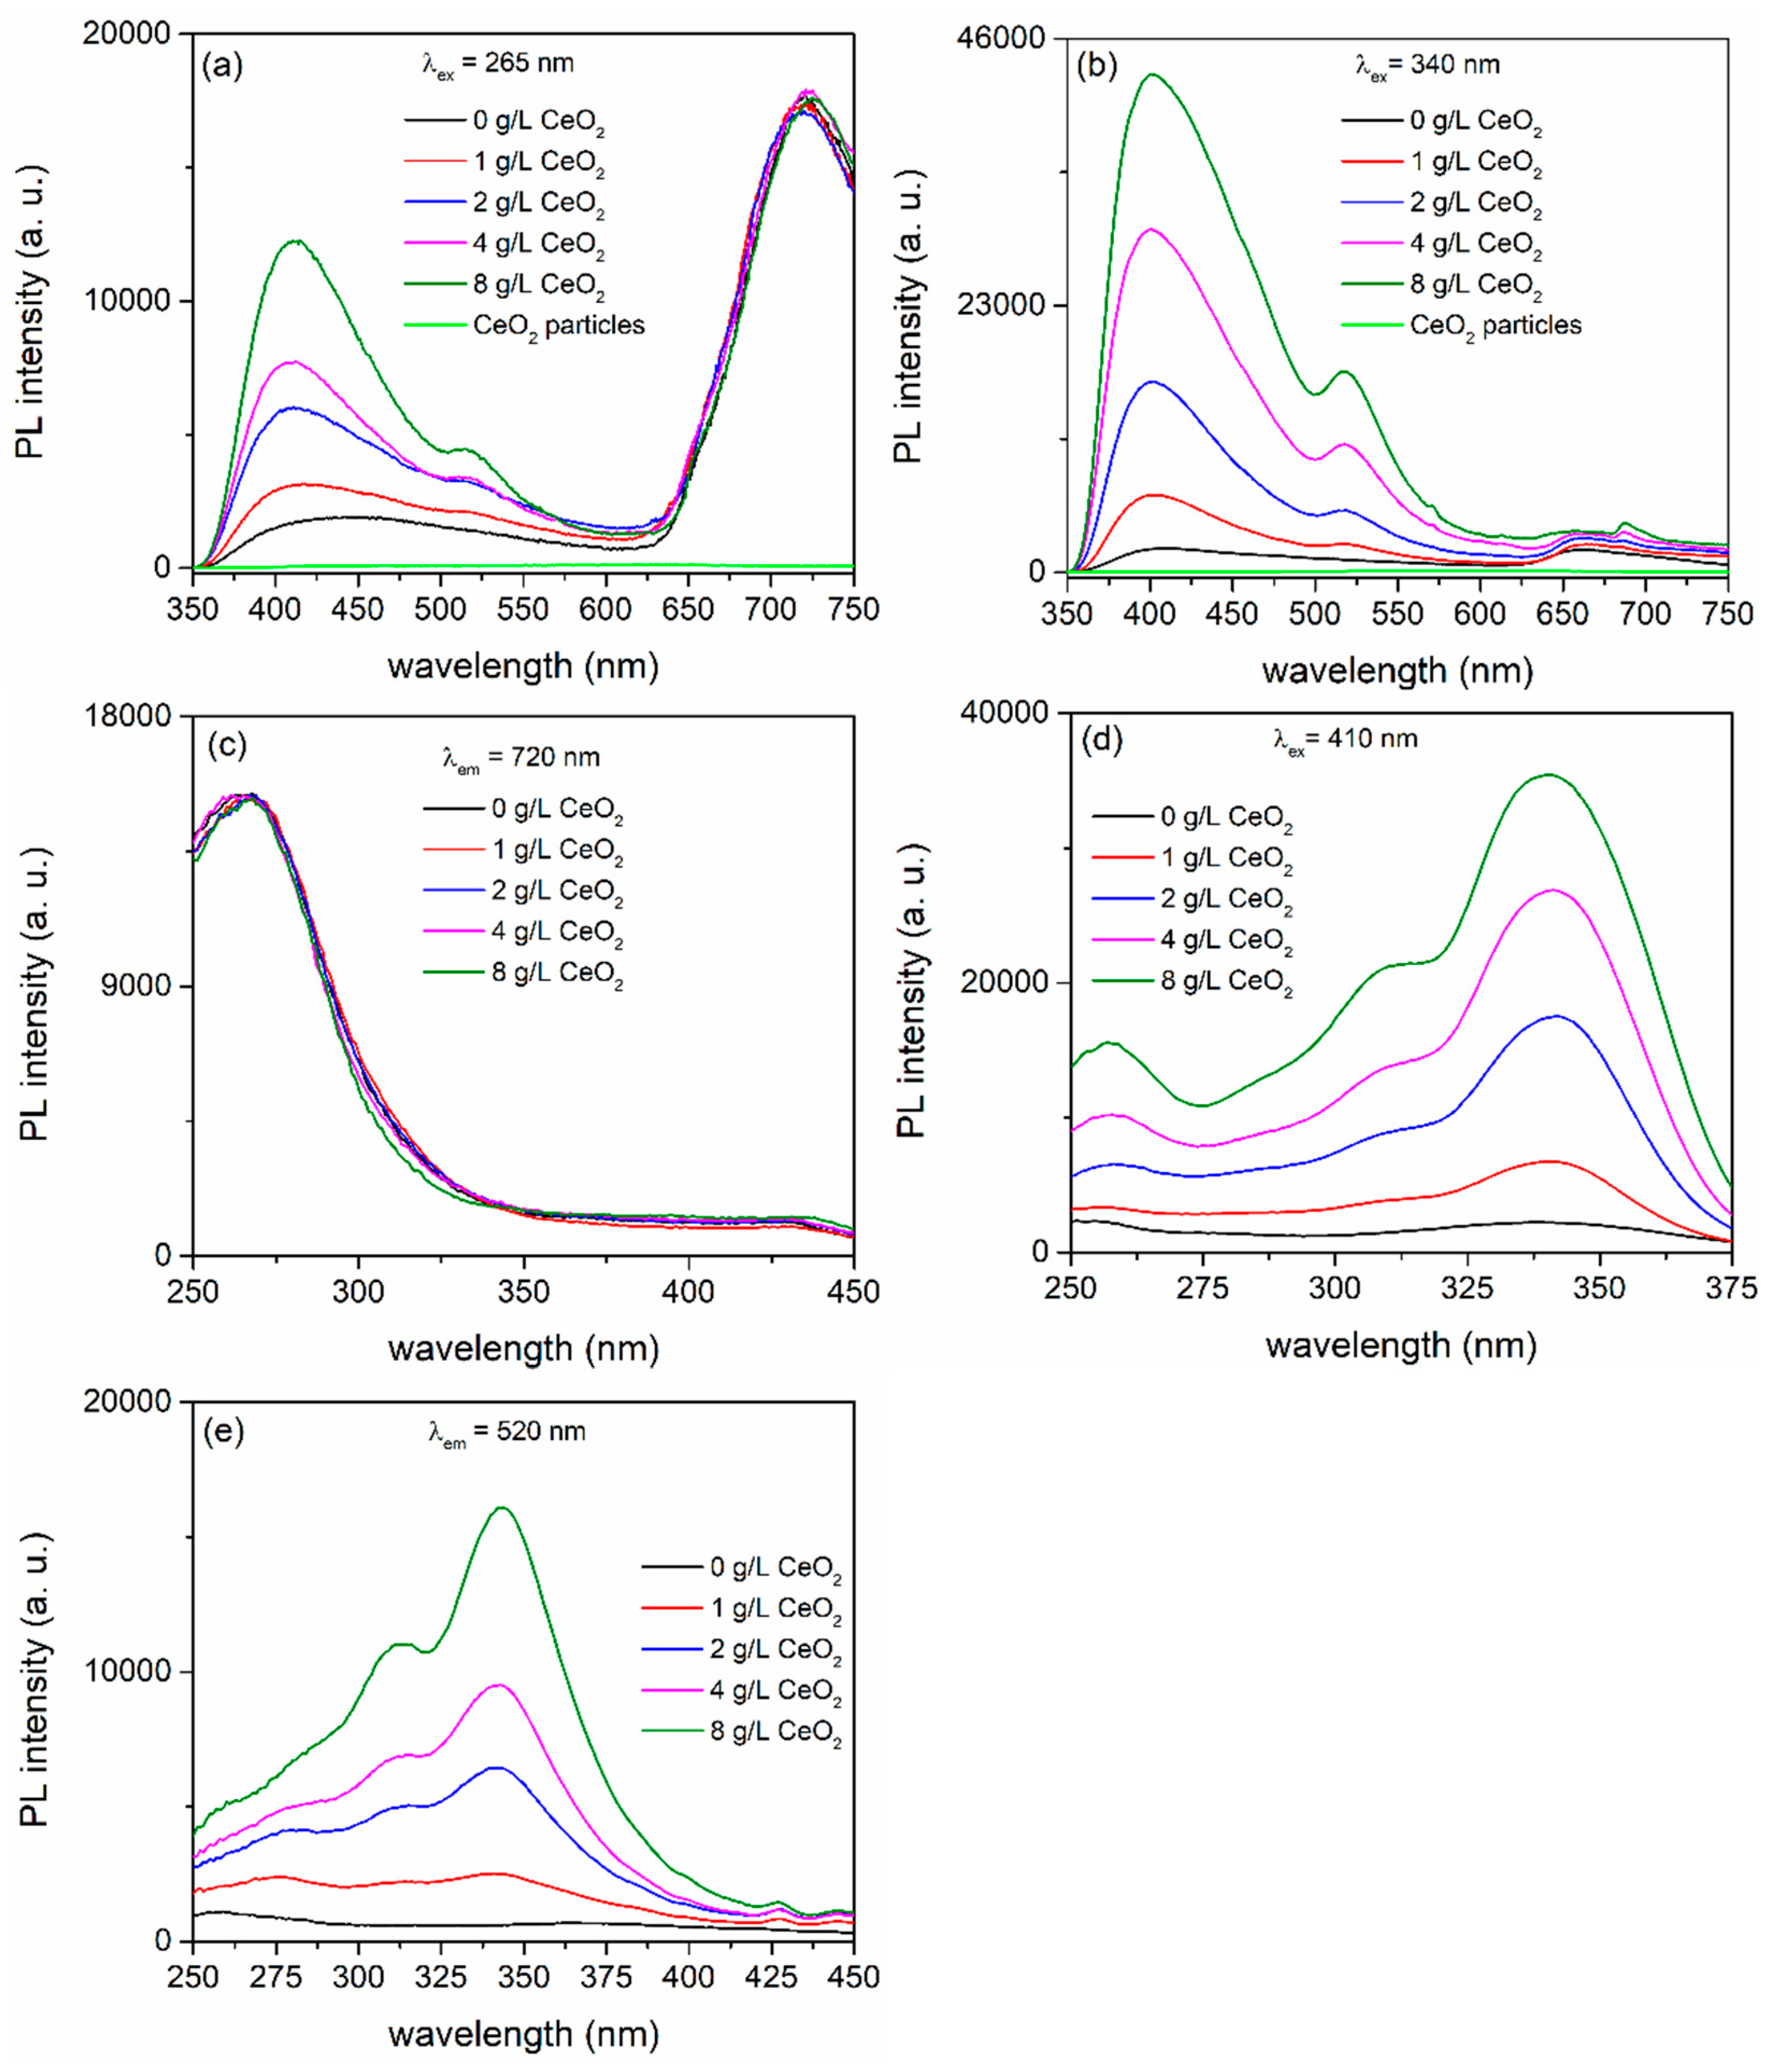
- As a result of the incorporation of CeO2 in coatings during PEO, oxygen vacancies are created, which accounts for the increase in PL intensity of MgO/MgAl2O4/CeO2 coatings over pure MgO/MgAl2O4 coating because PL originating from CeO2 particles is barely noticeable.
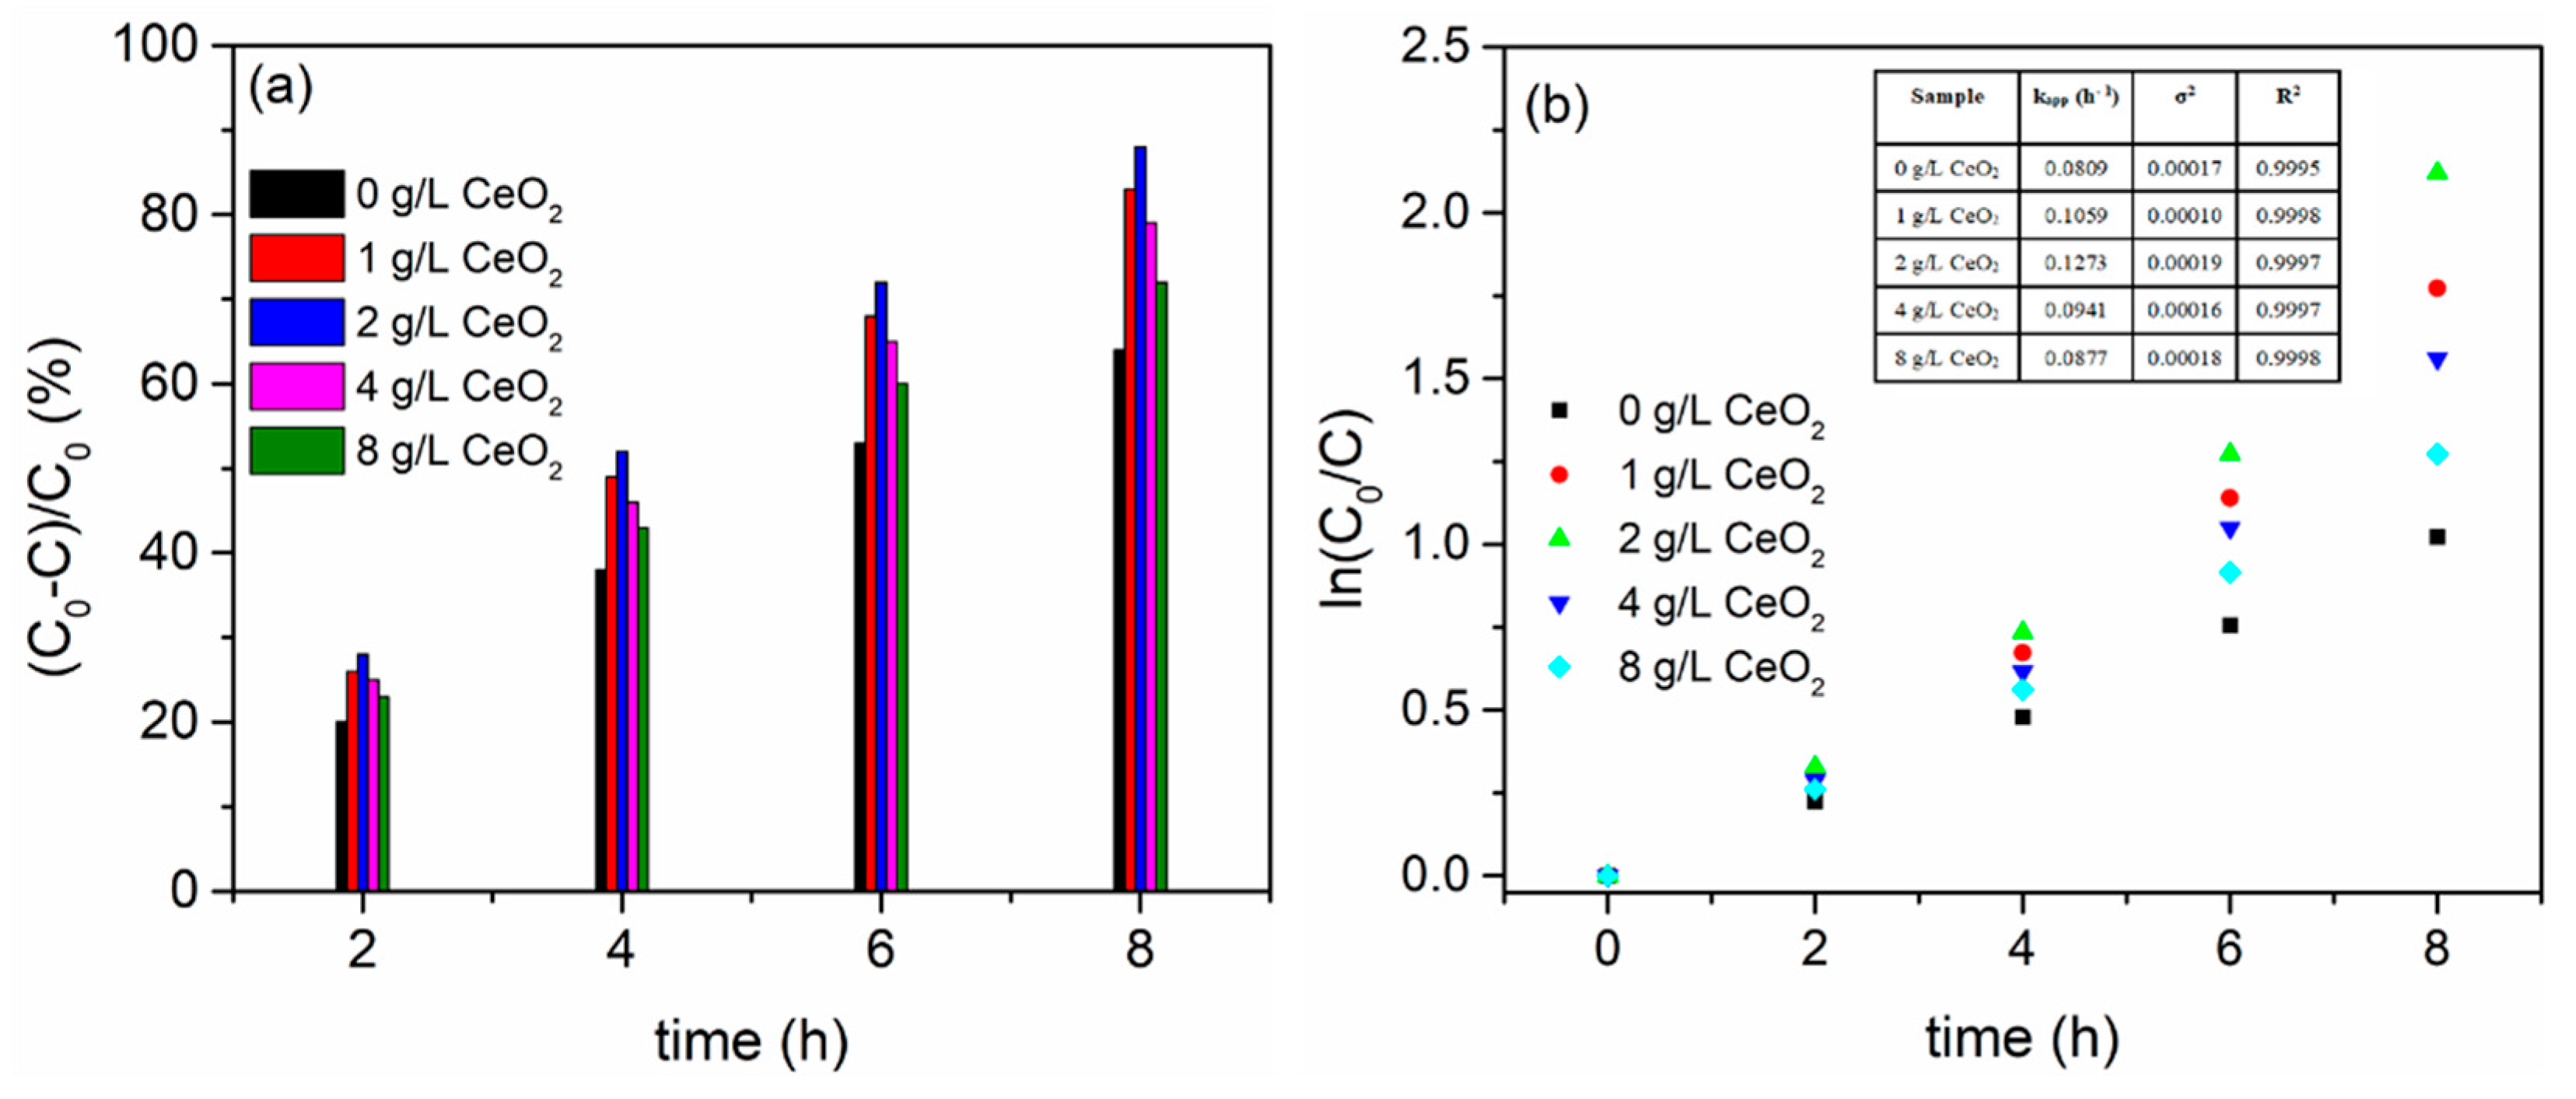
- The concentration of CeO2 particles in the aluminate electrolyte, i.e. the amount of CeO2 particles incorporated into MgO/MgAl2O4 coatings, determines the PA of MgO/MgAl2O4/CeO2 coatings. The decrease in photo-generated electron/hole recombination rate resulting from MgO/MgAl2O4 and CeO2 coupling is linked to the increased PA of MgO/MgAl2O4/CeO2. The MgO/MgAl2O4/CeO2 coating, which was formed in the aluminate electrolyte with the addition of 2 g/L CeO2 particles, exhibits the highest PA.
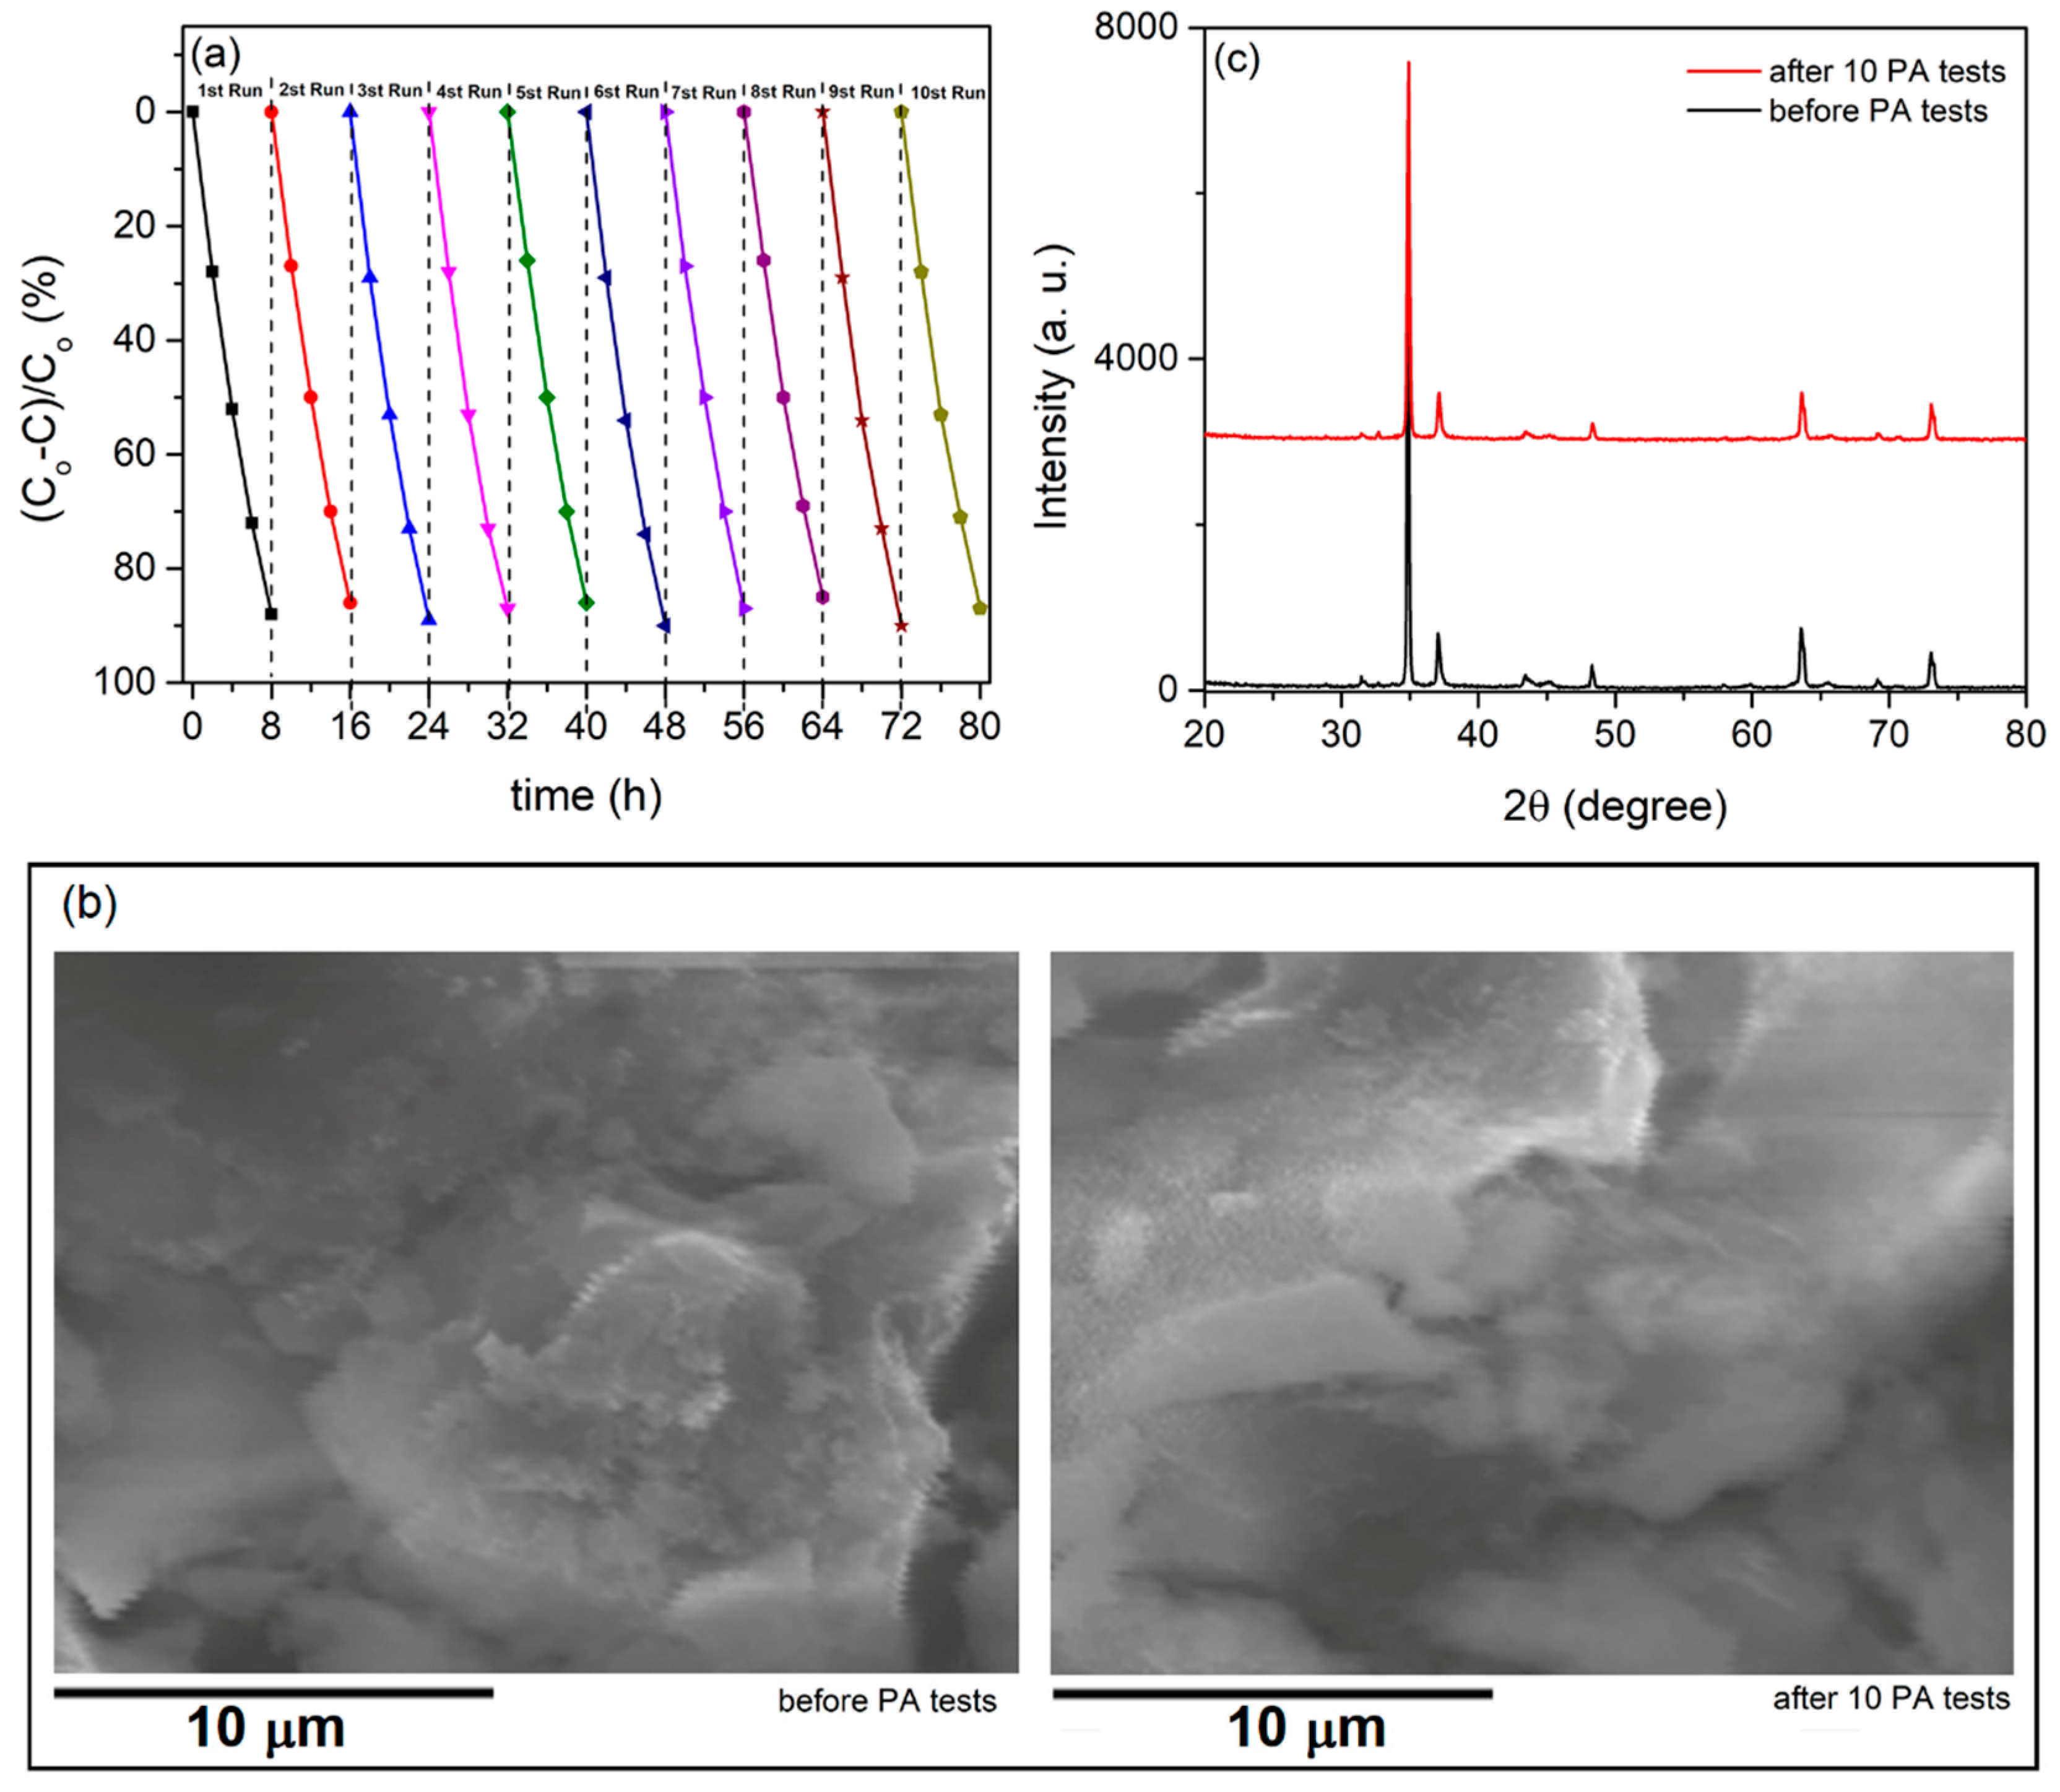
- The PA, morphology, and compositions of the formed photocatalysts did not alter after multiple PA cycles, indicating their chemical and physical stability - a crucial requirement for any potential uses.
Author Contributions
Funding
Data Availability Statement
Conflicts of Interest
References
- Kaseem, M.; Fatimah, S.; Nashrah, N.; Ko, Y.G. Recent progress in surface modification of metals coated by plasma electrolytic oxidation: Principle, structure, and performance. Prog. Mater. Sci. 2021, 117, 100735. [CrossRef]
- Simchen, F.; Sieber, M.; Kopp, A.; Lampke, T. Introduction to plasma electrolytic oxidation—An overview of the process and applications. Coatings 2020, 10, 628. [CrossRef]
- Tsai, D.-S.; Chou, C.-C. Review of the soft sparking issues in plasma electrolytic oxidation. Metals 2018, 8, 105. [CrossRef]
- Sikdar, S.; Menezes, P.V.; Maccione, R.; Jacob, T.; Menezes, P.L. Plasma electrolytic oxidation (PEO) process - processing, properties, and applications. Nanomaterials 2021, 11, 1375. [CrossRef]
- Clyne, T.W.; Troughton, S.C. A review of recent work on discharge characteristics during plasma electrolytic oxidation of various metals. Int. Mater. Rev. 2019, 64, 127–162. [CrossRef]
- Yang, Y.; Xiong, X.; Chen, J.; Peng, X.; Chen, D.; Pan, F. Research advances of magnesium and magnesium alloys worldwide in 2022. J. Magnes. Alloys 2023, 11, 2611–2654. [CrossRef]
- Tan, J.; Ramakrishna, S. Applications of magnesium and its alloys: A review. Appl. Sci. 2021, 11, 6861. [CrossRef]
- Esmaily, M.; Svensson, J.E.; Fajardo, S.; Birbilis, N.; Frankel, G.S.; Virtanen, S.; Arrabal, R.;0 Thomas, S.; Johansson, L.G. Fundamentals and advances in magnesium alloy corrosion. Prog. Mater. Sci. 2017, 89, 92–193. [CrossRef]
- Gray, J.E.; Luan, B. Protective coatings on magnesium and its alloys—A critical review. J. Alloys Compd. 2002, 336, 88–113. [CrossRef]
- Zhao, C.; Wang, X.; Yu, B.; Cai, M.; Yu, Q.; Zhou, F. Research progress on the wear and corrosion resistant plasma electrolytic oxidation composite coatings on magnesium and its alloys. Coatings 2023, 13, 1189. [CrossRef]
- Barati Darband, G.; Aliofkhazraei, M.; Hamghalam, P.; Valizade, N. Plasma electrolytic oxidation of magnesium and its alloys: Mechanism, properties and applications. J. Magnes. Alloys 2017, 5, 74–132. [CrossRef]
- Whitea, L.; Koo, Y.; Neralla, S.; Sankar, J.; Yun, Y. Enhanced mechanical properties and increased corrosion resistance of a biodegradable magnesium alloy by plasma electrolytic oxidation (PEO). Mater. Sci. Eng. B 2016, 208, 39–46. [CrossRef]
- Usmaniya, N.; Pillai, S.R.; Edalacheruvu, L.; Palanivel, M.; Chennampalli, P.; Vaithiyanathan, P.; Parfenov, E.; Lingamaneni, R.K.; Nagumothu, R. Effect of polycaprolactone coating on the corrosion and biological characteristics of plasma electrolytic oxidised ZM21 magnesium alloy. Surf. Coat. Technol. 2023, 471. [CrossRef]
- Fattah-alhosseini, A.; Molaei, M.; Nouri, M.; Babaei, K. Antibacterial activity of bioceramic coatings on Mg and its alloys created by plasma electrolytic oxidation (PEO): A review. J. Magnes. Alloys 2022, 10, 81–96. [CrossRef]
- Kumara, S.; Katyala, P.; Chaudhary, R.N.; Singh, V. Assessment of factors influencing bio-corrosion of magnesium based alloy implants: A review. Mater. Today Proc. 2022, 56, 2680–2689. [CrossRef]
- Kröger, N.; Kopp, A.; Staudt, M.; Rusu, M.; Schuh, A.; Liehn, E.A. Hemocompatibility of plasma electrolytic oxidation (PEO) coated Mg-RE and Mg-Zn-Ca alloys for vascular scaffold applications. Mater. Sci. Eng. C 2018, 92, 819–826. [CrossRef]
- HHusak, Y.; Olszaniecki, J.; Pykacz, J.; Ossowska, A.; Blacha-Grzechnik, A.; Waloszczyk, N.; Babilas, D.; Korniienko, V.; Varava, Y.; Diedkova, K.; Kyrylenko, S.; Hodzic, A.; Krichbaum, M.; Lu, X.; Dryhval, B.; Pogorielov, M.; Simka, W. Influence of silver nanoparticles addition on antibacterial properties of PEO coatings formed on magnesium. Appl. Surf. Sci. 2024, 654, 159387 [CrossRef]
- Patrascu, I.; Ducu, M.C.; Negrea, A.D.; Moga, S.G.; Plaiasu, A.G. Overview on plasma electrolytic oxidation of magnesium alloys for medical and engineering applications. IOP Conf. Series: Mater. Sci. Eng. 2022, 1251, 012001. [CrossRef]
- Tang, M.; Li, G.; Li, W.; Liu, H.; Zhu, L. Photocatalytic performance of magnesium alloy microarc oxides. J. Alloys Compod 2013, 562, 84–89. [CrossRef]
- Li, W.; Tang, M.; Zhu, L.; Liu, H. Formation of microarc oxidation coatings on magnesium alloy with photocatalytic performance. Appl. Surf. Sci. 2012, 258, 10017–10021. [CrossRef]
- Stojadinović, S.; Tadić, N.; Radić, N.; Grbić, B.; Vasilić, R. MgO/ZnO coatings formed on magnesium alloy AZ31 by plasma electrolytic oxidation: Structural, photoluminescence and photocatalytic investigation. Surf. Coat. Technol. 2017, 310, 98–105. [CrossRef]
- Stojadinović, S.; Radić, N.; Vasilić, R. ZnO particles modified MgAl coatings with improved photocatalytic activity formed by plasma electrolytic oxidation of AZ31 magnesium alloy in aluminate electrolyte. Catalysts 2022, 12, 1503. [CrossRef]
- Stojadinović, S.; Radić, N.; Vasilić, R. Photoluminescent and photocatalytic properties of Eu3+-doped MgAl oxide coatings formed by plasma electrolytic oxidation of AZ31 magnesium alloy. Coatings 2022, 12, 1830. [CrossRef]
- Supin, K.K.; Saji, A.; Chanda, A.; Vasundhara, M. Effects of calcinations temperatures on structural, optical and magnetic properties of MgO nanoflakes and its photocatalytic applications Opt. Mater. 2022, 132, 112777. [CrossRef]
- Nitha, T.V.; Britto, S. MgAl2O4 nanospinel: Green synthesis, characterization and effective heterogeneous catalyst for the photocatalytic degradation of carbol fuchsin dye and synthesis of 2-aryl substituted benzoxazole derivatives. Inorg. Chem. Commun. 2024, 159, 111776. [CrossRef]
- Kiran, N.; Baker, A.P.; Wang, G.-G. Synthesis and luminescence properties of MgO:Sm3+ phosphor for white light-emitting diodes. J. Mol. Struct. 2017, 1129, 211–215. [CrossRef]
- Kumar, K.G. Bhargav, P.B.; Aravinth, K.; N. Ahmed, N.; Balaji, C. Photoluminescence and electrochemical performance evaluation of Eu3+ doped MgAl2O4 phosphors for LED and energy storage applications. Ceram. Int. 2022, 48, 36038–36045. [CrossRef]
- Mohedano, M.; Blawert, C.; Zheludkevich, M. L. Silicate-based plasma electrolytic oxidation (PEO) coatings with incorporated CeO2 particles on AM50 magnesium alloy. Mater. Des. 2015, 86, 735–744. [CrossRef]
- Lim, T.S.; Ryu, H.S.; Hong, S.-H. Electrochemical corrosion properties of CeO2-containing coatings on AZ31 magnesium alloys prepared by plasma electrolytic oxidation. Corros. Sci. 2012, 62, 104–111. [CrossRef]
- Pan, J. Wang, S.; Chen, A.; Chen, Y.; Wang, M.; Chen, Y. Visible-light-active mesoporous ceria (CeO2) nanospheres for improved photocatalytic performance. J. Alloys Compd. 2022, 898, 162895. [CrossRef]
- Kusmierek, E. A CeO2 semiconductor as a photocatalytic and photoelectrocatalytic material for the remediation of pollutants in industrial wastewater: a review. Catalysts 2020, 10, 1435. [CrossRef]
- Pudukudy, M.; Jia, Q.; Yuan, J.; Megala, S.; Rajendran, R.; Shan, S. Influence of CeO2 loading on the structural, textural, optical and photocatalytic properties of single-pot sol-gel derived ultrafine CeO2/TiO2 nanocomposites for the efficient degradation of tetracycline under visible light irradiation. Mater. Sci. Semicond. Process. 2020, 108, 104891. [CrossRef]
- Habib, I.Y.; Burhan, J.; Jaladi, F.; Lim, C.M.; Usman, A.; Kumara, N.T.R.N.; Tsang, S.C.E.; Mahadi, A.H. Effect of Cr doping in CeO2 nanostructures on photocatalysis and H2O2 assisted methylene blue dye degradation. Catal. Today 2021, 375, 506–513. [CrossRef]
- Salimi, K. Self-assembled bio-inspired Au/CeO2 nano-composites for visible white LED light irradiated photocatalysis. Colloids Surf. A 2020, 559, 124908. [CrossRef]
- Wang, S.; Gao, H.; Li, J.; Wang, Y.; Chen, C.; Yu, X.; Tang, S.; Zhao, X.; Sun, G.; Li, D. Comparative study of the photoluminescence performance and photocatalytic activity of CeO2/MgAl2O4 composite materials with an n-n heterojunction prepared by one-step synthesis and two-step synthesis methods. J. Phys. Chem. Solids 2021, 150, 109891. [CrossRef]
- Matsukevich, I.; Kulinich, N.; Kulbitskaya, L.; Kuznetsova, T.; Popkov, V.; Chebanenko, M.; Moskovskikh, D.; Kuskov, K.; Romanovski, V. Mesoporous nanocomposites based on CeO2 and MgO: preparation, structure and photocatalytic activity. J. Chem. Technol. Biotechnol. 2023, 98, 2497–2505. [CrossRef]
- Hoque, K.A.; Kumer, A.; Chakma, U.; Chowdhury, A.-N. Facile Synthesis of computationally designed MgAl2O4/CeO2/Cu2O and MgAl2O4/CeO2/Ag2O smart heterojunction photocatalysts for aqueous organic pollutants degradation. ECS Trans. 2022, 107, 13785–13796. [CrossRef]
- Stojadinović, S.; Radić, N.; Perković, M. Highly efficient ZrO2 photocatalysts in the presence of UV radiation synthesized in a very short time by plasma electrolytic oxidation of zirconium. Opt. Mater. 2023, 146, 114608. [CrossRef]
- Rakoch, A.G.; Monakhova, E.P.; Khabibullina, Z.V.; Serdechnova, M.; Blawert, C.; Zheludkevich, M.L.; Gladkova, A.A. Plasma electrolytic oxidation of AZ31 and AZ91 magnesium alloys: Comparison of coatings formation mechanism. J. Magnes. Alloys 2020, 8, 587–600 [CrossRef]
- Zimou, J.; Nouneh, K.; Hsissou, R.; El-Habib, A.; El Gana, L.; Talbi, A.; Beraich, M.; Lotfi, N.; Addou, M. Structural, morphological, optical, and electrochemical properties of Co-doped CeO2 thin films. Mater. Sci. Semicond. Process. 2021, 135, 106049. [CrossRef]
- Lua, X.; Mohedano, Ma.; Blawerta, C.; Matykina, E.; Arrabal, R.; Kainer, K.U.; M.L. Zheludkevich, Plasma electrolytic oxidation coatings with particle additions– A review. Surf. Coat. Technol. 2016, 307, 1165–1182. [CrossRef]
- Orsetti, F.R.; Bukman, L.; Santos, J.S.; Nagay, B.E.; Rangel, E.C.; Cruz, N.C. Methylene blue and metformin photocatalytic activity of CeO2-Nb2O5 coatings is dependent on the treatment time of plasma electrolytic oxidation on titanium. Appl. Surf. Sci. Adv. 2021, 6, 100143. [CrossRef]
- Pathak, N.; Ghosh, P.S.; Gupta, S.K.; Mukherjee, S.; Kadam, R.M.; Arya, A. An insight into the various defects induced emission in MgAl2O4 and their tunability with phase behavior: Combined experimental and theoretical approach. J. Phys. Chem. C 2016, 120, 4016–4031. [CrossRef]
- Choudhuryn, B.; Basyach, P.; Choudhury, A. Monitoring F, F+ and F22+ related intense defect emissions from nanocrystalline MgO. J. Lumin. 2014, 149, 280–286. [CrossRef]
- Pathak, N.; Ghosh, P.S.; Gupta, S.K.; Kadam, R.M.; Arya, A. Defects induced changes in the electronic structures of MgO and their correlation with the optical properties: a special case of electron–hole recombination from the conduction band. RSC Adv. 2016, 6, 96398. [CrossRef]
- Stojadinović, S.; Tadić, Radić, N.; Grbić, B.; Vasilić, R. MgO/ZnO coatings formed on magnesium alloy AZ31 by plasma electrolytic oxidation: Structural, photoluminescence and photocatalytic investigation. Surf. Coat. Technol. 2017, 310, 98–105. [CrossRef]
- Zhang, J.; Zhang, L. Intensive green light emission from MgO nanobelts. Chem. Phys. Lett. 2002, 363, 293–297. [CrossRef]
- Li, M.; Wang, X.; Li, H.; Di, H.; Wu, X.; Fang, C.; Yang, B. Preparation of photoluminescent single crystalline MgO nanobelts by DC arc plasma jet CVD. Appl. Surf. Sci. 2013, 274, 188–194. [CrossRef]
- Uchino, T.; Okutsu, D.; Katayama, R.; Sawai, S. Mechanism of stimulated optical emission from MgO microcrystals with color centers. Phys. Rev. B 2009, 79, 165107. [CrossRef]
- Lente, G. Facts and alternative facts in chemical kinetics: remarks about the kinetic use of activities, termolecular processes, and linearization techniques. Curr. Opin. Chem. Eng. 2018, 21, 76–83. [CrossRef]
- Fauzi, A.A.; Jalil, A.A.; Hassan, N.S.; Aziz, F.F.A.; Azami, M.S.; Hussain, I.; Saravanan, R.; Vo, D.-V.N. A critical review on relationship of CeO2-based photocatalyst towards mechanistic degradation of organic pollutant. Chemosphere 2022, 286, 131651. [CrossRef]
- Liqiang, J.; Yichun, Q.; Baiqi, W.; Shudan, L.; Baojiang, J.; Libin, Y.; Wei, F.; Honggang, F.; Jiazhong, S. Review of photoluminescence performance of nano-sized semiconductor materials and its relationships with photocatalytic activity. Sol. Energy Mater. Sol. Cells 2006, 90, 1773–1787. [CrossRef]

| CeO2 (g/L) | Atomic (%) | |||
| O | Mg | Al | Ce | |
| 0 | 65.44 | 14.02 | 20.54 | / |
| 1 | 65.53 | 14.79 | 19.63 | 0.05 |
| 2 | 64.52 | 15.76 | 19.61 | 0.11 |
| 4 | 64.84 | 15.91 | 19.02 | 0.23 |
| 8 | 64.43 | 15.85 | 19.32 | 0.40 |
Disclaimer/Publisher’s Note: The statements, opinions and data contained in all publications are solely those of the individual author(s) and contributor(s) and not of MDPI and/or the editor(s). MDPI and/or the editor(s) disclaim responsibility for any injury to people or property resulting from any ideas, methods, instructions or products referred to in the content. |
© 2024 by the authors. Licensee MDPI, Basel, Switzerland. This article is an open access article distributed under the terms and conditions of the Creative Commons Attribution (CC BY) license (http://creativecommons.org/licenses/by/4.0/).


