Preprint
Article

Flexible Regulation and Synergy Analysis for Multiple Loads of Buildings in a Hybrid Renewable Integrated Energy System

Altmetrics

Downloads

72

Views

40

Comments

0

A peer-reviewed article of this preprint also exists.

Submitted:

04 March 2024

Posted:

05 March 2024

You are already at the latest version

Alerts
Abstract
The insufficient flexibility of the hybrid renewable integrated energy system (HRIES) makes it difficult to accommodate renewable energy with a high proportion. It is thus necessary to excavate its potential flexibility to improve its operational performance and consume renewable energy. This paper unlocks the adjustment potential of flexible buildings and builds a flexible thermal load regulation model according to the dynamic thermal characteristics and thermal comfort elastic interval of the buildings and a regulation model of the flexible electrical load based on its transferability, resectability, and rigidity. An operation optimization model, which incorporates multiple flexible load regulations and the variable load of devices, is then developed. A case study is presented to analyze the regulation and synergy mechanism in different types of flexible loads. Its results show a saturation effect between the flexible thermal and electrical loads in increasing renewable energy consumption and a synergy effect in decreasing the total cost. This synergy can reduce the total cost by 0.73%. Besides, the total cost can be reduced by 15.13%, and the renewable energy curtailment rate can decrease by 12.08% if the flexible electric and thermal loads are integrated into the operation optimization of HRIES.
Keywords: 
Subject: Engineering  -   Energy and Fuel Technology

1. Introduction

Massive greenhouse gas emissions are the root of environmental problems (e.g., global warming, rises in sea levels, frequent extreme weather), threatening human survival and development seriously [1]. Many countries have reached a consensus to reduce carbon emissions over the next several decades to address the issue [2]. The Chinese government has made a major strategic choice of “achieve carbon peak by 2030 and achieve carbon neutrality by 2060”. The International Energy Agency reports that the buildings sector accounts for about 40% of total energy consumption, which generates nearly 40% of global carbon dioxide [3]. China building carbon emissions accounted for 21.7% of total carbon emissions in 2020 [4]. The building sector must significantly decrease its carbon emissions to realize carbon neutrality [5].
Increasing the energy efficiency and renewable energy share of building energy systems is the key path to building carbon reduction [6]. Integrated energy system employs advanced technology and management modes to meet various energy demands of buildings in various forms of energy supply such as electricity, heat, and gas [7]. It breaks the technical, market, and institutional barriers of traditional single energy, realizing complementary and coordinated optimization of multiple energy sources, effectively improving energy efficiency [8]. A hybrid renewable integrated energy system (HRIES) of buildings can effectively reduce building carbon emissions. The combined heat and power (CHP) unit is the key link of multi-energy coupling synergy and energy efficiency in HRIES [9].
Yet, the inherent heat-electricity coupling feature of the CHP unit limits the flexible adjustment ability of HRIES. The limited adjustment ability is difficult to handle with the uncertain renewable energy. To increase the consumption of renewable energy, improving the average electrical efficiency of the gas CHP units for improving the operating performance of HRIES, it is urgent to improve its flexible adjustment ability.
Recent investigations into improving the flexibility of HRIES from two perspectives: coupling auxiliary equipment and excavating potential flexibility resources. The former is mainly to integrate energy transfer or conversion equipment to optimize the structure of HRIES, thus increasing its ability to follow load changes of buildings [10]. In integrating energy conversion equipment, paper [11] integrated electric boilers and electric heat pumps to expand the structure of HRIES, demonstrating potential annual cost savings of USD 180,000 and USD 190,000 respectively. Paper [12] integrated gas-fired boilers to expand the structure of HRIES and revealed that it improved the renewable energy consumption of the expanded system. In [13], it used bidirectional power to gas (P2G) to expand the structure of HRIES and revealed the utility of this device in renewable energy consumption. In integrating energy transfer equipment, paper [14] integrated compressed air energy storage to HRIES and proved that it can improve the economy and emission reduction of the system. Paper [15] highlighted that the heat storage device can reasonably allocate the resources in HRIES, thereby reducing the energy cost in the system. Furthermore, paper [16] pointed out that integrated low-temperature solar thermochemical energy storage can reduce the life cycle cost of HRIES by 2.84%. In [17], it extended the structure of HRIES with integrated power storage and demonstrated that it can reduce energy supply costs by 0.82% and cost by 4.5% per year. However, the integration of auxiliary equipment will bring additional equipment investment costs.
The essence of excavating the potential flexibility resources of HRIES is to utilize the different characteristics of heterogeneous energy flow on the grid side or the thermal dynamic characteristics and thermal comfort elasticity of load side buildings in operation optimization. For the grid side, paper [18] established a dynamic inventory model of the HRIES multi-gas transmission network and revealed that the inventory characteristics can alleviate the uncertainty fluctuation of wind power. Paper [19] established a collaborative optimization model of electric-gas coupling HRIES, revealing that the gas transmission delay can reduce the power fluctuation of the transmission network. In [20], it used the node method to establish the dynamic thermal model of the heat transfer network and revealed the effectiveness of heat transfer delay in promoting the consumption of renewable energy. Furthermore, the paper [21] coupled the storage characteristics of the heat transfer network to the operation optimization of the system, reducing the total cost by 2.41% and increasing the renewable energy consumption quota by 5.51%. In [22], it considered reconfigurable heating networks combined to solve the problem of district heating, revealing that the total operation cost decreases by 1.3%, and the wind curtailment is reduced by 51.7%. The above researches mainly focus on the transmission time scale of different energy flows in HRIES, which are mainly used for urban-level integrated energy systems. Conversely, in user-side HRIES, the coupling promotion impact of different energy flow transmission time scales is relatively limited.
For the load side, the dynamic thermal characteristics and thermal comfort elasticity of the building can flexible the heat load demand to improve the flexibility and renewable energy consumption level in HRIES. Based on this, the paper [23] integrates heat production and thermal comfort models in microgrid operation planning to achieve the required thermal comfort and to cover electricity needs. In [24], it introduced a bi-level robust optimization model with demand response and thermal comfort, revealing that the combination of demand response and thermal comfort can improve and enhance the planning and operation of HRIES. Paper [25] applied the global sensitivity analysis model to obtain the optimally combined strategy of energy-saving renovation. According to the paper [26], building heat capacity can reduce daily operating costs by 6.4% and wind curtailment penalty costs by 36.3%. In addition, the electrical load regulation also has the characteristics of flexible regulation. In [27], it proposed a novel CHP cascade heating system by integrating it with the electric heat pump (EHP), reducing the wind power curtailment ratio of the novel system by 10.75%. Furthermore, the paper [28] integrated a low-carbon economic operation optimization model by introducing flexible load and carbon trading mechanisms for HRIES. Consequently, established a flexible model including three kinds of electrical loads that can be translated, transferred, and reduced. It demonstrated that it can effectively smooth the load curve, lower carbon dioxide emissions, and reduce energy purchase costs. Nevertheless, existing research on the potential flexibility resources of the coupled load side mainly concentrates on the regulation of a single type of flexible load. Few studies have coupled the operation optimization of multiple flexible loads within HRIES simultaneously to analyze the synergistic effect between flexible loads.
HRIES is a comprehensive energy utilization system characterized by multi-energy input, coupling, and output. It is difficult to fully improve the operation performance of HRIES and the consumption of renewable energy by only considering the flexibility adjustment potential of a certain flexible load. Based on this, this paper establishes a flexible adjustment model of thermal load based on the dynamic thermal characteristics of buildings, the elastic range of thermal comfort, and a flexible adjustment model of electrical load based on the rigidity, transferability, and resectability of electrical load. The flexible load regulation is introduced into the operation of HRIES, and an operation optimization model considering various flexible load regulation and equipment variable conditions is proposed to explore the coordinated regulation mechanism and performance promotion measure of various flexible loads. The contributions of this work are summarized as follows:
(1)
Unlock the flexible regulation ability of buildings and establish a flexible thermal load regulation model according to the dynamic thermal characteristics and thermal comfort elastic interval of the buildings and a regulation model of the flexible electrical load based on its transferability, resectability, and rigidity.
(2)
An operation optimization model, which incorporates multiple flexible load regulations and the variable load of devices, is then developed to improve the operational performance and reduce the entropy of HRIES.
(3)
Comparatively analyze the performance of minimum total cost and renewable energy curtailment rate with various flexible loads. Present the flexible regulation and synergy mechanism of multiple types of flexible loads in improving the average electrical efficiency of the gas CHP units and reducing the renewable energy curtailment rate of HRIES.

2. HRIES with Flexible Buildings

The structure of HRIES with flexible buildings is shown as illustrated in Figure 1. The energy production facilities in the HRIES comprise gas CHP units, wind turbines, gas boilers, and energy storage devices including electrical energy storage and thermal energy storage. The electrical and thermal energy generated by each device is converged to the power hub and the thermal hub respectively. Subsequently, it is transmitted to the flexible building users through the corresponding transmission network. To ensure the reliability of the power supply and the real-time balance of electrical energy, storage equipment is installed within the HRIES. Any excess and insufficient electricity beyond the adjustment range of the HRIES is balanced through the power grid. Additionally, thermal storage is also installed in the heating hub to ensure heat balance. Besides, the thermal and electrical load of flexible buildings possess the adjustment potential. Unlocking this potential flexibility can effectively improve operational performance e.g., cost reduction and consumption increase of wind energy.

3. Flexible Load Model of Buildings

3.1. Flexible Thermal Load Model

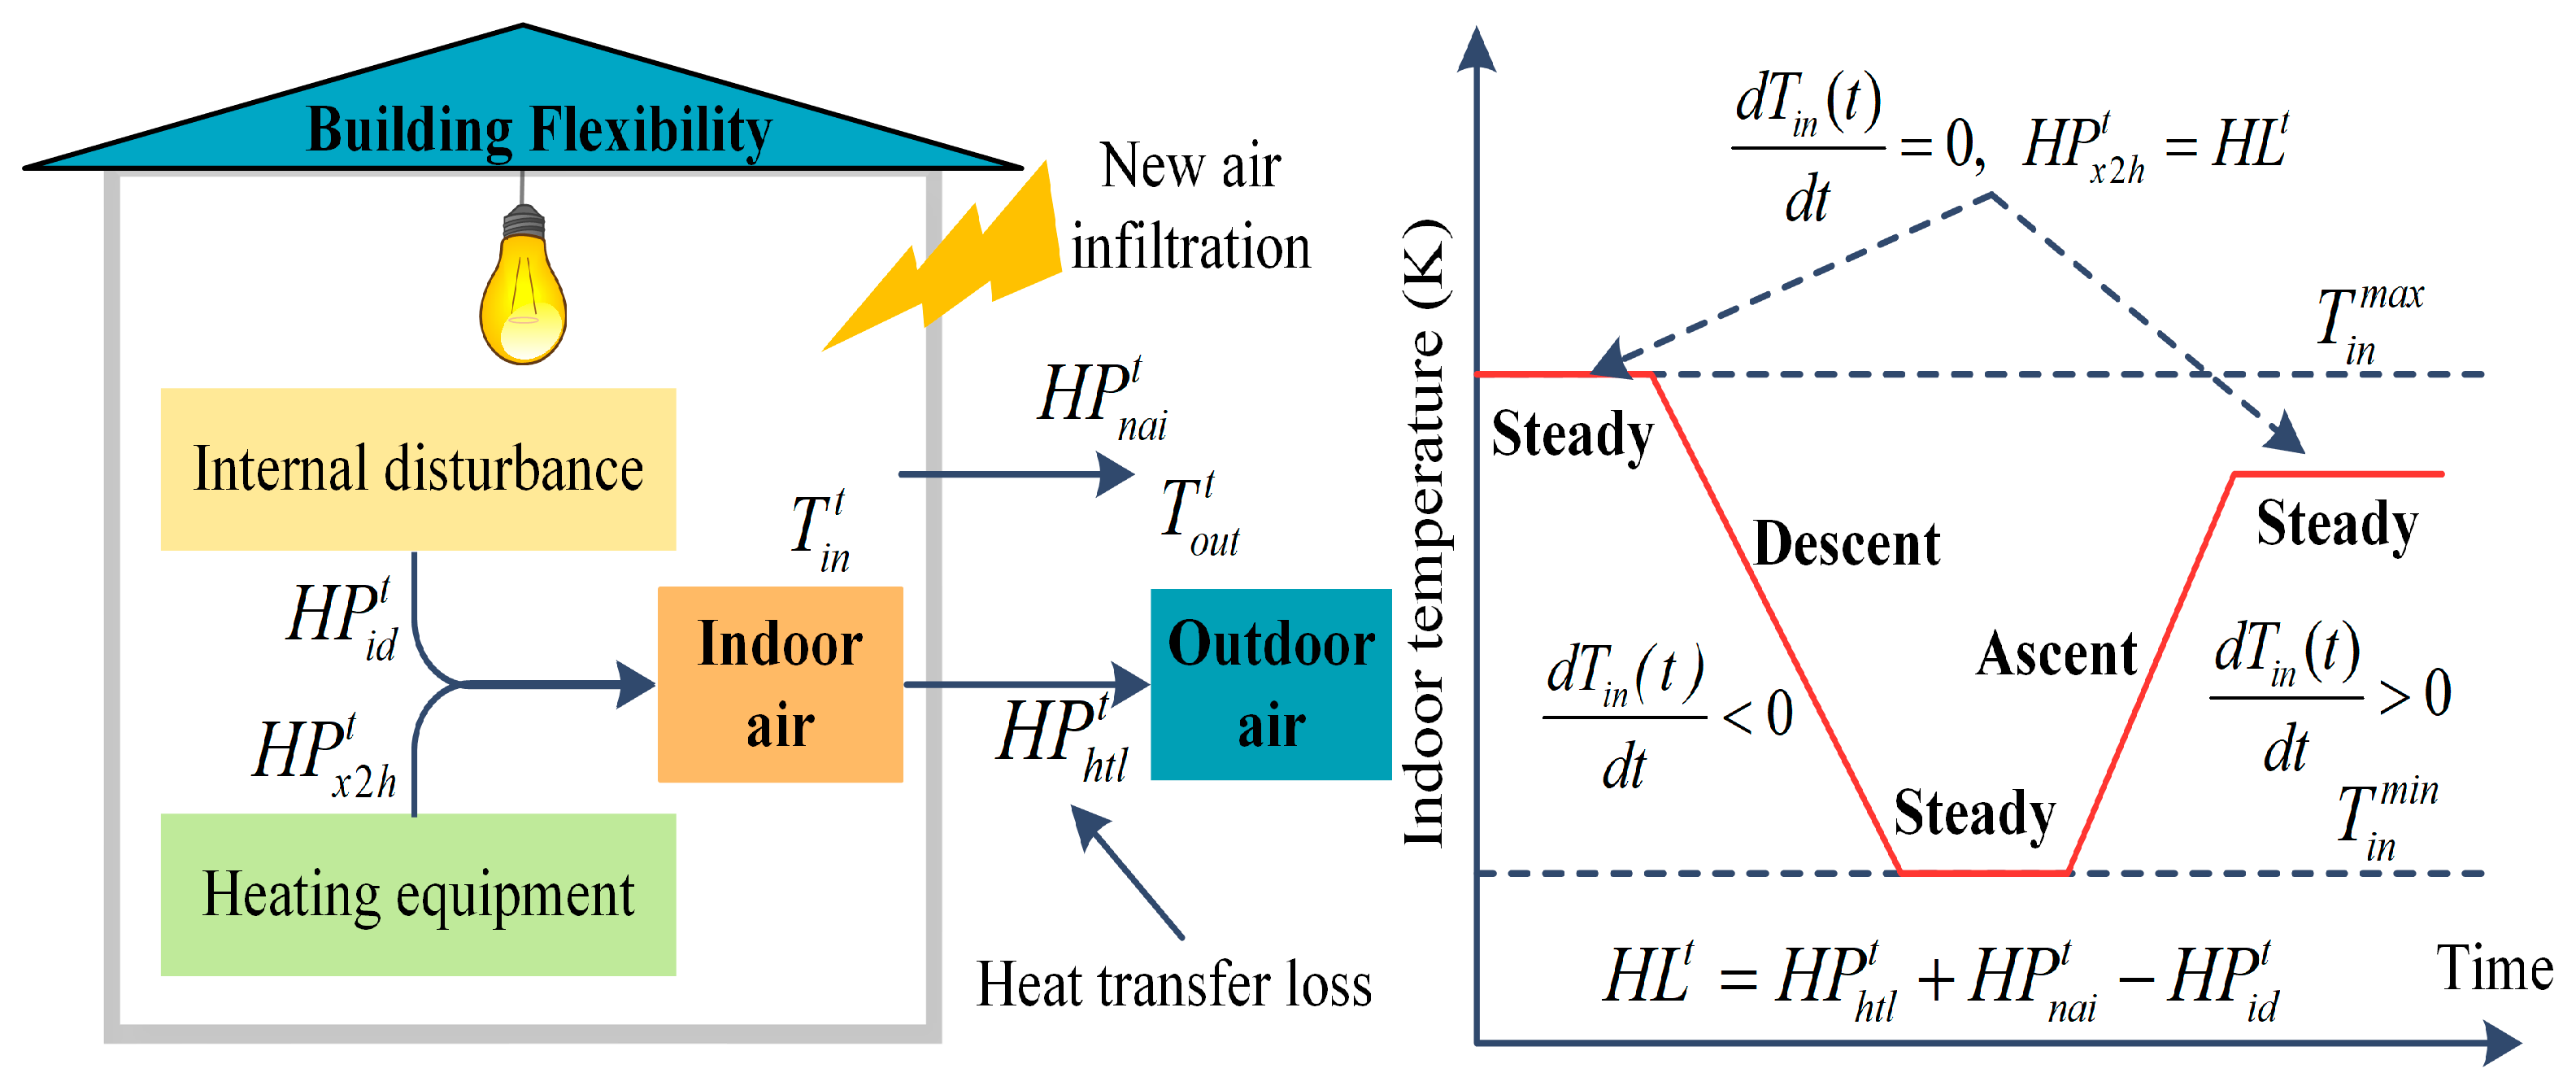
The purpose of building heat demand is to maintain indoor temperature at a comfortable temperature perceived by the human body under the interference of outdoor environmental factors, which is determined by the dynamic heat transfer process. However, this process is influenced by a lot of factors, e.g., wind speed, irradiation intensity, ambient temperature, and the characteristics of the building envelope, making it challenging to develop a precise model. In addition, the multitude of buildings and diverse rooms within the HRIES, individually modeling each building is impractical and unnecessary. A lumped model is employed to simplify the heat transfer process, in which a multi-story building or some adjacent building clusters with similar features can be abstracted as a typical large room. The dynamic heat balance features of this room are employed to describe the buildings approximately. Accordingly, the heat dynamic process is shown in Figure 2.
According to Figure 2, the heat dynamic balance is realized under the combined action of internal disturbance heat generation, equipment heating, envelope heat transfer, and fresh air infiltration heat transfer. The balance can be expressed as the following equation.
C b u d T i n ( t ) d t = H P i d t + H P x 2 h t H P h t l t H P n a i t
where Cbu represents the total capacity of buildings (MJ/°C); HP is heating power (MW); T represents temperature (°C); t is the time interval (h); the subscript in represents indoor; H P i d t , H P h t l t and H P n a i t represent the heat generation power of internal disturbance, the heat transfer power caused by indoor and outdoor temperature difference and the heat loss power of new air infiltration, respectively. H P x 2 h t represents the sum of heat power of heating equipment, which can be expressed as,
H P x 2 h t = H P C H P t + H P G B t + H P H E S t , e x H P H E S t , i m .
where subscripts CHP, GB, and TES represent CHP units, gas boilers, and heat storage devices; the superscripts im and ex represent energy input and energy output, respectively.
According to Figure 2, the heat load (HLt) is the difference between heat power contributed by internal disturbance (e.g., thermal energy from household appliances, thermal dissipation by server operation) and the sum of that contributed by thermal transfer and cold air infiltration. When the sum of the heat power of heating equipment ( H P x 2 h t ) is equal to the heat load, the derivative d T i n ( t ) / d t is 0, and the indoor temperature of buildings remains constant (namely the steady period). When H P x 2 h t is greater than the heat load, the derivative exceeds 0, and the indoor temperature of buildings will increase (namely the ascent period), which realizes the storage of heat energy in buildings. When H P x 2 h t < H L t , the derivative is less than 0, the indoor temperature of buildings will decrease (namely the descent period), which releases the heat energy stored in buildings.
The thermal power brought by the internal disturbance usually is less than that of the heating devices. Usually, it is defined by an empirical formula in [29].
H P i d t = u a g A
where uag is the average thermal power of the unit heating area contributed by the internal distribution, whose empirical value is 3.8 W/m2. A is the thermal supply area of buildings.
The process of heat transfer loss of the building envelope is extremely complex. It is thus assumed that the temperature of indoor air equals that of the inner surface of the envelope, and outdoor air equals that of the outer to simplify this process. The heat loss of the building envelope equals the sum of that of the doors, windows, walls, floors, roofs, etc. Accordingly, the thermal power contributed by heat transfer loss can be defined by the main heat transfer loss and the correction factor of the corresponding influence element (e.g., orientation, wind velocity, radiation intensity).
H P h t l t = ( 1 + θ h e ) i = 1 n e ( λ i A i θ T ( T i n t T o u t t ) ( 1 + θ S R + θ v ) )
where θ h e , θ T , θ S R and θ v are the correction factor of additional height, environment temperature, solar radiation, and wind velocity, respectively; λ i and A i are the thermal transfer coefficient and the area of i-th envelope, respectively; T o u t t is the temperature of the outdoor environment; ne is the number of the envelope.
In addition, the pressure difference brought by the temperature difference in indoor and outdoor environments drives cold air infiltration through the doors and windows, resulting in heat energy loss. For civil buildings, the thermal power contributed by cold air infiltration is defined in [30],
H P n a i t = 2.78 × 10 4 c a i r ρ a i r n a i r V ( T i n t T o u t t ) .
where c a i r and ρ a i r refer to the isobaric specific heat capacity (1.0 kJ/(kg⋅K)) and the density (1.29 kJ/m3) of air, respectively; V represents the volume of building space; n a i r is the ventilation frequency of buildings.
The energy loss of heat transfer and cold air infiltration is driven by the indoor and outdoor temperature difference. Their sum is thus simplified by introducing a comprehensive thermal transfer coefficient λ b u .
H P h t l t + H P n a i t = λ b u ( T i n t T o u t t )
The comprehensive thermal transfer coefficient is defined as,
λ b u = ( 2.78 × 10 4 c a i r ρ a i r n a i r V + ( 1 + θ h e ) i = 1 n e ( λ i A i θ T ( 1 + θ S R + θ v ) ) ) .
As a result, a comprehensive time coefficient that evaluates the level of thermal storage time of building space can be developed as,
t b u = C b u / θ a l l .
Accordingly, the dynamic heat balance equation can be rewritten as,
t b u λ b u d T i n ( t ) d t = H P x 2 h t + H P i d t λ b u ( T i n t T o u t t ) .
The above equation is discretized and then its discretized form is obtained.
T i n t + Δ t = T o u t t + H P x 2 h t + H P i d t λ b u + ( T i n t T o u t t T P x 2 h t + T P i d t λ b u ) exp ( Δ t t b u ) .
According to Equation (10), the indoor temperature at the next time relies on the current time and the sum of the heat power of heating devices.
When a constant temperature control strategy is employed, the derivative d T i n ( t ) / d t equals zero. Accordingly, Equation (9) can be rewritten as the following equation.
H P x 2 h t = λ b u ( T i n t T o u t t ) H P i d t
According to Equation (11), the sum of the heat power of heating equipment equals the heat demand. The heat load thus losses the flexible adjustment potential.
The temperature variation of the indoor air lags behind that of the thermal transfer medium. Some thermal energy can be stored in the internal space of the building, showing thermal inertia. In addition, the perception of the human body for the thermal environment of the building is fuzzy, which provides a flexible regulation potential. The thermal environment is affected by many factors (e.g., indoor temperature, humidity, air velocity, metabolism, clothing thermal resistance); its calculation model thus is extremely complex. To simplify the model, the influence of minor factors (e.g., air velocity and humidity) is usually ignored in engineering. Accordingly, the predicted mean vote (PMV) is introduced to measure the thermal comfort of the building [31].
P M V = 2.43 3.67 ( T r t T i n t ) M E ( I c l + 0.1 )
where T r t represents the average temperature of the skin surface in a comfortable state, with an approximate value of 32.6 °C; I c l represents the thermal resistance of the garment, which is approximately 0.11 (m2·°C)/W in winter; ME represents the human metabolic rate, with an approximate value of 80 W/m2 in [32].
According to “Heating Ventilation and Air Conditioning Design Specifications”, the value of PMV is between ±1. Maximum indoor temperature and minimum indoor temperature in winter can be calculated at 26.0 °C and 16.9 °C respectively.
When the operation optimization fails to consider the regulation of flexible heat load (namely constant temperature control strategy), the heat load of the building is only a time series curve. Inversely, if the variable temperature control strategy is introduced into the scheduling, there are countless time series curves of thermal load. The scheduling aims to find an optimal indoor temperature curve in its elastic range to promote the operational performance of HRIES (e.g., the consumption increase of wind energy and carbon emission reduction). Accordingly, the regulation model of the flexible heat load is defined as,
T i n t + Δ t = ( T i n t T o u t t H P x 2 h t + H P i d t λ b u ) exp ( Δ t t b u ) + H P x 2 h t + H P i d t λ b u + T o u t t ,   16.9 T i n t 26.0 .
where Δ t represents the time step, and its value in this paper is 1h.

3.2. Flexible Electrical Load Model

Electrical loads can be divided into shiftable, transferable, reducible, and rigid loads. The shiftable load needs to overall shift its working time cycle, such as a load of washing machine, dryer, and electric oven. The transferable load must maintain its energy balance in a scheduling cycle, without the continuity limitation of working time, such as a load of electric vehicles and water heaters. Reducible load refers to the demand that can withstand a certain interruption or reduction during the scheduling cycle. The rigid load is unchanged and is fully responded to by HRIES.
According to this, this paper establishes a regulation model of flexible electrical load based on the transferability, reducibility, and rigidity of electrical load.
E L t = E L b t + ( α s h i f t t , i m α s h i f t t , o u t ) E L b t α c u t t E L b t
where E L t represents the actual electrical load; E L b t represents the rigid electrical load; α s h i f t t , i m , α s h i f t t , o u t and α c u t t represent the turn-in ratio, turn-out ratio, and load shedding ratio at time t, respectively.
The transferable load needs to meet the energy balance in the scheduling period.
t = 1 24 ( α s h i f t t , i m α s h i f t t , e x ) E L b t = 0
In addition, the transfer-in ratio, transfer-out ratio, and load-shedding ratio of the flexible load model should be less than their respective maximum values.
α s h i f t t , i m α s h i f t , max , i m ,   α s h i f t t , o u t α s h i f t max , o u t ,   α c u t t α c u t max

4. Optimization Model of Introducing Flexible Load

4.1. Optimization Objectives

The optimization objectives in the model include system maintenance cost, energy purchase cost, carbon emission penalty cost, and wind curtailment cost. The system maintenance cost is defined as,
M C = t = 1 24 ( ( u m H H S ( H P H E S t , i m + H P H E S t , e x ) + u m C H P E P C H P t + u m W T E P W T t + u m G B H P G B t + u m E E S ( E P E E S t , i m + E P E E S t , e x ) ) Δ t ) .
The energy purchase cost is defined as,
E C = t = 1 24 ( ( φ N G ( F C H P t + F G B t ) + φ G t , i m E P G t , i m + φ G t , e x E P G t , e x ) Δ t ) .
The wind curtailment cost is defined as,
R E P = t = 1 24 ( φ R E C ( ( E P ^ W T t E P W T t ) Δ t ) ) .
Carbon emission penalty cost is defined as,
C E C = t = 1 24 φ C O 2 ( ( ξ N G ( F C H P t + F G B t ) + ξ G ( E P G t , e x E P G t , i m ) ) Δ t ) .
In the above equations, um represents the unit maintenance cost (Yuan/MWh); φ N G , φ C O 2 and φ R E C are set to 2.324 ¥/m3, 0.02269 ¥/kg, and 0.316 ¥/kWh, respectively, representing the unit cost of natural gas purchase, the penalty cost of carbon emissions and the penalty cost of renewable energy curtailment; the subscript G represents the power grid; φ G t , i m and φ G t , e x represent the price of selling and purchasing electricity to the power grid (Yuan/kWh); ξ N G and ξ G represent the carbon emission coefficients of natural gas combustion and power grid purchase, respectively, with values of 0.968 and 0.22 kg/kWh; F represents natural gas flow rate; EP represents electrical power (MW); therefore, E P G t , e x and E P G t , i m represent the real-time power of purchasing and selling electricity from the power grid respectively; the subscripts EES and WT represent electric energy storage and wind turbine respectively; E P ^ W T t and E P W T t represent the actual power generated by the wind turbine and the real output power, respectively.
Based on this, the total cost (TC) objective function is defined as,
T C = M C + E C + C E C + R E P .

4.2. Model Constraints

The model constraints include the operation model constraints of each piece of equipment in HRIES, energy balance constraints, and grid output constraints.

4.2.1. Device Model Constraints

(1)
Wind turbine
Wind turbine output power is closely related to the size of the wind speed, and the energy conversion model is described as [24],
E P W T t = { 0 , v t v min   o r   v t v max v t v min v r a v min I C W T ,   v min v t v r a I C W T , v r a v t v max .
where v denotes wind speed (m/s); therefore, v min , v max and v r a represent cut-in, cut-out, and rated wind speeds, respectively, which are usually 3 m/s, 20 m/s, and 10 m/s.
(2)
Gas CHP units
The energy conversion model of gas CHP unit can be expressed as,
F C H P t = { E P C H P t / ( η C H P t , e L H V N G ) ,   0.2 L R C H P t 1 0 , 0 L R C H P t < 0.2 ,
H P C H P t = { F C H P t η C H P t , h L H V N G ,   0.2 L R C H P t 1 0 , 0 L R C H P t < 0.2 .
where L R C H P t represents the load rate of the gas CHP units; L H V N G represents the low calorific value of natural gas (MJ/m3); η C H P t , e and η C H P t , h represent the efficiency of power generation and heat generation of gas CHP units, respectively, and they can be fitted as [33],
η C H P t , e = 0.24196 ( L R C H P t ) 3 + 0.5203 ( L R C H P t ) 2 0.47096 L R C H P t + 0 . 69857 ,     0.2 L R C H P t 1 .
η C H P t , h = 0.02045 ( L R C H P t ) 3 0.27649 ( L R C H P t ) 2 + 0.59816 L R C H P t + 0.00613 , 0.2 L R C H P t 1 .
In addition, the power of gas CHP units in adjacent periods needs to meet ramping constraints.
E P C H P t E P C H P t 1 U R C H P Δ t , E P C H P t 1 E P C H P t D R C H P Δ t
where UR and DR represent the climbing rate (MW/h) of the device up and down respectively.
At the same time, the maximum output power of gas CHP units needs to be less than the rated capacity of the equipment.
0 E P C H P t I C C H P
(3)
Gas-fired boiler
The gas boiler is a device that directly converts gas chemical energy into heat energy. Its model can be expressed as,
H P G B t = { η G B t F G B t L H V N G ,   0.2 L R G B t 1 0 ,   0 L R G B t < 0.2 .
where η G B t represents the efficiency of the gas boiler; the value in this article is set to 0.72; L R G B t represents the load rate of the gas boiler. The device stops when the load rate is less than 0.2.
In addition, the output constraint of the gas boiler in adjacent periods also needs to meet the climbing constraint.
H P G B t H P G B t 1 U R G B Δ t H P G B t 1 H P G B t D R G B Δ t
At the same time, the output of the gas boiler also needs to be less than its rated capacity.
0 H P G B t I C G B
(4)
Energy storage device
The energy state of the energy storage device at each moment is affected by the charging and discharging power and the energy state at the previous moment. The model can be expressed as,
E e s t = E e s t 1 + ( P e s t 1 , i m η e s i m P e s t 1 , e x / η e s e x ) Δ t   e s { E E S ,   H E S } ,   P { H P ,   E P }
where E denotes the energy state (MWh) of the energy storage; η e s i m and η e s e x represent the charging/discharging (storage/discharging) efficiency of energy storage equipment respectively. Overcharge and over-discharge will affect the life of energy storage equipment, so energy storage equipment needs to meet the following constraints.
χ e s min I C e s E e s t χ e s max I C e s
In addition, the charging/discharging (storage/discharging) power of the energy storage device also needs to meet the maximum charging/discharging (storage/discharging) power constraint.
0 P e s t , i m s t e s t , i m λ e s max , i m I C e s 0 P e s t , i m s t e s t , e x λ e s max , e x I C e s
where λ e s max , i m and λ e s max , e x represent the ratio of maximum charging/discharging (storage/ discharging) power to rated capacity respectively; s t e s t , i m and s t e s t , e x represent the charging/ discharging (storage/discharging) state variables of the energy storage device at time t; when the variable is equal to 1, it means that the state exists. If it is equal to 0, it means that the state does not exist. The charging/discharging process will have energy loss and affect the life of the equipment. Based on this, it is prohibited to have a charging/discharging (storage/discharging) state at the same time, and the following constraints need to be met.
s t e s t , i m + s t e s t , e x 1
Additionally, the energy storage needs to be restored to its initial state after the end of the scheduling cycle.
E e s 0 = E e s t = 24

4.2.2. Energy Balance Constraints

The operation optimization model of HRIES needs to meet the energy balance constraint, and the regulation of flexible electrical load is coupled with the energy balance constraint. The balance constraint is described as,
E P C H P t + E P W T t + E P G t , e x E P G t , i m + E P E E S t , e x E P E E S t , i m = E L b t + ( α s h i f t t , i m α s h i f t t , o u t ) E L b t α c u t t E L b t .
The heat balance constraint is a flexible heat load regulation model ( Equation (7)).

4.2.3. Constraints of the Power Grid

The HRIES is connected to the power grid and is constrained by the power of the contact line. Therefore, it is necessary to limit the power purchased and the power sold within a specific range.
0 E P G t , i m s t G t , i m E P G max , i m 0 E P G t , e x s t G t , e x E P G max , e x
In Equation (38), s t G t , i m and s t G t , e x represent the state variables of selling and purchasing electricity to the grid respectively. In addition, the HRIES cannot purchase and sell electricity to the grid at the same time, the optimization needs to satisfy the following constraint.
s t G t , i m + s t G t , e x 1

4.3. Model Solution

There are nonlinear output constraints of gas CHP units in the optimization model, which leads to the nonlinearity of the model. To solve the model, the piecewise linear approximation method is used to deal with the corresponding nonlinear constraints. The processed model is a mixed integer linear programming model, which is directly solved by the Cplex solver after programming.

5. Case Study

To investigate the regulation mechanism and performance promotion measure of different flexible loads, this method is implemented in the operation optimization of HRIES. The data on related equipment in the park are shown in Table 1.
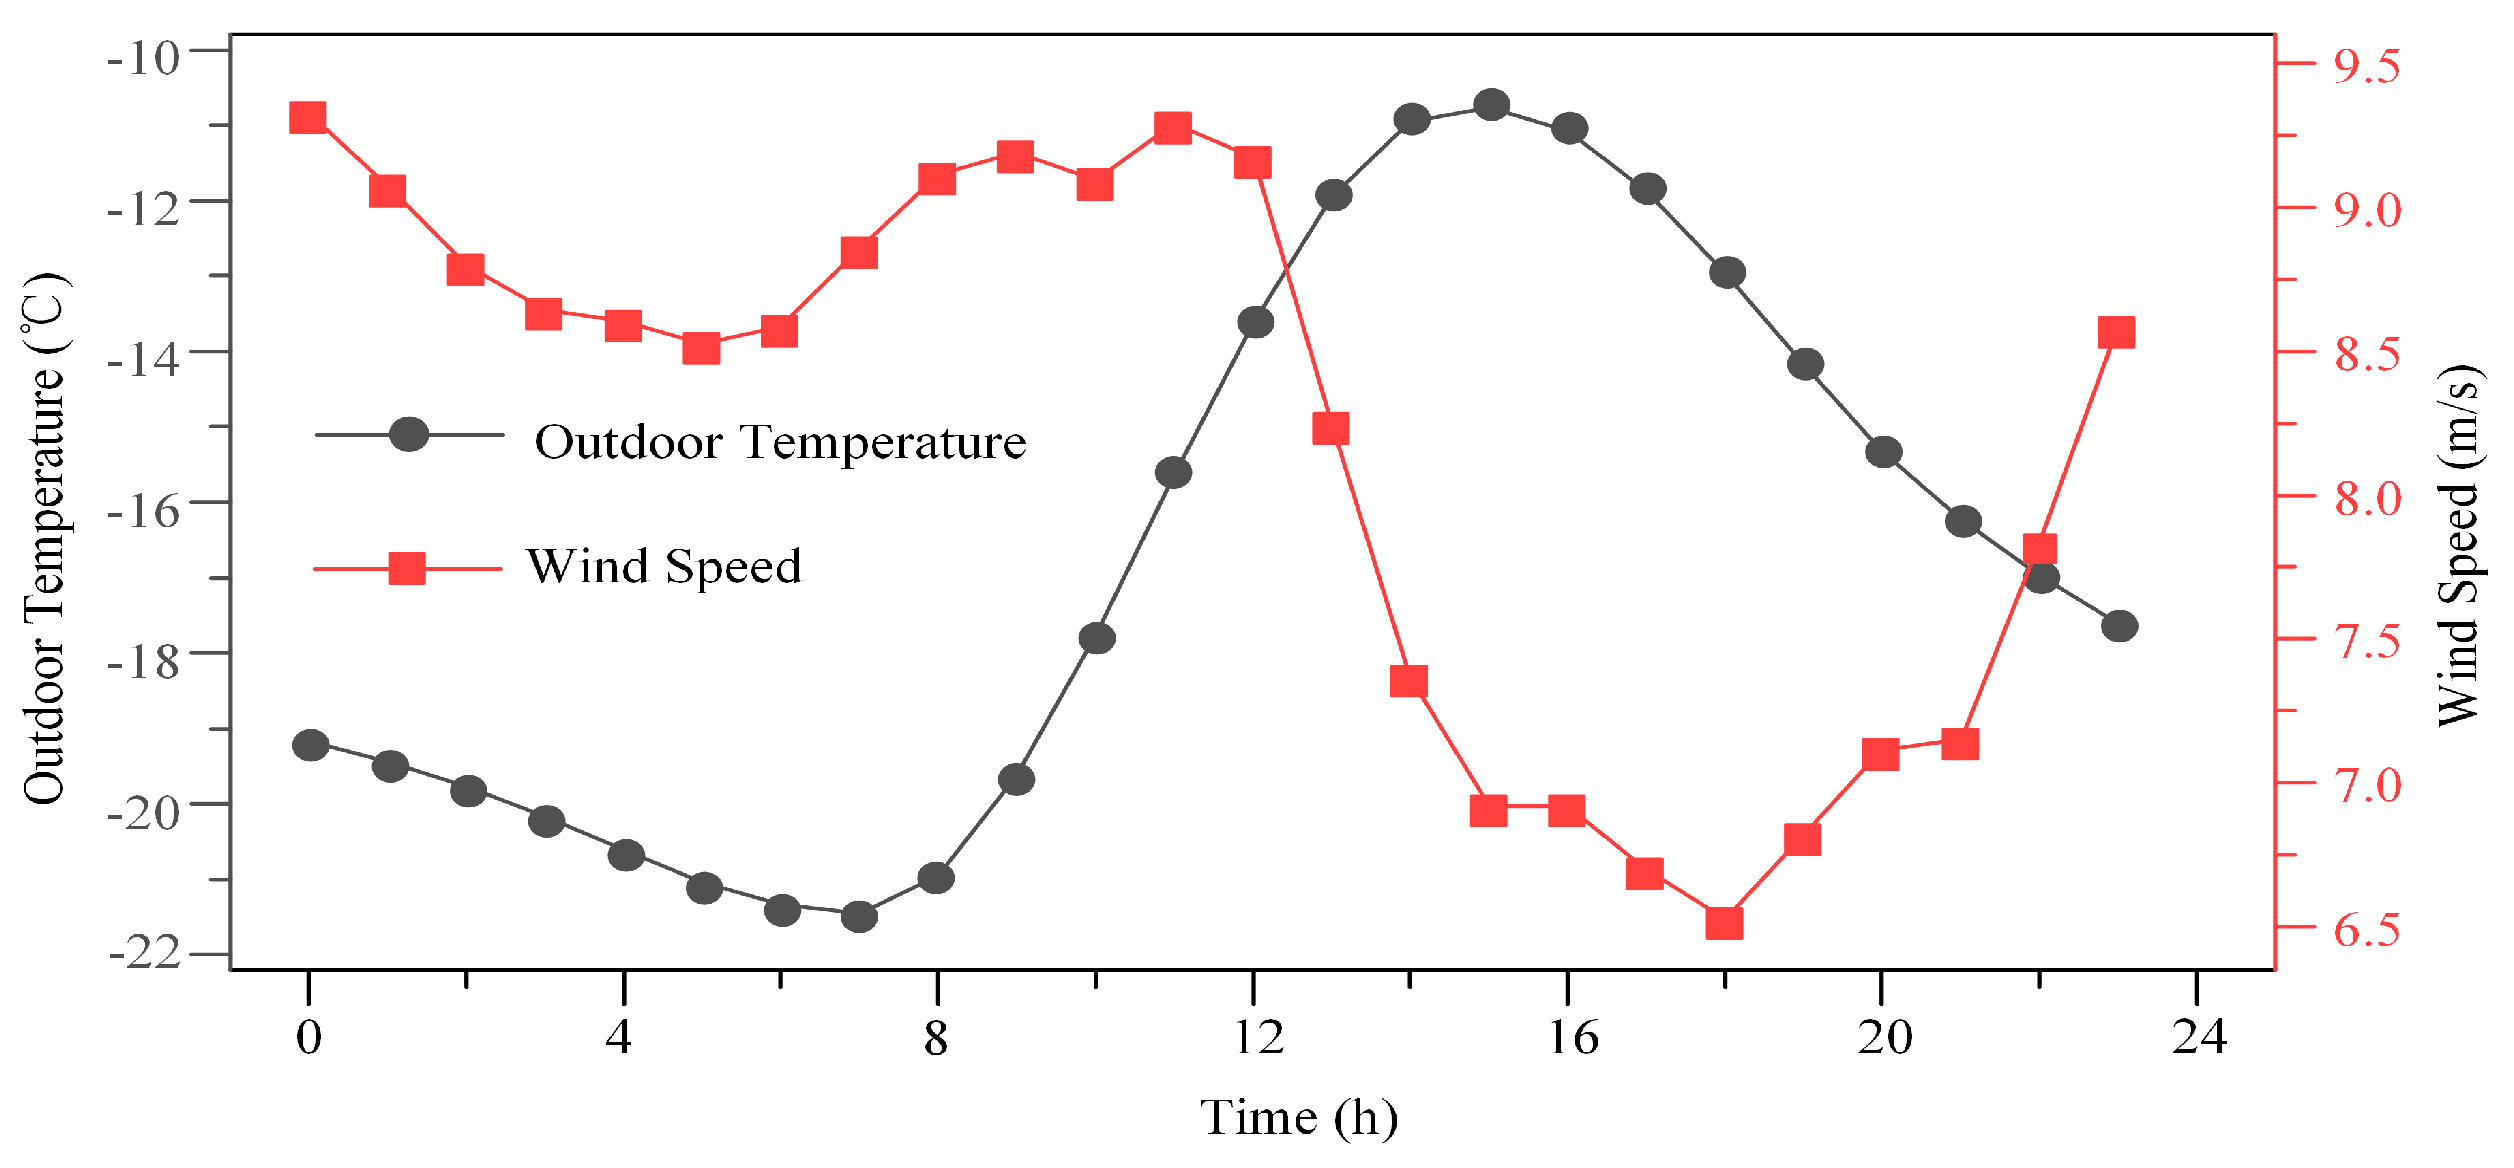
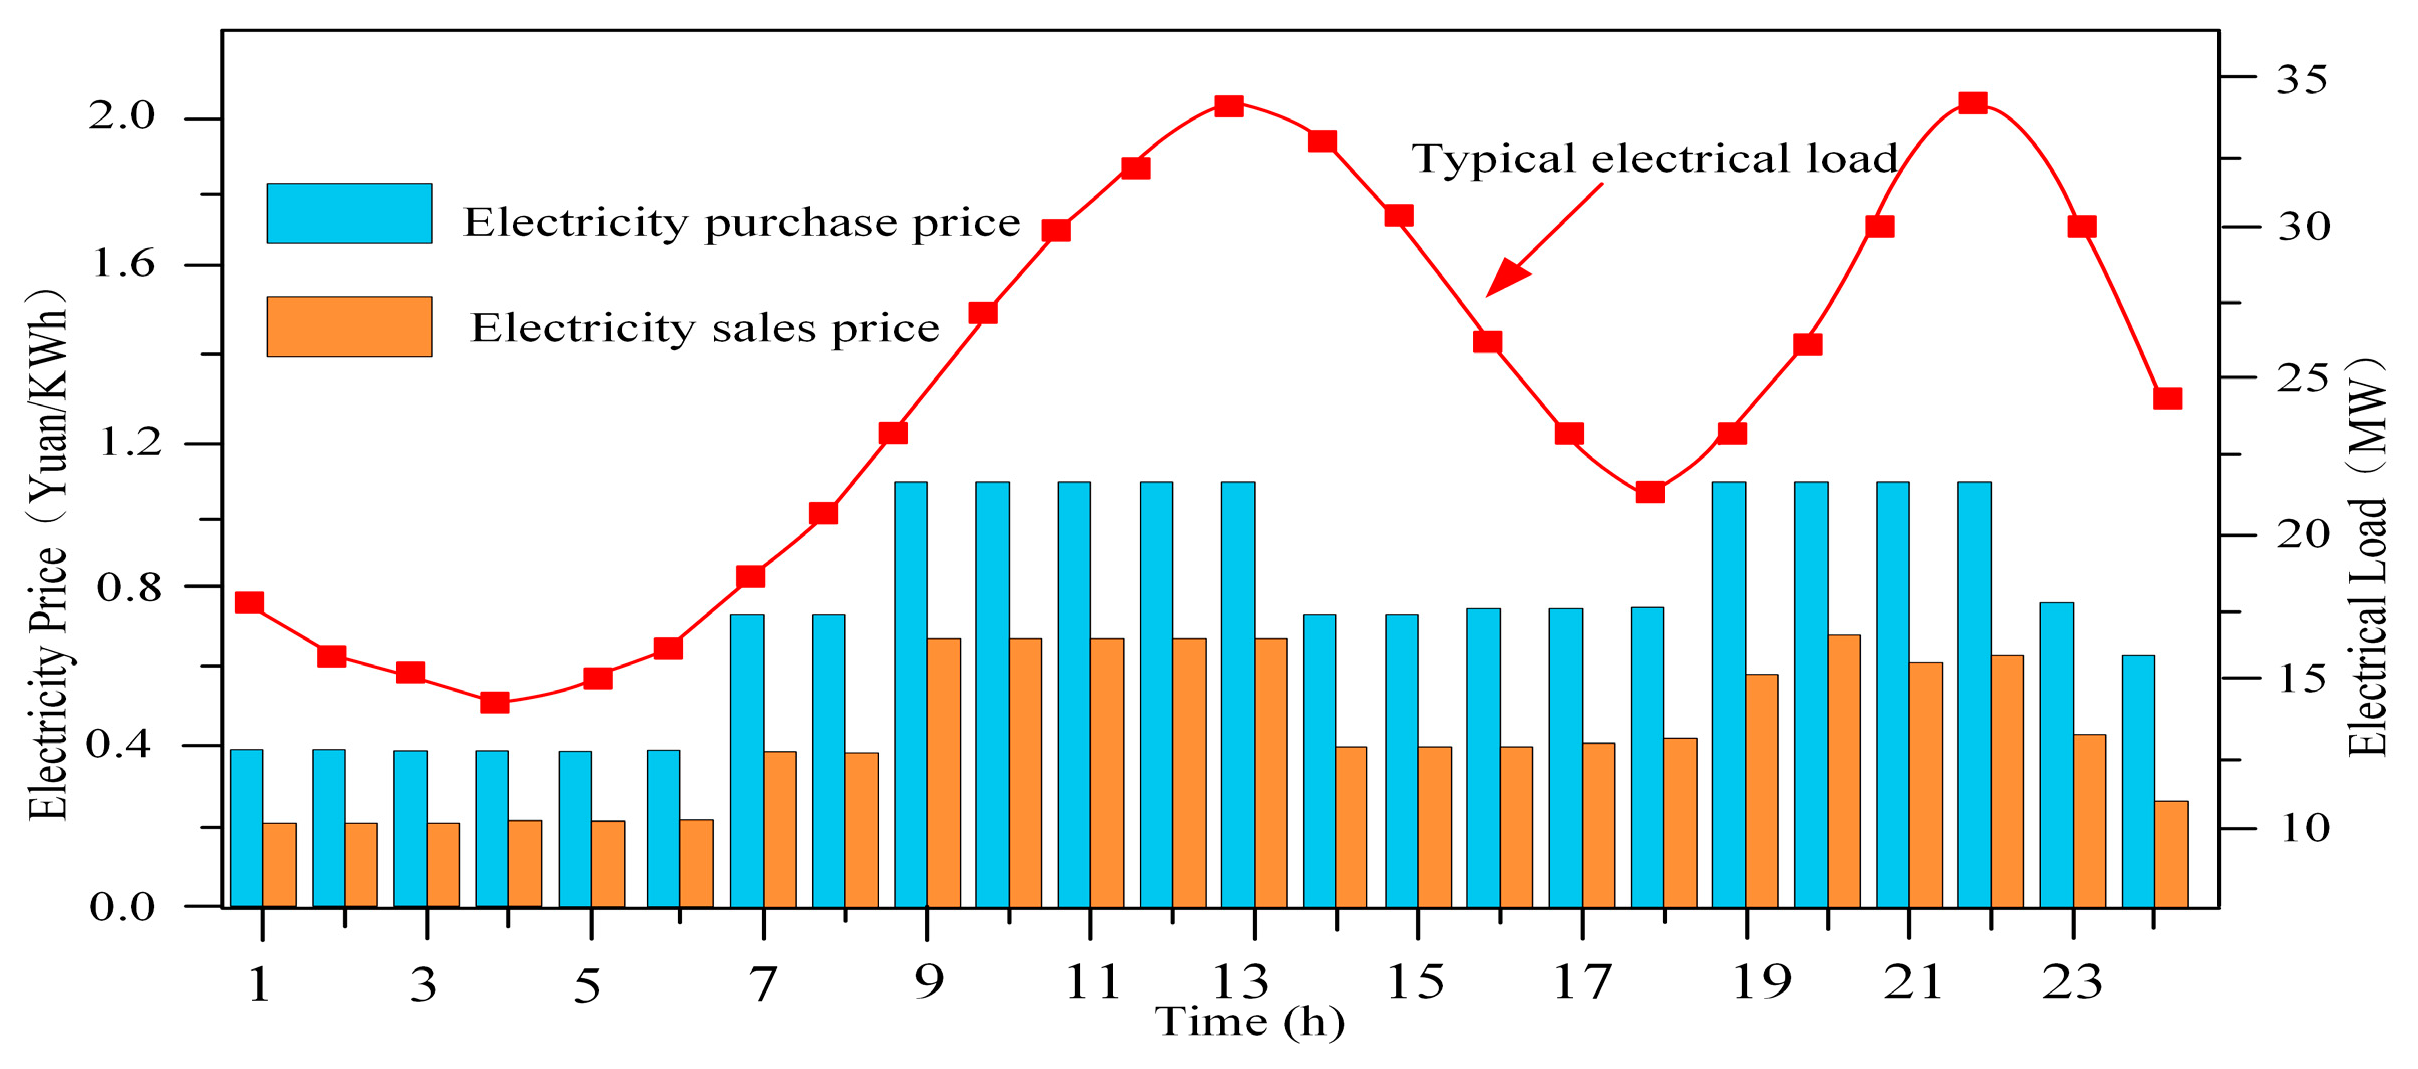
Moreover, the typical hourly wind speed and outdoor ambient temperature of the park are shown in Figure 3; the corresponding typical hourly electrical load and sale/purchase electricity price are displayed in Figure 4.
Additionally, the price of natural gas purchased in the park is 2.324 ¥/ m3, and the low calorific value of natural gas purchased is 36 MJ/m3; the heating area of the building is 1.16 × 10⁶ m2, and the comprehensive heat transfer coefficient and internal disturbance power per unit temperature are 1.45 MW/°C and 3.8 W/m2, respectively.

5.1. Model Solution

To compare and analyze the utility and synergy of various flexible load regulations, four cases are set as follows:
Case 1: Without considering flexible load regulation;
Case 2: Only flexible electrical load regulation is considered;
Case 3: Only flexible heat load regulation is considered;
Case 4: Consider both flexible heat load and electrical load regulation;
In addition, to analyze the utility of flexible load regulation from the perspectives of the economy and renewable energy consumption, two optimal target models of minimum total cost and minimum renewable energy curtailment rate are established. For the case with the minimum renewable energy curtailment rate, only the penalty coefficient of renewable energy abandonment needs to be set to an infinite number to realize the model conversion.

5.2. Optimization Results

To compare and analyze the utility and synergy of various flexible load regulations, four cases are set as follows:
Table 2 and Table 3 show the optimization results from the perspectives of minimum total cost and renewable energy curtailment rate.
From an economic point of view, flexible load regulation can reduce the total cost of HRIES from 413.8 thousand Yuan to 385.6 thousand Yuan, with a reduced rate of 6.81%. Furthermore, the flexible heat load regulation can reduce the total cost of HRIES from 413.8 thousand Yuan to 382.4 thousand Yuan, with a reduced rate of 7.59%. When considering both flexible electrical load and thermal load regulation in HRIES, the total cost is reduced to 351.2 thousand Yuan, with a reduced rate of 15.13%. It is worth noting that the decline rate of the total cost when considering both flexible heat load and electrical load regulation is greater than the sum of the decline rates when integrating flexible heat load and electrical load regulation alone (14.40%), which indicates that flexible electrical load and heat load regulation have a synergistic effect in improving economy. This effect can reduce the total cost by 0.73%.
In addition, energy purchase costs accounted for the largest share of the total costs of HRIES, reaching 75.04% (Case 1). In general, flexible load regulation reduces the total cost of HRIES mainly by reducing the penalty for renewable energy abandonment and energy purchase costs.
From the perspective of renewable energy consumption, integrated flexible heat load and electrical load regulation can reduce the renewable energy curtailment rate in HRIES. Among them, flexible electrical load regulation can reduce the renewable energy curtailment rate from 26.73% to 19.06%, a decrease of 7.67%, while flexible heat load regulation can reduce it to 22.05%, a decrease of 4.68%. If both flexible electrical load and thermal load regulation are considered in HRIES operation, the renewable energy curtailment rate decreases to 14.65%, which decreases by 12.08%. Therefore, this reduction is less than the sum of the reductions in the loss rate (12.35%) when the flexible electricity and heat load regulation are integrated alone, revealing that there is a saturation effect of the flexible electricity and heat load regulation in increasing the renewable energy consumption of the HRIES.
Comparing Table 2 with Table 3, in Case 2 where flexible load regulation is integrated separately, the optimization results under the minimum total cost and renewable energy curtailment rate are consistent, indicating that flexible load regulation mainly reduces the total cost by reducing the renewable energy curtailment rate. Conversely, in Case 3, where flexible heat load regulation is integrated separately, the optimization results are different under the minimum total cost and the minimum renewable energy curtailment rate. When pursuing maximizing the consumption of renewable energy, renewable energy waste decreases from 22.68% to 22.08%. However, this enhancement comes at the cost of a total cost increase from 382.4 thousand Yuan to 386.0 thousand Yuan.
Furthermore, when the operation optimization of the HRIES considers both the flexible electrical load and the heat load regulation (Case 4), the total cost of the system drops to 351.2 thousand Yuan, a decrease rate of 15.13%, and the renewable energy abandonment rate drops to 15.04%, a decrease rate of 12.2%. Similarly, the optimization results are also different under the two angles of minimum total cost and minimum renewable energy curtailment rate. The pursuit of renewable energy consumption will also increase the total cost of HRIES.

5.3. Discussion of Results

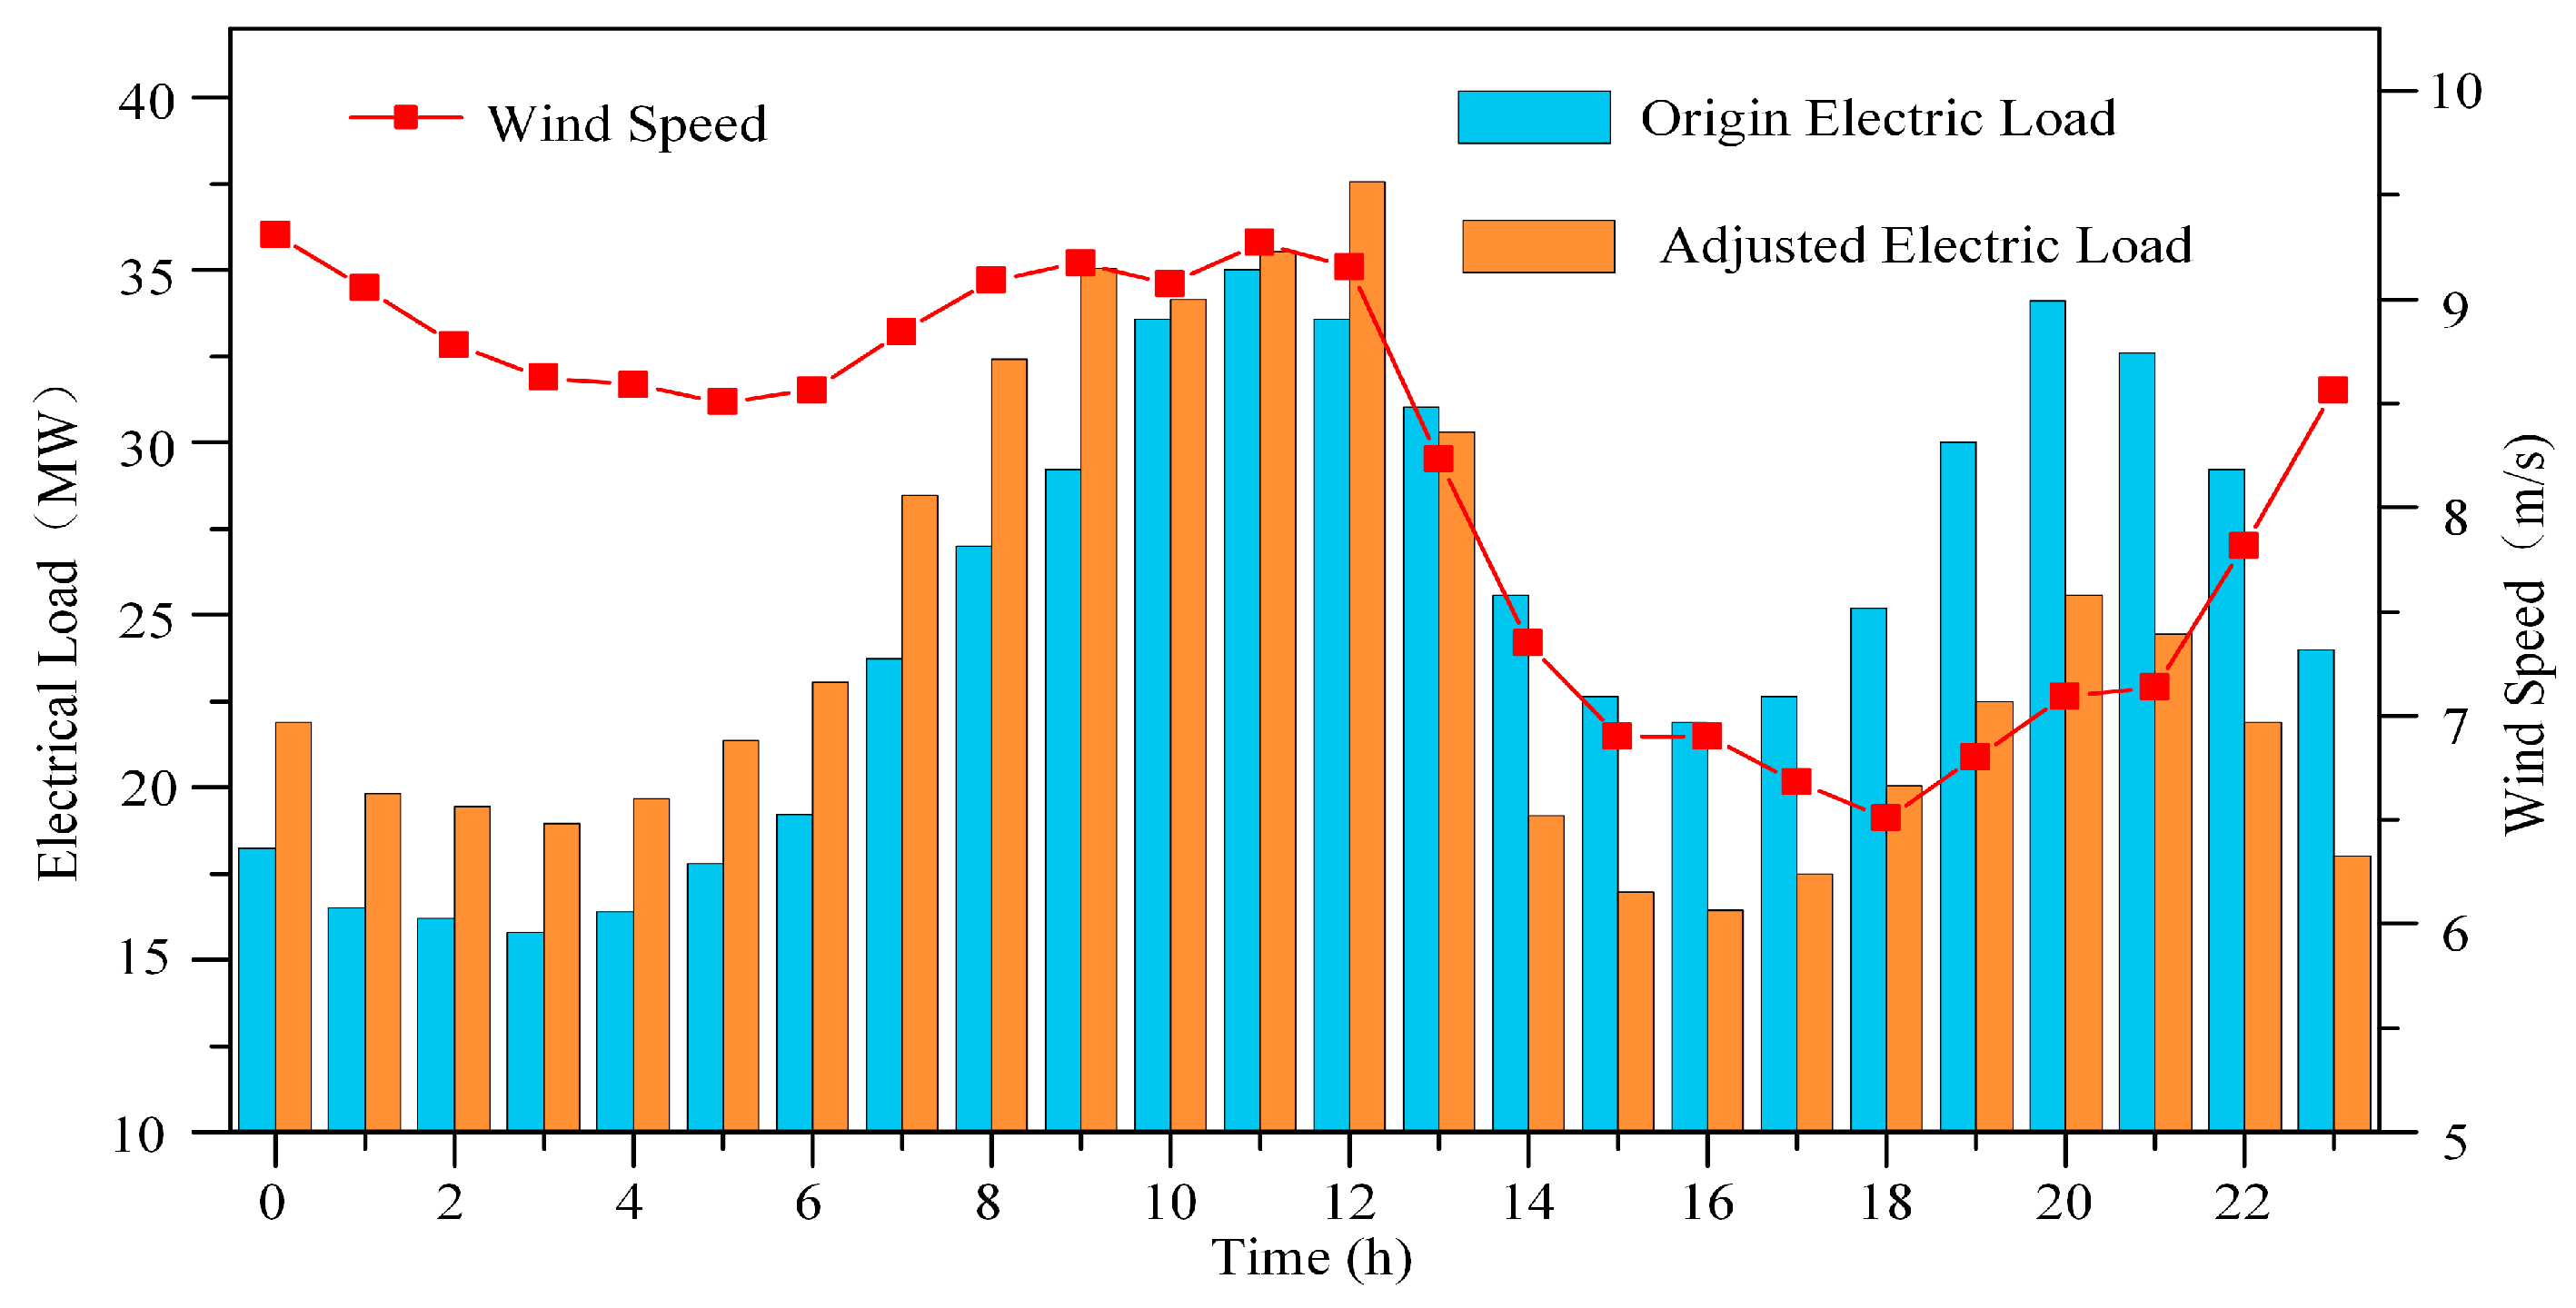
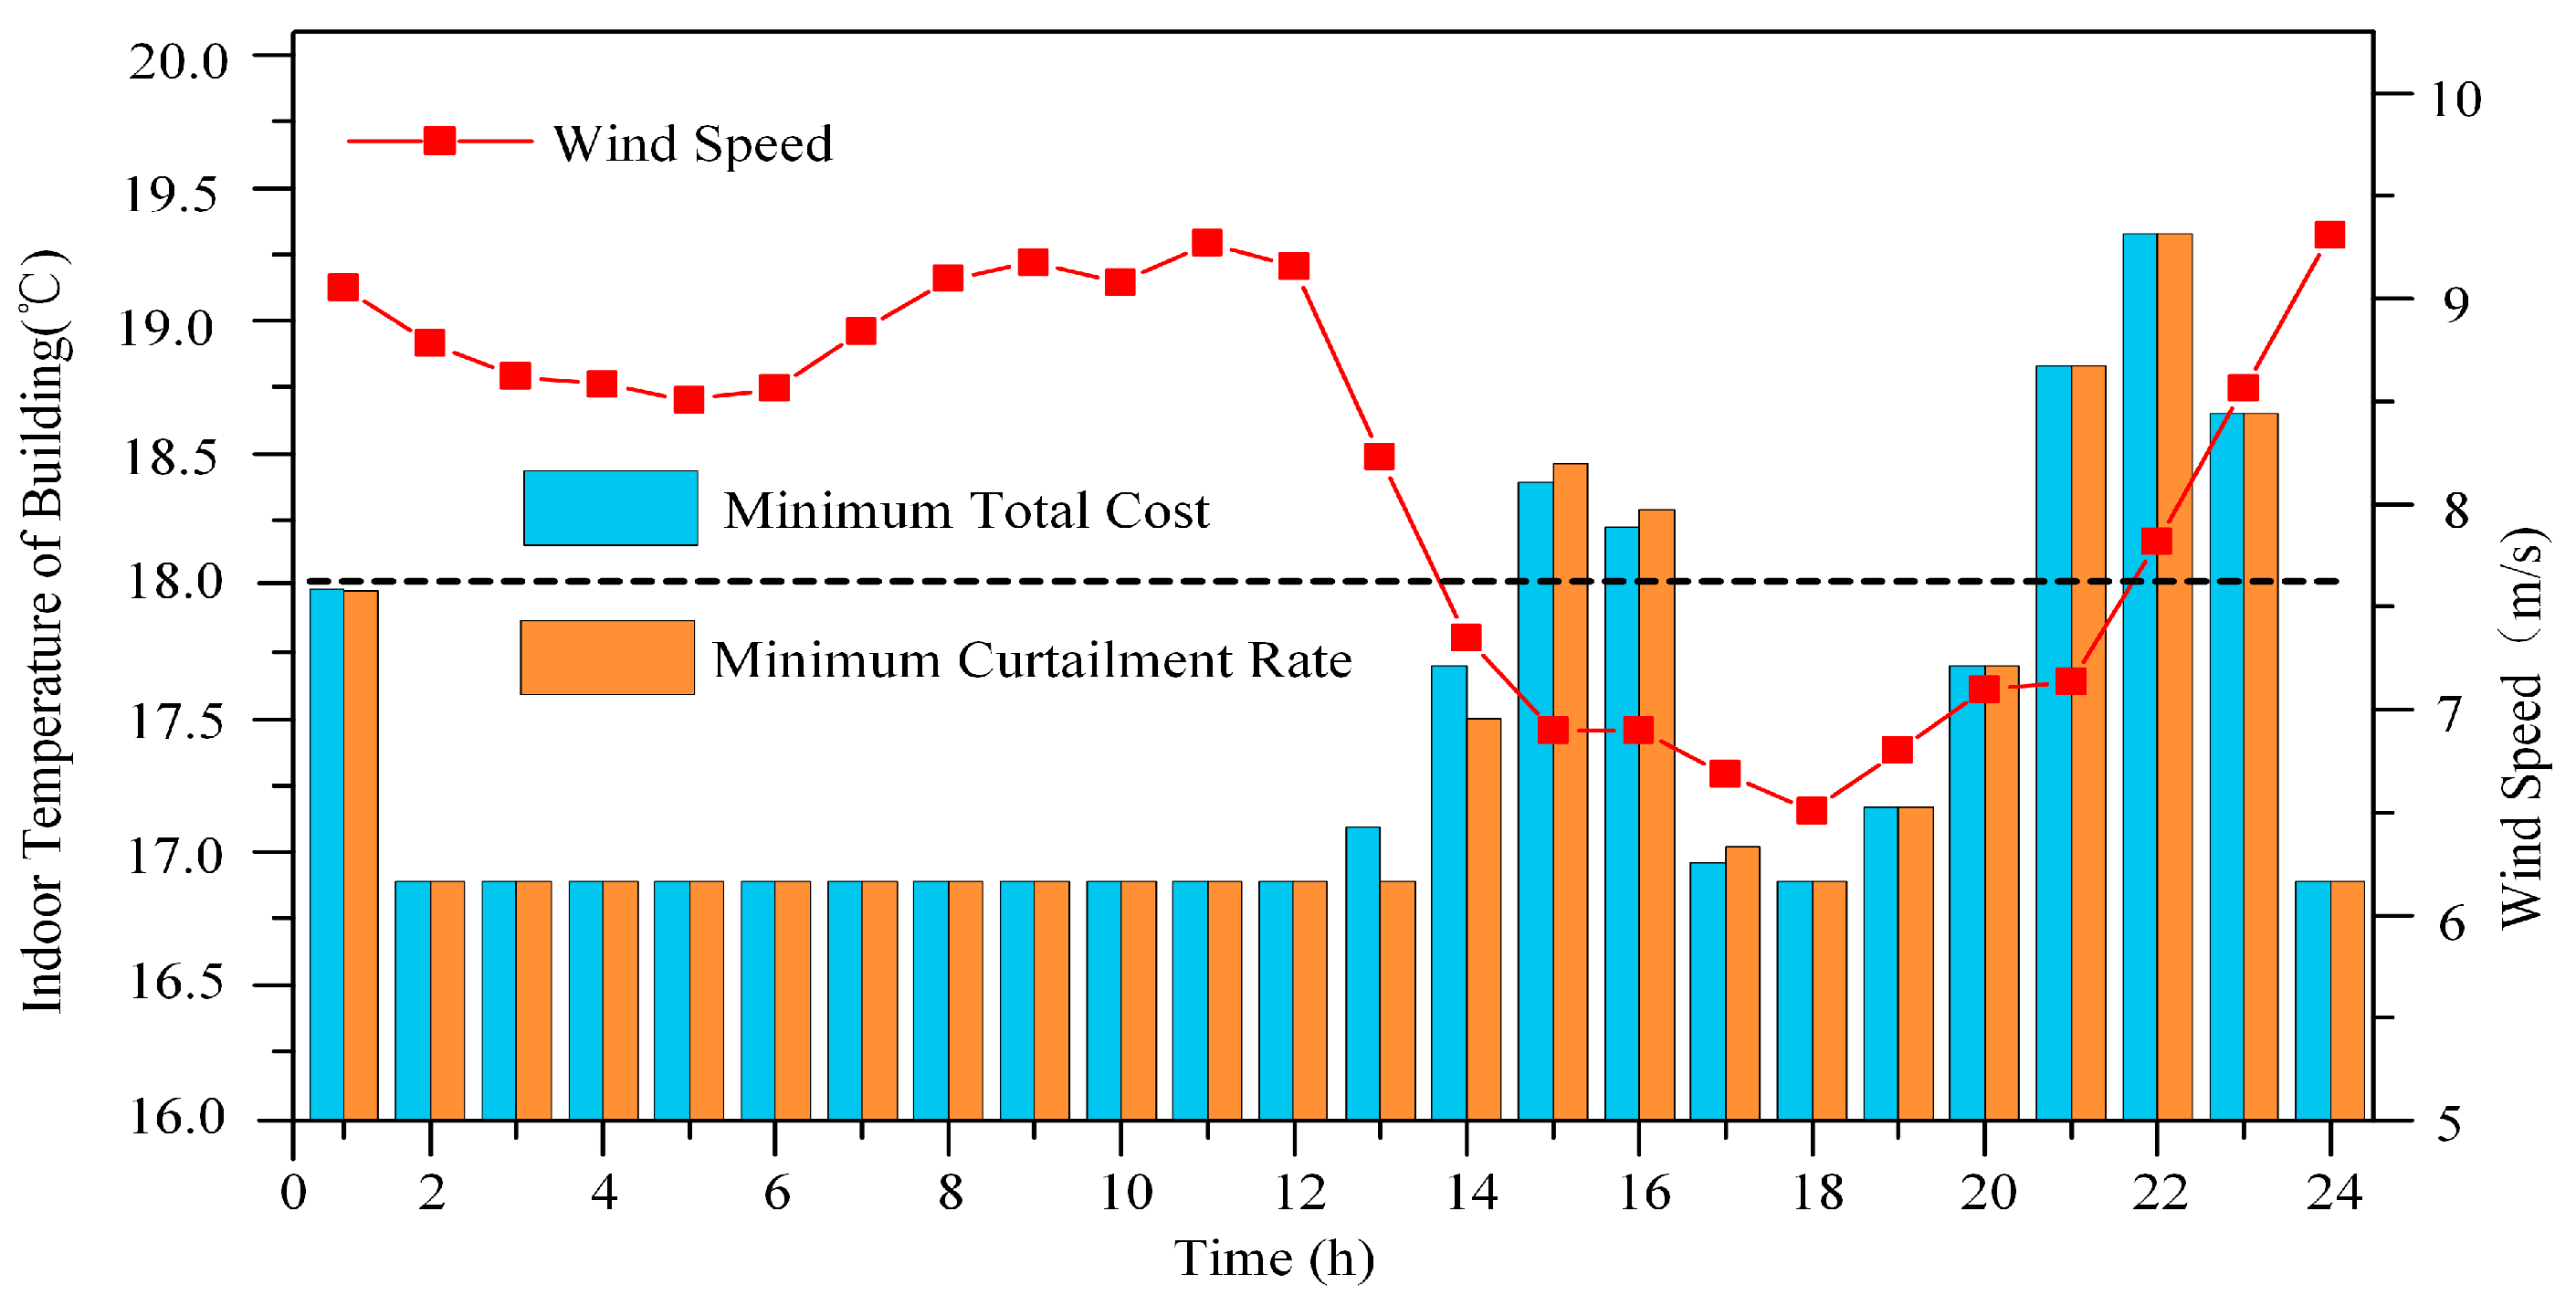
In Case 2, where flexible load regulation is considered separately, the comparison between the regulated load and the original load is shown in Figure 5.
Figure 5 shows that the wind speed of the park is larger during the period of 0:00–12:00. After 12:00, the wind speed shows a downward trend. After 18:00, the wind speed of the park shows an upward trend. On the whole, the flexible electrical load can absorb renewable energy as much as possible by transferring the load to the high wind speed period to improve the overall economic performance. Therefore, it presents the characteristics of turning in the high wind speed period and turning out in the low wind speed period. Accordingly, in the 0:00–12:00 period, the adjusted electrical load is higher than the original electrical load, in the 12:00–23:00 period, the adjusted electrical load is lower than the original electrical load.
The park has a low electrical load during the 0:00–6:00 period, and the outdoor low-temperature environment increases heat load demand and the output of gas CHP units, sufficient to meet most of the electricity demand. To absorb the abundant wind power, part of the load is transferred to this period. Subsequently, after 6:00, although the electrical load increases, the original load remains lower than the electric energy output of HRIES. Similarly, to increase the consumption of renewable energy, some loads are also transferred into this period. Accordingly, the actual electrical load after adjustment is higher than the original electrical load during 0:00–12:00.
At 12:00–18:00, on the one hand, the decrease in wind speed leads to a decrease in wind turbine output; on the other hand, at the same time, the outdoor temperature rises, the heat load demand decreases, and the output of the gas CHP units also decrease accordingly. Consequently, a portion of the electrical load is transferred to reduce the actual electric demand. After 18:00, the electrical load and wind speed show an upward trend. To optimize the overall performance of HRIES, part of the load is also transferred to the 0:00–12:00 period. As a result, the adjusted electrical load is lower than the original load from 12:00-23:00.
In Case 3, where flexible heat load regulation is considered, the comparison between the adjusted indoor temperature and the original temperature is shown in Figure 6. Due to the large output of wind turbines in HRIES during the 0:00–12:00 period, to reduce the output of gas CHP units to increase the space for renewable energy consumption, the indoor temperature during this period is low. Subsequently, after 12:00, the outdoor temperature rises and the wind turbine output decreases, the indoor temperature rises again.
It is noteworthy that indoor temperatures show a similar trend at a minimum total cost and a minimum renewable energy curtailment rate, with only a small difference between the two at 13:00–17:00, Notably, only when the output of the wind turbine is minimal, the indoor temperature under the minimum renewable energy curtailment rate is greater than that of the minimum total cost.
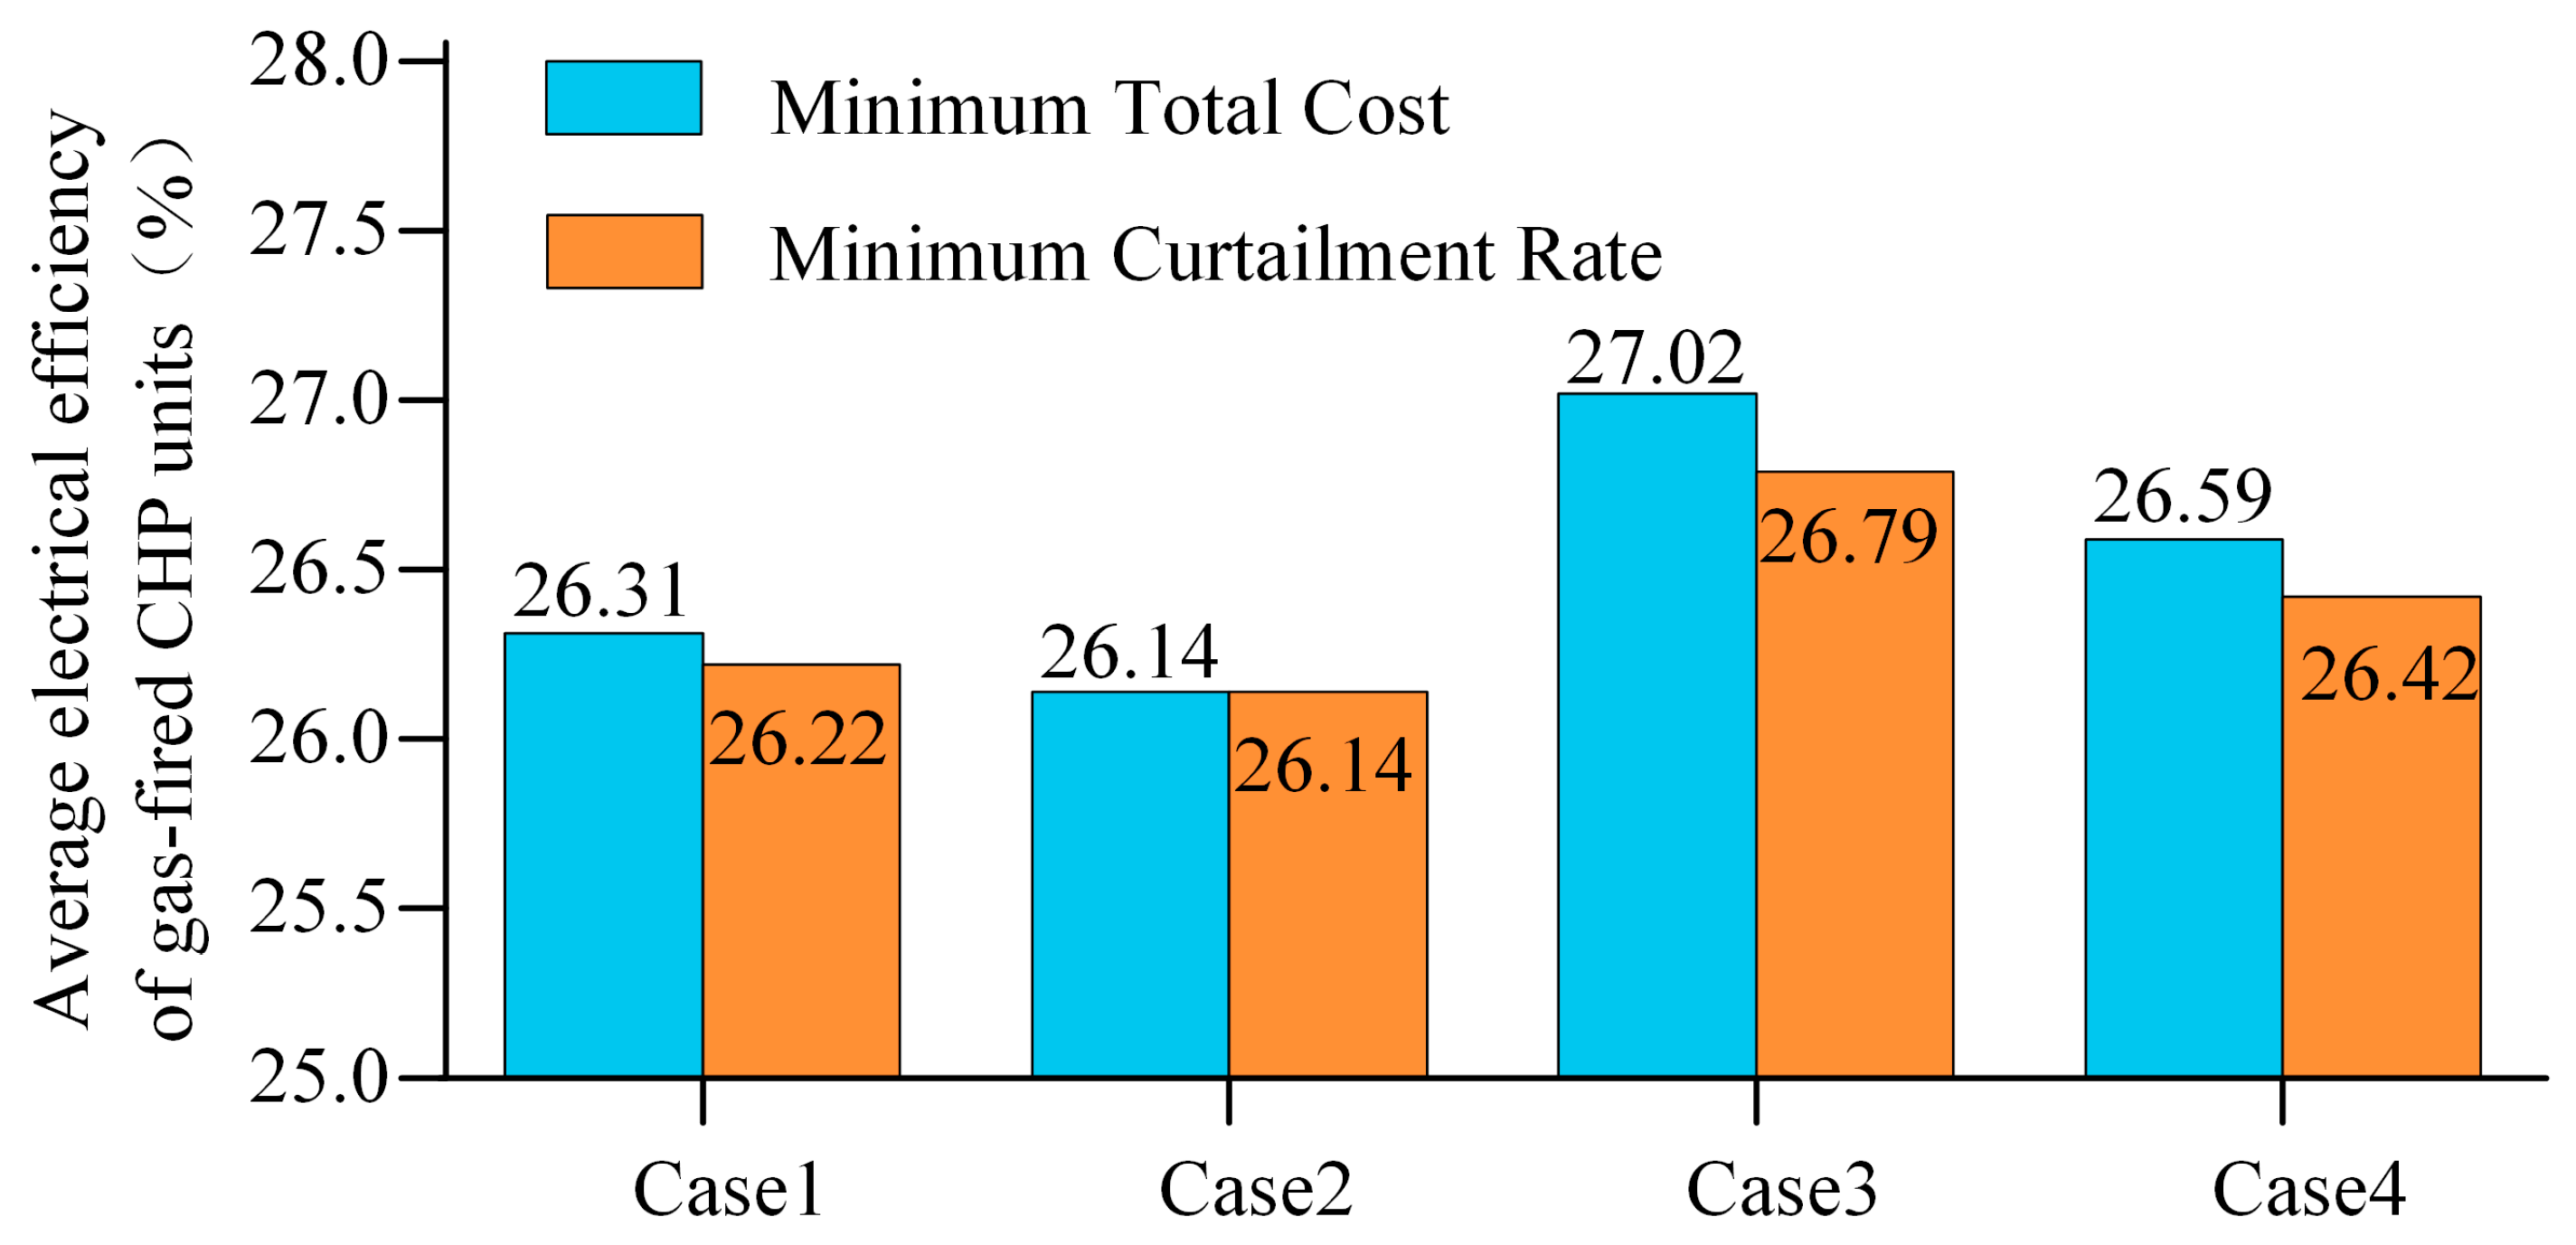
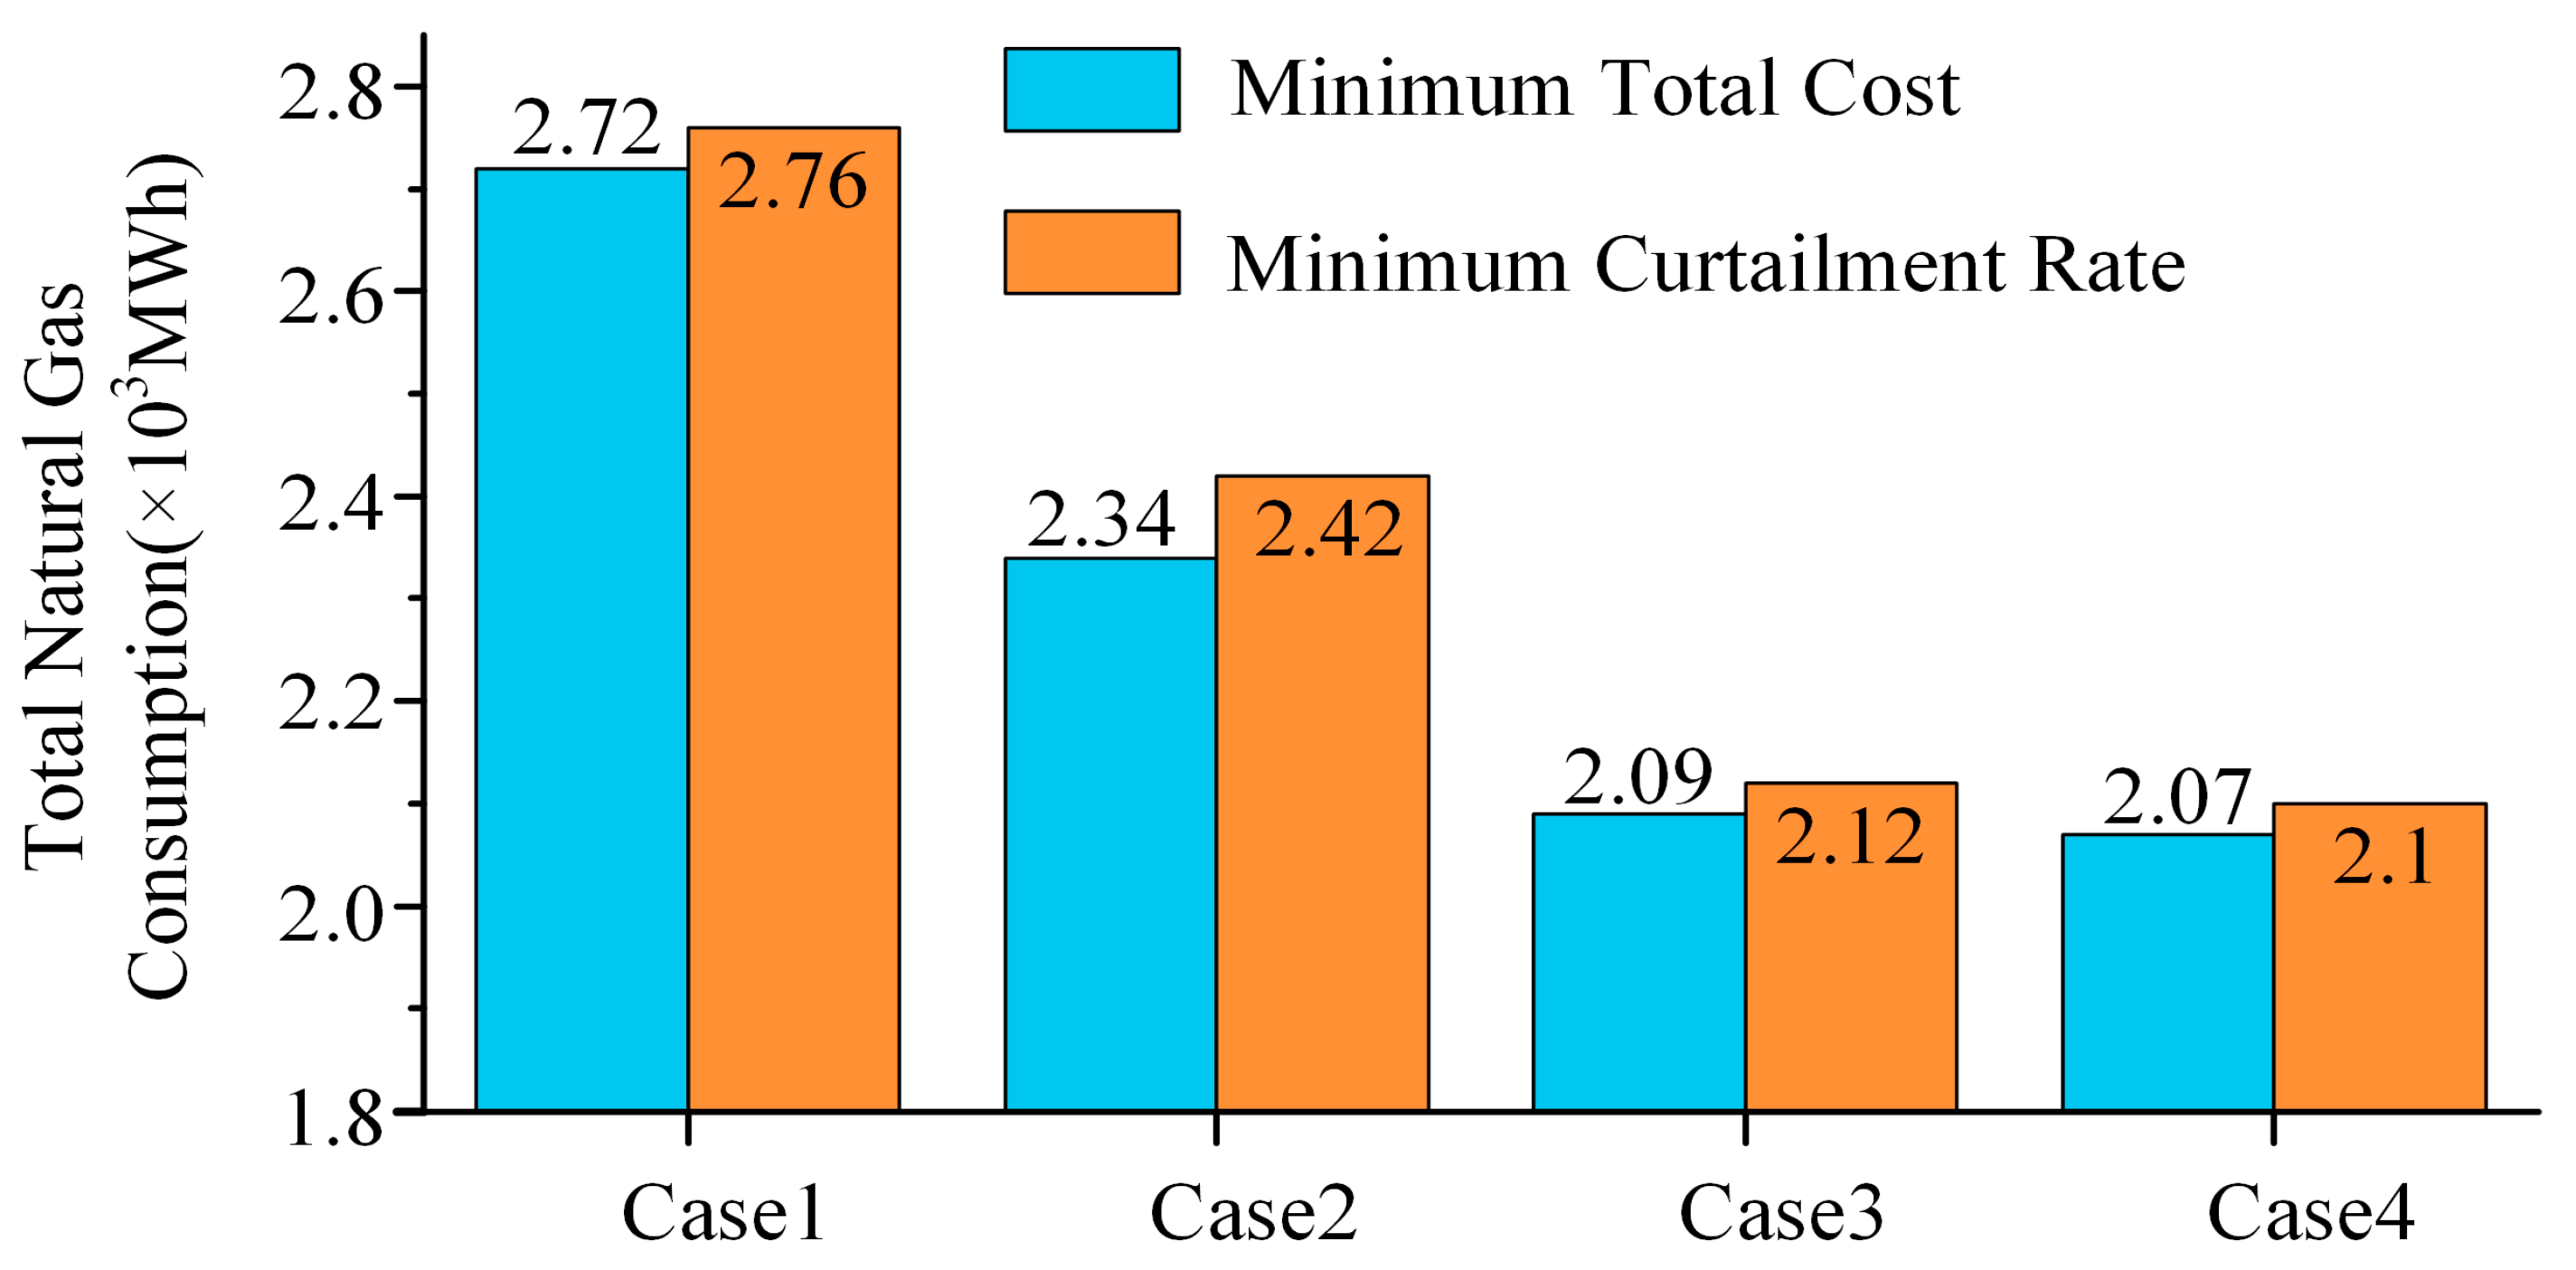
In addition, to analyze the essence of flexible electrical load and heat load regulation to reduce costs and improve renewable energy consumption, the average efficiency and total natural gas consumption data of gas CHP units during HRIES operation are extracted, as shown in Figure 7 and Figure 8.
Improving the energy efficiency of gas CHP units is essentially to reduce the increase of entropy. According to Figure 7, when the minimum total cost is pursued, the average electrical efficiency of the gas CHP units in the original HRIES is 26.31%. If flexible load regulation is considered in the operation optimization of HRIES, the average electrical efficiency of CHP units will be reduced to 26.14%. Under the same load, this case needs to consume more natural gas. Nevertheless, the flexible electricity load regulation leads to a reduction in the renewable energy curtailment rate, enabling a portion of the electricity load to be supplied by wind turbines, resulting in a decrease in the total consumption of natural gas from 2.72 × 10³ MWh in Case 1 to 2.34 × 10³ MWh. (Figure 8). The data again proves that flexible electrical load regulation reduces the total cost by increasing renewable energy consumption.
In contrast, when the flexible heat load is involved in the regulation, the average electrical efficiency of the gas CHP units is increased to 27.02%. Coupled with the substitution of some renewable energy sources, the total natural gas consumption during HRIES operation is reduced to 2.09 × 10³ MWh. However, when the renewable energy curtailment rate pursues to be minimum, the average electricity efficiency of gas CHP units will drop to 26.79%. Consequently, relative to the minimum total cost, the total natural gas consumption increases to 2.12 × 10³ MWh, resulting in the total cost increase from 382.4 thousand Yuan to 386.0 thousand Yuan. These findings prove that the flexible heat load regulation reduces the total cost by coordinating the reduction of the renewable energy curtailment rate and the enhancement of the average electrical efficiency of the gas CHP units. Blindly pursuing the consumption of renewable energy will worsen the cost.
For Case 4, which considers both flexible electrical load and heat load regulation, the average electrical efficiency of gas CHP units is improved compared with the case without considering flexible load regulation due to the regulation of flexible heat load. This optimization coupled with the partial substitution of renewable energy sources, results in a notable reduction in total natural gas consumption to 2.07 × 10³ MWh. Moreover, similar to the case of considering flexible heat load regulation alone, blindly pursuing the consumption of renewable energy will also reduce the average electrical efficiency of gas CHP units, which in turn leads to an increase in natural gas consumption, an increase in energy purchase costs, and ultimately a deterioration in total costs.

6. Conclusions

Aiming at the problem of potential flexibility resource mining in a hybrid renewable integrated energy system (HRIES), this paper proposes an operation optimization model considering multiple flexible load regulation and equipment variable conditions and analyzes the regulation coordination mechanism of flexible electrical load and thermal load and the promotion effect on HRIES operation performance. The conclusions are as follows:
(1)
Flexible load increases the compatibility between load and renewable energy output by adjusting the actual load curve of HRIES, thereby increasing the consumption of renewable energy. In addition, flexible load regulation mainly reduces the total cost of HRIES operation by increasing renewable energy consumption.
(2)
The flexible heating load reduces the total cost of the system by coordinating the renewable energy consumption during HRIES operation with the increase in the average electrical efficiency of the gas CHP units. Blindly pursuing renewable energy consumption during HRIES operation will reduce the average power efficiency of gas CHP units, which in turn worsens the total cost of the system.
(3)
Flexible electrical load and thermal load regulation have a saturation effect in improving the consumption of renewable energy during HRIES operation and a synergistic effect in reducing the total cost of the system, which can reduce the total cost by 0.73%.
(4)
If the regulation of flexible electrical and heat loads is considered in the operation optimization of HRIES, the total economic cost of the system will decrease by 15.13%, and the renewable energy curtailment rate will decrease by 12.08%.

Author Contributions

Conceptualization, Mou Wu; Methodology, Mou Wu; Methodology, Mou Wu; Visualization, Mou Wu, Rujing Yan and Jing Zhang; Investigation, Mou Wu; Formal analysis, Mou Wu; Writing-Original draft, Mou Wu, Junqiu Fan, Rujing Yan, Xiangxie Hu, Yu He and Guoqiang Cao; Writing-Review & Editing, Mou Wu, Xiangxie Hu, Jing Zhang, Yu He and Guoqiang Cao; Resources, Supervision, Junqiu Fan; Junqiu Fan, Supervision, Weixin Zhao and Da Song. All authors have read and agreed to the published version of the manuscript.

Funding

This research was funded by the Natural Science Special (special post) Research Fund Program of Guizhou University [2022]-48, Innovation Fund Program of Guizhou University Institute of Engineering Investigation and Design [2022]-01, and the Southern Power Grid General Technology Projects (Grant No. GZKJXM20210413).

Institutional Review Board Statement

Not applicable.

Data Availability Statement

Data sharing are not applicable.

Conflicts of Interest

The authors declare no conflicts of interest.

References

  1. Du, Y.; Liu, H.; Huang, H.; Li, X. The carbon emission reduction effect of agricultural policy——Evidence from China. Journal of Cleaner Production 2023, 137005. [Google Scholar] [CrossRef]
  2. Wen, D.; Aziz, M. Design and analysis of biomass-to-ammonia-to-power as an energy storage method in a renewable multi-generation system. Energy Conversion and Management 2022, 261, 115611. [Google Scholar] [CrossRef]
  3. Su, Y.; Cheng, H.; Wang, Z.; Yan, J.; Miao, Z.; Gong, A. Analysis and prediction of carbon emission in the large green commercial building: A case study in Dalian, China. Journal of Building Engineering 2023, 68, 106147. [Google Scholar] [CrossRef]
  4. Huo, T.; Du, Q.; Xu, L.; Shi, Q.; Cong, X.; Cai, W. Timetable and roadmap for achieving carbon peak and carbon neutrality of China's building sector. Energy 2023, 274, 127330. [Google Scholar] [CrossRef]
  5. Ali, K. A.; Ahmad, M. I.; Yusup, Y. Issues, Impacts, and Mitigations of Carbon Dioxide Emissions in the Building Sector. SUSTAINABILITY 2020, 12(18). [Google Scholar] [CrossRef]
  6. Ke, Y. Y.; Zhou, L.; Zhu, M. L.; Yang, Y.; Fan, R.; Ma, X. R. Scenario Prediction of Carbon Emission Peak of Urban Residential Buildings in China's Coastal Region: A Case of Fujian Province. SUSTAINABILITY 2023, 15(3). [Google Scholar] [CrossRef]
  7. Zeng, P. L.; Xu, J.; Zhu, M. C. Demand Response Strategy Based on the Multi-Agent System and Multiple-Load Participation. SUSTAINABILITY 2024, 16(2). [Google Scholar] [CrossRef]
  8. Al-Rawashdeh, H.; Al-Khashman, O. A.; Al Bdour, J. T.; Gomaa, M. R.; Rezk, H.; Marashli, A.; Arrfou, L. M.; Louzazni, M. Performance Analysis of a Hybrid Renewable-Energy System for Green Buildings to Improve Efficiency and Reduce GHG Emissions with Multiple Scenarios. SUSTAINABILITY 2023, 15(9). [Google Scholar] [CrossRef]
  9. Reddy, V. J.; Hariram, N. P.; Ghazali, M. F.; Kumarasamy, S. Pathway to Sustainability: An Overview of Renewable Energy Integration in Building Systems. SUSTAINABILITY 2024, 16(2). [Google Scholar] [CrossRef]
  10. Shi, S. H.; Zhu, N. Challenges and Optimization of Building-Integrated Photovoltaics (BIPV) Windows: A Review. SUSTAINABILITY 2023, 15(22). [Google Scholar] [CrossRef]
  11. Liu, M.; Wang, S.; Yan, J. Operation scheduling of a coal-fired CHP station integrated with power-to-heat devices with detail CHP unit models by particle swarm optimization algorithm. Energy 2021, 214. [Google Scholar] [CrossRef]
  12. Turk, A.; Wu, Q.; Zhang, M.; Ostergaard, J. Day-ahead stochastic scheduling of integrated multi-energy system for flexibility synergy and uncertainty balancing. Energy 2020, 196. [Google Scholar] [CrossRef]
  13. Zeng, Q.; Zhang, B.; Fang, J.; Chen, Z. A bi-level programming for multistage co-expansion planning of the integrated gas and electricity system. Applied Energy 2017, 200, 192–203. [Google Scholar] [CrossRef]
  14. Wang, H.; Zhang, C.; Li, K.; Ma, X. Game theory-based multi-agent capacity optimization for integrated energy systems with compressed air energy storage. Energy 2021, 221. [Google Scholar] [CrossRef]
  15. Zhou, Y.; Zhao, P.; Xu, F.; Cui, D.; Ge, W.; Chen, X.; Gu, B. Optimal Dispatch Strategy for a Flexible Integrated Energy Storage System for Wind Power Accommodation. Energies 2020, 13(5). [Google Scholar] [CrossRef]
  16. Ji, L.; Liang, X.; Xie, Y.; Huang, G.; Wang, B. Optimal design and sensitivity analysis of the stand-alone hybrid energy system with PV and biomass-CHP for remote villages. Energy 2021, 225. [Google Scholar] [CrossRef]
  17. Li, H.; Wei, Z.; Miao, Q.; Zhao, L.; Sun, B.; Zhang, C. Multi-energy flow cooperative dispatch for generation, storage, and demand in integrated energy systems with dynamic correction. Sustainable Cities and Society 2022, 76. [Google Scholar] [CrossRef]
  18. Zeng, R.; Guo, B.; Zhang, X.; Li, H.; Zhang, G. Study on thermodynamic performance of SOFC-CCHP system integrating ORC and double-effect ARC. Energy Conversion and Management 2021, 242, 114326. [Google Scholar] [CrossRef]
  19. Jiang, Y.; Xu, J.; Sun, Y.; Wei, C.; Wang, J.; Liao, S.; Ke, D.; Li, X.; Yang, J.; Peng, X. Coordinated operation of gas-electricity integrated distribution system with multi-CCHP and distributed renewable energy sources. Applied Energy 2018, 211, 237–248. [Google Scholar] [CrossRef]
  20. Li, Z.; Wu, W.; Shahidehpour, M.; Wang, J.; Zhang, B. Combined Heat and Power Dispatch Considering Pipeline Energy Storage of District Heating Network. Ieee Transactions on Sustainable Energy 2016, 7(1), 12–22. [Google Scholar] [CrossRef]
  21. Wang, J.; Huo, S.; Yan, R.; Cui, Z. Leveraging heat accumulation of district heating network to improve performances of integrated energy system under source-load uncertainties. Energy 2022, 252. [Google Scholar] [CrossRef]
  22. Xue, Y.; Shahidehpour, M.; Pan, Z.; Wang, B.; Zhou, Q.; Guo, Q.; Sun, H. Reconfiguration of District Heating Network for Operational Flexibility Enhancement in Power System Unit Commitment. Ieee Transactions on Sustainable Energy 2021, (2), 1161–1173. [Google Scholar] [CrossRef]
  23. Aluisio, B.; Dicorato, M.; Forte, G.; Litrico, G.; Trovato, M. Integration of heat production and thermal comfort models in microgrid operation planning. Sustainable Energy Grids & Networks 2018, 16, 37–54. [Google Scholar] [CrossRef]
  24. Yang, X.; Chen, Z.; Huang, X.; Li, R.; Xu, S.; Yang, C. Robust capacity optimization methods for integrated energy systems considering demand response and thermal comfort. Energy 2021, 221. [Google Scholar] [CrossRef]
  25. Huang, H.; Wang, H.; Hu, Y.-J.; Li, C.; Wang, X. Optimal plan for energy conservation and CO2 emissions reduction of public buildings considering users' behavior: Case of China. Energy 2022, 261. [Google Scholar] [CrossRef]
  26. Wang, D.; Zhi, Y.-q.; Jia, H.-j.; Hou, K.; Zhang, S.-x.; Du, W.; Wang, X.-d.; Fan, M.-h. Optimal scheduling strategy of district integrated heat and power system with wind power and multiple energy stations considering thermal inertia of buildings under different heating regulation modes. Applied Energy 2019, 240, 341–358. [Google Scholar] [CrossRef]
  27. Zhang, Y.; Ge, Z.; Yang, Y.; Hao, J.; Xu, L.; Du, X.; Traeholt, C. Carbon reduction and flexibility enhancement of the CHP-based cascade heating system with integrated electric heat pump. Energy Conversion and Management 2023, 280. [Google Scholar] [CrossRef]
  28. Sun, H.; Sun, X.; Kou, L.; Zhang, B.; Zhu, X. Optimal scheduling of park-level integrated energy system considering ladder-type carbon trading mechanism and flexible load. Energy Reports 2023, 9, 3417–3430. [Google Scholar] [CrossRef]
  29. Lu, N. An Evaluation of the HVAC Load Potential for Providing Load Balancing Service. IEEE Transactions on Smart Grid 2012, 3(3), 1263–1270. [Google Scholar] [CrossRef]
  30. Liu, W.; Tian, X.; Yang, D.; Deng, Y. Evaluation of individual thermal sensation at raised indoor temperatures based on skin temperature. Building and Environment 2021, 188. [Google Scholar] [CrossRef]
  31. Lin, L.; Gu, J.; Wang, L. Optimal Dispatching of Combined Heat-power System Considering Characteristics of Thermal Network and Thermal Comfort Elasticity for Wind Power Accommodation. Dianwang Jishu/Power System Technology 2019, 43(10), 3648–3655. [Google Scholar]
  32. Yang, H.; Xiong, T.; Qiu, J.; Qiu, D.; Dong, Z. Y. Optimal operation of DES/CCHP based regional multi-energy prosumer with demand response. Applied Energy 2016, 167, 353–365. [Google Scholar] [CrossRef]
  33. Li, H. Evaluation of a Distributed Energy System Combined With Heating, Cooling and Power Generation Through Multi-Criteria Optimization. In 2003; pp. 277-284. [CrossRef]
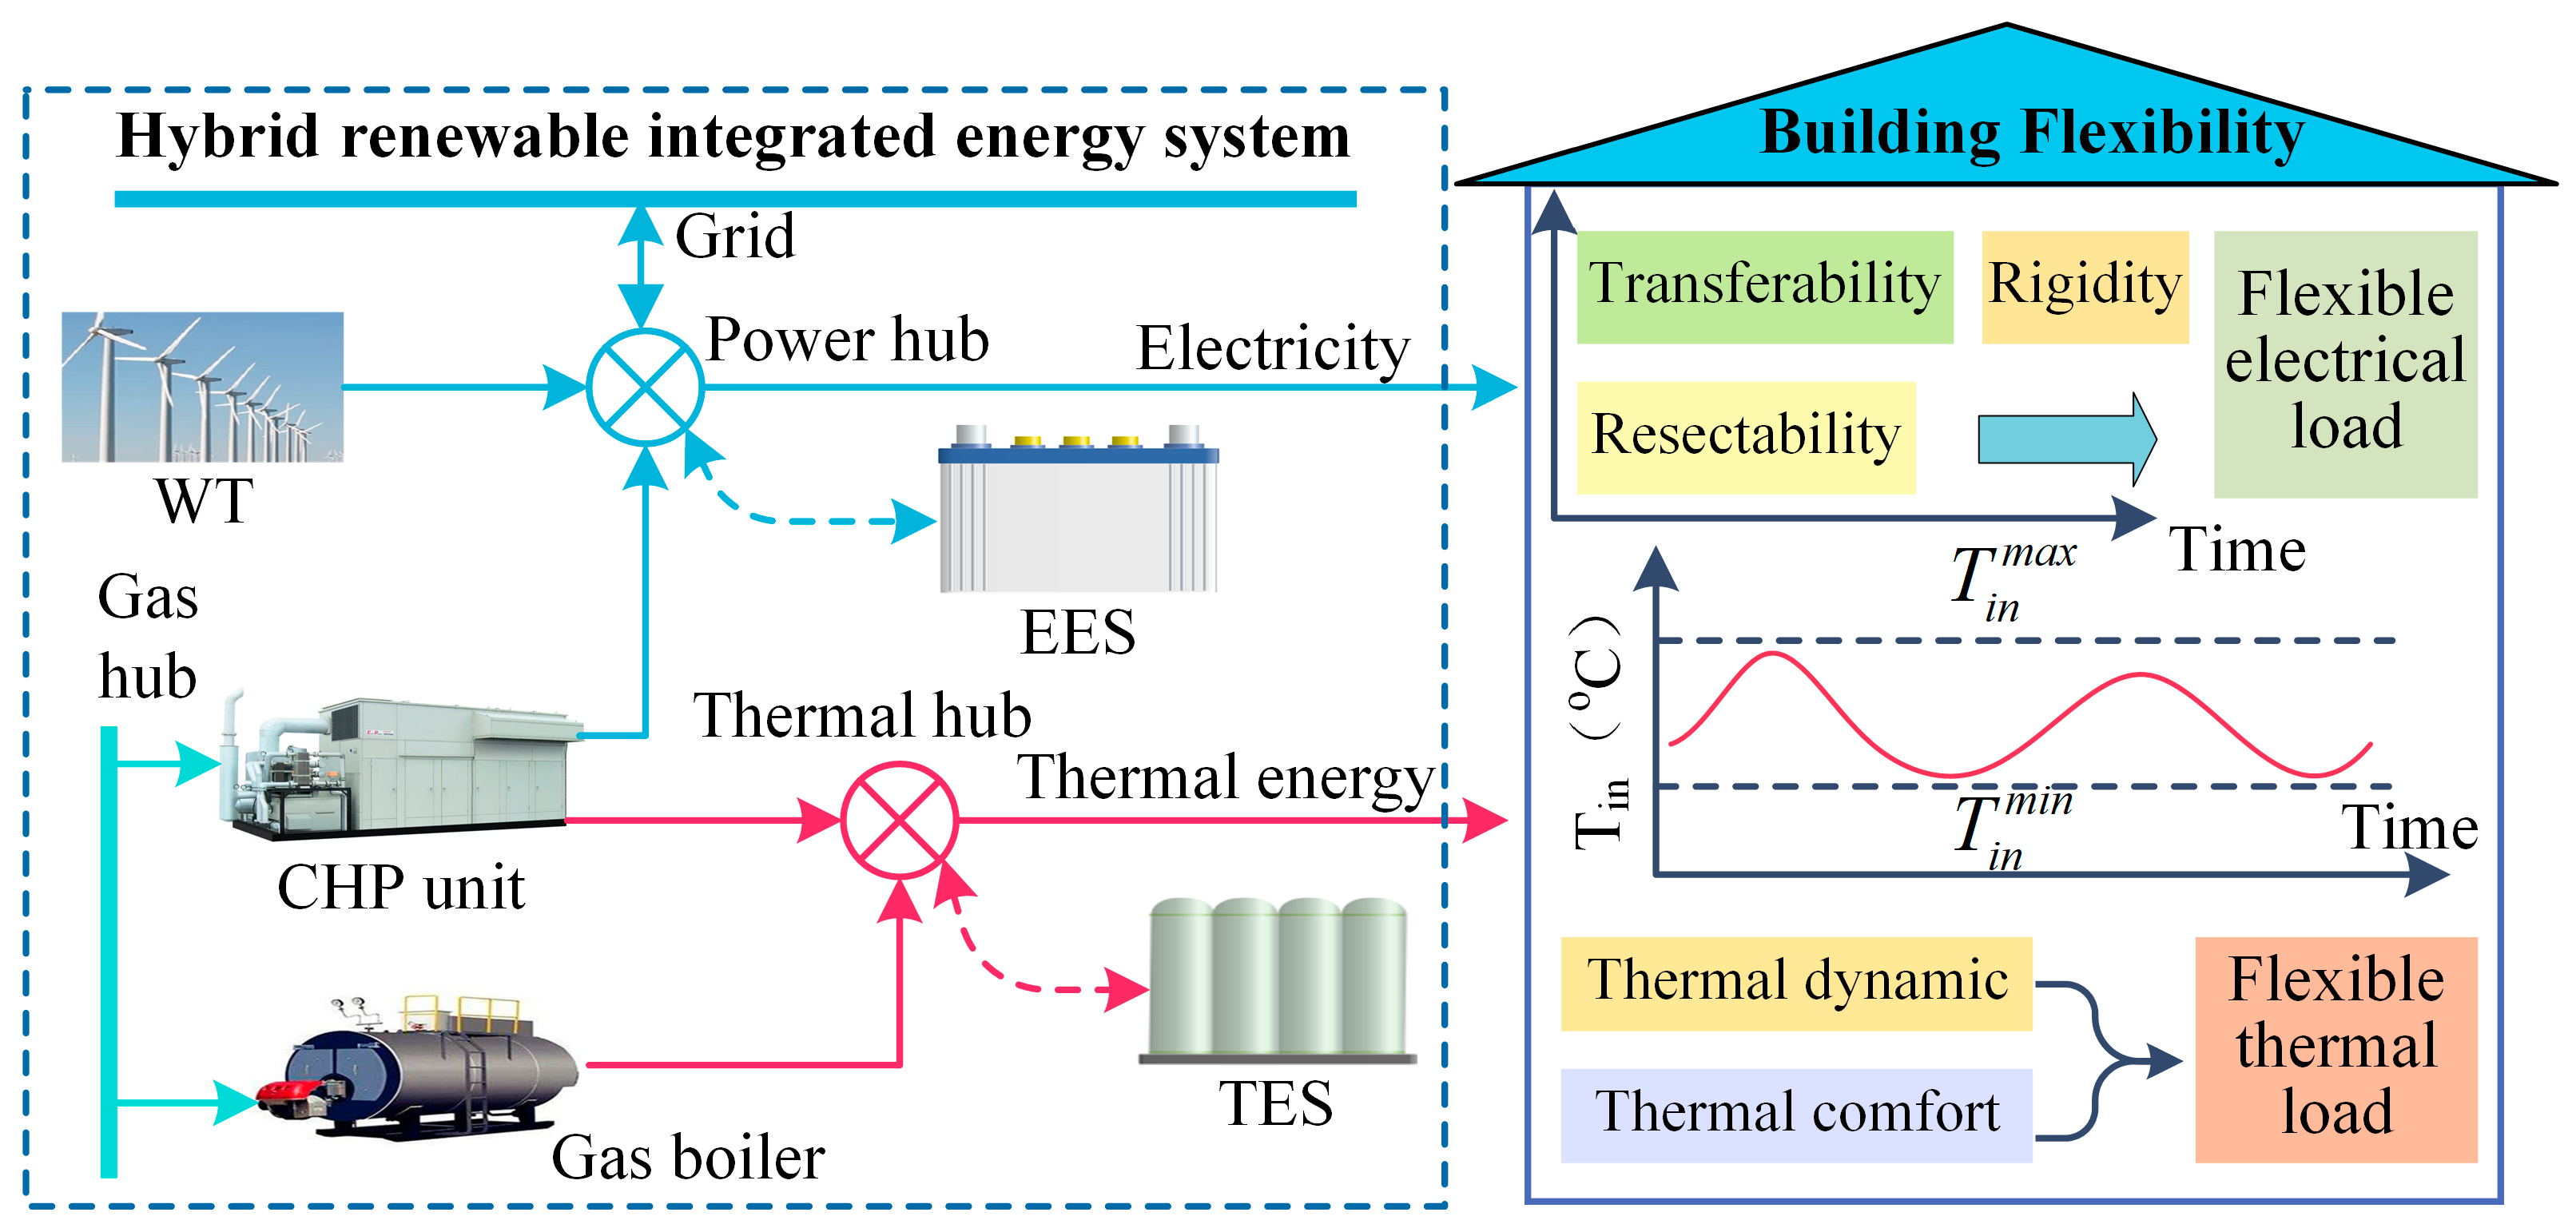
Figure 1. Structure of hybrid renewable HRIES with flexible buildings.
Preprints 100480 g001
Figure 2. Schematic diagram of a dynamic heat transfer process.
Preprints 100480 g002
Figure 3. Typical outdoor temperature and wind speed in the park.
Preprints 100480 g003
Figure 4. The typical electrical load of the park and its electricity price.
Preprints 100480 g004
Figure 5. Optimal hourly electrical load under flexible electrical load regulation.
Preprints 100480 g005
Figure 6. Optimal indoor temperature curve under flexible heat load regulation.
Preprints 100480 g006
Figure 7. Average electrical efficiency of gas CHP units in four cases.
Preprints 100480 g007
Figure 8. Total natural gas consumption of HRIES in the four cases.
Preprints 100480 g008
Table 1. Economic and technical parameters of devices.
Equipment Unit Maintenance Cost (Yuan/MWh) Technical Parameters
GB 20 ICGB = 12 MW; URGB = DRGB = 6 MW/h
EES 83 η E E S i m = η E E S e x = 0.95 ; λ E E S max , i m = λ E E S max , e x = 0.35 ; χ E E S min = 0.2 ;
χ E E S max = 0.9 ; I C E E S = 20   WMh ;   E E E S 0 = 4   WMh
HES 20 η T E S i m = η T E S e x = 0.88 ; λ T E S max , i m = λ T E S max , e x = 0.4 ; χ T E S min = 0 ;
χ T E S max = 0.9 ; I C T E S = 20   WMh ;   E T E S 0 = 0   WMh
CHP 20 ICCHP = 35 MW; URCHP = DRCHP = 12.25 MW/h
WT 68 ICWT = 50 MW
Table 2. Optimized results under the minimum total cost.
Optimized
results
curtailment rate (%) TC
(Thousand Yuan)
MC
(Thousand Yuan)
EC
(Thousand Yuan)
CEC
(Thousand Yuan)
REP
(Thousand Yuan)
Case 1 27.24 413.8 48.6 310.5 12.8 45.6
Case 2 19.06 385.6 47.6 290.3 14.1 33.6
Case 3 22.68 382.4 45.5 282.2 15.8 38.8
Case 4 15.04 351.2 50.0 263.1 12.4 25.7
Table 3. Optimized results under minimum renewable energy curtailment rate.
Optimized
results
curtailment rate (%) TC
(Thousand Yuan)
MC
(Thousand Yuan)
EC
(Thousand Yuan)
CEC
(Thousand Yuan)
REP
(Thousand Yuan)
Case 1 26.73 417.6 48.6 310.5 12.8 45.7
Case 2 19.06 385.6 47.6 290.3 14.1 33.6
Case 3 22.05 386.0 50.7 282.3 15.8 37.7
Case 4 14.65 354.2 53.7 263.1 12.4 25
Disclaimer/Publisher’s Note: The statements, opinions and data contained in all publications are solely those of the individual author(s) and contributor(s) and not of MDPI and/or the editor(s). MDPI and/or the editor(s) disclaim responsibility for any injury to people or property resulting from any ideas, methods, instructions or products referred to in the content.
Copyright: This open access article is published under a Creative Commons CC BY 4.0 license, which permit the free download, distribution, and reuse, provided that the author and preprint are cited in any reuse.
Prerpints.org logo

Preprints.org is a free preprint server supported by MDPI in Basel, Switzerland.

Subscribe

© 2024 MDPI (Basel, Switzerland) unless otherwise stated