Submitted:
03 March 2024
Posted:
04 March 2024
You are already at the latest version
Abstract
Keywords:
1. Introduction
2. Methods
2.1. Type of Study
2.2. Data Source, GIS-Mapping and Statistical Analyses
2.3. Population and Sample
Results
Discussion
Author Contributions
Funding
Ethics approval and consent to participate
Consent for publication
Availability of data and materials
Acknowledgements
Competing interests
References
- Rodriguez-Morales, A.J.; Castañeda-Hernández, D.M. Bacteria: Mycobacterium bovis. In Reference Module in Food Science; Elsevier, 2019. [Google Scholar] [CrossRef]
- Rodriguez-Morales, A.J.; Castañeda-Hernández, D.M. Bacteria: Mycobacterium bovis. In Encyclopedia of Food Safety; Motarjemi, Y., Ed.; Academic Press: Waltham, 2014; pp. 468–475. [Google Scholar] [CrossRef]
- Ramanujam, H.; Palaniyandi, K. Bovine tuberculosis in India: The need for One Health approach and the way forward. One health (Amsterdam, Netherlands) 2023, 16, 100495. [Google Scholar] [CrossRef] [PubMed]
- Willgert, K.; da Silva, S.; Li, R.; Dandapat, P.; Veerasami, M.; Maity, H.; Papanna, M.; Srinivasan, S.; Wood, J.L.N.; Kapur, V.; et al. Is bovine density and ownership associated with human tuberculosis in India? PloS one 2023, 18, e0283357. [Google Scholar] [CrossRef] [PubMed]
- Milián-Suazo, F.; González-Ruiz, S.; Contreras-Magallanes, Y.G.; Sosa-Gallegos, S.L.; Bárcenas-Reyes, I.; Cantó-Alarcón, G.J.; Rodríguez-Hernández, E. Vaccination Strategies in a Potential Use of the Vaccine against Bovine Tuberculosis in Infected Herds. Animals: an open access journal from MDPI 2022, 12. [Google Scholar] [CrossRef]
- Aguirre, C.; Acosta-España, J.D.; Patajalo-Villata, S.J.; Rodriguez-Morales, A.J. Necrotising pneumonia caused by Curvularia hawaiiensis (syn. Bipolaris hawaiiensis) and Mycobacterium tuberculosis coinfection in a patient with ascariasis: a case report and review. Annals of clinical microbiology and antimicrobials 2023, 22, 36. [Google Scholar] [CrossRef] [PubMed]
- Rodriguez-Morales, A.J.; Abbara, A.; Ntoumi, F.; Kapata, N.; Mwaba, P.; Yeboah-Manu, D.; Maeurer, M.; Dar, O.; Abubakar, I.; Zumla, A. World tuberculosis day 2023-Reflections on the spread of drug-resistant tuberculosis by travellers and reducing risk in forcibly displaced populations. Travel medicine and infectious disease 2023, 53, 102568. [Google Scholar] [CrossRef] [PubMed]
- Palanca, P.A.; Rodriguez-Morales, A.J.; Franco, O.H. The impact of the COVID-19 pandemic on tuberculosis services. International journal of mycobacteriology 2021, 10, 478–479. [Google Scholar] [CrossRef] [PubMed]
- Franco-Paredes, C.; Marcos, L.A.; Henao-Martínez, A.F.; Rodríguez-Morales, A.J.; Villamil-Gómez, W.E.; Gotuzzo, E.; Bonifaz, A. Cutaneous Mycobacterial Infections. Clinical microbiology reviews 2018, 32. [Google Scholar] [CrossRef]
- Giraldo-Montoya Á, M.; Rodríguez-Morales, A.J.; Hernández-Hurtado, J.D.; López-Salazar, Á.; Lagos-Grisales, G.J.; Ruiz-Granada, V.H. Rasmussen aneurysm: A rare but not gone complication of tuberculosis. International journal of infectious diseases: IJID: official publication of the International Society for Infectious Diseases 2018, 69, 8–10. [Google Scholar] [CrossRef]
- Pérez-Lago, L.; Navarro, Y.; García-de-Viedma, D. Current knowledge and pending challenges in zoonosis caused by Mycobacterium bovis: a review. Research in veterinary science 2014, 97 Suppl, S94–s100. [Google Scholar] [CrossRef]
- Leal-Bohórquez, A.F.; Castro-Osorio, C.M.; Wintaco-Martínez, L.M.; Villalobos, R.; Puerto-Castro, G.M. [Tuberculosis caused by Mycobacterium bovis in workers of bovine tuberculosis sanitation farms in Antioquia, Boyacá and Cundinamarca]. Revista de salud publica (Bogota, Colombia) 2016, 18, 727–737. [Google Scholar] [CrossRef]
- Refaya, A.K.; Bhargavi, G.; Mathew, N.C.; Rajendran, A.; Krishnamoorthy, R.; Swaminathan, S.; Palaniyandi, K. A review on bovine tuberculosis in India. Tuberculosis (Edinb) 2020, 122, 101923. [Google Scholar] [CrossRef]
- Marianelli, C.; Verrubbi, V.; Pruiti Ciarello, F.; Ippolito, D.; Pacciarini, M.L.; Di Marco Lo Presti, V. Geo-epidemiology of animal tuberculosis and Mycobacterium bovis genotypes in livestock in a small, high-incidence area in Sicily, Italy. Front Microbiol 2023, 14, 1107396. [Google Scholar] [CrossRef] [PubMed]
- Dergal, N.B.; Ghermi, M.; Imre, K.; Morar, A.; Acaroz, U.; Arslan-Acaroz, D.; Herman, V.; Ayad, A. Estimated Prevalence of Tuberculosis in Ruminants from Slaughterhouses in Constantine Province (Northeastern Algeria): A 10-Year Retrospective Survey (2011-2020). Life (Basel) 2023, 13. [Google Scholar] [CrossRef] [PubMed]
- Arnot, L.F.; Michel, A. Challenges for controlling bovine tuberculosis in South Africa. Onderstepoort J Vet Res 2020, 87, e1–e8. [Google Scholar] [CrossRef] [PubMed]
- Boko, C.K.; Zoclanclounon, A.R.; Adoligbe, C.M.; Dedehouanou, H.; M’Po, M.; Mantip, S.; Farougou, S. Molecular diagnosis of bovine tuberculosis on postmortem carcasses during routine meat inspection in Benin: GeneXpert(®) testing to improve diagnostic scheme. Veterinary world 2022, 15, 2506–2510. [Google Scholar] [CrossRef] [PubMed]
- Health, T.C.f.F.S.y.P.; Biologics, I.F.I.C.i.A.; UNIVERSITY, L.S.; OIE; USDA. Zoonotic Tuberculosis in Mammals, including Bovine and Caprine Tuberculosis. 2019. [Google Scholar]
- Escárcega, D.A.V.; Razo, C.A.P.; Ruíz, S.G.; Gallegos, S.L.S.; Suazo, F.M.; Alarcón, G.J.C. Analysis of Bovine Tuberculosis Transmission in Jalisco, Mexico through Whole-genome Sequencing. Journal of veterinary research 2020, 64, 51–61. [Google Scholar] [CrossRef]
- Rodrigues, D.L.; Amorim, E.A.; Ferreira, F.; Amaku, M.; Baquero, O.S.; de Hildebrand, E.G.F.J.H.; Dias, R.A.; Heinemann, M.B.; Telles, E.O.; Gonçalves, V.S.P.; et al. Apparent prevalence and risk factors for bovine tuberculosis in the state of Paraná, Brazil: an assessment after 18 years since the beginning of the Brazilian program. Tropical animal health and production 2022, 54, 360. [Google Scholar] [CrossRef]
- Barandiaran, S.; Martínez Vivot, M.; Pérez, A.M.; Cataldi, A.A.; Zumárraga, M.J. Bovine tuberculosis in domestic pigs: Genotyping and distribution of isolates in Argentina. Research in veterinary science 2015, 103, 44–50. [Google Scholar] [CrossRef]
- Max, V.; Paredes, L.; Rivera, A.; Ternicier, C. National control and eradication program of bovine tuberculosis in Chile. Veterinary microbiology 2011, 151, 188–191. [Google Scholar] [CrossRef]
- Picasso-Risso, C.; Gil, A.; Nunez, A.; Suanes, A.; Macchi, V.; Salaberry, X.; Alvarez, J.; Perez, A. Diagnostic interaction between bovine tuberculosis (bTB) and Johne’s disease in bTB highly prevalent dairy farms of Uruguay. Veterinary and animal science 2019, 7, 100052. [Google Scholar] [CrossRef] [PubMed]
- Gallo, C.; Véjar, L.; Galindo, F.; Huertas, S.M.; Tadich, T. Animal welfare in Latin America: Trends and characteristics of scientific publications. Frontiers in veterinary science 2022, 9, 1030454. [Google Scholar] [CrossRef] [PubMed]
- Thoen, C.O.; Kaplan, B.; Thoen, T.C.; Gilsdorf, M.J.; Shere, J.A. Zoonotic tuberculosis. A comprehensive ONE HEALTH approach. Medicina 2016, 76, 159–165. [Google Scholar] [PubMed]
- Brebu, M.; Simion, V.E.; Andronie, V.; Jaimes-Mogollon, A.L.; Beleno-Saenz, K.J.; Ionescu, F.; Welearegay, T.G.; Suschinel, R.; de Lema, J.B.; Ionescu, R. Putative volatile biomarkers of bovine tuberculosis infection in breath, skin and feces of cattle. Mol Cell Biochem 1007, 10.1007/s11010-023-04676-5. [Google Scholar] [CrossRef] [PubMed]
- Sierra, A.; Camelo, D.; Lota, C.; Arenas, N.E.; Soto, C.Y. Specific identification of Mycobacterium bovis by Loop-Mediated Isothermal Amplification (LAMP) targeting the Region of Difference 12 (RD12) of the M. tuberculosis complex. MethodsX 2023, 10, 102223. [Google Scholar] [CrossRef] [PubMed]
- de Jesús Beleño-Sáenz, K.; Cáceres-Tarazona, J.M.; Nol, P.; Jaimes-Mogollón, A.L.; Gualdrón-Guerrero, O.E.; Durán-Acevedo, C.M.; Barasona, J.A.; Vicente, J.; Torres, M.J.; Welearegay, T.G. , et al. Non-Invasive Method to Detect Infection with Mycobacterium tuberculosis Complex in Wild Boar by Measurement of Volatile Organic Compounds Obtained from Feces with an Electronic Nose System. Sensors (Basel, Switzerland) 2021, 21. [Google Scholar] [CrossRef] [PubMed]
- Bolaños, C.A.D.; Franco, M.M.J.; Souza Filho, A.F.; Ikuta, C.Y.; Burbano-Rosero, E.M.; Ferreira Neto, J.S.; Heinemann, M.B.; Motta, R.G.; Paula, C.L.; Morais, A.B.C.; et al. Nontuberculous mycobacteria in milk from positive cows in the intradermal comparative cervical tuberculin test: implications for human tuberculosis infections. Revista do Instituto de Medicina Tropical de Sao Paulo 2018, 60, e6. [Google Scholar] [CrossRef]
- Romero, R.E.; Garzón, D.L.; Mejía, G.A.; Monroy, W.; Patarroyo, M.E.; Murillo, L.A. Identification of Mycobacterium bovis in bovine clinical samples by PCR species-specific primers. Canadian journal of veterinary research = Revue canadienne de recherche veterinaire 1999, 63, 101–106. [Google Scholar]
- Rodríguez, J.G.; Fissanoti, J.C.; Del Portillo, P.; Patarroyo, M.E.; Romano, M.I.; Cataldi, A. Amplification of a 500-base-pair fragment from cultured isolates of Mycobacterium bovis. Journal of clinical microbiology 1999, 37, 2330–2332. [Google Scholar] [CrossRef]
- Bonilla-Aldana, D.K.; Jimenez-Diaz, S.D.; Barboza, J.J.; Rodriguez-Morales, A.J. Mapping the Spatiotemporal Distribution of Bovine Rabies in Colombia, 2005-2019. Tropical medicine and infectious disease 2022, 7. [Google Scholar] [CrossRef]
- Idarraga-Bedoya, S.E.; Álvarez-Chica, J.; Bonilla-Aldana, D.K.; Moore, D.P.; Rodríguez-Morales, A.J. Seroprevalence of Neospora caninum infection in cattle from Pereira, Colombia (⋆). Veterinary parasitology, regional studies and reports 2020, 22, 100469. [Google Scholar] [CrossRef] [PubMed]
- Instituto Colombiano Agropecuario, I.C.A. Censo Pecuario Nacional . Instituto Colombiano Agropecuario ICA 2019. [Google Scholar]
- Barros, M.L.; Barddal, J.E.I.; Santos, J.C.Q.; Negreiros, R.L.; Rosa, B.M.; Teixeira, R.C.; Prada, J.R.R.; Gonçalves, V.S.P.; Ferreira Neto, J.S. Retrospective benefit-cost analysis of bovine brucellosis control in the state of Mato Grosso, Brazil. Prev Vet Med 2023, 218, 105992. [Google Scholar] [CrossRef] [PubMed]
- Bonilla-Aldana, D.K.; Trejos-Mendoza, A.E.; Pérez-Vargas, S.; Rivera-Casas, E.; Muñoz-Lara, F.; Zambrano, L.I.; Arteaga-Livias, K.; Ulloque-Badaracco, J.R.; Alarcon-Braga, E.A.; Hernandez-Bustamante, E.A.; et al. A systematic review and meta-analysis of bovine brucellosis seroprevalence in Latin America and the Caribbean. New Microbes and New Infections 2023. [Google Scholar] [CrossRef] [PubMed]
- Nugent, G.; Gortazar, C.; Knowles, G. The epidemiology of Mycobacterium bovis in wild deer and feral pigs and their roles in the establishment and spread of bovine tuberculosis in New Zealand wildlife. New Zealand veterinary journal 2015, 63 Suppl 1, 54–67. [Google Scholar] [CrossRef] [PubMed]
- Devi, K.R.; Lee, L.J.; Yan, L.T.; Syafinaz, A.N.; Rosnah, I.; Chin, V.K. Occupational exposure and challenges in tackling M. bovis at human-animal interface: a narrative review. International archives of occupational and environmental health 2021, 94, 1147–1171. [Google Scholar] [CrossRef]
- Buddle, B.M.; Vordermeier, H.M.; Chambers, M.A.; de Klerk-Lorist, L.M. Efficacy and Safety of BCG Vaccine for Control of Tuberculosis in Domestic Livestock and Wildlife. Frontiers in veterinary science 2018, 5, 259. [Google Scholar] [CrossRef]
- Cardenas, N.C.; Pozo, P.; Lopes, F.P.N.; Grisi-Filho, J.H.H.; Alvarez, J. Use of Network Analysis and Spread Models to Target Control Actions for Bovine Tuberculosis in a State from Brazil. Microorganisms 2021, 9. [Google Scholar] [CrossRef]
- Hardstaff, J.L.; Häsler, B.; Rushton, J.R. Livestock trade networks for guiding animal health surveillance. BMC veterinary research 2015, 11, 82. [Google Scholar] [CrossRef]
- Mekonnen, G.A.; Ameni, G.; Wood, J.L.N.; Berg, S.; Conlan, A.J.K. Network analysis of dairy cattle movement and associations with bovine tuberculosis spread and control in emerging dairy belts of Ethiopia. BMC veterinary research 2019, 15, 262. [Google Scholar] [CrossRef]
- Gormley, E.; Corner, L.A. Control strategies for wildlife tuberculosis in Ireland. Transboundary and emerging diseases 2013, 60 Suppl 1, 128–135. [Google Scholar] [CrossRef] [PubMed]
- Moennig, V.; Becher, P. Control of Bovine Viral Diarrhea. Pathogens (Basel, Switzerland) 2018, 7. [Google Scholar] [CrossRef] [PubMed]
- Conlan, A.J.K.; Vordermeier, M.; de Jong, M.C.; Wood, J.L. The intractable challenge of evaluating cattle vaccination as a control for bovine Tuberculosis. eLife 2018, 7. [Google Scholar] [CrossRef] [PubMed]
- Franc, K.A.; Krecek, R.C.; Häsler, B.N.; Arenas-Gamboa, A.M. Brucellosis remains a neglected disease in the developing world: a call for interdisciplinary action. BMC public health 2018, 18, 125. [Google Scholar] [CrossRef] [PubMed]
- Aggarwal, D.; Ramachandran, A. One Health Approach to Address Zoonotic Diseases. Indian journal of community medicine: official publication of Indian Association of Preventive & Social Medicine 2020, 45, S6–s8. [Google Scholar] [CrossRef]
- Kaneene, J.B.; Miller, R.; Steele, J.H.; Thoen, C.O. Preventing and controlling zoonotic tuberculosis: a One Health approach. Veterinaria italiana 2014, 50, 7–22. [Google Scholar] [CrossRef] [PubMed]
- Carpenter, A.; Waltenburg, M.A.; Hall, A.; Kile, J.; Killerby, M.; Knust, B.; Negron, M.; Nichols, M.; Wallace, R.M.; Behravesh, C.B.; et al. Vaccine Preventable Zoonotic Diseases: Challenges and Opportunities for Public Health Progress. Vaccines 2022, 10. [Google Scholar] [CrossRef]

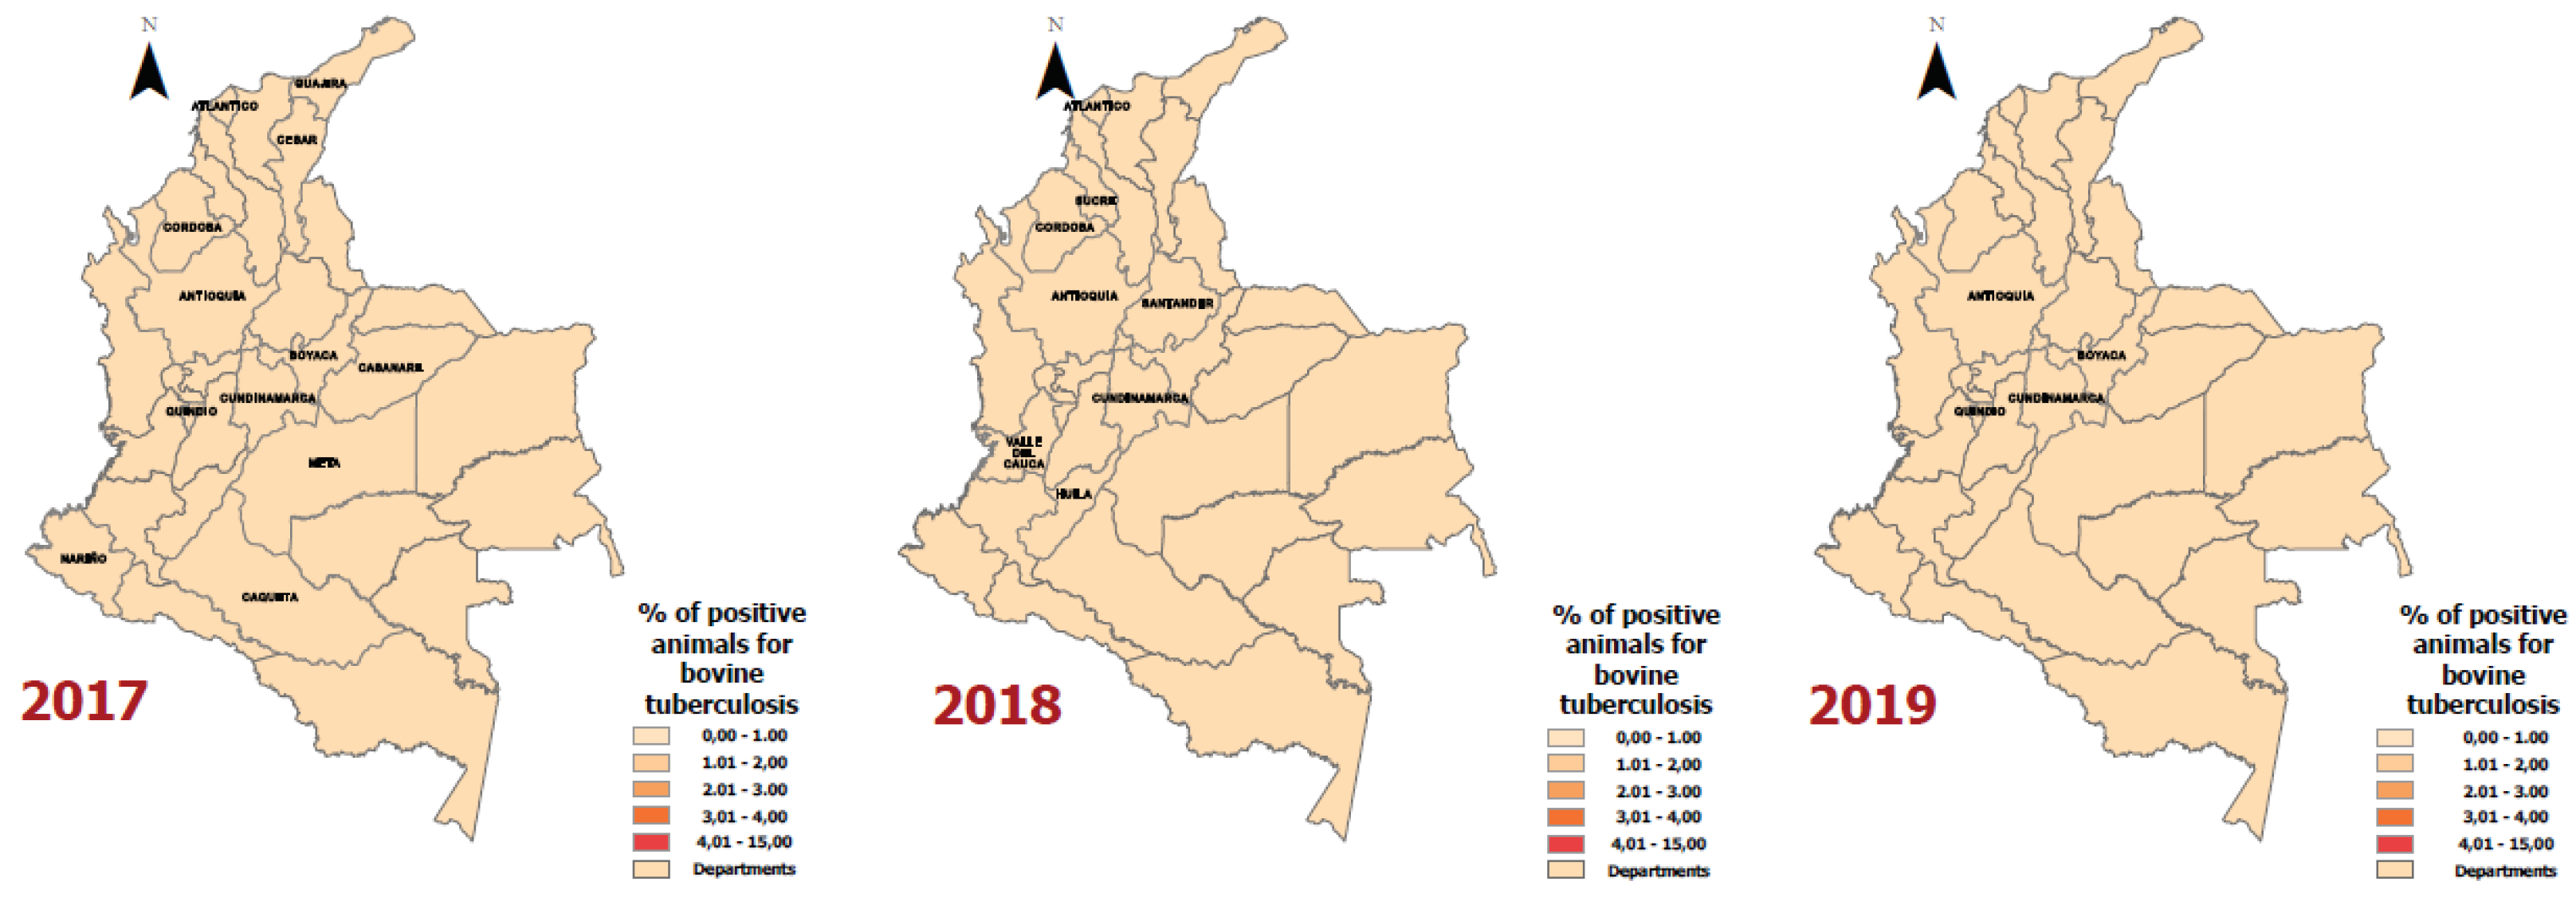
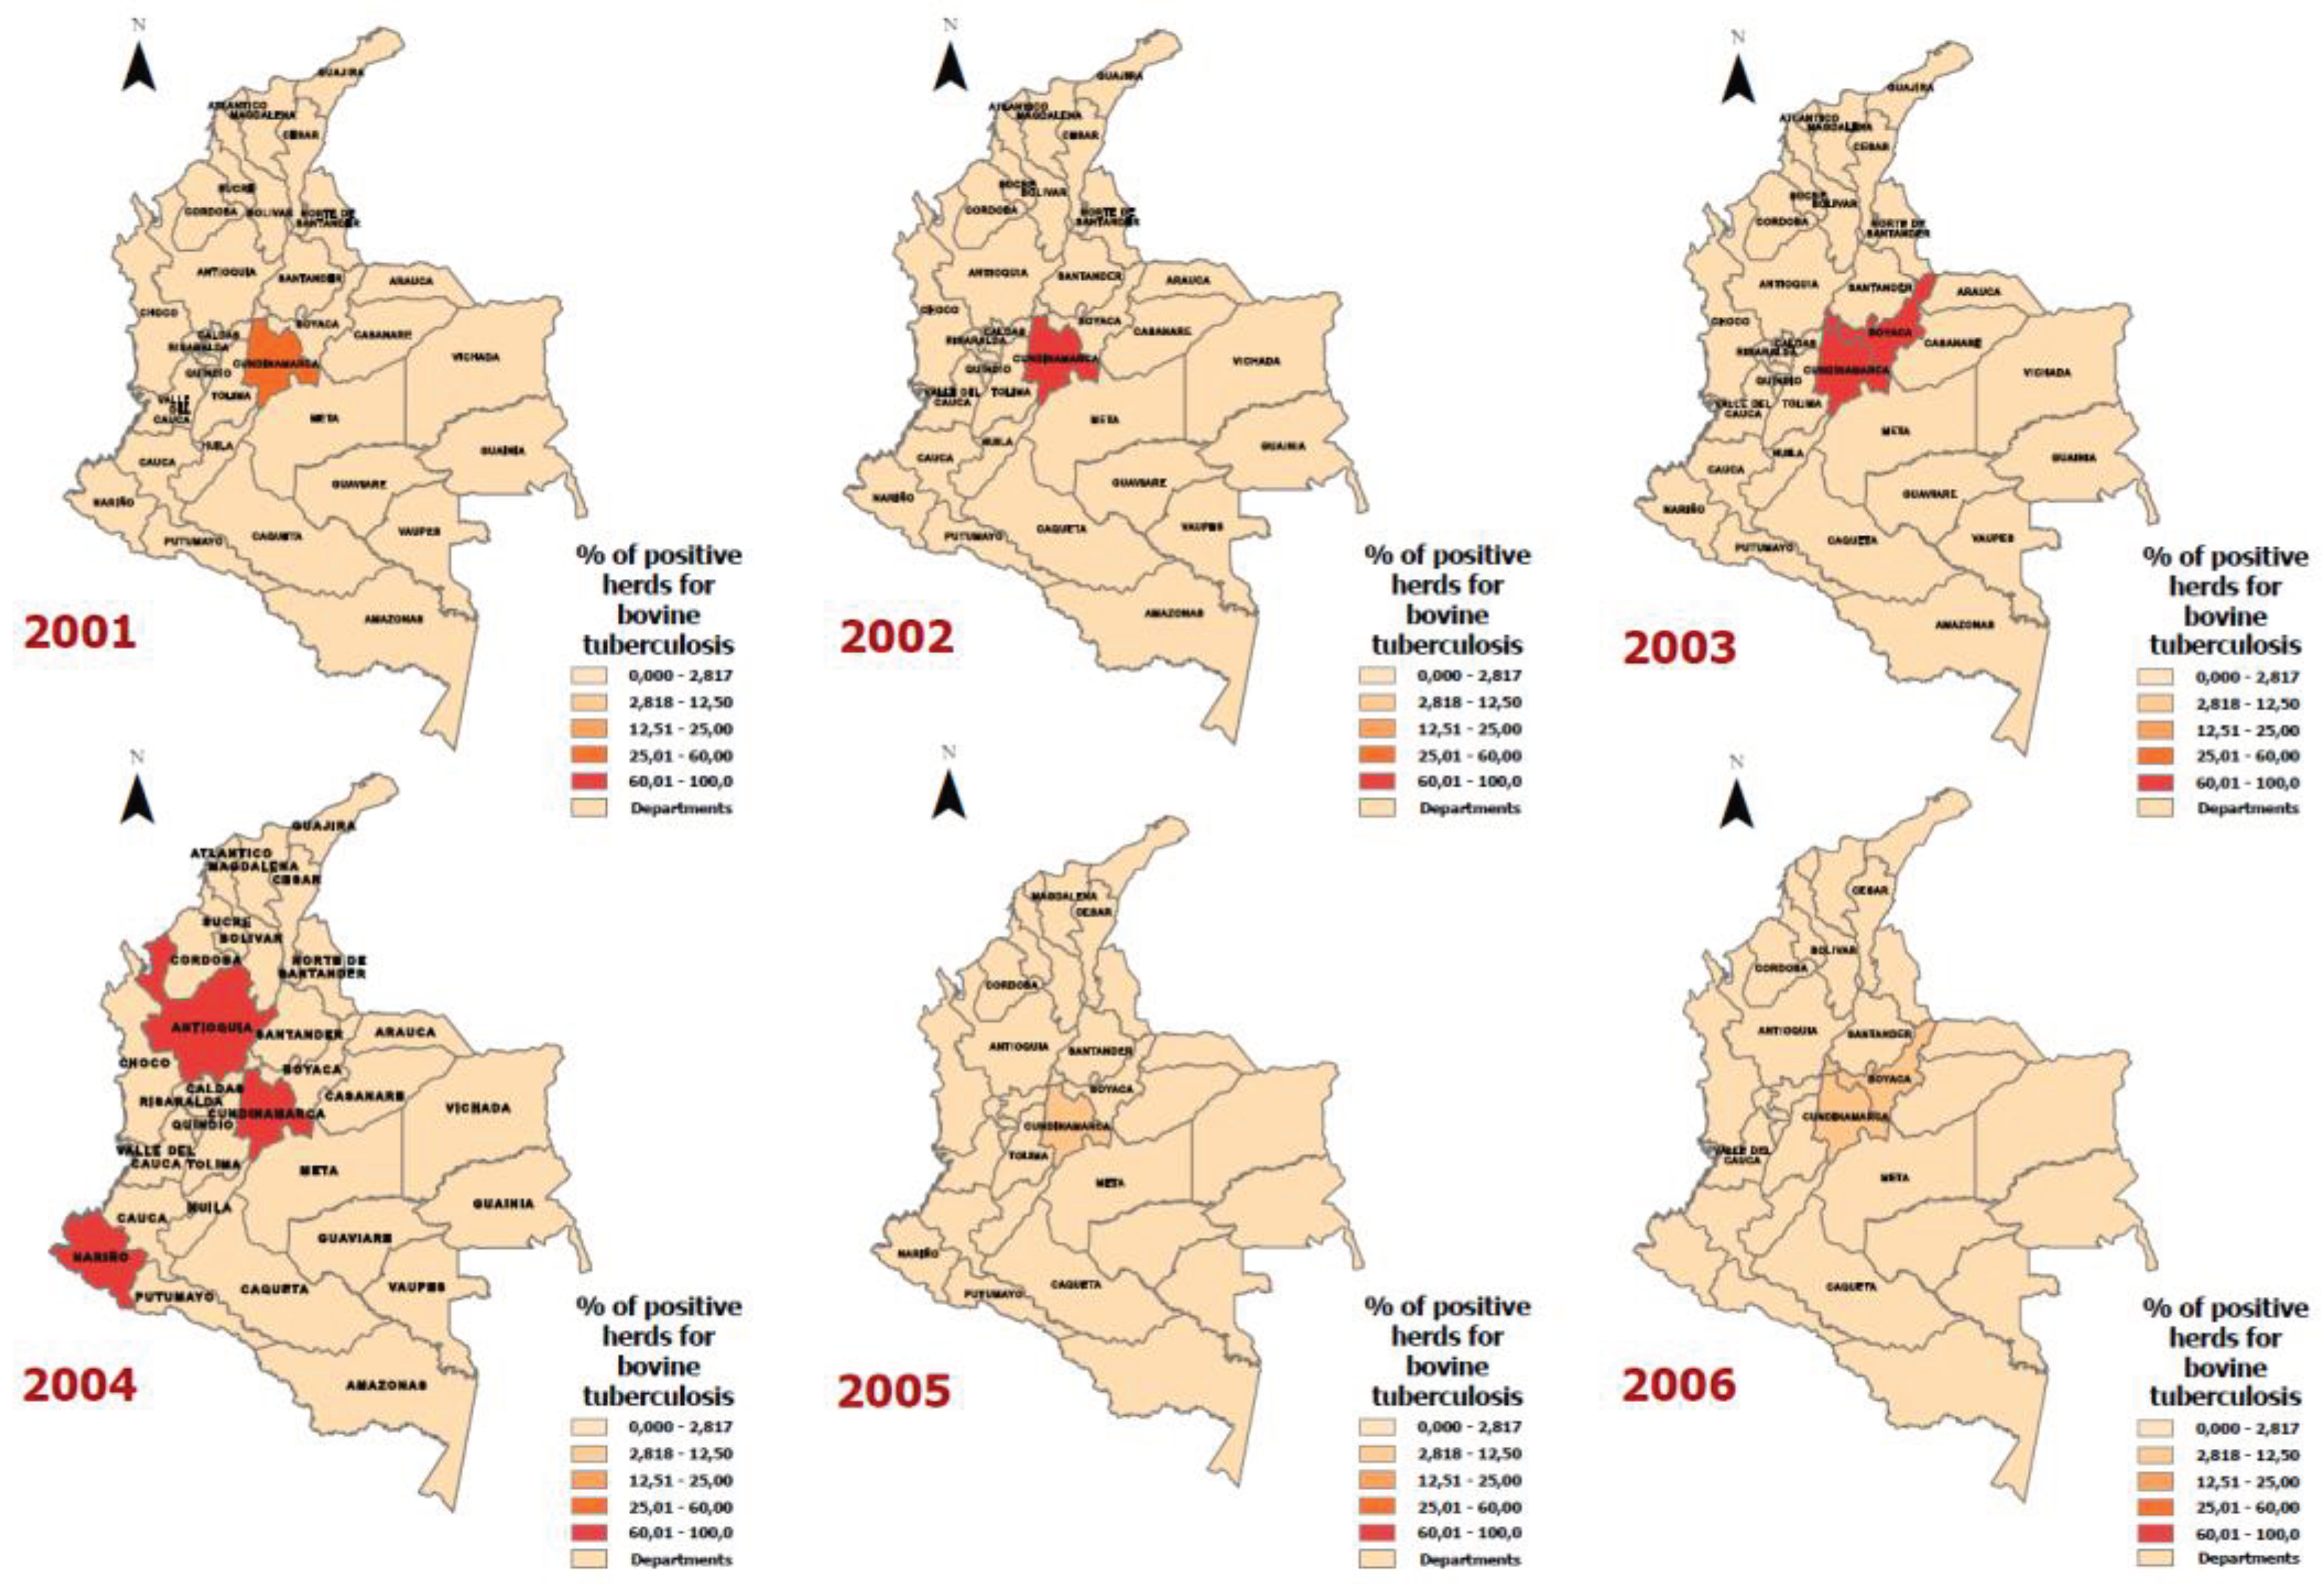
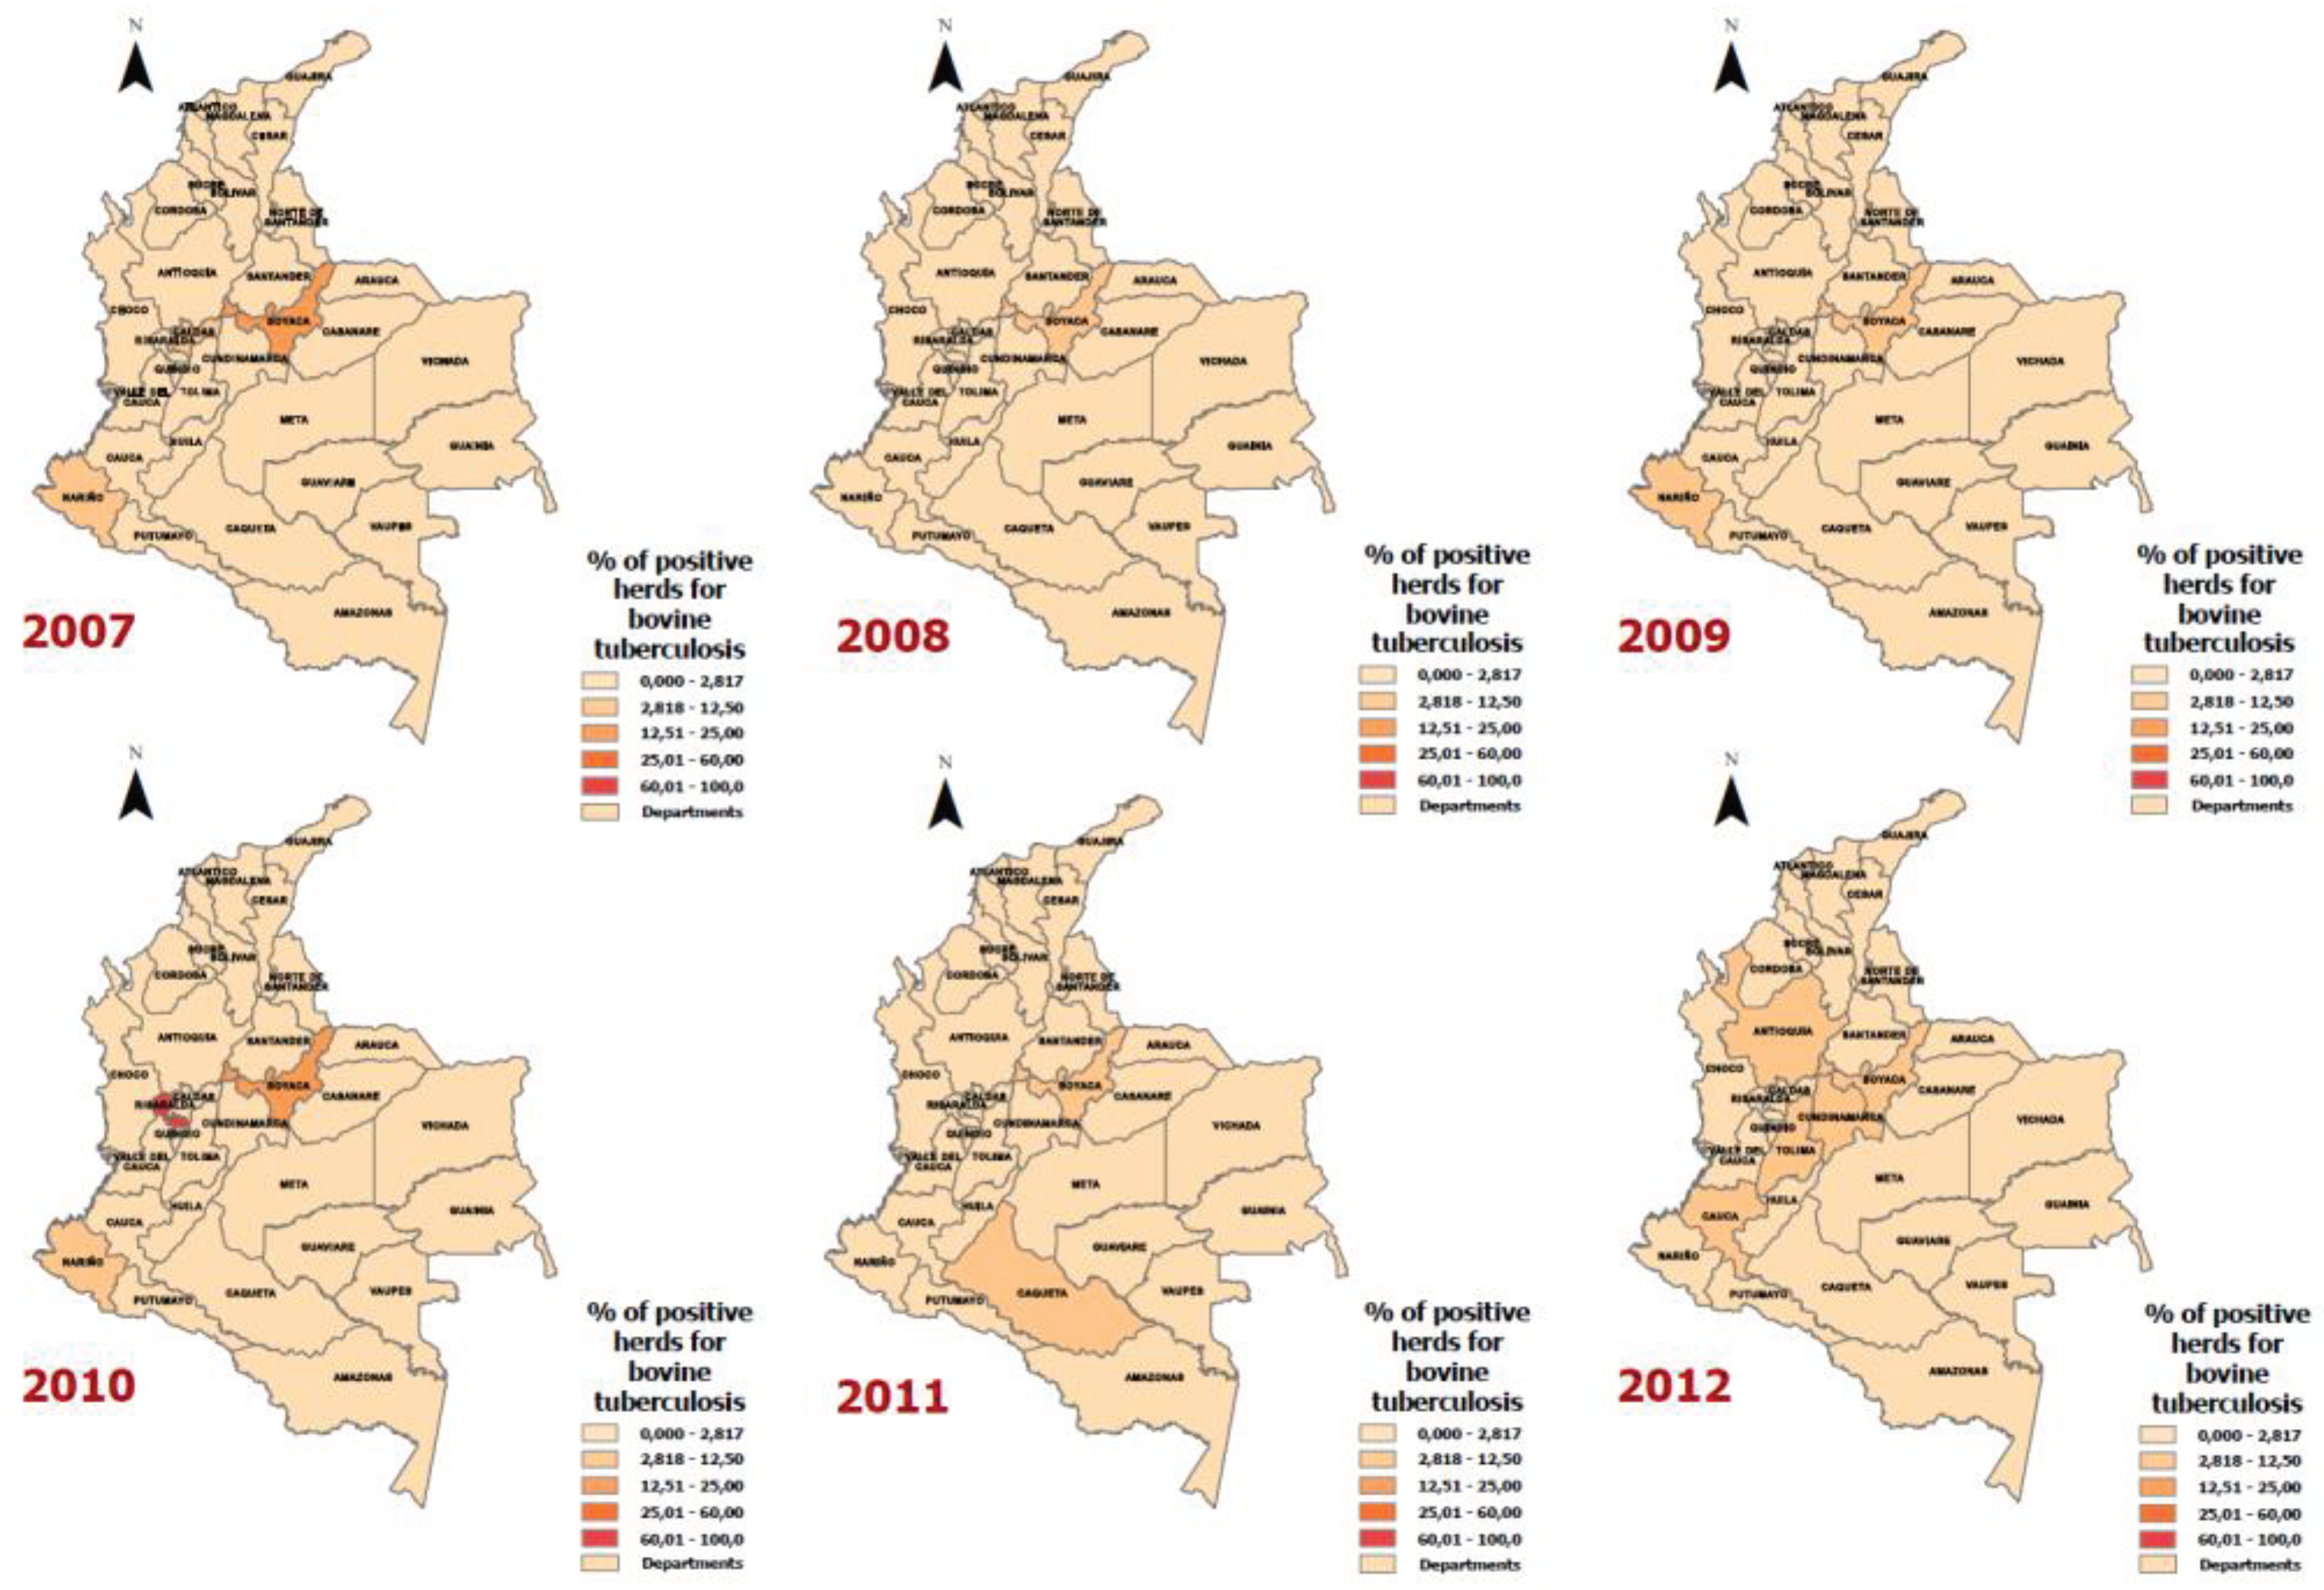
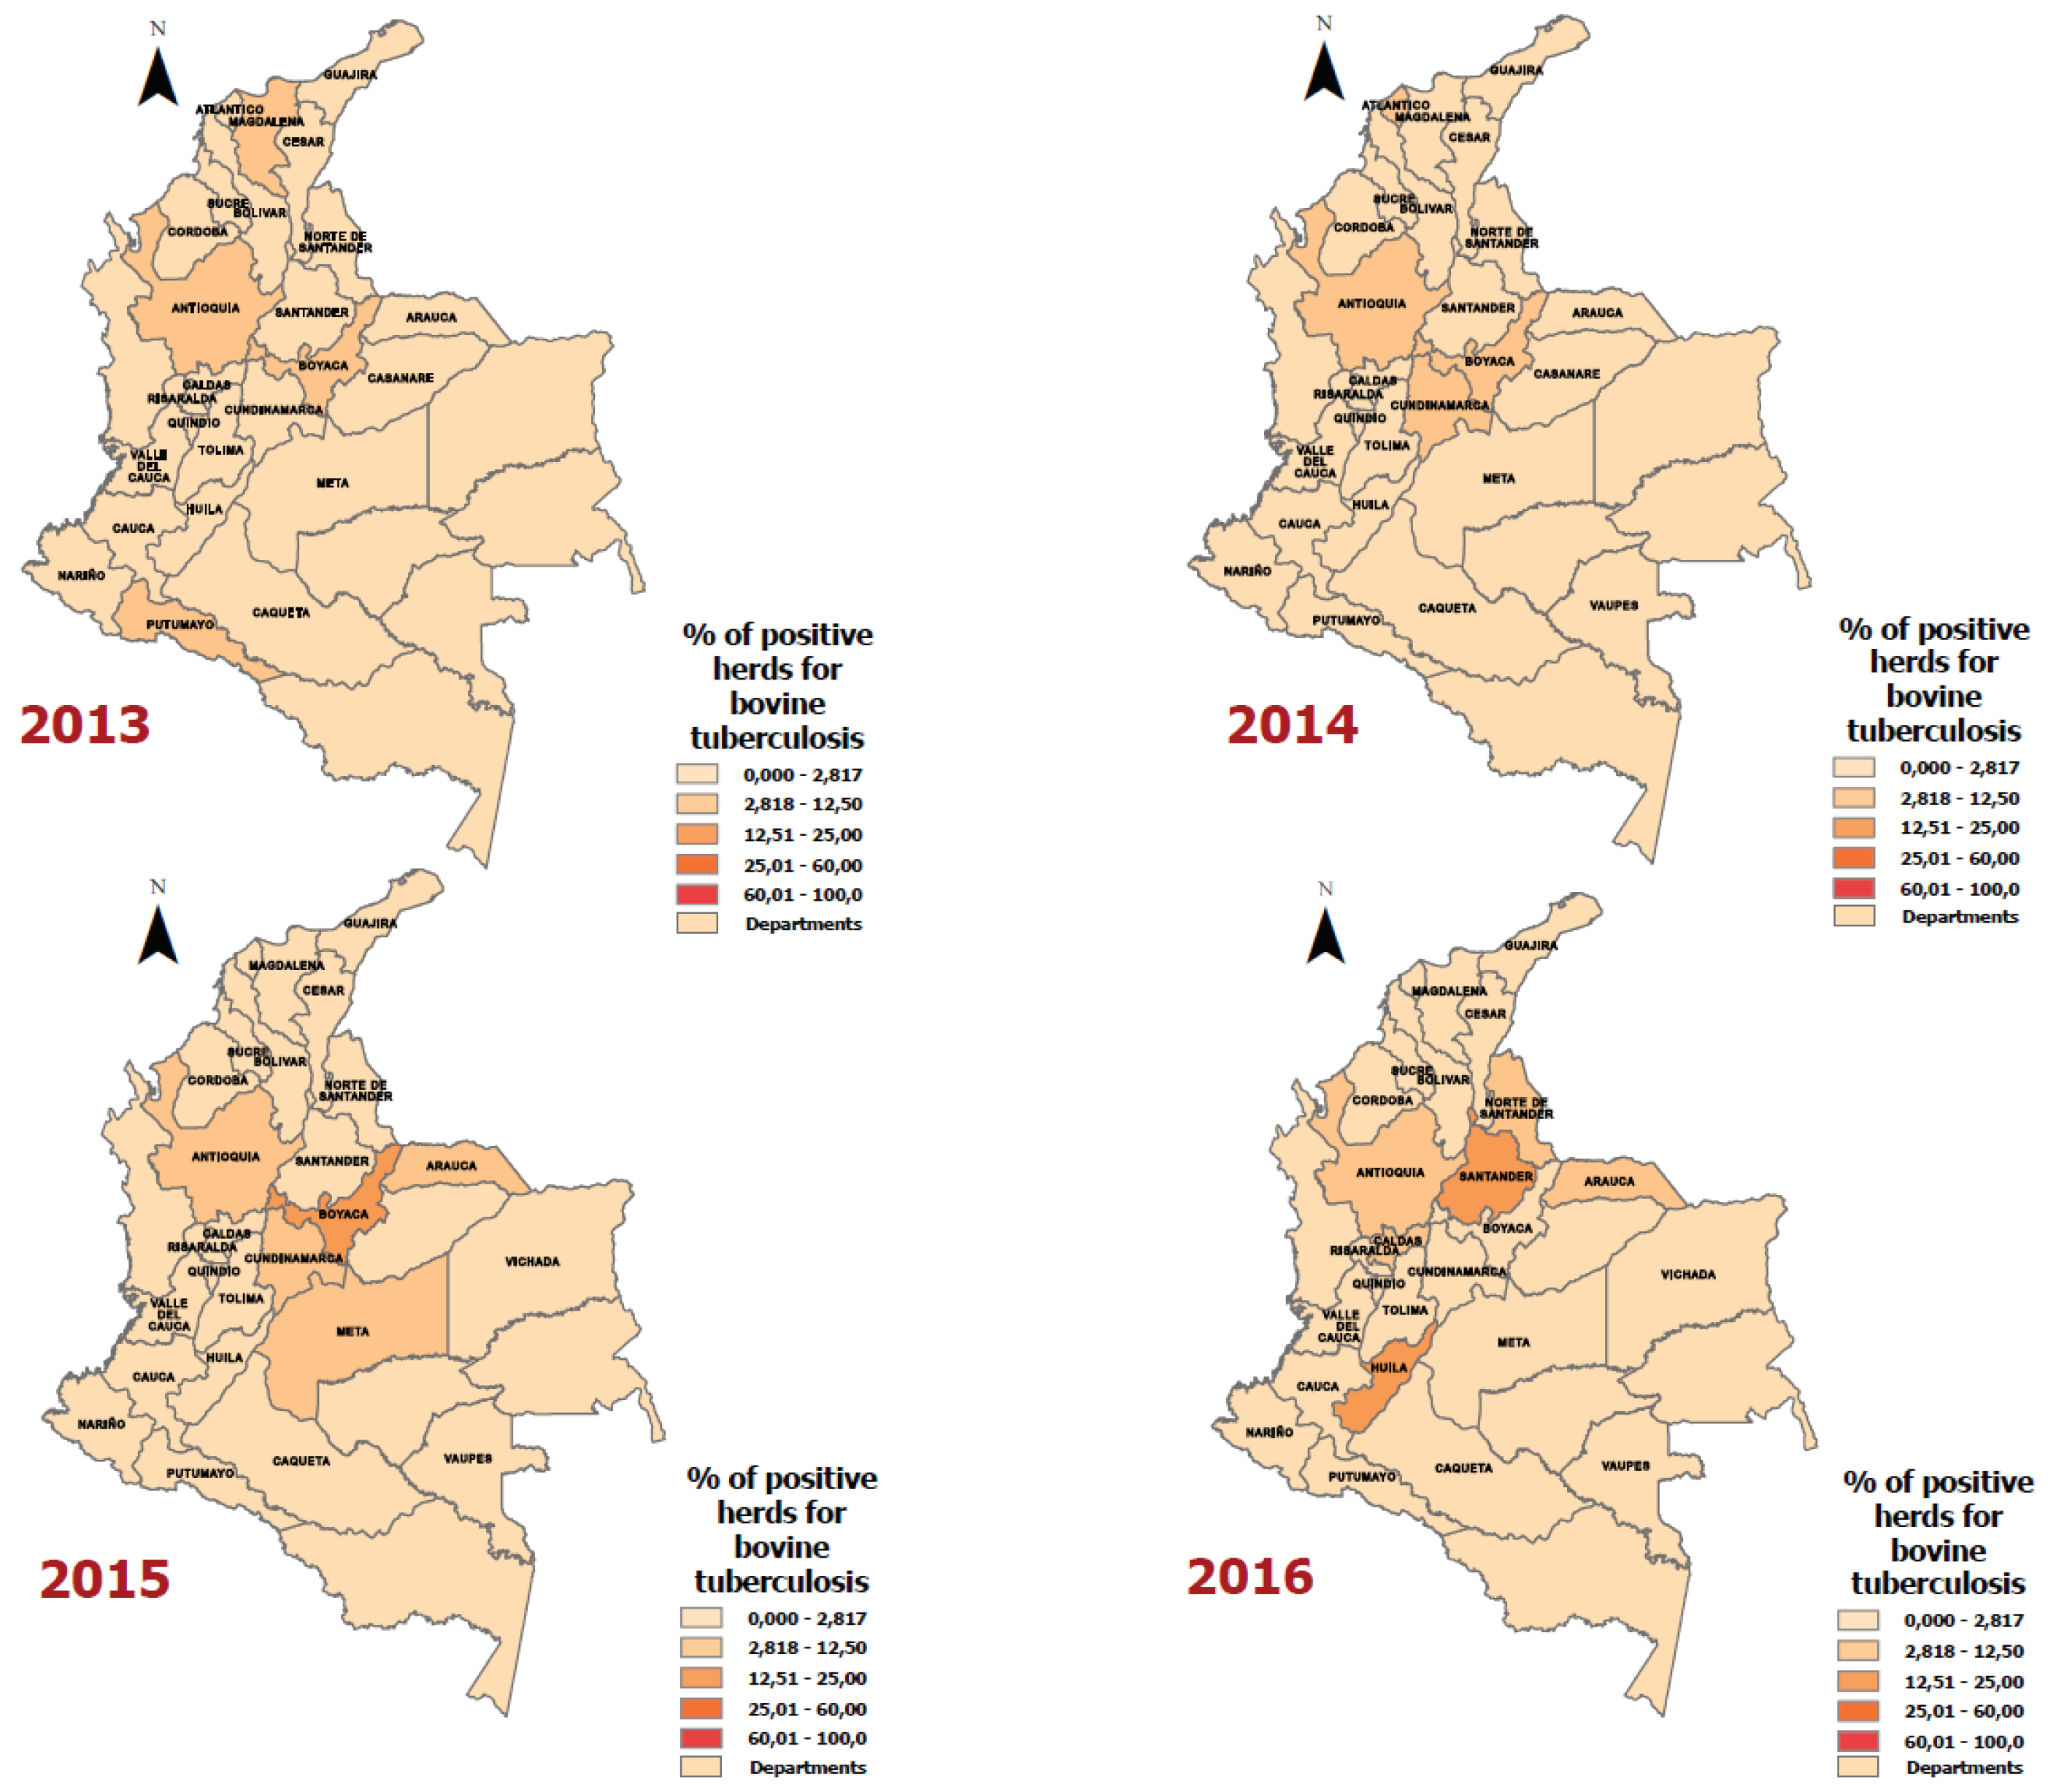
| Year | Department | Positive Animals for Bovine Tuberculosis | Number of Animals according to the Bovine Census | Rate (Cases of bovine tuberculosis per 100,000 animals) |
|---|---|---|---|---|
| 2016 | Putumayo | 45 | 197,611 | 22.8 |
| 2016 | Caldas | 60 | 370,345 | 16.2 |
| 2016 | Huila | 53 | 415,246 | 12.8 |
| 2016 | Cundinamarca | 138 | 1,256,535 | 11.0 |
| 2016 | Antioquia | 221 | 2,632,125 | 8.4 |
| 2016 | Santander | 55 | 1,412,313 | 3.9 |
| 2016 | Norte de Santander | 3 | 389,694 | 0.8 |
| 2016 | Arauca | 3 | 1,048,543 | 0.3 |
Disclaimer/Publisher’s Note: The statements, opinions and data contained in all publications are solely those of the individual author(s) and contributor(s) and not of MDPI and/or the editor(s). MDPI and/or the editor(s) disclaim responsibility for any injury to people or property resulting from any ideas, methods, instructions or products referred to in the content. |
© 2024 by the authors. Licensee MDPI, Basel, Switzerland. This article is an open access article distributed under the terms and conditions of the Creative Commons Attribution (CC BY) license (http://creativecommons.org/licenses/by/4.0/).


