Submitted:
02 March 2024
Posted:
05 March 2024
You are already at the latest version
Abstract
Keywords:
1. Introduction
2. Results
2.1. Phenotypic Data on Common Rust Resistance in RILs
2.2. QTL Mapping of Common Rust Resistance in Three RIL Populations
2.3. SNP Characterization, and Population Structure
2.4. Genome-Wide Association Analysis of Three RIL Subpopulations
2.5. Analysis of Consistent Loci Identified by GWAS and QTL Mapping
3. Discussion
4. Conclusions
5. Materials and Methods
5.1. Experimental Materials and Field Experiment Design
5.2. Common Rust Disease Evaluation
5.3. Phenotypic Data Analysis
5.4. DNA Extraction and Genotyping-by-Sequencing (GBS)
5.5. QTL Mapping
5.6. Structure Analysis
5.7. Haplotype Analysis
5.8. Genome Wide Association Study
5.9. Identification and Functional Annotation of Candidate Genes
5.10. Candidate Gene Expression Analysis
Supplementary Materials
Author Contributions
Funding
Data Availability Statement
Acknowledgments
Conflicts of Interest
References
- Hooker, A.L. 7 - Corn and Sorghum Rusts. In Diseases, Distribution, Epidemiology, and Control; Roelfs, A.P., Bushnell, W.R., Eds.; Academic Press, 1985, pp. 207-236, ISBN 978-0-12-148402-6.
- Pataky, J.K.; Tracy, W.F. Widespread Occurrence of Common Rust, Caused by Puccinia sorghi, on Rp-Resistant Sweet Corn in the Midwestern United States. Plant Dis. 1999, 83, 1177. [Google Scholar] [CrossRef]
- Dey, U.K.; Harlapur, S.I.; Dhutraj, D.N.; Suryawanshi, A.P.; Badgujar, S.L.; Jagtap, G.P.; Kuldhar, D.P. Spatiotemporal yield loss assessment in corn due to common rust caused by Puccinia sorghi Schw. African Journal of Agricultural Research 2012, 7, 5265–5269. [Google Scholar] [CrossRef]
- Dey, U.K.; Harlapur, S.I.; Dhutraj, D.N.; Suryawanshi, A.P.; Bhattacharjee, R. Integrated disease management strategy of common rust of maize incited by Puccinia sorghi Schw. African Journal of Microbiology Research 2015, 9, 1345–1351. [Google Scholar] [CrossRef]
- Kibe, M.; Nyaga, C.; Nair, S.K.; Beyene, Y.; Das, B.; M, S.L.; Bright, J.M.; Makumbi, D.; Kinyua, J.; Olsen, M.S.; et al. Combination of Linkage Mapping, GWAS, and GP to Dissect the Genetic Basis of Common Rust Resistance in Tropical Maize Germplasm. Int. J. Mol. Sci. 2020, 21. [Google Scholar] [CrossRef] [PubMed]
- Delaney, D.E.; Webb, C.A.; Hulbert, S.H. A Novel Rust Resistance Gene in Maize Showing Overdominance. Molecular Plant-Microbe Interactions® 1998, 11, 242–245. [Google Scholar] [CrossRef]
- Kerns, M.R.; Dudley, J.W.; Rufener, G.K. QTL for resistance to common rust and smut in maize. Maydica 1999, 44, 37–45. [Google Scholar]
- Wisser, R.J.; Balint-Kurti, P.J.; Nelson, R.J. The genetic architecture of disease resistance in maize: a synthesis of published studies. Phytopathology 2006, 96, 120–129. [Google Scholar] [CrossRef] [PubMed]
- Zheng, H.; Chen, J.; Mu, C.; Makumbi, D.; Xu, Y.; Mahuku, G. Combined linkage and association mapping reveal QTL for host plant resistance to common rust (Puccinia sorghi) in tropical maize. Bmc Plant Biol. 2018, 18, 310. [Google Scholar] [CrossRef]
- Lubberstedt, T.; Klein, D.; Melchinger, A.E. Comparative Quantitative Trait Loci Mapping of Partial Resistance to Puccinia sorghi Across Four Populations of European Flint Maize. Phytopathology 1998, 88, 1324–1329. [Google Scholar] [CrossRef]
- Brown, A.F.; Juvik, J.A.; Pataky, J.K. Quantitative Trait Loci in Sweet Corn Associated with Partial Resistance to Stewart's Wilt, Northern Corn Leaf Blight, and Common Rust. Phytopathology 2001, 91, 293–300. [Google Scholar] [CrossRef]
- Ren, J.; Li, Z.; Wu, P.; Zhang, A.; Liu, Y.; Hu, G.; Cao, S.; Qu, J.; Dhliwayo, T.; Zheng, H.; et al. Genetic Dissection of Quantitative Resistance to Common Rust (Puccinia sorghi) in Tropical Maize (Zea mays L.) by Combined Genome-Wide Association Study, Linkage Mapping, and Genomic Prediction. Front. Plant Sci. 2021, 12, 692205. [Google Scholar] [CrossRef] [PubMed]
- Song, J.; Xu, D.; Dong, Y.; Li, F.; Bian, Y.; Li, L.; Luo, X.; Fei, S.; Li, L.; Zhao, C.; et al. Fine mapping and characterization of a major QTL for grain weight on wheat chromosome arm 5DL. Theor. Appl. Genet. 2022, 135, 3237–3246. [Google Scholar] [CrossRef] [PubMed]
- Liu, S.; Wang, X.; Zhang, Y.; Jin, Y.; Xia, Z.; Xiang, M.; Huang, S.; Qiao, L.; Zheng, W.; Zeng, Q.; et al. Enhanced stripe rust resistance obtained by combining Yr30 with a widely dispersed, consistent QTL on chromosome arm 4BL. Theor. Appl. Genet. 2022, 135, 351–365. [Google Scholar] [CrossRef] [PubMed]
- Ma, P.; Li, H.; Liu, E.; He, K.; Song, Y.; Dong, C.; Wang, Z.; Zhang, X.; Zhou, Z.; Xu, Y.; et al. Evaluation and Identification of Resistance Lines and QTLs of Maize to Seedborne Fusarium verticillioides. Plant Dis. 2022, 106, 2066–2073. [Google Scholar] [CrossRef] [PubMed]
- Johnmark, O.; Indieka, S.; Liu, G.; Gowda, M.; Suresh, L.M.; Zhang, W.; Gao, X. Fighting Death for Living: Recent Advances in Molecular and Genetic Mechanisms Underlying Maize Lethal Necrosis Disease Resistance. Viruses 2022, 14. [Google Scholar] [CrossRef] [PubMed]
- Warburton, M.L.; Jeffers, D.; Smith, J.S.; Scapim, C.; Uhdre, R.; Thrash, A.; Williams, W.P. Comparative Analysis of Multiple GWAS Results Identifies Metabolic Pathways Associated with Resistance to A. flavus Infection and Aflatoxin Accumulation in Maize. Toxins 2022, 14. [Google Scholar] [CrossRef] [PubMed]
- Galiano-Carneiro, A.L.; Kessel, B.; Presterl, T.; Miedaner, T. Intercontinental trials reveal stable QTL for Northern corn leaf blight resistance in Europe and in Brazil. Theor. Appl. Genet. 2021, 134, 63–79. [Google Scholar] [CrossRef] [PubMed]
- Shikha, K.; Shahi, J.P.; Vinayan, M.T.; Zaidi, P.H.; Singh, A.K.; Sinha, B. Genome-wide association mapping in maize: status and prospects. 3 Biotech 2021, 11, 244. [Google Scholar] [CrossRef] [PubMed]
- Schneider, H.M.; Lor, V.S.; Zhang, X.; Saengwilai, P.; Hanlon, M.T.; Klein, S.P.; Davis, J.L.; Borkar, A.N.; Depew, C.L.; Bennett, M.J.; et al. Transcription factor bHLH121 regulates root cortical aerenchyma formation in maize. Proc. Natl. Acad. Sci. U. S. A. 2023, 120, e2075299176. [Google Scholar] [CrossRef]
- Qian, F.; Jing, J.; Zhang, Z.; Chen, S.; Sang, Z.; Li, W. GWAS and Meta-QTL Analysis of Yield-Related Ear Traits in Maize. Plants 2023, 12. [Google Scholar] [CrossRef]
- Yang, W.; Liu, X.; Yu, S.; Liu, J.; Jiang, L.; Lu, X.; Liu, Y.; Zhang, J.; Li, X.; Zhang, S. The maize ATP-binding cassette (ABC) transporter ZmMRPA6 confers cold and salt stress tolerance in plants. Plant Cell Rep. 2023, 43, 13. [Google Scholar] [CrossRef] [PubMed]
- Zhang, K.; Xue, M.; Qin, F.; He, Y.; Zhou, Y. Natural polymorphisms in ZmIRX15A affect water-use efficiency by modulating stomatal density in maize. Plant Biotechnol. J. 2023, 21, 2560–2573. [Google Scholar] [CrossRef] [PubMed]
- Wang, W.; Guo, W.; Le L; Yu, J. ; Wu, Y.; Li, D.; Wang, Y.; Wang, H.; Lu, X.; Qiao, H.; et al. Integration of high-throughput phenotyping, GWAS, and predictive models reveals the genetic architecture of plant height in maize. Mol. Plant. 2023, 16, 354–373. [Google Scholar] [CrossRef]
- Okunlola, G.; Badu-Apraku, B.; Ariyo, O.; Agre, P.; Offernedo, Q.; Ayo-Vaughan, M. Genome-wide association studies of Striga resistance in extra-early maturing quality protein maize inbred lines. G3-Genes Genomes Genet. 2023, 13. [Google Scholar] [CrossRef]
- Zheng, Y.; Yuan, F.; Huang, Y.; Zhao, Y.; Jia, X.; Zhu, L.; Guo, J. Genome-wide association studies of grain quality traits in maize. Sci. Rep. 2021, 11, 9797. [Google Scholar] [CrossRef]
- Olukolu, B.A.; Tracy, W.F.; Wisser, R.; De Vries, B.; Balint-Kurti, P.J. A Genome-Wide Association Study for Partial Resistance to Maize Common Rust. Phytopathology 2016, 106, 745–751. [Google Scholar] [CrossRef]
- Yan, J.; Warburton, M.L.; Crouch, J.H. Association Mapping for Enhancing Maize (Zea mays L.) Genetic Improvement. Crop Sci. 2011, 51, 433–449. [Google Scholar] [CrossRef]
- Cao, S.; Loladze, A.; Yuan, Y.; Wu, Y.; Zhang, A.; Chen, J.; Huestis, G.; Cao, J.; Chaikam, V.; Olsen, M.; et al. Genome-Wide Analysis of Tar Spot Complex Resistance in Maize Using Genotyping-by-Sequencing SNPs and Whole-Genome Prediction. Plant Genome 2017, 10. [Google Scholar] [CrossRef]
- Tian, F.; Bradbury, P.J.; Brown, P.J.; Hung, H.; Sun, Q.; Flint-Garcia, S.; Rocheford, T.R.; Mcmullen, M.D.; Holland, J.B.; Buckler, E.S. Genome-wide association study of leaf architecture in the maize nested association mapping population. Nat. Genet. 2011, 43, 159–162. [Google Scholar] [CrossRef]
- Kump, K.L.; Bradbury, P.J.; Wisser, R.J.; Buckler, E.S.; Belcher, A.R.; Oropeza-Rosas, M.A.; Zwonitzer, J.C.; Kresovich, S.; Mcmullen, M.D.; Ware, D.; et al. Genome-wide association study of quantitative resistance to southern leaf blight in the maize nested association mapping population. Nat. Genet. 2011, 43, 163–168. [Google Scholar] [CrossRef]
- Zhang, N.; Gibon, Y.; Wallace, J.G.; Lepak, N.; Li, P.; Dedow, L.; Chen, C.; So, Y.S.; Kremling, K.; Bradbury, P.J.; et al. Genome-wide association of carbon and nitrogen metabolism in the maize nested association mapping population. Plant Physiol. 2015, 168, 575–583. [Google Scholar] [CrossRef] [PubMed]
- Wallace, J.G.; Zhang, X.; Beyene, Y.; Semagn, K.; Olsen, M.; Prasanna, B.M.; Buckler, E.S. Genome-wide Association for Plant Height and Flowering Time across 15 Tropical Maize Populations under Managed Drought Stress and Well-Watered Conditions in Sub-Saharan Africa. Crop Sci. 2016, 56, 2365–2378. [Google Scholar] [CrossRef]
- Kump, K.L.; Bradbury, P.J.; Wisser, R.J.; Buckler, E.S.; Belcher, A.R.; Oropeza-Rosas, M.A.; Zwonitzer, J.C.; Kresovich, S.; Mcmullen, M.D.; Ware, D.; et al. Genome-wide association study of quantitative resistance to southern leaf blight in the maize nested association mapping population. Nat. Genet. 2011, 43, 163–168. [Google Scholar] [CrossRef]
- Jiang, F.; Liu, L.; Li, Z.; Bi, Y.; Yin, X.; Guo, R.; Wang, J.; Zhang, Y.; Shaw, R.K.; Fan, X. Identification of Candidate QTLs and Genes for Ear Diameter by Multi-Parent Population in Maize. Genes 2023, 14. [Google Scholar] [CrossRef]
- Walley, J.W.; Sartor, R.C.; Shen, Z.; Schmitz, R.J.; Wu, K.J.; Urich, M.A.; Nery, J.R.; Smith, L.G.; Schnable, J.C.; Ecker, J.R.; et al. Integration of omic networks in a developmental atlas of maize. Science 2016, 353, 814–818. [Google Scholar] [CrossRef]
- Krattinger, S.G.; Kang, J.; Braunlich, S.; Boni, R.; Chauhan, H.; Selter, L.L.; Robinson, M.D.; Schmid, M.W.; Wiederhold, E.; Hensel, G.; et al. Abscisic acid is a substrate of the ABC transporter encoded by the durable wheat disease resistance gene Lr34. New Phytol. 2019, 223, 853–866. [Google Scholar] [CrossRef]
- Zhang, G.; Wang, C.; Ren, X.; Li, Z.; Liu, C.; Qiao, X.; Shen, S.; Zhang, F.; Wan, F.; Liu, B.; et al. Inhibition of invasive plant Mikania micrantha rapid growth by host-specific rust (Puccinia spegazzinii). Plant Physiologyplant Physiology 2023, 192, 1204–1220. [Google Scholar] [CrossRef] [PubMed]
- Yin, C.; Park, J.J.; Gang, D.R.; Hulbert, S.H. Characterization of a tryptophan 2-monooxygenase gene from Puccinia graminis f. sp. tritici involved in auxin biosynthesis and rust pathogenicity. Mol. Plant. Microbe. Interact. 2014, 27, 227–235. [Google Scholar] [CrossRef] [PubMed]
- Ali, S.; Rizwan, M.; Arif, M.S.; Ahmad, R.; Hasanuzzaman, M.; Ali, B.; Hussain, A. Approaches in Enhancing Thermotolerance in Plants: An Updated Review. J. Plant Growth Regul. 2020, 39, 456–480. [Google Scholar] [CrossRef]
- Ilgenfritz, H.; Bouyer, D.; Schnittger, A.; Mathur, J.; Kirik, V.; Schwab, B.; Chua, N.H.; Jurgens, G.; Hulskamp, M. The Arabidopsis STICHEL gene is a regulator of trichome branch number and encodes a novel protein. Plant Physiol. 2003, 131, 643–655. [Google Scholar] [CrossRef]
- Xi, A.; Yang, X.; Deng, M.; Chen, Y.; Shao, J.; Zhao, J.; An, L. Isolation and identification of two new alleles of STICHEL in Arabidopsis. Biochem. Biophys. Res. Commun. 2018, 499, 605–610. [Google Scholar] [CrossRef] [PubMed]
- Kong, D.; Pan, X.; Jing, Y.; Zhao, Y.; Duan, Y.; Yang, J.; Wang, B.; Liu, Y.; Shen, R.; Cao, Y.; et al. ZmSPL10/14/26 are required for epidermal hair cell fate specification on maize leaf. New Phytol. 2021, 230, 1533–1549. [Google Scholar] [CrossRef] [PubMed]
- Zhou, C.; Lin, Q.; Lan, J.; Zhang, T.; Liu, X.; Miao, R.; Mou, C.; Nguyen, T.; Wang, J.; Zhang, X.; et al. WRKY Transcription Factor OsWRKY29 Represses Seed Dormancy in Rice by Weakening Abscisic Acid Response. Front. Plant Sci. 2020, 11, 691. [Google Scholar] [CrossRef] [PubMed]
- Wang, X.; Meng, H.; Tang, Y.; Zhang, Y.; He, Y.; Zhou, J.; Meng, X. Phosphorylation of an ethylene response factor by MPK3/MPK6 mediates negative feedback regulation of pathogen-induced ethylene biosynthesis in Arabidopsis. J. Genet. Genomics 2022, 49, 810–822. [Google Scholar] [CrossRef] [PubMed]
- Dievart, A.; Gottin, C.; Perin, C.; Ranwez, V.; Chantret, N. Origin and Diversity of Plant Receptor-Like Kinases. Annu. Rev. Plant Biol. 2020, 71, 131–156. [Google Scholar] [CrossRef]
- Wang. Lecture Series on Knowledge of Maize Pests and Diseases (Ⅲ) Maize Pest and Disease Resistance Identification and Investigation Techniques. Crop J. 2005, 53–55.
- Knapp, S.J.; Ross, W.M.; Stroup, W.W. Exact Confidence Intervals for Heritability on a Progeny Mean Basis1. Crop Sci. 1983, 25, 192–194. [Google Scholar] [CrossRef]
- Alvarado, G.; Rodríguez, F.M.; Pacheco, A.; Burgueño, J.; Crossa, J.; Vargas, M.; Pérez-Rodríguez, P.; Lopez-Cruz, M.A. META-R: A software to analyze data from multi-environment plant breeding trials. The Crop Journal 2020, 8, 745–756. [Google Scholar] [CrossRef]
- Murray, M.G.; Thompson, W.F. Rapid isolation of high molecular weight plant DNA. Nucleic. Acids. Res. 1980, 8, 4321–4325. [Google Scholar] [CrossRef]
- Poland, J.A.; Brown, P.J.; Sorrells, M.E.; Jannink, J.L. Development of high-density genetic maps for barley and wheat using a novel two-enzyme genotyping-by-sequencing approach. Plos One 2012, 7, e32253. [Google Scholar] [CrossRef]
- Li, C.; Guan, H.; Jing, X.; Li, Y.; Wang, B.; Li, Y.; Liu, X.; Zhang, D.; Liu, C.; Xie, X.; et al. Genomic insights into historical improvement of heterotic groups during modern hybrid maize breeding. Nat. Plants 2022, 8, 750–763. [Google Scholar] [CrossRef] [PubMed]
- Mckenna, A.; Hanna, M.; Banks, E.; Sivachenko, A.; Cibulskis, K.; Kernytsky, A.; Garimella, K.; Altshuler, D.; Gabriel, S.; Daly, M.; et al. The Genome Analysis Toolkit: a MapReduce framework for analyzing next-generation DNA sequencing data. Genome Res. 2010, 20, 1297–1303. [Google Scholar] [CrossRef] [PubMed]
- Jiao, Y.; Peluso, P.; Shi, J.; Liang, T.; Stitzer, M.C.; Wang, B.; Campbell, M.S.; Stein, J.C.; Wei, X.; Chin, C.S.; et al. Improved maize reference genome with single-molecule technologies. Nature 2017, 546, 524–527. [Google Scholar] [CrossRef] [PubMed]
- Wang, K.; Li, M.; Hakonarson, H. ANNOVAR: functional annotation of genetic variants from high-throughput sequencing data. Nucleic. Acids. Res. 2010, 38, e164. [Google Scholar] [CrossRef] [PubMed]
- Van, J.W.; Wageningen, O.; B V, K. Software for the calculation of genetic linkage maps. In 2001.
- Zeng, Z.B. Precision mapping of quantitative trait loci. Genetics 1994, 136, 1457–1468. [Google Scholar] [CrossRef] [PubMed]
- Churchill, G.A.; Doerge, R.W. Empirical threshold values for quantitative trait mapping. Genetics 1994, 138, 963–971. [Google Scholar] [CrossRef] [PubMed]
- Vogt, F.; Shirsekar, G.; Weigel, D. vcf2gwas: Python API for comprehensive GWAS analysis using GEMMA. Bioinformatics 2022, 38, 839–840. [Google Scholar] [CrossRef]
- Zhang, Z.; Ersoz, E.; Lai, C.Q.; Todhunter, R.J.; Tiwari, H.K.; Gore, M.A.; Bradbury, P.J.; Yu, J.; Arnett, D.K.; Ordovas, J.M.; et al. Mixed linear model approach adapted for genome-wide association studies. Nat. Genet. 2010, 42, 355–360. [Google Scholar] [CrossRef]
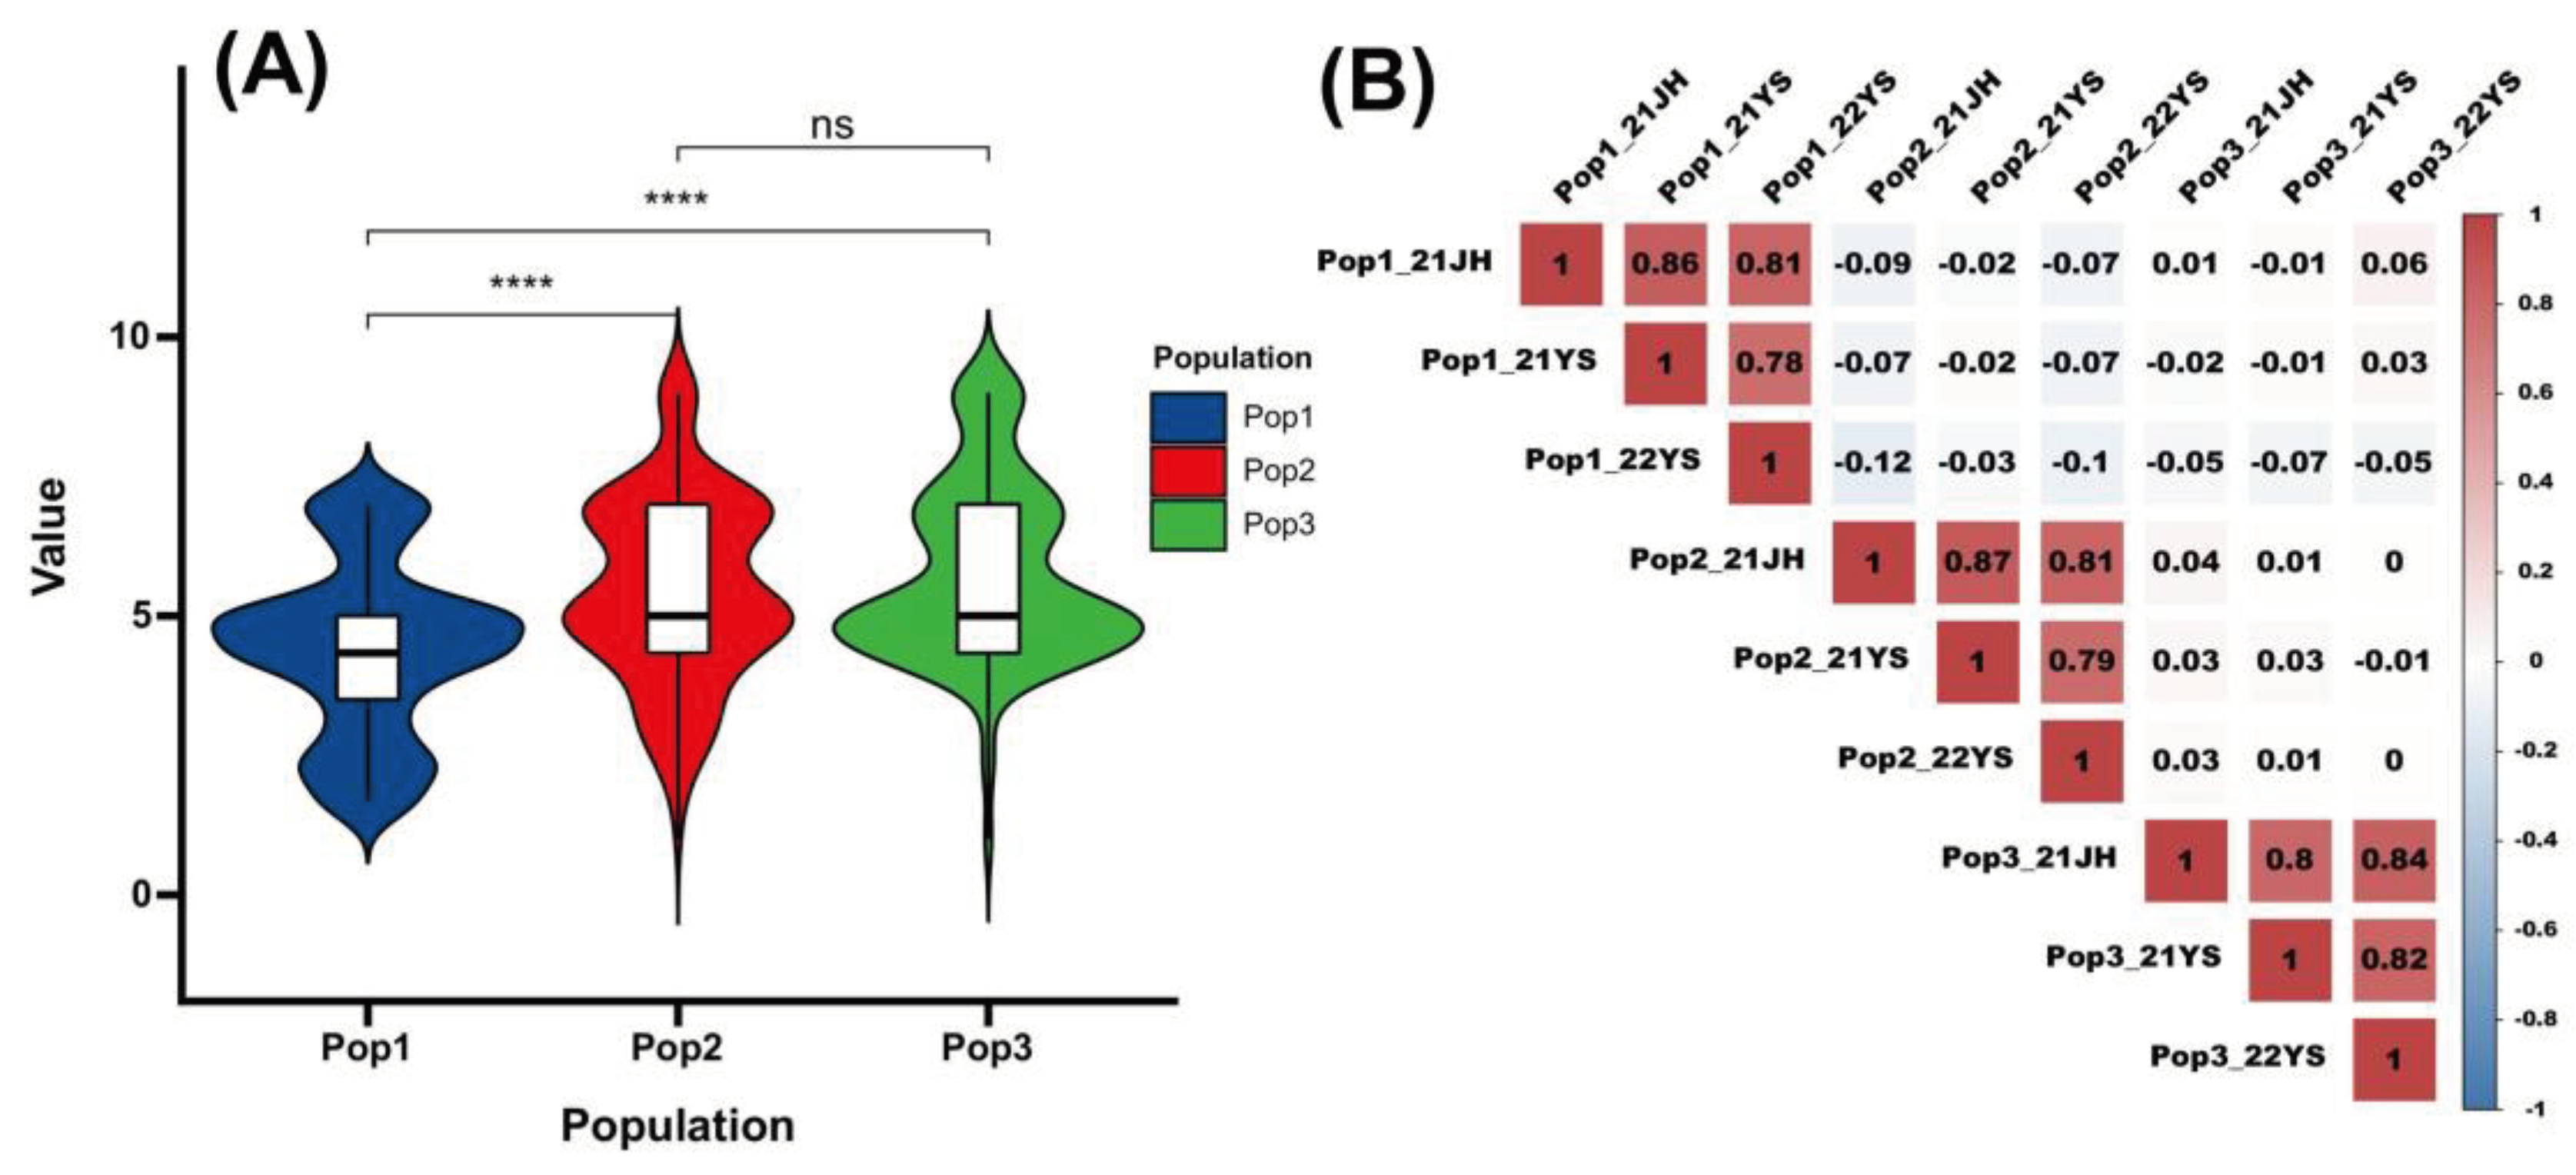
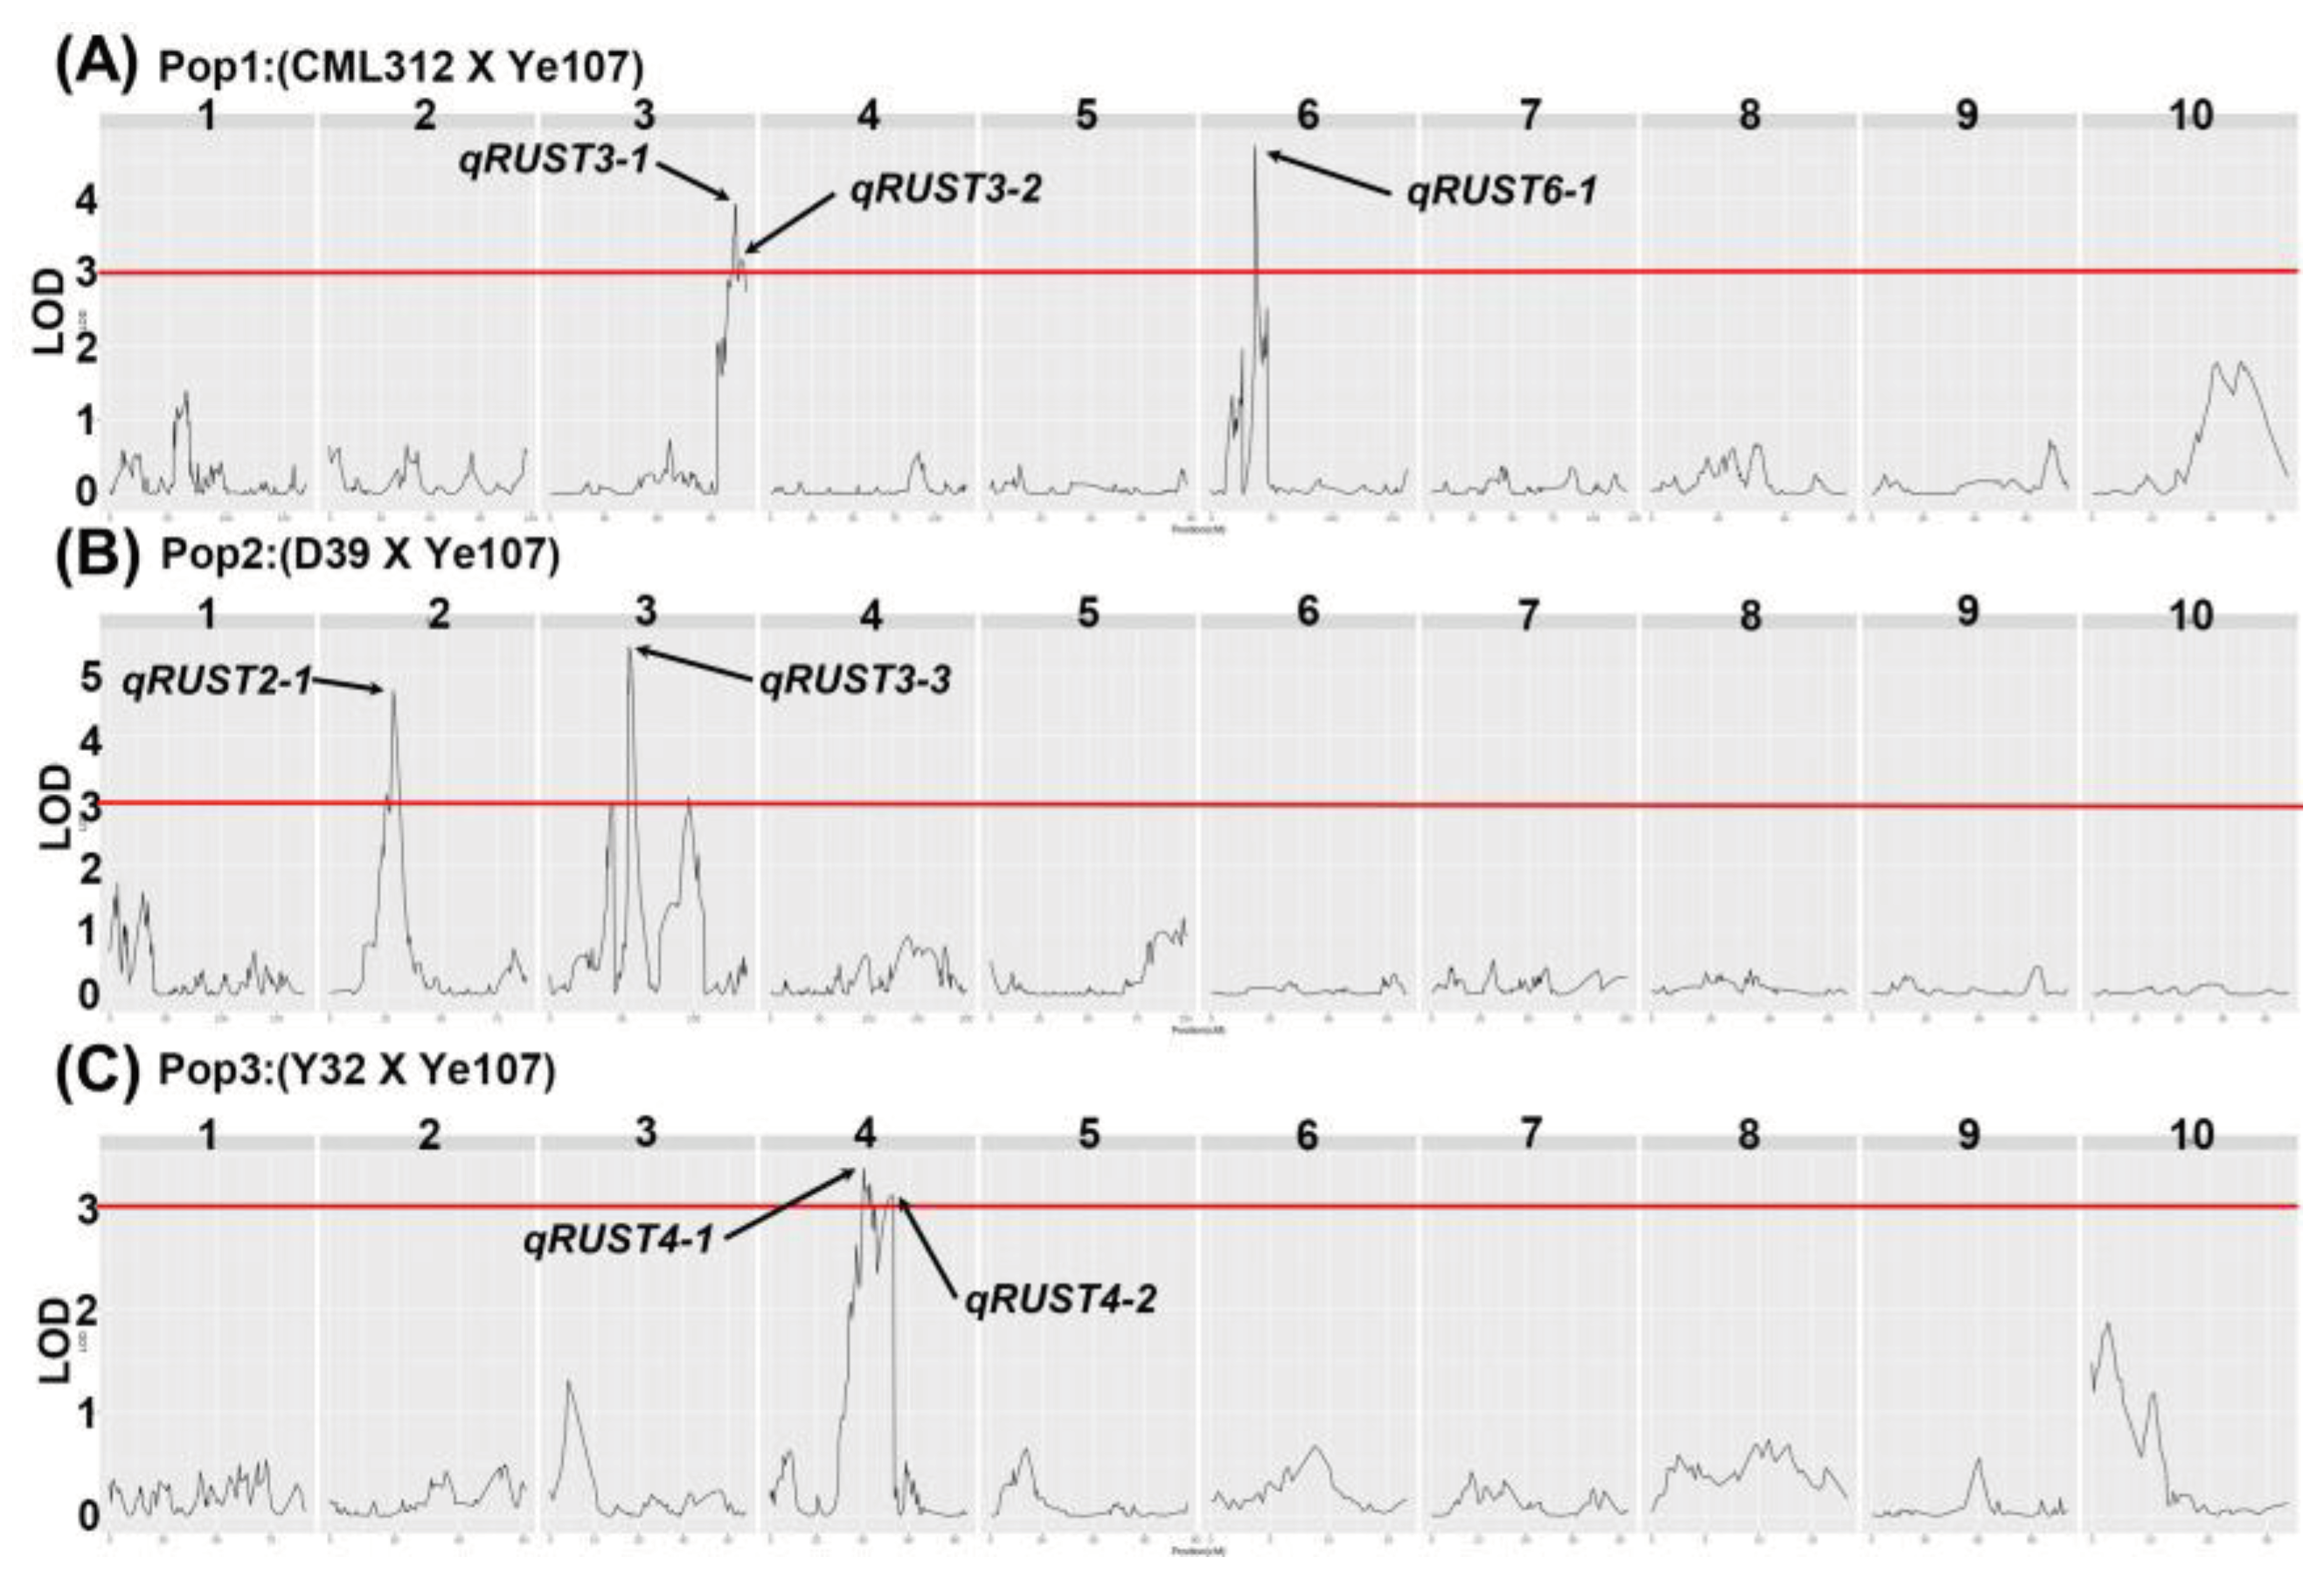
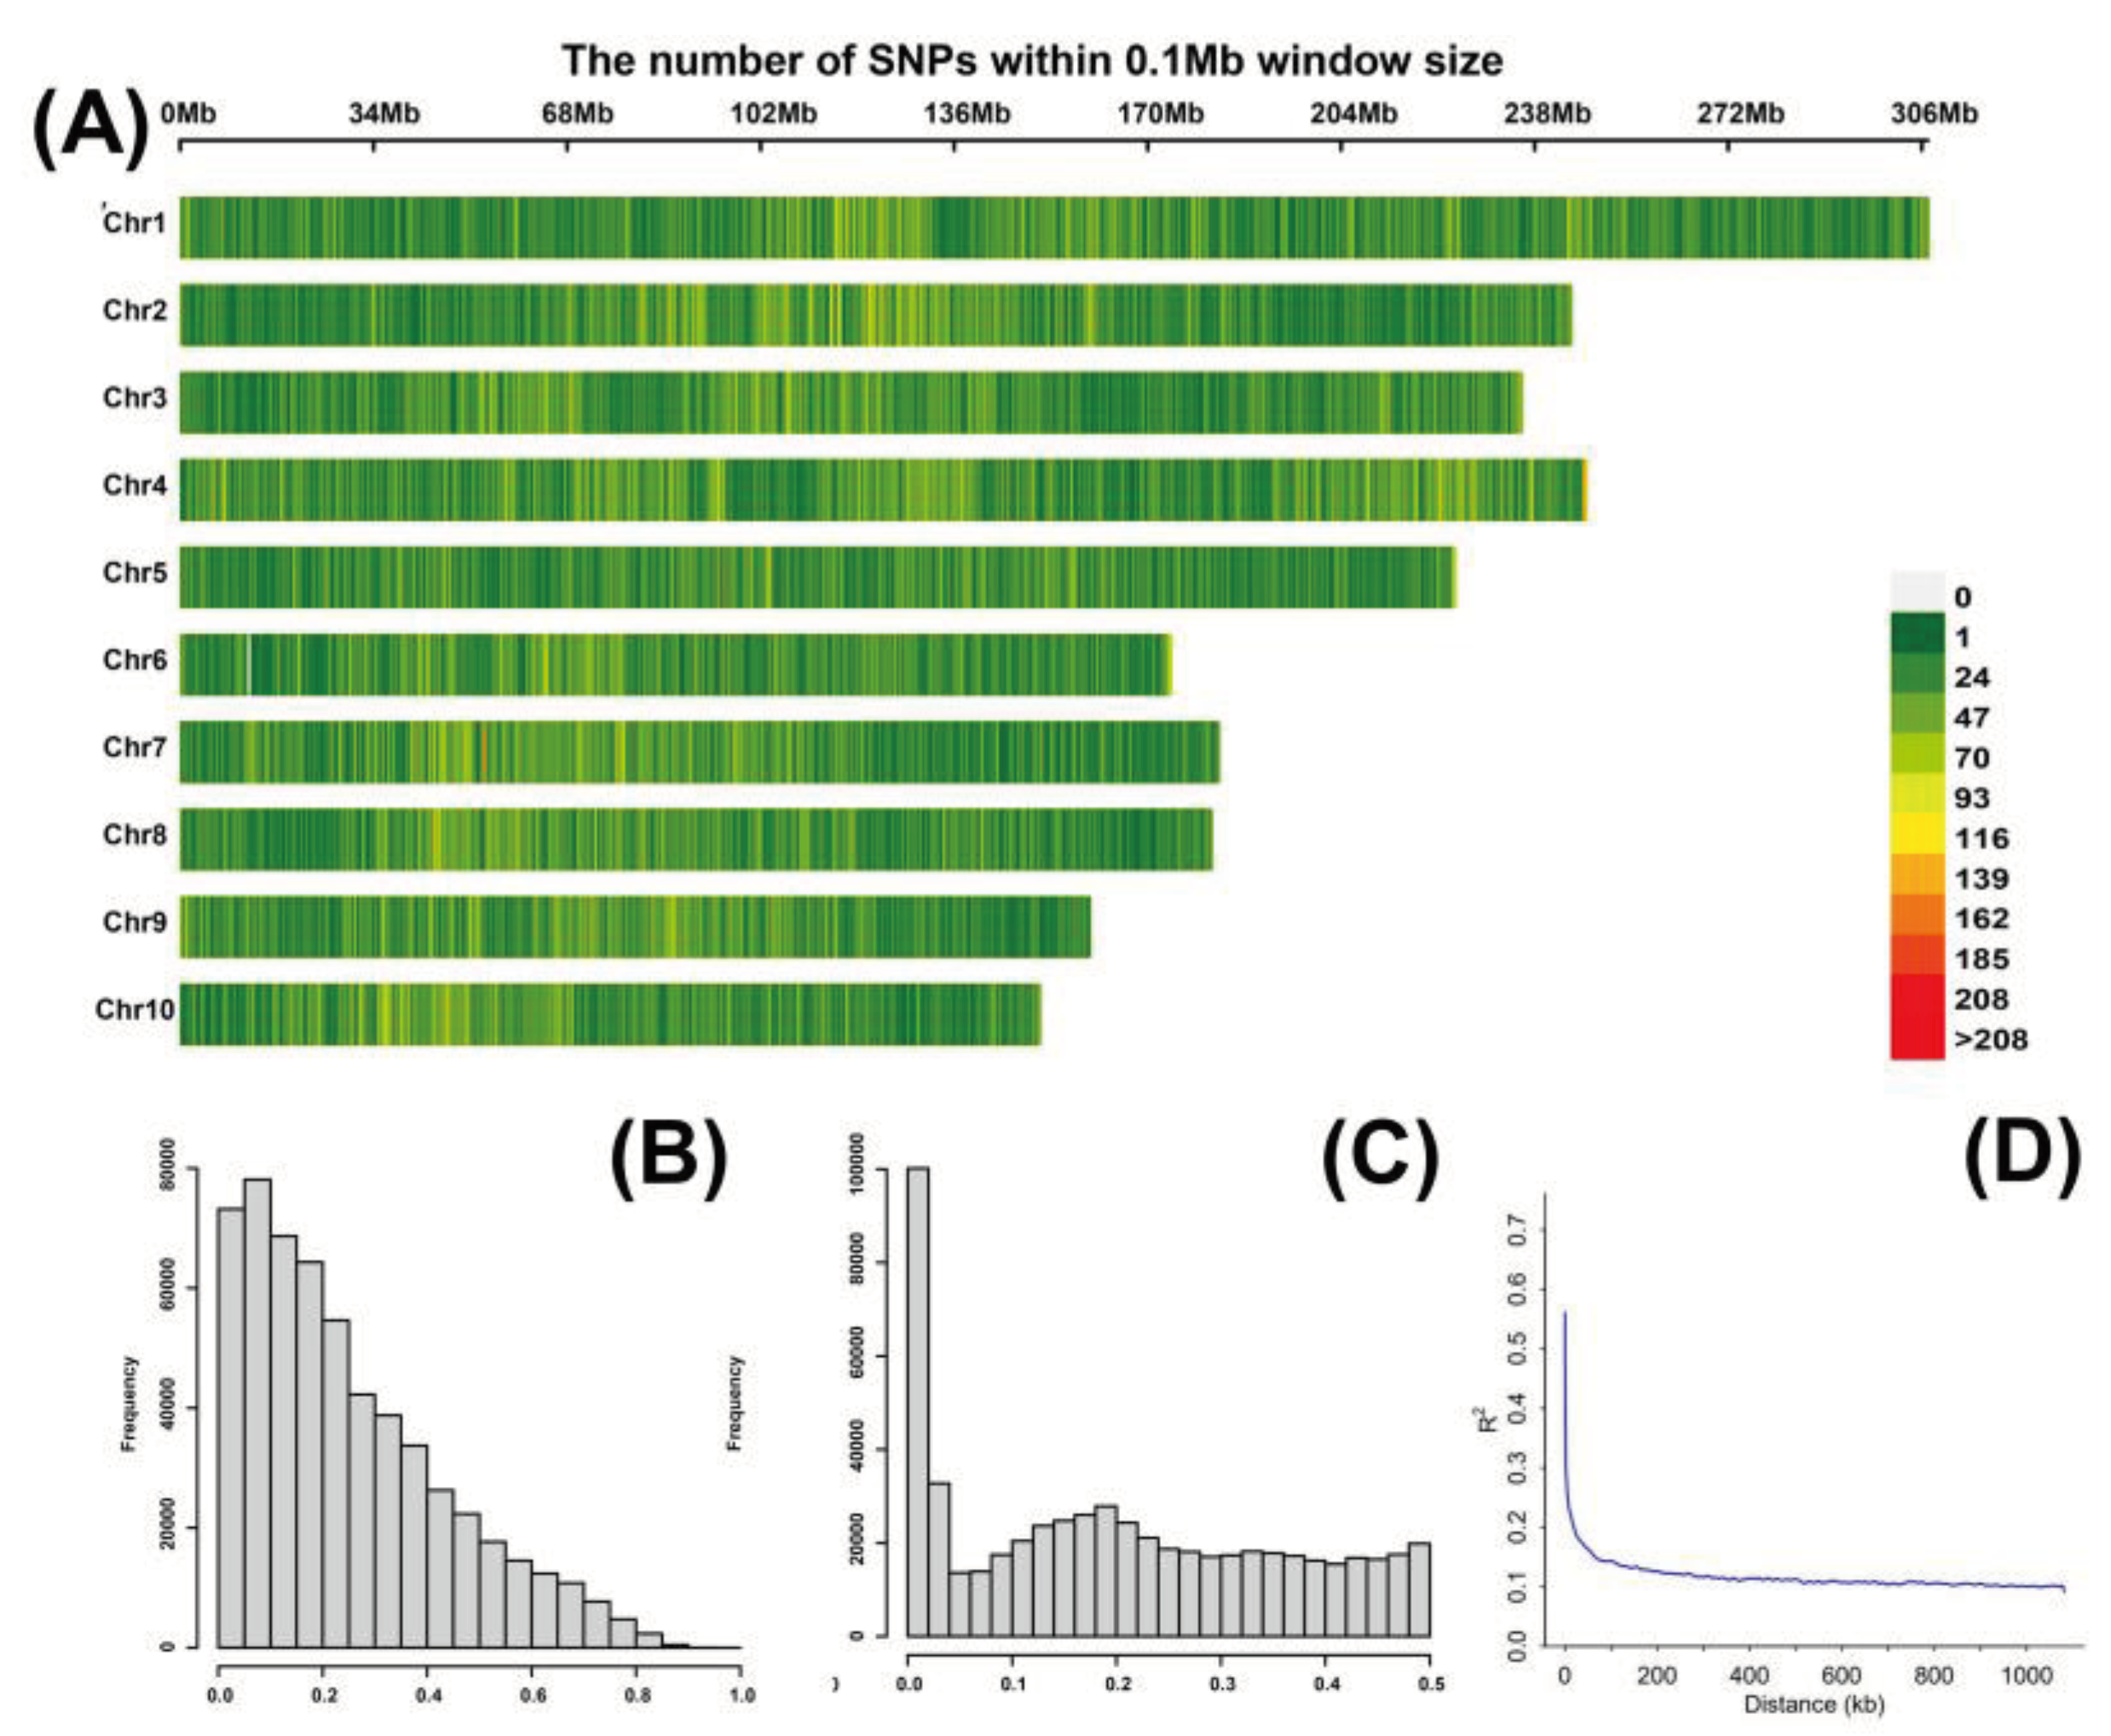

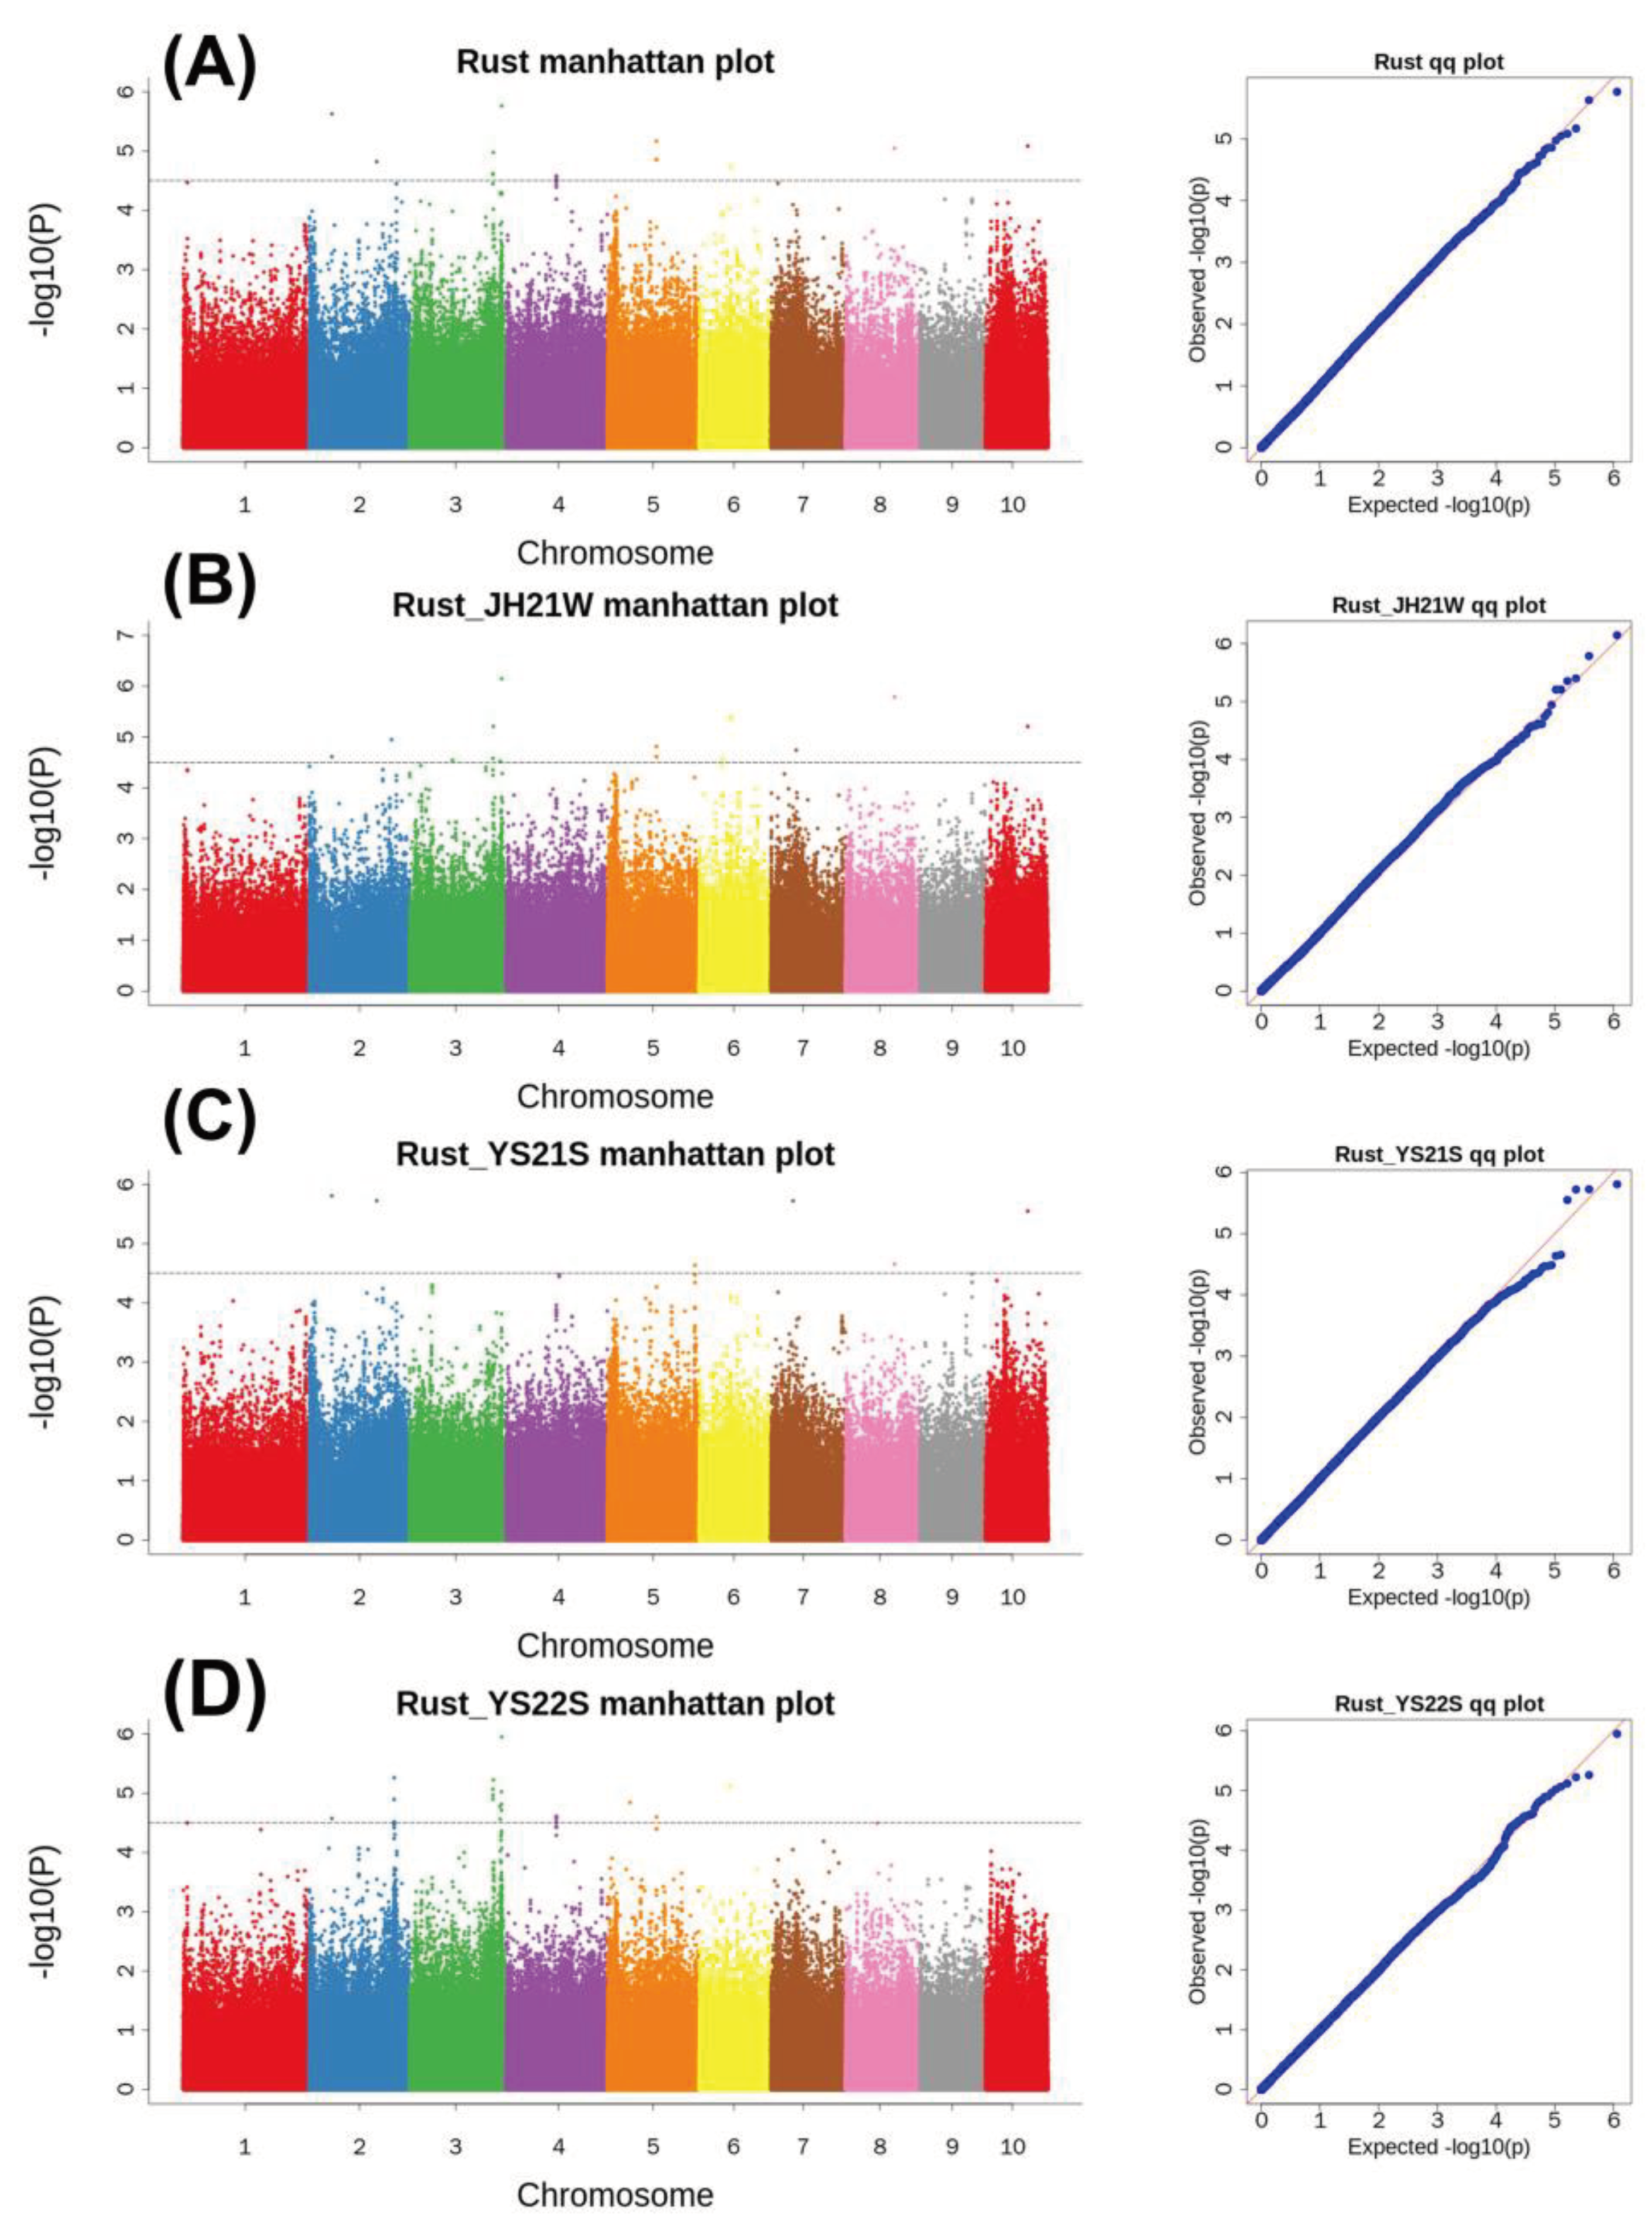
| Populations | Environments | Means | StandardDeviation | Skewness | Kurtosis | Coefficient ofVariation (%) | Variance components | PopulationHeritability (%) | ||||
|---|---|---|---|---|---|---|---|---|---|---|---|---|
| Pop1 | 21JH | 4.700 | 2.066 | -0.330 | -0.324 | 44.0 | 3.182* | 0.219* | 0.218 | 85.7 | ||
| 21YS | 4.322 | 2.147 | 0.218 | -0.428 | 49.7 | |||||||
| 22YS | 5.000 | 1.831 | 0.221 | 0.059 | 36.6 | |||||||
| Pop2 | 21JH | 5.789 | 1.705 | 0.201 | 0.123 | 29.4 | 2.377* | 0.382* | 0.057 | 90.6 | ||
| 21YS | 5.439 | 1.871 | 0.248 | -0.133 | 34.4 | |||||||
| 22YS | 5.964 | 1.596 | 0.406 | 0.143 | 26.5 | |||||||
| Pop3 | 21JH | 5.759 | 1.644 | -0.121 | -0.151 | 28.6 | 2.494* | 0.177* | 0.036 | 92.2 | ||
| 21YS | 5.268 | 1.817 | 0.166 | -0.379 | 34.5 | |||||||
| 22YS | 5.359 | 1.876 | -0.332 | -0.018 | 35.1 | |||||||
| QTL | Chr | Position(cM) | Mapping Interval(cM) | LOD | Additive_Effect | R2(%) |
|---|---|---|---|---|---|---|
| qRUST2-1 | 2 | 28.49 | 25.05-31.32 | 4.71 | -0.48 | 0.09 |
| qRUST3-1 | 3 | 103.72 | 101.71-103.72 | 3.92 | -0.59 | 0.1 |
| qRUST3-2 | 3 | 106.73 | 105.73-108.28 | 3.17 | -0.54 | 0.08 |
| qRUST3-3 | 3 | 54.96 | 54.41-59.02 | 5.39 | 0.7 | 0.11 |
| qRUST4-1 | 4 | 40.43 | 40.12-43.27 | 3.37 | 0.46 | 0.08 |
| qRUST4-2 | 4 | 52.39 | 51.39-53.39 | 3.1 | 0.45 | 0.08 |
| qRUST6-1 | 6 | 36.39 | 36.39-38.39 | 4.71 | 0.92 | 0.12 |
| Environment | SNP | Chr | p-BLUP | p-21JH | p-21YS | p-22YS | Candidate Gene | Gene Annotation |
|---|---|---|---|---|---|---|---|---|
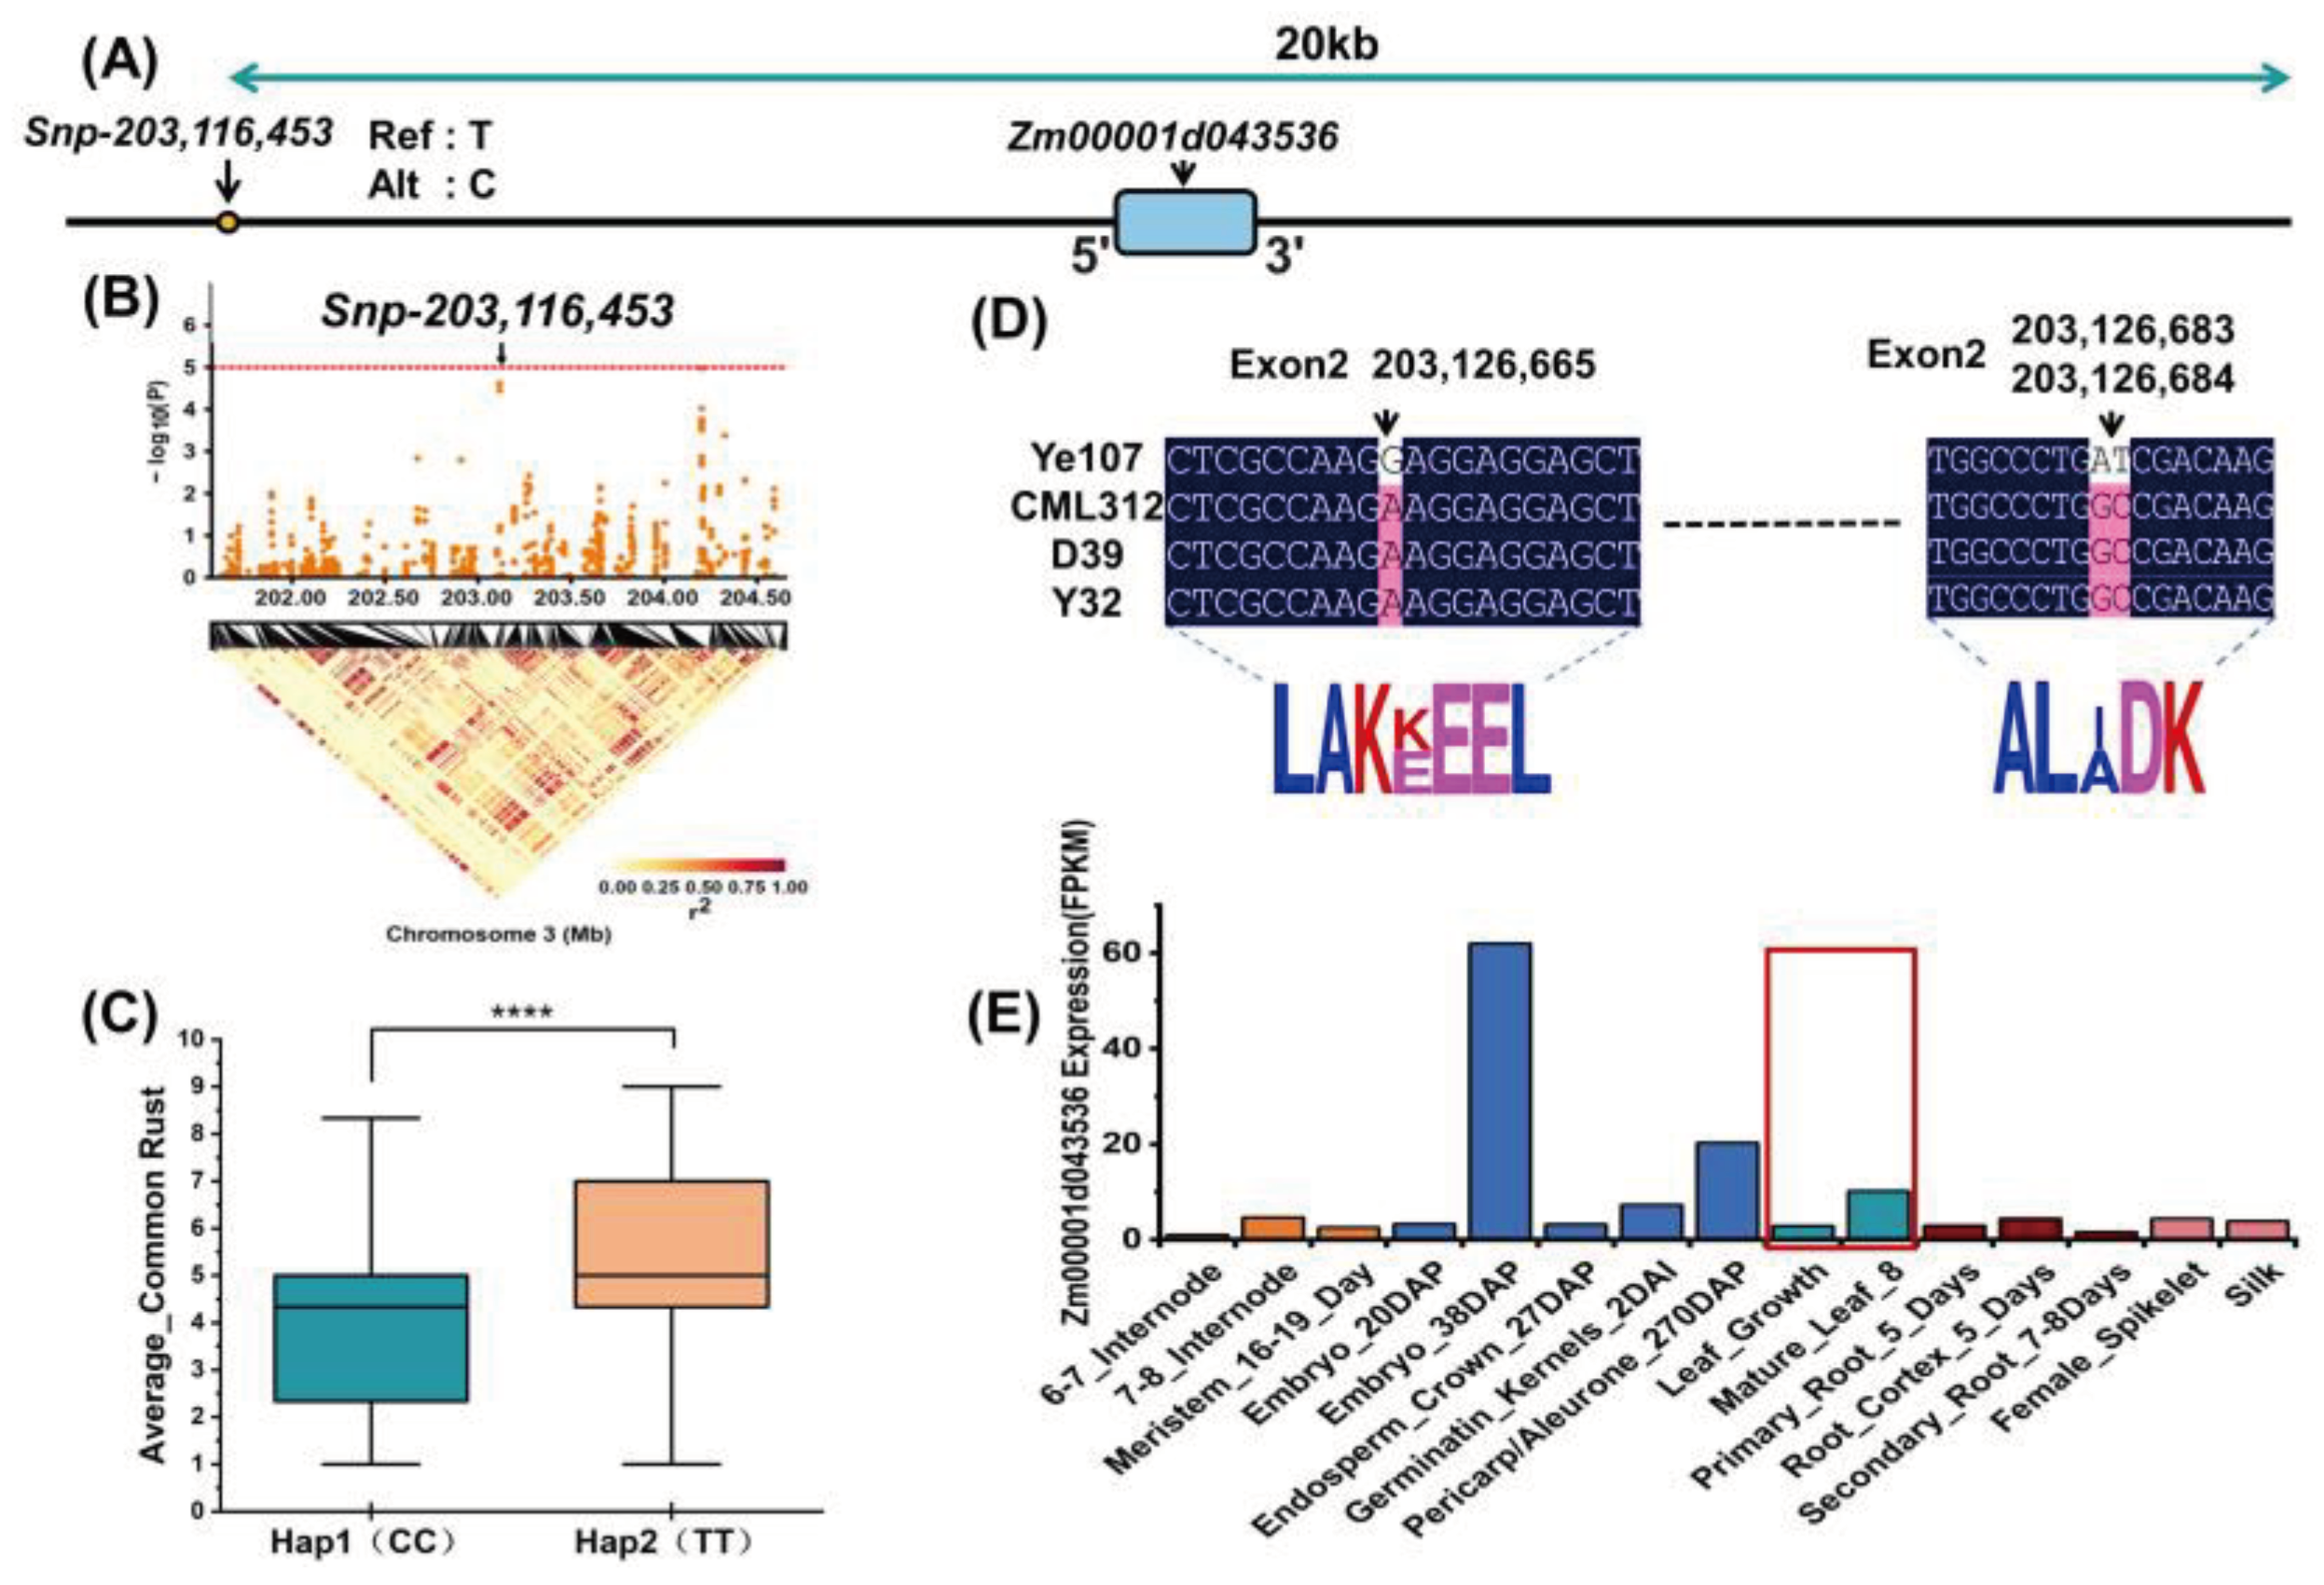
| BLUP 21JH 22YS | Snp-203,116,453 | 3 | 4.618 | 4.580 | - | 5.066 | Zm00001d043536 | Heat stress transcription factor C-1b |
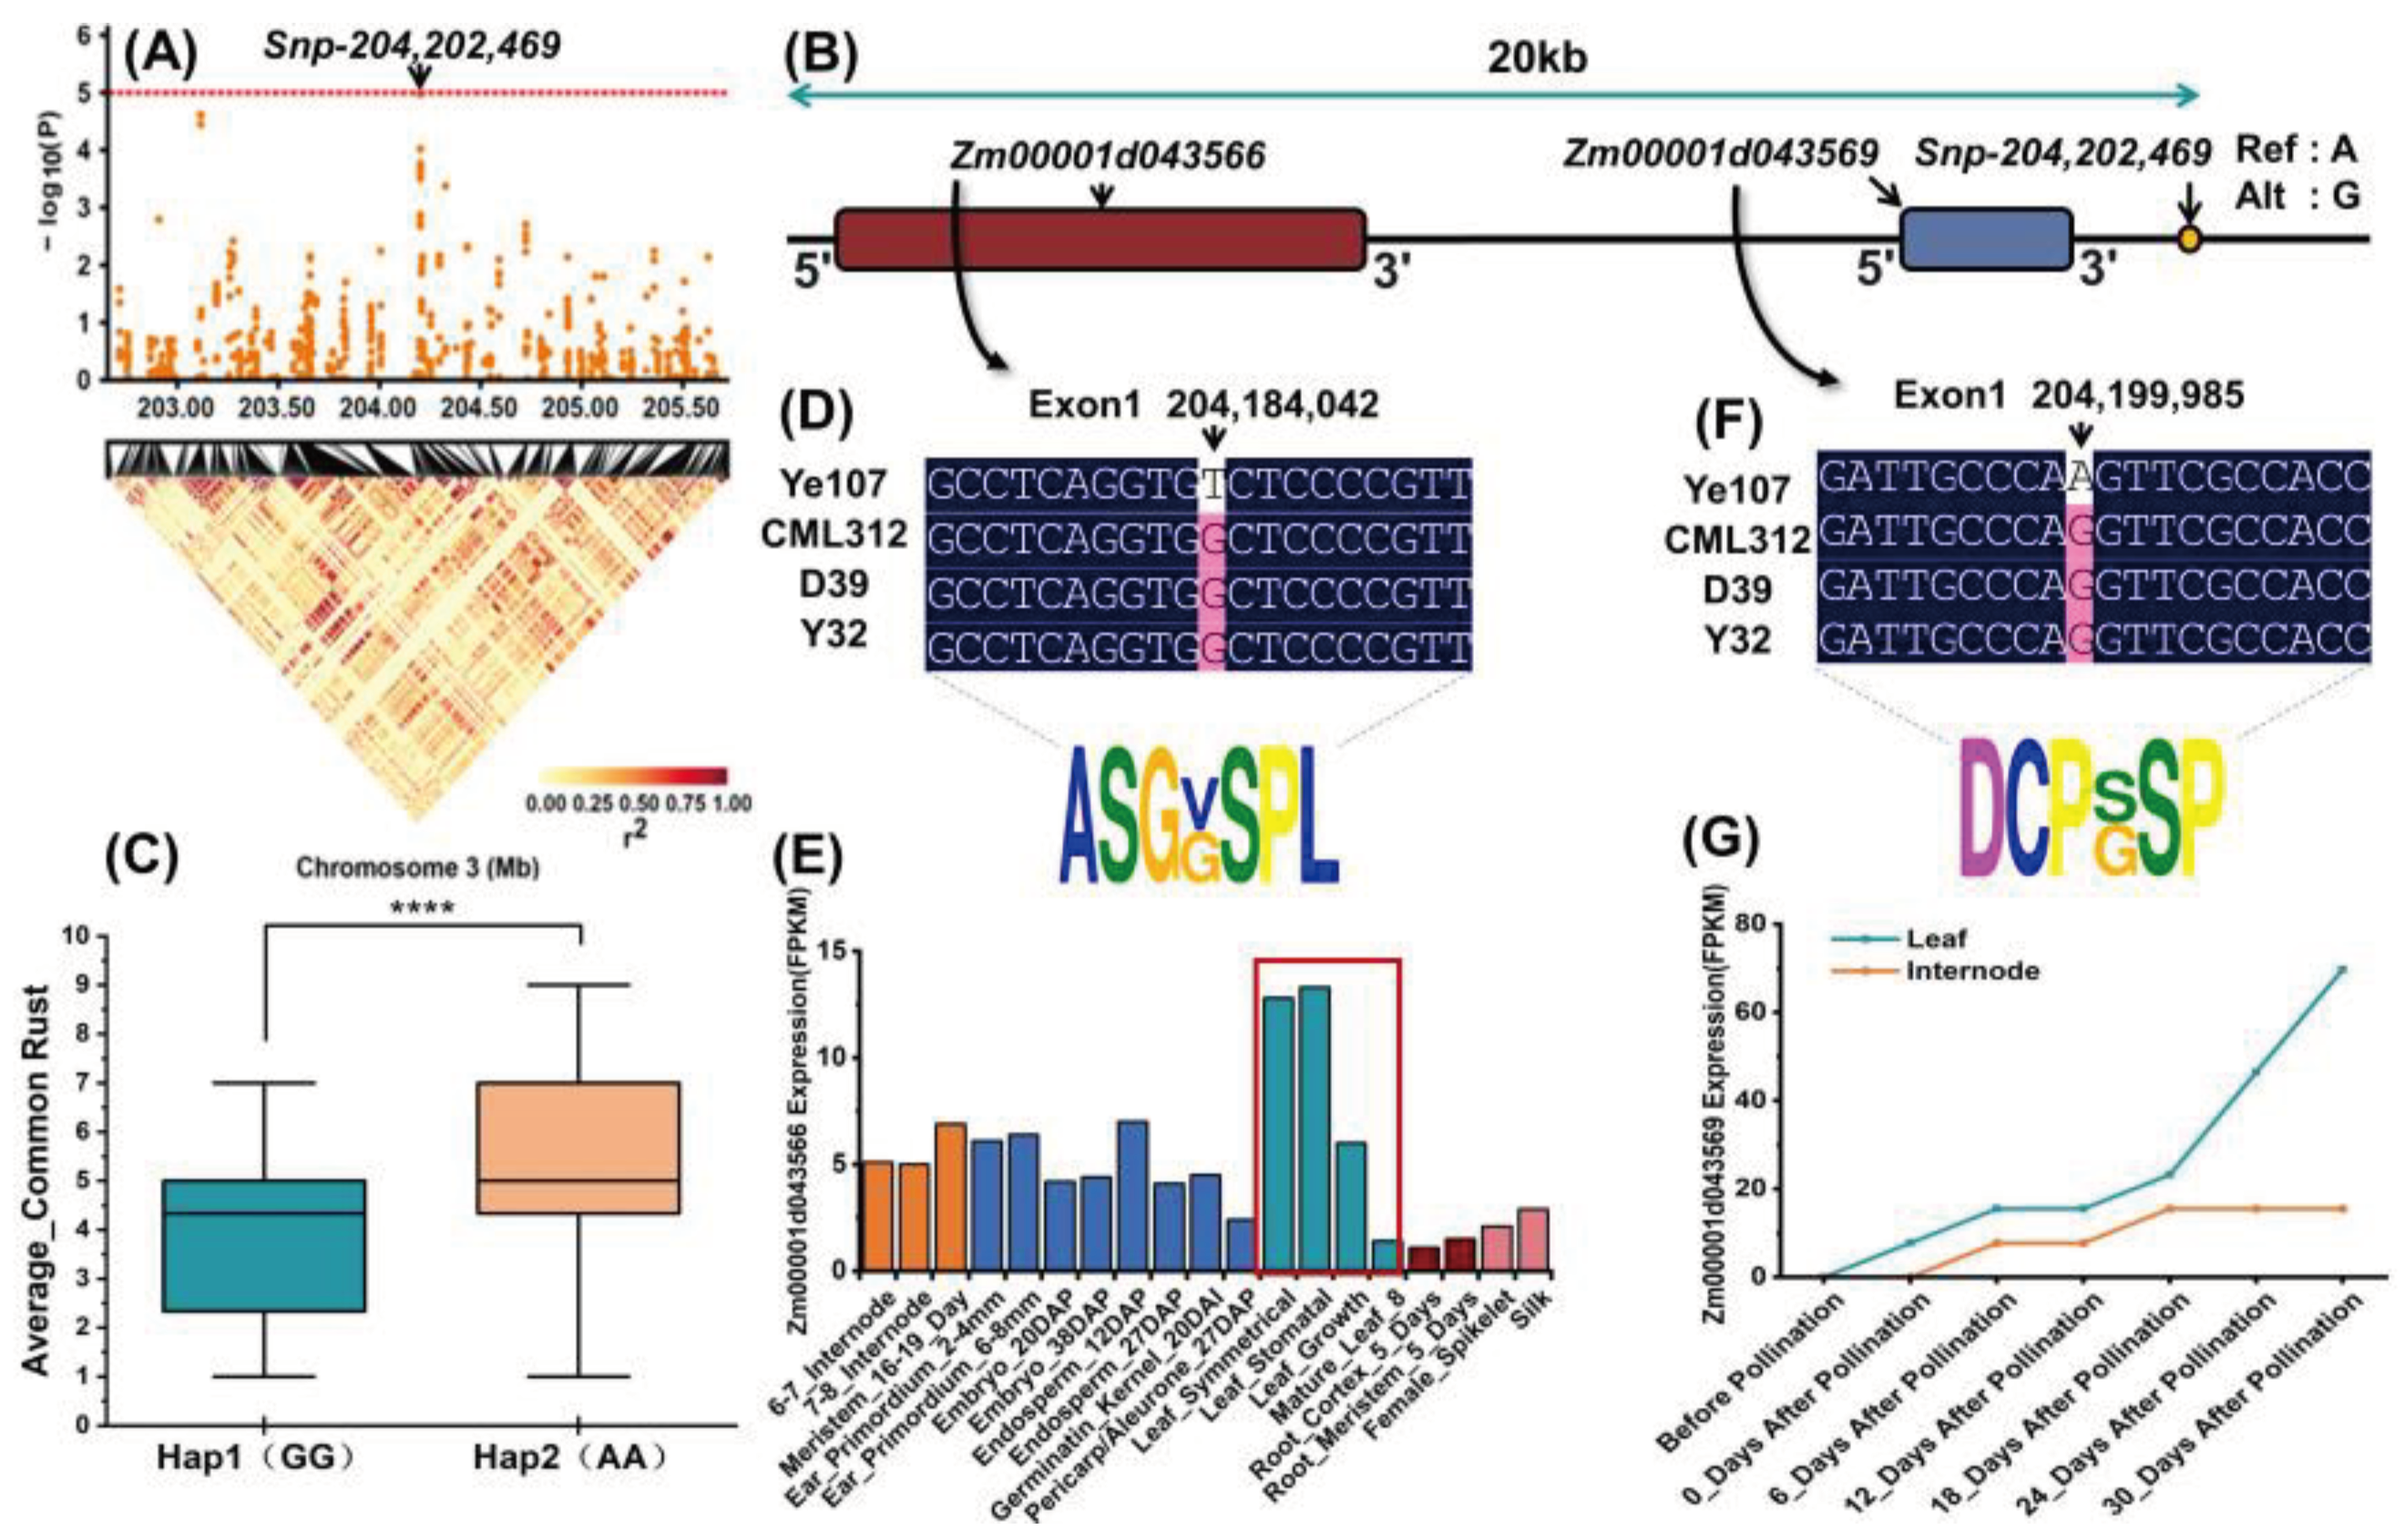
| Snp-204,202,469 | 3 | 4.978 | 5.208 | - | 5.223 | Zm00001d043566 | Protein STICHEL-like 3 | |
| Zm00001d043567 | - | |||||||
| Zm00001d043568 | - | |||||||
| Zm00001d043569 | WRKY-transcription factor 29 | |||||||
| Snp-224,639,688 | 3 | 5.763 | 6.145 | - | 5.949 | Zm00001d044303 | IQ_motif_EF-hand-BS | |
| Snp-118,608,571 | 5 | 5.169 | 4.812 | - | 4.596 | Zm00001d015778 | Leucine-rich repeat | |
| BLUP 21JH 21YS | Snp- 118,876,904 | 8 | 5.046 | 5.787 | 4.654 | - | Zm00001d010519 | - |
| Snp-102,507,767 | 10 | 5.084 | 5.206 | 5.548 | - | Zm00001d025070 | - | |
| Zm00001d025071 | - |
| QTL/SNP | Chr | Position | Candidate Gene | Gene Annotation |
|---|---|---|---|---|
| qRUST3-3 | 3 | 172,823,884-210,543,887 | Zm00001d043536 | Heat stress transcription factorC-1b |
| Snp-203,116,453 | 3 | 203,116,453 | Zm00001d043566 | Protein STICHEL-like 3 |
| Snp-204,202,469 | 3 | 204,202,469 | Zm00001d043569 | WRKY-transcription factor 29 |
| Chr | This study | Previous study | |||
|---|---|---|---|---|---|
| QTL/Snp | Position | QTL/Snp | Position | reference | |
| 2 | qRUST2-1 | 125,535,857-125,535,857 | - | - | - |
| 3 | qRUST3-1 | 19,468,979-21,766,539 | - | - | - |
| 3 | qRUST3-2 | 17,098,052-18,118,650 | - | - | - |
| 3 | qRUST3-3 | 172,823,884-210,543,887 | qCR3-113 | 113,425,715-224,567,900 | [5] |
| 5 | qRUST4-1 | 121,288,117-128,564,645 | - | - | - |
| 5 | qRUST4-2 | 94,866,787-94,866,787 | - | - | - |
| 6 | qRUST6-1 | 99,941,104-110,962,870 | - | - | - |
| 3 | Snp-203,116,453 | 203,116,453 | qCR3-113 | 113,425,715-224,567,900 | [5] |
| 3 | Snp-204,202,469 | 204,202,469 | qCR3-113 | 113,425,715-224,567,900 | [5] |
| 3 | Snp-224,639,688 | 224,639,688 | - | - | - |
| 5 | Snp-118,608,571 | 118,608,571 | qCR5-51 | 51,355,494-186,678,634 | [5] |
| 8 | Snp-118,876,904 | 118,876,904 | - | - | - |
| 10 | Snp-102,507,767 | 102,507,767 | - | - | - |
| Chr | This study | Distance(bp) | (Kibe et al., 2020)[5] | ||||||
| 3 | Ye107 × D39(F7) | CZL0618 × LaPostaSeqC7-F71-1-2-1-1B(F3) | |||||||
| QTL/Snp | Pos | LOD | QTL/Snp | Pos | LOD | ||||
| qRUST3-3 | 172,823,884 ~ 210,543,887 |
37.63Mb | 5.39 | - | qCR3-113 | 113,425,715 ~ 224,567,900 |
111.14Mb | 2.85 | |
| Snp-203,116,453 | 203,116,453 | - | 56,102,674 | S3_147013779 | 147,013,779 | - | |||
| Snp-204,202,469 | 204,202,469 | - | 57,188,690 | ||||||
| Parents | Pedigree | Ecological type |
Rust resistance | Symptoms scale of CR |
|---|---|---|---|---|
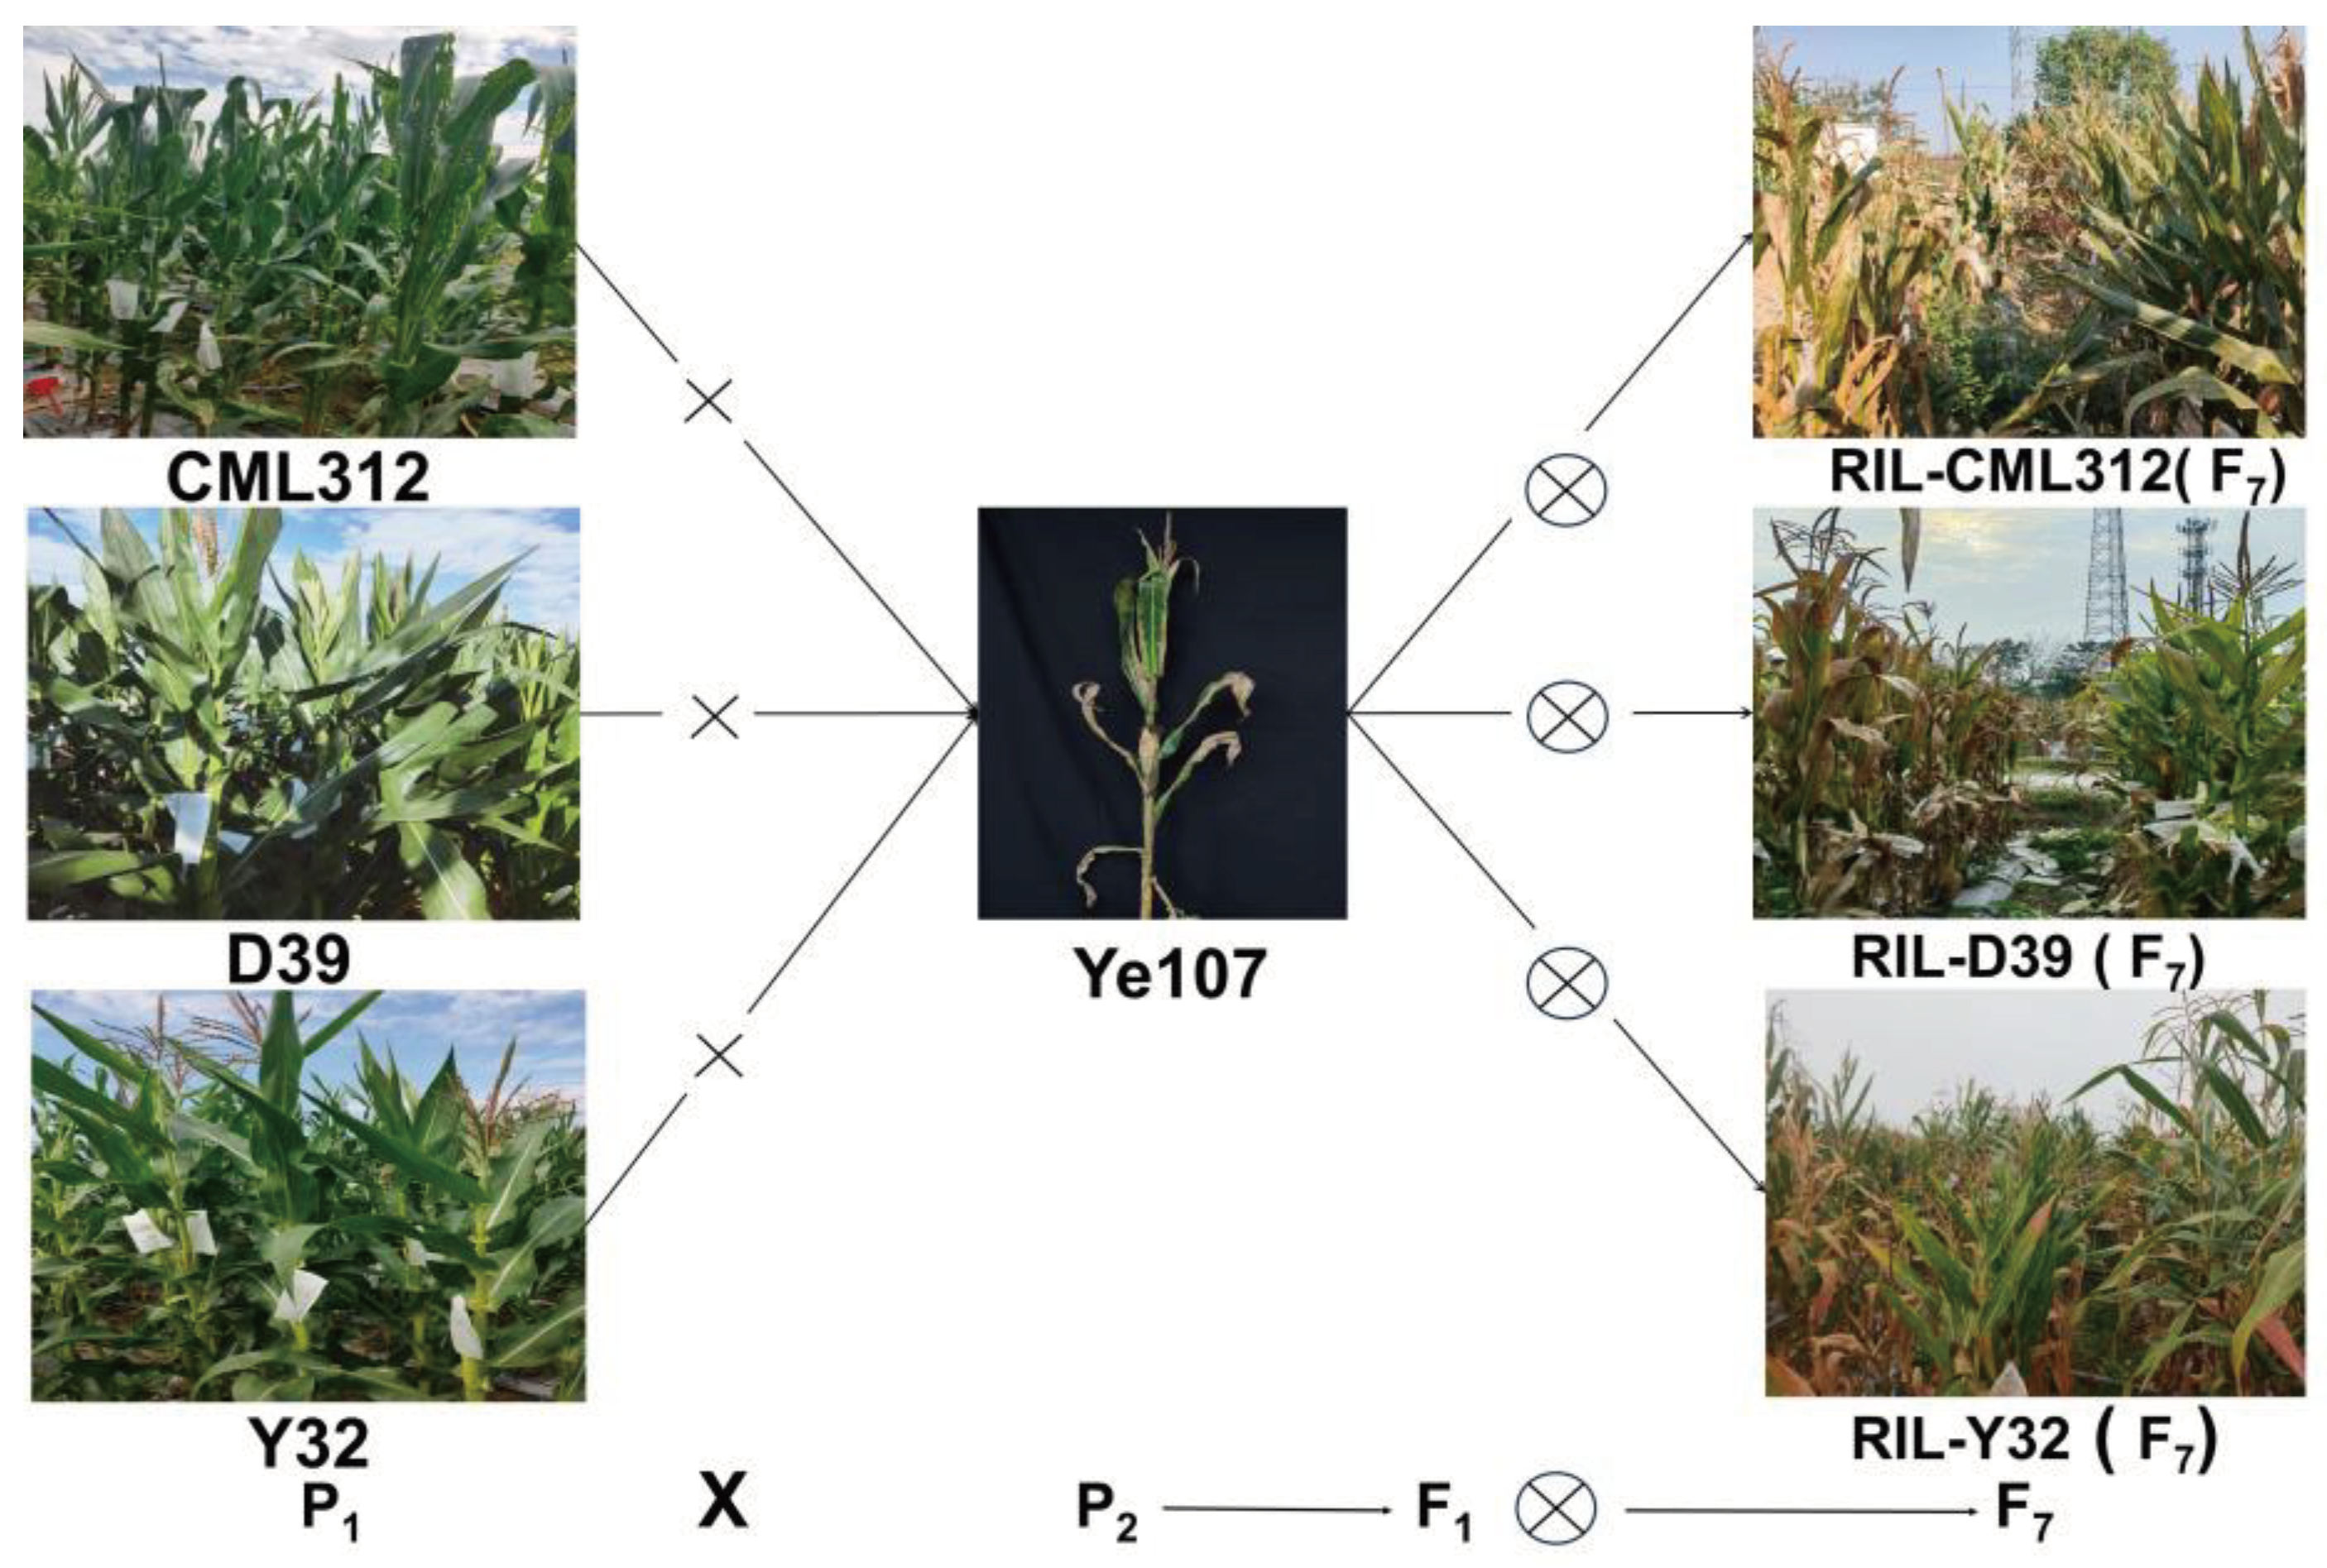
| Ye107 | Derived from US hybrid DeKalb XL80 | Temperate | Susceptible | 9 |
| CML312 | S89500-F2-2-2-1-1-B*5-2-1-6-1 | Tropical | Resistant | 3 |
| D39 | Selected from Suwan1 | Tropical | Highly Resistant | 1 |
| Y32 | Suwan 1-SC9-S8-346-2(Kei 8902)-3-4-4-6 | Tropical | Highly Resistant | 1 |
| Scale | Reaction Category | Symptoms |
|---|---|---|
| 1 | highly resistant | no or very few rust spots on the leaves, or lesion area less than 6% of the total leaf area |
| 3 | resistant | a small number of spots on the leaves, or lesion area comprising 6% to 25% of the total leaf area |
| 5 | moderately resistant | number of spots on leaves or lesion area covering 26% to 50% of the total leaf area |
| 7 | susceptible | number of spots on leaves or area of damage comprising 51% to 75% of the total leaf area |
| 9 | highly susceptible | large lesion area on leaves or 76% to 100% of leaf death |
Disclaimer/Publisher’s Note: The statements, opinions and data contained in all publications are solely those of the individual author(s) and contributor(s) and not of MDPI and/or the editor(s). MDPI and/or the editor(s) disclaim responsibility for any injury to people or property resulting from any ideas, methods, instructions or products referred to in the content. |
© 2024 by the authors. Licensee MDPI, Basel, Switzerland. This article is an open access article distributed under the terms and conditions of the Creative Commons Attribution (CC BY) license (http://creativecommons.org/licenses/by/4.0/).


