Preprint
Article

Ecological Safety Assessment and Convergence of Resource-Based Cities in Yellow River Basin

Altmetrics

Downloads

77

Views

16

Comments

0

A peer-reviewed article of this preprint also exists.

This version is not peer-reviewed

Submitted:

04 March 2024

Posted:

04 March 2024

You are already at the latest version

Alerts
Abstract
Promoting the sustainable development of resource-based cities is of great significance to the ecological protection and high-quality development of the Yellow River Basin. Combining the environmental status and economic development, we objectively evaluate the ecological safety level of resource-based cities in the Yellow River Basin, compare and analysis the main factors affecting the ecological safety of different resource-based cities, and formulate precise and differentiated ecological safety protection measures in river basins to achieve high-quality development. Taking the Yellow River Basin as an example, this paper analyses the ecological level of the Yellow River Basin based on the theory of sustainable development, calculates the ecological safety level of 30 resource-based cities in the Yellow River Basin from 2006 to 2020 by TOPSIS model, and makes convergence analysis by classification. Through the DID empirical test of sustainable development planning policy on ecological safety factors, distinguish the development characteristics of different resource-based cities. The results show that: (1) the ecological safety level of resource-based cities in the Yellow River Basin is generally developing well, and there are differences among different types of resource-based cities; (2) the kinetic energy of sustainable development of resource-based cities in the Yellow River Basin is mainly industrial transformation, and the power of science and technology is insufficient; (3) local governments pay limited attention to environmental protection, and the sustainable development planning of resource-based cities in 2013 mainly promotes the adjustment of industrial structure of resource-based cities.
Keywords: 
Subject: Environmental and Earth Sciences  -   Sustainable Science and Technology

1. Introduction

The ecological protection and high-quality development of the Yellow River Basin is an important national strategy to which the CPC Central Committee attaches great importance. The Yellow River Basin is an important energy economic belt in China. The Yellow River flows through 74 prefecture-level cities in 9 provinces, including 36 resource-based cities. Resource-based cities are the national energy strategic guarantee and the important support for the high quality of the national economy. The sustainable development of resource-based cities is not only an important strategic issue in China's modernization, but also a global issue. Of the 14 coal bases planned by the state, 9 are located in the Yellow River Basin, with total coal resources accounting for 40% of the country's total and output approaching 69.7%. The Yellow River Basin is not only an important area of coal resources and raw coal production and processing in China, but also a relatively fragile ecological area. Coal mining has a significant impact on the water and sediment environment of the Yellow River [2].
Resource exploitation is a double-edged sword for urban development. On the one hand, resource exploitation provides a material guarantee for industrialization, but on the other hand, it affects the ecological environment, increases the high level of pollutant emissions and aggravates the difficulty of ecological management. As China enters a new stage of high-quality development, the sustainable development of resource-based cities is imminent. In 2013, the State formulated the National Plan for the Sustainable Development of Resource-Based Cities (2013–2020) (hereinafter referred to as the Plan) and put forward the scientific classification of resource-based cities into four categories: growth, maturity, decline and regeneration, and established orderly development, optimized industrial structure and people's livelihood as the principles of sustainable development of resource-based cities. Under the above background, this paper takes the resource-based cities in the Yellow River Basin as the research object, guided by the theory of green economy and sustainable development, analyses the change characteristics and influencing factors of the ecological safety level of resource-based cities in the basin, considers the externality of ecological protection, and analyses the differences in the ecological safety level between upstream and downstream and different types of resource-based cities. With the comprehensive and systematic promotion of ecological protection in the Yellow River Basin, whether there is a narrowing and convergence of ecological safety differences is of great significance to the realization of ecological safety in the Yellow River Basin.
The scientificity and rationality of ecological safety evaluation index system determines the credibility and effectiveness of quantitative evaluation, which is widely used in ecology, soil, environment, economy and other fields, provinces, cities, villages, mining areas and other scales. Kesler, a foreign scholar, earlier established the evaluation framework of regional ecological safety of coal mining earlier, mainly considering the impact of coal mining on the regional ecological environment. Costanza and others further refined the evaluation index system of the ecological safety of mining areas. Aigbedion and others constructed the index system including land structure stability, biodiversity, air pollution, water pollution and other factors in the study of regional ecological safety of mineral resources in Nigeria. Maxim and others [6] increased vegetation, air and water pollution and surface collapse. Domestic scholars construct the ecological safety index system of coal resource-based cities, focusing on urban land structure, urban ecological function, urban interference and other aspects to complement the ecological evaluation index system of coal resource-based cities. Yu Jian et al. [18] added regional development index to study the ecological safety of coal resource-based cities in Anhui, Cao Gang et al. [19] added indicators such as construction land pressure, land use structure and land production pressure to study the ecological safety evaluation of Linxiang City, and Cui Xinyue et al. [20] added regional policy response indicators such as scientific research, education and energy conservation to study the ecological safety level of Yangtze River Delta urban agglomeration. They found that the ecological safety of resource-based cities in Anhui Province was slightly worse. Liu Surong and Yang Huimiao [11], relied on big data technology to survey ecological environment assessment index system of resource-based cities by using the PSR analysis framework in CNKI from 2006 to 2016, and summarized 39 ecological environment assessment index systems of resource-based cities with four layers, three dimensions and 11 elements. Lu Guozhi et al. [12] used PSR model to analyze the ecological safety of Shizuishan, a coal resource-based city, and added indicators such as coal resource exploitation and mining industry investment ratio, and obtained the overall change of ecological safety through obstacle measurement model and grey prediction. Over-exploitation and limited environmental treatment are the main obstacle factors of ecological safety. To study the causal relationship between natural climate, water resources, land use and other ecological factors and human health and living environment. Zhao Xiang and He Guizhen[13] used CiteSpace software to summarize the research on DPSIR analysis framework at home and abroad from 1998 to 2019. The DPSIR method has matured in small-scale land and water resources research, and needs to be improved in large-scale research such as agriculture, marine area and city. Ness et al. [14] used the DPSIR model to construct the evaluation index of ecological sustainable development of resource-based cities, and analyzed the spatial changes of urban ecology before and after environmental constraints. In the research of Shi Xixi and Yang Li [17], the indicators of resources and science and technology system were added, and the coordination of sustainable development in the Yellow River Basin from 2008 to 2018 was evaluated. It was considered that attaching importance to ecological protection would not reduce the speed of economic development, while unreasonable economic development mode was the root of conflict, and resource productivity was the key factor to solve the conflict. The nexus of ecology-economy-social development could be explored from the perspectives of ecological pollution control, sustainable development and technological progress. Du Yong [18] selected 26 indicators from four aspects: resource safety, economic development, people's livelihood and well-being, and environmental protection to evaluate the ecological civilization of resource-based cities in China. Chen Dan and Wang Ran [19] constructed an index evaluation system of three dimensions: environmental carrying capacity, intensive use of resources and environmental quality, and compared the development level of ecological civilization of mining cities in the Middle East and the West. According to the regional characteristics of coal mines, Liu Jin et al. [20] constructed 28 ecological safety evaluation index systems in four dimensions: resources, environment, society and economy.
After selecting indices, determining weights and comprehensively calculating the ecological safety index, the most critical step is the method of determining weights, including entropy weight method, principal component method, analytical hierarchy process, OWA method, CRITIC method and other weight confirmation methods. Entropy weight method and principal component analytical hierarchy process are common evaluation methods. Ordered weighted average operator (OWA) operator is usually used in combination with geographic information system (GIS) in ecological safty evaluation. Zhang Hong et al. [21] constructed the ecological safety evaluation system of Dali City from three levels: nature, ecology and landscape, and carried out the multi-criteria decision evaluation of ordered weighted average operator (OWA), multi-criteria decision evaluation, and obtained the ecological safety evaluation results of Dali City under different decision risk coefficients. Bao Yanli and Zhang Hong [22] combined the PSR model with the EES model, and introduced the CRITIC method into the traditional grey target model to calculate the comprehensive ecological safety level of Yunnan Province in 2017. Li Bingyi and Shi Xueyi [23] used the ecological footprint comprehensive account model to evaluate the ecological safety of Jincheng, a coal resource-based city, and made suggestions for improvement suggestions from the aspects of industrial structure, land use efficiency and population size. Wu Ge et al. [24] analyzed the changes of ecological footprint, ecological footprint diversity index, ecological carrying capacity and ecological surplus/deficit in Yan'an, and concluded that although the resource use efficiency is improving, the resource consumption rate is higher than the resource regeneration speed. Xin Boxiong et al. [25] They calculated the ecological efficiency differences of 28 cities based on three-stage DEA and bootstrap DEA models, and pointed out that the main influencing factors of regional ecological efficiency are regional scale, regional carrying capacity, and regional environmental quality and so on. Yu Jian et al. [18] used entropy weight fuzzy matter element model to evaluate the ecological safety of Anhui resource-based cities, and compared with the multi-index comprehensive evaluation method, it was concluded that Ma'anshan's ecological safety was poor, while Chizhou and Anqing had a tendency to deteriorate, which was consistent with the analysis results obtained by the multi-index comprehensive method.
2. Research Objects

2.1. Overview of Resource-Oriented Cities in the Yellow River Basin

The Yellow River Basin is rich in energy resources, the upper reaches are rich in water resources, which is an important water resources conservation area in China; the middle reaches are rich in coal resources, which are distributed with important coal production bases in China; and the lower reaches are rich in oil and natural gas resources. As shown in Figure 1, the Yellow River flows through nine provinces, namely Qinghai, Sichuan, Ningxia, Shaanxi, Shanxi, Inner Mongolia, Henan and Shandong, and there are 30 resource cities in the Yellow River Basin according to the National Sustainable Development Plan for Resource Cities (2013-2020) issued by the State Council in 2013.
According to the different stages of resource development, resource-based cities are divided into four types: growth-oriented, mature-oriented, declining oriented and regenerative-oriented. As shown in Table 1, this paper screens six growth-oriented resource-based cities in the Yellow River Basin, which are rich in resource reserves and have long-term development potential, so it is necessary to pay attention to the coordinated promotion of resource development and ecological safety; 15 mature resource-based cities, which are facing the needs of transformation and development, and the ecological safety threat brought by resource development is greater; six declining resource-based cities, which are facing the situation of resource depletion; three regenerative resource-based cities show that they have broken away from the mode of relying on resources for development. Taking these 30 resource-based cities as the research objects, the ecological safety assessment model of resource-based cities in the Yellow River Basin was constructed.

2.2. Characteristics of the Yellow River Basin Ecosystem

The Yellow River originates from the Qinghai-Tibet Plateau, with a total length of 5,464 kilometers and a vast drainage area of about 750,000 square kilometers, flowing through the areas of the Qinghai-Tibet Plateau, Loess Plateau, Hetao Plain and North China Plain, with a great difference in topographic and geomorphic conditions, crossing three major topographic terrains from west to east, making it the largest river in the world in terms of sand content and sand transport.
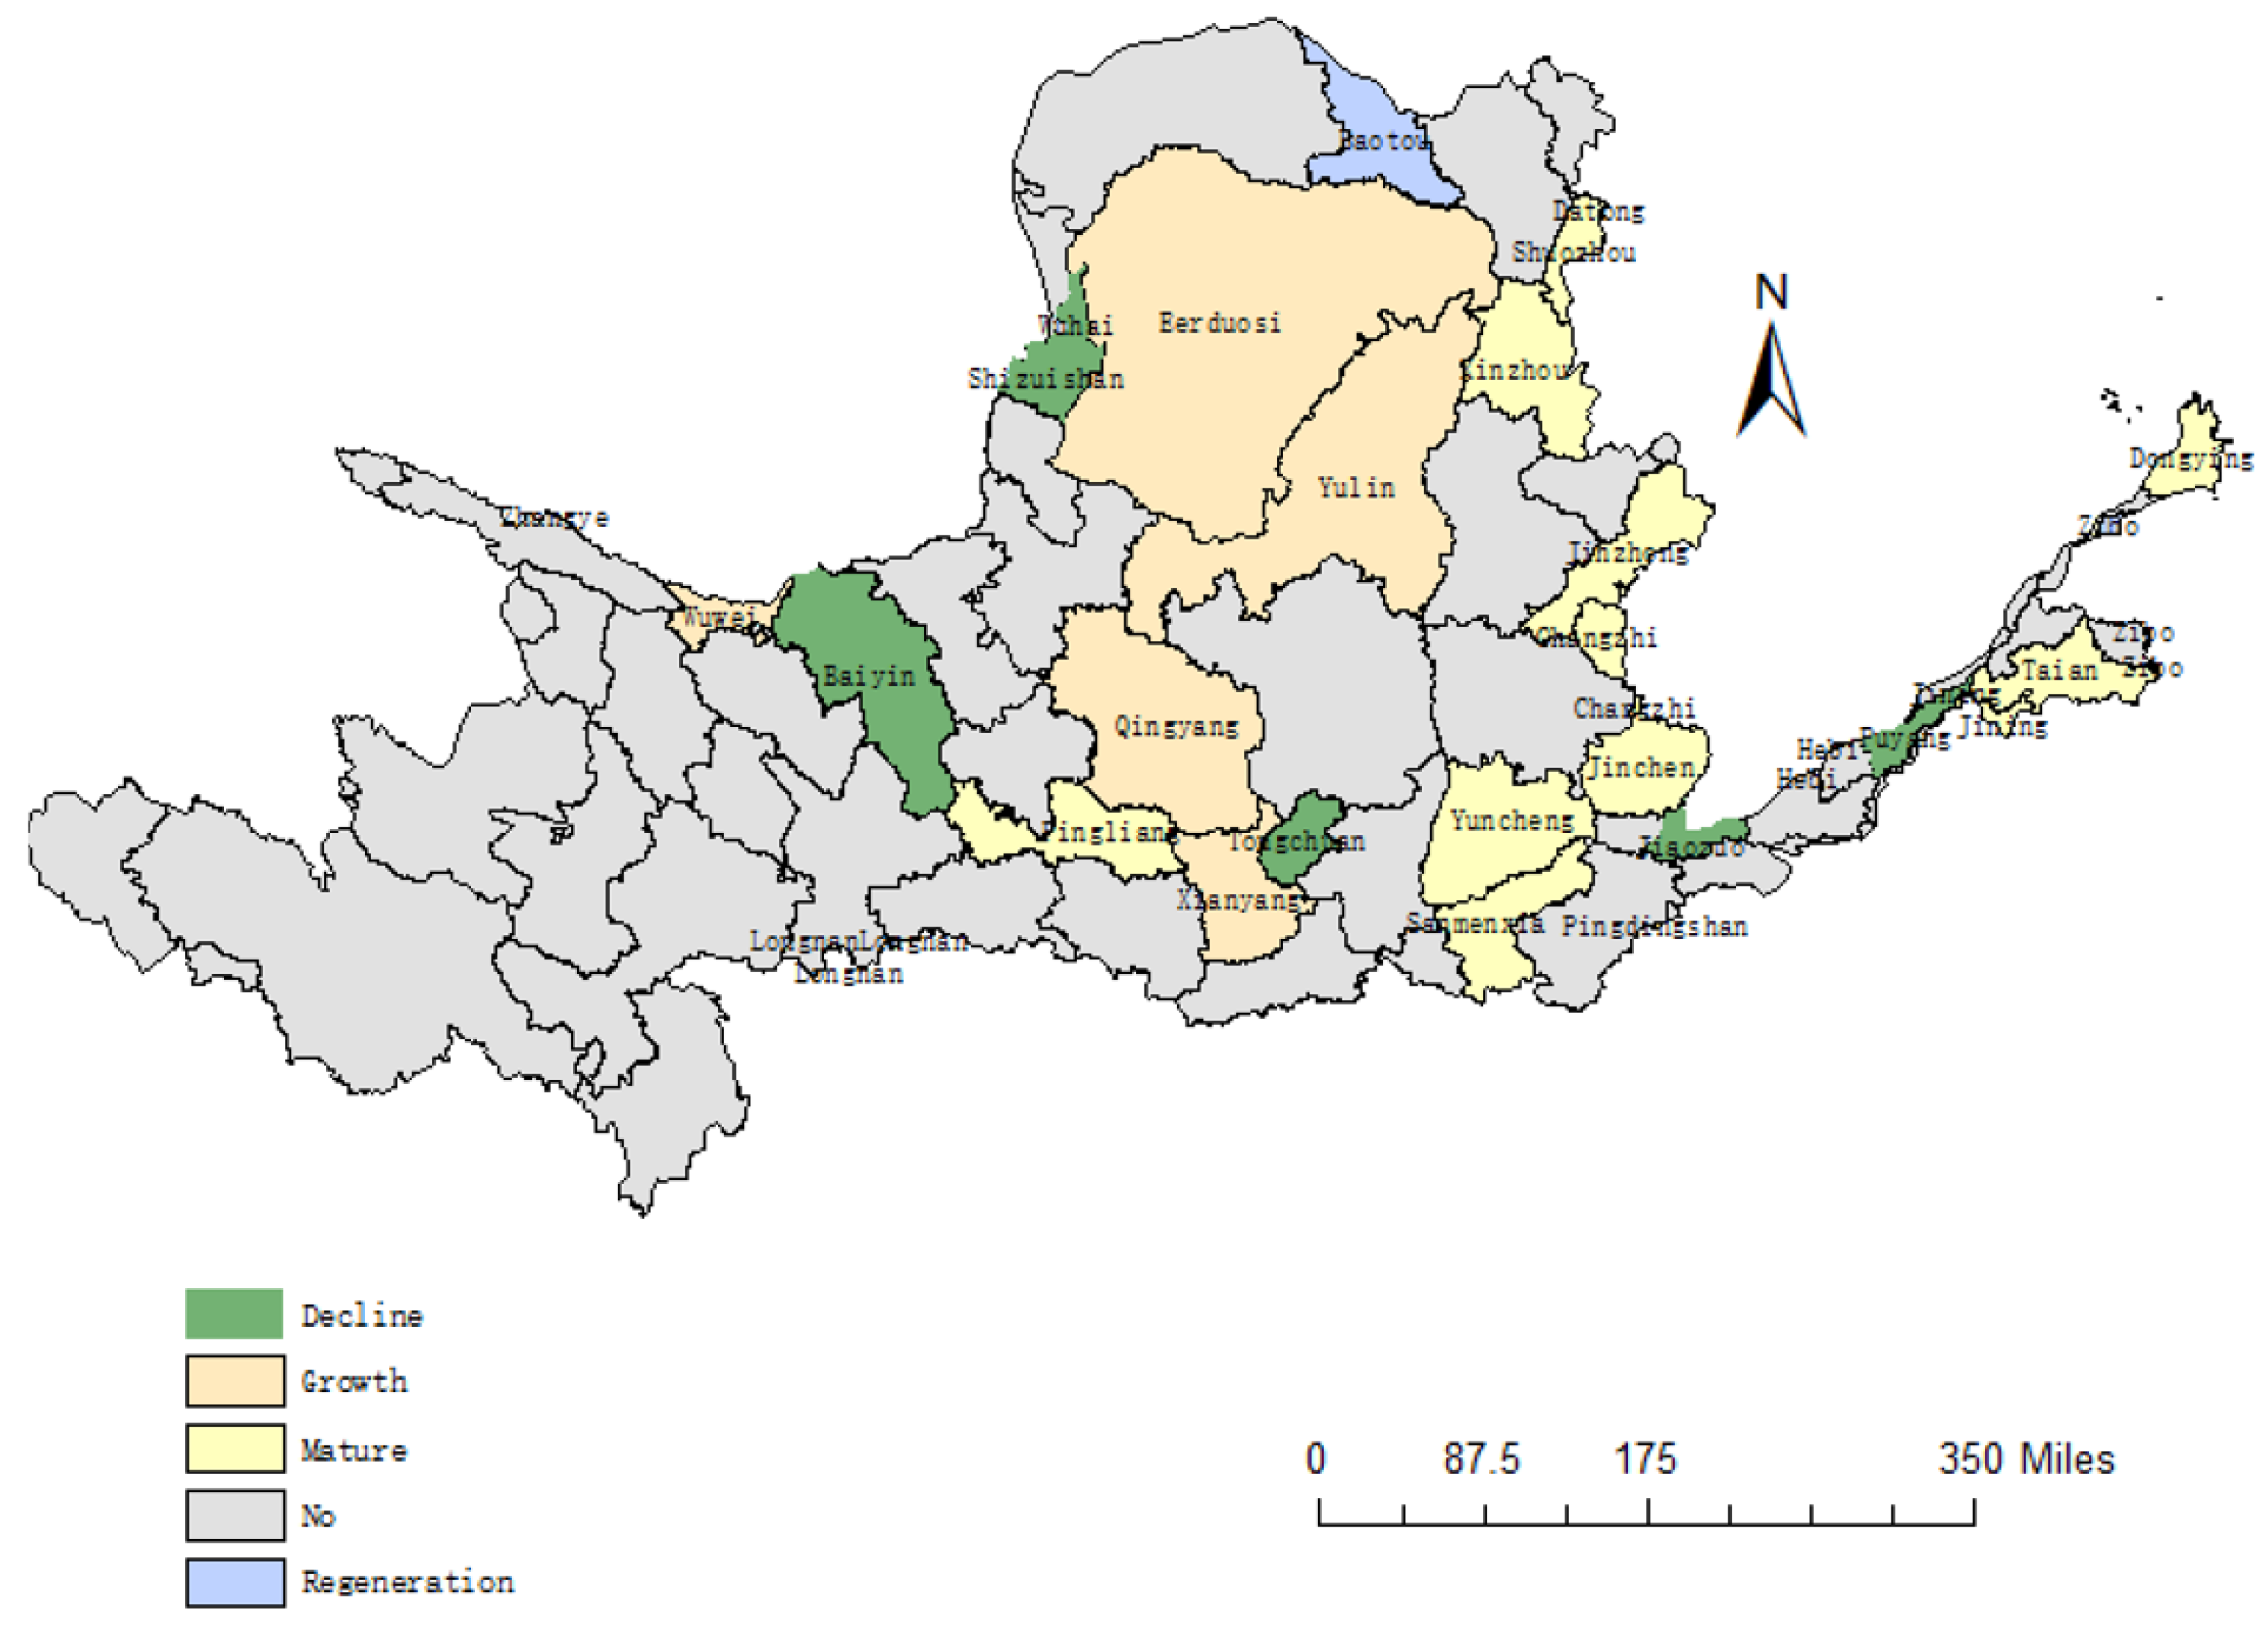
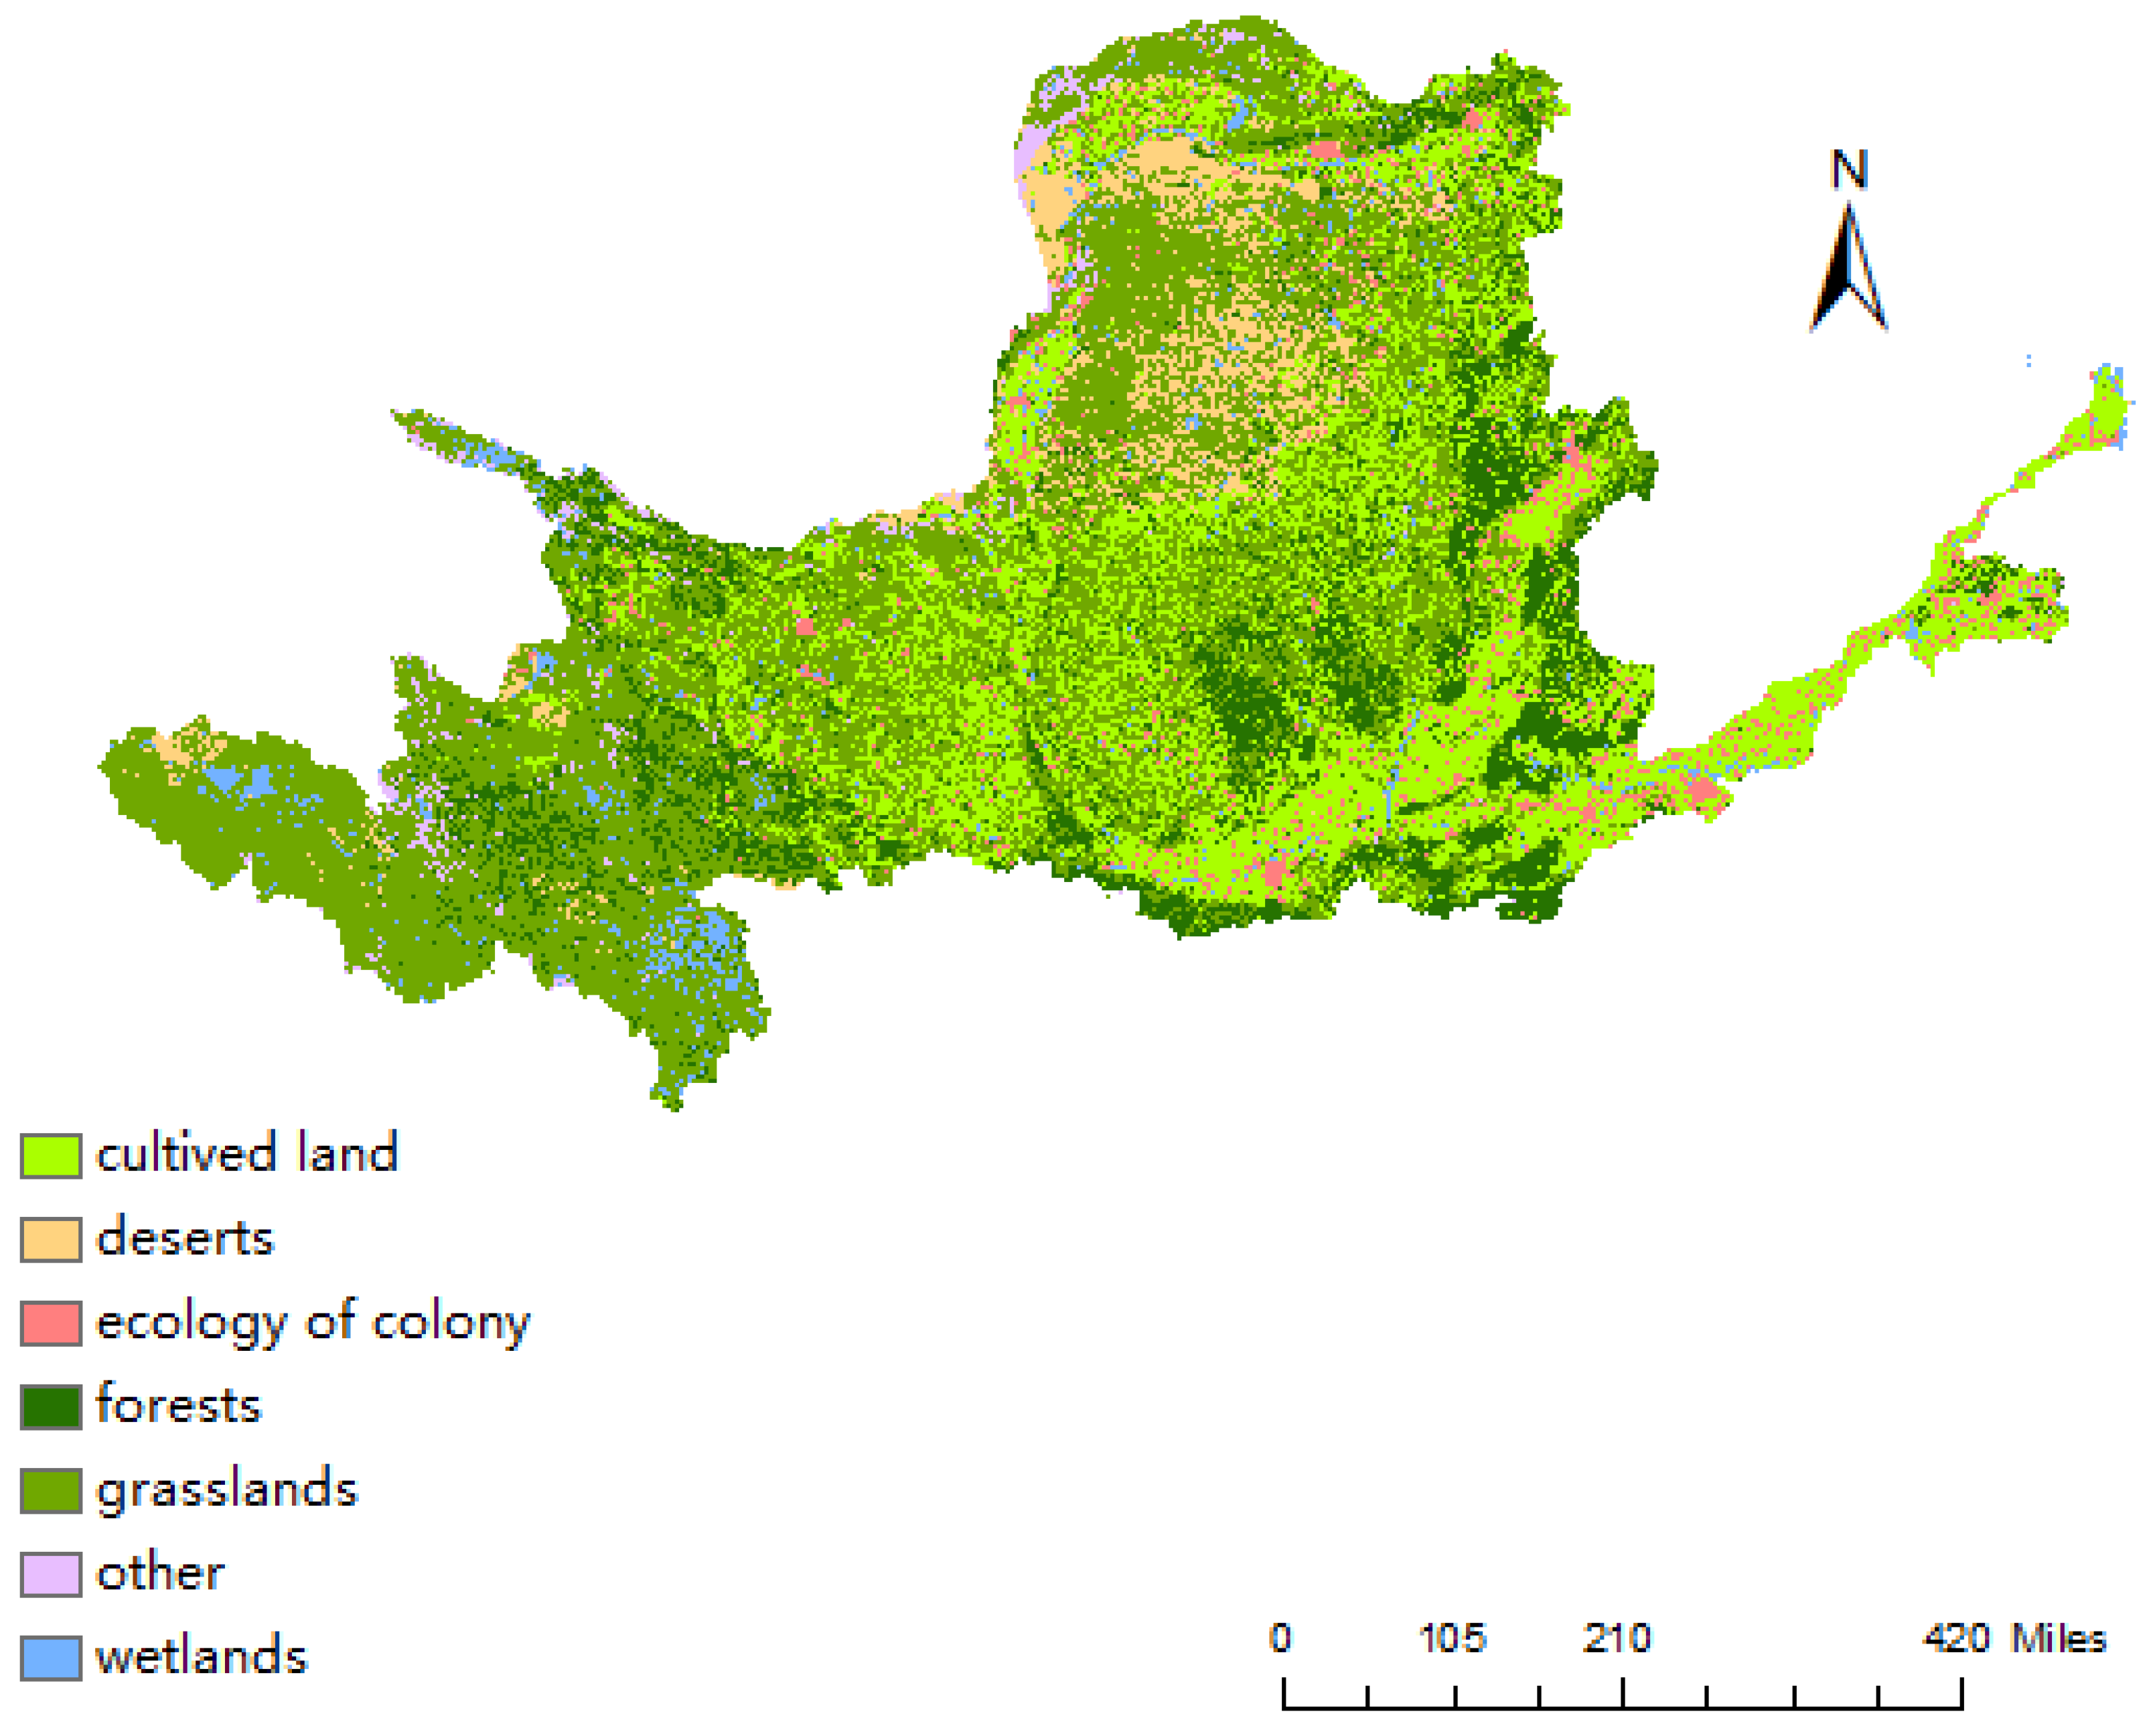
As shown in Figure 2, the ecological types of farmland, grassland, forest and wetland in the Yellow River Basin are unevenly distributed, the upper reaches of the Yellow River is the first stage of the Tibetan Plateau, rich in water, wetland and grassland ecosystems, and the middle reaches of the Yellow River are dominated by desert ecosystems, with landscapes such as the Hetao Plain, the Ordos Plateau, the Loess Plateau, the Fenwei Basin, the Qubuzi Desert and the Mao Wusu Sandy, etc., and this area is often subject to complex meteorology, with frequent occurrence of hydrological and sedimentary disasters, This area is characterized by frequent occurrence of complex meteorological, hydrological and sedimentary phenomena, frequent occurrence of natural disasters such as landslides and mudslides, active wind and sand landscapes, loose soil, broken topography, fragmented vegetation and severe soil erosion, and is the main occurrence of water and drought disasters along the Yellow River basin. The lower reaches of the Yellow River, from the Taihang Mountains east to the coastal area, are dominated by the North China Plain, with dense settlement ecosystems, concentrated industrial and mining enterprises, and vast areas of farmland. Growing resource cities are mainly distributed in the middle and upper reaches of the Yellow River basin, located along the Loess Plateau and the Fenwei Basin; mature resource cities are mainly distributed in the middle and lower reaches of the Yellow River basin, located in the declining resource cities, and regenerative resource cities are scattered, as shown in Figure 3.
According to the analysis of the principles of holism, nonlinearity and dynamics of complex science theory, the ecosystem and socio-economic development of resource cities in the Yellow River Basin have the following characteristics:
(1) The ecological types of resource-based cities in the Yellow River Basin are very different.
Complex science holds that the system is a whole, but there are imperfections and uncertainties in the whole. When the ecosystem is considered as a whole, there may be internal conflicts or disharmonies, but the carrying capacity of the ecosystem can resolve the external threats and pressures and bring the whole to a safe state. Conversely, if the carrying capacity of the ecosystem cannot withstand the threats and pressures, the whole ecosystem is in a dangerous state. Ecosystem integrity of the ecosystem is embodied in multi-dimensional coordination, including natural, social and economic coordination; coordination of different components of the ecosystem; coordination in the time dimension.
The ecological security of resource-based cities in the Yellow River Basin is different from that of cities. The Yellow River Basin is added to the ecosystem, so it is necessary to assess the impact of resource exploitation and related chemical industry development on the urban ecological carrying capacity of the city and the impact on the ecological carrying capacity of the Yellow River. Ecological protection and high-quality development in the Yellow River basin are important national strategies, and the efficiency of improving the quality of ecological barriers conflicts with resource development. In particular, the middle and upper reaches of the Yellow River are located in the Loess Plateau, with a fragile ecological environment, abundant oil and gas resources and a unified industrial structure, and there are many contradictions between economic and social development and ecological safety in resource-based cities. Sustainable development of resource-based cities is an important part of China's modernization, so it is necessary to analyze the ecological safety of resource-based cities in the Yellow River Basin from multiple dimensions.
(2) The process of resource exploitation that affects socio-ecological systems is not a linear one.
Under the framework of classical economic theory, resource scarcity is the root of promoting price increase and monopolizing economic development, forming the equilibrium theory of selfishness, while the theory of sustainable development pays more attention to social welfare and emphasizes the equilibrium of altruism. The ecological safety of resource-based cities in the Yellow River Basin needs to examine the environmental damage caused by resource exploitation and the impact of the Yellow River. For example, coal mining in the middle and upper reaches of the Yellow River affects the geological structure of the loess plateau, and with the development of cracks, it increases soil erosion, which is not conducive to the stability of plant roots. At the same time, the discharge of coarse sediments into the tributaries of the Yellow River increases, and the increase of heavy metals affects the ecological safety of the Yellow River. It can be seen that the mechanism affecting the ecological safety of resource-based cities in the Yellow River basin is complex. From a linear point of view, it is analyzed that nature provides infinite resources, and through the development of manufacturing industry, it provides production efficiency and production scale, and transforms resources into various products to meet human needs. This simple causal linear production analysis poses great threats to ecological security. Based on a comprehensive understanding of the state of ecological safety, non-linear thinking puts forward problems from different levels, different angles and different ways.
(3) Lack of clarity on the benefits of sustainable development policies for socio-ecological systems.
Complexity science holds that the time and space dimensions are superimposed to form a space-time structure that forms a self-organized synergy under the joint action of system function, system organization, and the relationship between the system and the environment. Self-organization can be understood as a functional coupling system that forms a steady state under the action of a feedback mechanism. Coupling includes information transmission path, maintaining steady state and feedback regulation depending on the analysis of coupling formation process, and the feedback relationship between different levels of ecological subsystems forms ecological behavior. The government ensures the smooth feedback between different levels of ecological subsystems and adjusts the steady state by formulating the overall ecological planning of river basins, using the overall planning, optimizing the industrial structure, innovating and promoting green development, so as to improve the self-organization synergy. The sustainable development plan of resource-based cities issued in 2013 puts forward the principles of classified guidance and characteristic development for different types of resource-based cities, and details the planning concepts of orderly development of resources, optimization of industrial structure and people's livelihood. The synergy between steady state and self-organization is in dynamic change, so the effectiveness of policies should be evaluated in time to ensure the dynamic stability of ecological safety.

3. Research Methodology

3.1. Calculation Model and Selection of Variables for the Ecological Safty Level

3.1.1. Indicator System

Based on the overall consideration of ecological safety, combined with the research results of existing scholars, this paper holds that resource-based cities rely on resource development to promote economic growth and social development. In the process of resource development and ecological restoration, the environment, economy and social development are in a relatively stable and safe state. Therefore, the ecological safety index system is constructed from three aspects: ecological pressure, ecological threat and ecological carrying capacity, as shown in Table 2. The impact of ecological pressure and ecological threat on ecological safety is negative, while ecological carrying capacity shows a positive ecological comprehensive management effect. In order to alleviate the difference between samples, this paper uses the range method to standardize the treatment, and adopts the 3-1 formula for the positive index and the 3-2 formula for the negative index.
S i , j = X i , j m i n X i m a x   X i m i n X i
S i , j = m a x X i X i , j m a x   X i m i n X i
Where, it is the original data, and it is the maximum and minimum value of the i-th index. X i , j m a x X i m i n X i

3.1.2. Ideal Point Ranking Evaluation Method

Based on the comprehensive evaluation of the actual level of ecological safety by the entropy weight method, the ideal point ranking (TOPSIS) model calculates the gap between the actual level and the ideal level by the ideal point ranking method, and comprehensively obtains the ecological safety index, which ranges from 0 to 1. The higher the index, the higher the ecological safety level.
The entropy weighting method is a kind of objective scoring method. The index weight is determined by two factors, one is the degree of index change, and the other is the influence of index change on the result. The greater the range of change range of the indicators, the greater the impact on the results, the higher the weight, and vice versa. Specific calculation formulae are shown in 3-3, 3-4 and 3-5.
F i , j = S i , j i = 1 m S i , j
E j = 1 l n m i = 1 m F i , j ln F i , j 0 E j 1
W j = ( 1 E j ) j = 1 n ( 1 E j )
Among them, it refers to the proportion of the value of the I-th evaluation object under the J index after standardization to the sum of the indices; refers to the information entropy of the item j index, which is obtained by calculation; is the weight of the J-th indicator. F i , j E j F i , j W j .
Under the multi-objective decision making of limited systems, TOPSIS comprehensively calculates the ecological safety level according to the distance between positive and negative ideal points in different years by measuring the gap between the ecological safety level and the ideal state. Specific calculation formulae are given in 3-6, 3-7, 3-8, 3-9 and 3-10.
V i , j = S i , j × W j      
V + = ( V i , j ) m a x   V = ( V i , j ) m i n                                    
D i + = j = 1 n V i , j V + 2
D i = j = 1 n V i , j V 2
C i = D i ( D i + + D i )
Among them, it refers to the weighted index matrix; Correct the ideal solution; Negative ideal solution; They refer to the distance between the evaluation of the actual urban ecological safety level and positive and negative ideal solutions; Refers to the calculated ecological safety index. V i , j V + V D i + D i C i .

3.2. Regional Differences in Ecological Safety Level: σ Convergence and β Convergence

In order to investigate whether the ecological safety level of resource-based cities in the Yellow River Basin has convergence, the methods of σ convergence and β convergence are adopted for analysis. Among them, σ convergence refers to the trend that the ecological safety level of different resource-based cities gradually deviates from the average value gradually with the passage of time, which is used to evaluate the convergence analysis of ecological common safety in the Yellow River Basin. It is a common method to calculate σ convergence of the coefficient of variation, and the basic formula is as follows:
σ i = 1 N i = 1 N ( C i , t C i ¯ ) 2 C i ¯
Among them, N represents the number of resource-based cities in the Yellow River Basin; It is the ecological safety level value of a resource-based city in the Yellow River Basin in a certain year; Average value of ecological safety water in resource-based cities. C i , t C i .
Beta convergence examines the change trend of ecological safety in different resource-based cities from the perspective of ecological safety growth rate, and beta convergence considers the conditional beta convergence of heterogeneous resource-based cities under the condition of control variables. It uses the classical β convergence influence difference analysis:
ln C i , t + 1 C i , t = α + β l n C i , t + k = 1 n θ k X k , i , t + ε i , t
Among them, it is the ecological safety level value of a resource-based city in the Yellow River Basin in a certain year; It refers to the growth rate of ecological safety level from t to t+1 in a resource-based city; K control variables; Refers to the regression coefficient of the control variables. If it is 0, it is conditional convergence and 0 is absolute convergence. If it is positive, it means that the ecological safety level tends to converge conditionally, otherwise it means that the ecological safety level diverges. According to the calculation results, the convergence rate s, T = 15 can be calculated in this paper. At the same time, the half-life cycle t can be calculated, which indicates the time needed for cities with low ecological safety level to catch up with cities with high ecological safety level. C i , t l n ( C i , t + 1 C i , t )   X k , i , t θ k θ k > θ k = β < 0 s = l n ( 1 + β ) T t = l n ( 2 ) s

3.3. Analysis of Factors Influencing the Level of Ecological Safety Level under Sustainable Development Policy

In 2013, China issued the sustainable development plan of resource-based cities. This paper takes Tc as the difference variable of ecological safety level to measure the change level of ecological safety of resource-based cities in the Yellow River Basin, and introduces the time dummy variable dt, which is set as dt=0 from 2006 to 2012 before the policy was issued, and dt=1 from 2013 to 2020 after the policy was issued; introduce a double difference model as shown in Formula 3-13:
T c i , t = β 0 + β 1 d u i , t + β 2 d t * k = 1 n β k X k , i , t + U i , t + ε
Among them, it represents the ecological safety difference in recent two years, dt and du are dummy variables of time and region, and dt* is an interactive item, which represents the difference of ecological safety in the last two years. T c i , t   X k , i , t .
In the development process of growth-type and mature resource-type cities, the contradiction between resource development intensity and ecological environmental protection is prominent, and the problems left by resource depletion in recession-type and regeneration-type resource cities are serious, which face the urgent need of industrial structure transformation and optimization development. Therefore, this paper selects the proportion of tertiary industry as the control variable of industrial structure transformation. In the process of transformation and development, the science and technology empowering green mining can effectively alleviate the contradiction between resource development and ecological environmental protection. At the same time, relying on science and technology for transformation and development is conducive to industrial upgrading and optimization of resource depleted cities and improving the quality of development. Therefore, this paper chooses the proportion of green inventions in the total number of inventions applied for annually as the control variable of science and technology transformation and development in resource-based cities. In the process of resource-based city development, the government's attention to environmental protection is of great significance to sustainable development. Therefore, this paper chooses the frequency of environmental protection words as the total number of words in the government work report as the control variable of environmental protection policy.

4. Empirical Analysis and Results

4.1. Statistical Analysis of the Ecological Safety Level

According to TOPSIS model, Table 3 shows the results in 2006 2013 and 2020, including D+ D- and the ecological safety level (C).
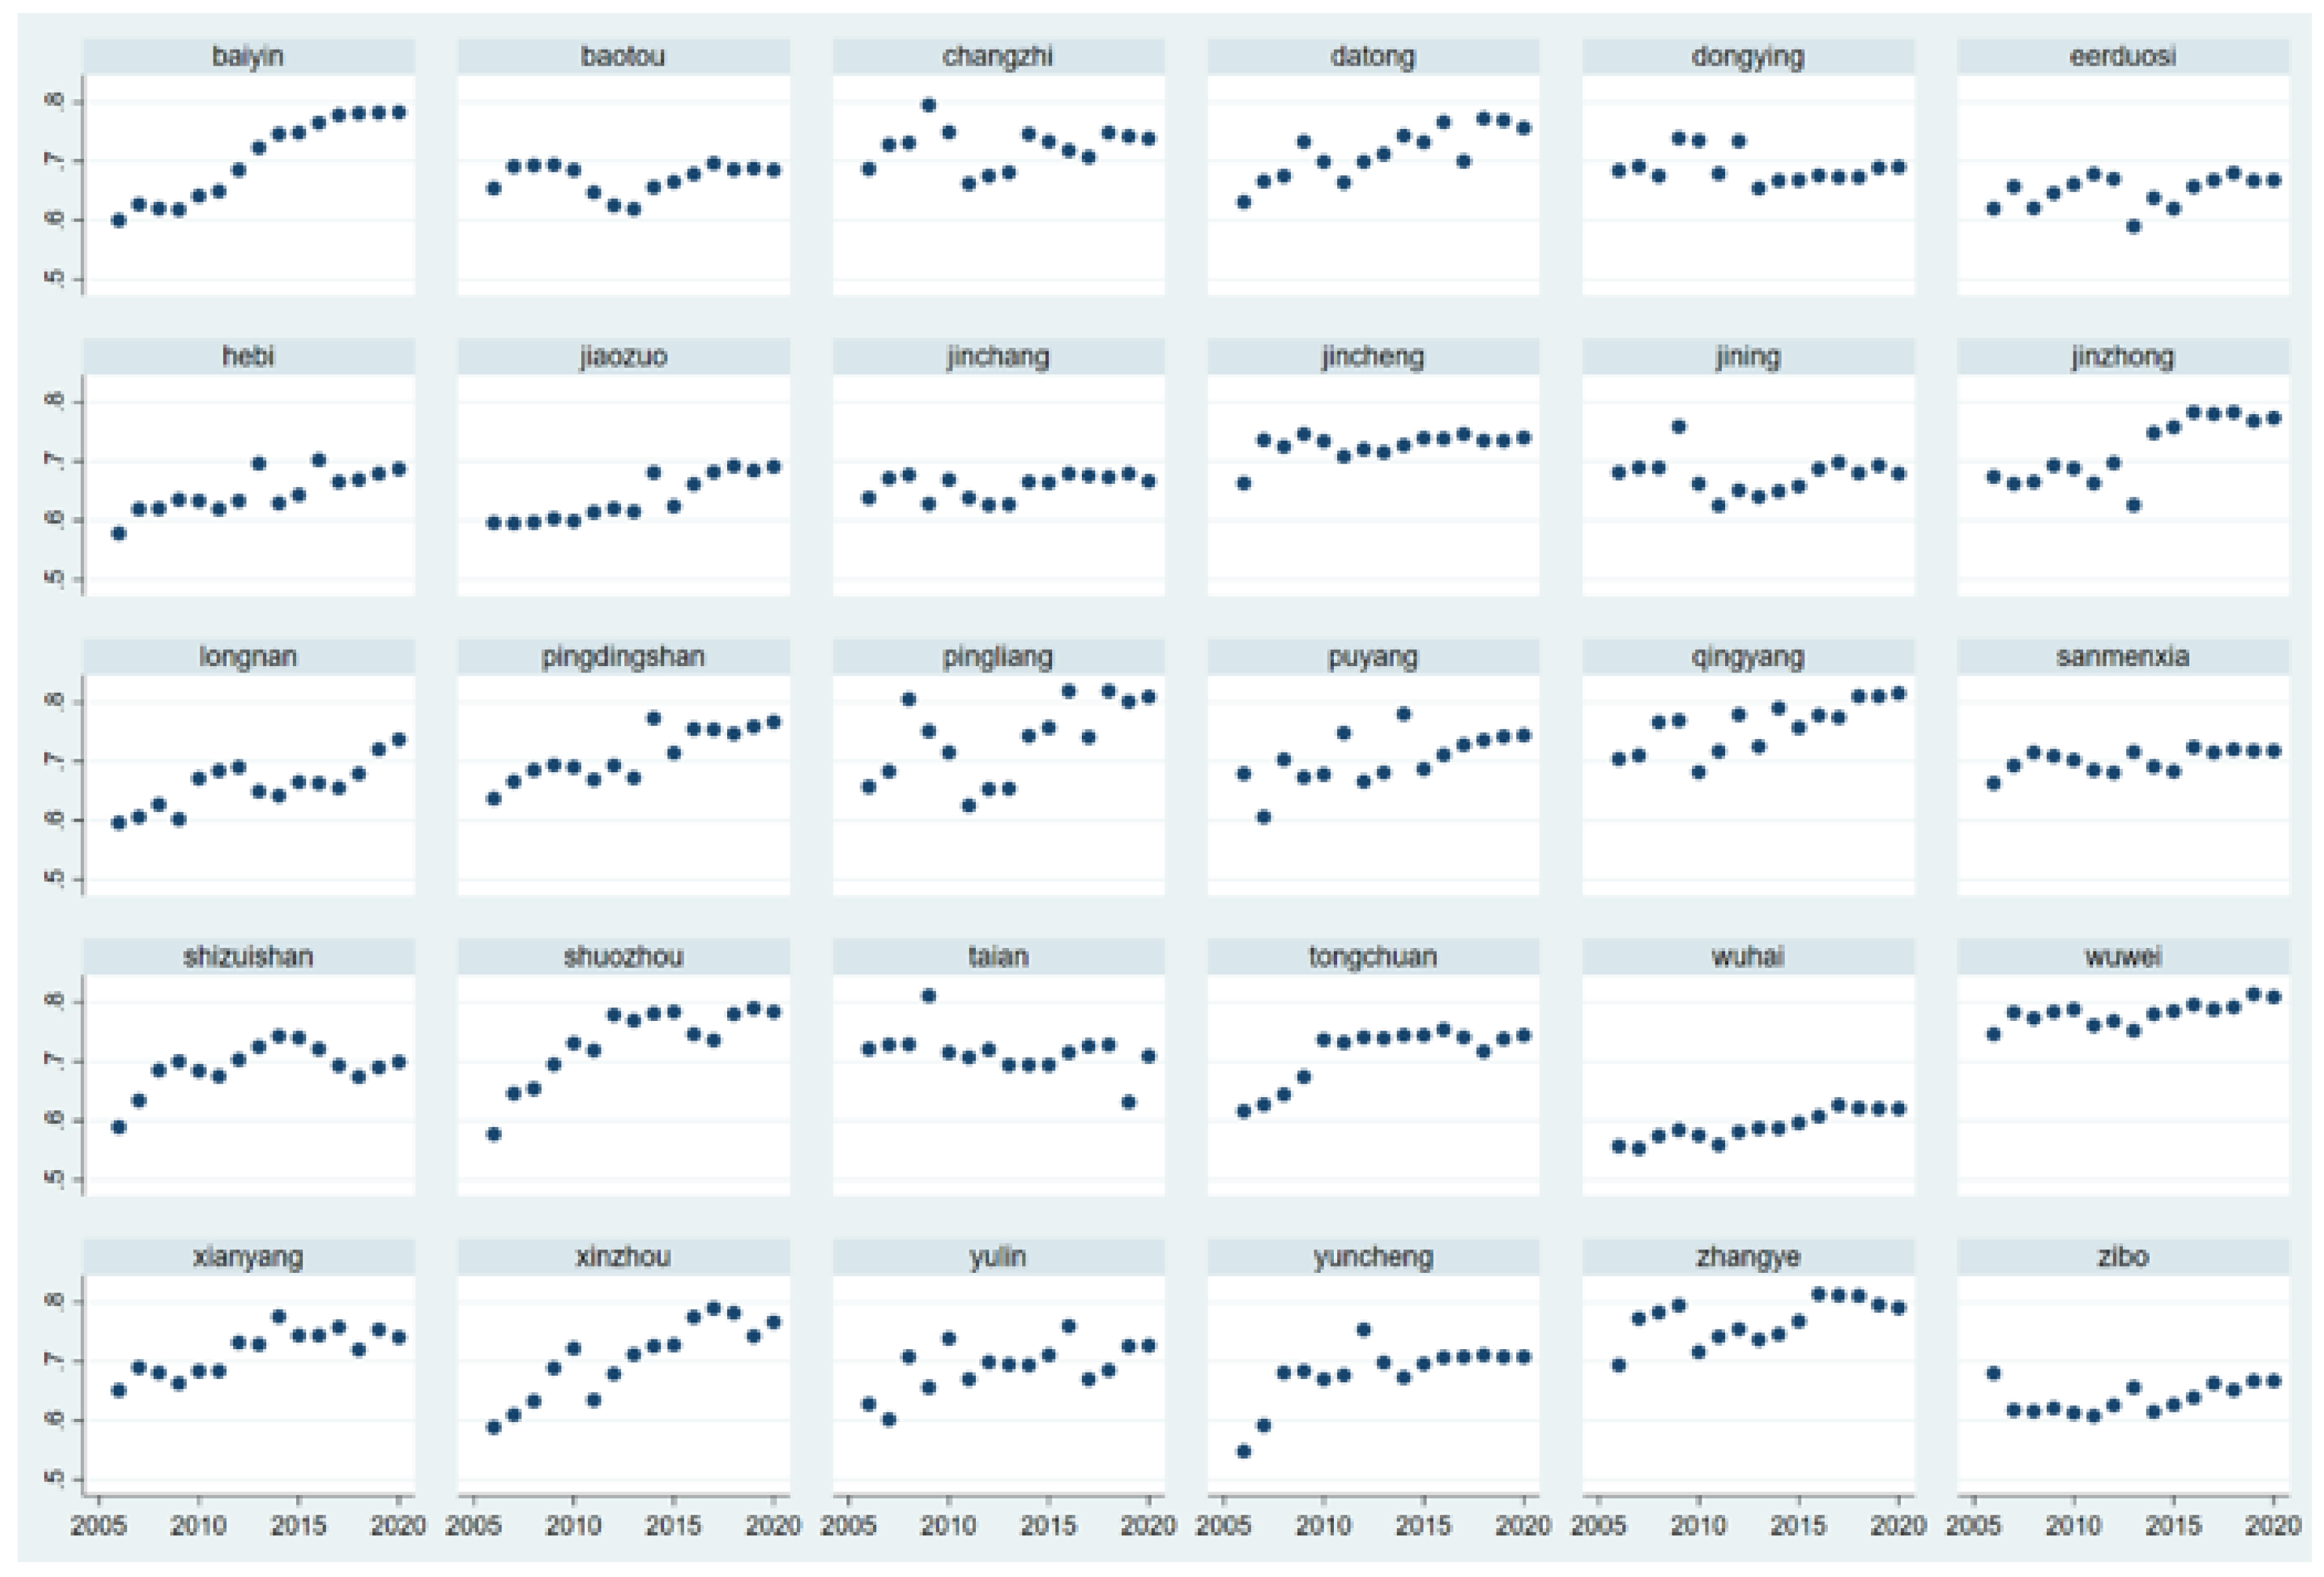
Figure 4 shows the ecological safety level of each resource-based city in the Yellow River Basin from 2006 to 2020. Generally speaking, the ecological safety level of resource-based cities in the Yellow River Basin is on a steady upward trend, and the ecological safety level is between 0.5 and 0.8. During the study period, the ecological safety level of some resource cities did not change significantly. The ecological safety level of Wuhai, a declining city, was low, ranging from 0.5 to 0.6, while that of Baotou and Zibo, a regenerating city, was turbulent, ranging 0.6 to 0.7, with no significant improvement. After the implementation of the plan in 2013, the ecological safety level of most cities shows a clear upward trend.
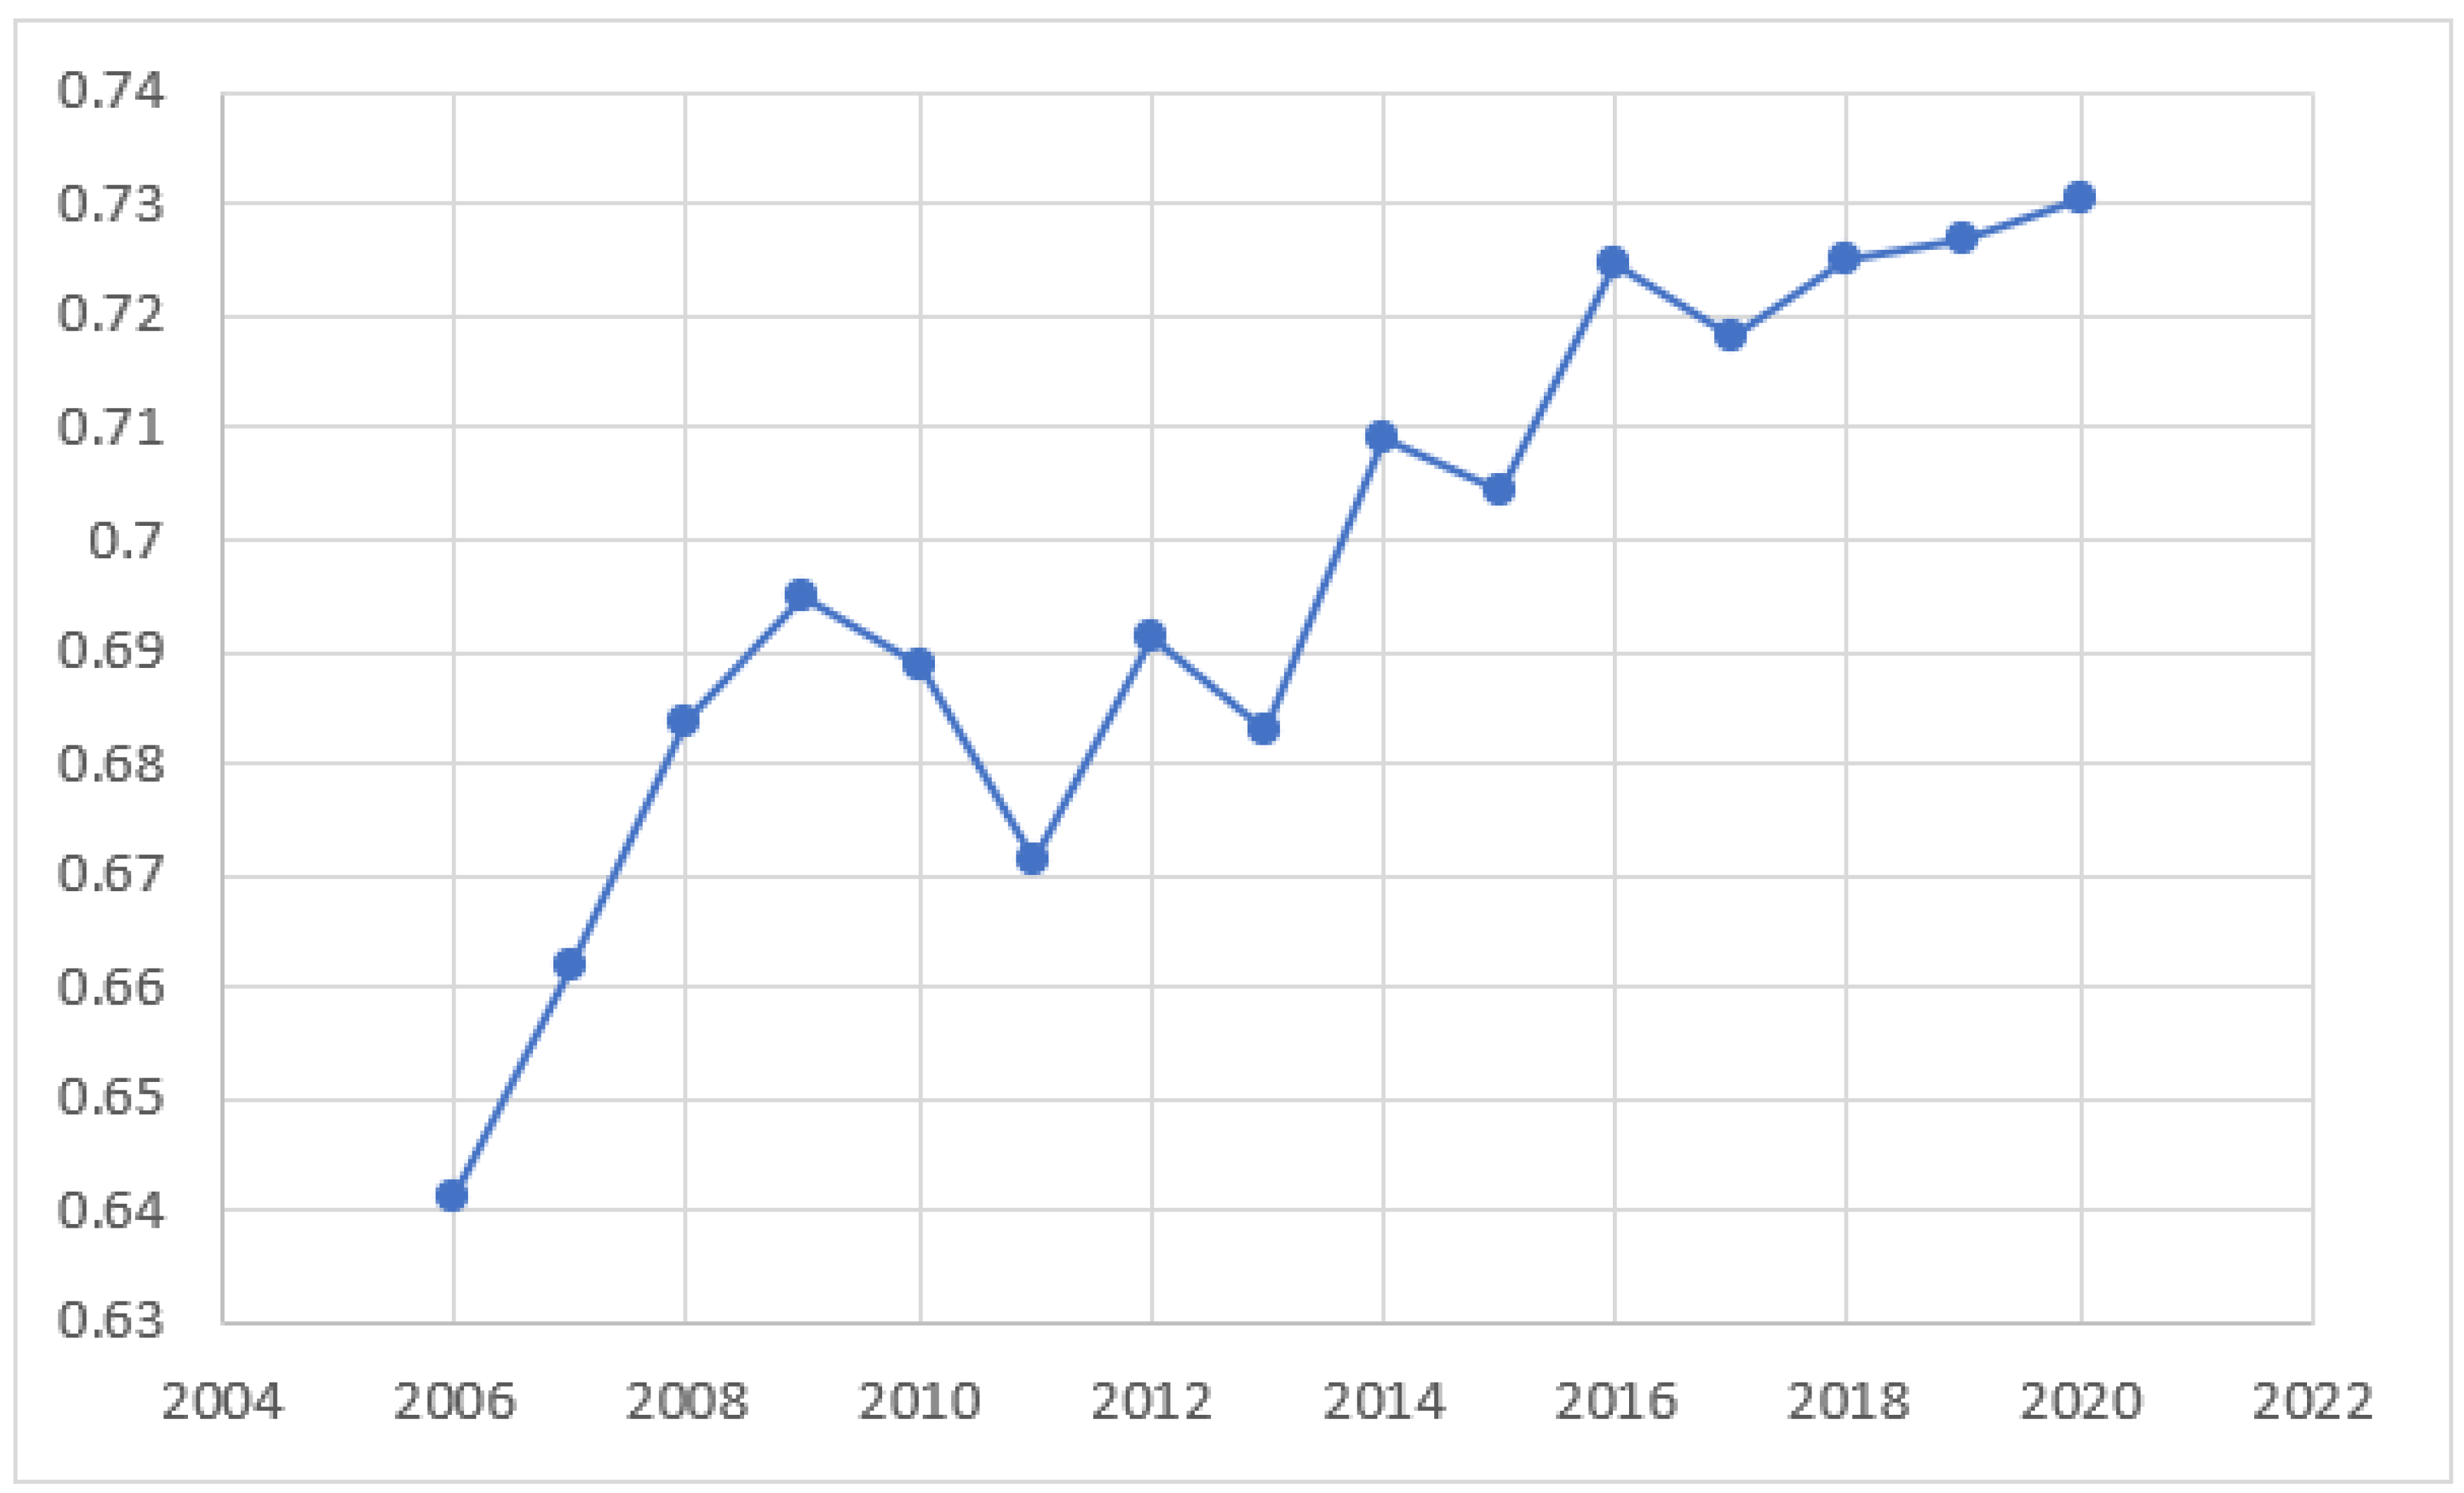
Figure 5 shows the average changes in the ecological safety level changes of resource-based cities in the Yellow River Basin over different years. Overall, the ecological level of resource-based cities in the Yellow River Basin is improving. It can be summarized into three phases: from 2006 to 2009, it was in a period of rapid improvement, from 2010 to 2013, it was in a period of horizontal adjustment, from 2014 to 2016, it was in a period of rapid recovery, and from 2017 to 2020, it was in a period of slow growth.
Before further discussing the influencing factors of ecological safety of resource-based cities in the Yellow River Basin, the ecological safety level, the proportion of control variables, the proportion of tertiary industry, the proportion of green inventions and the proportion of environmental protection words frequency are statistically analyzed, as shown in Table 4. The minimum value of ecological safety level is 0.548, the maximum value is 0.819, and the proportion of tertiary industry is 81.75% and 36.19%. The share of green inventions is generally low, with the maximum of 0.375. Some resource-based cities pay less attention to green inventions and environmental protection.

4.2. Verifying and Analyzing the Convergence of the Ecological Safety Level

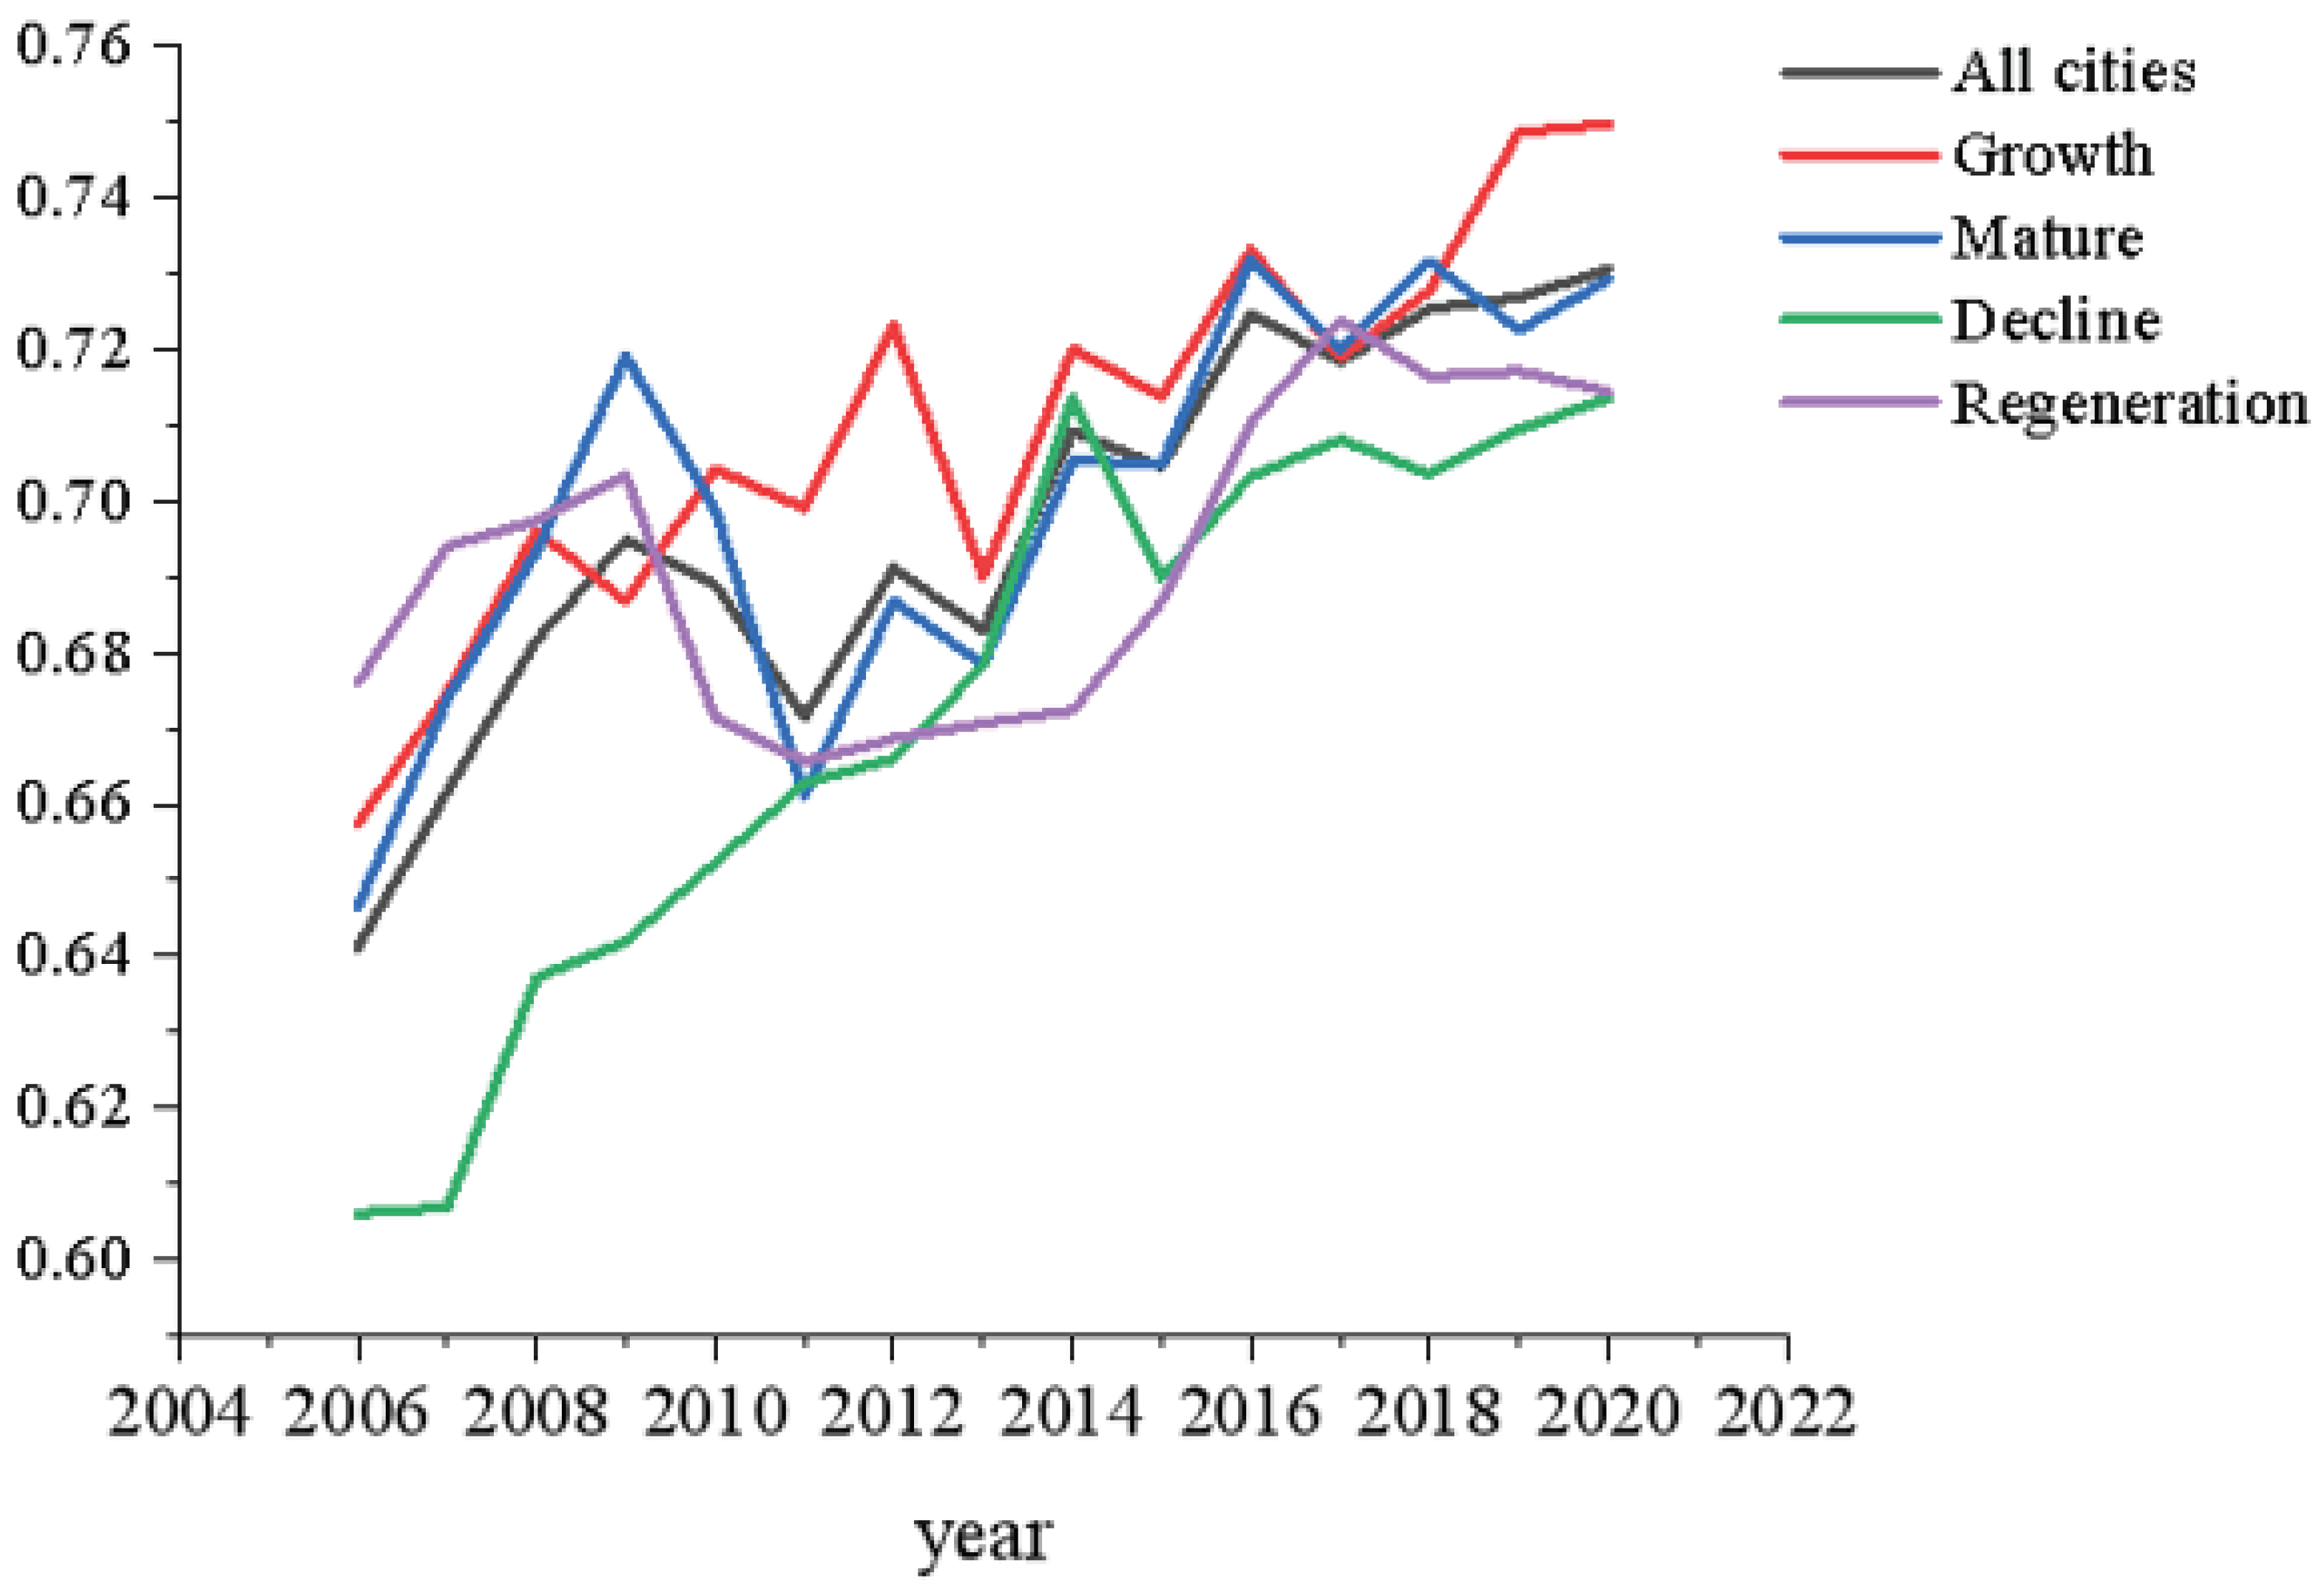
Figure 6 shows the convergence trend of ecological safety σ of resource-based cities in the Yellow River Basin. Overall, the difference is obvious, and the ecological safety level of resource-based cities in the Yellow River Basin changes significantly. However, different types of resource-based cities have different characteristics. The resource development of growth-based resource-based cities is in the initial rising stage, and the σ coefficient is obviously higher than that of other cities. By standardizing the order of resource development and limiting the intensity of resource development the level of ecological safety can be effectively improved; the resource development of mature resource-based cities is in the stable development stage, the downstream industrial chain of resource development continues to expand, and the industrial structure is optimized and upgraded. As shown by the blue line in the figure, it is in a period of rapid change from 2006 to 2012, first increasing and then decreasing, and after 2013, it is in a period of steady increase; the ecological safety level of declining resource-based cities started low, but the growth rate was higher than that of other cities; the ecological safety level of renewable resource-based cities fluctuates widely, and the ecological safety level is at a low point from 2008 to 2016. The growth range of σ coefficient of resource-based cities in the Yellow River Basin is about 0.1, indicating that the overall ecological safety is in an upward convergence trend, but the growth rate is limited. The ecological safety level of different resource-based cities is quite different in 2006, and the difference is obviously reduced in 2020. On the whole, growth-based resource-based cities pay more attention to the protection of ecological safety, while the ecological safety level of renewable resource-based cities is not significantly developed.
Table 5 shows the convergence test results of the ecological safety β conditions of the resource-based cities in the Yellow River Basin. The overall lnC coefficient of the Yellow River Basin is negative, indicating that the ecological safety level of resource-based cities in the Yellow River Basin has a convergence trend, with a convergence rate of 0.156, a half-life cycle of 4.44 and a fitting degree of 0.8212. Growth resource-based cities with low ecological safety level need 8 years to catch up with cities with high ecological safety level. The growth resource-based cities of Wuwei, Qingyang, Longnan, Erdos, Xianyang and Yulin are all located on the Loess Plateau in the middle and upper reaches of the Yellow River. Under arid and semi-arid natural conditions, the loess texture is loose, the rainfall is concentrated and intense, and the problems of soil erosion, soil aggradation and siltation of rivers, lakes and reservoirs are serious. As a result of resource exploitation, industrial water has greatly increased, exceeding the carrying capacity of local water resources, leading to drought and water shortage. From the perspective of control variables, the proportion of tertiary industry and the word frequency indicators environmental protection have passed the significance test of 10% and 5%, respectively, which has a significant impact on growth-oriented and mature resource-based cities. The proportion of tertiary industry increased by 1%, the ecological safety level of growth resource-based cities increased by 4.9%, and that of mature resource-based cities increased by 3.74%. The emphasis on environmental protection increased by 1%, the ecological safety level of growing resource-based cities decreased by 2.7%, while the ecological safety level of mature resource-based cities increased by 0.88%.

4.3. Analysis of Factors Influencing the Difference in Ecological Safety Level under Sustainable Development Policy

In 2001, the State Council set up a pilot project for the transformation and development of resource-depleted cities in Fuxin, Liaoning Province. In 2008, 69 pilot projects for the transformation and development of resource-poor cities were reviewed nationwide. In 2013, the National Plan for the Sustainable Development of Resource-exhausted Cities was issued, and 262 resource-exhausted cities were identified. Focusing on the problems faced by resource-based cities, such as irregular resource development order, "one industry dominates", people's livelihood and environment left by history, this paper puts forward the sustainable goals and mechanisms of resource-based cities, focusing on guiding the scientific development of resource-based cities by classification, developing resources in an orderly way, adjusting industrial structure, improving people's livelihood, strengthening environmental governance and ecological protection, etc. It is the first national plan for the development of resource-based city. In this paper, the DID model is used to make a comparative study of the ecological safety level of resource-based cities in the Yellow River Basin before and after planning, and the results are shown in Table 6.
Given the characteristics of resource-based cities in China, the 2013 Plan focuses on improving the classification and guiding the scientific development of various cities, targeting the optimization of the industrial structure, rational development and utilization of resources, and promoting the social development of resource-based cities. The response of various cities to the plan is highlighted in the optimization of industrial structure. Through the empirical results of the DID model, Table 5 shows that increasing the proportion of tertiary industry has a significant effect on improving the ecological safety of all resource-based cities after the introduction of the planning. Compared with the analysis of the above β influencing factors above, the proportion of tertiary industry has no significant impact on the ecological safety of declining and renewable resource-based cities from 2006 to 2020, but it has a significant impact on the ecological safety of declining and renewable resource-based cities from 2013 to 2020.

5. Conclusions and Recommendations

The ecological safety level of resource-based cities in the Yellow River Basin is measured by the TOPSIS model, and σ convergence and β convergence analyses are carried out to distinguish the ecological safety differences of different types of resource-based cities, compare the ecological safety differences before and after the introduction of the sustainable development plan of resource-based cities in 2013, and clarify the response characteristics of resource-based cities in the Yellow River Basin to the plan. The main conclusions are as follows:
(1) The ecological safety level of resource-based cities in the Yellow River Basin is generally good, with an increasing trend. The ecological safety level and development trend of various resource-based cities in the Yellow River Basin are significantly different according to the σ convergence test. The reason is that the resources of declining resource-based cities are developed earlier and the awareness of ecological safety is low, so the overall ecological safety level is low. With the extension of the industrial chain, the degree of coupling of ecological pressure, ecological threat and ecological carrying capacity is high in mature resource-based cities, and the ability of ecological safety prevention and control is relatively high. However, the growth-oriented resource-based cities have certain ecological safety plans for in the early stage of resource development, so the ecological safety level is relatively high.
(2) The sustainable development policy for resource-based cities is beneficial to reduce the gap in ecological safety level among resource-based cities in the Yellow River Basin, but it has a limited inpact on the overall ecological safety level. The optimization of the sustainable development policy can promote the high-quality construction of resource-based cities, but the policy content should be further refined, and a variety of mechanism linkage modes such as industrial structure optimization and green innovation development should be constructed.
Through the above research, taking the Yellow River Basin as a case, combined with the city classification basis in the sustainable development planning of resource-based cities, the influencing factors of ecological safety level and the changes of ecological safety before and after the policy are classified and evaluated, and the following policy suggestions are put forward to further improve the ecological safety of the Yellow River Basin and promote the "common ecological safety of the basin": 1. Improve the sustainable development mechanism of ecological safety in the Yellow River Basin. Carry out pilot ecological evaluation of green exploitation in river basins, evaluate the ecological safety of the whole industrial chain of resource exploitation, promote green innovation, improve the efficiency of dual-chain integration development, and compensate for the ecological threat of resource exploitation. 2. Improve the dynamic monitoring mechanism of ecological safety in the Yellow River basin. Based on the monitoring base of hydrological stations in the tributaries of the Yellow River, the dynamic monitoring mechanism of ecological safety in resource-based cities is established, and the ecological emergency response will be improved. 3. Improve the reward and subsidy policy for ecological evaluation in the Yellow River basin. Establish a financial ecological compensation policy for the Yellow River Basin, improve the ecological reward and punishment measures in the upper, middle and lower reaches, and clarify the ecological safety assessment indicators and the reward and punishment system.

References

  1. Peng, S.; Bi, Y. Key technologies and strategic thinking of ecological environment restoration in coal mining areas of Yellow River Basin. J. Coal Sci. 2020, 45, 1211–1221. [Google Scholar]
  2. Time, R.H.; Qiao, L.; et al. Study on high-quality development of coal in Yellow River Basin. Coal Econ. Res. 2020, 40, 36–44. [Google Scholar]
  3. Bian, Z.; Yu, H.; Lei, S.; et al. Study on coal resources development strategy and ecological restoration strategy in the Yellow River Basin. J. Coal Sci. 2021, 46, 1378–1391. [Google Scholar]
  4. Hu, Z.; Zhao, Y. Principle and technical method of coordinated control of ecological environment and Yellow River sediment in mining areas of Yellow River Basin. J. Coal Sci. 2022, 47, 438–448. [Google Scholar]
  5. Yao, W.; Jiao, P. Spatial equilibrium analysis of comprehensive management of soil and water conservation in the Yellow River Basin. J. Soil Water Conserv. 2023, 37, 1–7. [Google Scholar]
  6. Wu, G.; Zheng, D.; Yin, W.; et al. Expert talk: Construction of comprehensive observation system of natural resources elements from the perspective of multidisciplinary integration. Resour. Sci. 2020, 42, 1839–1848. [Google Scholar]
  7. Deng, X.; Yang, K.; Shan, J.; et al. Urban agglomeration and industrial transformation and development in the Yellow River Basin. J. Nat. Resour. 2021, 36, 273–289. [Google Scholar] [CrossRef]
  8. Xiao, P.; Lu, X.; Zhang, P. Research progress and achievements of soil and water conservation in the Yellow River Basin. China Soil Water Conserv. 2020, 6’9+82. [Google Scholar]
  9. Stoner, J.D. Probable Hydrological Effects of Subsurface Mining. Groundw. Monit. Remediat. 2010, 3, 128–137. [Google Scholar] [CrossRef]
  10. Li, T.; Li, W.; Sun, Y. Recovery prediction of phreatic water level in near shallow coal seam mining in semi-arid mining area. J. China Univ. Min. Technol. 2011, 40, 894–900. [Google Scholar]
  11. Wang, Z.; Kuan, Y.C.; Lu, Y. Application of remote sensing monitoring of water pollution in typical coal mining areas in western China. J. Ecol. Rural Environ. 2019, 35, 538–544. [Google Scholar]
  12. Adhikary, D.P.; Guo, H. Modelling of Longwall Mining-Induced Strata Permeability Change. Rock Mech. Rock Eng. 2015, 48, 345–359. [Google Scholar] [CrossRef]
  13. H, Q.; Du, J.; Hou, E.; et al. Study on the development law and formation mechanism of overlying strata and surface fractures in shallow coal seams. J. Min. Saf. Eng. 2019, 36, 7–15. [Google Scholar]
  14. Wei, J.; Wang, S.; Song, S.; et al. Numerical simulation of evolution law of overburden fracture and surface fracture in trench mining of shallow coal seam. Coalf. Geol. Explor. 2022, 50, 67–75. [Google Scholar]
  15. Liu, Q.; Cai, X.; Liu, J.; et al. Variation characteristics and genetic analysis of water-sediment relationship in Kuye River basin of the middle reaches of the Yellow River. Res. Soil Water Conserv. 2022, 29, 68–74. [Google Scholar]
  16. Zhang, D.; Cao, Y.; Zhao, Z.; et al. Influence of coal mining activities on dissolved sulfate in Kuye River basin in the middle reaches of the Yellow River. J. Earth Sci. Environ. 2023, 1–13. [Google Scholar]
  17. Kesler, S.E. Mineral Resources, Economics and the Environment; Macmillan College Publishing Company: New York, NY, USA, 1994. [Google Scholar]
  18. Costanza, R.; Folke, C. Valuing ecosystem services with efficiency, fairness and sustainability as goals. Nature’s Serv. Soc. Depend. Nat. Ecosyst. 1997, 49–70. [Google Scholar]
  19. Aigbedion, I.; Iyayi, S.E. Environmental effect of mineral exploitation in Nigeria. Int. J. Phys. Sci. 2007, 2, 33–38. [Google Scholar]
  20. Maxim, L.; Joachim, H. An analysis of risks for biodiversity under the DPSIR framework. Ecol. Econ. 2009, 69, 12–23. [Google Scholar] [CrossRef]
  21. Yu, J.; Fang, L.; Cang, D.; et al. Application of entropy weight fuzzy matter-element model in land ecological safety evaluation. J. Agric. Eng. 2012, 28, 260–266. [Google Scholar]
  22. Cao, G.; Liu, Y.; Zhang, Z.; et al. Construction and application of two-dimensional early warning model of land ecological safety-a case study of Linxiang city. Environ. Sci. China 2022, 42, 2305–2314. [Google Scholar]
  23. Cui, X.; Fang, L.; Wang, X.; et al. Study on ecological safety evaluation of Yangtze River Delta urban agglomeration based on DPSIR model. Acta Ecol. 2021, 41, 302–319. [Google Scholar]
  24. Sodhro, A.H.; Pirbhulal, S.; Luo, Z.; de Albuquerque, V.; Hugo, C. Towards an optimal resource management for IoT based green and sustainable smart cities. J. Clean. Prod. 2019, 220, 1167–1179. [Google Scholar] [CrossRef]
  25. Liu, S.; Yang, H. Study on Ecological Environment Evaluation Index System of Resource-based Cities—Based on the Development Background of Big Data. Econ. Forum 2017, 559, 135–139. [Google Scholar]
  26. Lu, G.; Pang, X.; Hou, J.; et al. Evaluation and prediction of ecological safety in Shizuishan city based on PSR model. J. Saf. Environ. 2023, 1–10. [Google Scholar]
  27. Zhao, X.; He, G. Research progress of driving force-pressure-state-impact-response analysis framework based on CiteSpace. Acta Ecol. 2021, 41, 6692–6705. [Google Scholar]
  28. Ness, B.; Anderberg, S. Structuring problems in su-stability science: The multi-level DPSIR framework Geoforum. 2010, 41, 479–488. [Google Scholar]
  29. Tagiltseva, J.A.; Drozdov, N.A.; Kuzina, E.L. Monitoring society-ecological-economic safety of management environmental decisions. In Proceedings of the 2017 IEEE Russia Section Young Researchers in Electrical and Electronic Engineering Conference, ElConRus 2017, 24 April 2017; pp. 1366–1370. [Google Scholar]
  30. Li, Q.; Ji, Z.; Zhang, H. Study on temporal and spatial evolution law of coordinated development of EES in coal mining subsidence area of Shanxi Province. Min. Saf. Environ. Prot. 2021, 48, 123–128. [Google Scholar]
  31. Shi, X.; Yang, L. Evaluation of sustainable development and analysis of systematic coordinated development in the Yellow River Basin from 2008 to 2018. Bull. Soil Water Conserv. 2021, 41, 260–267. [Google Scholar]
  32. Du, Y. Study on Evaluation Index System of Ecological Civilization Construction in Resource-based Cities in China. Theory Mon. 2014, 388, 138–142. [Google Scholar]
  33. Chen, D.; Wang, R. Study on the Difference Evaluation of Ecological Civilization Development Level in Mining Cities in China. Ecol. Econ. 2016, 32, 212–217. [Google Scholar]
  34. Liu, J.; Zheng, Y.; Wang, X. Analysis on the construction of ecological environment quality evaluation index system in coal mining areas. Agric. Disaster Res. 2014, 4, 50–53. [Google Scholar]
  35. Zhang, H.; Wang, A.; Song, B. Study on Land Ecological Safety Evaluation of Dali City Based on OWA. Geogr. Sci. 2017, 37, 1778–1784. [Google Scholar]
  36. Bao, Y.; Zhang, H. Evaluation of land ecological safety in Yunnan Province based on CRITIC weighted grey target model. Shanghai Land Resour. 2020, 41, 48–53. [Google Scholar]
  37. Li, B.; Shi, X. Analysis of Sustainable Development Ability of Resource-based Cities Based on Ecological Footprint—A Case Study of Jincheng City, Shanxi Province. Res. Soil Water Conserv. 2016, 23, 255–261. [Google Scholar]
  38. Wu, G.; Fu, S.; Yang, Y.; et al. Analysis of ecological footprint and carrying capacity changes in Yan’an city from 2006 to 2014. Res. Soil Water Conserv. 2018, 25, 259–264. [Google Scholar]
  39. Xin, B.; Niu, J.; Wang, F.; et al. "2 +26 "Urban Eco-efficiency Evaluation and Influencing Factors-Based on Three-stage DEA and Bootstrap-DEA Model. J. Hebei Univ. Geosci. 2023, 46, 99–109. [Google Scholar]
  40. Shi, H.; Tian, L. Ecological safety evaluation of mining area based on ANP and sensitivity analysis of index weight. J. Hebei Univ. Eng. (Nat. Sci. Ed.) 2020, 37, 75–81. [Google Scholar]
  41. Fan, D.; Deqin, Q.Y.; Sun, Y. Ecological environment assessment of Shenfu mining area based on remote sensing ecological index. Surv. Mapp. Bull. 2021, 532, 23–28. [Google Scholar]
  42. Hao, L.; Sun, G. Review on the influence of urbanization on ecological and hydrological processes in river basins. Acta Ecol. 2021, 41, 13–26. [Google Scholar]
  43. Sun, H.; Wei, X.; Sun, X.; et al. Benchmark and model for ecological risk assessment of heavy metal pollution in soil of small watershed in mountainous area. Geol. China 2023, 1–15. [Google Scholar]
  44. Huang, Y.; Guo, Y.; Qi, W.; et al. Evolution law and degradation mechanism of surface vegetation coverage damaged by mining in typical ecologically fragile mining areas in western China. Acta Coal Sin. 2022, 47, 4217–4227. [Google Scholar]
  45. Wu, Y.; Zhao, T.; Liu, D. Study on Urban Ecological Safety under the Background of New Urbanization--A Case Study of Tongchuan City. Renew. Resour. Circ. Econ. 2023, 16, 8–11. [Google Scholar]
  46. Wang, Y.; He, G.; Ruan, J. Study on Temporal and Spatial Evolution and Obstacles of Regional Ecological Safety from the Perspective of New Urbanization-A Case Study of Anhui Province. J. Shijiazhuang Tiedao Univ. (Soc. Sci. Ed.) 2022, 16, 16–23. [Google Scholar]
  47. Bhandari, K.S.; Cho, G.H. Resource Oriented Topology Construction to Ensure High Reliability in IoT Based Smart City Networks. Int. J. Syst. Assur. Eng. Manag. 2020, 11, 798–805. [Google Scholar] [CrossRef]
  48. Wu, Y.; Wei, Z.; Wang, A. Study on ecological safety assessment and influencing factors of Yellow River basin based on DPSIR model. Bull. Soil Water Conserv. 2022, 42, 322–331. [Google Scholar]
  49. Feng, Z. Study and evaluation of ecological environment quality in coal cities. China Min. 2007, 54–57. [Google Scholar]
  50. Song, S.; Liu, X.; Zhong, K.; et al. Analysis of main ecological and environmental problems and prevention measures in coal cities in northwest China. Inn. Mong. Environ. Sci. 2007, 59, 81–85. [Google Scholar]
  51. Si, J.; Wang, S. Ecological safety assessment and temporal and spatial differentiation of Jiaozuo mining area based on combined weighting method. Res. Soil Water Conserv. 2021, 28, 348–354. [Google Scholar] [CrossRef]
  52. Tan, J.; Liu, G. Study on ecological safety evaluation method of mining area based on wavelet support vector machine model. Gold Sci. Technol. 2020, 28, 902–909. [Google Scholar]
  53. Wang, J.; Lu, C.; Li, F.; Zhang, S. Study on ecological safety evaluation of open-pit mining area based on PSR and GA-Elman model. China Min. 2020, 29, 65–71. [Google Scholar]
  54. Qiao, A. Discussion on the influence of coal mining on soil environmental quality. Shanxi Sci. Technol. 2020, 35, 66–68. [Google Scholar]
  55. Bian, Z.; Yu, H.; Hou, J.; et al. Influencing factors and evaluation of land degradation in key coal mining areas in western China. Acta Coal Sin. 2020, 45, 338–350. [Google Scholar]
  56. Villa, V.; Reniers, G.L.L.; Paltrinieri, N.; Cozzani, V. Development of an economic model for the allocation of preventive safety measures against environmental and ecological terrorism in chemical facilities. Process Saf. Environ. Prot. 2017, 109, 311–339. [Google Scholar] [CrossRef]
  57. Takatsuka, H.; Zeng, D.-Z.; Zhao, L. Resource-based cities and the Dutch disease. Resour. Energy Econ. 2015, 40, 57–84. [Google Scholar] [CrossRef]
Figure 1. Spatial arrangement of resource-dependent cities in the Yellow River Basin.
Preprints 100527 g001
Figure 2. Spatial distribution of Yellow River Basin ecosystem types (Source: Data collated from the Institute of Resources and Geography, Chinese Academy of Sciences, 2020).
Preprints 100527 g002
Figure 3. Ecological Types of Growing and Mature Resource-Based Cities.
Preprints 100527 g003
Figure 4. Distribution map of the ecological safety level of resource-based cities in the Yellow River Basin from 2006 to 2020.
Preprints 100527 g004
Figure 5. Average ecological safety level 2004-2020.
Preprints 100527 g005
Figure 6. σConvergence Changes of Resource-Based Cities in the Yellow River Basin from 2006 to 2020.
Preprints 100527 g006
Table 1. Different Types of Resource-Based Cities in the Yellow River Basin.
Type City
Growth Wuwei, Qingyang, Longnan, Erdos, Xianyang and Yulin
Mature Jinchang, Pingliang, Datong, Changzhi, Jincheng, Xinzhou, Jinzhong, Yuncheng, Shuozhou, Sanmenxia, Hebi, Pingdingshan, Dongying, Jining and Tai'an
Decline Baiyin, Shizuishan, Wuhai, Tongchuan, Jiaozuo and Puyang
Regeneration Zhangye, Baotou, Zibo
Source: According to the National Sustainable Development Plan of Resource-based Cities (2013–2020).
Table 2. Ecological Safety Evaluation Index System for Resource Based Cities.
Category Primary Variable Secondary Variable Influence
Ecological Pressure Social Development Population Density (-)
Per capita GDP (-)
Urbanization rate (-)
Ecological Threat Environmental Pollution Wastewater (-)
SO2 (-)
Dust (-)
PM2.5 (-)
Ecological carrying capacity Comprehensive control Solid waste utilization (+)
Centralized processing (+)
Harmless (+)
Greening area (+)
Table 3. TOPSIS test results in 2006 2013 and 2020.
year city D+ D- C year city D+ D- C
2006 baiyin 1.547 2.317 0.6 2006 puyang 1.238 2.618 0.679
2013 baiyin 1.006 2.631 0.723 2013 puyang 1.228 2.621 0.681
2020 baiyin 0.794 2.87 0.783 2020 puyang 0.946 2.756 0.744
2006 baotou 1.276 2.412 0.654 2006 qingyang 1.161 2.756 0.704
2013 baotou 1.442 2.345 0.619 2013 qingyang 1.096 2.887 0.725
2020 baotou 1.211 2.631 0.685 2020 qingyang 0.672 2.96 0.815
2006 changzhi 1.104 2.424 0.687 2006 sanmenxia 1.237 2.437 0.663
2013 changzhi 1.123 2.401 0.681 2013 sanmenxia 1.034 2.605 0.716
2020 changzhi 0.935 2.634 0.738 2020 sanmenxia 1.041 2.656 0.718
2006 datong 1.363 2.334 0.631 2006 shizuishan 1.506 2.157 0.589
2013 datong 1.02 2.523 0.712 2013 shizuishan 0.992 2.613 0.725
2020 datong 0.898 2.777 0.756 2020 shizuishan 1.132 2.623 0.699
2006 dongying 1.13 2.447 0.684 2006 shuozhou 1.634 2.227 0.577
2013 dongying 1.316 2.484 0.654 2013 shuozhou 0.807 2.68 0.769
2020 dongying 1.165 2.588 0.69 2020 shuozhou 0.79 2.863 0.784
2006 eerduosi 1.494 2.436 0.62 2006 taian 1.037 2.684 0.721
2013 eerduosi 1.637 2.351 0.59 2013 taian 1.153 2.609 0.694
2020 eerduosi 1.323 2.657 0.668 2020 taian 1.088 2.649 0.709
2006 hebi 1.662 2.278 0.578 2006 tongchuan 1.476 2.368 0.616
2013 hebi 1.153 2.638 0.696 2013 tongchuan 0.957 2.711 0.739
2020 hebi 1.224 2.679 0.687 2020 tongchuan 0.954 2.772 0.744
2006 jiaozuo 1.489 2.194 0.596 2006 wuhai 1.805 2.265 0.557
2013 jiaozuo 1.457 2.331 0.615 2013 wuhai 1.629 2.316 0.587
2020 jiaozuo 1.149 2.564 0.691 2020 wuhai 1.555 2.534 0.62
2006 jinchang 1.357 2.387 0.638 2006 wuwei 0.95 2.795 0.746
2013 jinchang 1.367 2.295 0.627 2013 wuwei 0.909 2.761 0.752
2020 jinchang 1.317 2.628 0.666 2020 wuwei 0.697 2.946 0.809
2006 jincheng 1.201 2.36 0.663 2006 xianyang 1.306 2.441 0.651
2013 jincheng 1.018 2.554 0.715 2013 xianyang 0.978 2.629 0.729
2020 jincheng 0.944 2.687 0.74 2020 xianyang 0.938 2.683 0.741
2006 jining 1.178 2.515 0.681 2006 xinzhou 1.704 2.445 0.589
2013 jining 1.398 2.481 0.64 2013 xinzhou 1.037 2.562 0.712
2020 jining 1.239 2.616 0.679 2020 xinzhou 0.845 2.787 0.767
2006 jinzhong 1.176 2.43 0.674 2006 yulin 1.441 2.438 0.628
2013 jinzhong 1.416 2.367 0.626 2013 yulin 1.122 2.557 0.695
2020 jinzhong 0.83 2.828 0.773 2020 yulin 1.005 2.676 0.727
2006 longnan 1.734 2.553 0.596 2006 yuncheng 1.765 2.137 0.548
2013 longnan 1.391 2.567 0.649 2013 yuncheng 1.111 2.568 0.698
2020 longnan 1.001 2.812 0.737 2020 yuncheng 1.072 2.599 0.708
2006 pingdingshan 1.347 2.365 0.637 2006 zhangye 1.191 2.701 0.694
2013 pingdingshan 1.235 2.526 0.672 2013 zhangye 0.969 2.717 0.737
2020 pingdingshan 0.85 2.797 0.767 2020 zhangye 0.757 2.875 0.791
2006 pingliang 1.385 2.656 0.657 2006 zibo 1.185 2.514 0.68
2013 pingliang 1.353 2.562 0.654 2013 zibo 1.313 2.507 0.656
2020 pingliang 0.685 2.892 0.809 2020 zibo 1.258 2.515 0.667
Table 4. Statistical Table of Ecological Safety Level and Control Variables.
Variable Observations Mean Max Min
Ecological safety 450 0.698 0.819 0.548
Ecological safety difference 420 0.0059 0.122 -0.097
Proportion of Tertiary sector of the economy 450 36.19% 81.75% 11.38%
Proportion of green inventions in total inventions 450 0.107 0.375 0
Proportion of environmental protection words in government work reports 450 0.0036 0.0092 0
Table 5. β Conditional convergence test results.
variable All cities Growth Mature Decline Regeneration
lnCi, t -0.9037*** -0.7049** -0.0584*** -0.4852 -0.5607
(-20.94) (-3.63) (-9.68) (-1.85) (-3.75)
Proportion of Tertiary sector of the economy 0.0005 0.0494* 0.0374** 0.0693 0.0155
(2.29) (2.11) (2.83) (1.36) (1.42)
Proportion of environmental protection words in government work reports 1.7261 -0.027** 0.0088* 0.0040 0.0071
(2.21) (-3.10) (1.87) (0.78) (2.8)
Proportion of green inventions in total inventions 0.0587 -0.0057 0.0099 -0.0148 -0.0091
(1.77) (-0.52) (1.51) (-1.31) (-0.63)
Convergence rate 0.156 0.081 0.004 - -
Half life cycle 4.44 8.55 173
R2 0.8212 0.6663 0.1834 0.4360 0.7479
Table 6. DID test results.
variable Growth Mature Decline Regeneration
Proportion of Tertiary sector of the economy 0.0009*** 0.0008** 0.0014*** 0.0005*
(5.04) (3.02) (4.36) (2.89)
Proportion of environmental protection words in government work reports -4.4582* 2.4797 5.6874 4.9022
(-2.28) (1.21) (1.46) (1.41)
Proportion of green inventions in total inventions -0.0691 0.0759 -0.3409** -0.1279
(-0.75) (1.32) (-2.73) (-0.94)
Constant 0.7143*** 0.6652*** 0.6512*** 0.6806***
(44.71) (90.95) (31.69) (35.36)
Observations 90 210 90 45
R2 0.7546 0.3185 0.7034 0.8648
Disclaimer/Publisher’s Note: The statements, opinions and data contained in all publications are solely those of the individual author(s) and contributor(s) and not of MDPI and/or the editor(s). MDPI and/or the editor(s) disclaim responsibility for any injury to people or property resulting from any ideas, methods, instructions or products referred to in the content.
Copyright: This open access article is published under a Creative Commons CC BY 4.0 license, which permit the free download, distribution, and reuse, provided that the author and preprint are cited in any reuse.
Prerpints.org logo

Preprints.org is a free preprint server supported by MDPI in Basel, Switzerland.

Subscribe

© 2024 MDPI (Basel, Switzerland) unless otherwise stated