Submitted:
07 March 2024
Posted:
08 March 2024
You are already at the latest version
Abstract
Keywords:
1. Introduction
2. Materials and Methods
2.1. Materials
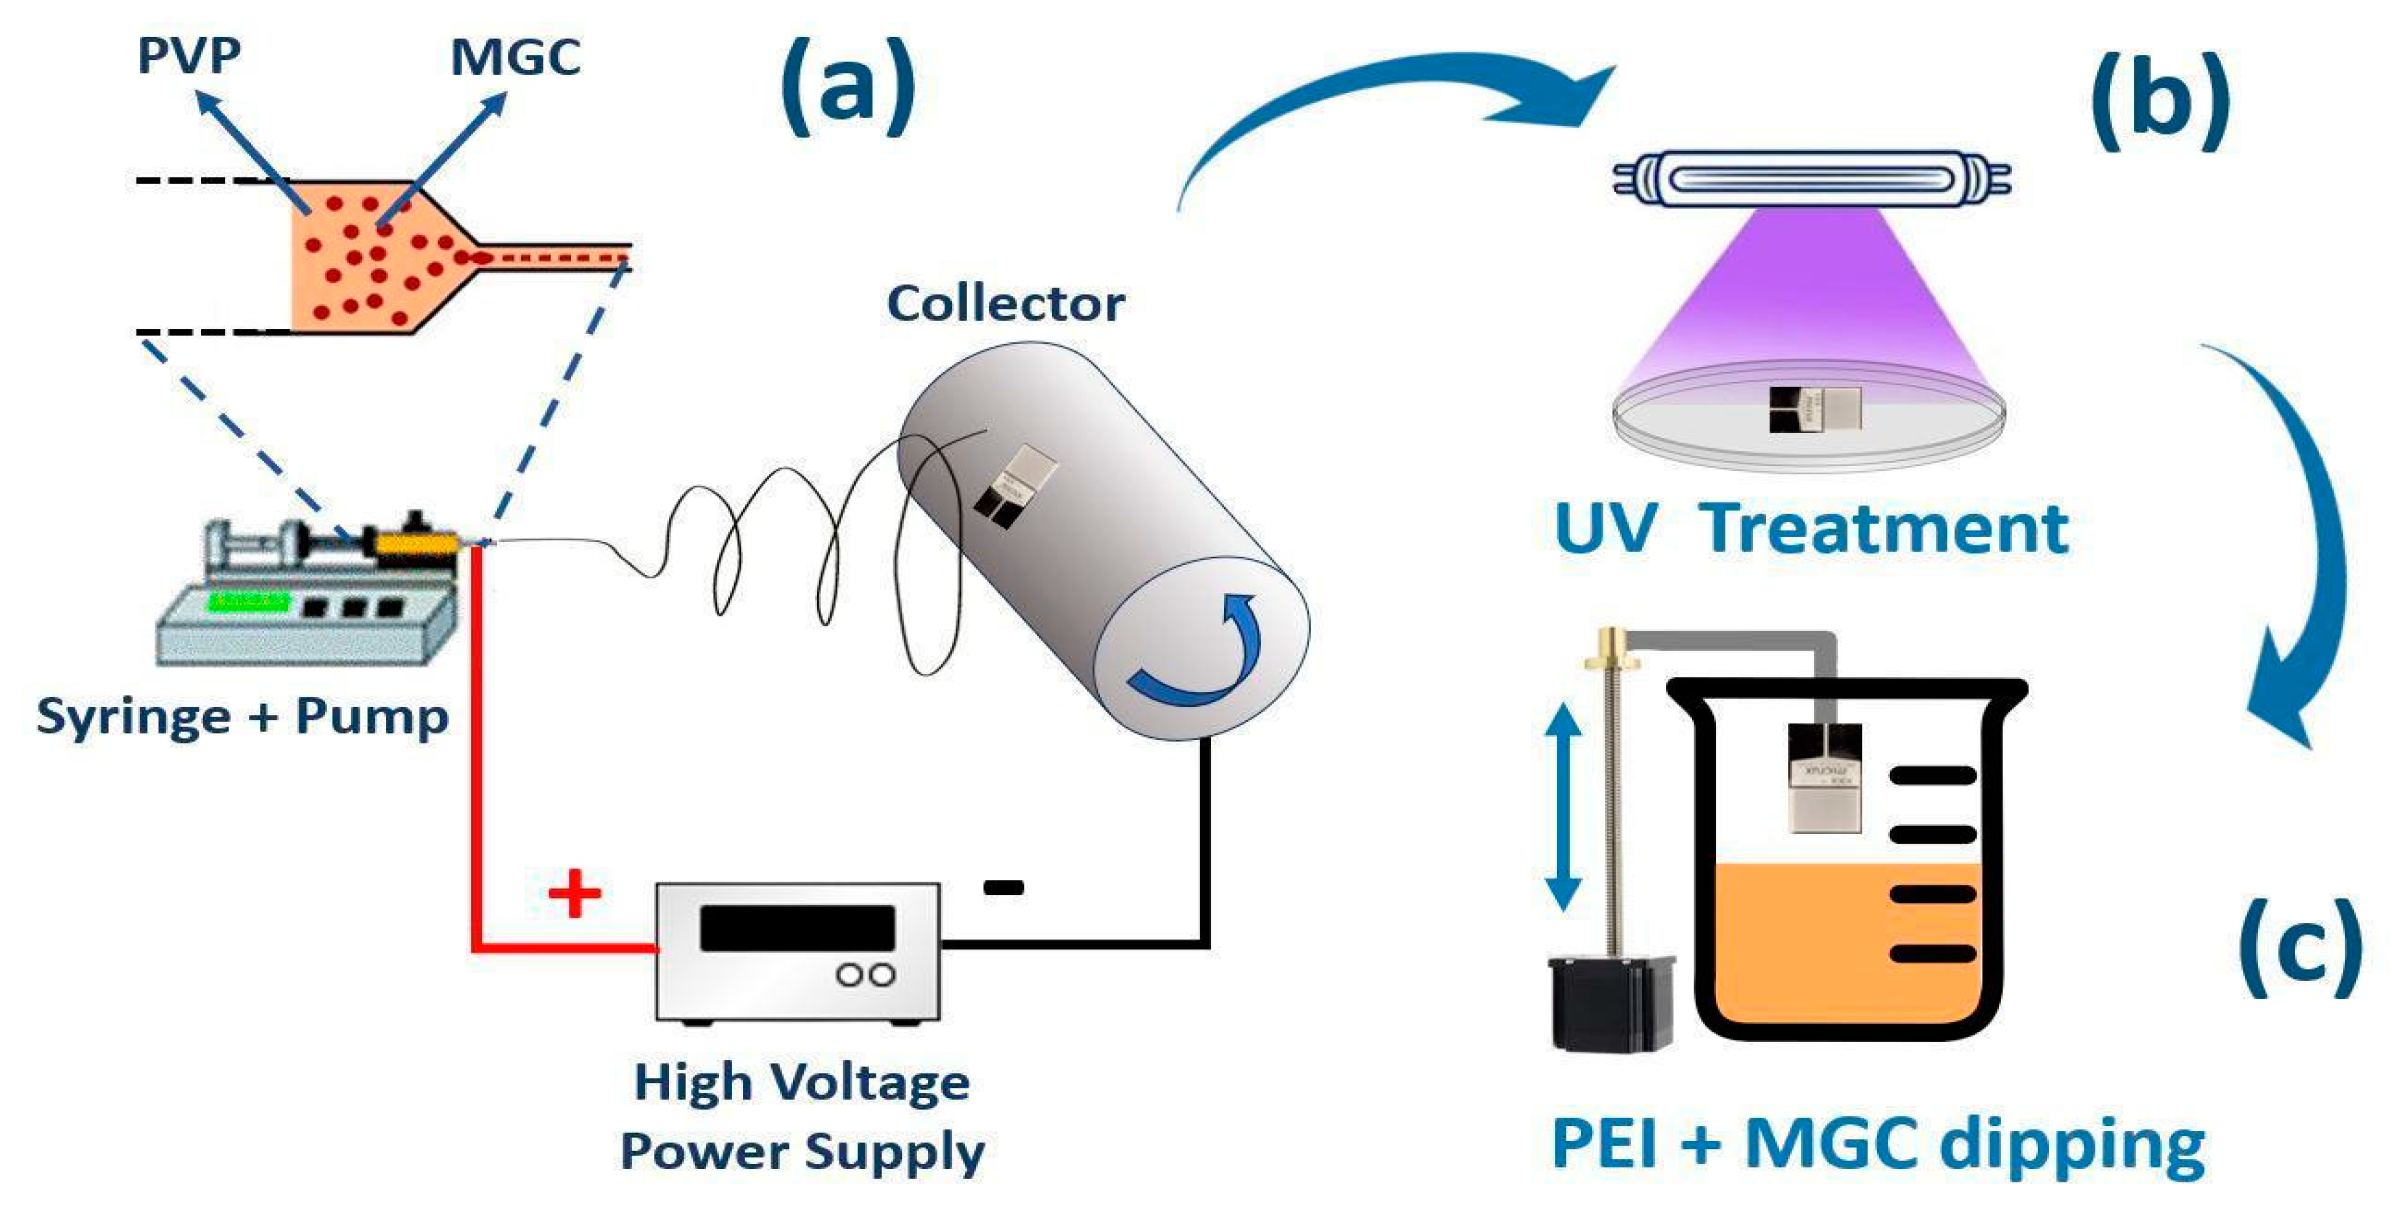
2.2. Sensor Material Growth
2.3. Material Characterization
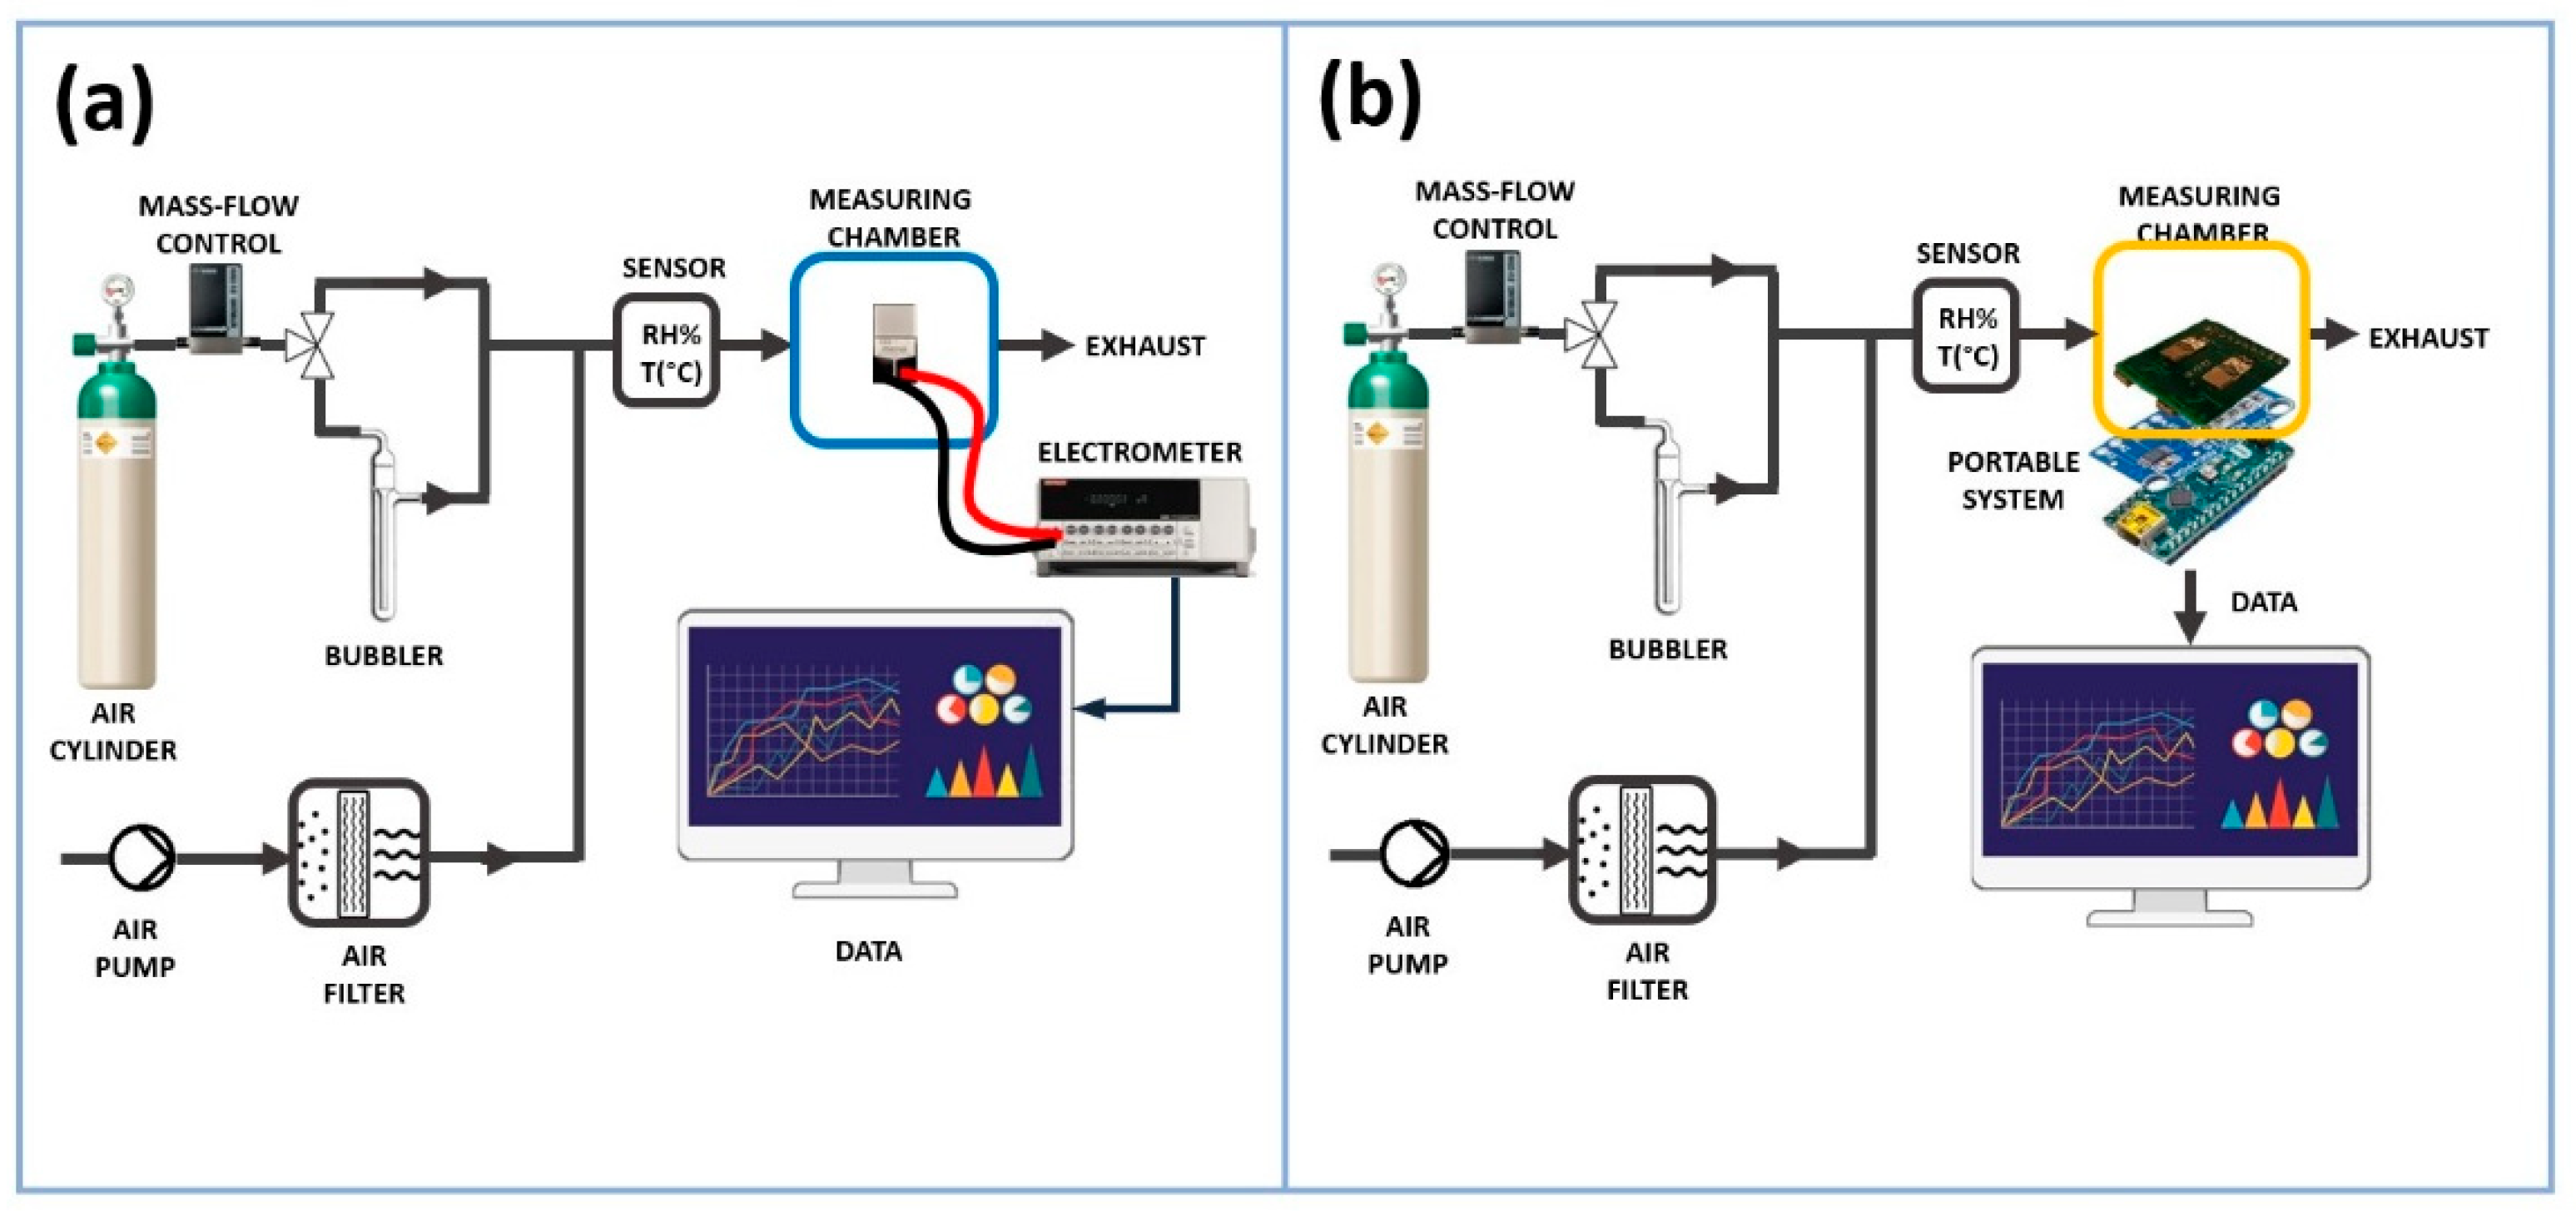
2.4. Sensor Measurement Systems Setup
3. Results and Discussion
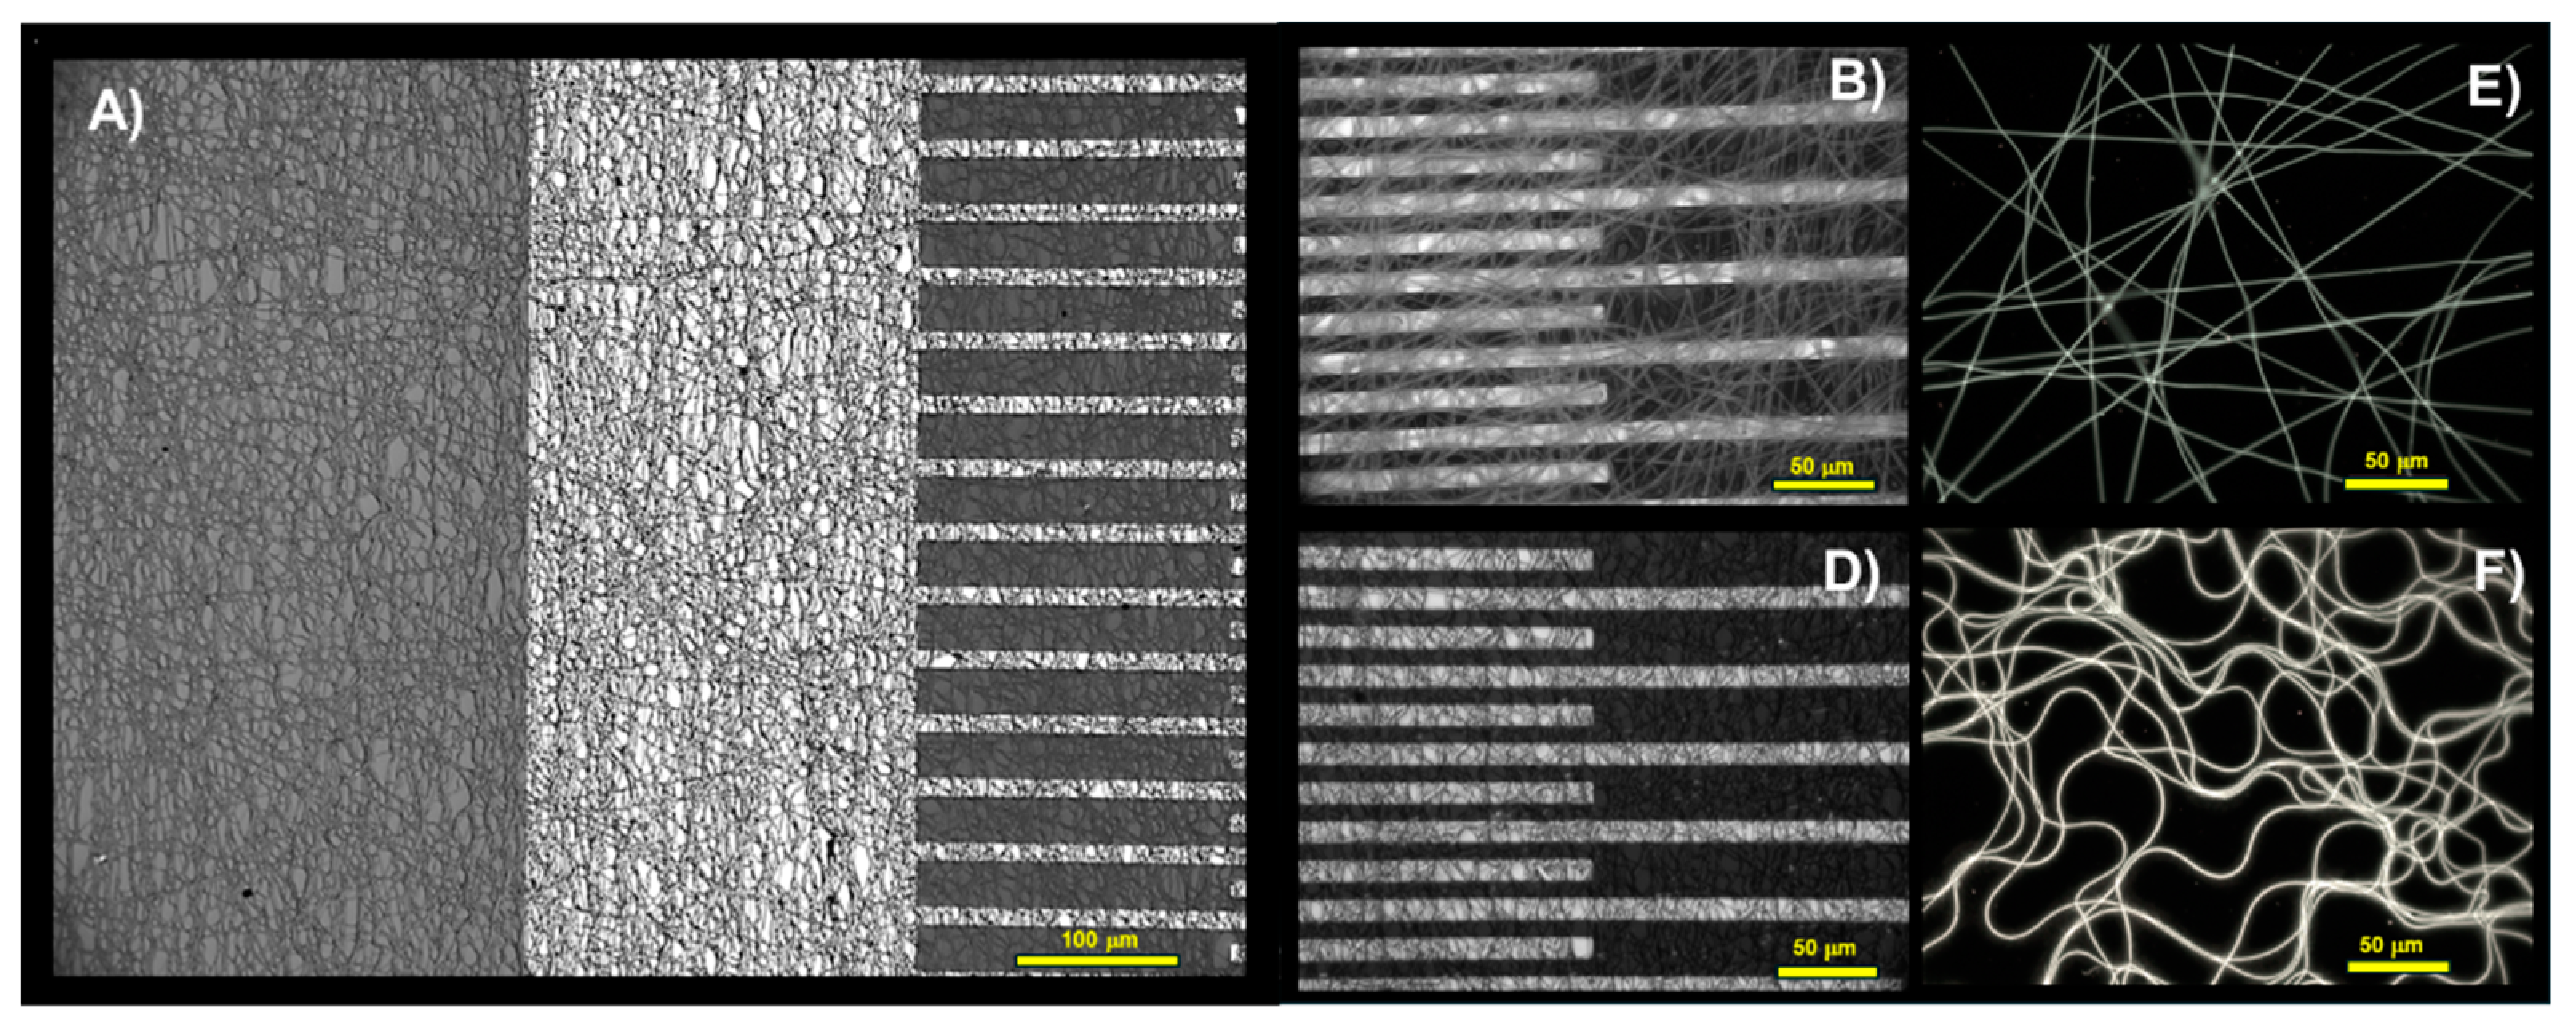
3.1. Sensing Material Characterization
3.2. Sensing Electrical Characterization
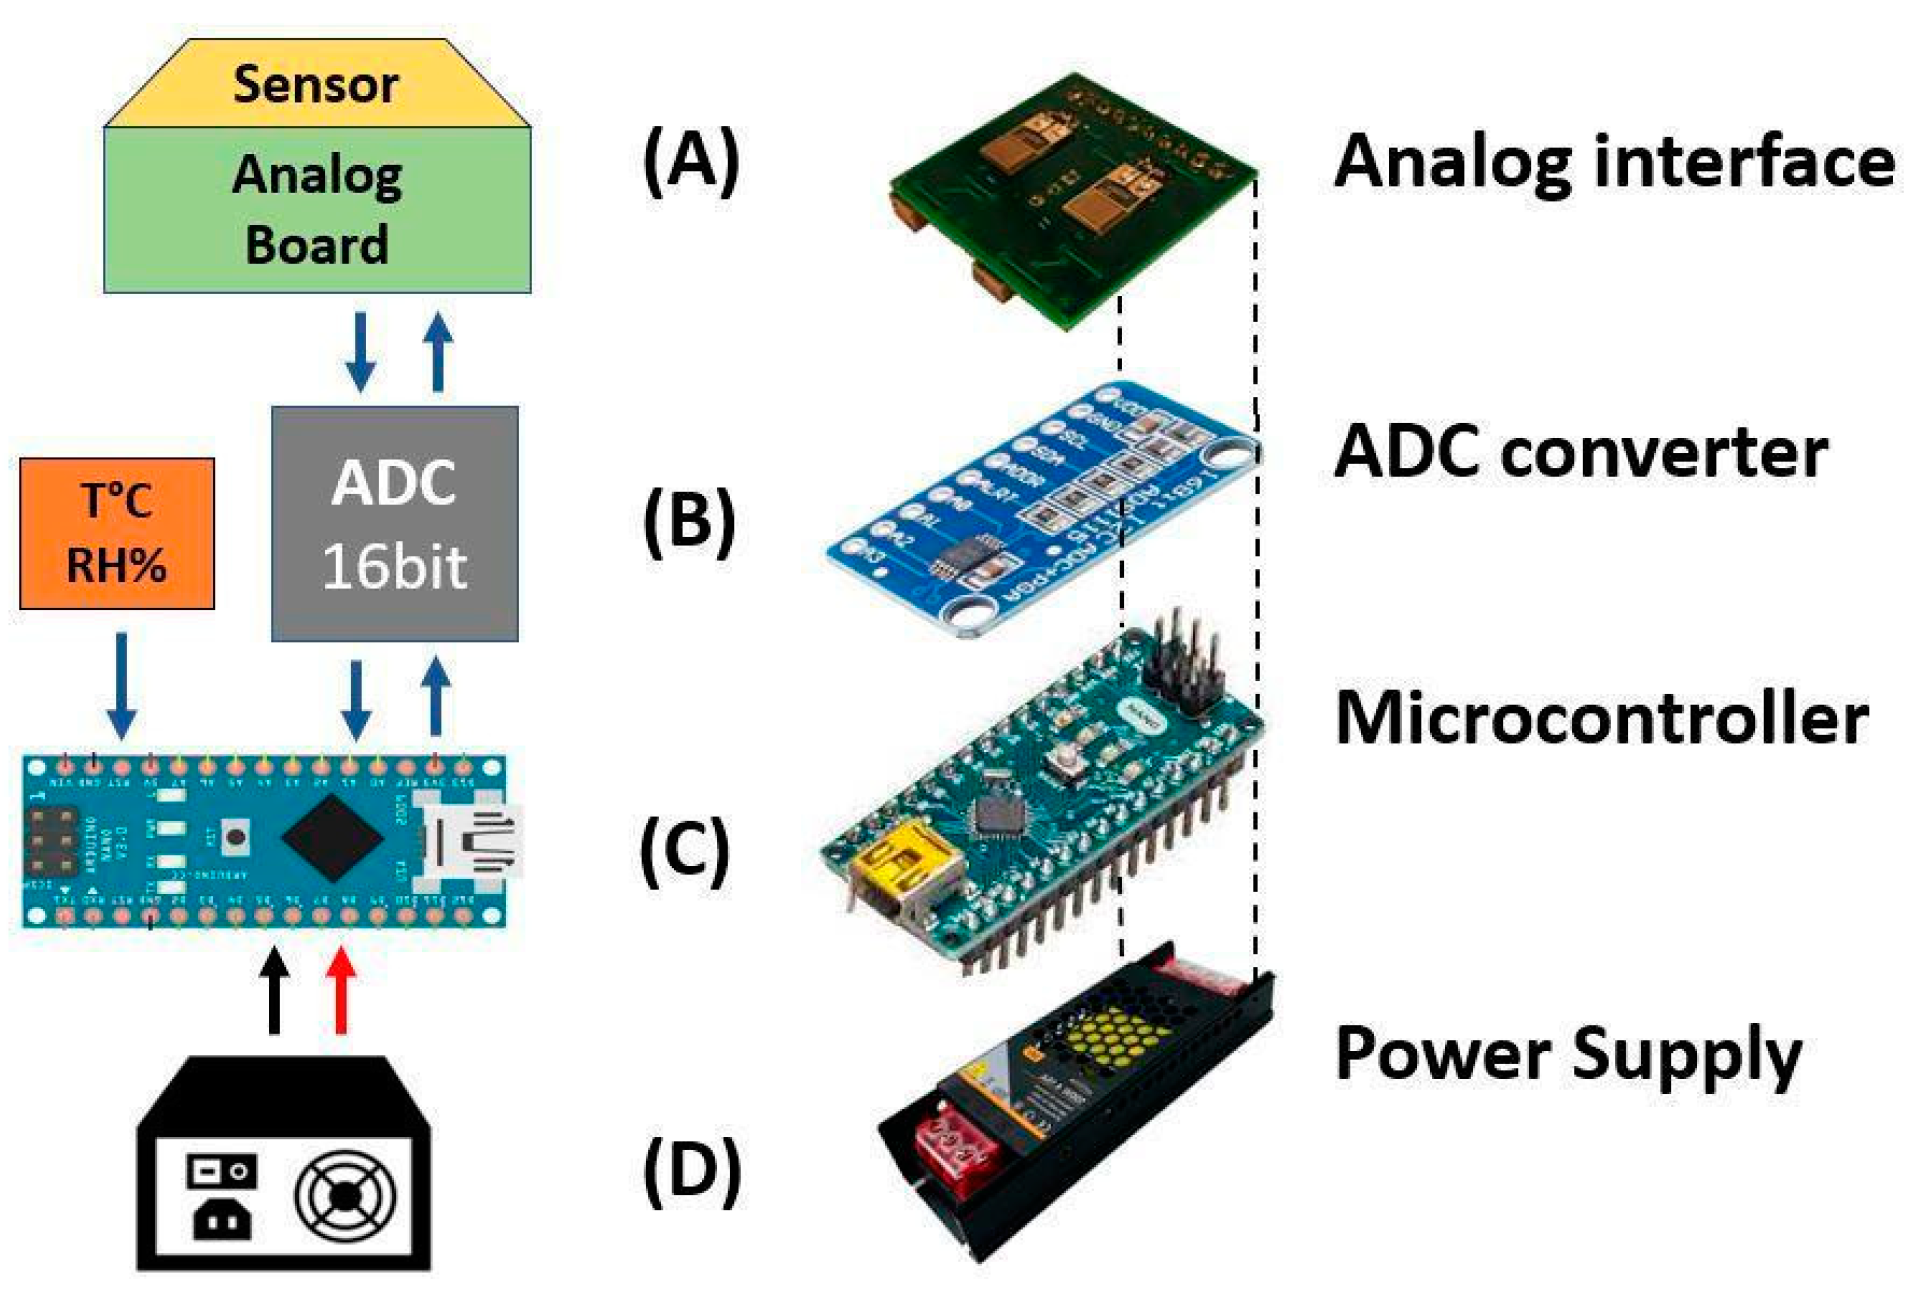
3.3. Portable Sensing System
4. Conclusions
Author Contributions
Funding
Institutional Review Board Statement
Informed Consent Statement
Data Availability Statement
Acknowledgments
Conflicts of Interest
References
- Falahati, M.; Ahmadvand, P.; Safaee, S.; Chang, Y.C.; Lyu, Z.; Chen, R.; Li, L.; Lin, Y. Smart Polymers and Nanocomposites for 3D and 4D Printing. Materials Today 2020, 40, 215–245. [Google Scholar] [CrossRef]
- Idumah, C.I.; Obele, C.M.; Emmanuel, E.O.; Hassan, A. Recently Emerging Nanotechnological Advancements in Polymer Nanocomposite Coatings for Anti-Corrosion, Anti-Fouling and Self-Healing. Surfaces and Interfaces 2020, 21, 100734. [Google Scholar] [CrossRef] [PubMed]
- Wu, H.; Fahy, W.P.; Kim, S.; Kim, H.; Zhao, N.; Pilato, L.; Kafi, A.; Bateman, S.; Koo, J.H. Recent Developments in Polymers/Polymer Nanocomposites for Additive Manufacturing. Prog Mater Sci 2020, 111. [Google Scholar] [CrossRef]
- Sarfraz, J.; Gulin-Sarfraz, T.; Nilsen-Nygaard, J.; Pettersen, M.K. Nanocomposites for Food Packaging Applications: An Overview. Nanomaterials 2021, 11, 1–27. [Google Scholar] [CrossRef]
- Gong, M.; Zhang, L.; Wan, P. Polymer Nanocomposite Meshes for Flexible Electronic Devices. Prog Polym Sci 2020, 107, 101279. [Google Scholar] [CrossRef]
- Hossain, S.K.S.; Hoque, M.E. Polymer Nanocomposite Materials in Energy Storage: Properties and Applications; Elsevier Ltd. 2018; ISBN 9780081019115. [Google Scholar]
- Zhao, L.; Liu, J. Application of Polymer Nanocomposites in Biomedicine; INC. 2022; ISBN 9780323916110. [Google Scholar]
- Panicker, S.; Mohamed, A.A. Polymer Nanocomposites for Drug Delivery Applications; INC. 2022; ISBN 9780323916110. [Google Scholar]
- Ahmadi, Y.; Moeini, N.; Yadav, M.; Ahmad, S. Antimicrobial Polymer Nanocomposite Films and Coatings; INC. 2020; ISBN 9780128214978. [Google Scholar]
- Aboulrous, A.A.; Mahmoud, T. Polymer Nanocomposites for Sensing Applications; Elsevier Ltd. 2023; ISBN 9780323884310. [Google Scholar]
- Damiri, F.; Gaiji, H.; Muhamad, I.I.; Lazim, N.A.M.; Kaur, D.; Berrada, M. Design and Fabrication of Polymer Nanocomposite Sensors; Elsevier Ltd. 2022; ISBN 9780323988308. [Google Scholar]
- Pineau, N.J.; Krumeich, F.; Güntner, A.T.; Pratsinis, S.E. Y-Doped ZnO Films for Acetic Acid Sensing down to Ppb at High Humidity. Sens Actuators B Chem 2021, 327, 128843. [Google Scholar] [CrossRef]
- Wang, C.; Ma, S.; Sun, A.; Qin, R.; Yang, F.; Li, X.; Li, F.; Yang, X. Characterization of Electrospun Pr-Doped ZnO Nanostructure for Acetic Acid Sensor. Sens Actuators B Chem 2014, 193, 326–333. [Google Scholar] [CrossRef]
- Turemis, M.; Zappi, D.; Giardi, M.T.; Basile, G.; Ramanaviciene, A.; Kapralovs, A.; Ramanavicius, A.; Viter, R. ZnO/Polyaniline Composite Based Photoluminescence Sensor for the Determination of Acetic Acid Vapor. Talanta 2020, 211, 120658. [Google Scholar] [CrossRef]
- Chu, X.; Gan, Z.; Bai, L.; Dong, Y.; Rumyantseva, M.N. The Acetic Acid Vapor Sensing Properties of BaSnO3 Microtubes Prepared by Electrospinning Method. Materials Science and Engineering: B 2020, 259, 114606. [Google Scholar] [CrossRef]
- Qin, W.F.; Zhang, H.M.; Li, X.B.; Xing, Y.W.; Guo, Y.X.; Feng, Y.Y.; Li, Y.J.; Han, S.Q.; Ma, K.F.; Cao, H.H.; et al. Surfactant Modified Hexagonal ZnO Gas Sensor for Acetic Acid. Journal of Materials Science: Materials in Electronics 2023, 34, 1–13. [Google Scholar] [CrossRef]
- Ling, W.; Zhang, S.; Cao, S.; Pu, Y.; Zhu, D. Enhanced Acetic Acid Detection for Tb2O3 @MOF-Derived ZnO at Room Temperature. Sens Actuators B Chem 2023, 377, 133057. [Google Scholar] [CrossRef]
- Zappi, D.; Varani, G.; Iatsunskyi, I.; Wallaszkovits, N.; Bailer, J.; Giardi, M.T. High-Sensitivity Metal Oxide Sensors Duplex for On-the-Field Detection of Acetic Acid Arising from the Degradation of Cellulose Acetate-Based Cinematographic and Photographic Films. Chemosensors 2022, 10. [Google Scholar] [CrossRef]
- Rizani, A.; Winingsih, S.S.; Aditya, R.; Julian, T.; Hidayat, S.N.; Kusumaatmaja, A.; Roto, R.; Triyana, K. Polyacrylamide Coated on Quartz Crystal Microbalance Electrodes for Highly Sensitive Sensor of Acetic Acid. Materials Science Forum 2019, 948 MSF, 254–259. [Google Scholar] [CrossRef]
- Cai, Jingfang; Yan, Ying; Wang, Weiwei; Ma, Yuanyuan; Cai, Lankun; Icon, L.W.; Hao, Z. Detection of Formic Acid and Acetic Acid Gases by a QCM Sensor Coated with an Acidified Multi-Walled Carbon Nanotube Membrane. Environ Technol 2021, 44.6, 751–761. [Google Scholar] [CrossRef]
- Wang, Y.C.; Sun, Z. Sen; Wang, S.Z.; Wang, S.Y.; Cai, S.X.; Huang, X.Y.; Li, K.; Chi, Z.T.; Pan, S. Di; Xie, W.F. Sub-Ppm Acetic Acid Gas Sensor Based on In2O3 Nanofibers. J Mater Sci 2019, 54, 14055–14063. [Google Scholar] [CrossRef]
- Li, G.; Su, Y.; Li, Y.Y.; Li, Y.X.; Guo, Z.; Huang, X.J.; Liu, J.H. Size-Tunable Ag Nanoparticles Sensitized Porous ZnO Nanobelts: Controllably Partial Cation-Exchange Synthesis and Selective Sensing toward Acetic Acid. Nanotechnology 2018, 29. [Google Scholar] [CrossRef] [PubMed]
- Khorramshahi, V.; Karamdel, J.; Yousefi, R. Acetic Acid Sensing of Mg-Doped ZnO Thin Films Fabricated by the Sol–Gel Method. Journal of Materials Science: Materials in Electronics 2018, 29, 14679–14688. [Google Scholar] [CrossRef]
- Jin, W.X.; Ma, S.Y.; Tie, Z.Z.; Li, W.Q.; Luo, J.; Cheng, L.; Xu, X.L.; Wang, T.T.; Jiang, X.H.; Mao, Y.Z. Synthesis of Hierarchical SnO 2 Nanoflowers with Enhanced Acetic Acid Gas Sensing Properties. Appl Surf Sci 2015, 353, 71–78. [Google Scholar] [CrossRef]
- Cheng, L.; Ma, S.Y.; Wang, T.T.; Luo, J.; Li, X.B.; Li, W.Q.; Mao, Y.Z.; Gz, D.J. Highly Sensitive Acetic Acid Gas Sensor Based on Coral-like and Y-Doped SnO2 Nanoparticles Prepared by Electrospinning. Mater Lett 2014, 137, 265–268. [Google Scholar] [CrossRef]
- Web Page Available online: https://www.gas-sensing.com/ati-acid-gases-sensor-00-1045.html.
- Chen, Y.; Yang, Y.; Liu, X.; Shi, X.; Wang, C.; Zhong, H.; Jin, F. Sustainable Production of Formic Acid and Acetic Acid from Biomass. Molecular Catalysis 2023, 545, 113199. [Google Scholar] [CrossRef]
- European Union Commission Commission Directive (EU) 2017/164 of 31 January 2017 Establishing a Fourth List of Indicative Occupational Exposure Limit Values Pursuant to Council Directive 98/24/EC, and Amending Commission Directives 91/322. 2000, EEC39.
- Angkawinitwong, U.; Williams, G.R. Electrospun Materials for Wearable Sensor Applications in Healthcare; Elsevier Ltd. 2020; ISBN 9780128196113. [Google Scholar]
- Das, R.; Zeng, W.; Asci, C.; Del-Rio-Ruiz, R.; Sonkusale, S. Recent Progress in Electrospun Nanomaterials for Wearables. APL Bioeng 2022, 6. [Google Scholar] [CrossRef] [PubMed]
- Gilmore, T.; Gouma, P. Novel Electrospinning Process for Wearable Sensors. ECS Meeting Abstracts 2022, MA2022-01, 1035. [Google Scholar] [CrossRef]
- Massaglia, G.; Quaglio, M. Electrospun Nanofibers for Optimized Fiber-Shaped Wearable Sensors. In Proceedings of the IOCN 2023; MDPI: Basel, Switzerland, 5 May 2023; p. 55. [Google Scholar]
- Electrospinning for High Performance Sensors; Macagnano, A., Zampetti, E., Kny, E., Eds.; NanoScience and Technology; Springer International Publishing: Cham, 2015; ISBN 978-3-319-14405-4. [Google Scholar]
- Electrospinning, Wang, L., Qin, X., Eds.; Wiley. 2024; ISBN 9783527351978.
- Utkarsh; Hegab, H.; Tariq, M.; Syed, N.A.; Rizvi, G.; Pop-Iliev, R. Towards Analysis and Optimization of Electrospun PVP (Polyvinylpyrrolidone) Nanofibers. Advances in Polymer Technology 2020, 2020, 1–9. [Google Scholar] [CrossRef]
- Maciejewska, B.M.; Wychowaniec, J.K.; Woźniak-Budych, M.; Popenda, Ł.; Warowicka, A.; Golba, K.; Litowczenko, J.; Fojud, Z.; Wereszczyńska, B.; Jurga, S. UV Cross-Linked Polyvinylpyrrolidone Electrospun Fibres as Antibacterial Surfaces. Sci Technol Adv Mater 2019, 20, 979–991. [Google Scholar] [CrossRef]
- Wang, T.; Huang, D.; Yang, Z.; Xu, S.; He, G.; Li, X.; Hu, N.; Yin, G.; He, D.; Zhang, L. A Review on Graphene-Based Gas/Vapor Sensors with Unique Properties and Potential Applications. Nanomicro Lett 2016, 8, 95–119. [Google Scholar] [CrossRef]
- Bolotin, K.I.; Sikes, K.J.; Jiang, Z.; Klima, M.; Fudenberg, G.; Hone, J.; Kim, P.; Stormer, H.L. Ultrahigh Electron Mobility in Suspended Graphene. Solid State Commun 2008, 146, 351–355. [Google Scholar] [CrossRef]
- Park, J.; Lee, J.; Kim, S.; Hwang, J. Graphene-Based Two-Dimensional Mesoporous Materials: Synthesis and Electrochemical Energy Storage Applications. Materials 2021, 14. [Google Scholar] [CrossRef] [PubMed]
- Matatagui, D.; López-Sánchez, J.; Peña, A.; Serrano, A.; del Campo, A.; de la Fuente, O.R.; Carmona, N.; Navarro, E.; Marín, P.; del Carmen Horrillo, M. Ultrasensitive NO2 Gas Sensor with Insignificant NH3-Interference Based on a Few-Layered Mesoporous Graphene. Sens Actuators B Chem 2021, 335, 129657. [Google Scholar] [CrossRef]
- Han, T.H.; Huang, Y.-K.; Tan, A.T.L.; Dravid, V.P.; Huang, J. Steam Etched Porous Graphene Oxide Network for Chemical Sensing. J Am Chem Soc 2011, 133, 15264–15267. [Google Scholar] [CrossRef]
- Kanjwal, M.A.; Ghaferi, A. Al Graphene Incorporated Electrospun Nanofiber for Electrochemical Sensing and Biomedical Applications: A Critical Review. Sensors 2022, 22, 8661. [Google Scholar] [CrossRef]
- Avossa, J.; Paolesse, R.; Di Natale, C.; Zampetti, E.; Bertoni, G.; De Cesare, F.; Scarascia-Mugnozza, G.; Macagnano, A. Electrospinning of Polystyrene/Polyhydroxybutyrate Nanofibers Doped with Porphyrin and Graphene for Chemiresistor Gas Sensors. Nanomaterials 2019, 9. [Google Scholar] [CrossRef] [PubMed]
- Kausar, A.; Ahmad, I.; Zhao, T.; Aldaghri, O.; Ibnaouf, K.H.; Eisa, M.H. Nanocomposite Nanofibers of Graphene—Fundamentals and Systematic Developments. Journal of Composites Science 2023, 7, 323. [Google Scholar] [CrossRef]
- De, S.; Sahoo, S.; Das, A.K.; Nayak, G.C. Recent Progress in Electrospinning Technologies for Graphene-Based Materials. 2021; pp. 1–34. [Google Scholar]
- Al-Dhahebi, A.M.; Gopinath, S.C.B.; Saheed, M.S.M. Graphene Impregnated Electrospun Nanofiber Sensing Materials: A Comprehensive Overview on Bridging Laboratory Set-up to Industry. Nano Converg 2020, 7, 27. [Google Scholar] [CrossRef] [PubMed]
- Wang, Y.; Yokota, T.; Someya, T. Electrospun Nanofiber-Based Soft Electronics. NPG Asia Mater 2021, 13, 22. [Google Scholar] [CrossRef]
- Guo, Z.; Huang, J.; Xue, Z.; Wang, X. Electrospun Graphene Oxide/Carbon Composite Nanofibers with Well-Developed Mesoporous Structure and Their Adsorption Performance for Benzene and Butanone. Chemical Engineering Journal 2016, 306, 99–106. [Google Scholar] [CrossRef]
- Storti, E.; Lojka, M.; Lencová, S.; Hubálková, J.; Jankovský, O.; Aneziris, C.G. Synthesis and Characterization of Graphene Nanoplatelets-Containing Fibers by Electrospinning. Open Ceramics 2023, 15. [Google Scholar] [CrossRef]
- Del Sorbo, G.; Truda, G.; Bifulco, A.; Passaro, J.; Petrone, G.; Vitolo, B.; Ausanio, G.; Vergara, A.; Marulo, F.; Branda, F. Non Monotonous Effects of Noncovalently Functionalized Graphene Addition on the Structure and Sound Absorption Properties of Polyvinylpyrrolidone (1300 KDa) Electrospun Mats. Materials 2018, 12, 108. [Google Scholar] [CrossRef]
- Kaczmarek, H.; Szalla, A.; Kamińska, A. Study of Poly(Acrylic Acid)–Poly(Vinylpyrrolidone) Complexes and Their Photostability. Polymer (Guildf) 2001, 42, 6057–6069. [Google Scholar] [CrossRef]
- Song, G.; Lin, Y.; Zhu, Z.; Zheng, H.; Qiao, J.; He, C.; Wang, H. Strong Fluorescence of Poly( N -Vinylpyrrolidone) and Its Oxidized Hydrolyzate. Macromol Rapid Commun 2015, 36, 278–285. [Google Scholar] [CrossRef]
- Louie, S.M.; Gorham, J.M.; Tan, J.; Hackley, V.A. Ultraviolet Photo-Oxidation of Polyvinylpyrrolidone (PVP) Coatings on Gold Nanoparticles. Environ Sci Nano 2017, 4, 1866–1875. [Google Scholar] [CrossRef]
- Chen, L.; Raohao, F.; Changchang, Z.; Xiang, L.; Changhua, Z. Fluorescent Enhancement of Polyethyleneimine Nano-Polymers and the Application in Cellar Imaging. Polym Degrad Stab 2019, 163, 7–14. [Google Scholar] [CrossRef]
- Khan, W.S.; Asmatulu, R.; Eltabey, M.M. Electrical and Thermal Characterization of Electrospun PVP Nanocomposite Fibers. J Nanomater 2013, 2013, 1–9. [Google Scholar] [CrossRef]
- Gillan, L. Inkjet Printed Metal Oxide Thin Film Transistors Incorporating Polyethyleneimine. 2017. [Google Scholar]
- Roizard, D. Antoine Equation. In Encyclopedia of Membranes; Springer: Berlin, Heidelberg, 2014; pp. 1–3. [Google Scholar]
- D’Amico, A.; Di Natale, C. A Contribution on Some Basic Definitions of Sensors Properties. IEEE Sens J 2001, 1, 183–190. [Google Scholar] [CrossRef]
- Chu, X.; Dai, P.; Dong, Y.; Sun, W.; Bai, L.; Zhang, W. The Acetic Acid Gas Sensing Properties of Graphene Quantum Dots (GQDs)–ZnO Nanocomposites Prepared by Hydrothermal Method. Journal of Materials Science: Materials in Electronics 2017, 28, 19164–19173. [Google Scholar] [CrossRef]
- Geng, W.; Ma, Z.; Yang, J.; Duan, L.; Li, F.; Zhang, Q. Pore Size Dependent Acetic Acid Gas Sensing Performance of Mesoporous CuO. Sens Actuators B Chem 2021, 334, 129639. [Google Scholar] [CrossRef]
- Aziz, N.A.; Abdullah, M.F.; Badaruddin, S.A.M.; Hussin, M.R.M.; Hashim, A.M. Highly Sensitive Sub-Ppm CH3COOH Detection by Improved Assembly of Sn3O4-RGO Nanocomposite. Molecules 2022, 27. [Google Scholar] [CrossRef] [PubMed]
- Khorramshahi, V.; Karamdel, J.; Yousefi, R. High Acetic Acid Sensing Performance of Mg-Doped ZnO/RGO Nanocomposites. Ceram Int 2019, 45, 7034–7043. [Google Scholar] [CrossRef]
- He, L.; Gao, C.; Yang, L.; Zhang, K.; Chu, X.; Liang, S.; Zeng, D. Facile Synthesis of MgGa2O4/Graphene Composites for Room Temperature Acetic Acid Gas Sensing. Sens Actuators B Chem 2020, 306, 127453. [Google Scholar] [CrossRef]
- Avossa, J.; Zampetti, E.; De Cesare, F.; Bearzotti, A.; Scarascia-Mugnozza, G.; Vitiello, G.; Zussman, E.; Macagnano, A. Thermally Driven Selective Nanocomposite PS-PHB/MGC Nanofibrous Conductive Sensor for Air Pollutant Detection. Front Chem 2018, 6, 1–14. [Google Scholar] [CrossRef]
- Cheng, L.; Ma, S.Y.; Wang, T.T.; Luo, J.; Li, X.B.; Li, W.Q.; Mao, Y.Z.; Gz, D.J. Highly Sensitive Acetic Acid Gas Sensor Based on Coral-like and Y-Doped SnO2 Nanoparticles Prepared by Electrospinning. Mater Lett 2014, 137, 265–268. [Google Scholar] [CrossRef]
- Wu, J.; Wan, Y.; Wang, Z.; Wang, Y.; Luo, Q.; Feng, C.; Yoshinobu, T. Loose Ag-Doped LaFeO 3 Nanotubes-Based Gas Sensor for Excellent Acetic Acid Sensing. IEEE Sens J 2024, 1. [Google Scholar] [CrossRef]
- Jin, W.X.; Ma, S.Y.; Tie, Z.Z.; Li, W.Q.; Luo, J.; Cheng, L.; Xu, X.L.; Wang, T.T.; Jiang, X.H.; Mao, Y.Z. Synthesis of Hierarchical SnO2 Nanoflowers with Enhanced Acetic Acid Gas Sensing Properties. Appl Surf Sci 2015, 353, 71–78. [Google Scholar] [CrossRef]
- Zhang, J.; Liao, F.; Zhu, Y.; Sun, J.; Shao, M. Visible-Light-Enhanced Gas Sensing of CdSxSe1-x Nanoribbons for Acetic Acid at Room Temperature. Sens Actuators B Chem 2015, 215, 497–503. [Google Scholar] [CrossRef]
- Gautam, M.; Jayatissa, A.H. Detection of Organic Vapors by Graphene Films Functionalized with Metallic Nanoparticles. J Appl Phys 2012, 112. [Google Scholar] [CrossRef]
- Huang, X.Y.; Chen, K.; Xie, W.; Li, Y.; Yang, F.; Deng, Y.; Li, J.; Jiang, F.; Shu, Y.; Wu, L.; et al. Chemiresistive Gas Sensors Based on Highly Permeable Sn-Doped Bismuth Subcarbonate Microspheres: Facile Synthesis, Sensing Performance, and Mechanism Study. Adv Funct Mater 2023, 33, 1–12. [Google Scholar] [CrossRef]
- Bi, W.; Liu, S. Preparation of a Hierarchical 3D Structure Composed of Co-Doped SnO2 Nanosheets with Excellent Gas Sensitivity to Acetic Acid. Materials Science and Engineering: B 2022, 286, 116006. [Google Scholar] [CrossRef]
- Zappi, D.; Varani, G.; Iatsunskyi, I.; Wallaszkovits, N.; Bailer, J.; Giardi, M.T. High-Sensitivity Metal Oxide Sensors Duplex for On-the-Field Detection of Acetic Acid Arising from the Degradation of Cellulose Acetate-Based Cinematographic and Photographic Films. Chemosensors 2022, 10, 60. [Google Scholar] [CrossRef]
- Cao, P.F.; Ma, S.Y.; Fan, R.J. Carbon-Doped Porous Hollow Alpha-Fe2O3 Microtubules Controlled by Absorbent Cotton Bio-Template to Detect Acetic Acid Vapor. Ceram Int 2022, 48, 12729–12741. [Google Scholar] [CrossRef]
- Han, D. Sol-Gel Autocombustion Synthesis of Zinc Oxide Foam Decorated with Holes and Its Use as Acetic Acid Gas Sensor at Sub-Ppm Level. Ceram Int 2020, 46, 3304–3310. [Google Scholar] [CrossRef]
- Zhang, Y.; Liu, J.; Chu, X.; Liang, S.; Kong, L. Preparation of g–C3N4–SnO2 Composites for Application as Acetic Acid Sensor. J Alloys Compd 2020, 832, 153355. [Google Scholar] [CrossRef]
- Gauglitz, G. Analytical Evaluation of Sensor Measurements. Anal Bioanal Chem 2018, 410, 5–13. [Google Scholar] [CrossRef] [PubMed]
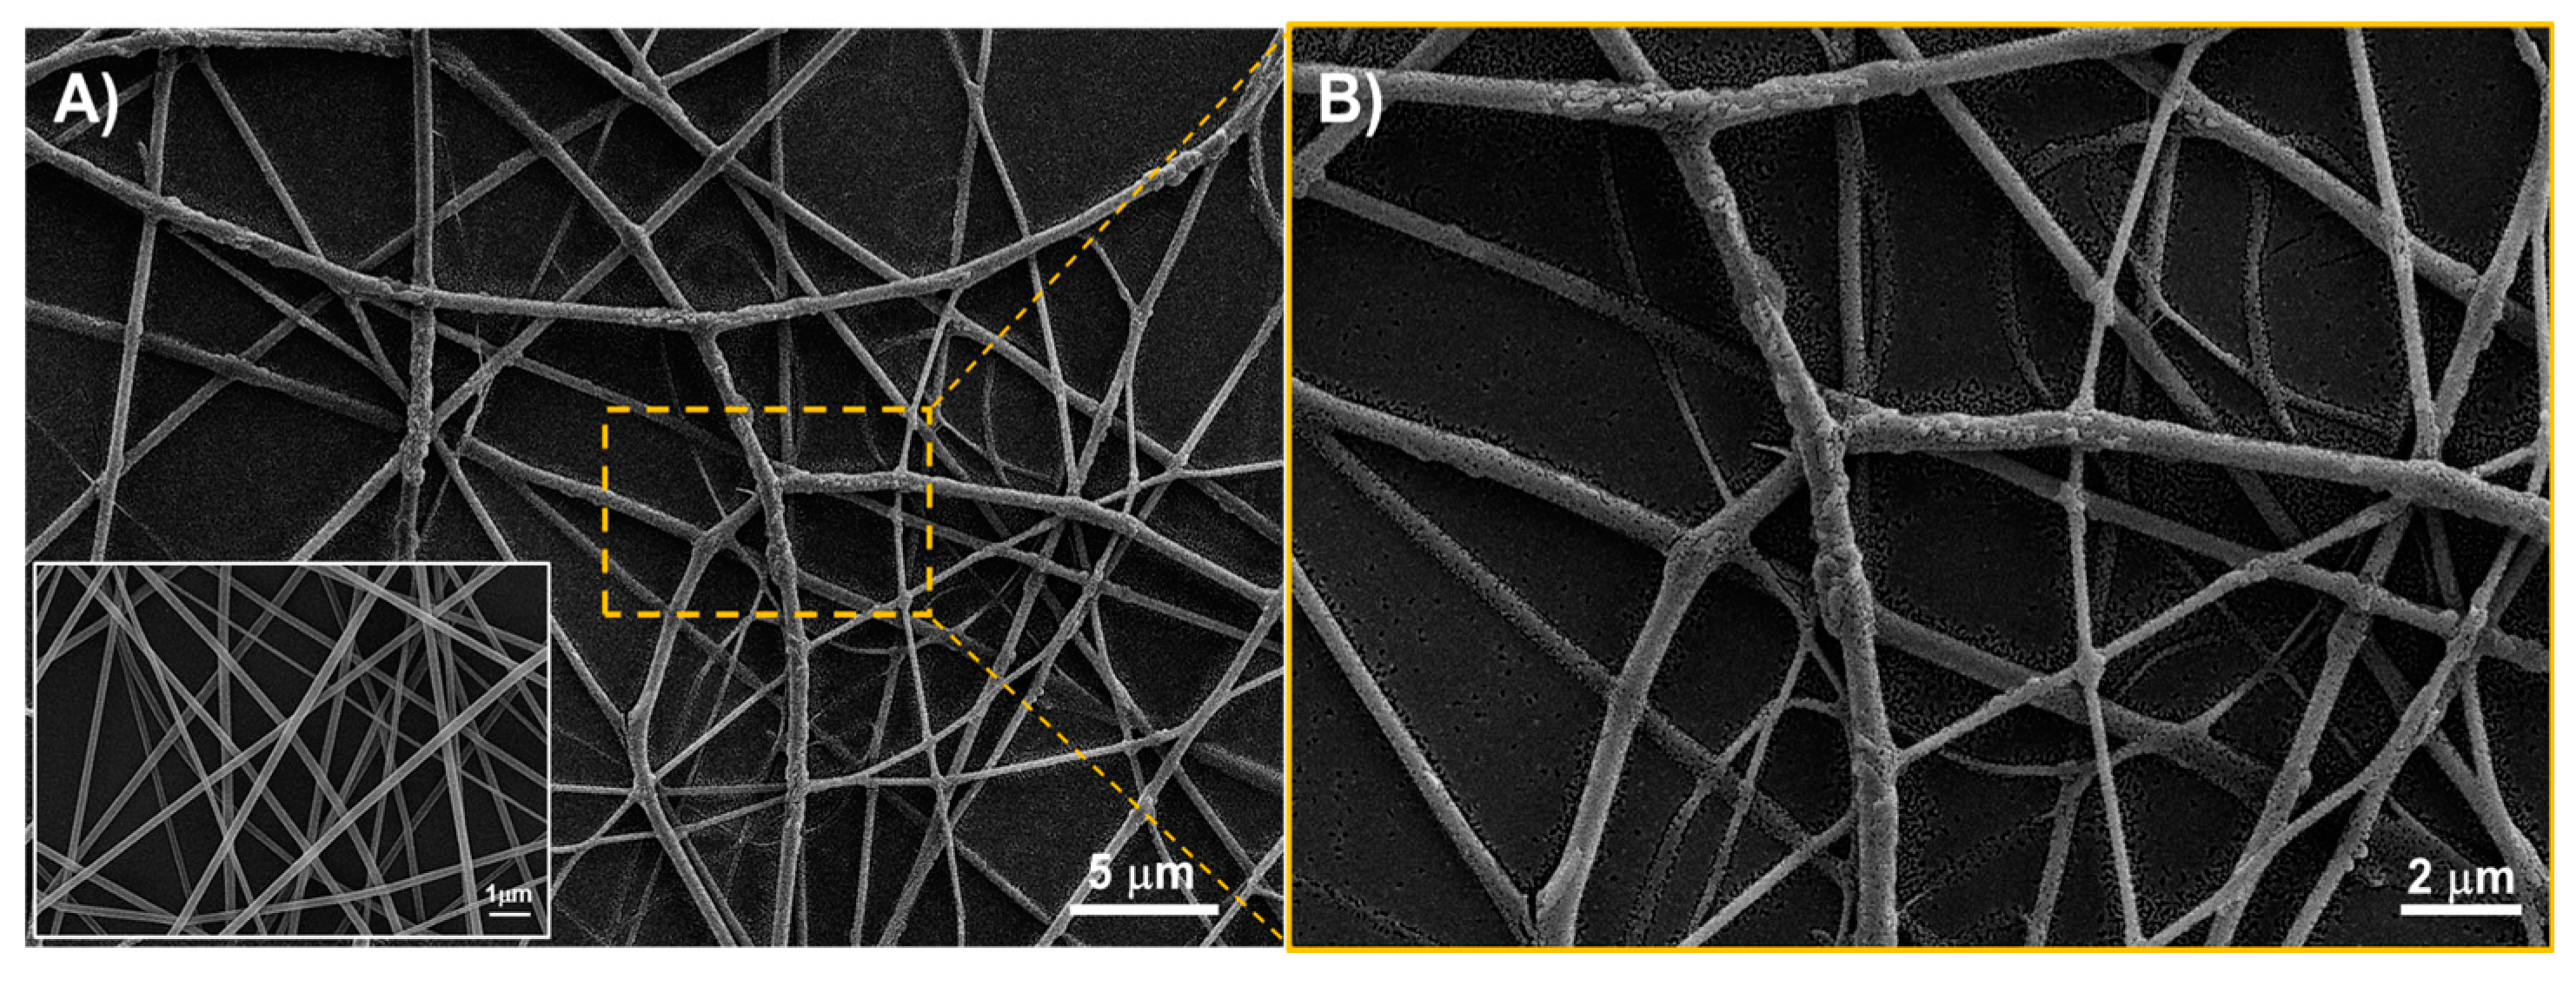
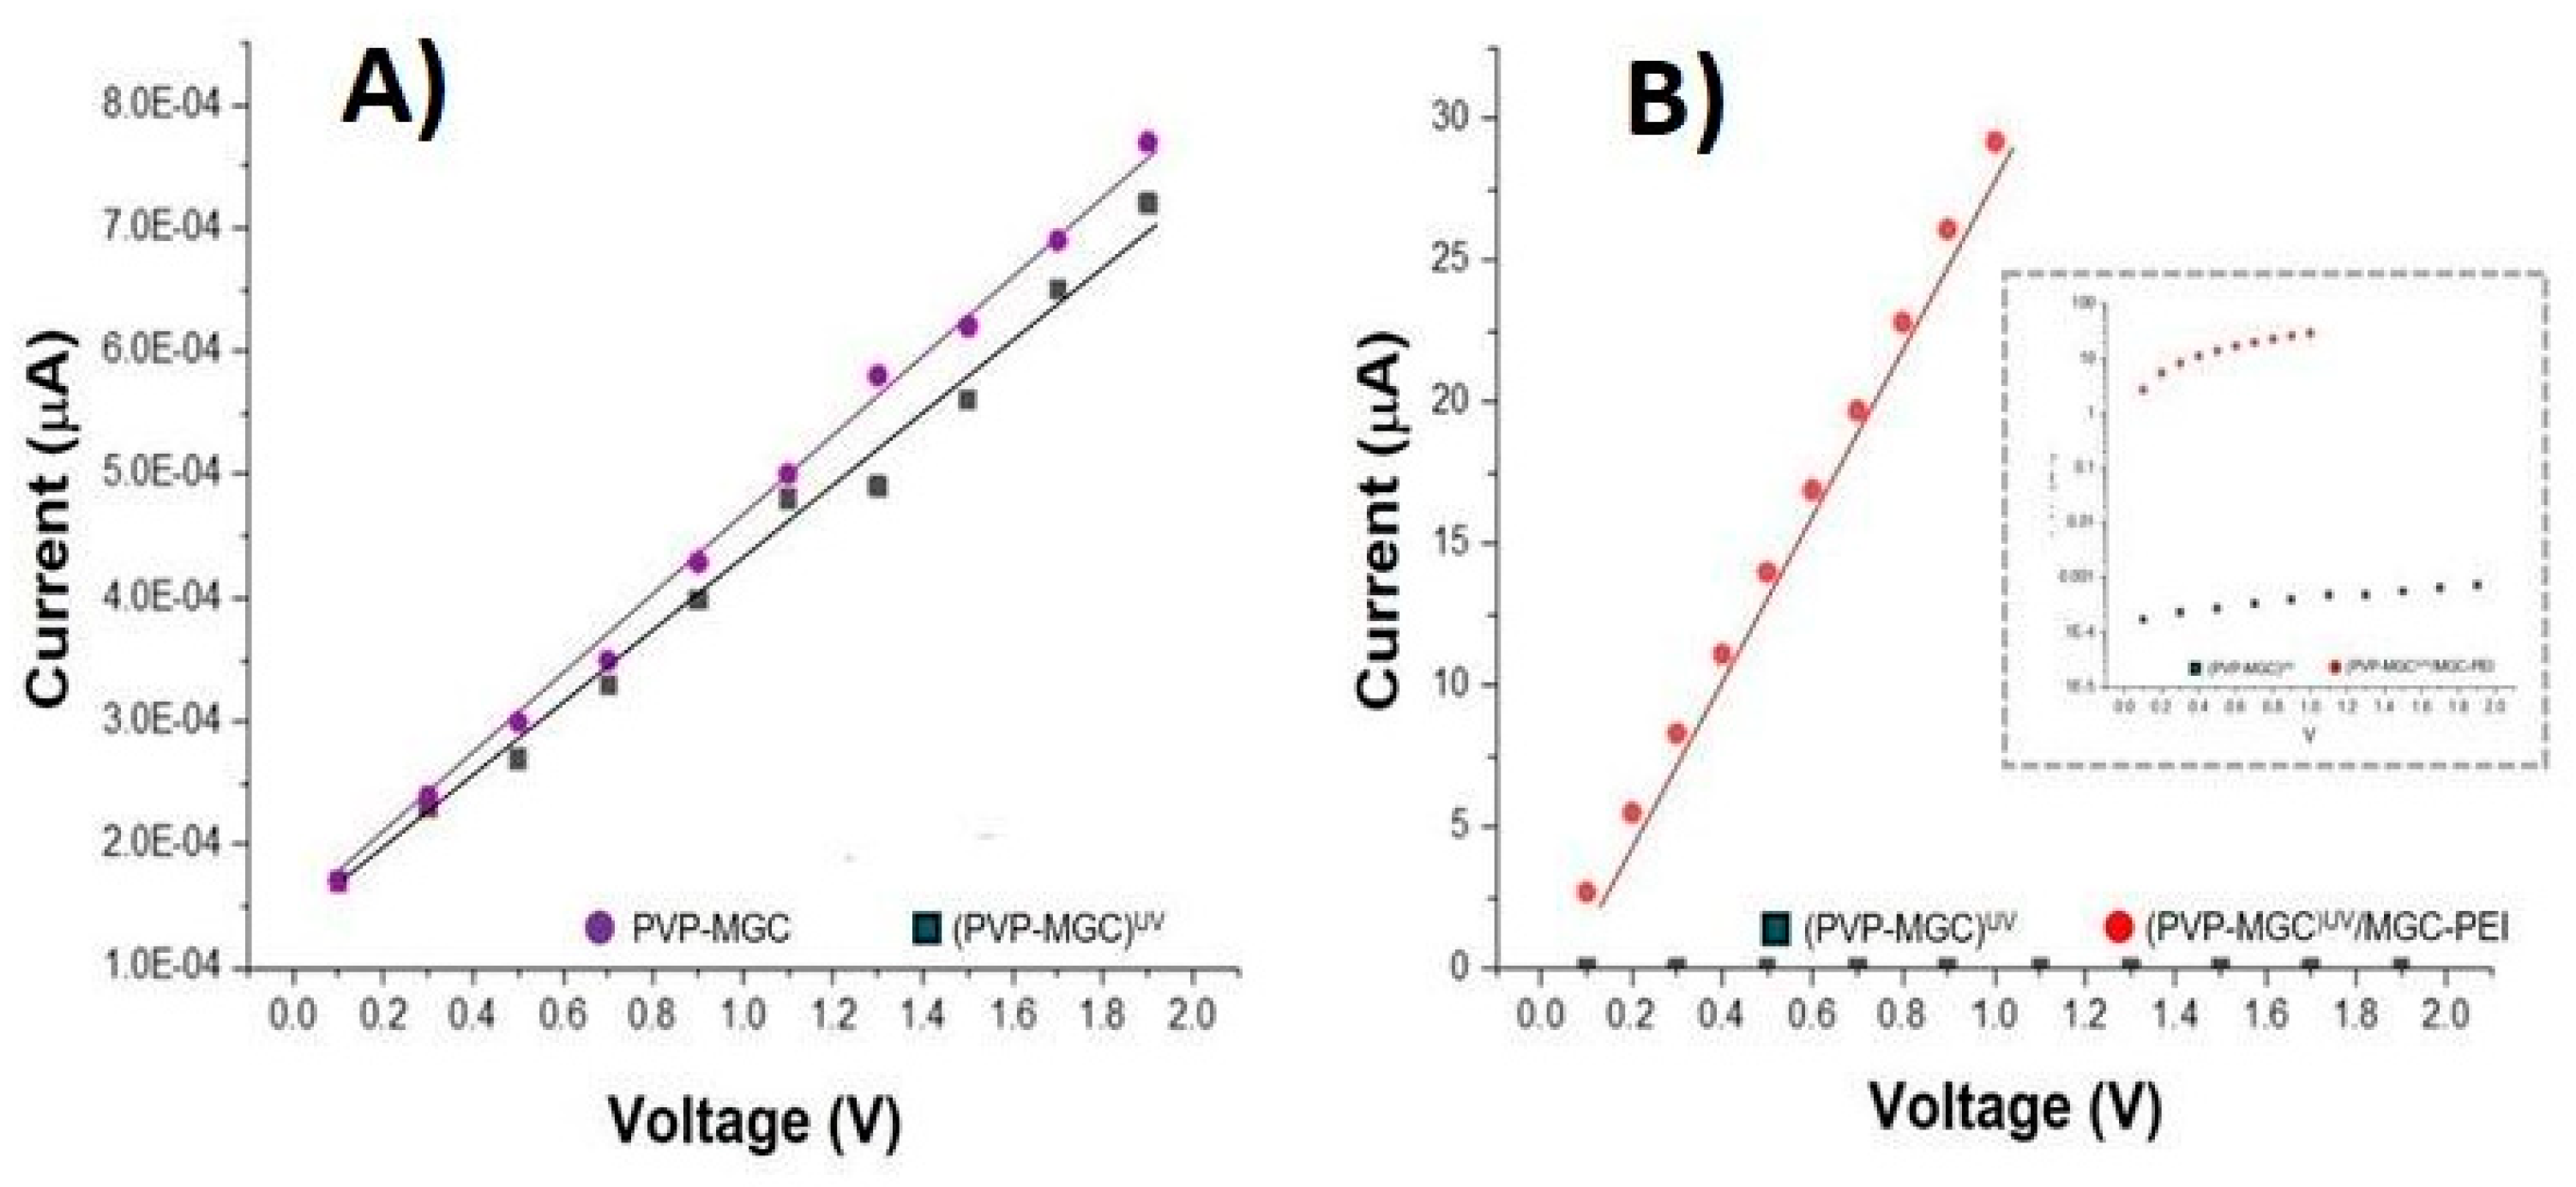
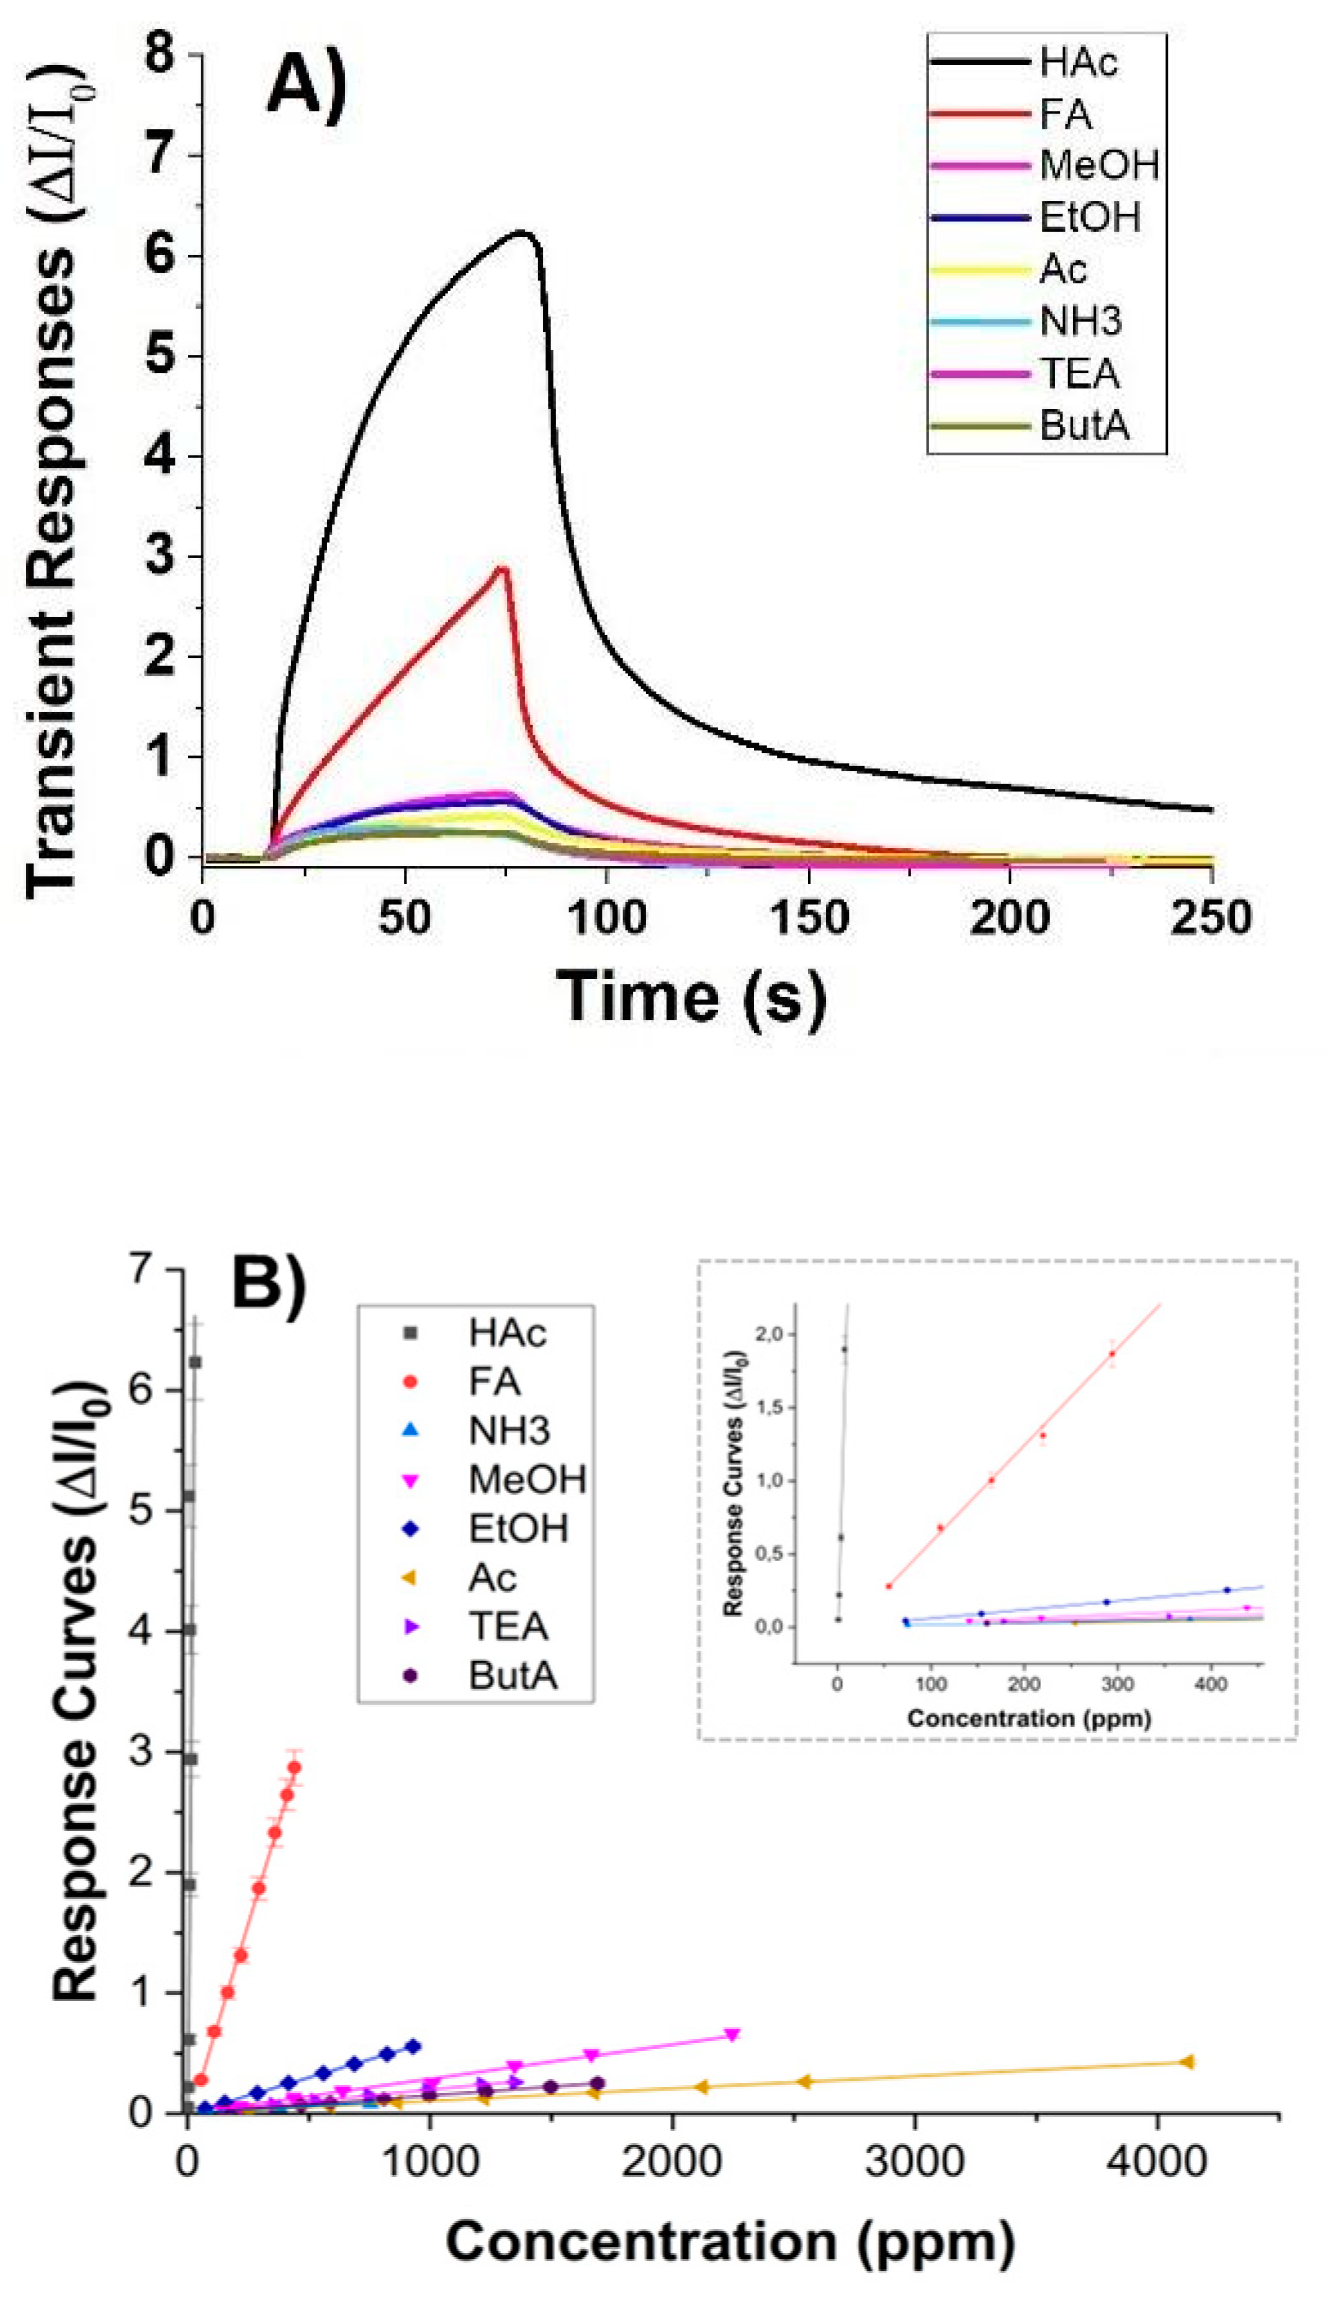
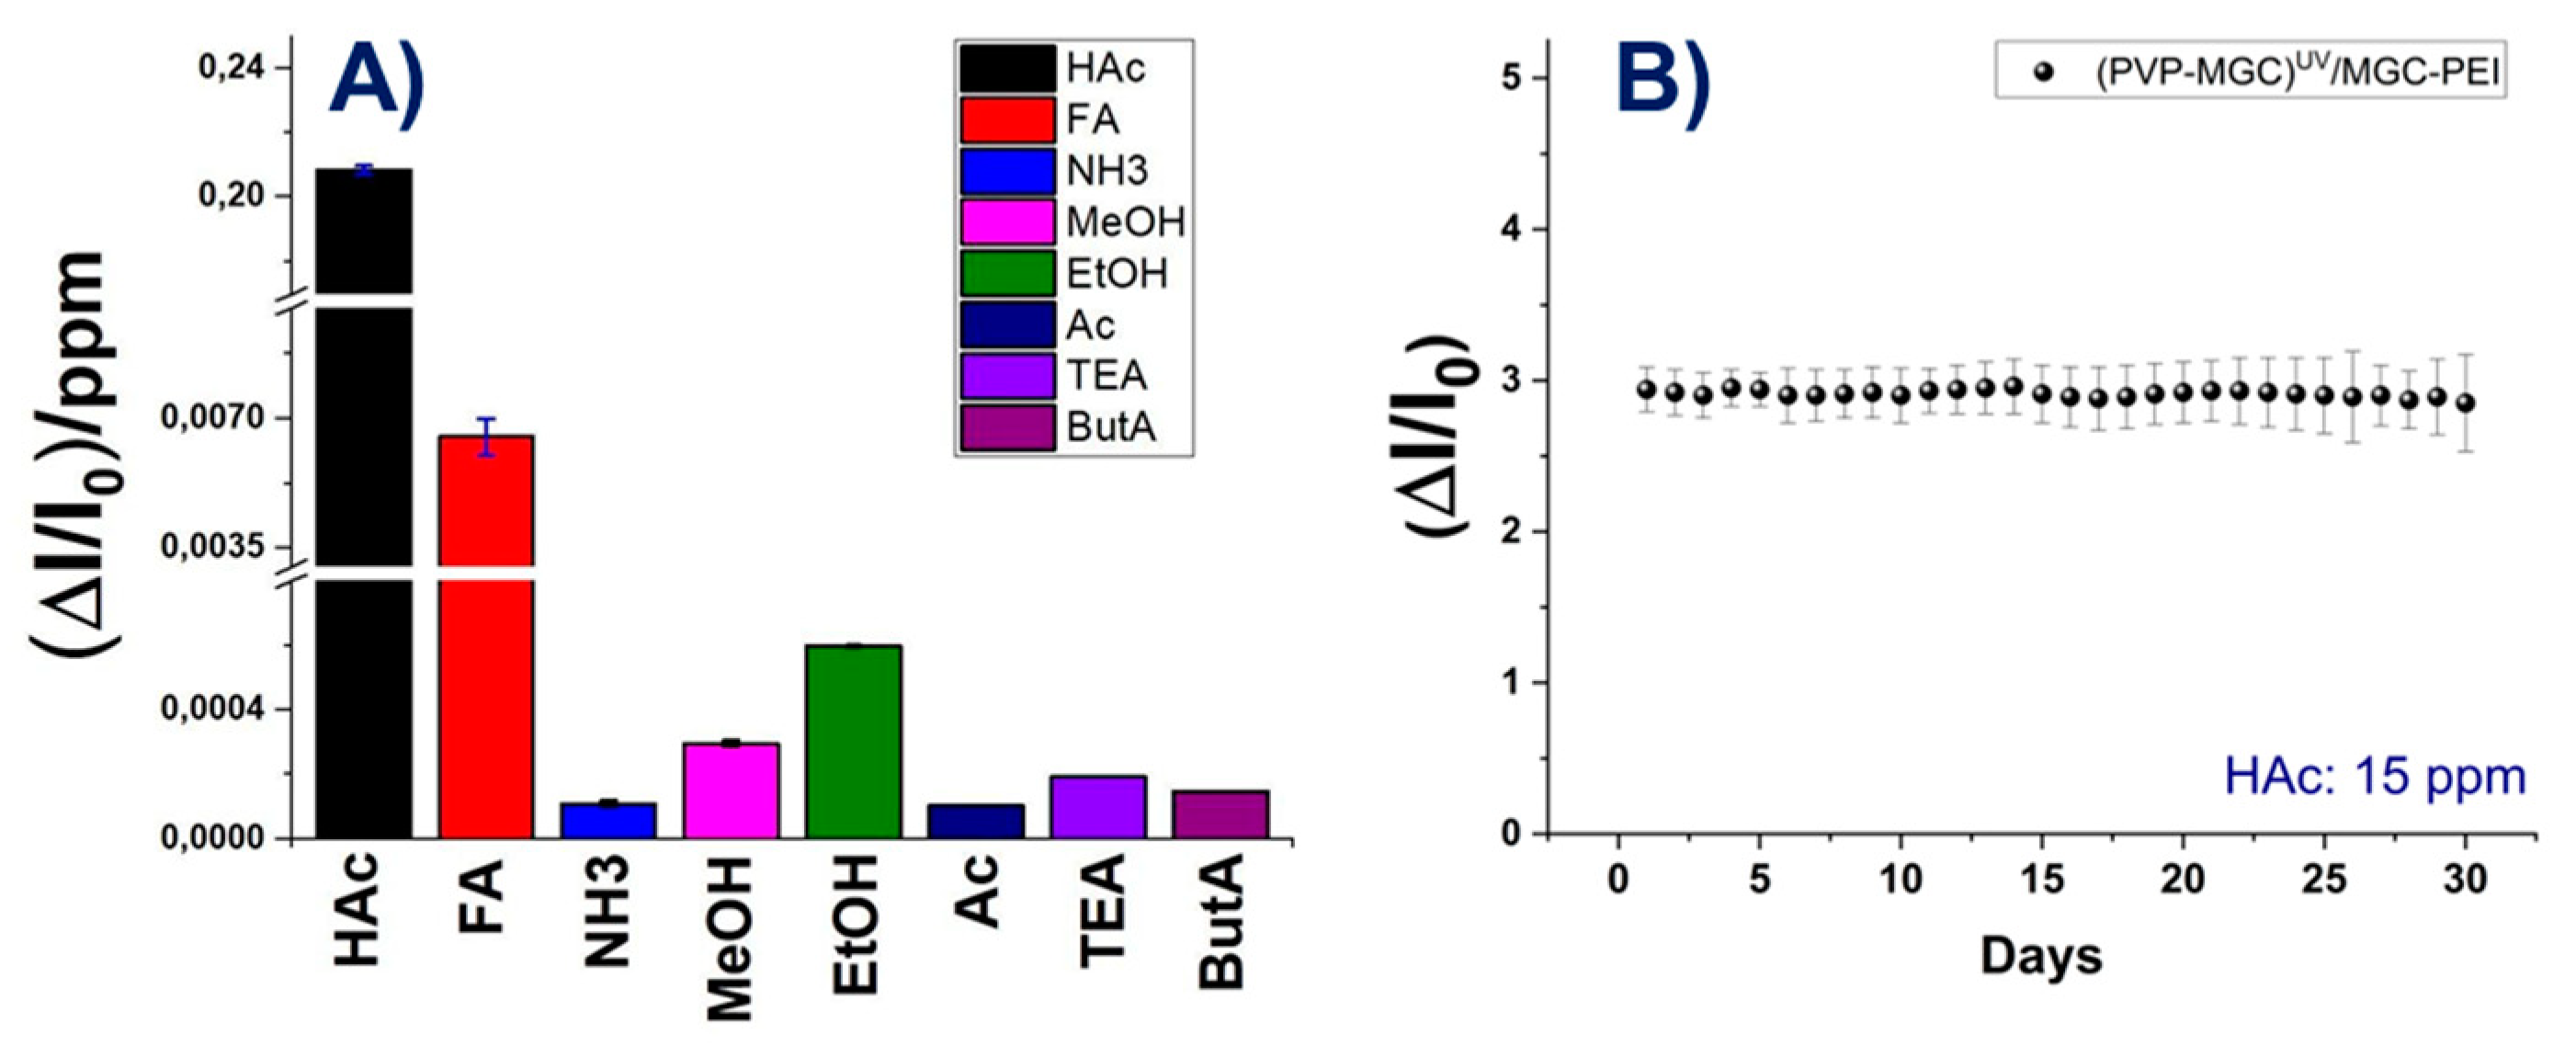
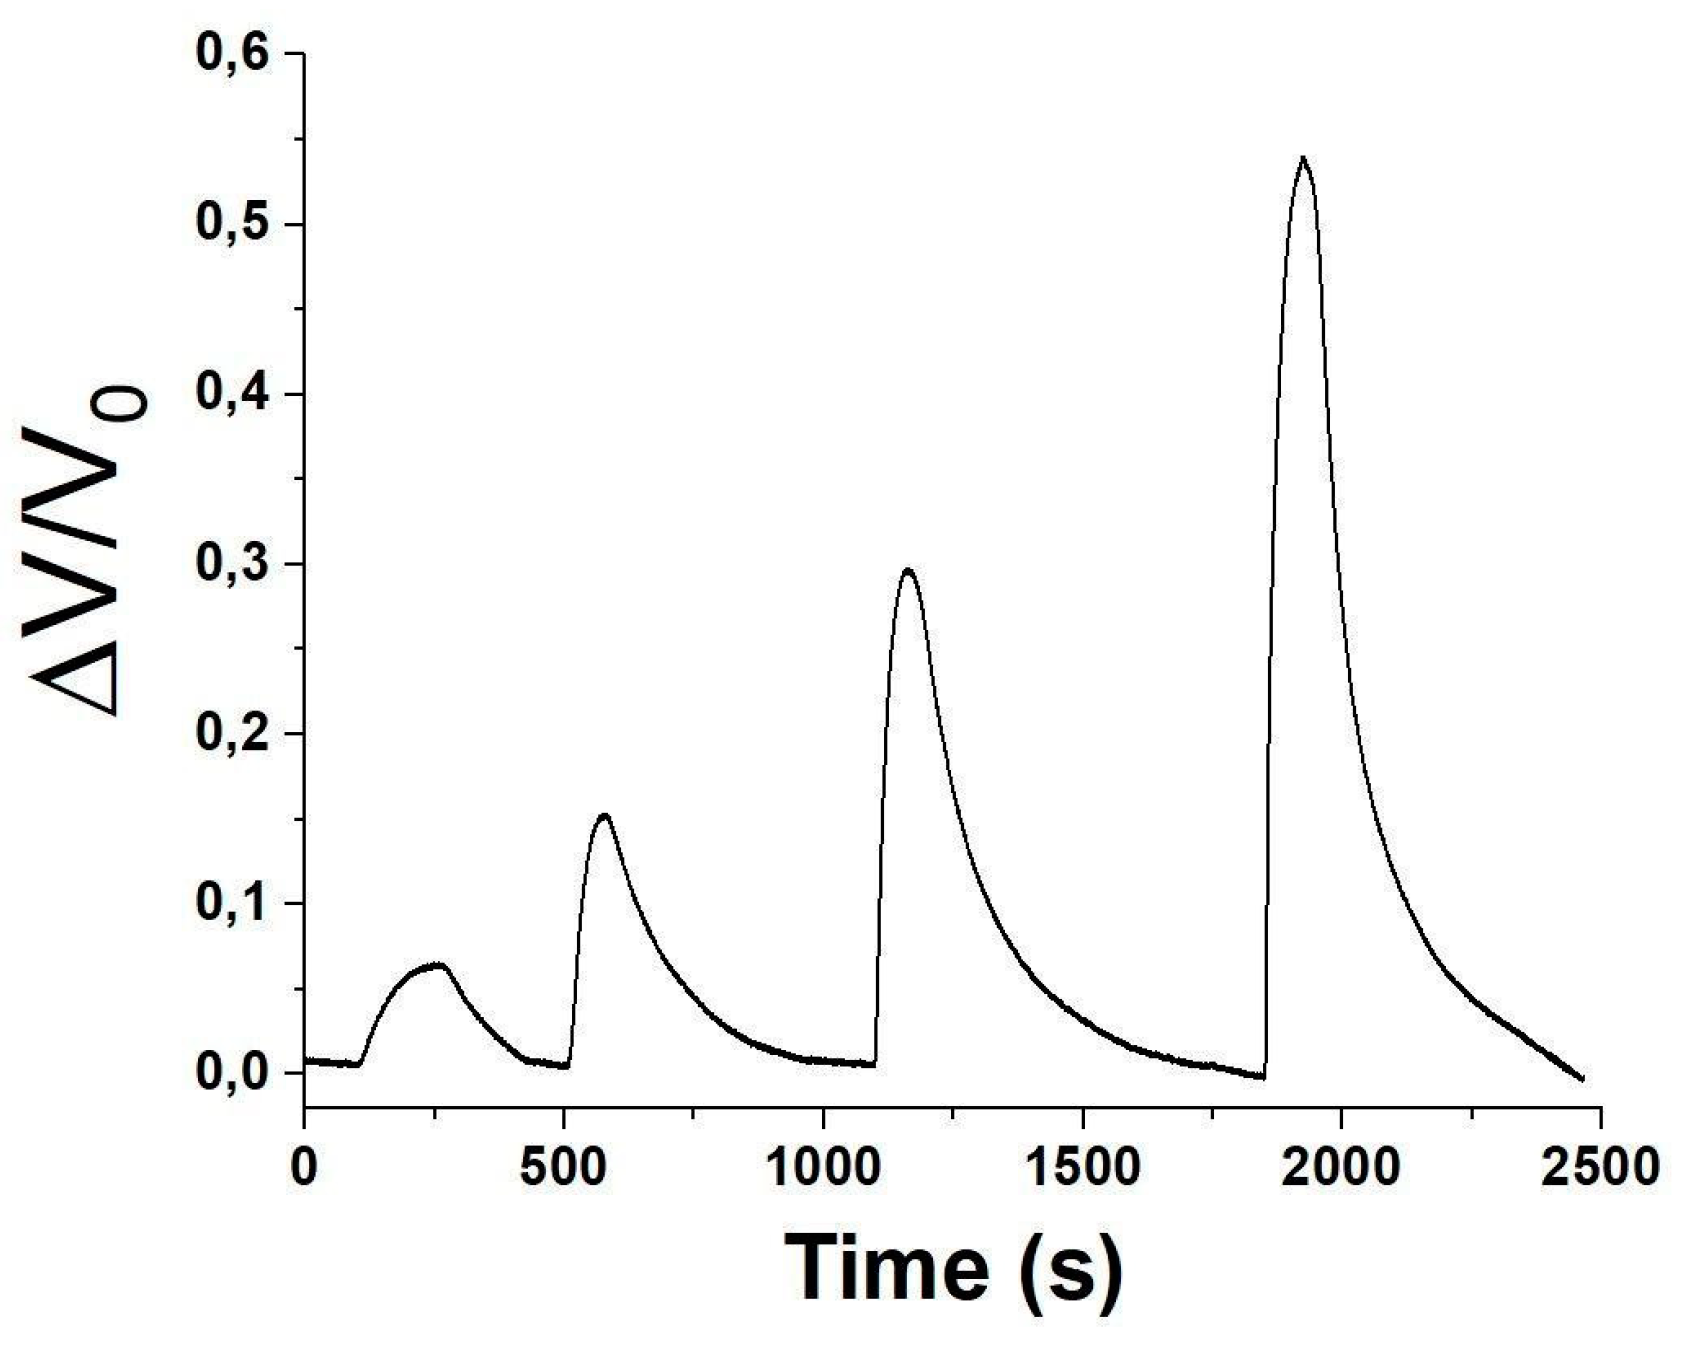
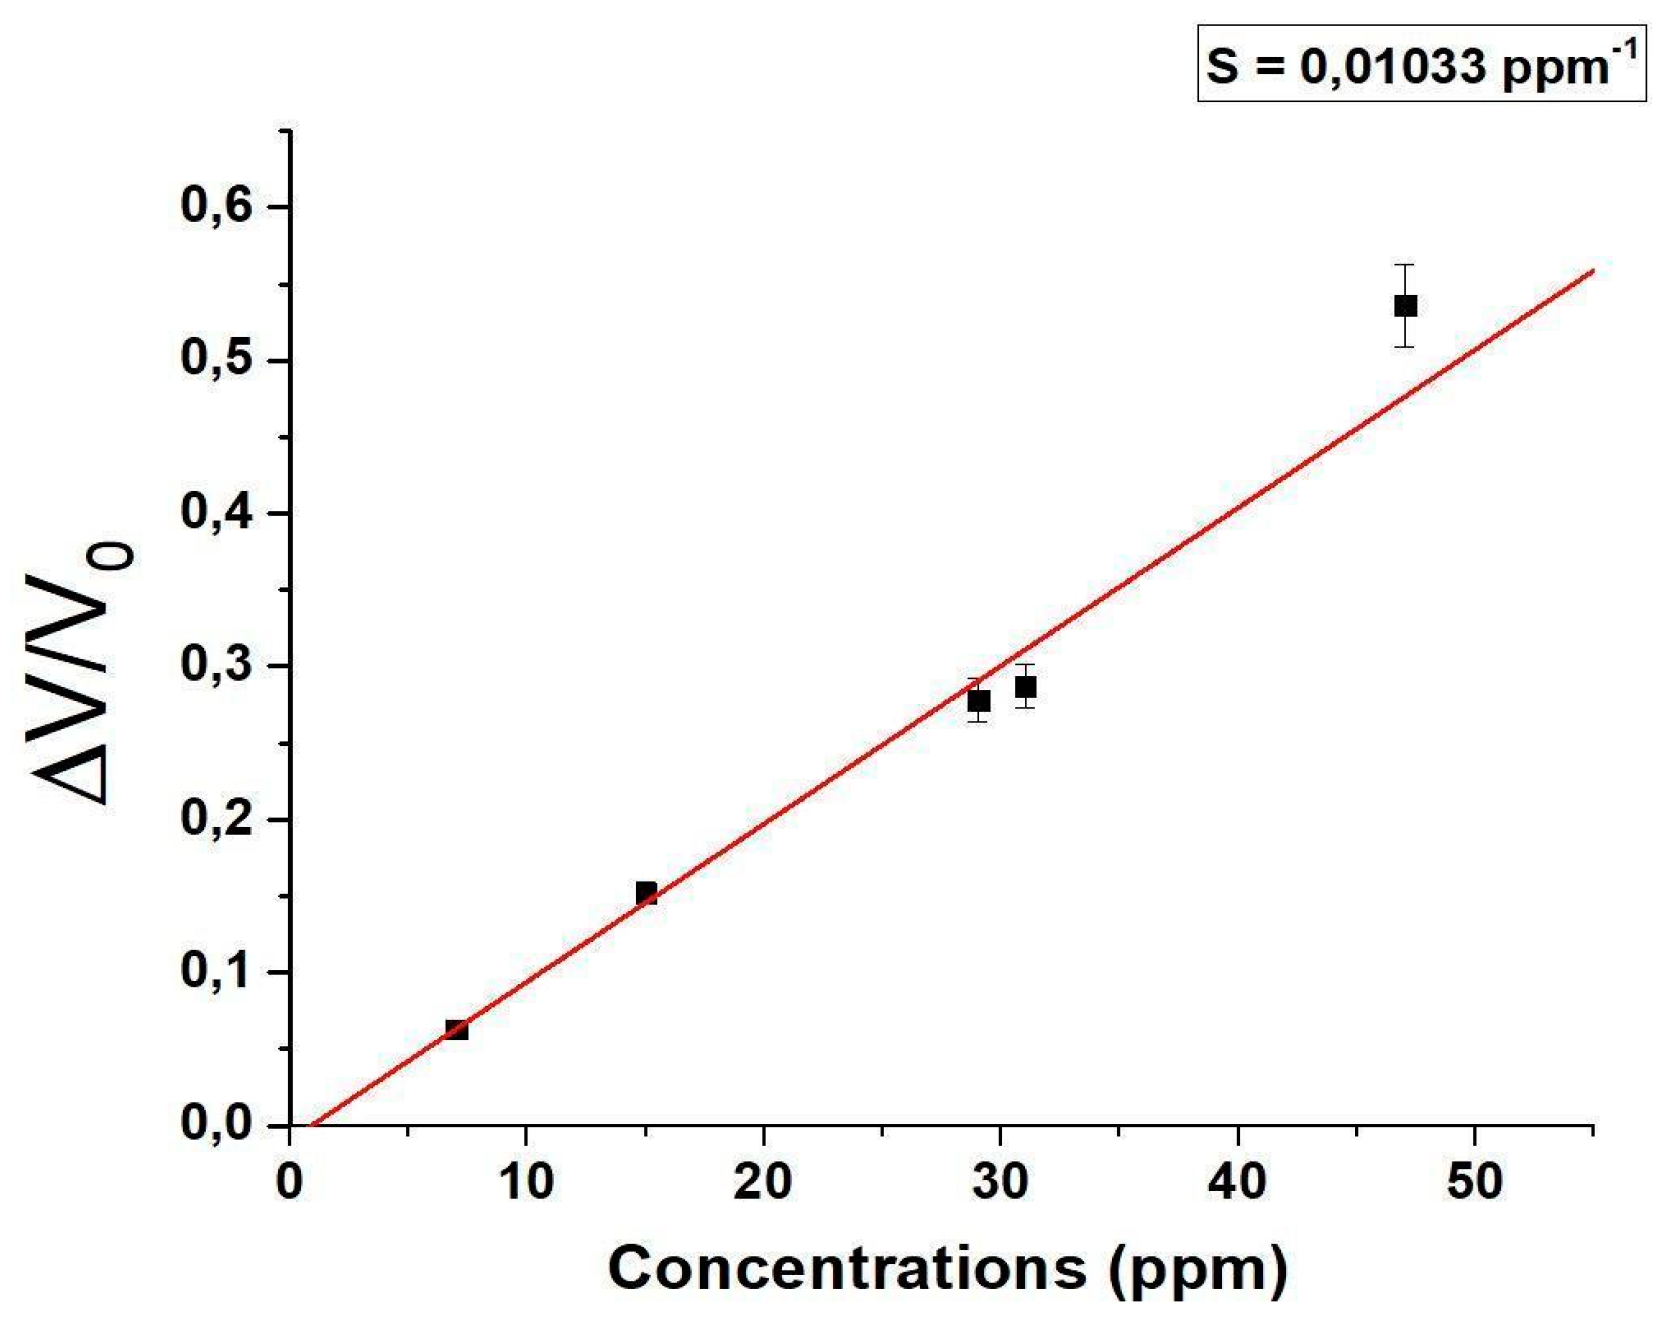
| Sensing Material | Type of sensor | Temperature (°C) | LOD | Reference |
|---|---|---|---|---|
| Pr-doped ZnO | Chemiresistor | 380 | 50 ppm | [13] |
| Y-doped SnO2 | Chemiresistor | 300 | 10 ppm | [65] |
| Ag-doped LaFeO3 | Chemiresistor | 150 | 0,5 ppm | [66] |
| Flower-like SnO2 | Chemiresistor | 260 | 1 ppm | [67] |
| CdSxSe1−xnanoribbons | Chemiresistor | 100 | 0,87 ppm | [68] |
| Gr:Au and Gr:Pt | Chemiresistor | rt | 0.6%/ppm | [69] |
| Hexagonal ZnO | Chemiresistor | 230 | 10 ppm | [16] |
| Tb2O3@MOF- ZnO | Chemiresistor | 20°C | 0,5 ppm | [17] |
| Bi2O2CO3 | Chemiresistor | 150°C | 1 ppm | [70] |
| Co-doped SnO2 | Chemiresistor | 300°C | 10 ppm | [71] |
| metal oxide (WO/SnO) | Chemiresistor | rt | 30 ppb | [72] |
| Sn3O4-RGO | Chemiresistor | rt | 64%/ppm | [61] |
| C-doped α-Fe2O3 | Chemiresistor | 260°C | 1 ppm | [73] |
| Y-doped ZnO | Chemiresistor | 350°C | 10 ppb | [12] |
| mesoporous CuO | Chemiresistor | 200°C | 10 ppm | [60] |
| BaSnO3 microtubes | Chemiresistor | 245°C | 0,3 ppm | [15] |
| ZnO foam | Chemiresistor | 400°C | 0,5 ppm | [74] |
| GeC3N4eSnO2 | Chemiresistor | 185°C | 0,1 ppm | [75] |
| MgGa2O4/graphene | Chemiresistor | rt | 1 ppb | [63] |
| In2O3 nanofibers | Chemiresistor | 250°C | 500 ppb | [21] |
| Mg-doped ZnO/rGO | Chemiresistor | 250°C | 10 ppm | [62] |
| GQDs–ZnO | Chemiresistor | rt | 1 ppm | [59] |
Disclaimer/Publisher’s Note: The statements, opinions and data contained in all publications are solely those of the individual author(s) and contributor(s) and not of MDPI and/or the editor(s). MDPI and/or the editor(s) disclaim responsibility for any injury to people or property resulting from any ideas, methods, instructions or products referred to in the content. |
© 2024 by the authors. Licensee MDPI, Basel, Switzerland. This article is an open access article distributed under the terms and conditions of the Creative Commons Attribution (CC BY) license (http://creativecommons.org/licenses/by/4.0/).


