1. Introduction
In the southeast coastal provinces of China, there is a significant quantity of low-lying structures, with the majority featuring double-slope roofs and eaves. In the statistics of typhoon disaster losses, the collapse of low-rise buildings under mountains and the casualties caused by them account for a considerable proportion. Hence, examining the wind pressure distribution of low-rise buildings and the impact of various mountain placements on wind loads is imperative. This will offer essential backing for the design of wind-resistant structures and the prevention of disasters in low-rise buildings.
Wind load’s interference effect between low-rise buildings is primarily influenced by factors such as wind direction, the ratio of spacing between adjacent buildings, the density and arrangement of building groups, as well as the height of surrounding buildings. Various researchers, both domestic and international, have conducted studies on the impact of wind load interference among low-rise structures. For instance, Fan Youchuan [1] and T. Van Hooff [2]examined the wind-induced interference effect on a single factory building as well as two consecutive factory buildings. They conducted wind tunnel tests to analyze the alterations in wind direction and building spacing. Akon and Kop [3] examined the wind pressure and re-attachment distance on a level rooftop under varying the incoming airflow’s turbulence intensities. Their findings revealed that increasing the turbulence intensity of the incoming airflow considerably reduces the re-attachment distance and increases the wind pressure. Holmes [4] examined the impact of wind-induced interference among multi-row structures and found that the alteration in spacing between preceding buildings and target structures had a more significant effect on the interference than the influence of preceding rows of buildings.
(3) Building density: Quan yong et al. The impact of altering the density of the building area surrounding a structure of similar size on the flat roof’s wind pressure coefficient was examined using a rigid model. It was determined that as the density of surrounding buildings increased, the maximum negative pressure on different areas of the target building's roof decreased and eventually became more consistent. The roof’s minimum wind pressure decreases on the single building when the area densities of the surrounding building increase. Chang et al.[6] and Yong et al.[7] shows that the distance between buildings and the height ratio between buildings will have a great influence on the "occlusion effect" of disturbed buildings. Wind tunnel experiments were conducted by Huai-Yu Zhong[8] to examine the impact of different sheltering conditions.
YONG C.K.[9] employed the wind tunnel testing technique to evaluate the wind load on a flat roof building model that was encircled by buildings of identical dimensions. The findings indicate that the disruptive element of the least favorable adverse wind pressure of the disrupted structure exceeds 1.0 when the nearby buildings have a low relative height. When the surrounding building’s height is below 1.0, the interference factor declines as the surrounding building’s height rises. However, when the surrounding building’s height surpasses 1.0, the impact of height on the interference factor is not significant. The impact of various roof forms on the airflow around low-rise buildings was examined by Zhixiang Liu[10] and Tominaga et al[13]. Researchers[11,12] conducted wind tunnel tests utilizing PIV technology to investigate how various roof angles impact the airflow patterns surrounding a gable-roof structure. The researchers discovered that the diversity of roof inclinations had an impact on the swirling pattern within the area behind the model.
There are many factors that affect the wind pressure distribution between buildings. This paper conducts a comprehensive investigation into the impact of altering the relative position of the building and the mountain of the double-slope roof structure.
2. Wind Tunnel Test Experiments
Wind Tunnel Tests are conducted at the Department of Civil Engineering at Hunan University. The working section has a width of 3.0 miles, a height of 2.5 miles, and a length of 10 miles.
2.1. Full-Sized Physical Model
Simulating the atmospheric boundary layer involves representing it as a geometric scale of 1:40. As shown in
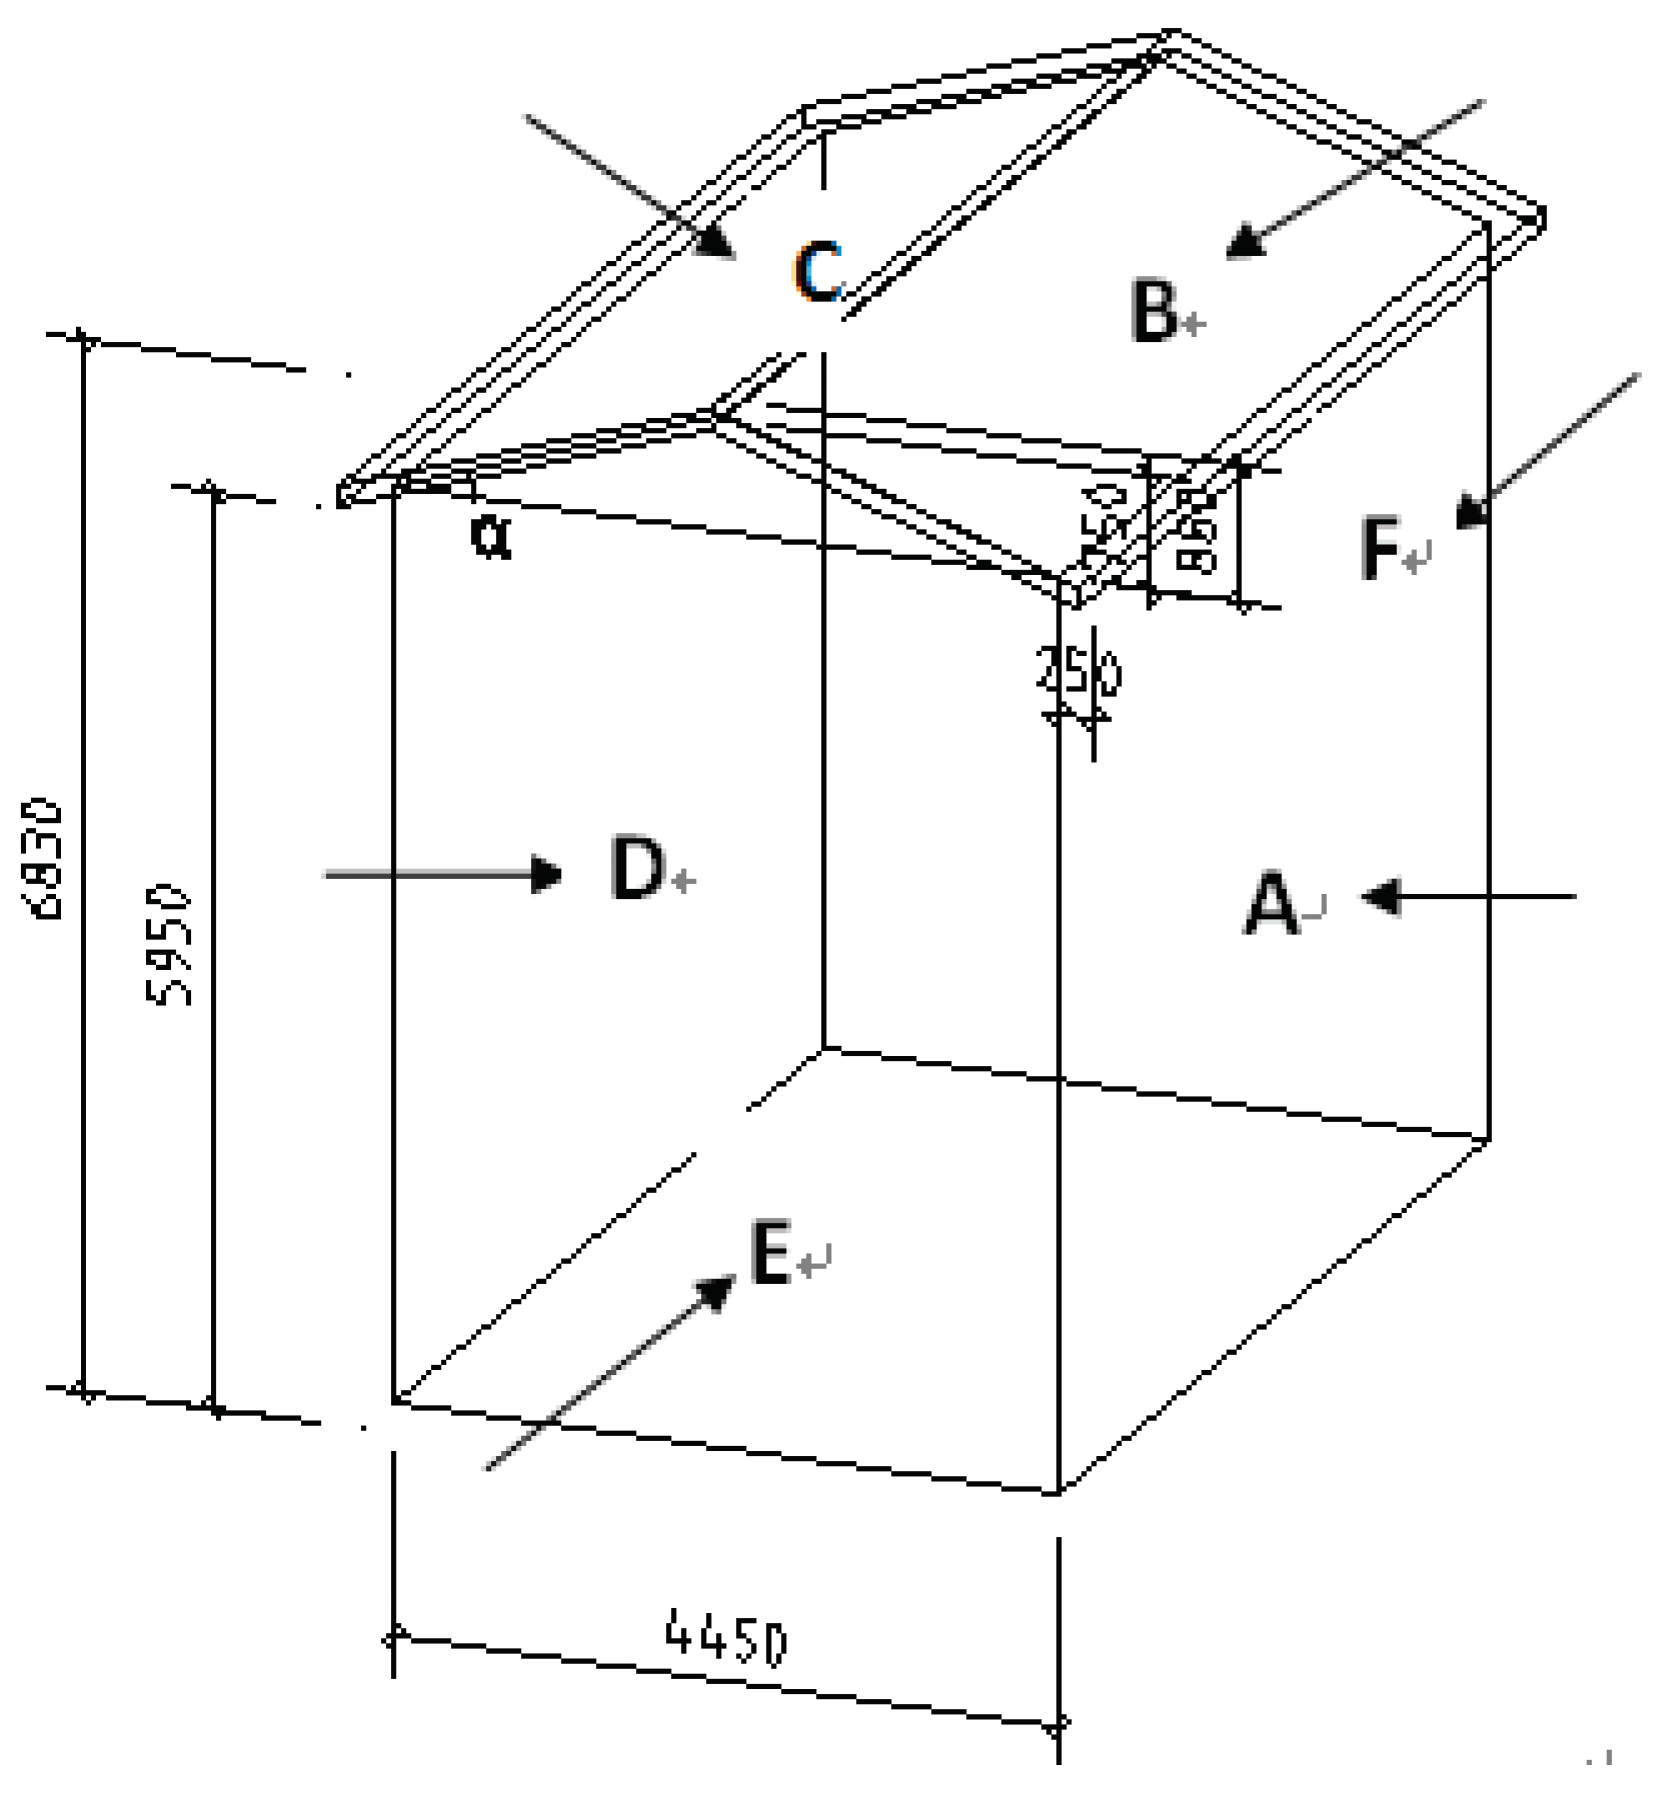
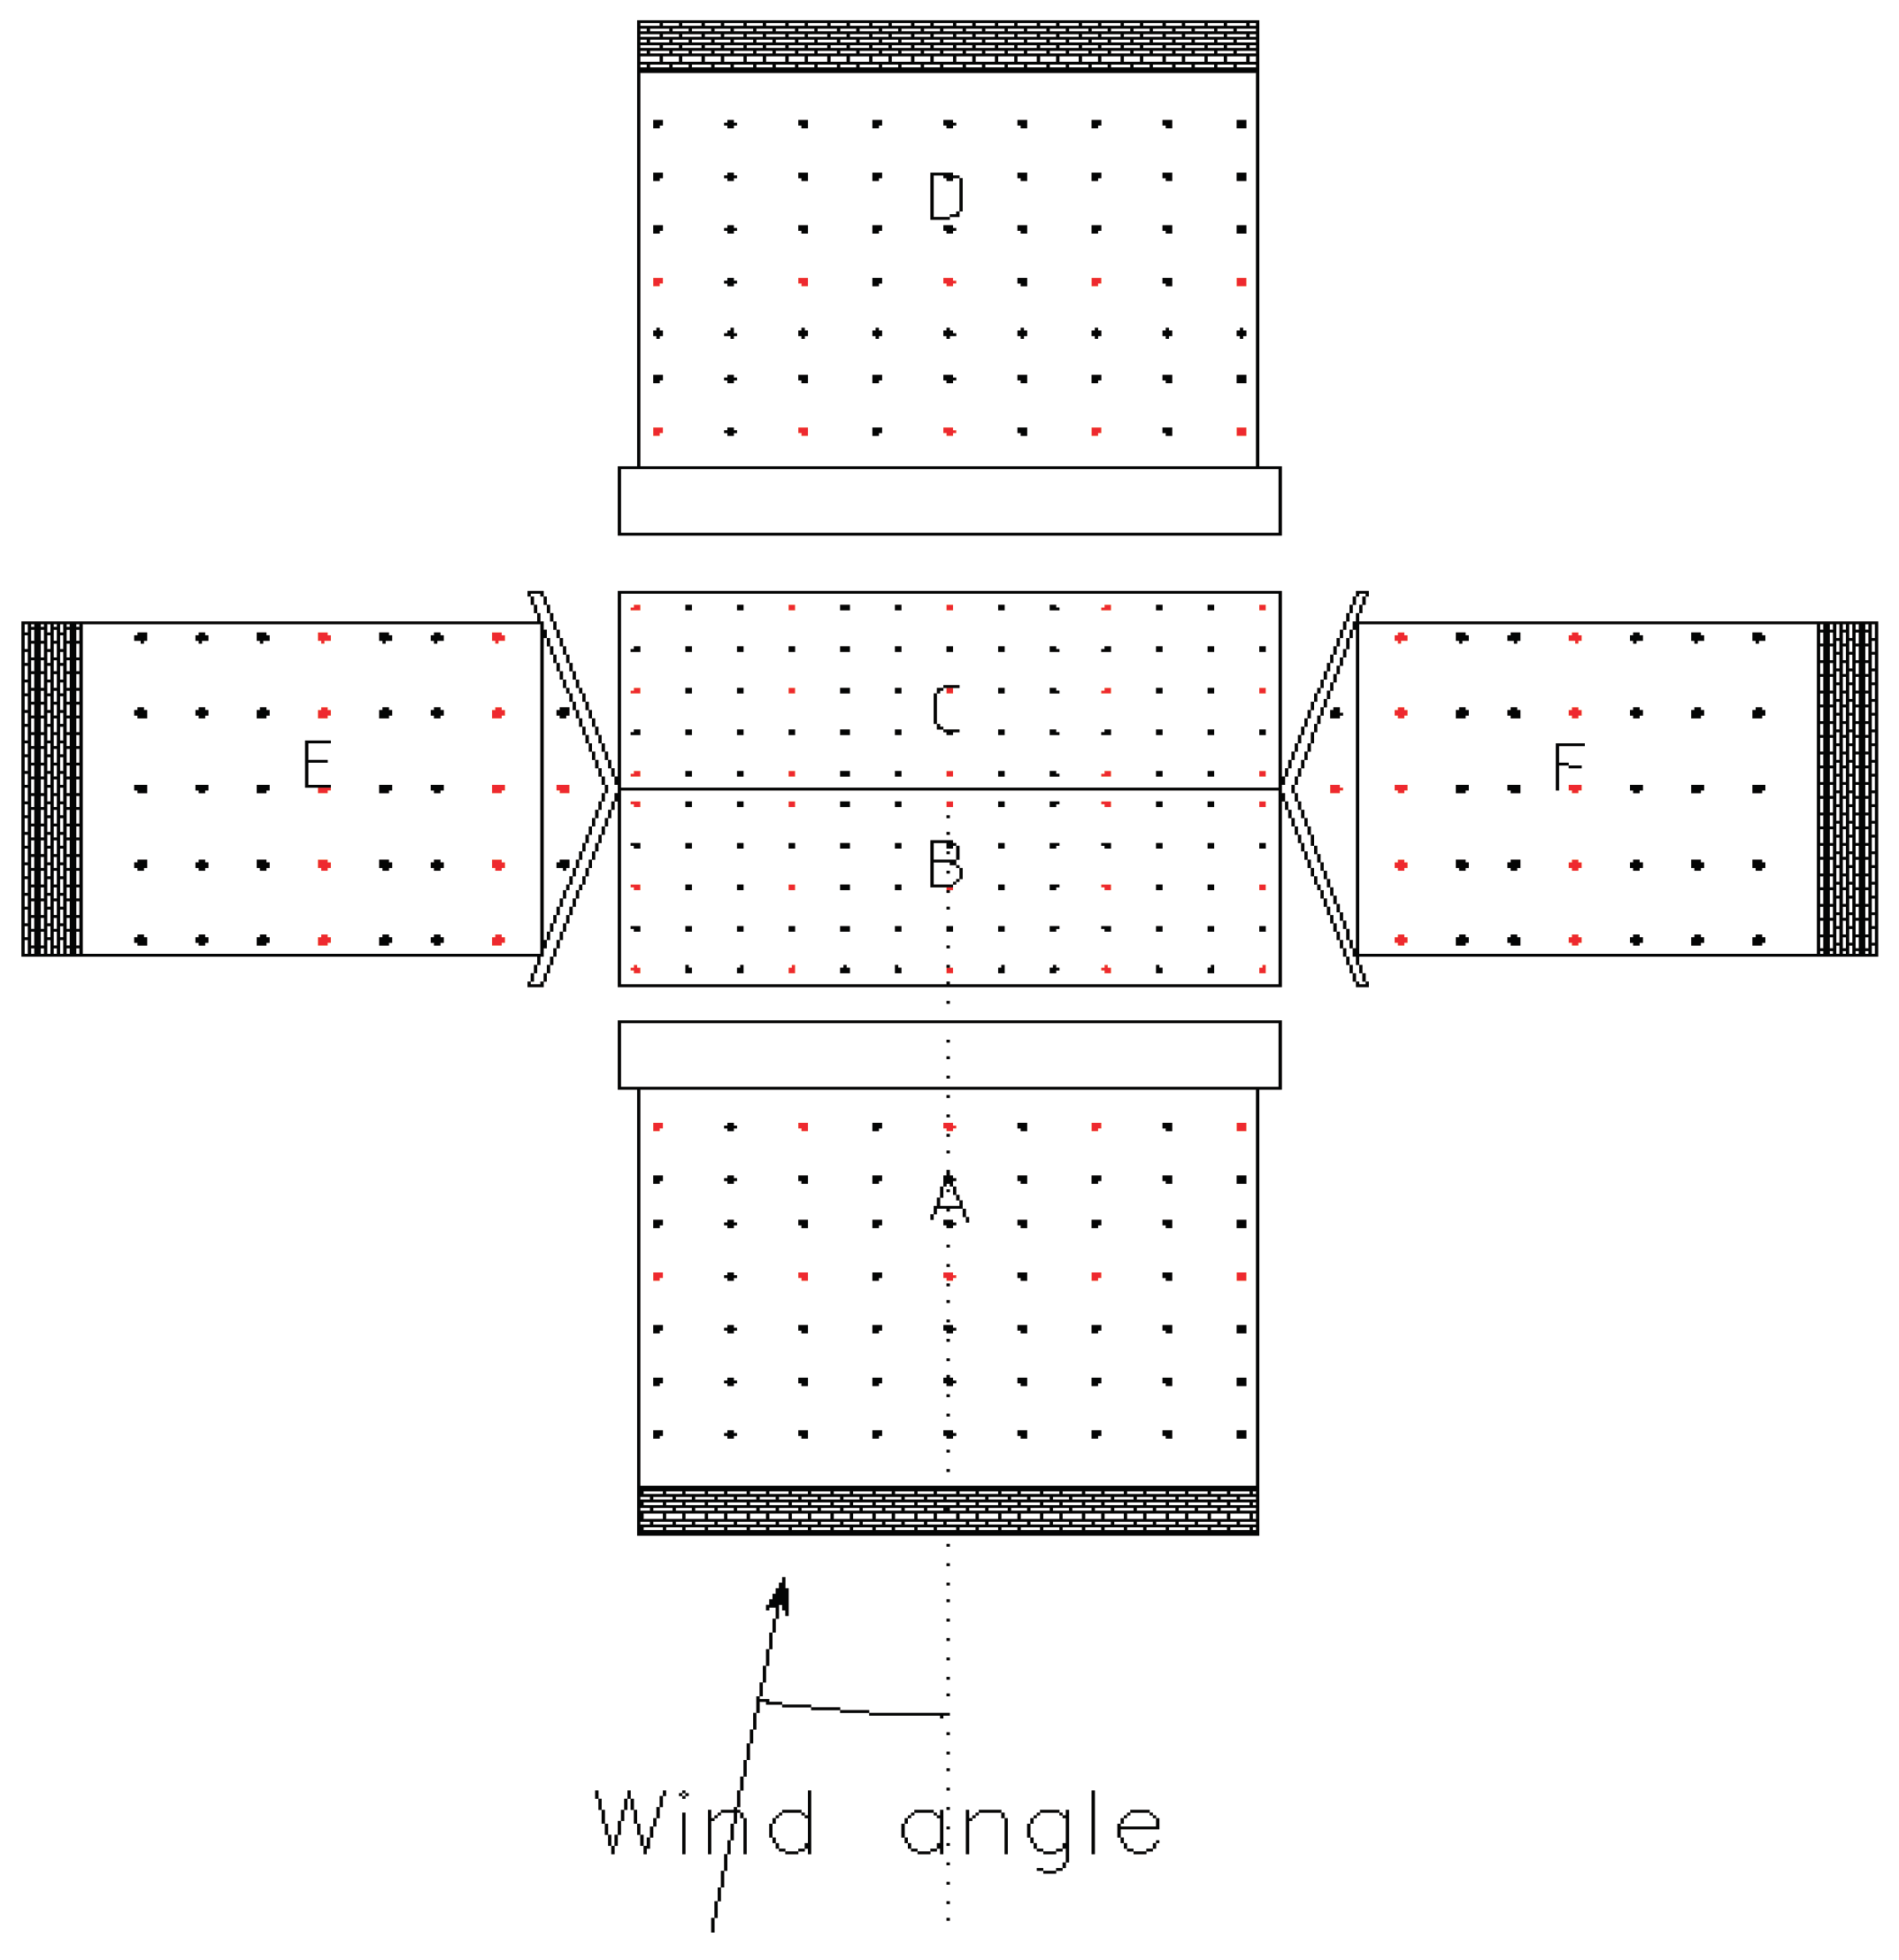
Figure 1, the design of the building's physical scale model is derived from the prevalent low-rise structures found in China. The dimensions of the actual mountain model are determined by the specifications outlined in the 'Code for Structural Loads on Building (GB50009-2012)', which includes guidelines for constructing a low-rise building situated close to a mountain.
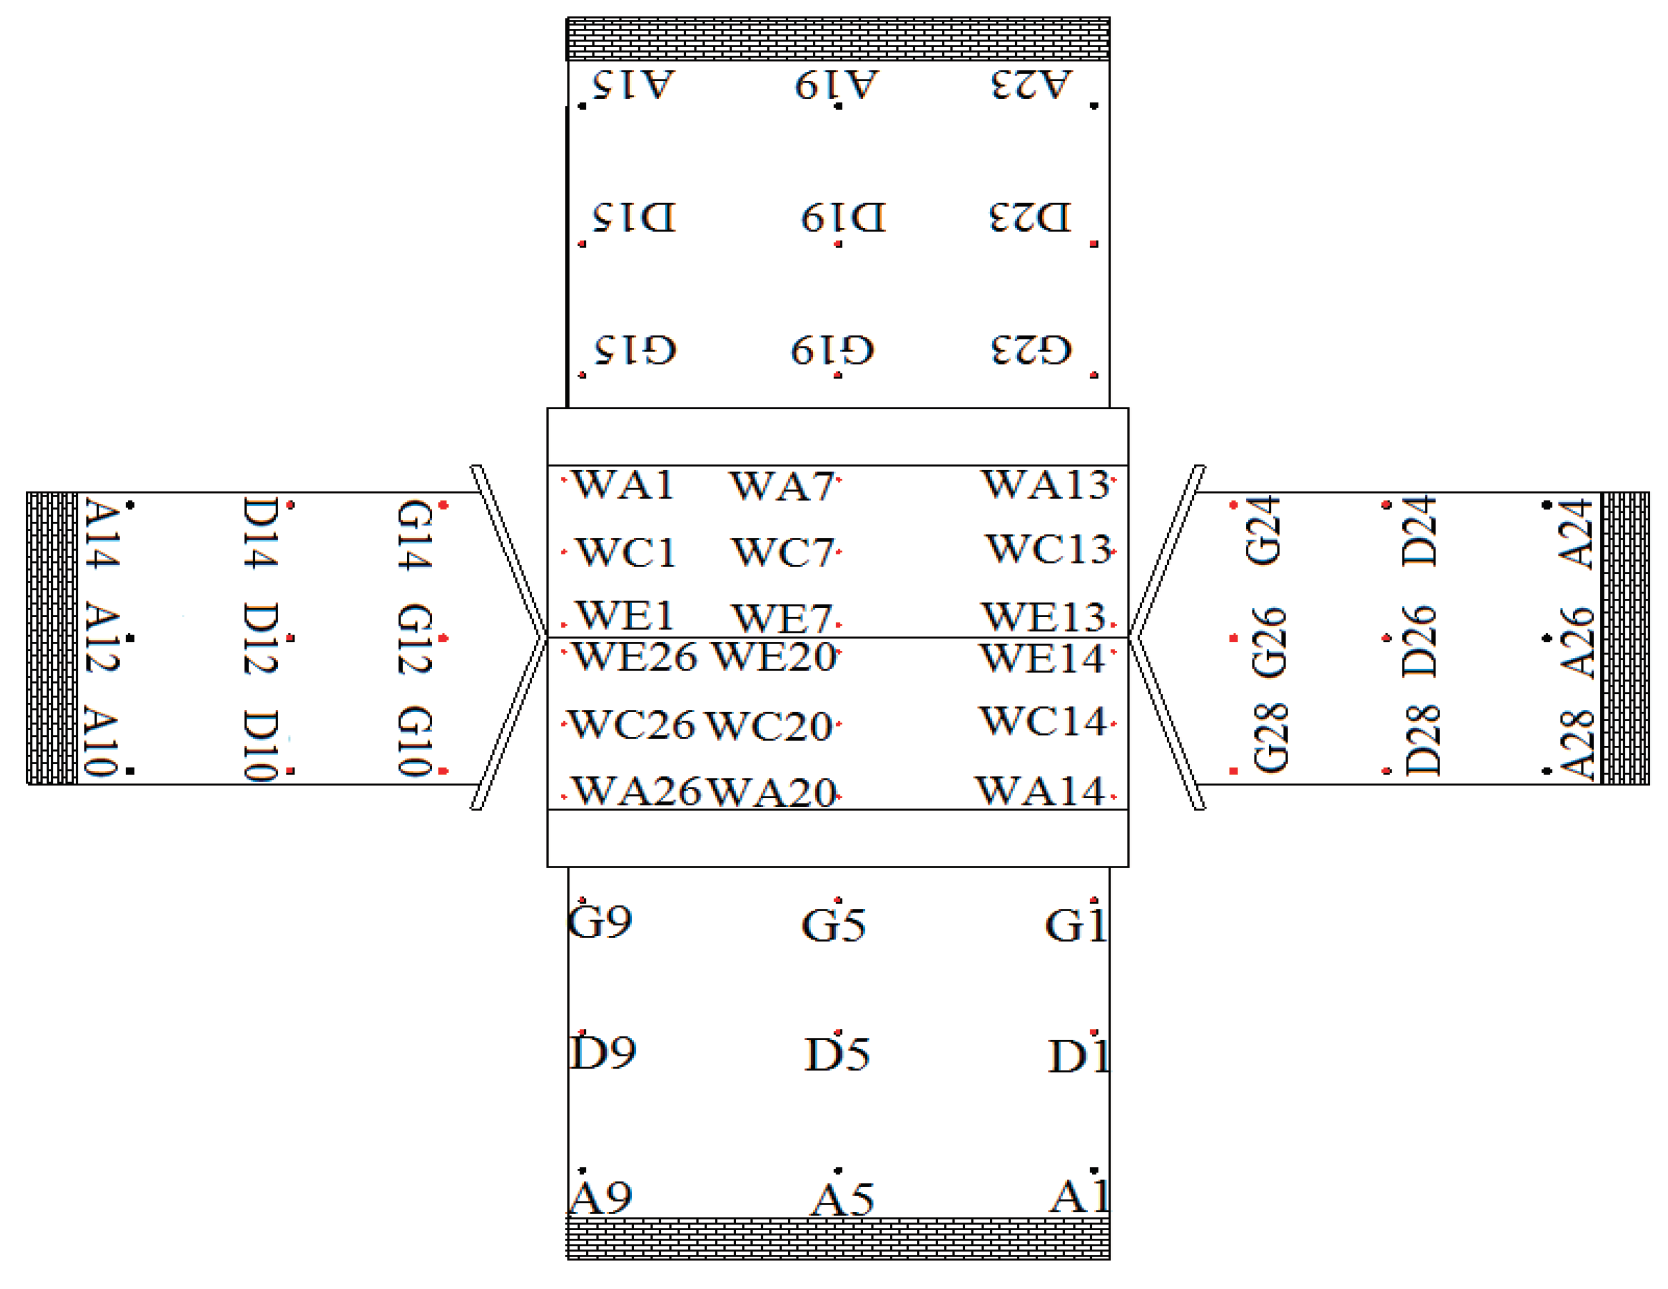
A 1:40 scale model of a building is constructed to depict a structure measuring 6.83m high (H), 4.45m wide (W), and 7.5m long (L). The roof had an extension of 0.25m from the side of the building. Testing points for pressure taps can be found on walls, the roof, and both sides of the eaves. The total number of testing points is 374, with 202 on the walls, 130 on the roof, and 42 on the eaves. The pressure testing points are shown in
Figure 2.
2.2. Experimental Operating Conditions
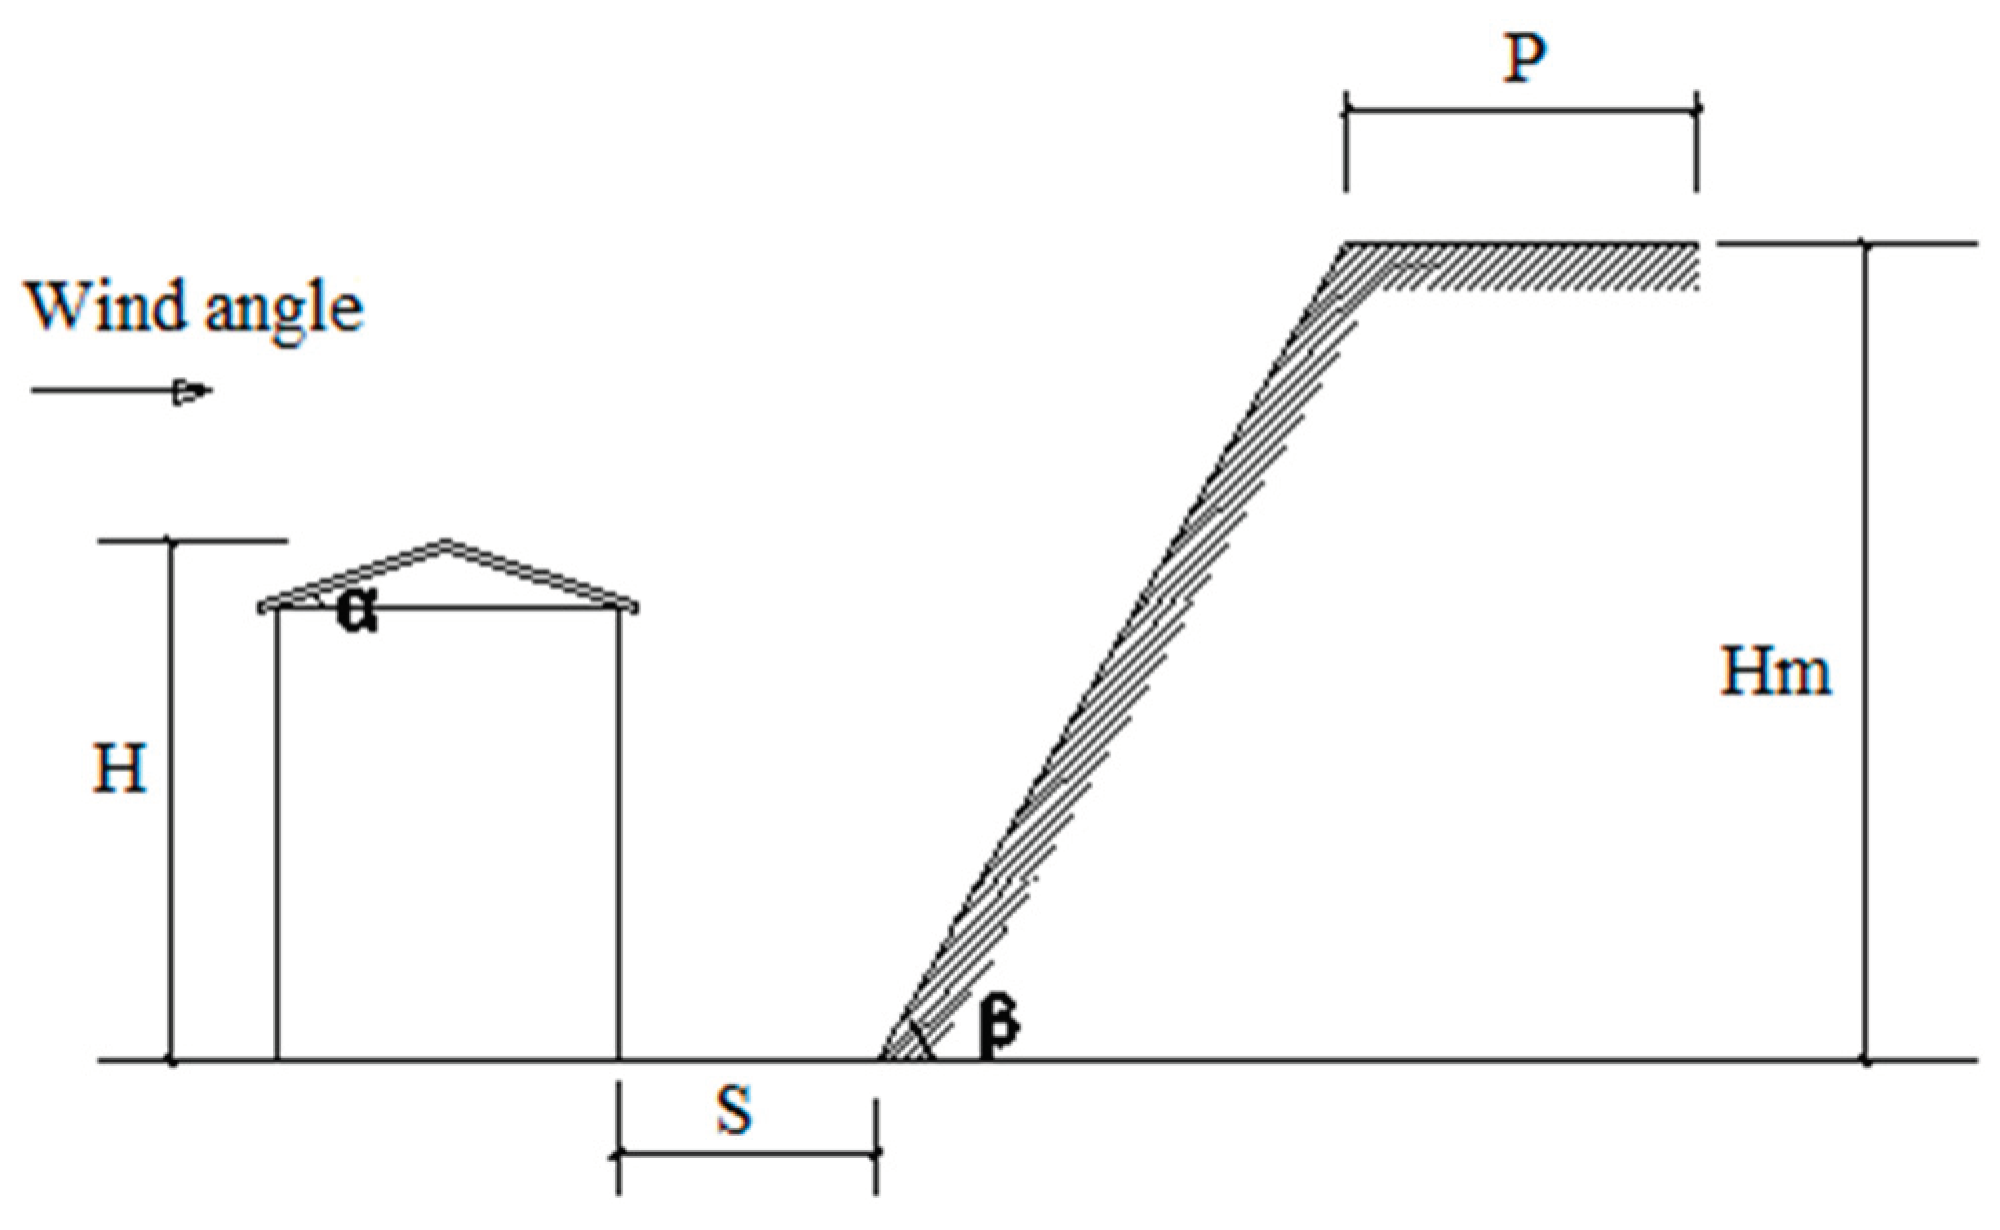
Figure 3 shows the position of the experimental model and the mountain. The low-rise building’s height is represented by
H, while the hillside height is represented by
Hm. The hillside slope is represented by
β, and the roof slope is represented by
α. The distance between the hillside and the house is represented by
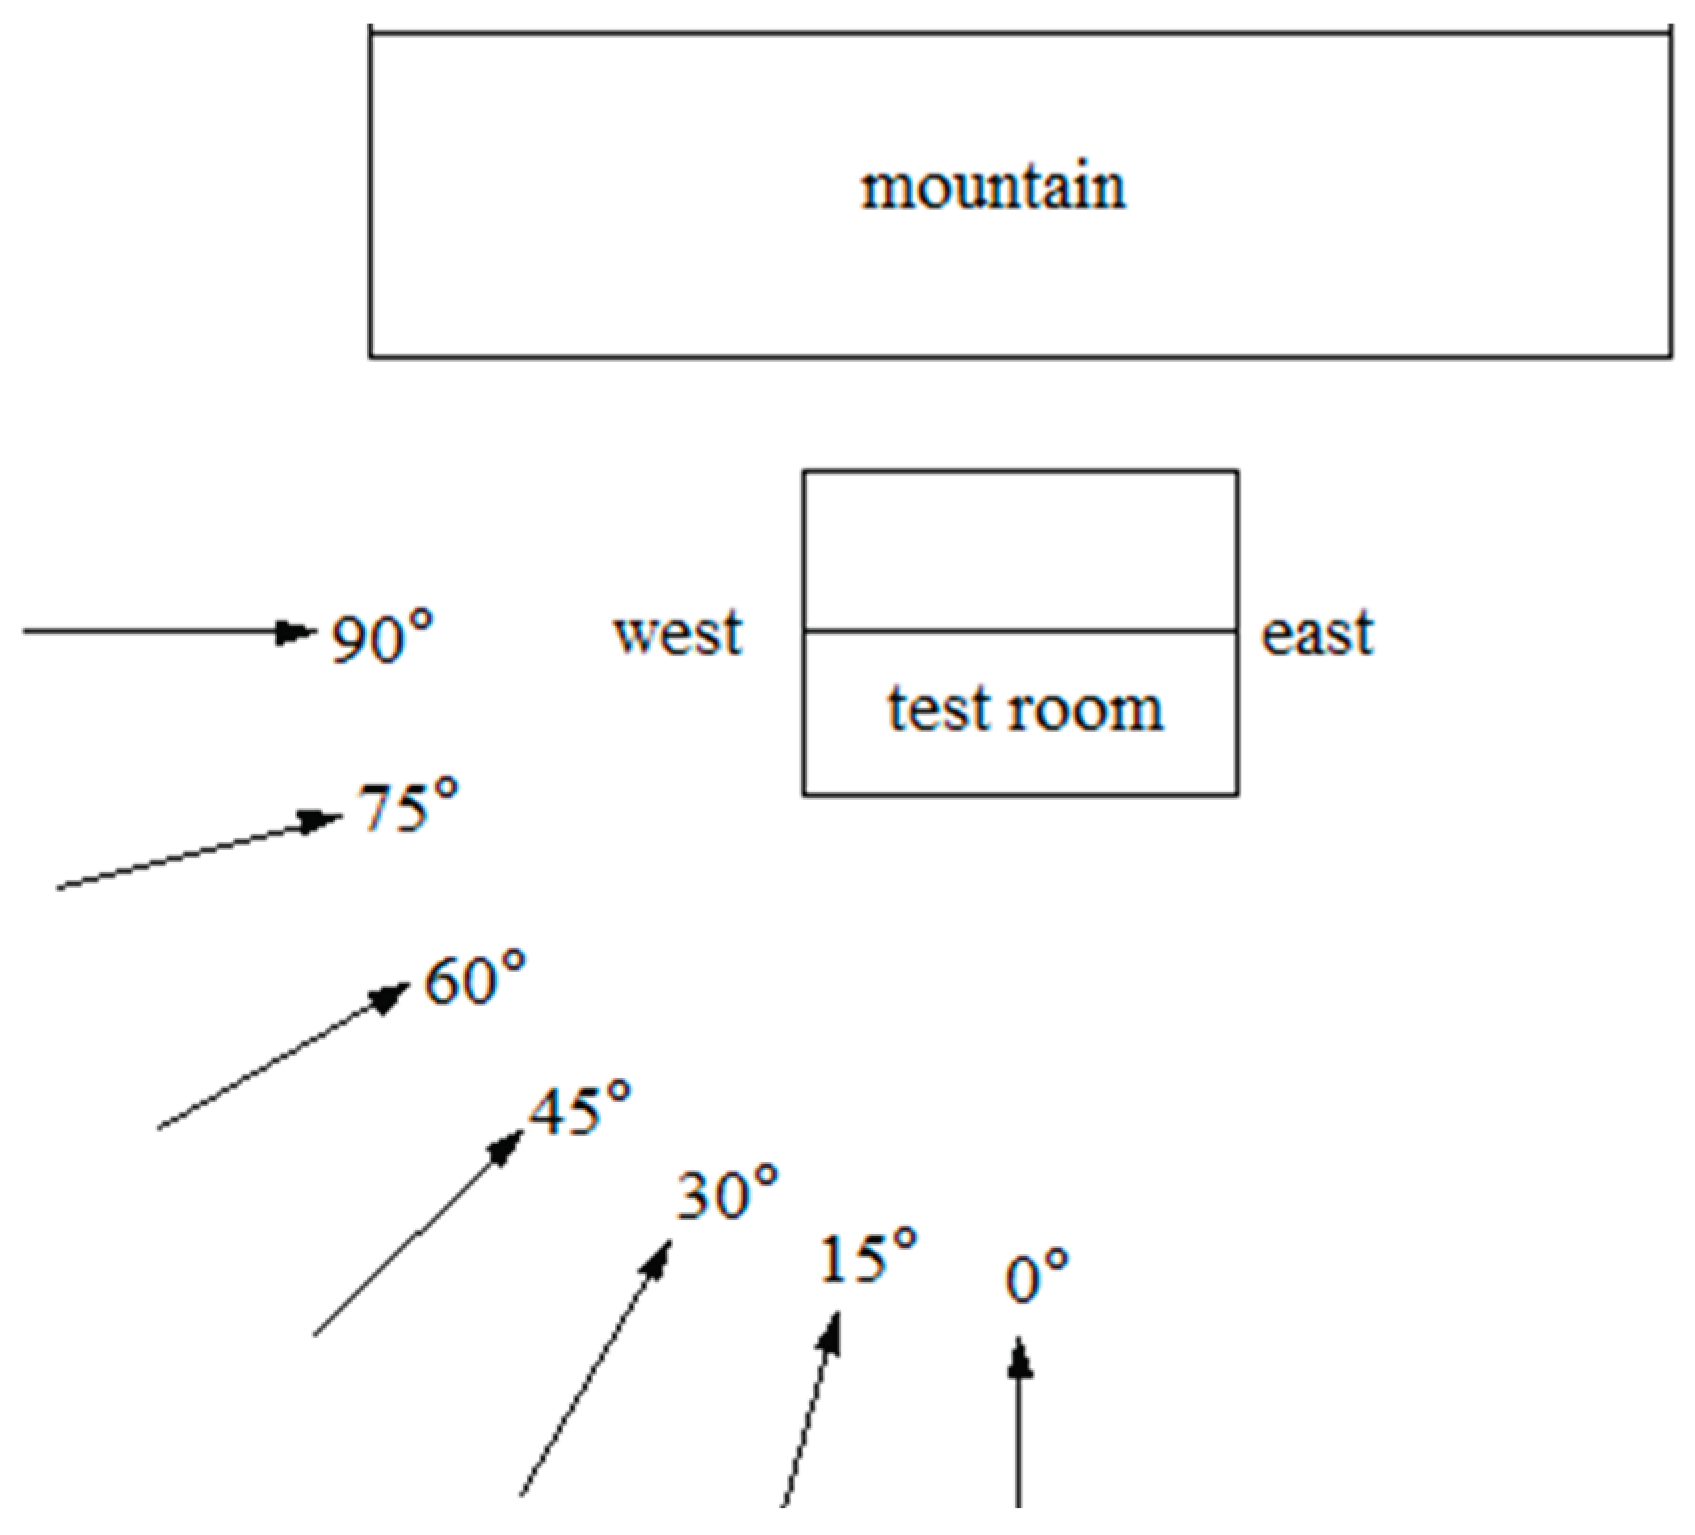
S. In the experiment, the angle of wind was tested from 0° to 90°with a 5° interval, as depicted in
Figure 4. The Hillside without surroundings has been considered to analyze the wind pressure affected by the distance between the hillside and the house.
Table 1 displays the specifics of the parameters. The Wind Tunnel experiment meets all the necessary criteria for the blocking probability.
2.3. Testing the Simulation of Wind Patterns
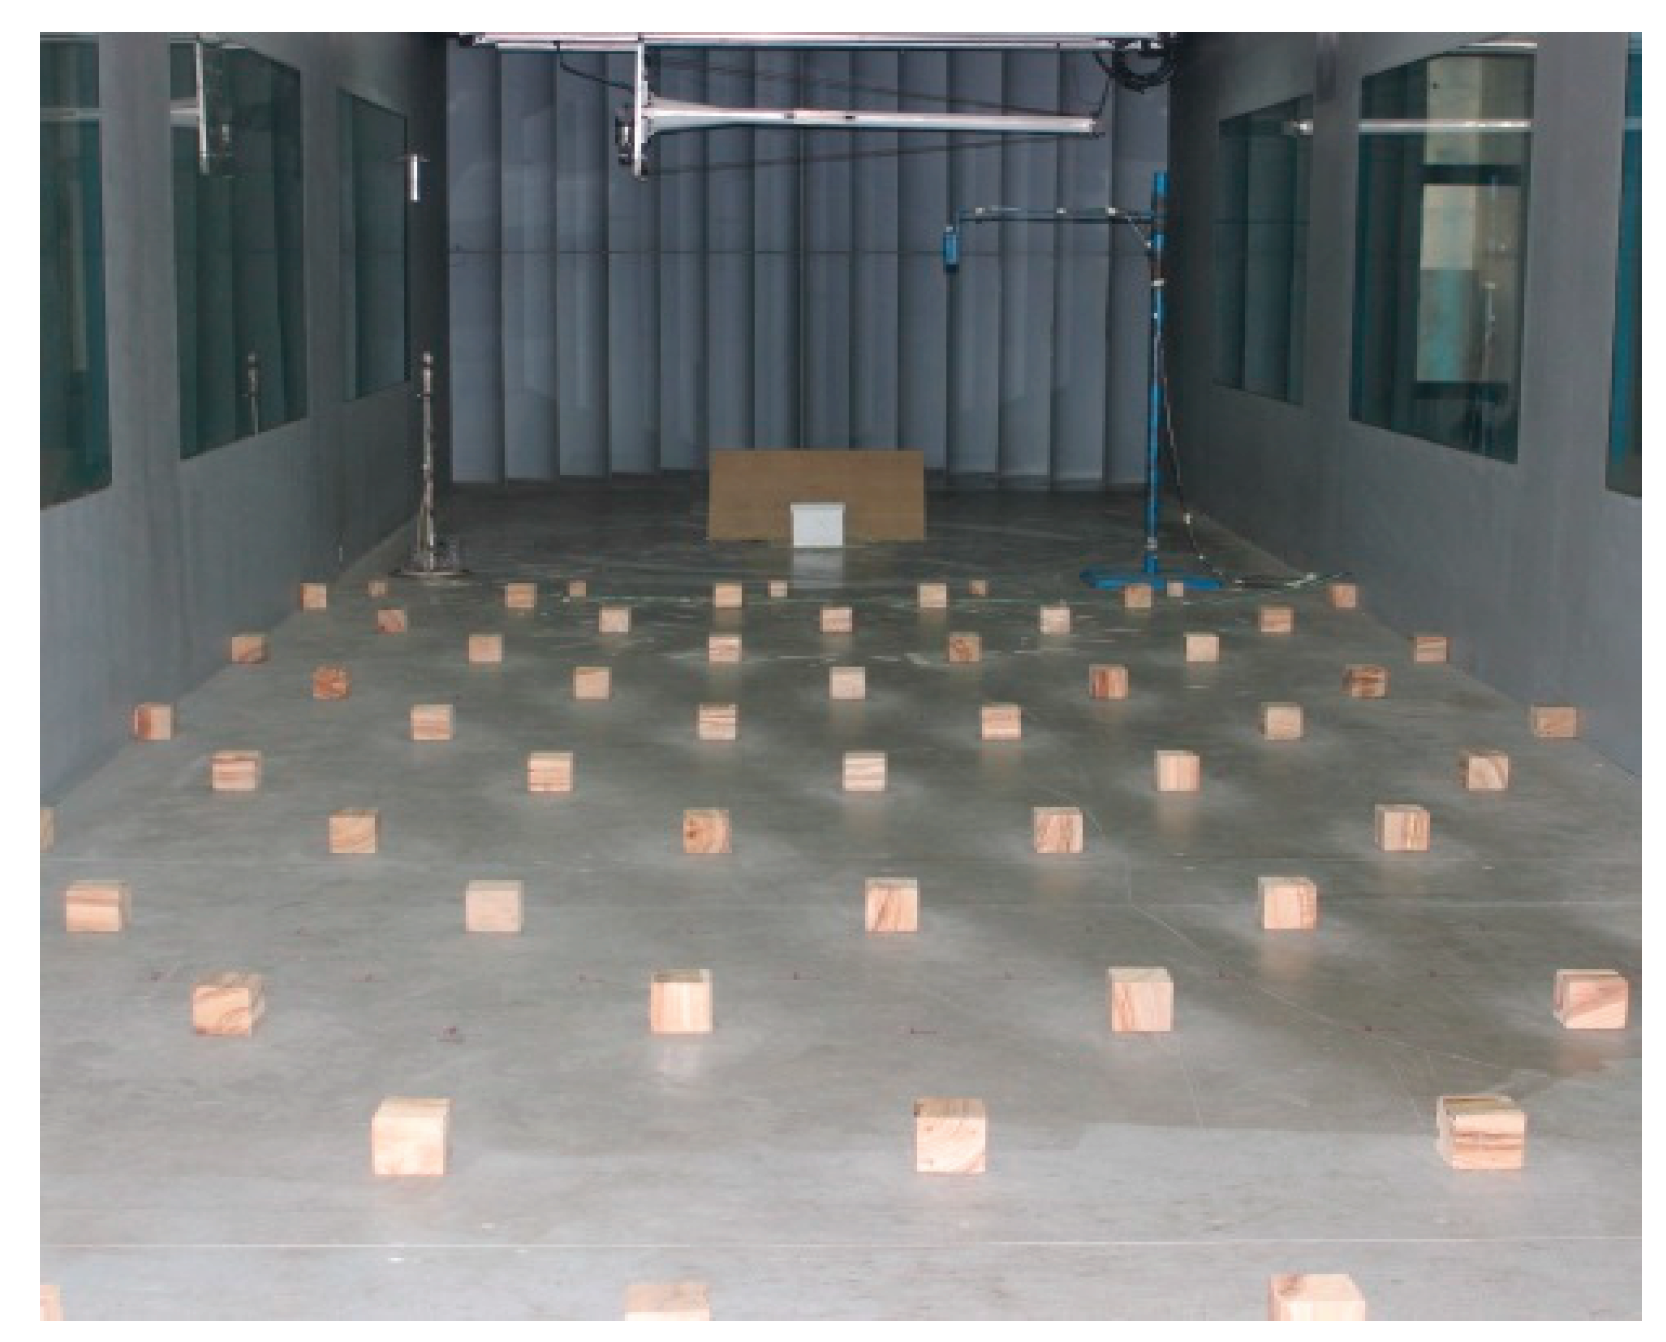
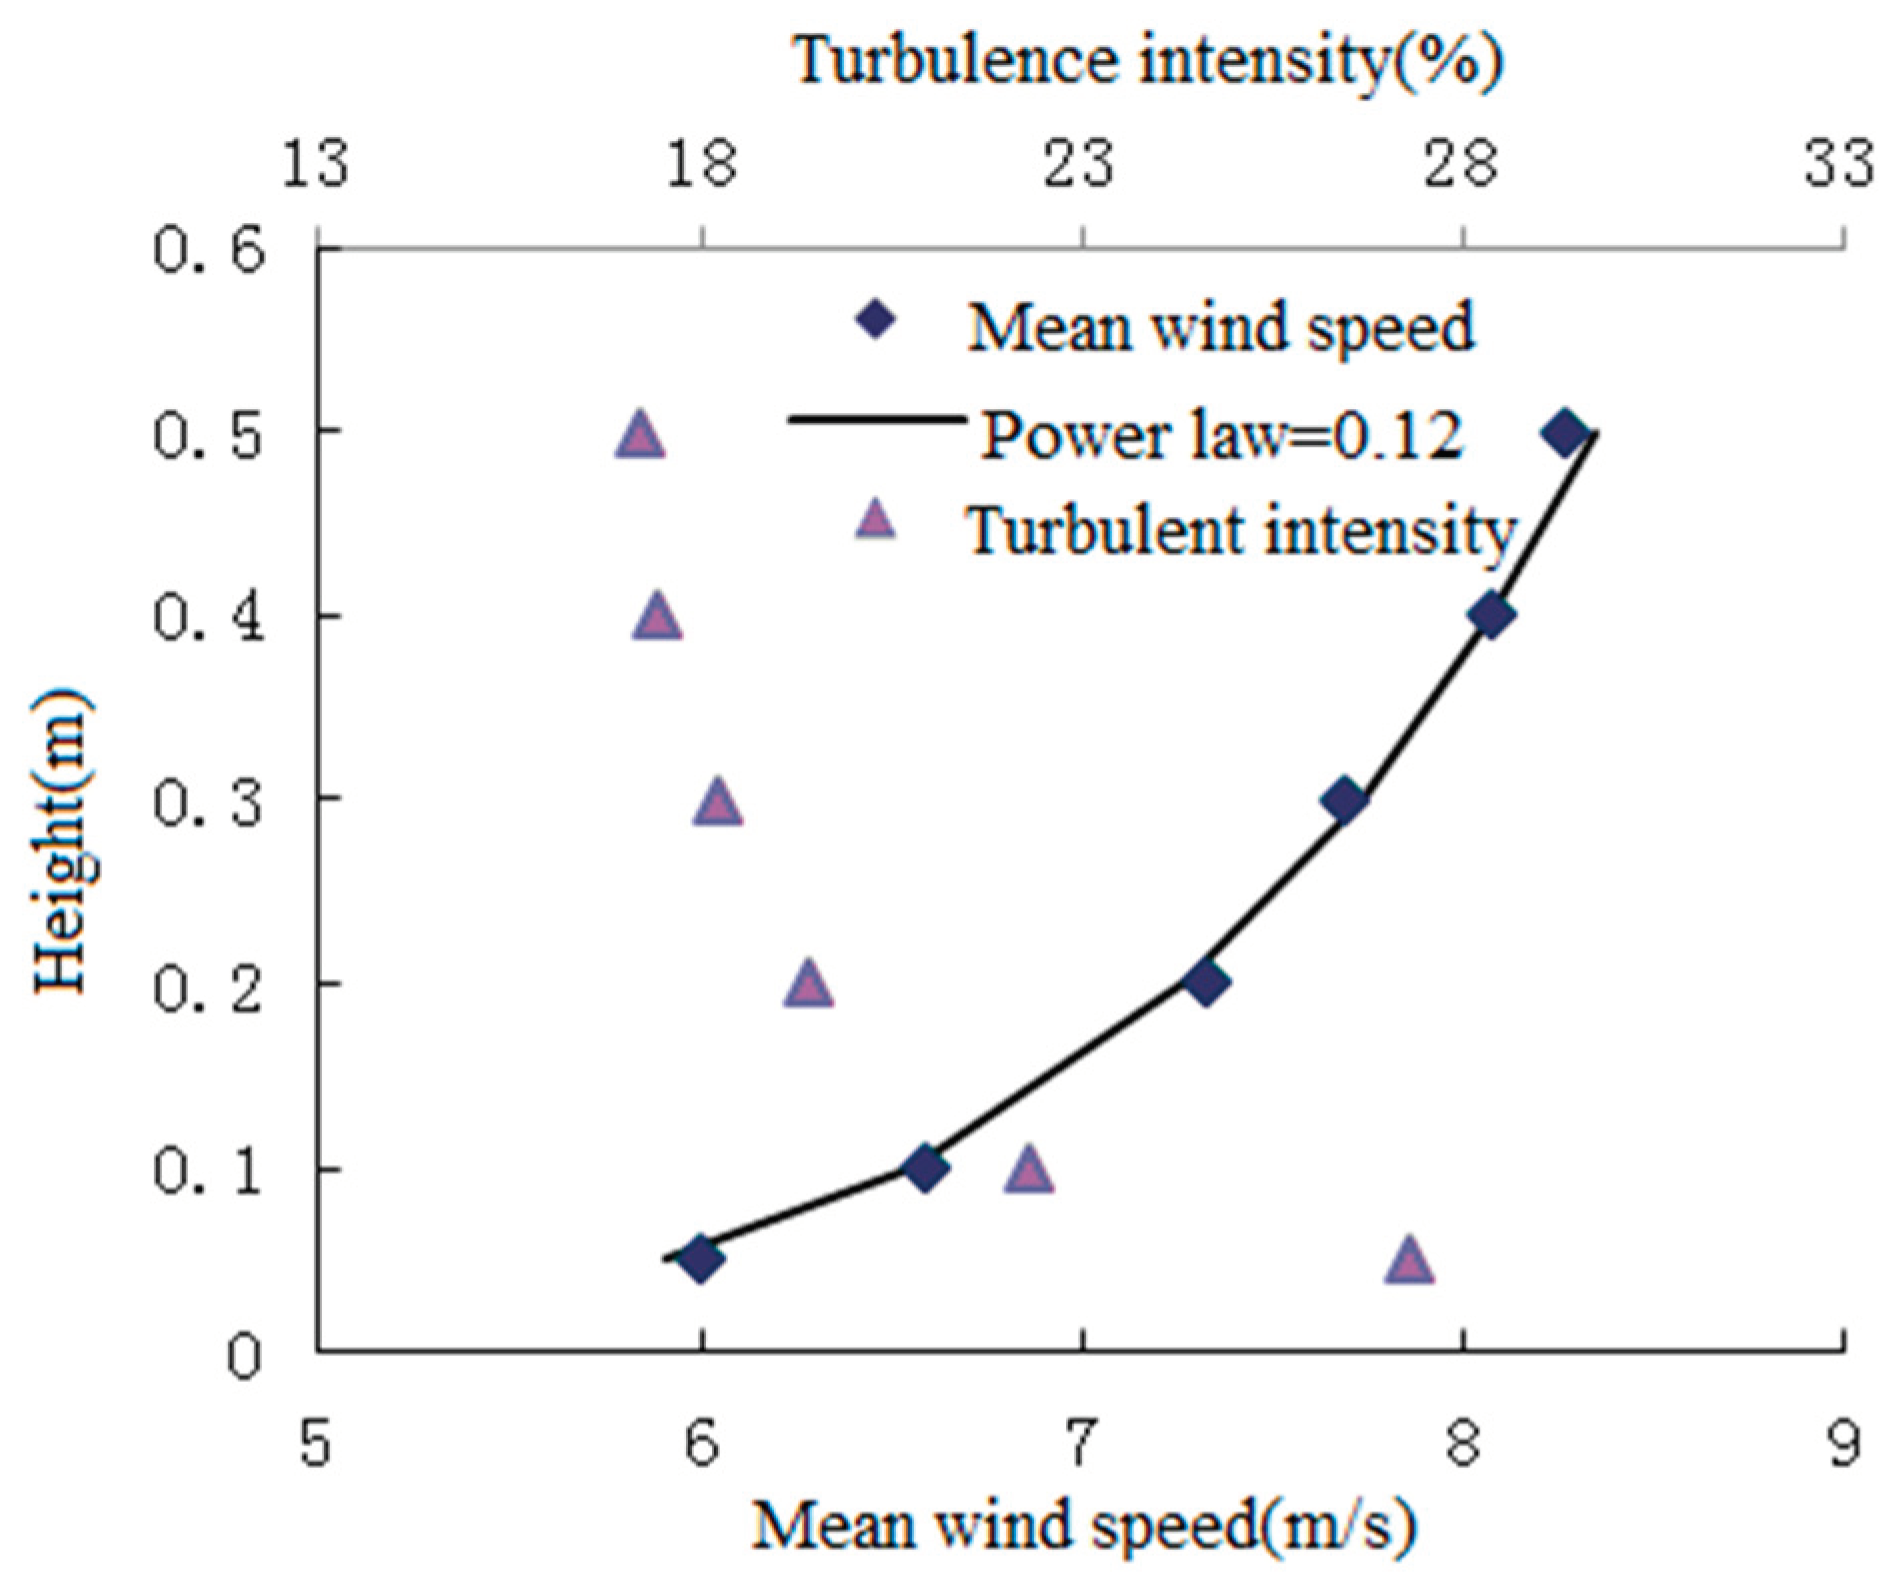
To create a comparable setting in regular mountainous landscapes, a wind velocity of 12m/s is established. This can be replicated in wind tunnel experiments by incorporating triangular structures and ground roughness components with a power exponent of 0.12 to simulate natural wind conditions.
Figure 5 displays the experimental models and setup for the wind tunnel tests in the simulation.
Figure 6 illustrates the profiles of mean wind speed and turbulence intensity.
2.4. Method of Analyzing Data
2.4.1. Mean Wind Pressure Coefficient
The formula for expressing the average wind pressure coefficient is as follows
The static (ambient, atmospheric) reference pressure, denoted as p0, is determined based on the wind tunnel test’s reference height(0.4 m), which is equivalent to a realistic height of 40m. The model's reference height; the mean velocity, denoted as Ur, and the air density, denoted as ρ, which in turn determines the instantaneous surface pressure, represented as pi.
2.4.2. Shape Coefficient
The shape coefficient, which is the i-th pressure taps testing point on the structure surface, can be obtained from the following formula. As per the specifications in the ' Code for load on building structures (GB50009-2012)', the overall shape coefficient can be modified based on the formula for the local shape coefficient.
where is the roughness index of the ground; zi The height of the model’s measuring point; zr is the height of the reference point;
The formula (2) has its truncation height, which is 5m belongs to the typical mountains terrain classification A. If the height of the pressure taps testing points is below 5m, they are not suitable for using the formula (2). Some appropriate modifications need to be made.
The shape coefficient on the surface of the structure can be obtained by the following formula.
The area of the pressure taps testing point is denoted as Ai, while A represents the total surface area.
3. Fluctuating Wind Pressure’s Interference Effect
To analyze the change law on the fluctuating wind pressure coefficient at crucial measurement locations with the space between the hillside and the structure, the variation in the mean wind pressure coefficient at different measuring points with varying slope height is analyzed.
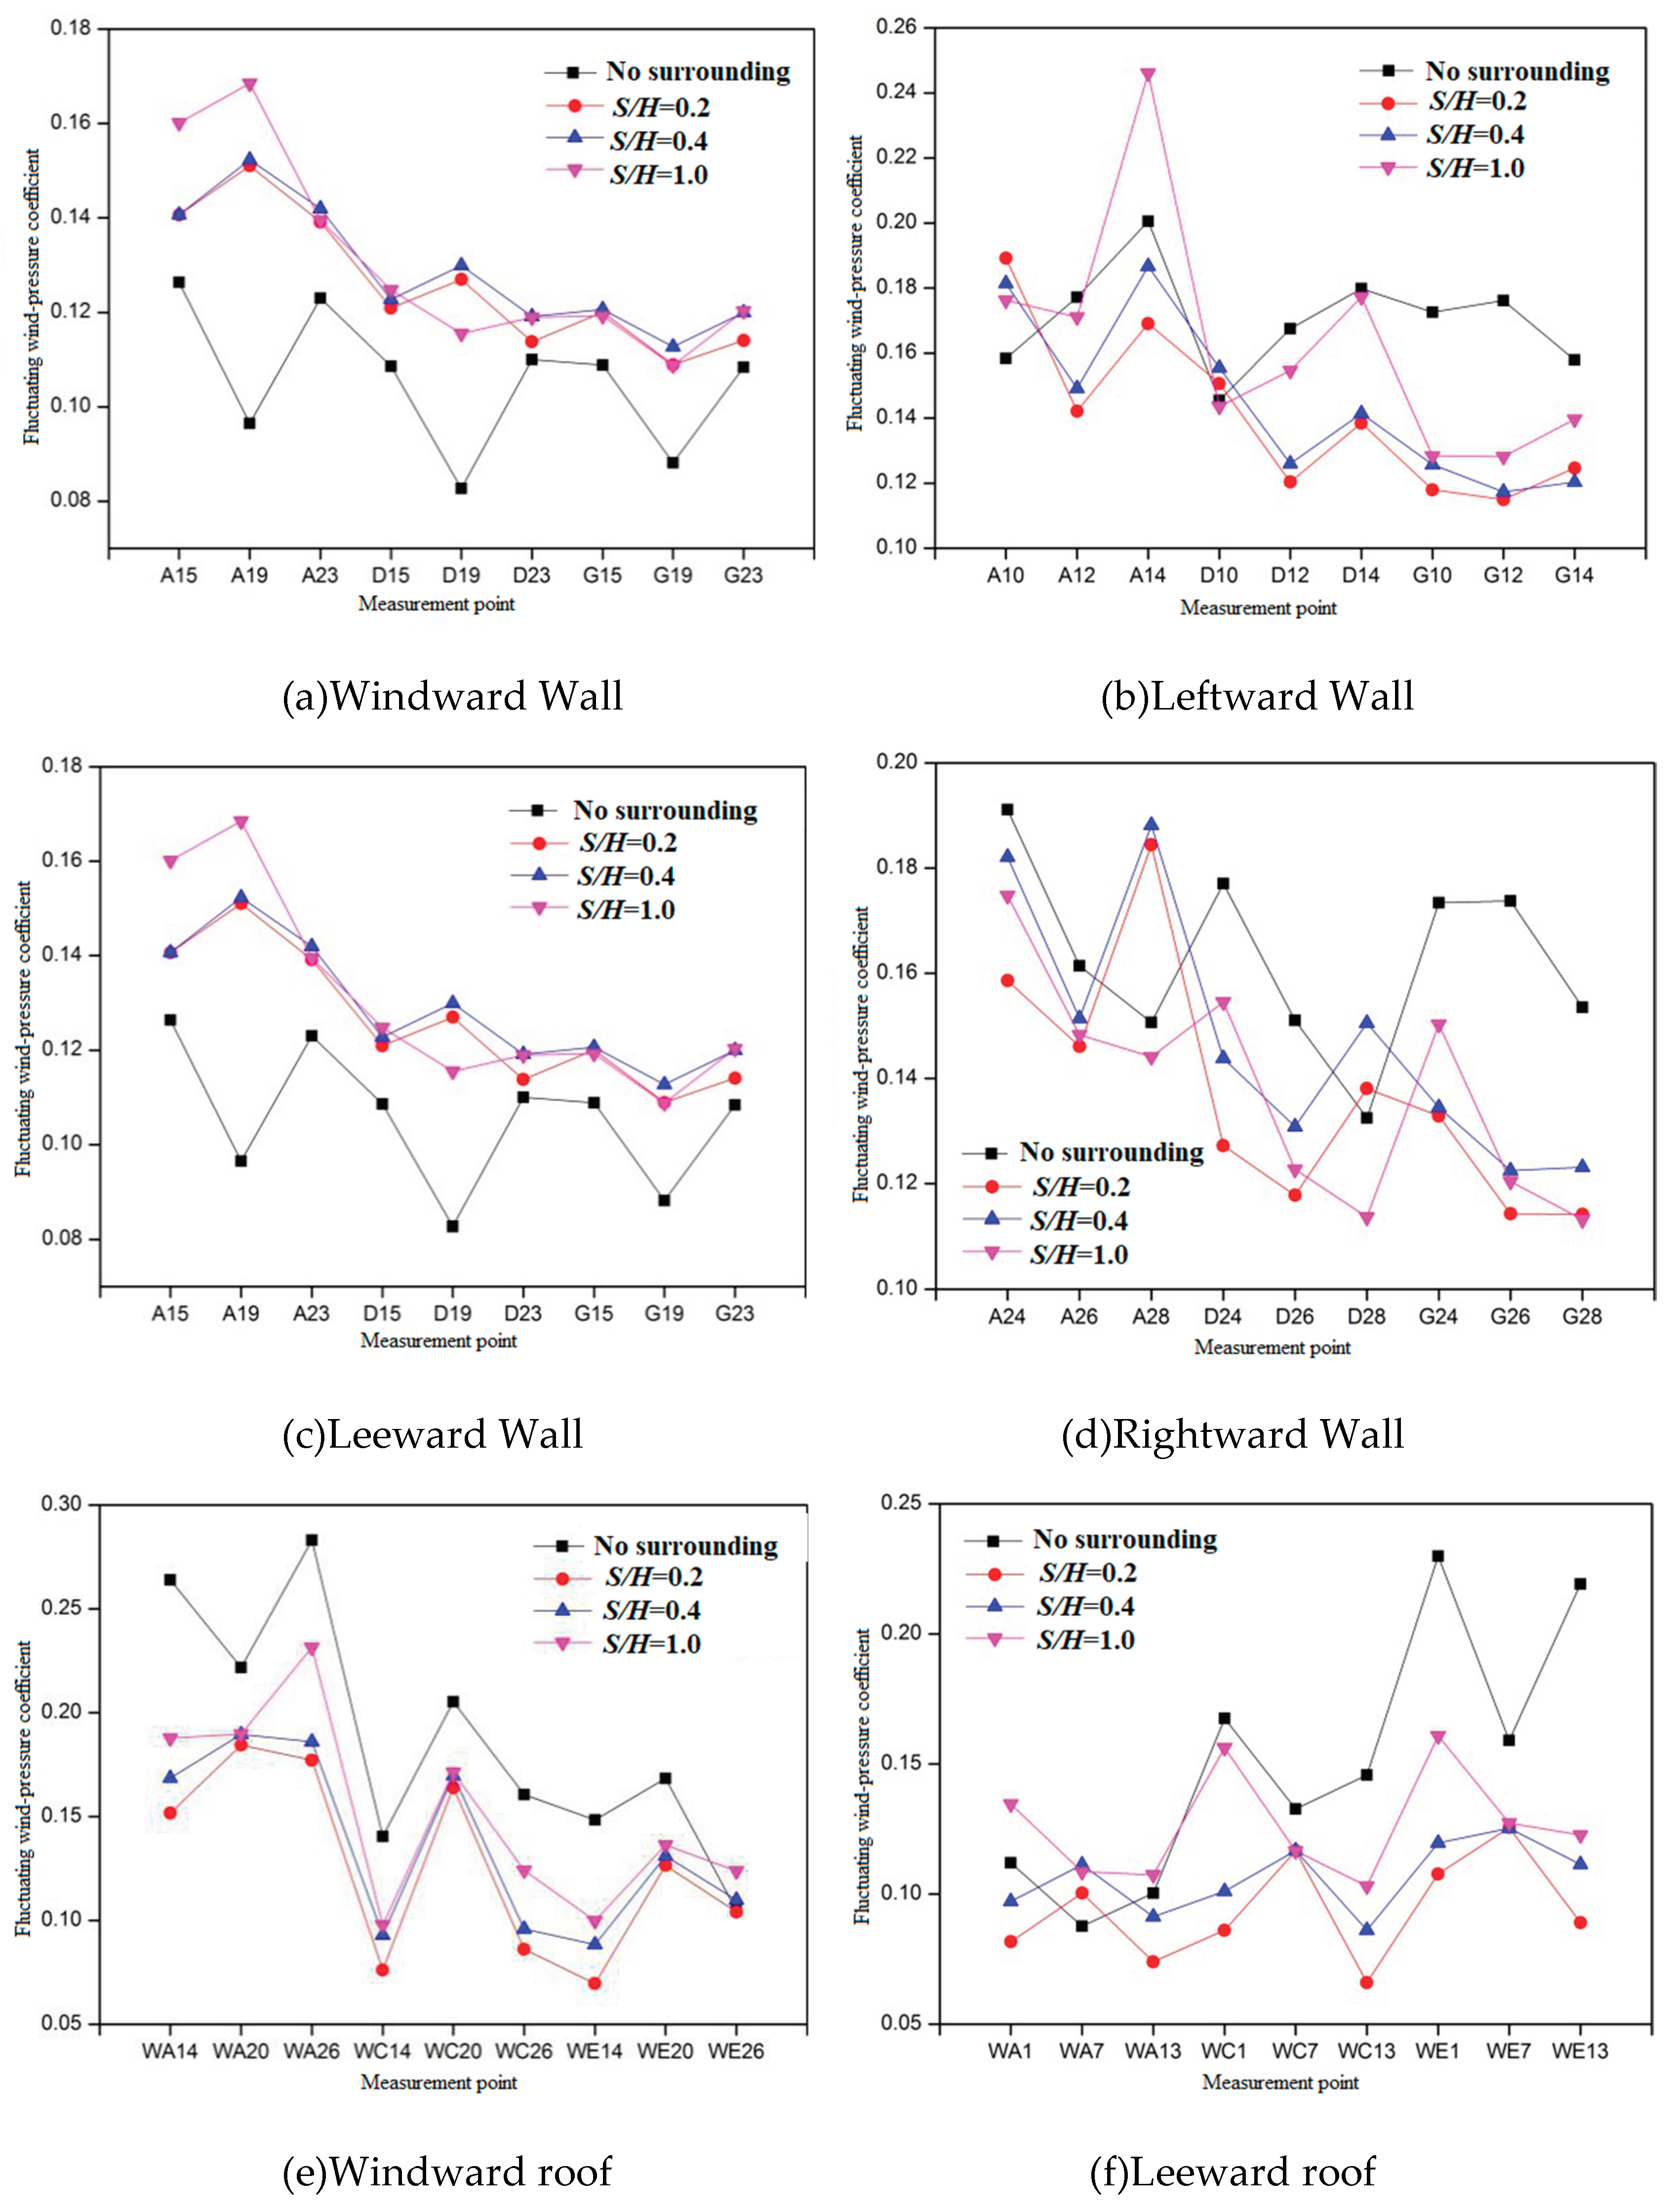
Figure 7 shows the layout of selected representative measurement points l.
Figure 8a reveals that in the middle of the windward side, the fluctuating coefficient exceeds the coefficient at the edge measuring points.
Additionally, compared to A5, A1 experiences a 13.5% decrease in its fluctuating coefficient. The fluctuating coefficient of G5 and G9 is smaller than that of G1, and it exhibits a rising pattern. However, when there is a hillside, G1, G5, and G9 demonstrate a declining pattern.
Compared to the measuring point at the edge, the fluctuating coefficient is lower at the middle line. The fluctuating coefficient of A14 is 0.246, which is 43.8% higher than that of A12.
According to
Figure 8c, in the absence of any impact from the surrounding environment, the fluctuating wind pressure coefficient at the middle line measuring point is lower compared to the edge. However, in the presence of a mountain, the fluctuating coefficient at the middle line is higher than that on the margins.
The information depicted in the diagram is evident.8(d), A24, D24, and G24 have the largest values in the same row of measurement points when there is no periphery and working conditions 1 and 2. In working condition 3, the fluctuating coefficient at A26 is higher than at A24. Similarly, in rows D and G, the edge measuring points D24 and G24 have a greater fluctuating wind pressure coefficient than the other measuring points in their respective rows.
The absence of a clear correlation between the fluctuating coefficient of the mid-line and the edge measuring point can be observed in
Figure 8e when the windward roof remains unaffected by the surrounding environment. In general, the fluctuating coefficient of the windward roof is higher than without the surrounding environment.
Additionally, measuring points located along the middle line exhibit a lower fluctuating coefficient compared to measuring points situated at the edge when considering different mountain spacing.
Figure 8f illustrates that the middle measuring point’s fluctuating coefficient is lower than on the margins when the lee roof remains unaffected by the surrounding environment. The fluctuating coefficient at the middle measuring point exhibits less variation compared to the edge measuring point when a mountain is present. Notably, the value at measuring point WE7 remains constant.
4. Examining the Fluctuating Coefficient under Different Wind Angles
When the wind direction is between 60° and 80°, the fluctuating coefficients are at their lowest, unaffected by the surrounding environment. Then S/H=0.4, then S/H =0.2, and finally S/H =1.0. When the wind direction ranges from 85° to 90°, the fluctuating wind pressure coefficient increases when the distance increases, and the difference in the fluctuating coefficient is minimal.
In
Figure 9b, the maximum fluctuating coefficient is 0.21 when the wind direction is 15°. At a wind direction of 70° and a ratio of S/H equal to 0.4, the highest coefficient for fluctuating wind pressure is 0.22. As the wind angle increases, the fluctuating coefficient initially rises, then falls, and ultimately rises when the working condition S/H=1.
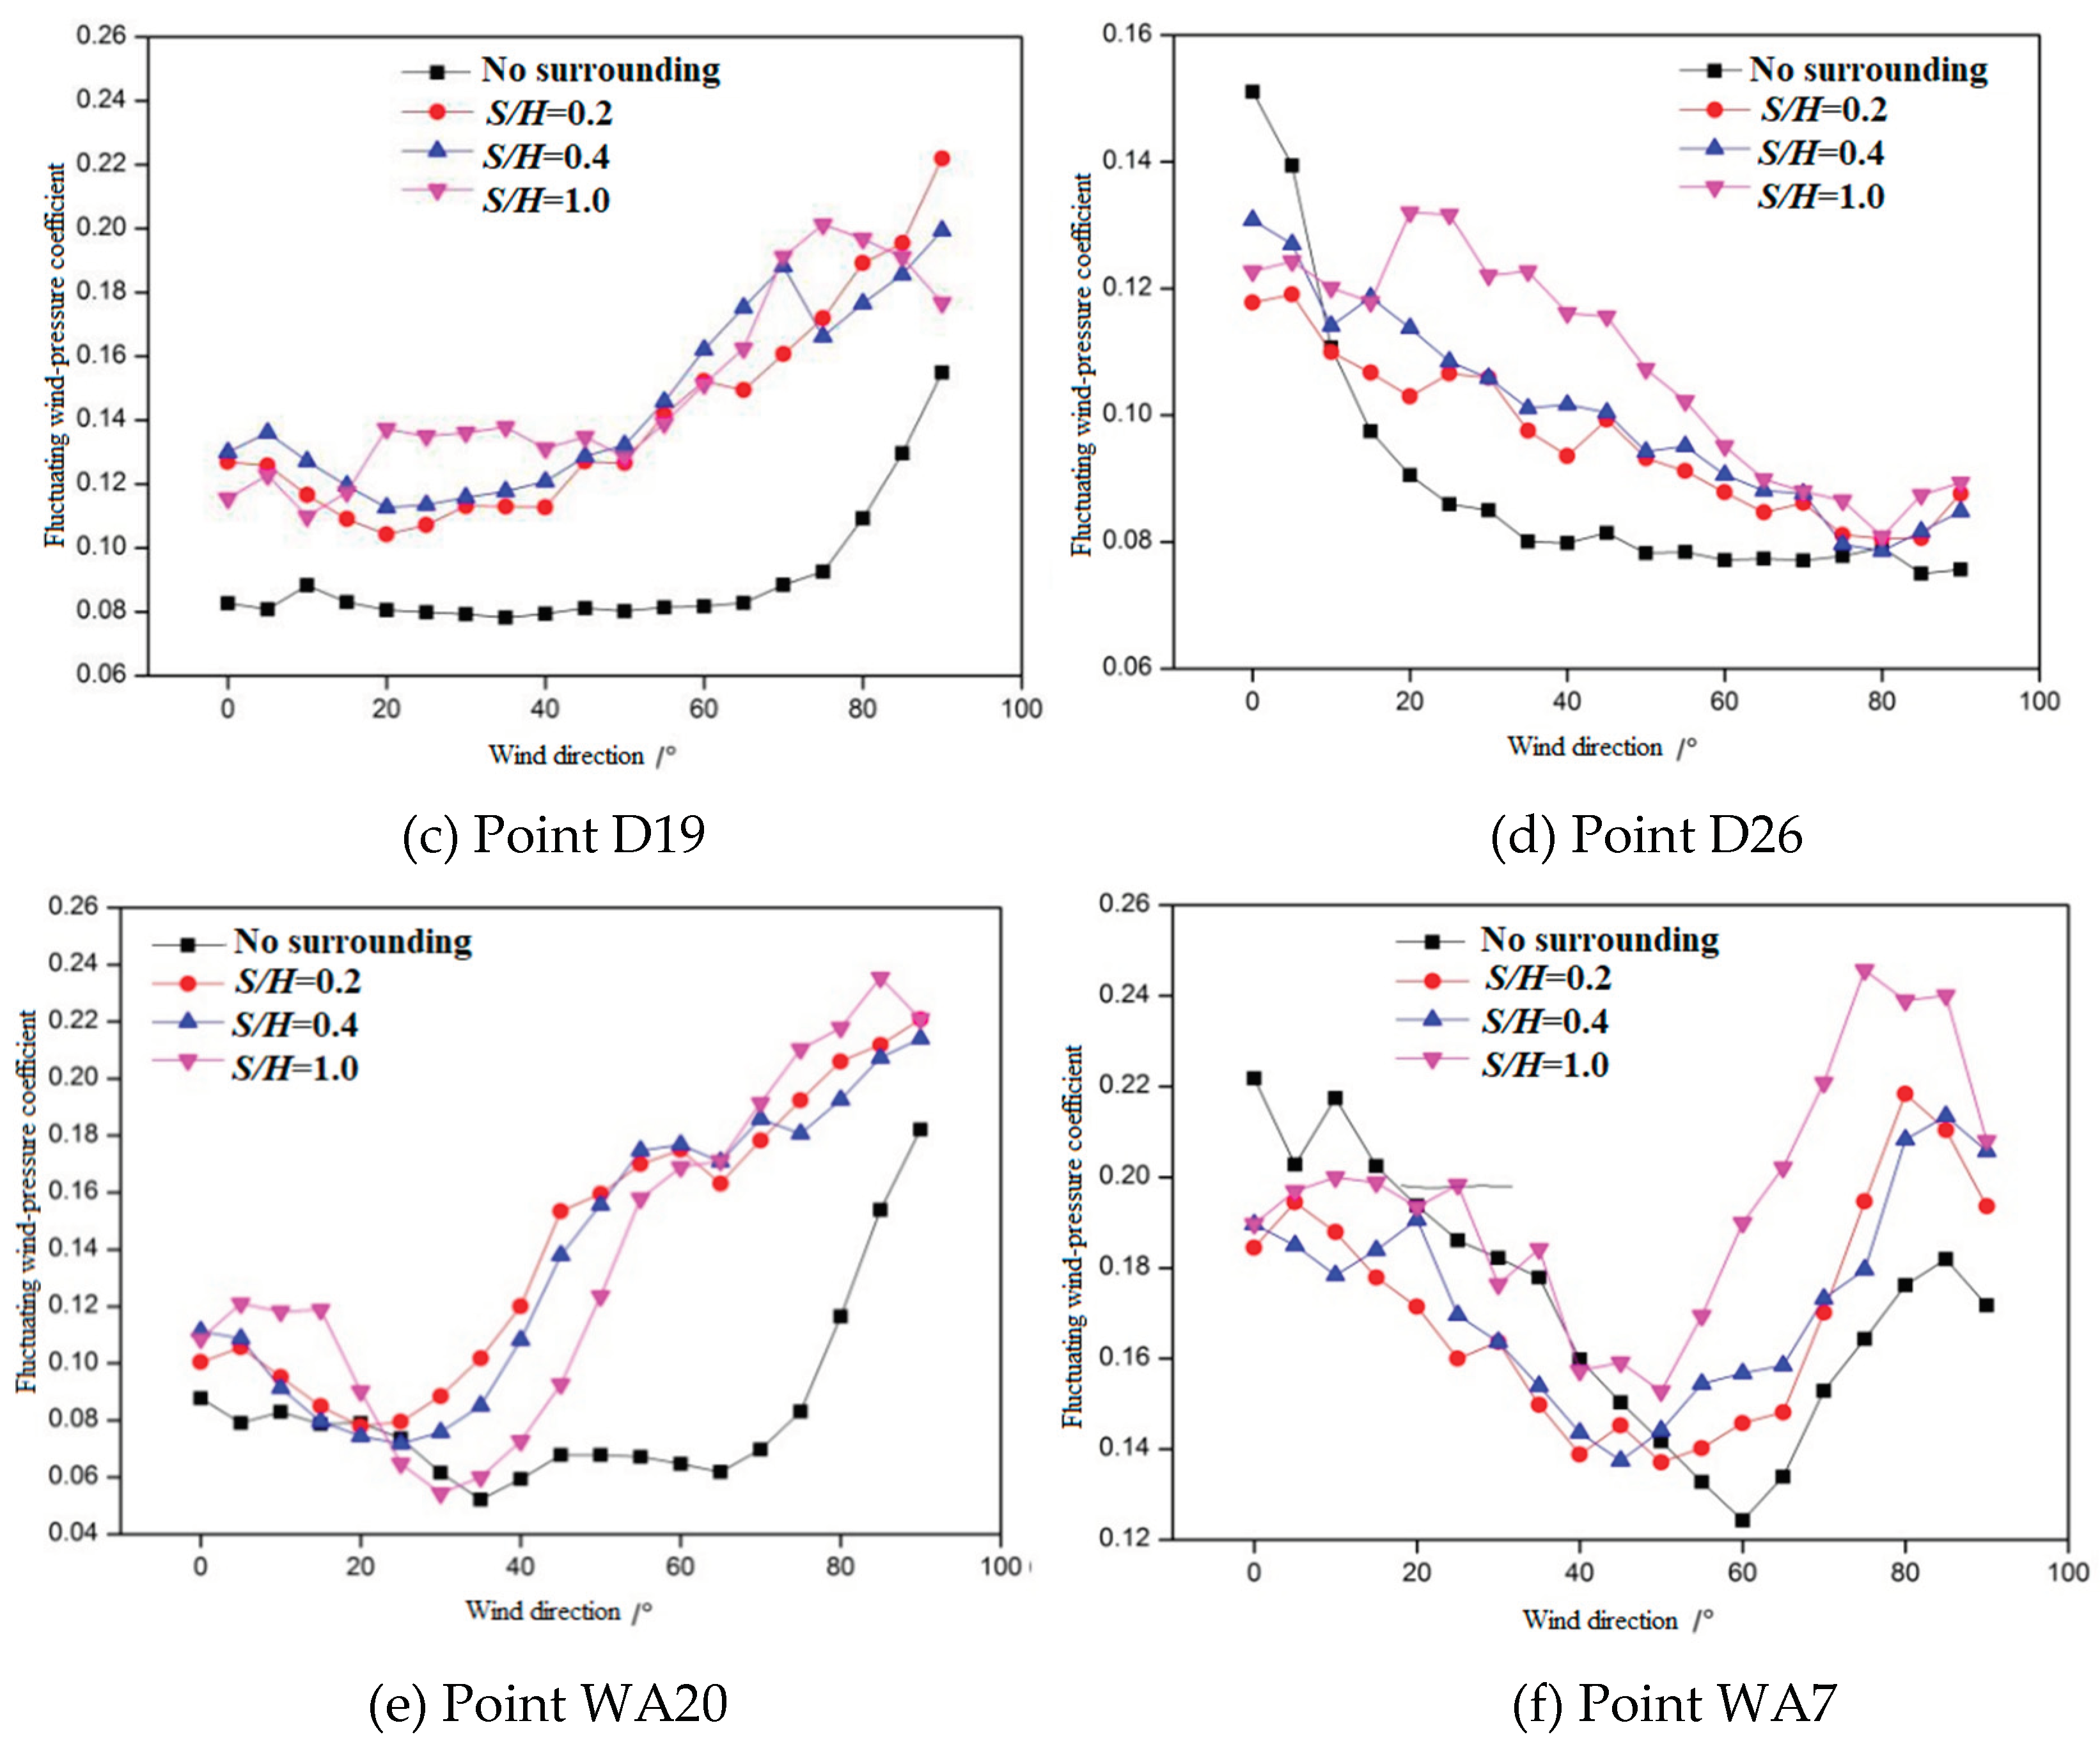
The fluctuating coefficient of measuring point D19 in the middle of the lee side is reduced in the absence of any impact from the surrounding environment, as depicted in
Figure 9c. The mountain's fluctuating wind pressure coefficient does not follow a clear rule under three different spacing working conditions.
The fluctuating coefficient remains approximately 0.08 when the wind direction ranges from 35° to 90°, as is shown in
Figure 9d. The fluctuating wind pressure coefficient values under S/H=0.2 are similar to those under S/H=0.4, and both values decrease gradually with the wind direction increase. As the wind direction increases, the fluctuating coefficient initially rises, then falls, and eventually rises again when the working condition is S/H=1.0. At a wind direction of 20°, the highest fluctuating coefficient is 0.135.
The wind pressure coefficient at the windward eave is lower in the absence of surrounding environmental influence compared to when there is a mountain, as depicted in
Figure 9e. As the wind direction rises to 75°, the fluctuating wind pressure coefficient accelerates and reaches a peak value of 0.18 under the wind direction of 90°.
As is shown in
Figure 9e, at a wind direction of 60°, the minimum fluctuating coefficient is 0.122. In the presence of a peak, with a ratio of S/H equal to 1.0, when the wind blows at an angle of 75°, the fluctuating coefficient reaches its highest point at 0.25.
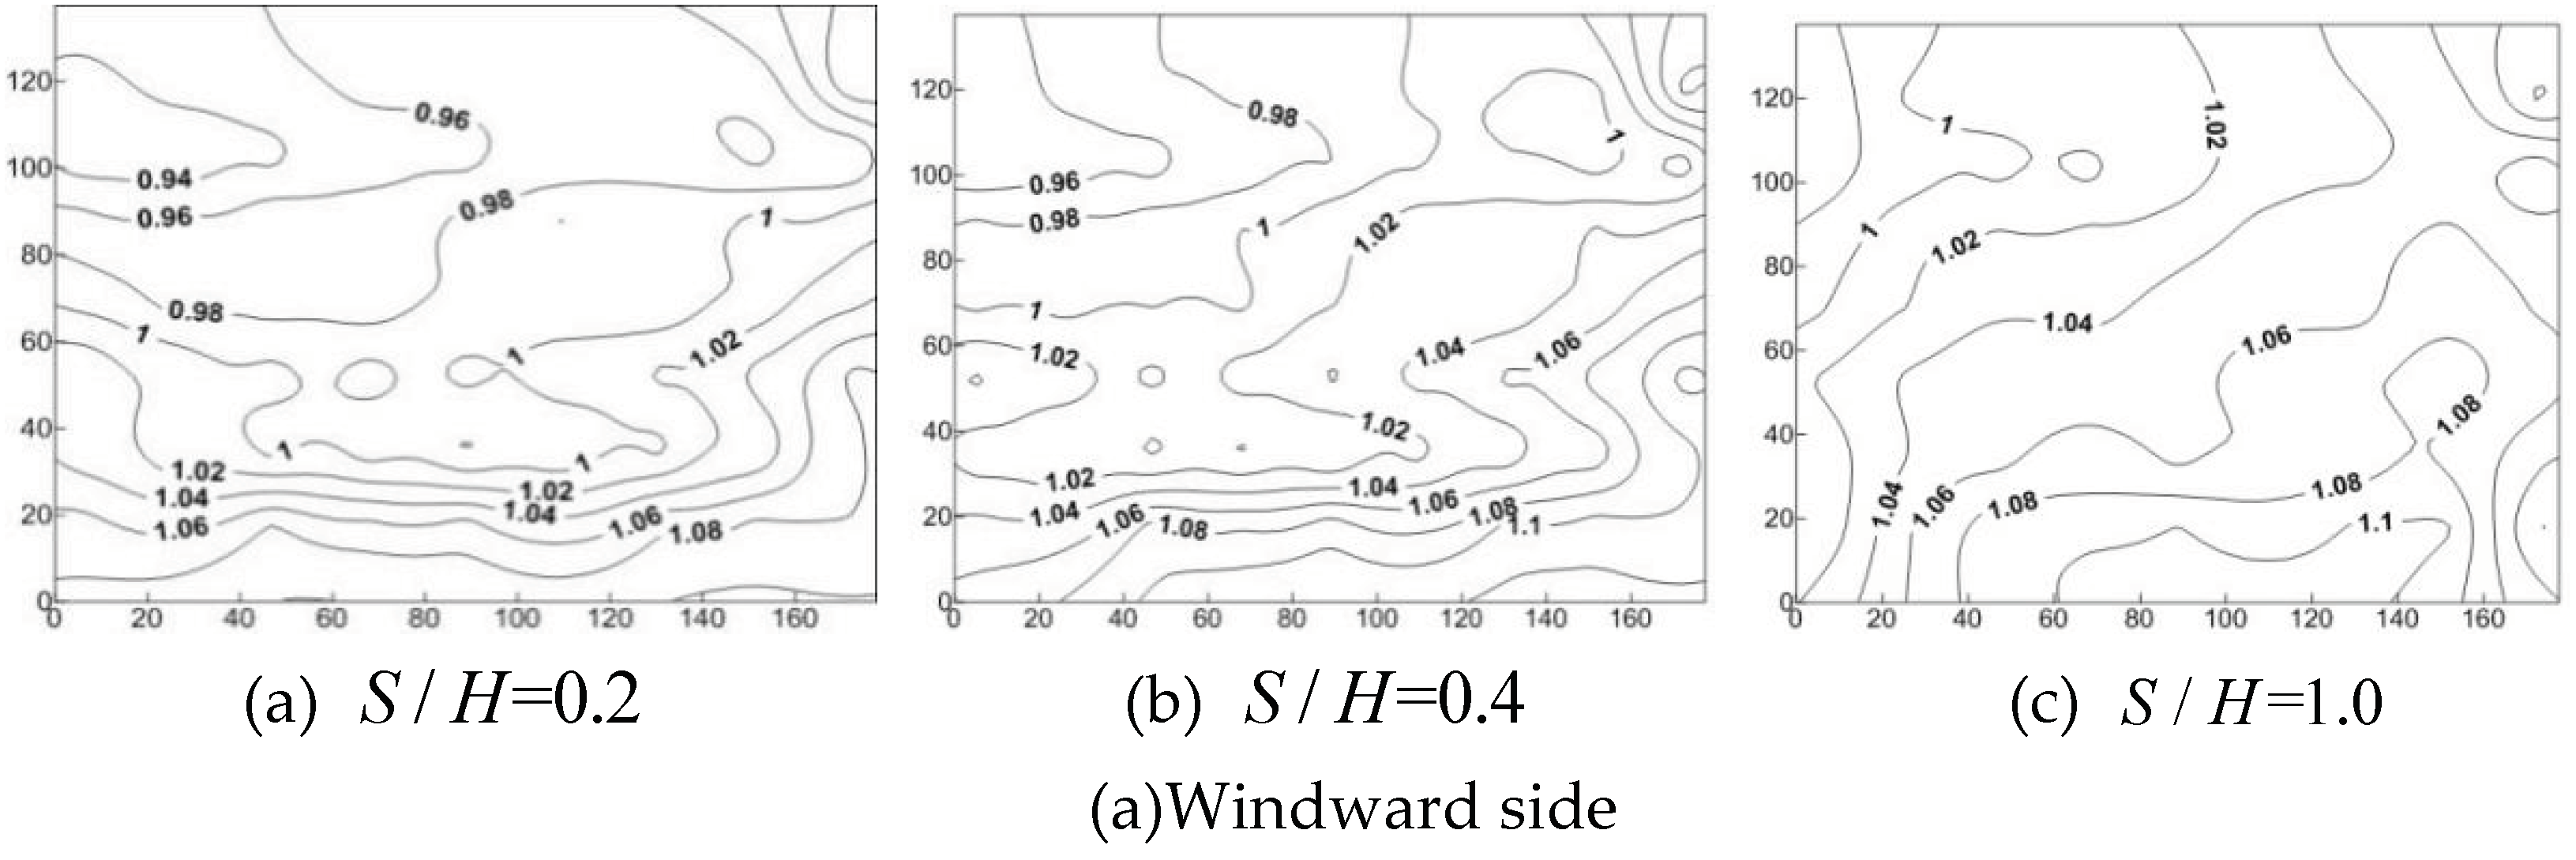
Figure 10a demonstrates that when the ratio of
S/
H =0.2, the interference factor exhibits a range of 0.94 to 1.08. Moreover, the interference factor gradually increases from the top to the bottom, reaching its peak at the bottom. When
S/H=0.4, the variation range of the interference factor is 0.96 ~ 1.1, compared with
S/
H=0.2, the distribution state is unchanged, and the interference factor is increased. When
S/
H=1.0, the variation range of the interference factor is 1.0 ~ 1.1, compared with
S/
H=0.2, the value increases, and the distribution state changes.
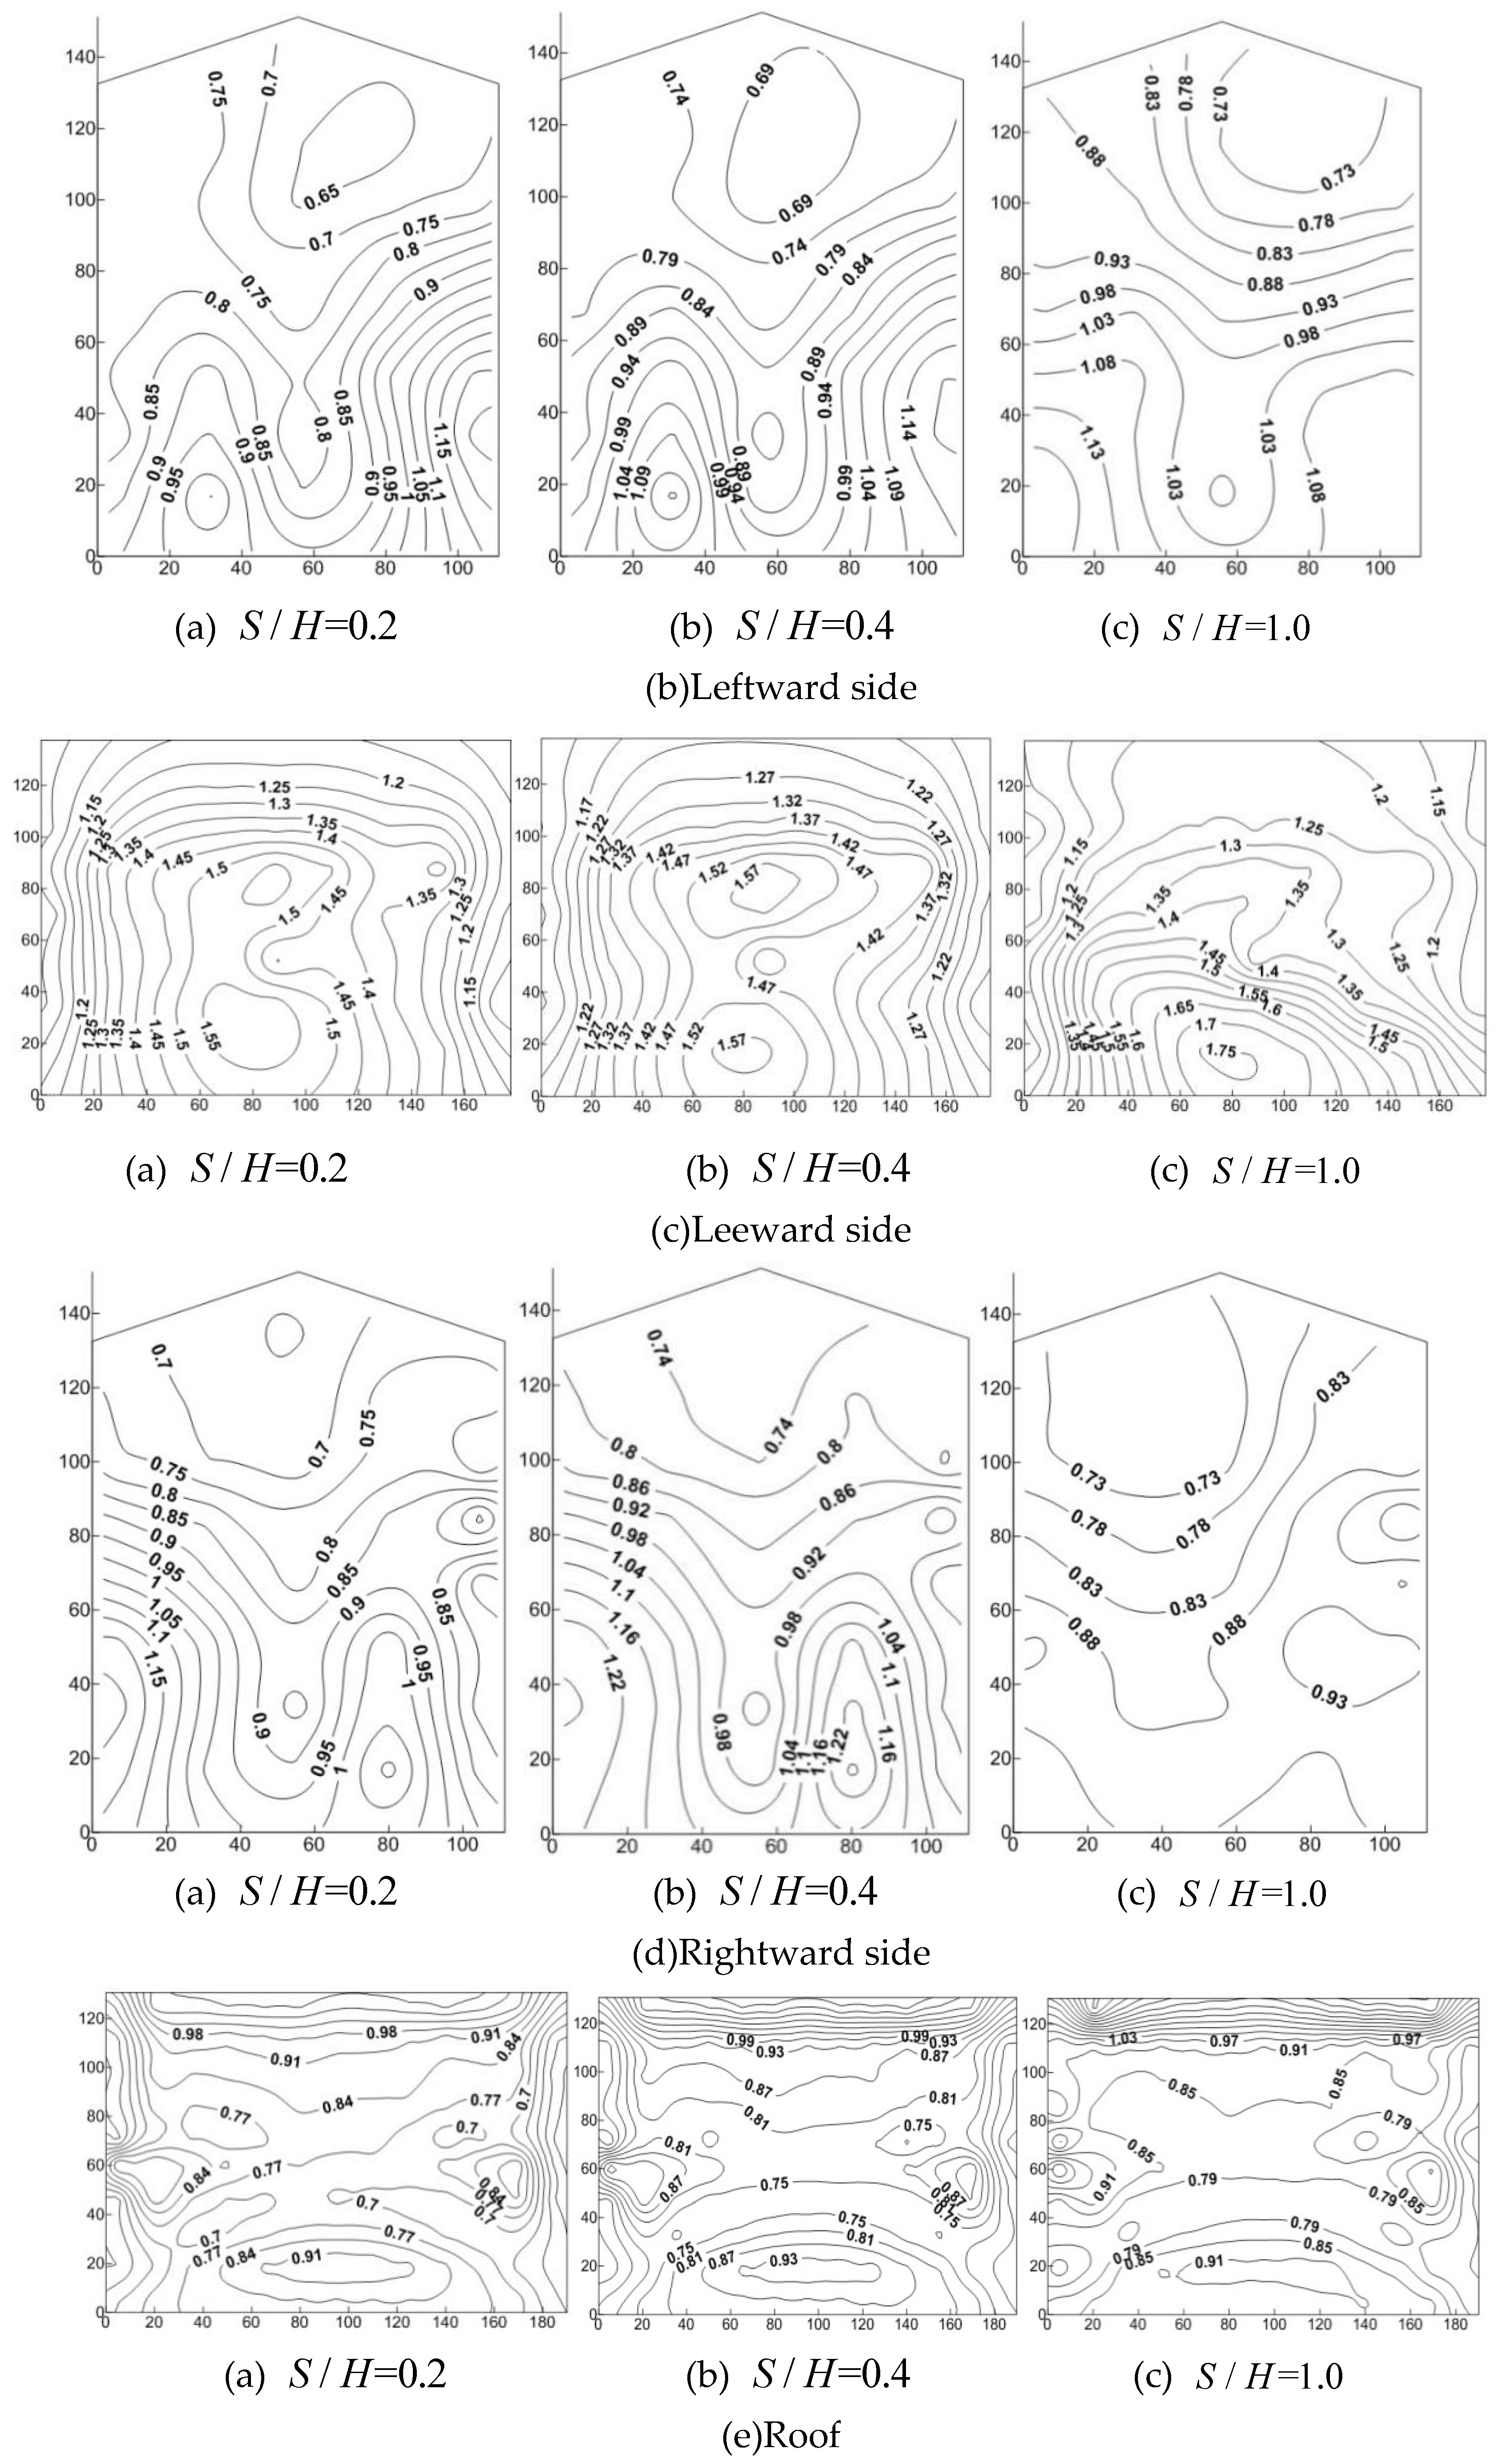
Figure 10b illustrates that at S/H=0.2, the interference factor ranges from 0.65 to 1.15. The highest interference factor of 1.15 is observed below the right edge, with a vortex present on the left side. In the center line, the interference factor is 0.95, while the upper right region exhibits the lowest interference factor of 0.65. When S/H=0.4, the variation range of the interference factor is 0.69 ~ 1.14, compared with S/H=0.2, the interference factor at the bottom left vortex increases to 1.09 in the center, and the interference factor in the other regions decreases. When S/H=1.0, the distribution state of the interference factor changes, ranging from 0.73 to 1.13. The interference factor increases gradually from top to bottom.
Figure 10c shows that when S/H=0.2, the interference factor ranges from 1.15 to 1.55, with the highest value at the center bottom and the lowest values at the edges on the left and right sides. When S/H=0.4, the variation range of the interference factor is 1.17 ~ 1.57, compared with S/H=0.2, the interference factor is increased, and the distribution state is unchanged. When S/H =1.0, the variation range of the interference factor is 1.15 ~ 1.75, compared with S/H =0.4, the distribution state changes, the largest interference factor increases, and the smallest interference factor decreases.
Figure 10d illustrates that with a S/H ratio of 0.2, the interference factor ranges from 0.7 to 1.0. The highest interference factor is found in the bottom right, while the lowest interference factor is located at the top. When S/H=0.4, the variation range of the interference factor is 0.74 ~ 1.22, compared with S/H =0.2, the interference factor is increased, and the distribution state is unchanged. When S/H =1.0, the distribution state changes, and the variation range of the interference factor is 0.73 ~ 0.93, The most disturbed area is located in the lower region of the right edge, and the smallest disturbed area is located in the upper left region.
The disturbance factors range from 0.7 to 0.98 when S/H =0.2, as depicted in
Figure 10e. Notably, the disturbance factors at the windward eaves and leeward eaves surpass those in other regions. The windward eaves have the largest disturbance factor 0.91, while the leeward eaves have the largest disturbance factor 0.98. There is a minimum interference factor of 0.7. When S/H =0.4, the variation range of the interference factor is 0.75 ~ 0.99, compared with S/H =0.2, the interference factor is increased, and the distribution state is unchanged. When S/H =1.0, the distribution state changes, and the variation range of the interference factor is 0.79 ~ 1.03. There is a larger interference factor 0.91 at the windward eaves, the largest interference factor 1.03 at the leeward eaves, and the smallest interference factor 0.79 at the two edges of the roof ridge.
5. Comparative Analysis of the Power Spectrum
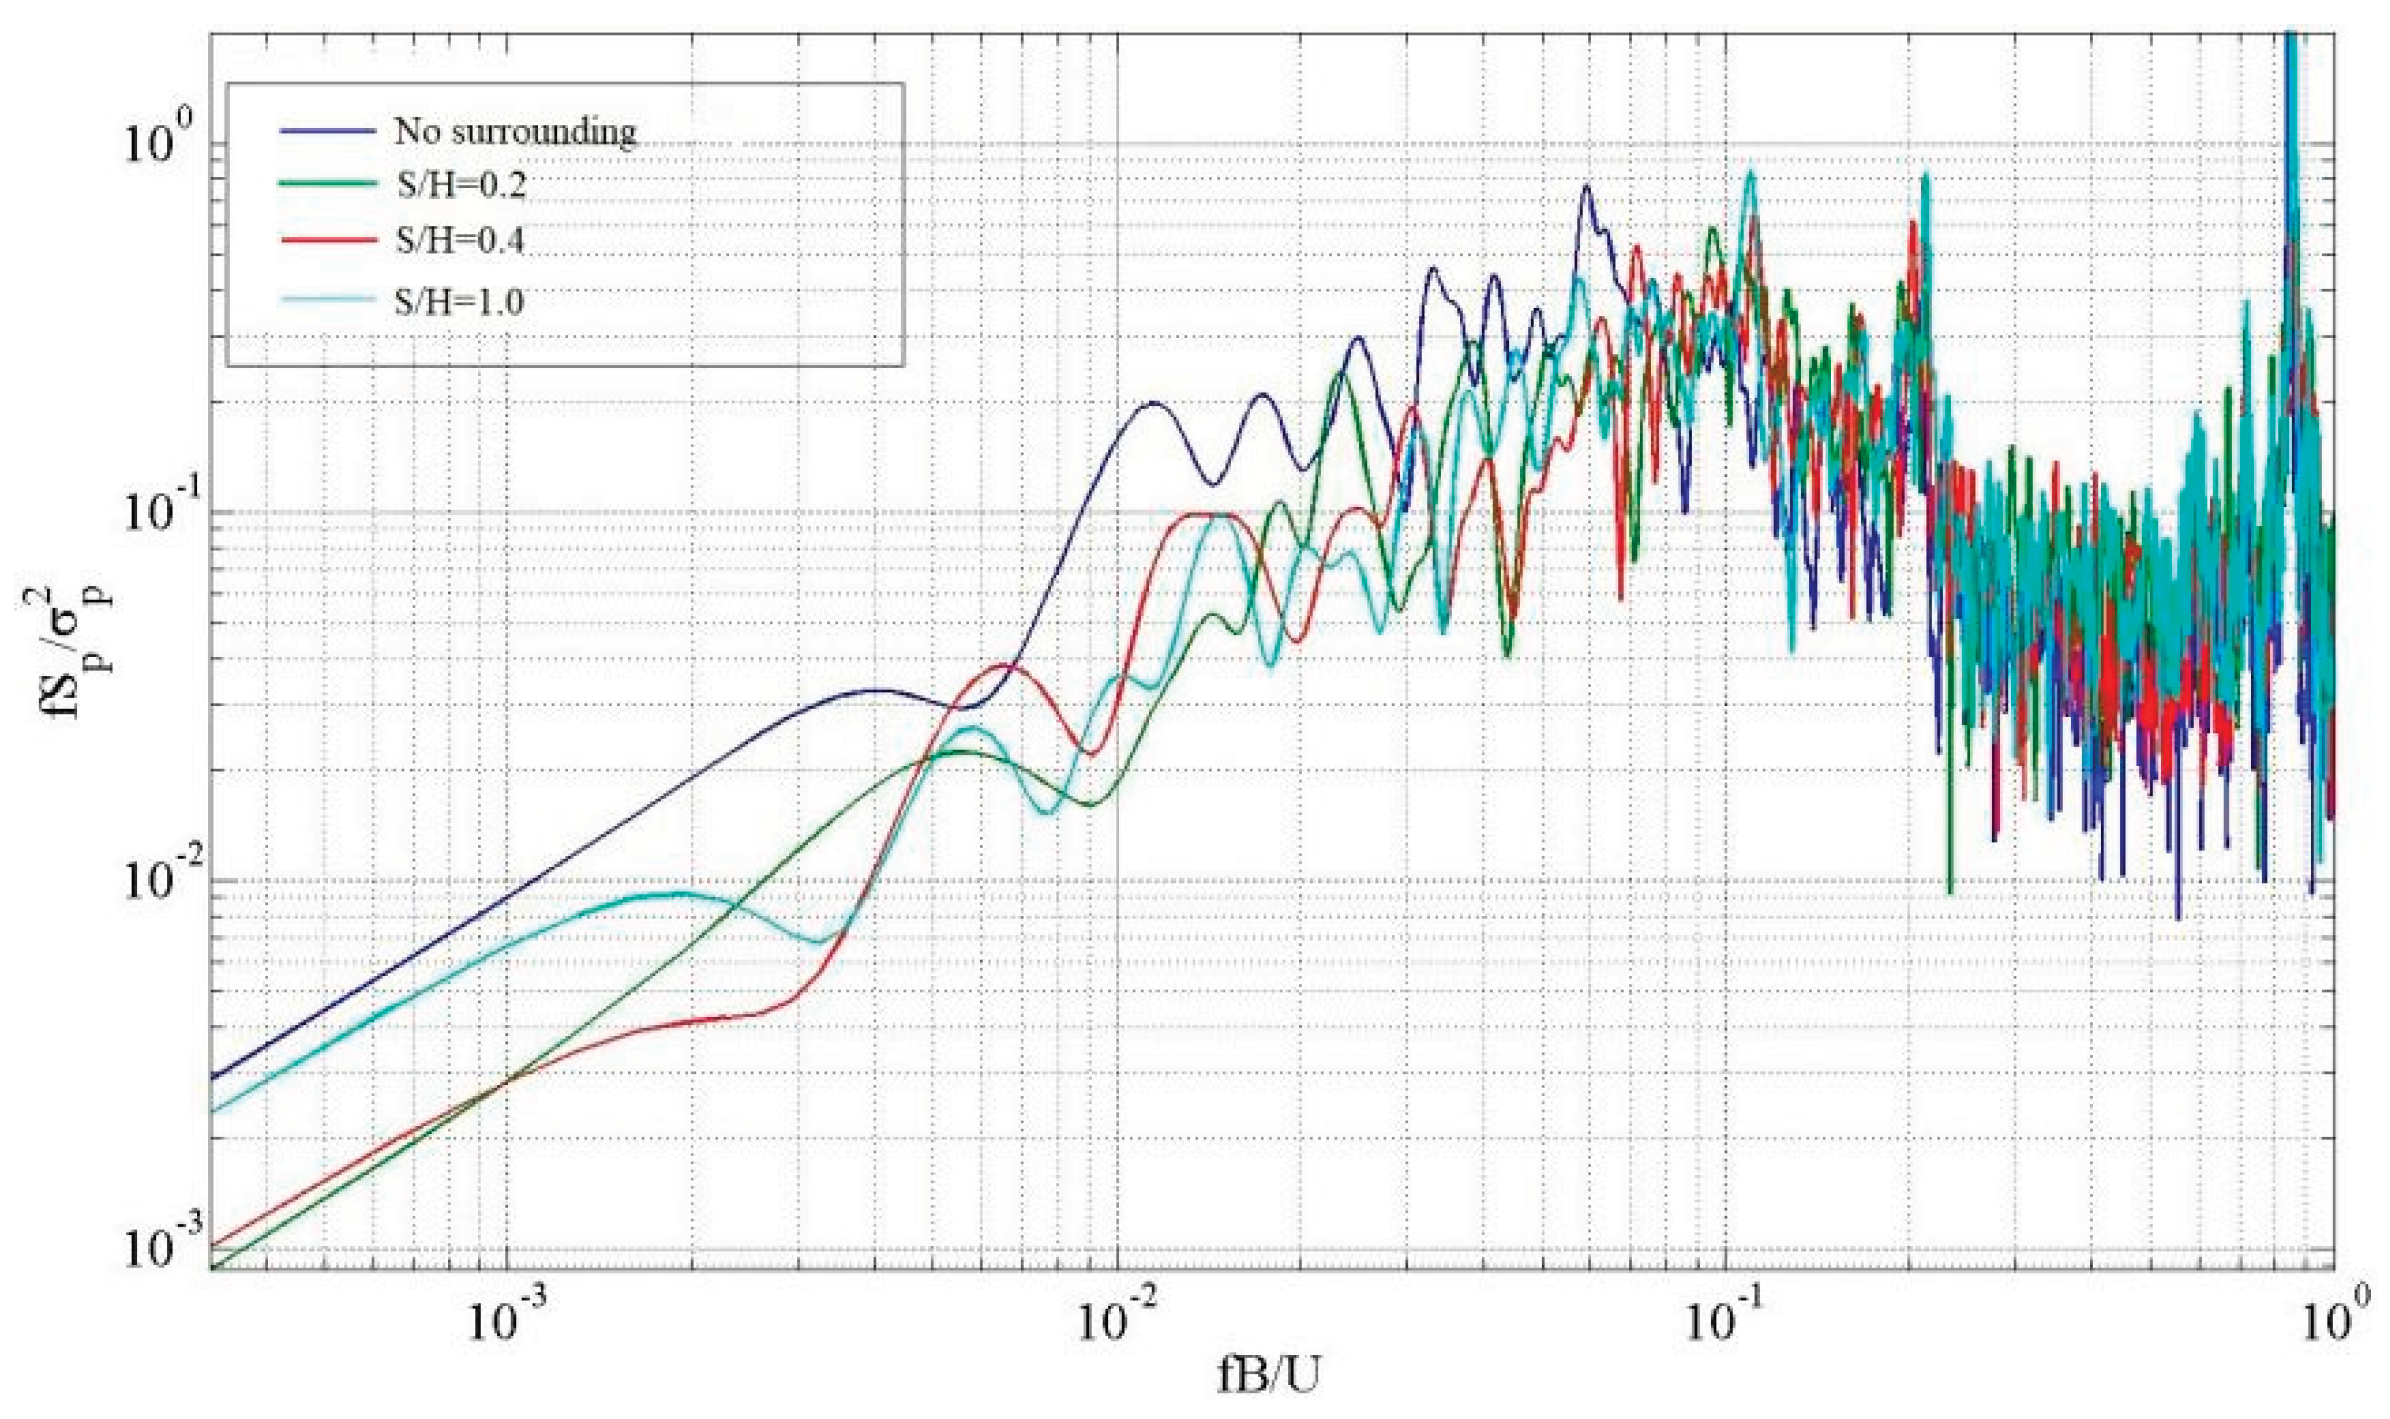
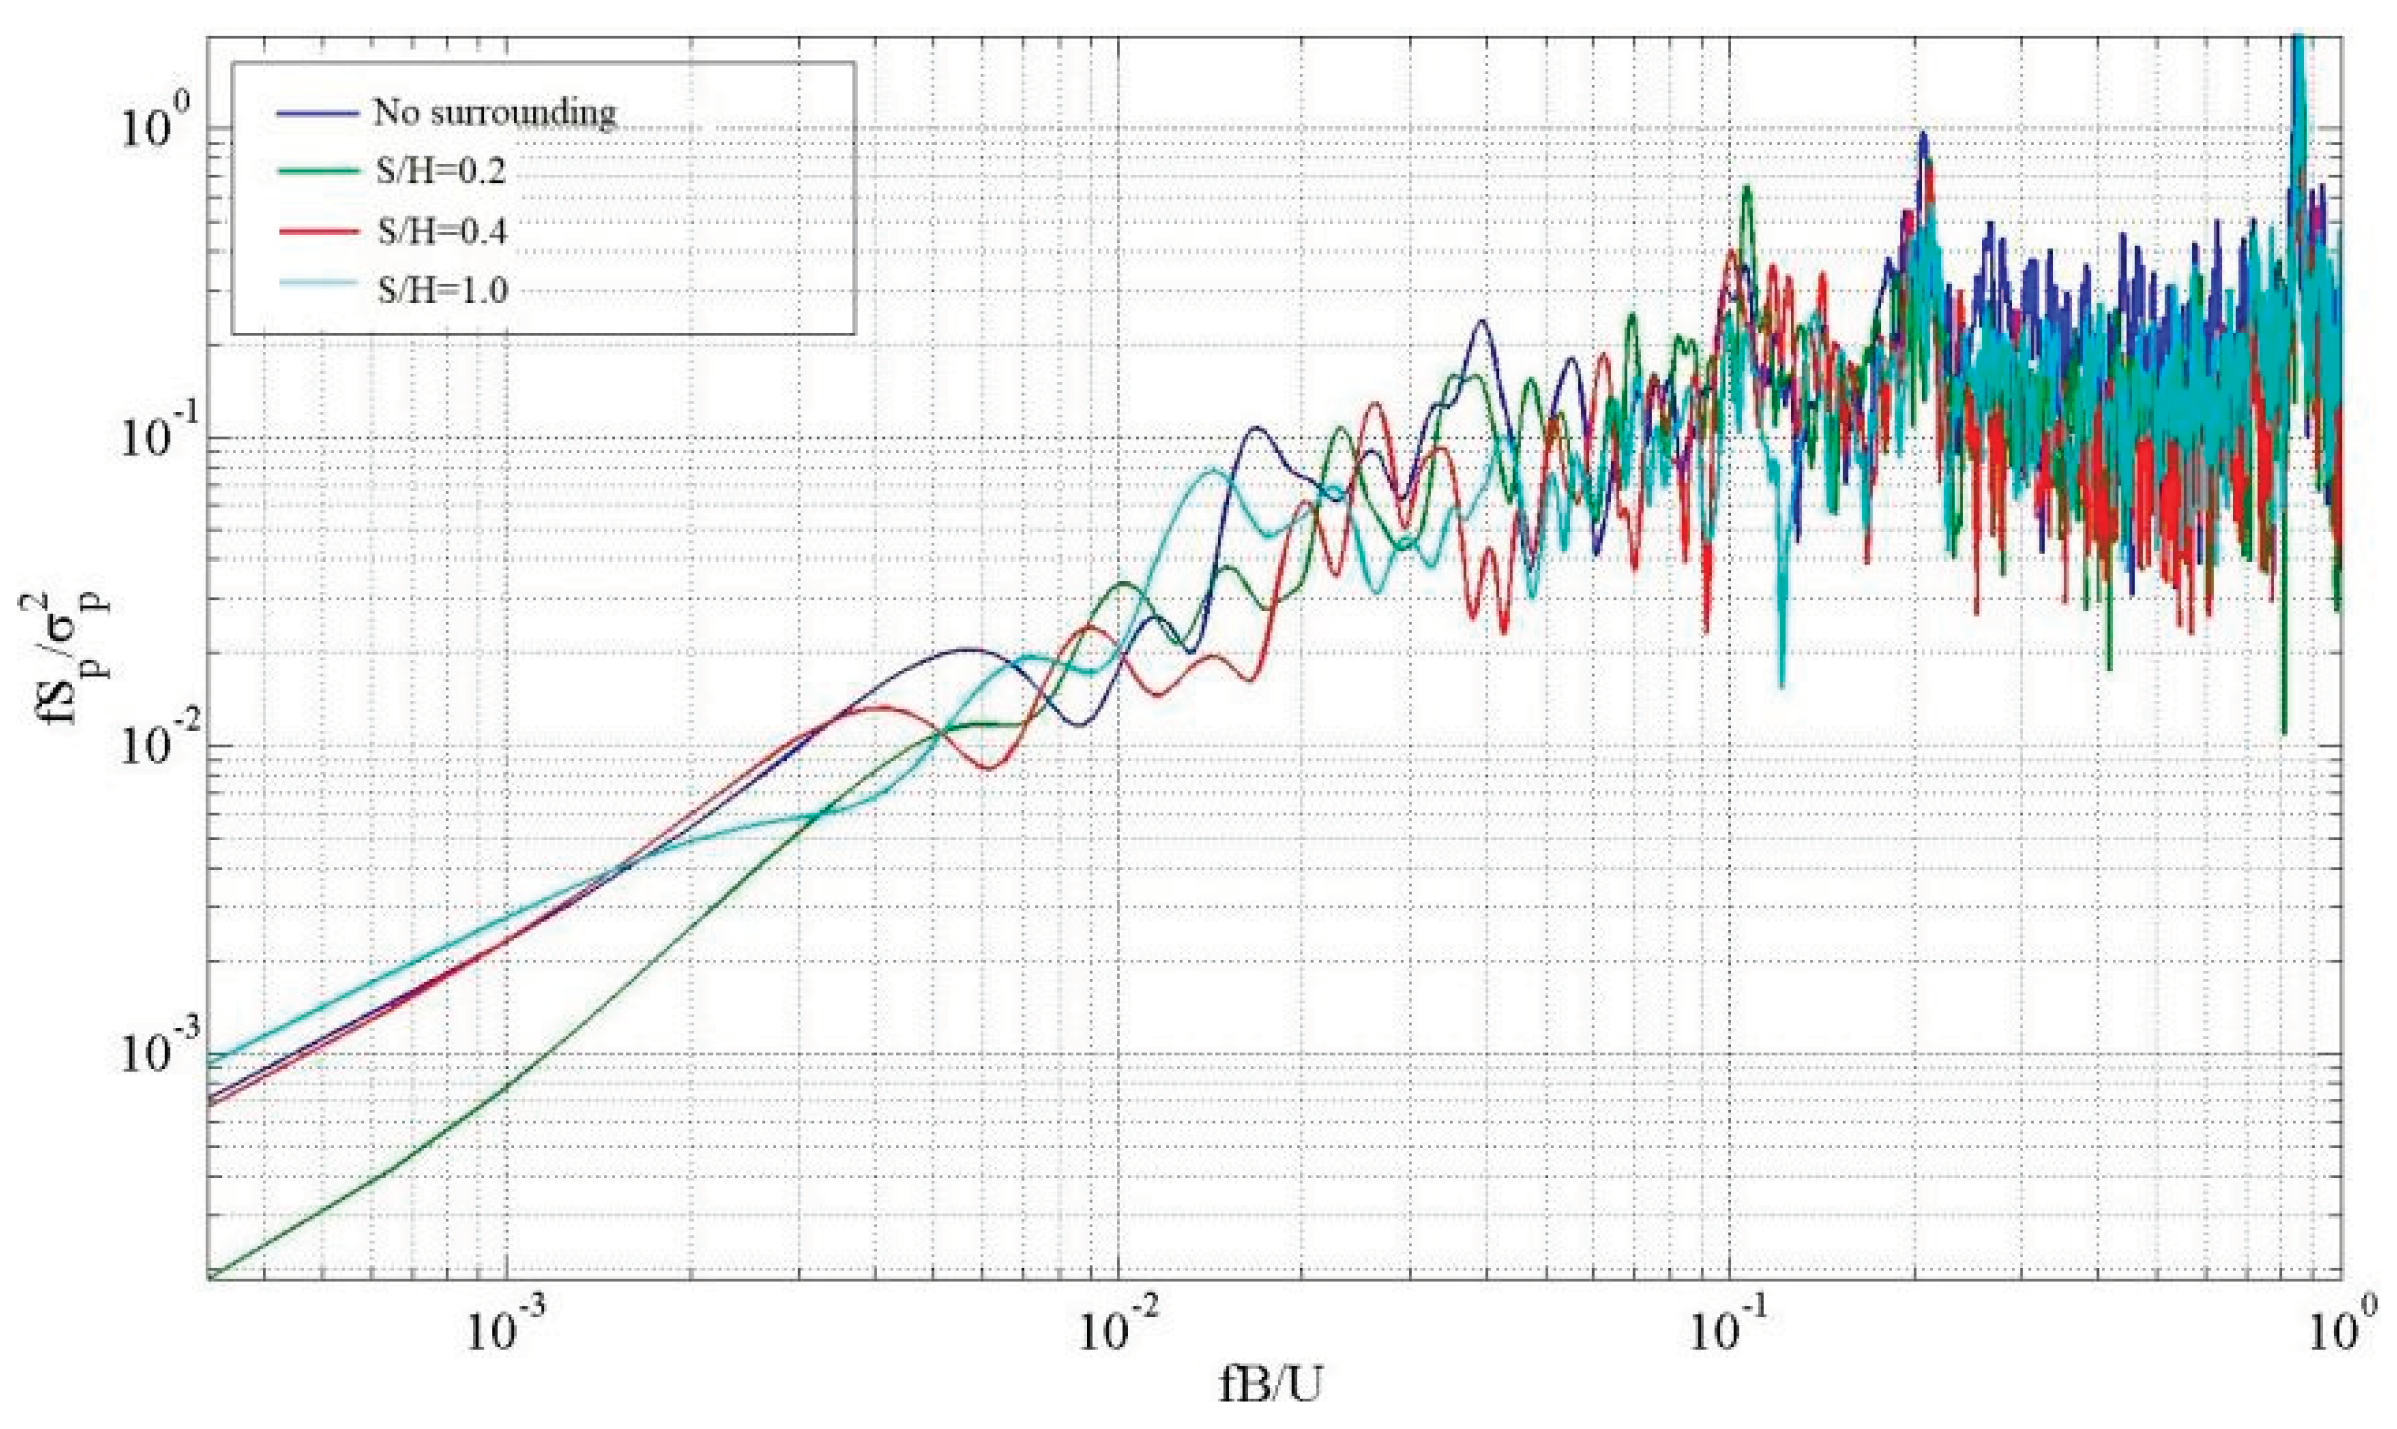
Figure 11 shows that at a wind direction of 0°, the spectral peak on the windward is distinct, measuring approximately 0.76. This occurs when the reduction frequency of the low-frequency band is 0.08 when there isn’t a surrounding building. The energy in the high-frequency is minimal, with the majority of energy concentrated in the low-frequency range, primarily within the expansive vortexes in space. Typically, the maximum amplitude of the distinct spectral peak in the high-frequency is enhanced following an increase in the elevation of the mountain. The findings indicate that the presence of the mountain alters the flow, leading to an augmentation in small-scale vortices and an elevation in high-frequency band energy. As the hillside and the building move further apart, the maximum value of the spike spectral peak in the low-frequency gradually rises, and the energy of the large-scale vortex steadily grows.
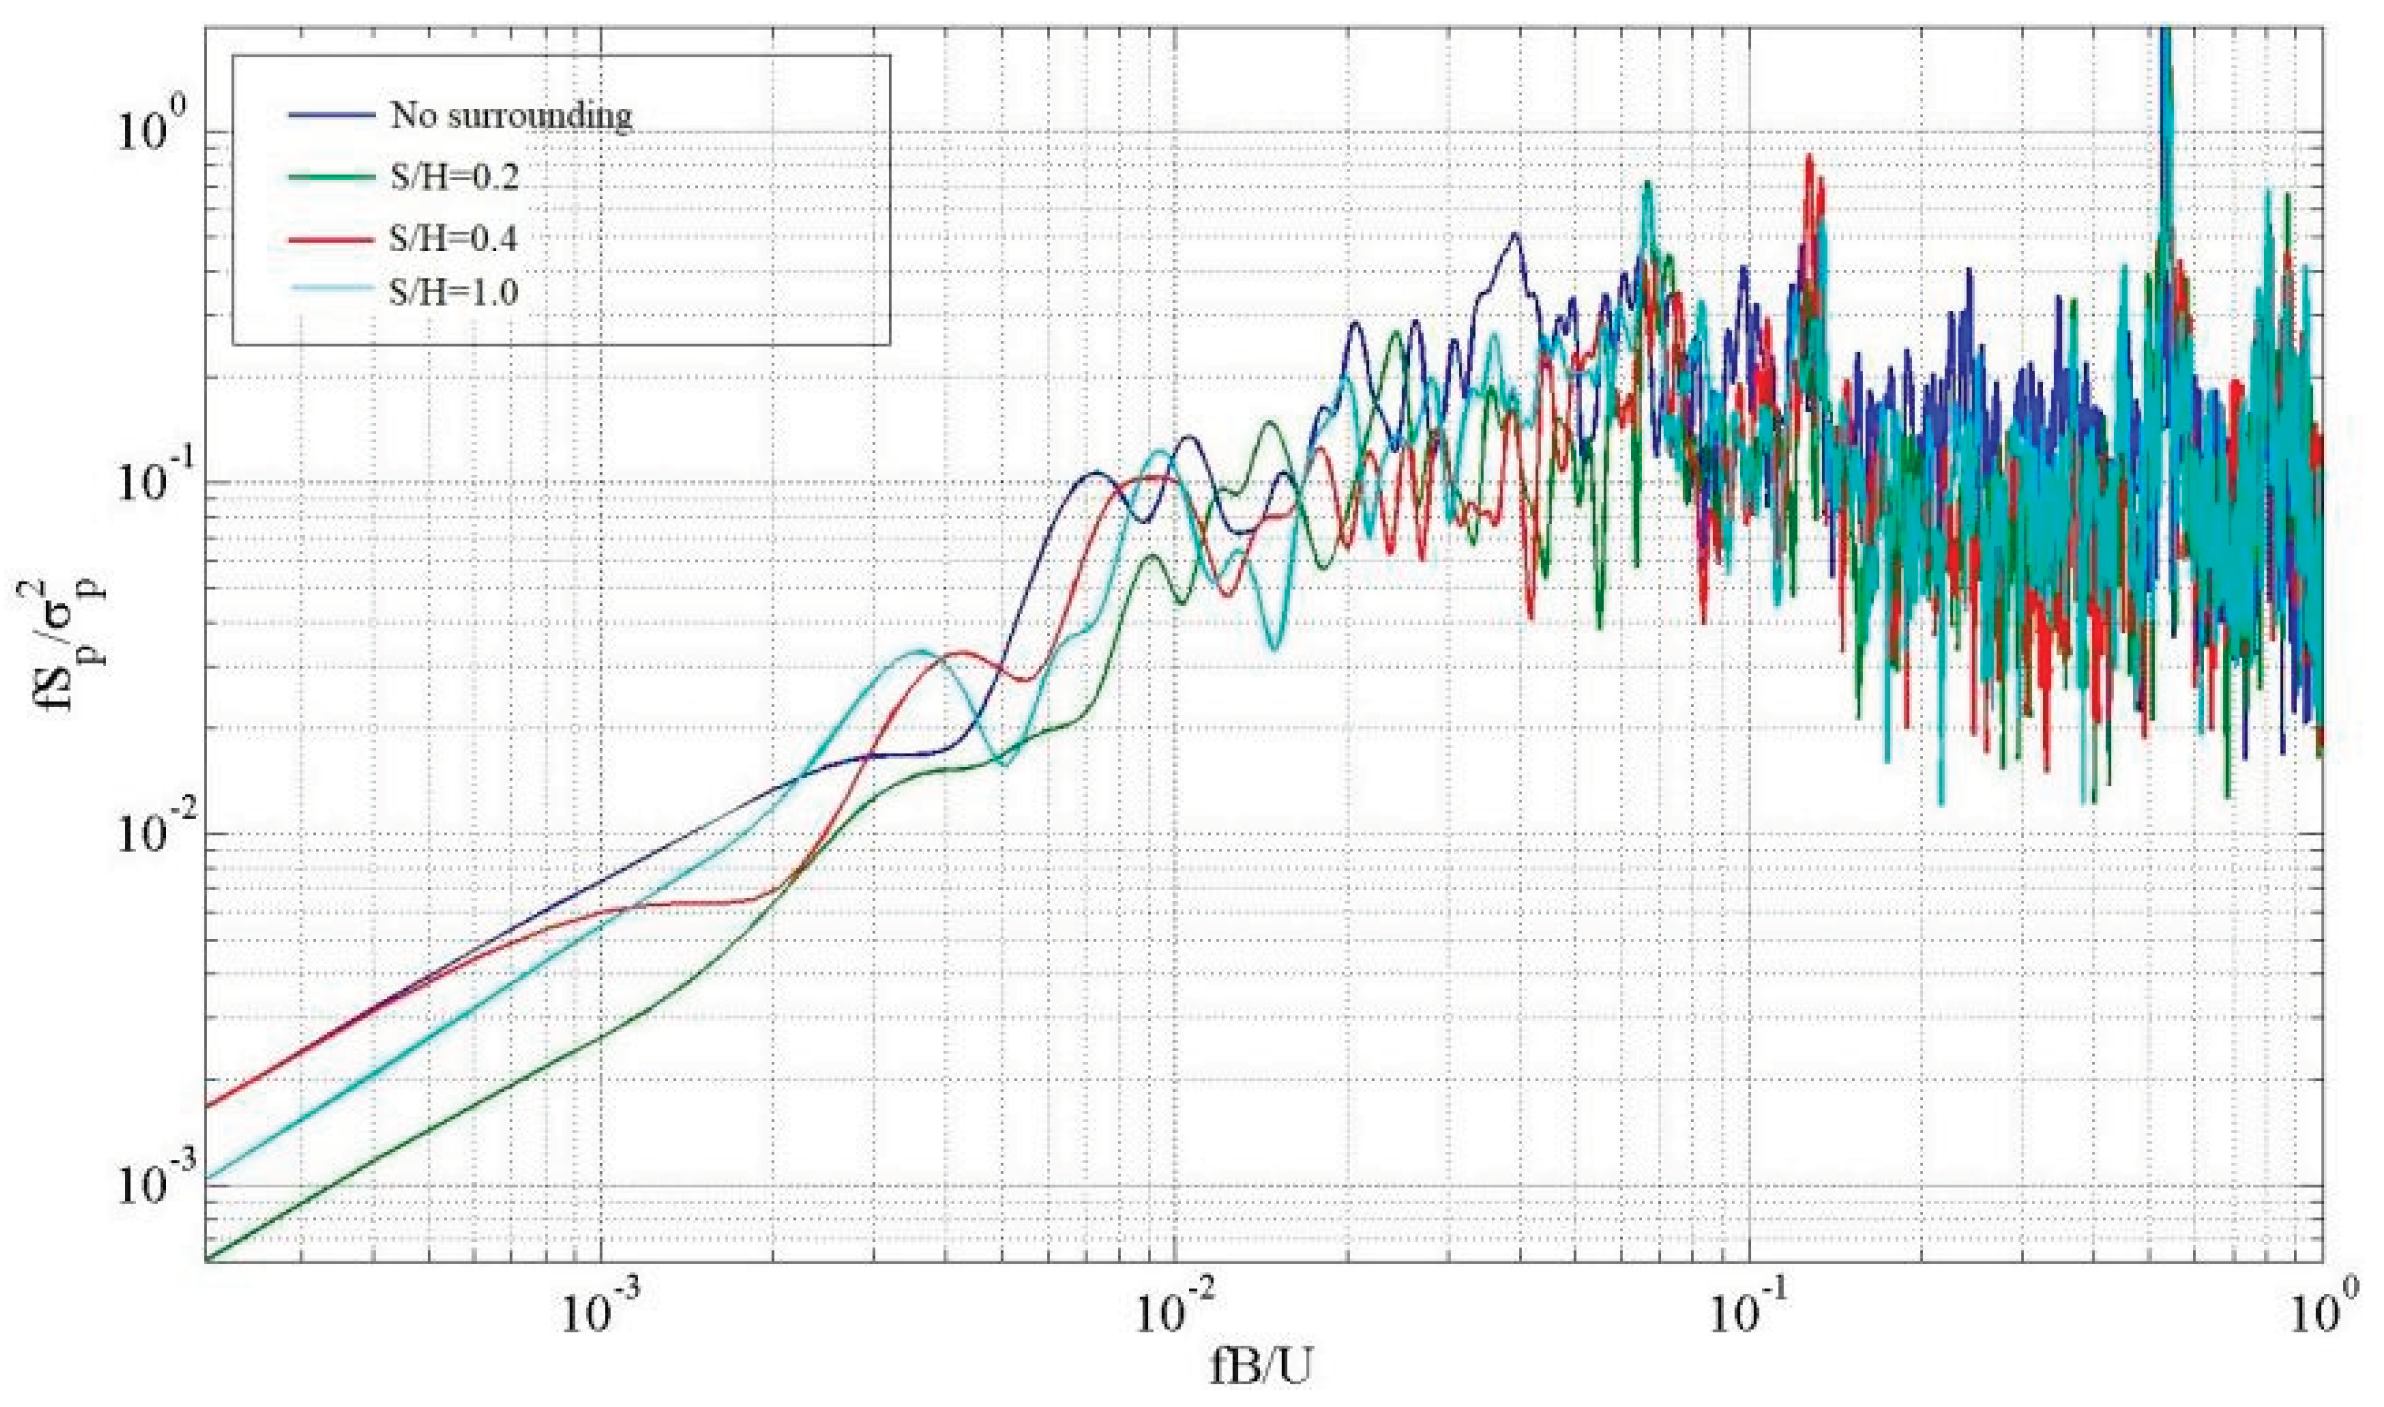
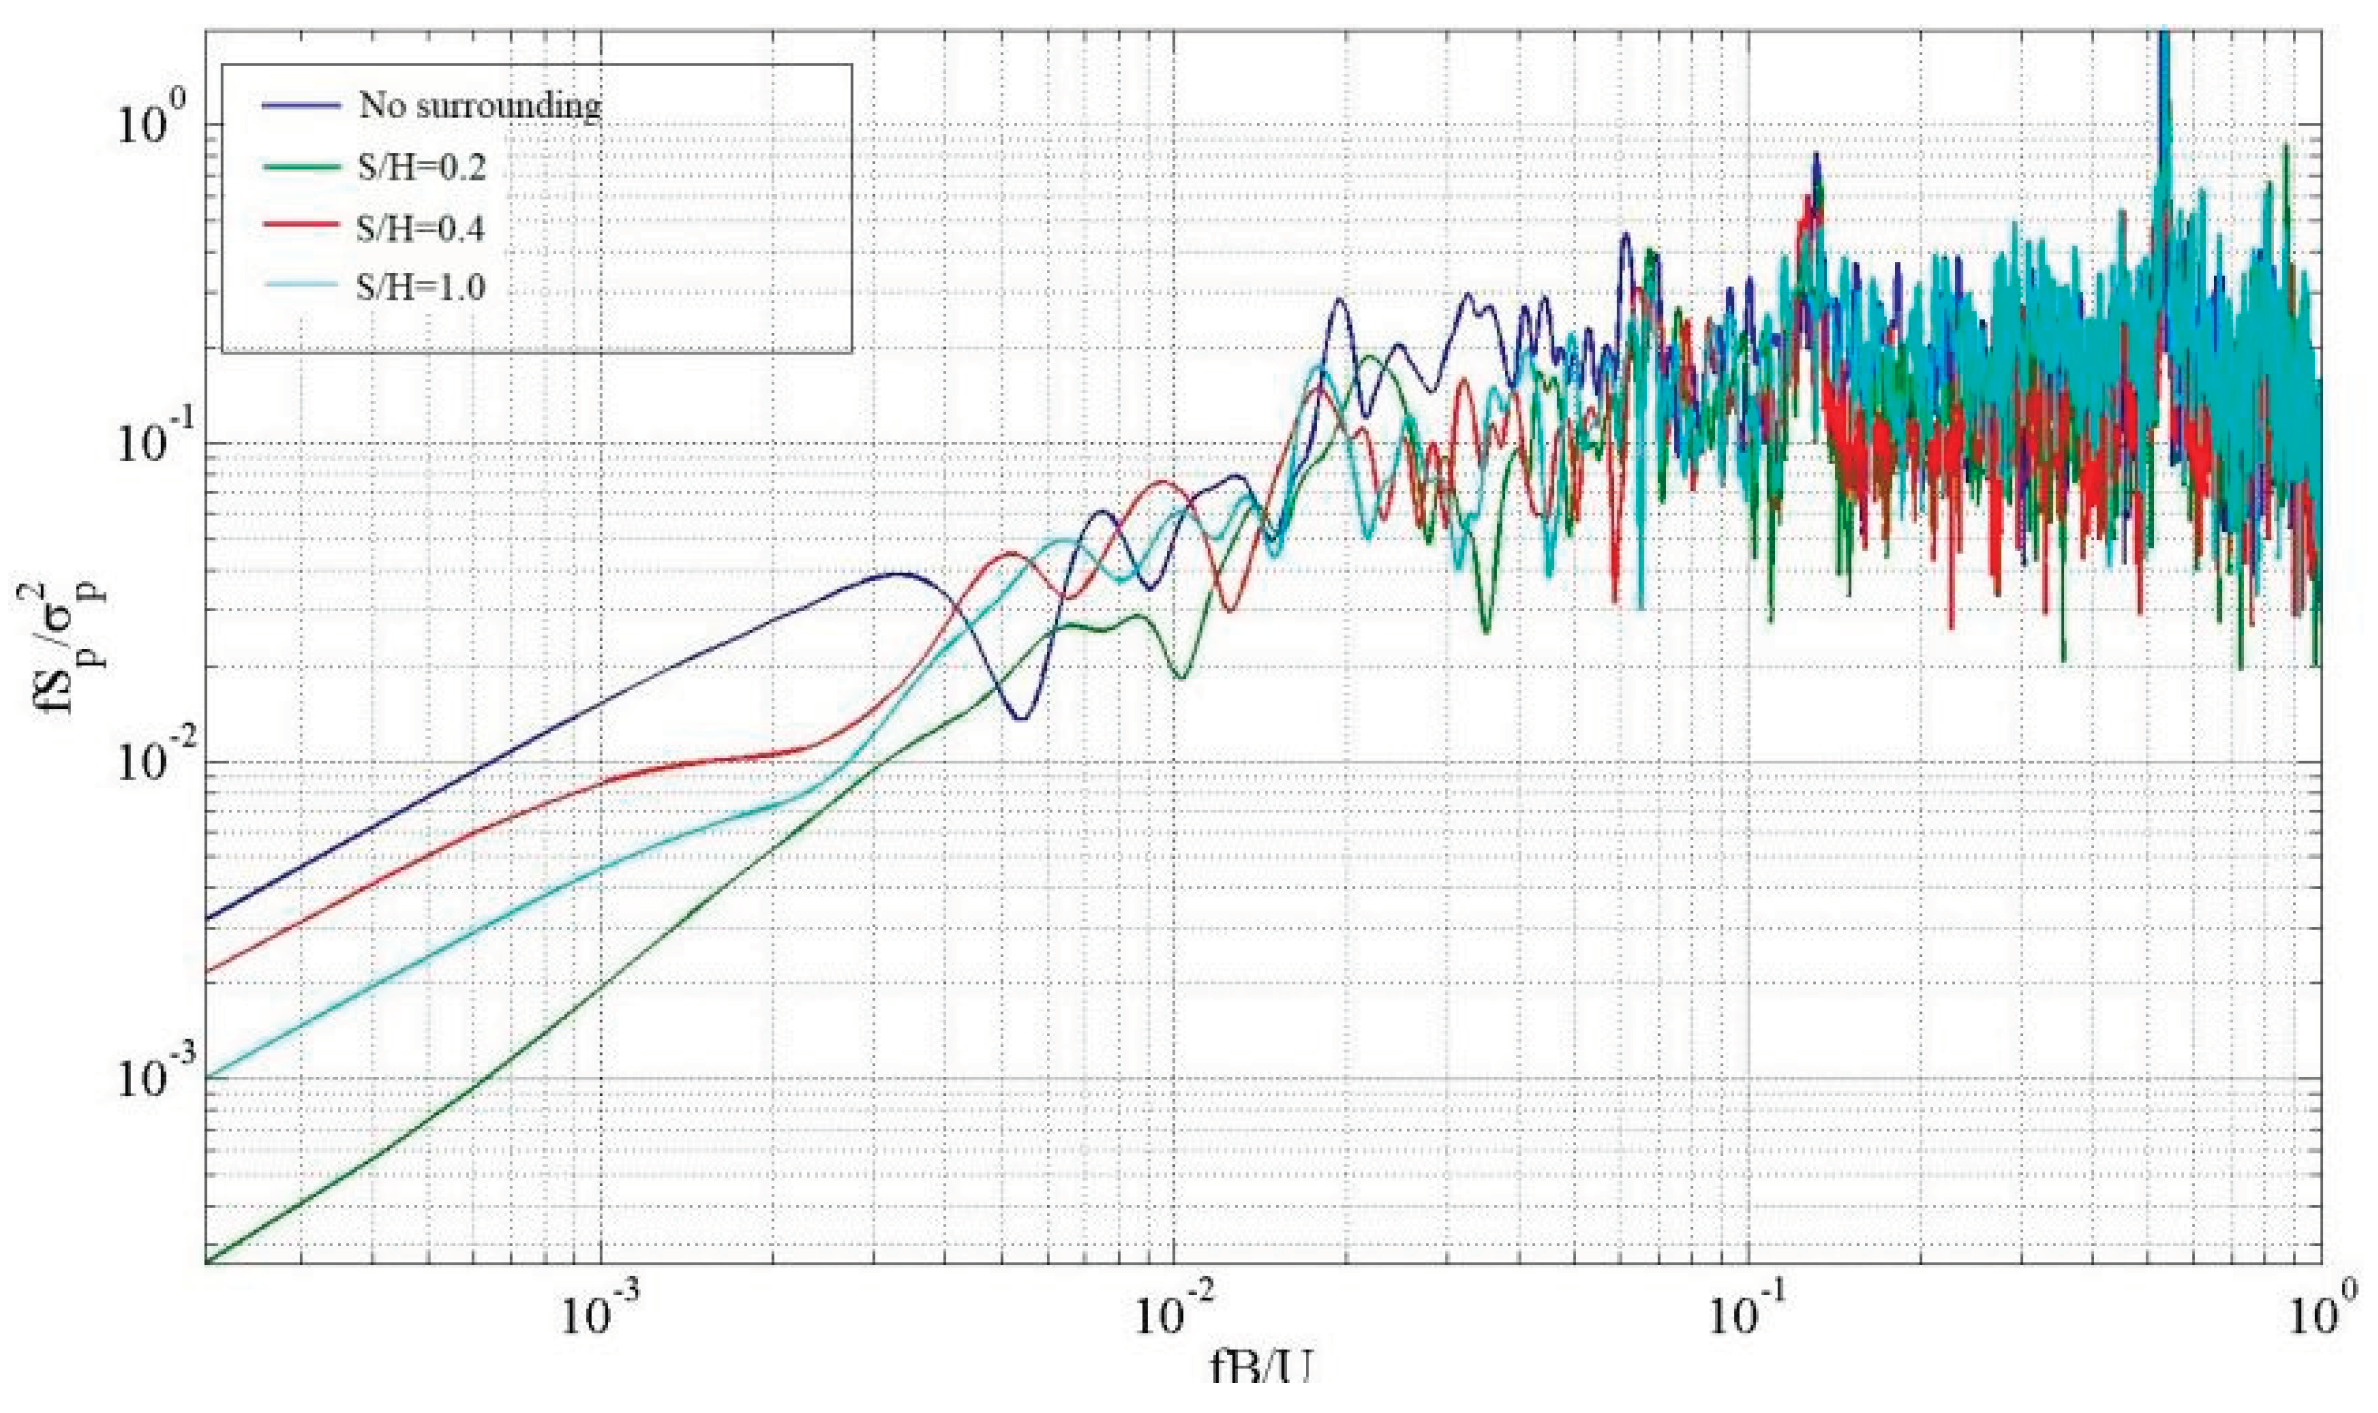
Figure 12 shows that the spectrum is abundant in the low-frequency range when D12 under a wind direction of 0°, has no impact on the surrounding environment. At a reduction frequency of 1.2 for the high-frequency range, a distinct spectral peak emerges with a peak value of approximately 0.65, while the energy of the remaining high-frequency is minimal. The presence of the mountain alters the low frequency band's spectrum from wide to narrow, and the high-frequency band's spectral peak rises in comparison to when the surrounding environment has no impact. This suggests that the mountain's existence causes an increase in energy in the middle of the left side within the high-frequency. Additionally, the small-scale vortex and large-scale vortex experience slight increases when compared to the absence of the surrounding environment's influence.
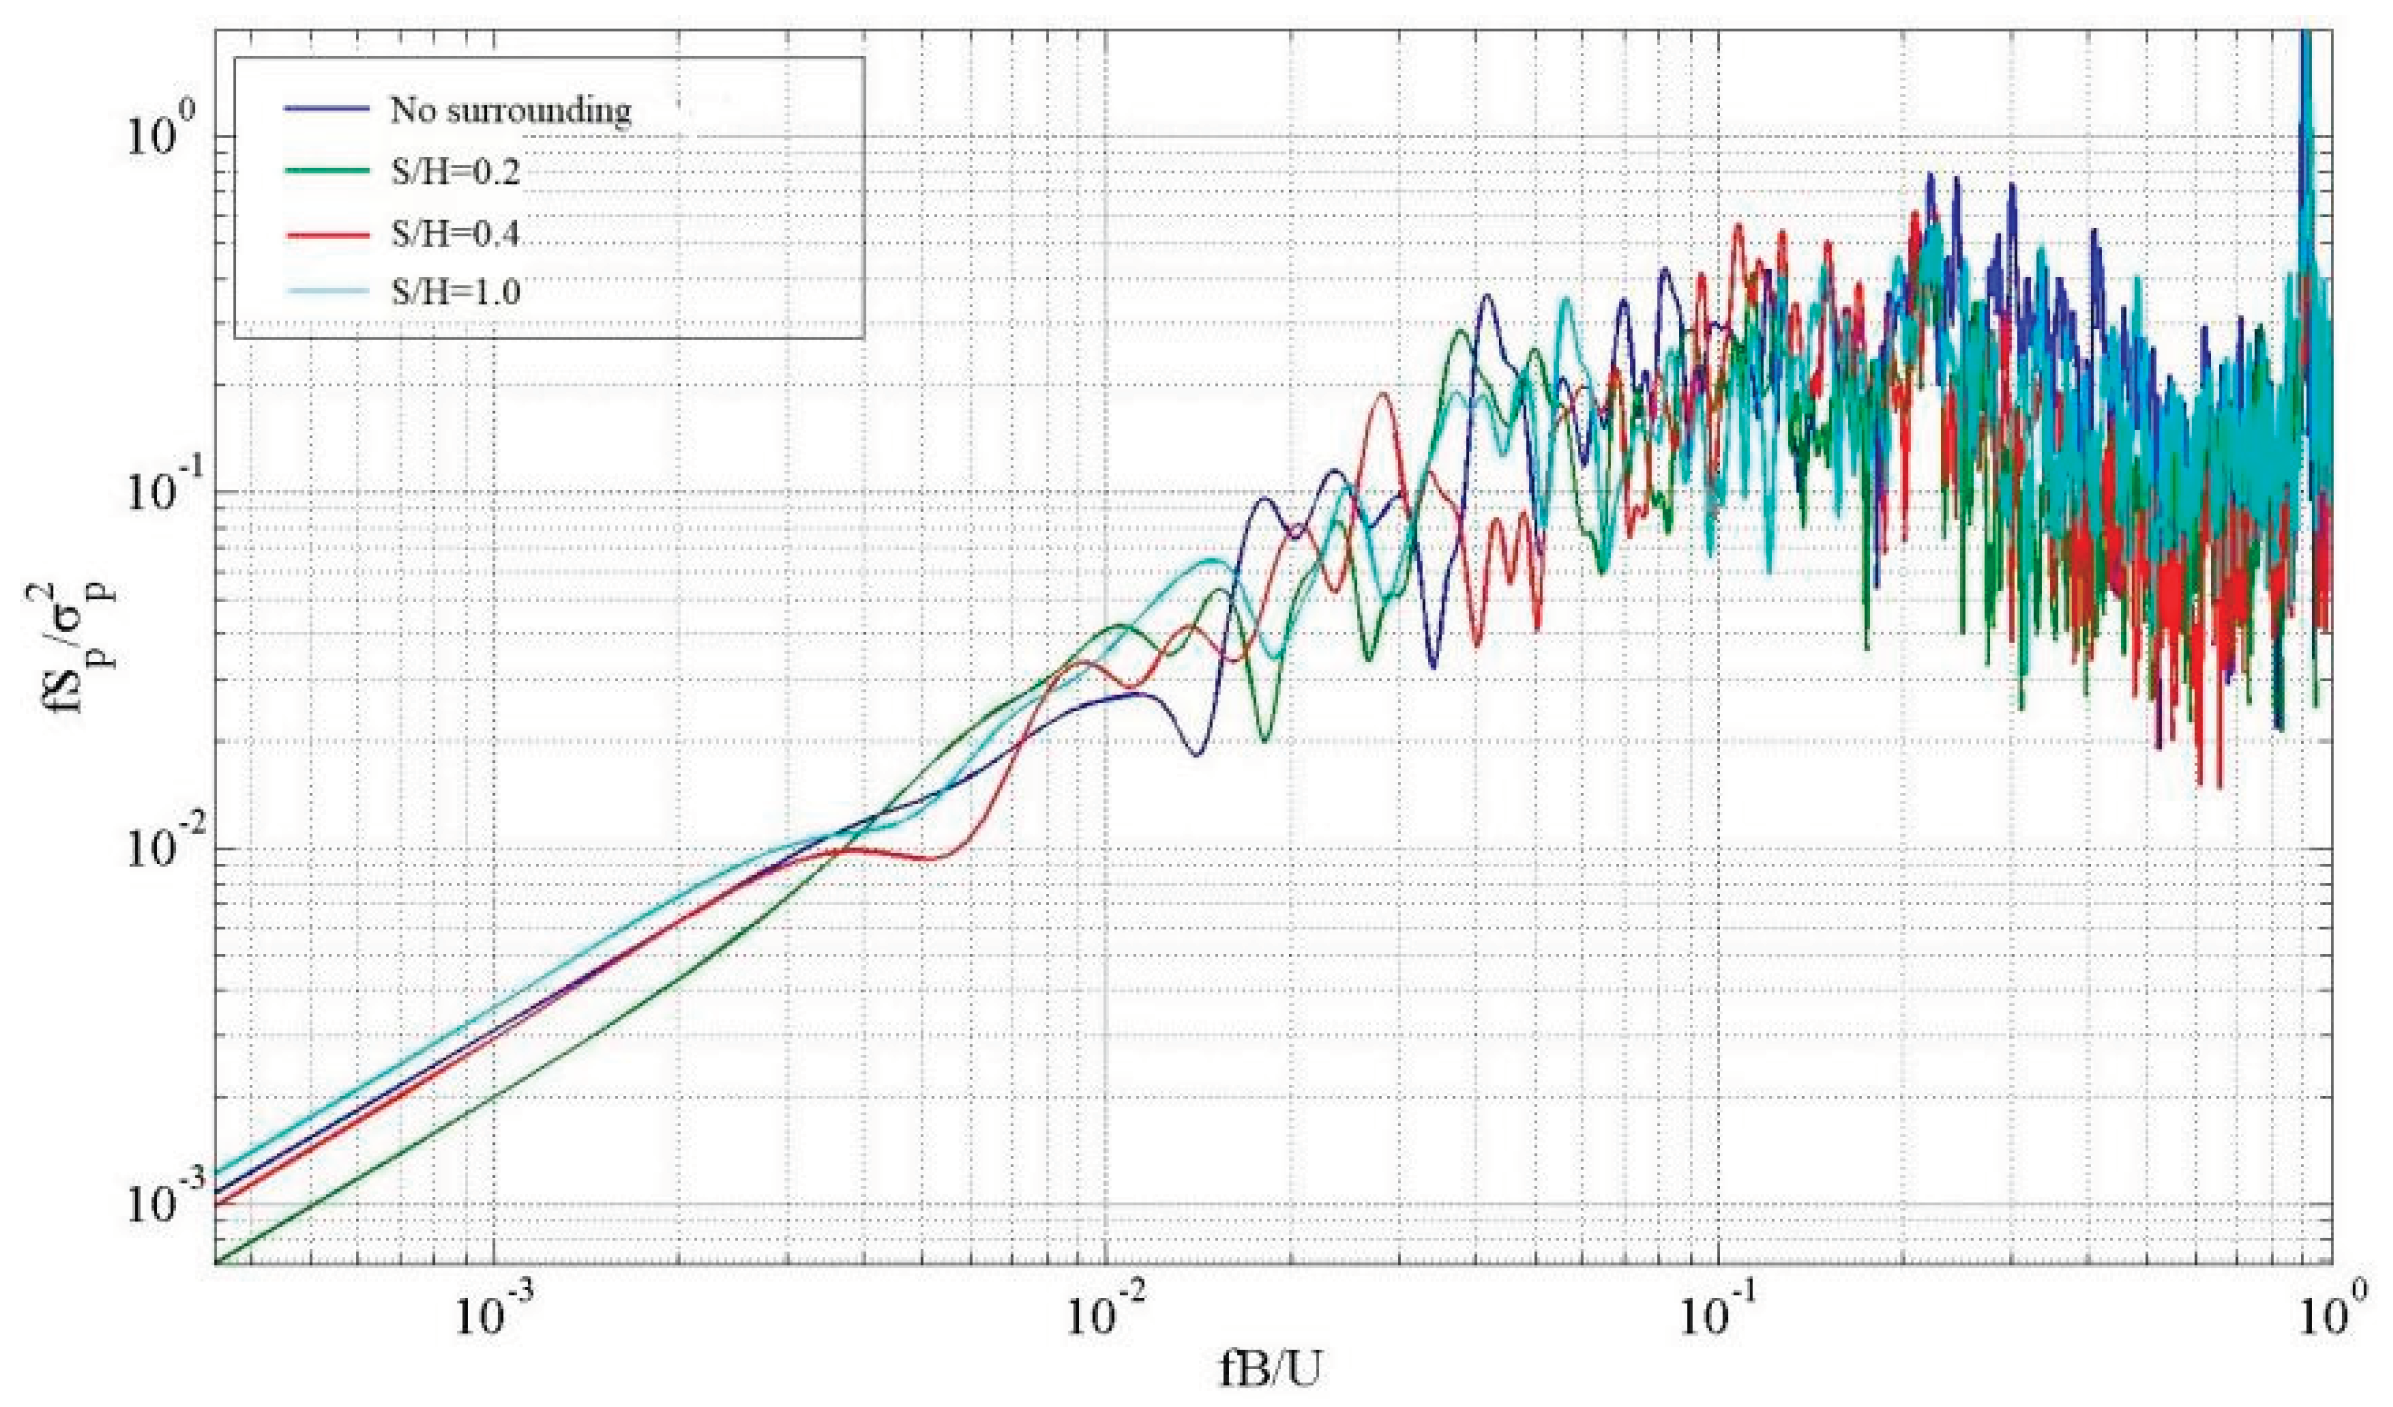
Figure 13 illustrates that when there is a mountain under the wind direction of 0°, the spectral peak value of the high-frequency band decreases on the lee side, unaffected by the surrounding environment. As the hillside and the building move further apart, the spectral peak value of the low-frequency band steadily rises. On the other hand, there is a decrease in the maximum value of the high-frequency spectral. The data indicates a gradual shift in energy from a higher frequency to a lower frequency. Additionally, the impact of fluctuating wind pressure, resulting from the incoming wind's characteristics, becomes more pronounced, while the effect of vortex turbulence caused by the mountain diminishes.
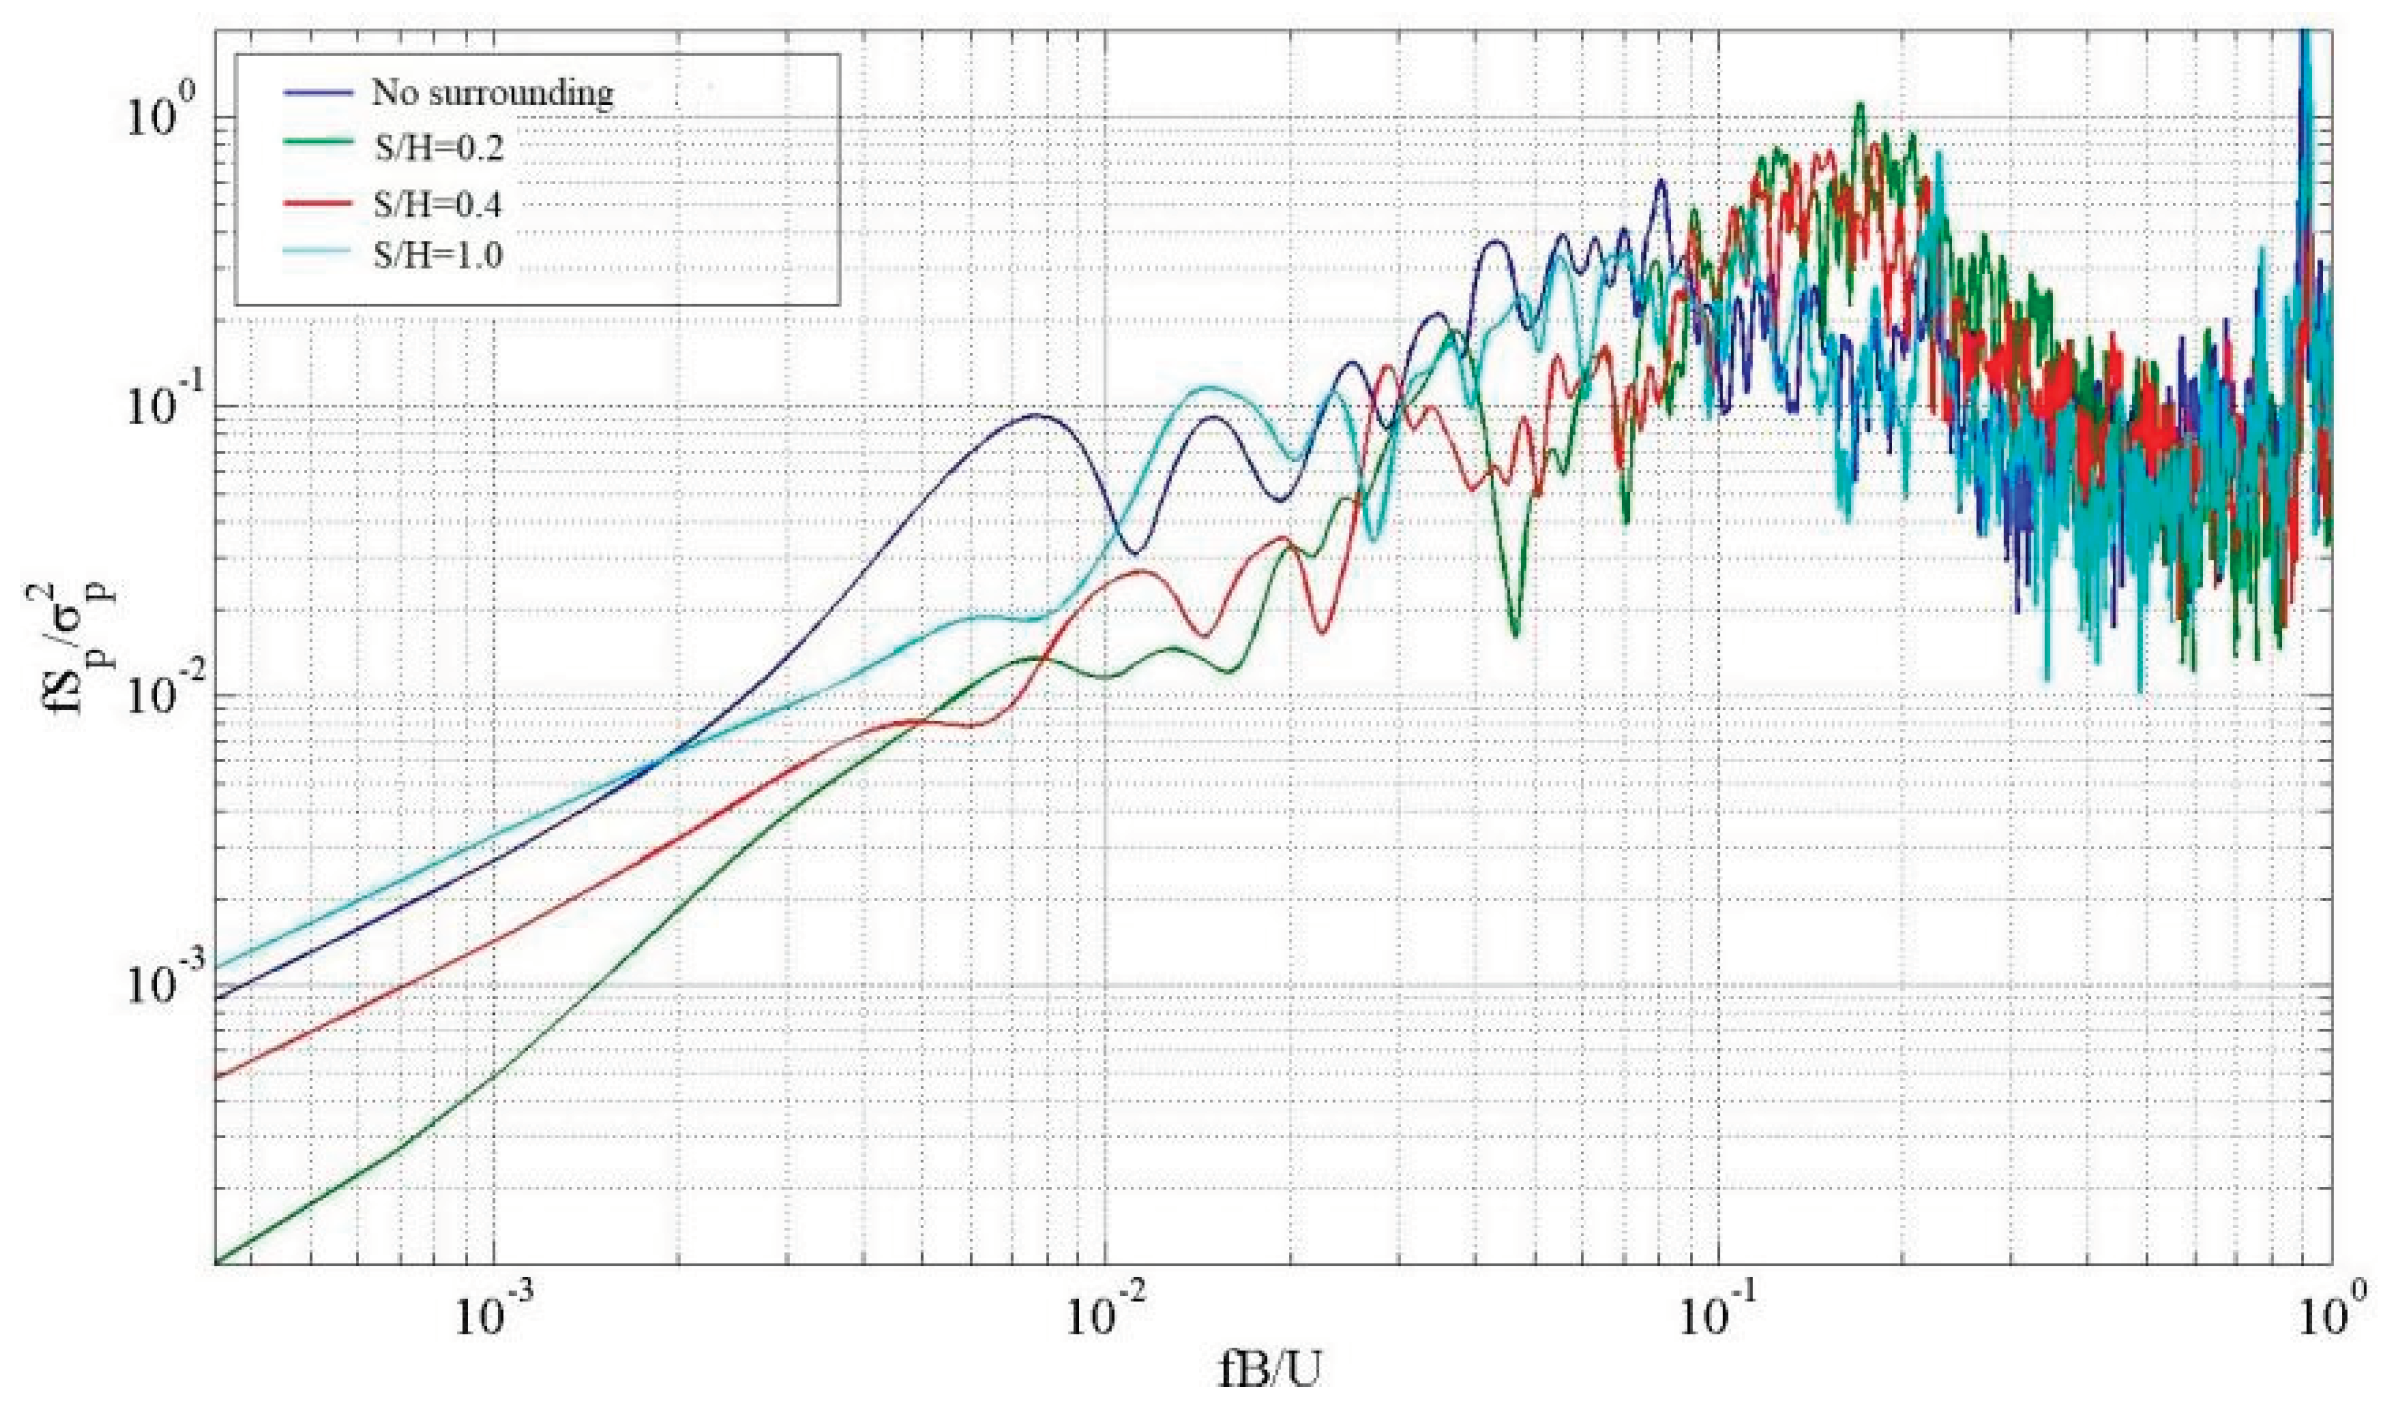
Figure 14 shows that when S/H=0.2, the low-frequency band's spectral peak value at D26 decreases, while the high-frequency band's spectral peak value increases relatively on the right side, unaffected by the surrounding environment. Currently, the energy frequency transited from low to high, leading to a reduction in the impact of the fluctuating resulting from the properties of the incoming wind. Nevertheless, the impact of the vortex turbulence resulting from the mountain formation escalates. As the hillside and the building move further apart, the high-frequency energy gradually diminishes, leading to a weakening of the vortex turbulence caused by the mountain.
Figure 15 illustrates that at the measuring point WA1 located at the leeward eave's edge, the spectral peak value of the low-frequency band decreases, as well as a decrease in the spectral peak value of the high-frequency when compared to the surrounding environment. As the hillside and the building move further apart, the impact of the vortex turbulence generated by the mountain structure diminishes.
Figure 16 illustrates that at a wind direction of 0°, the measuring point WA20 positioned at the center of the windward eave exhibits a significant spike spectral peak with a peak value of approximately 0.95 when S/H=0.2 and the low-frequency band reduction frequency is 0.2. When S/H=0.4, as the hillside and the building move further apart, the low-frequency range decreases, while the high-frequency remains insignificant in range. At this time, the influence of incoming turbulence is slightly weakened. When S/H=1.0, the high-frequency energy decreases while the low-frequency range increases.
6. Analysis of the Probability Law of Fluctuating Wind Pressure in Low-Rise Buildings
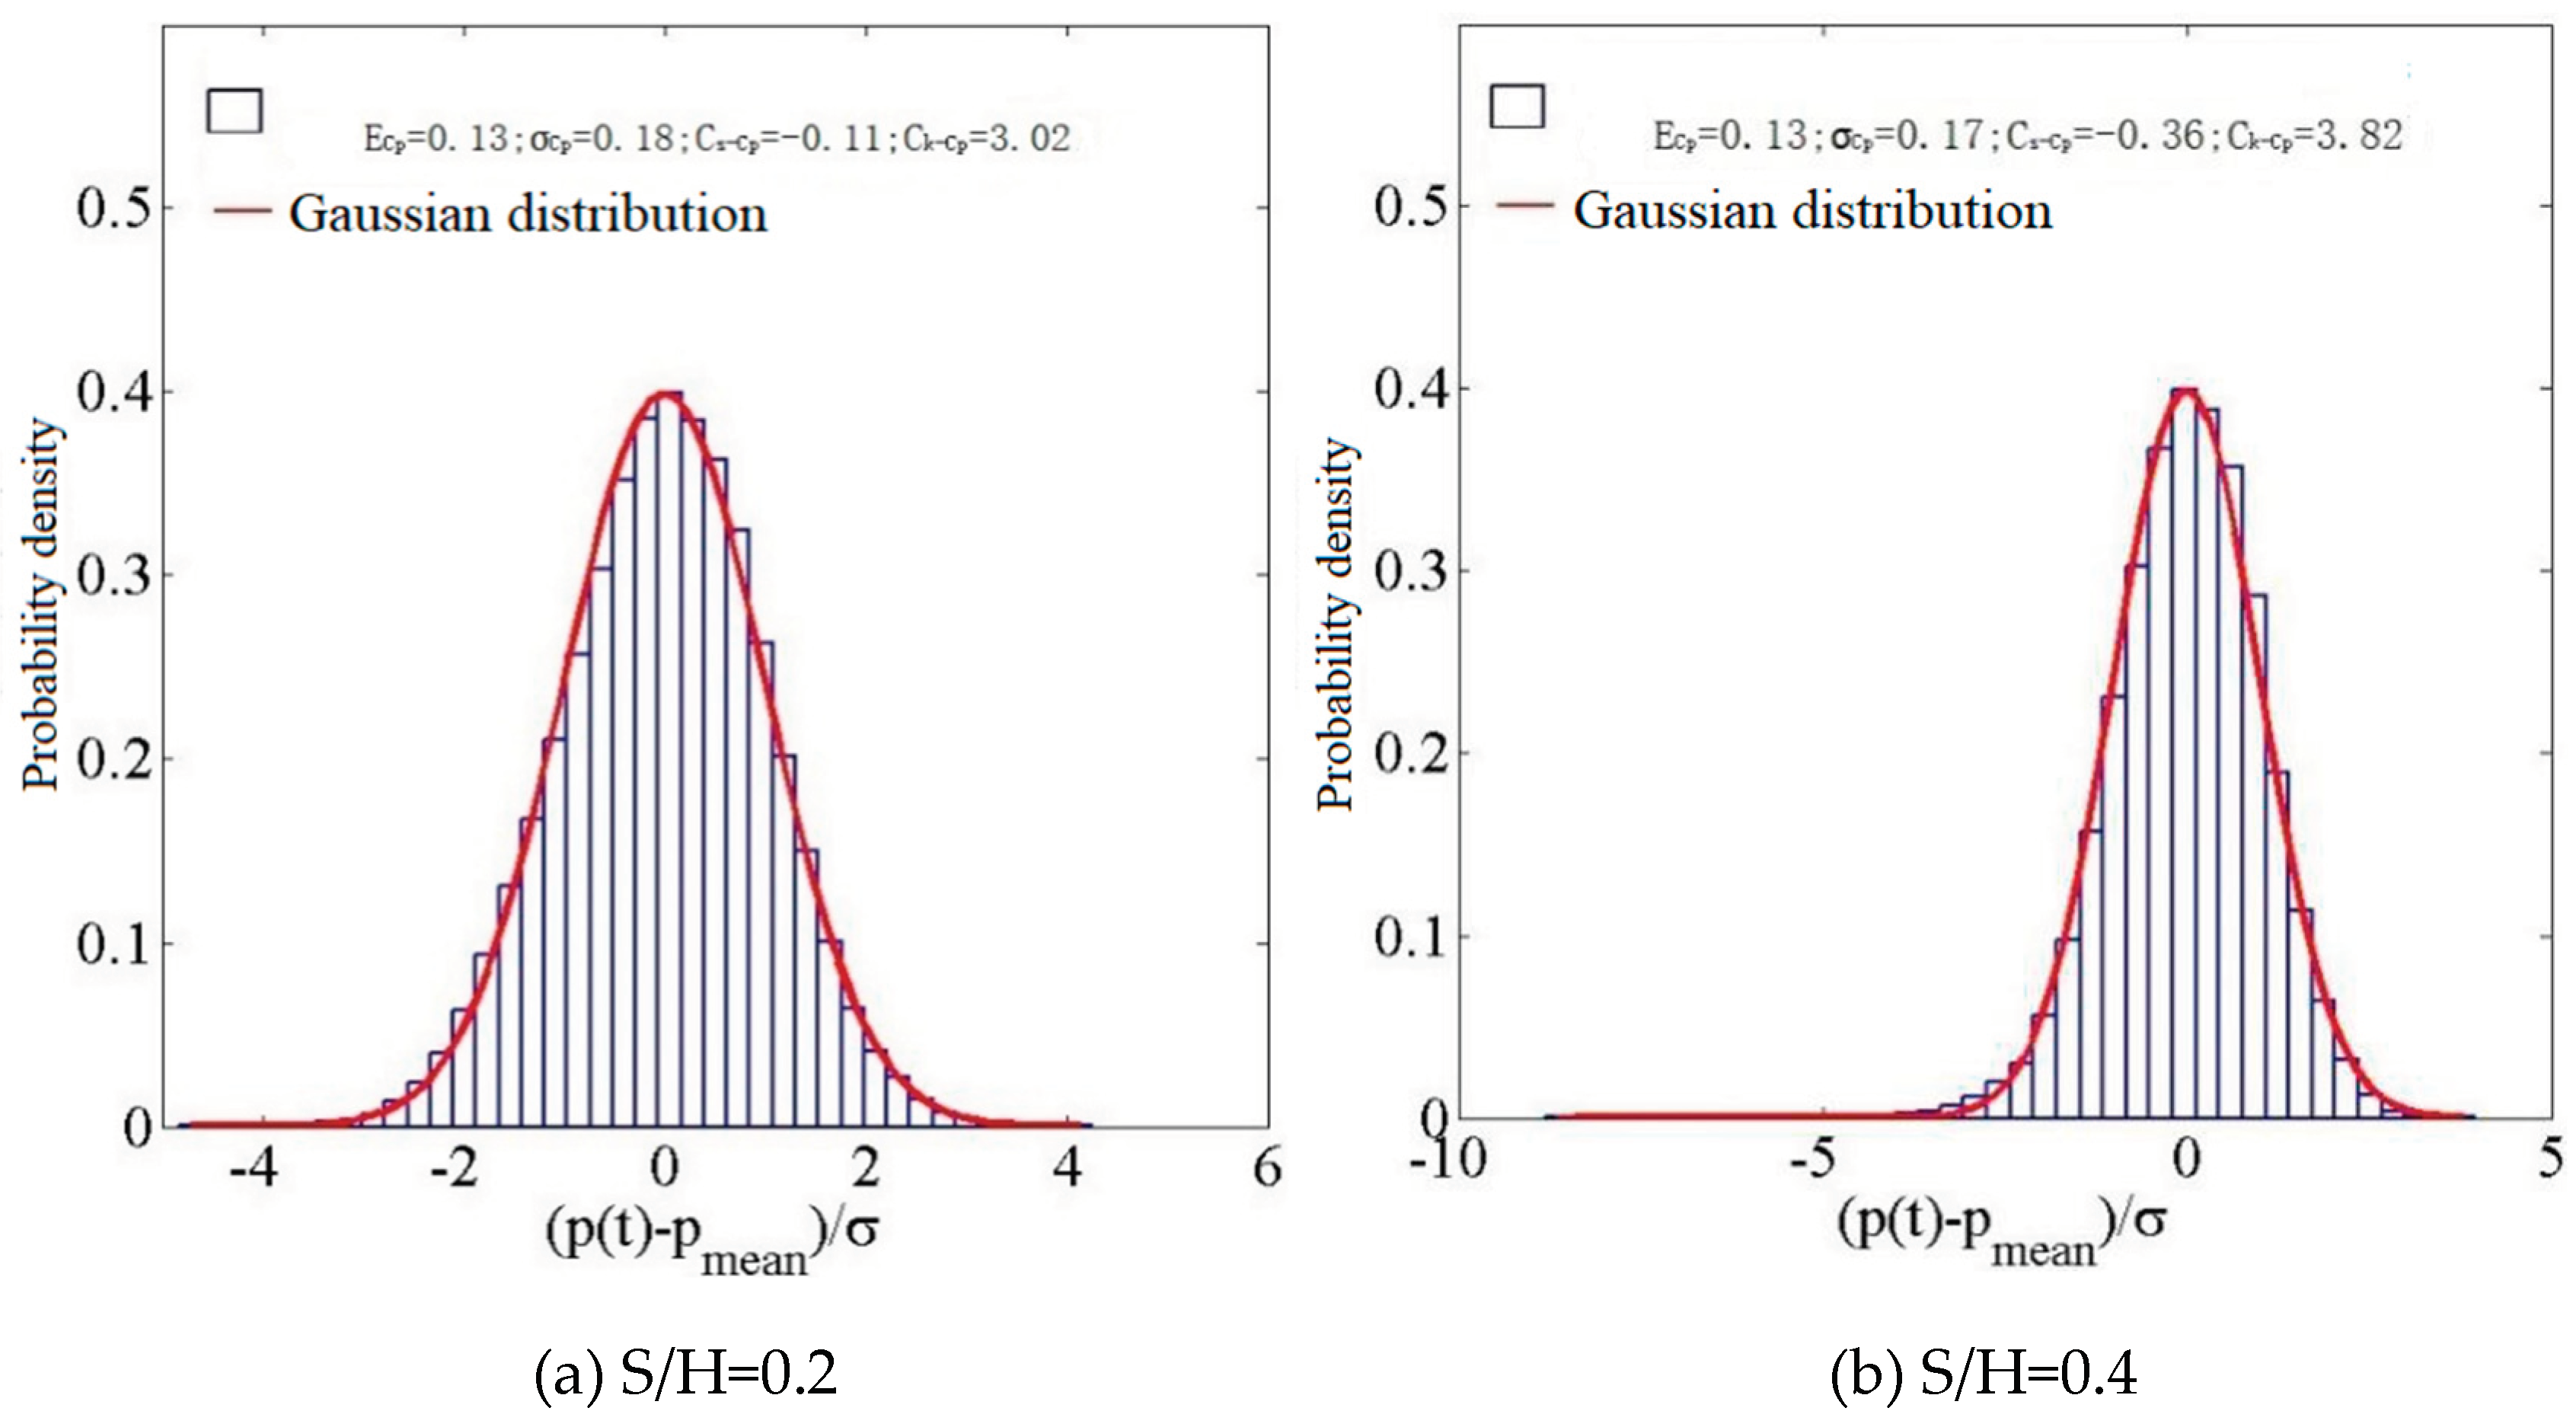
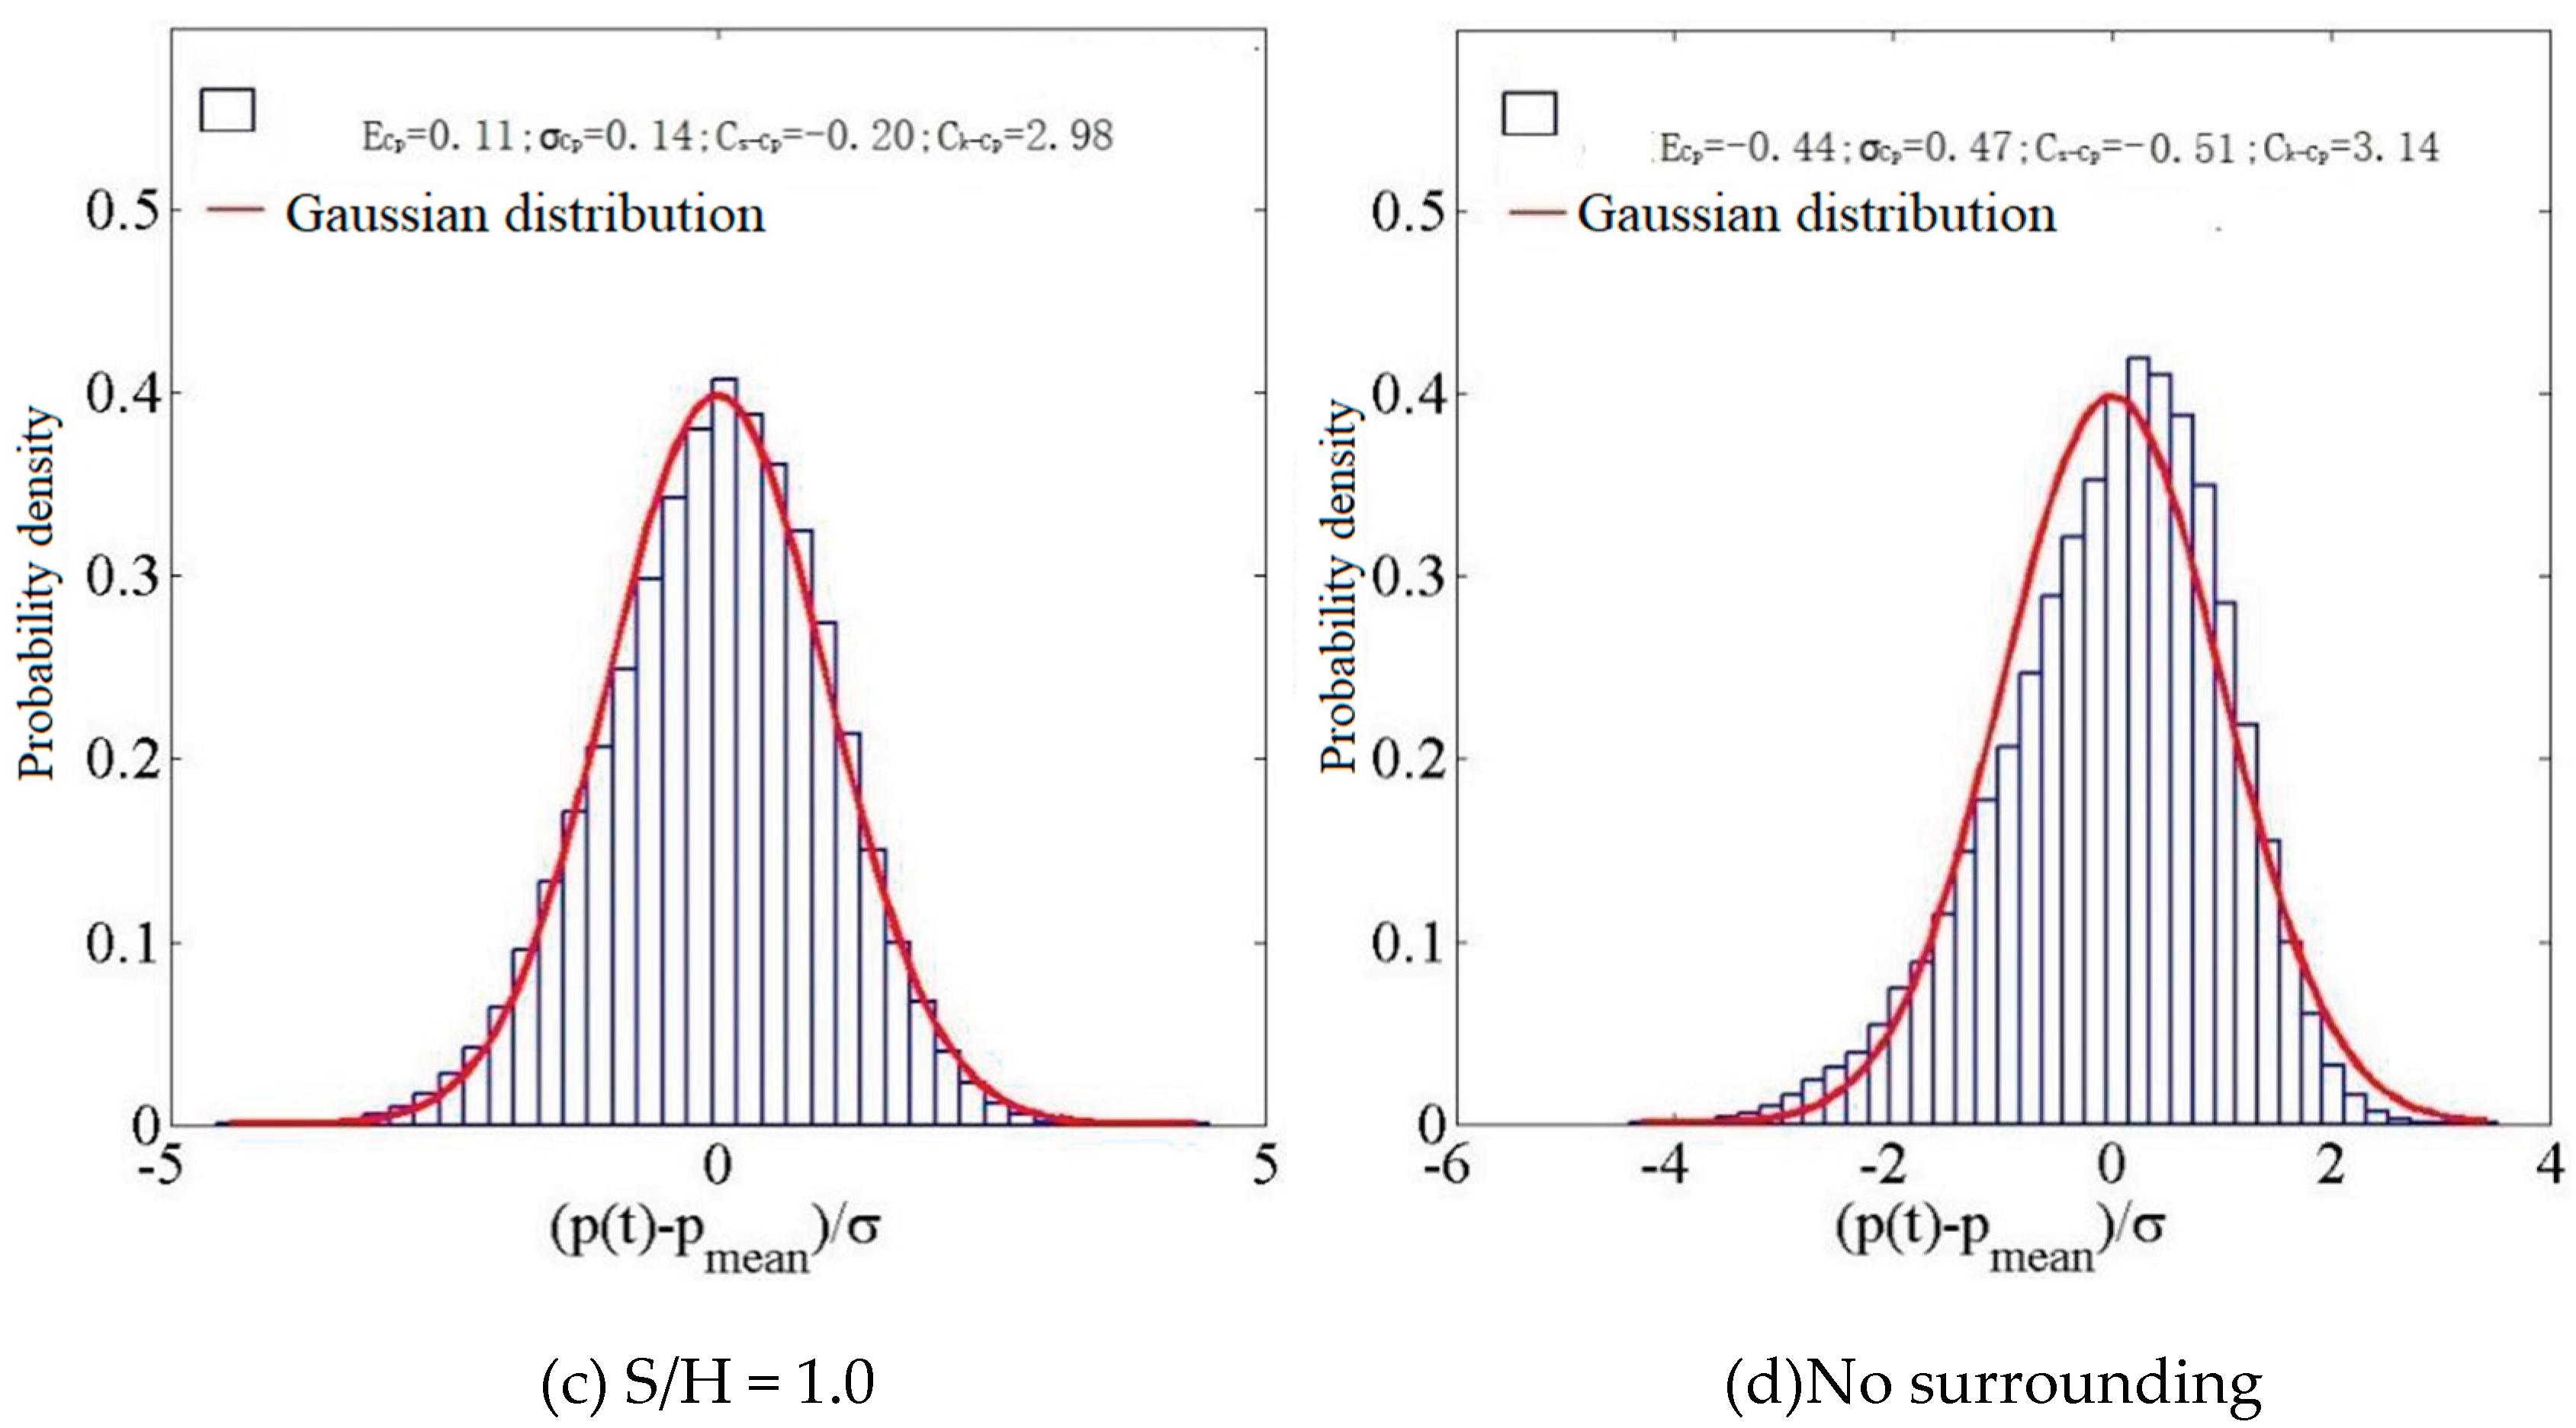
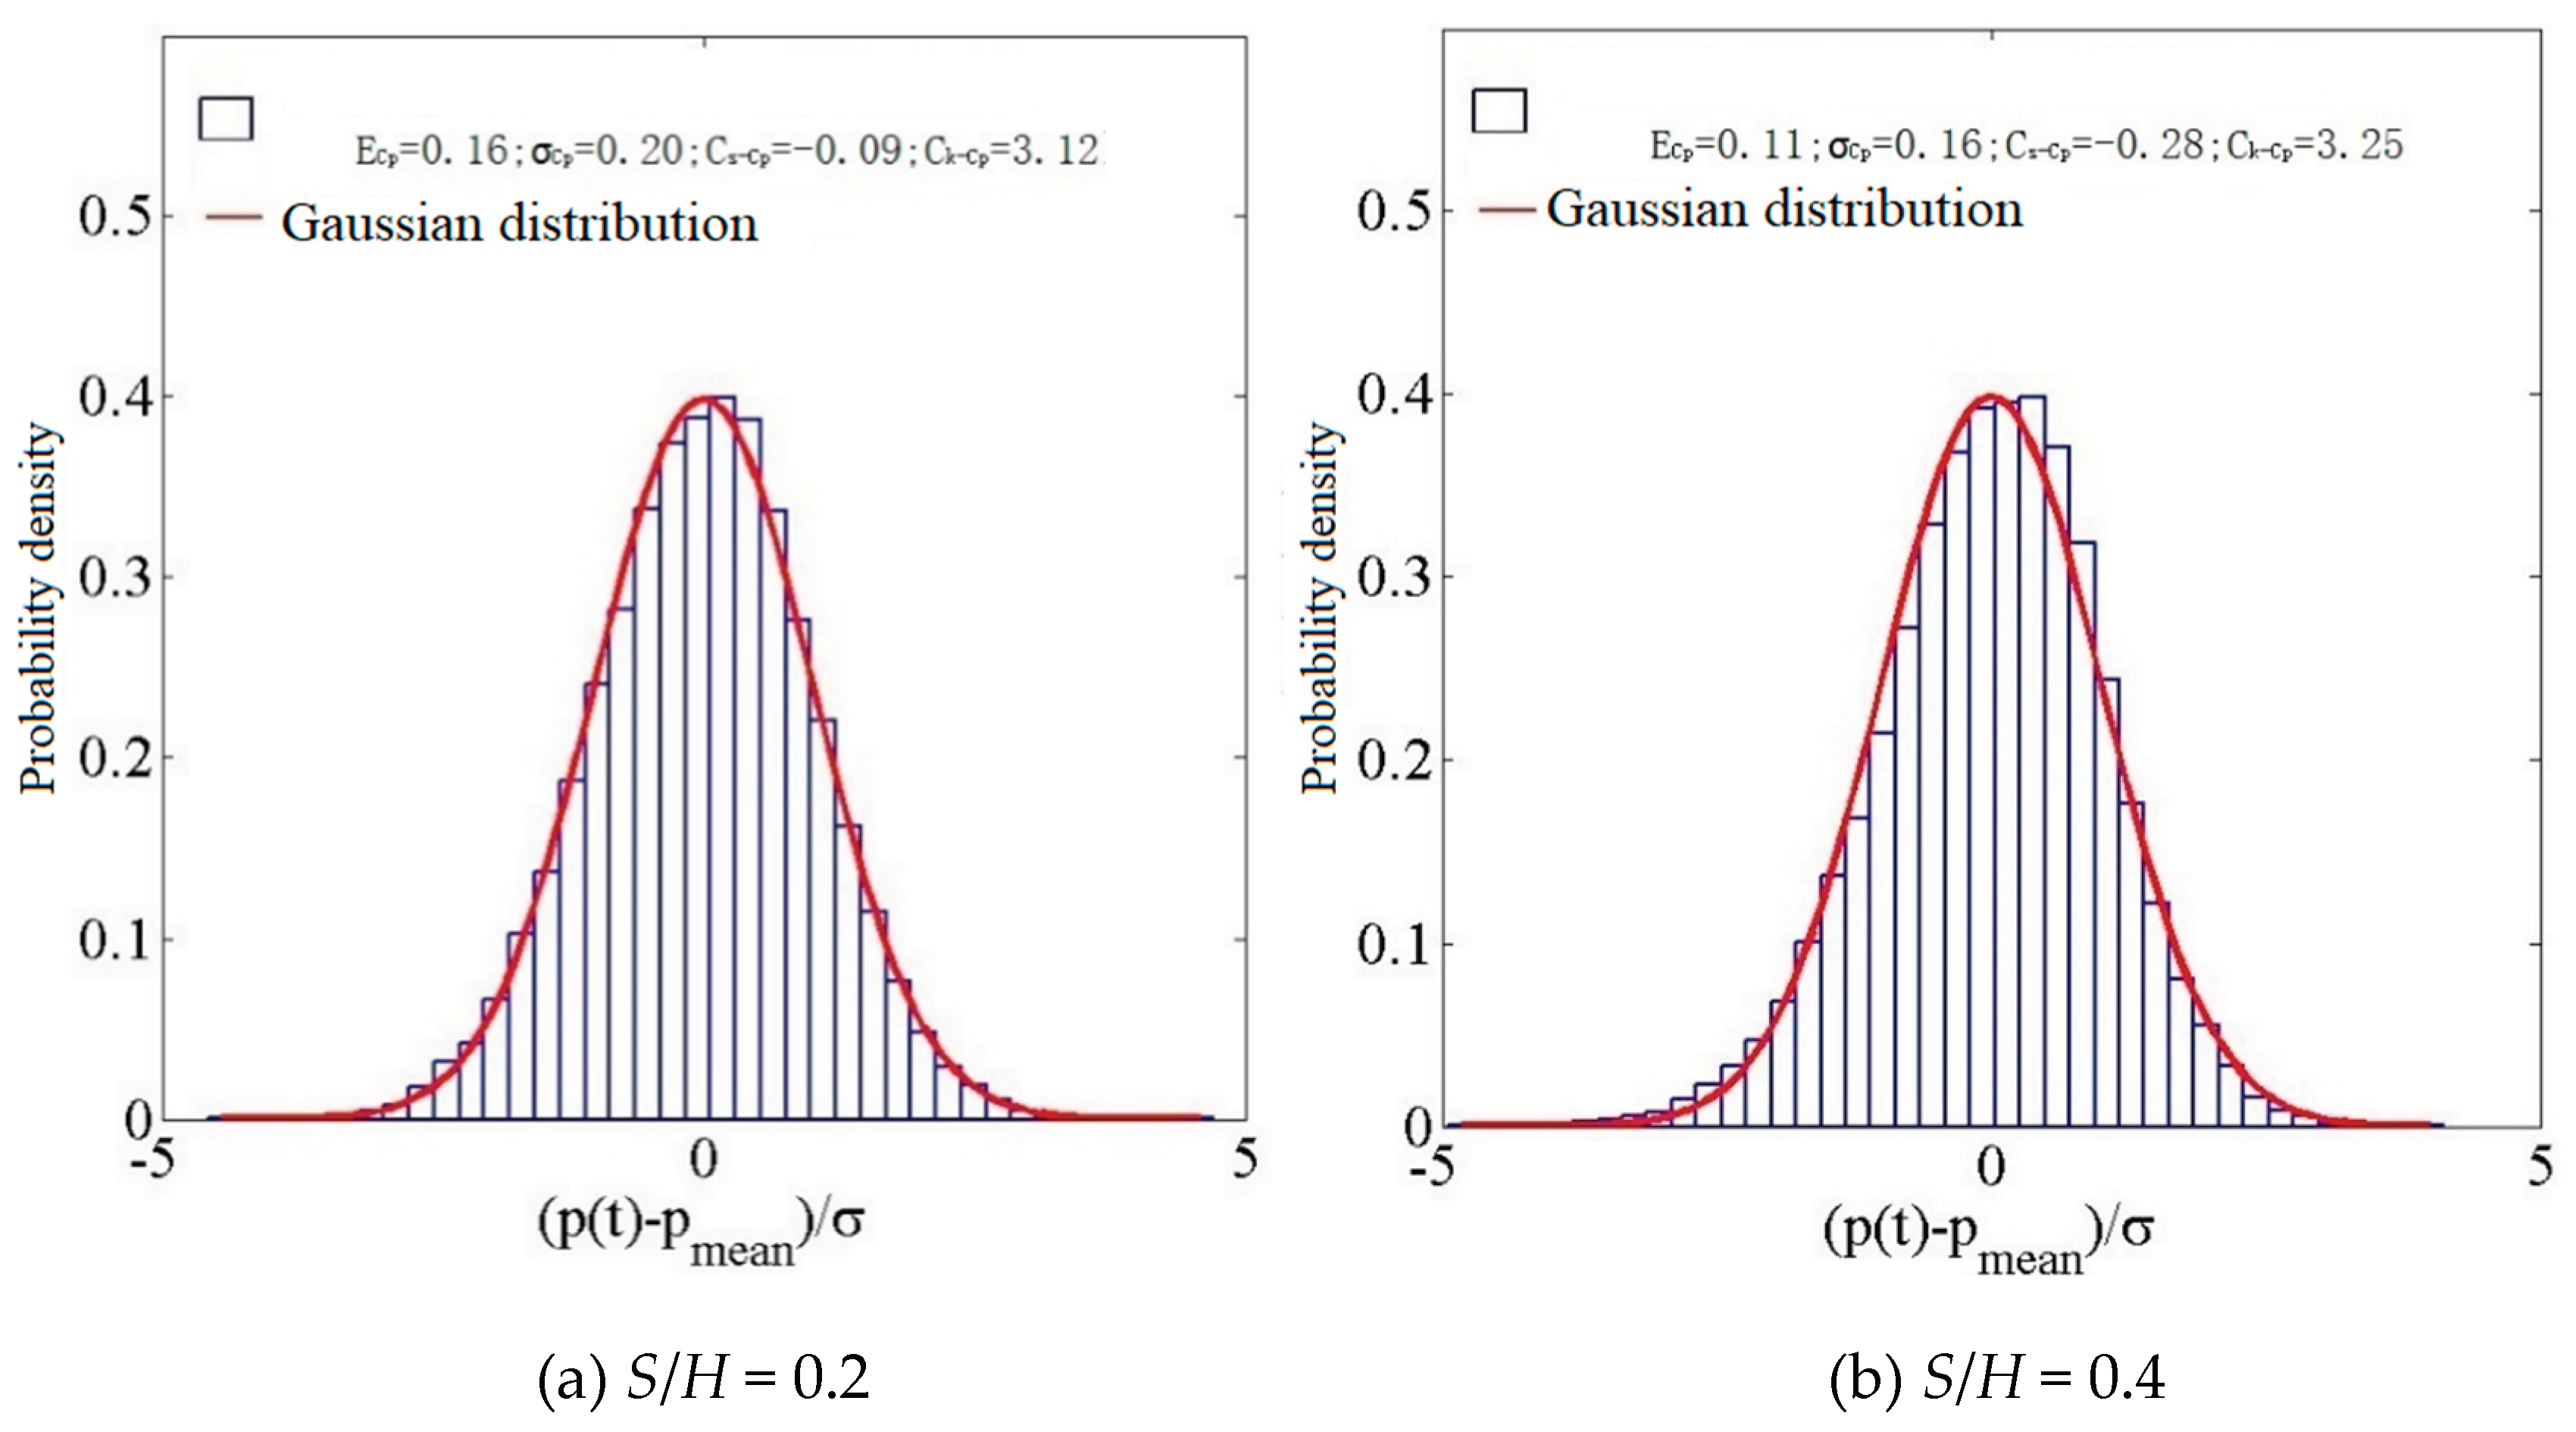
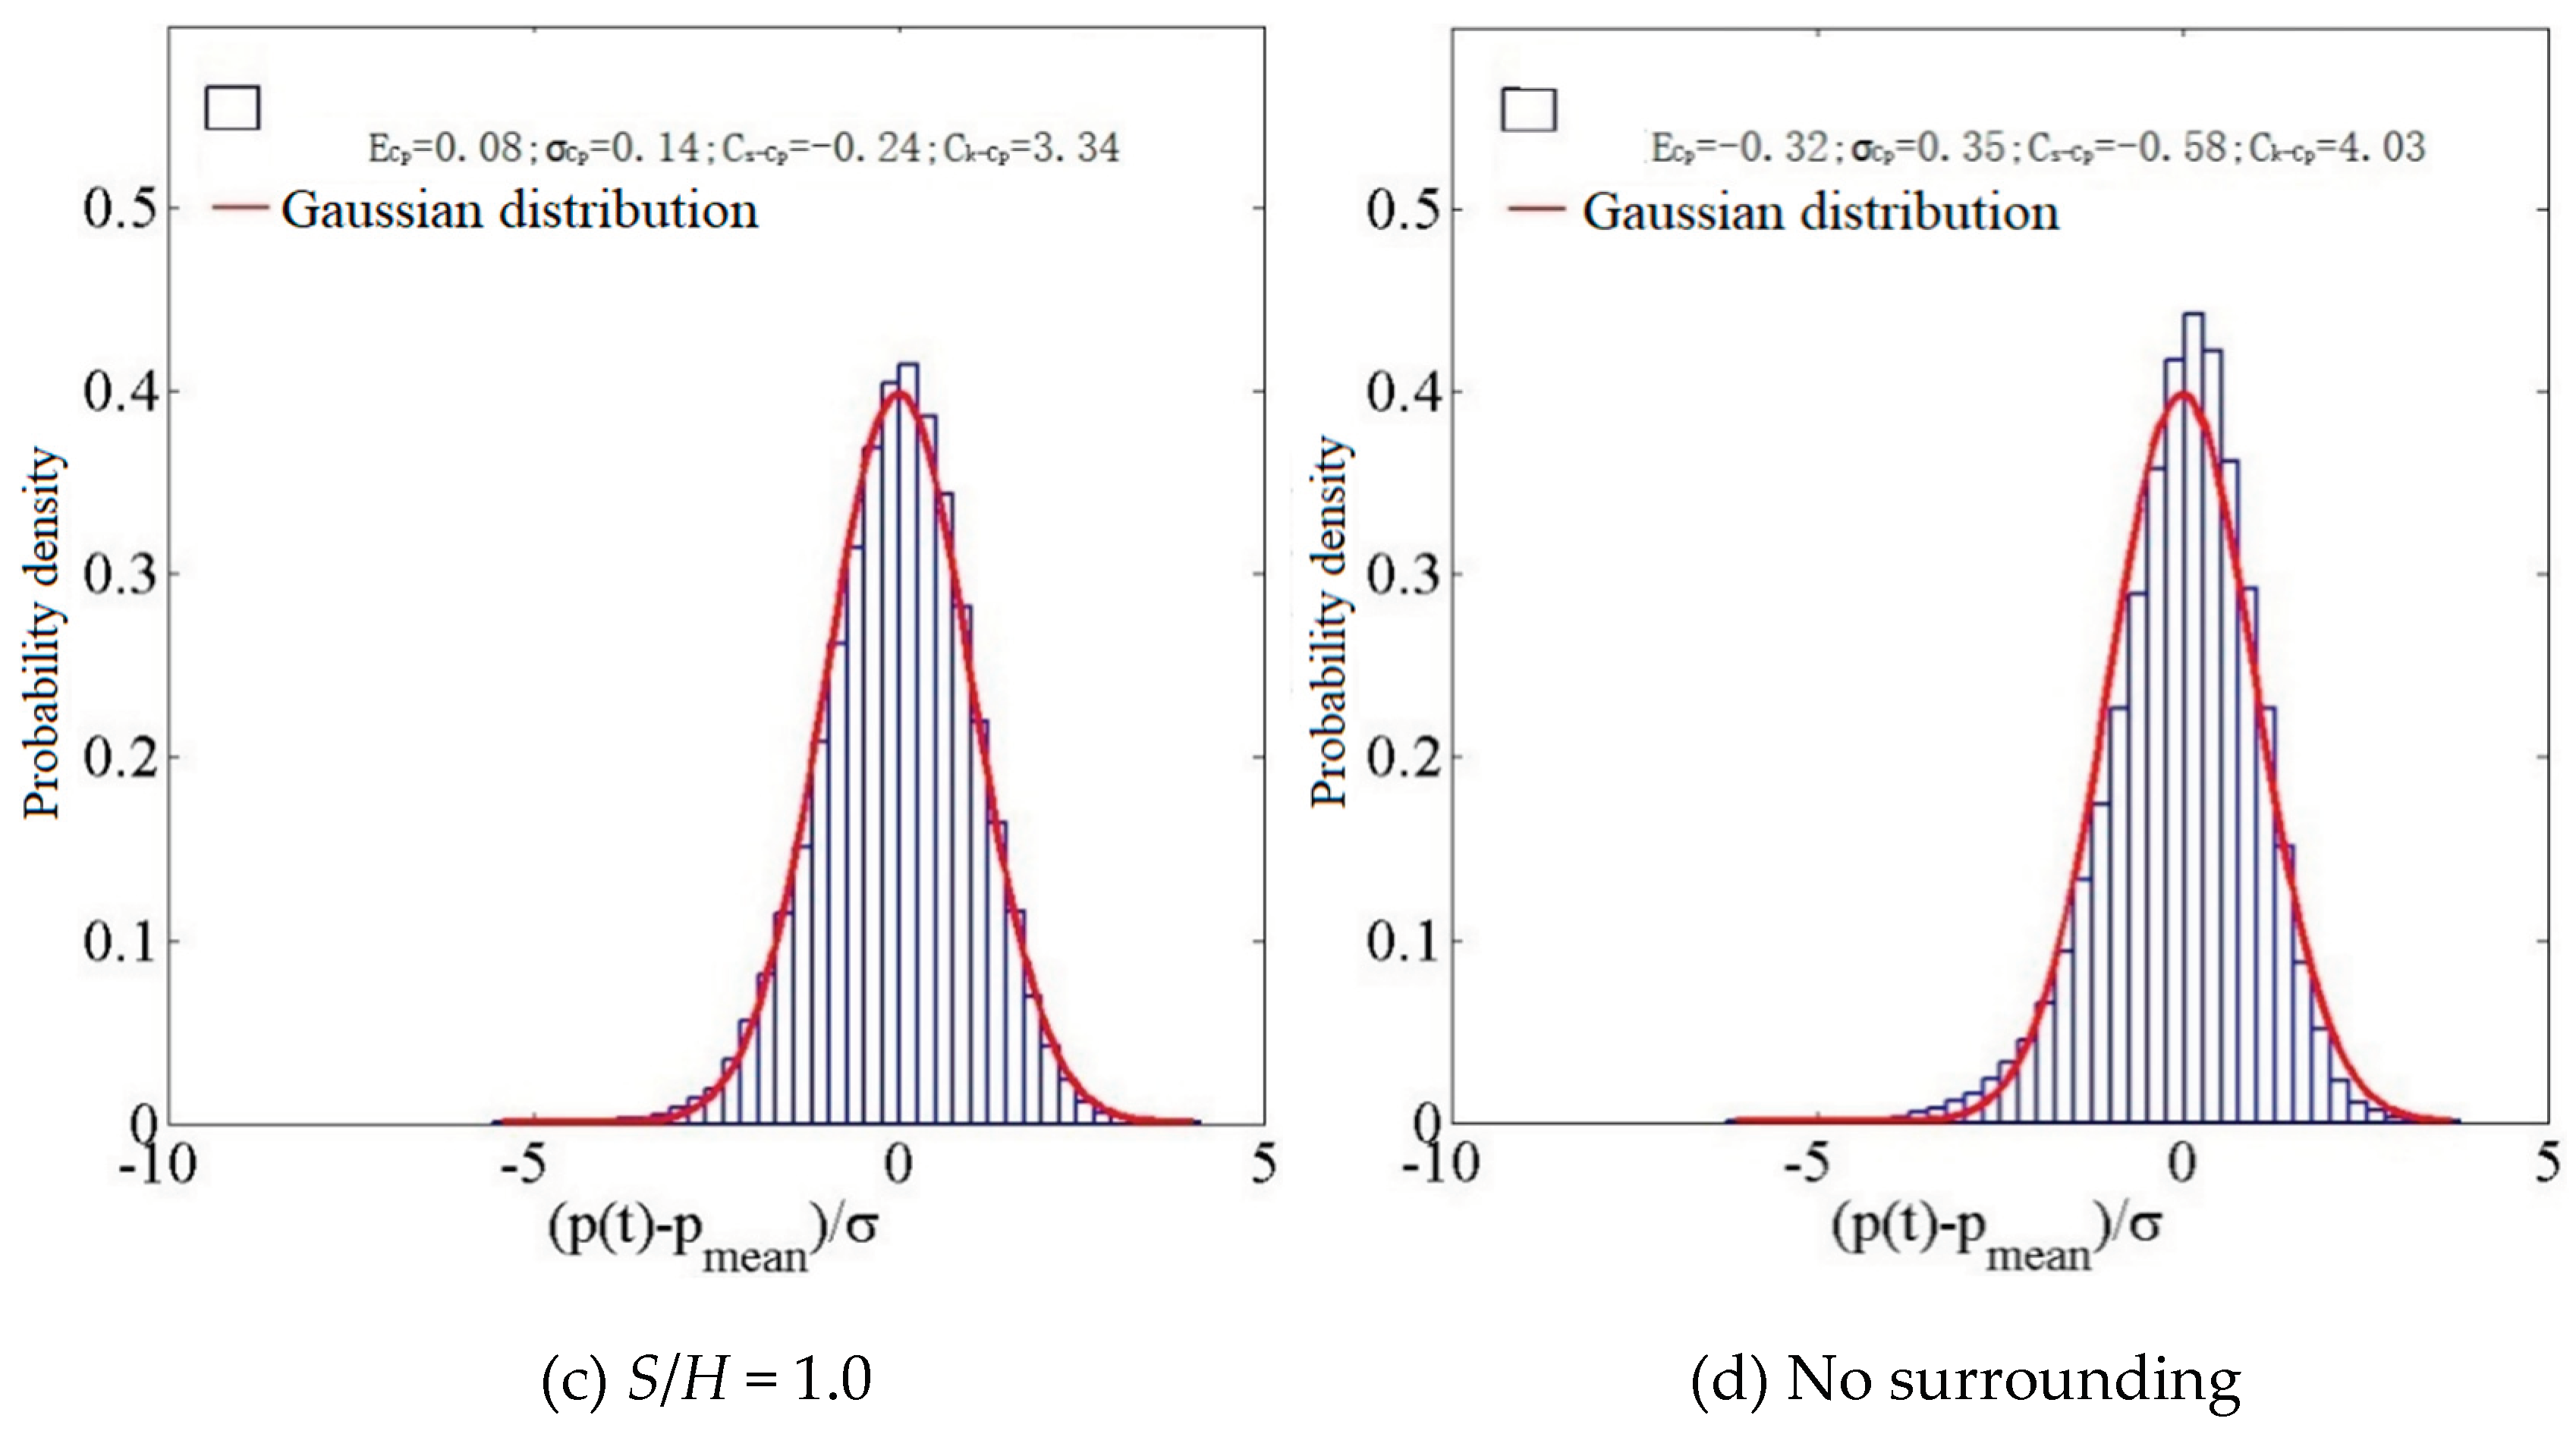
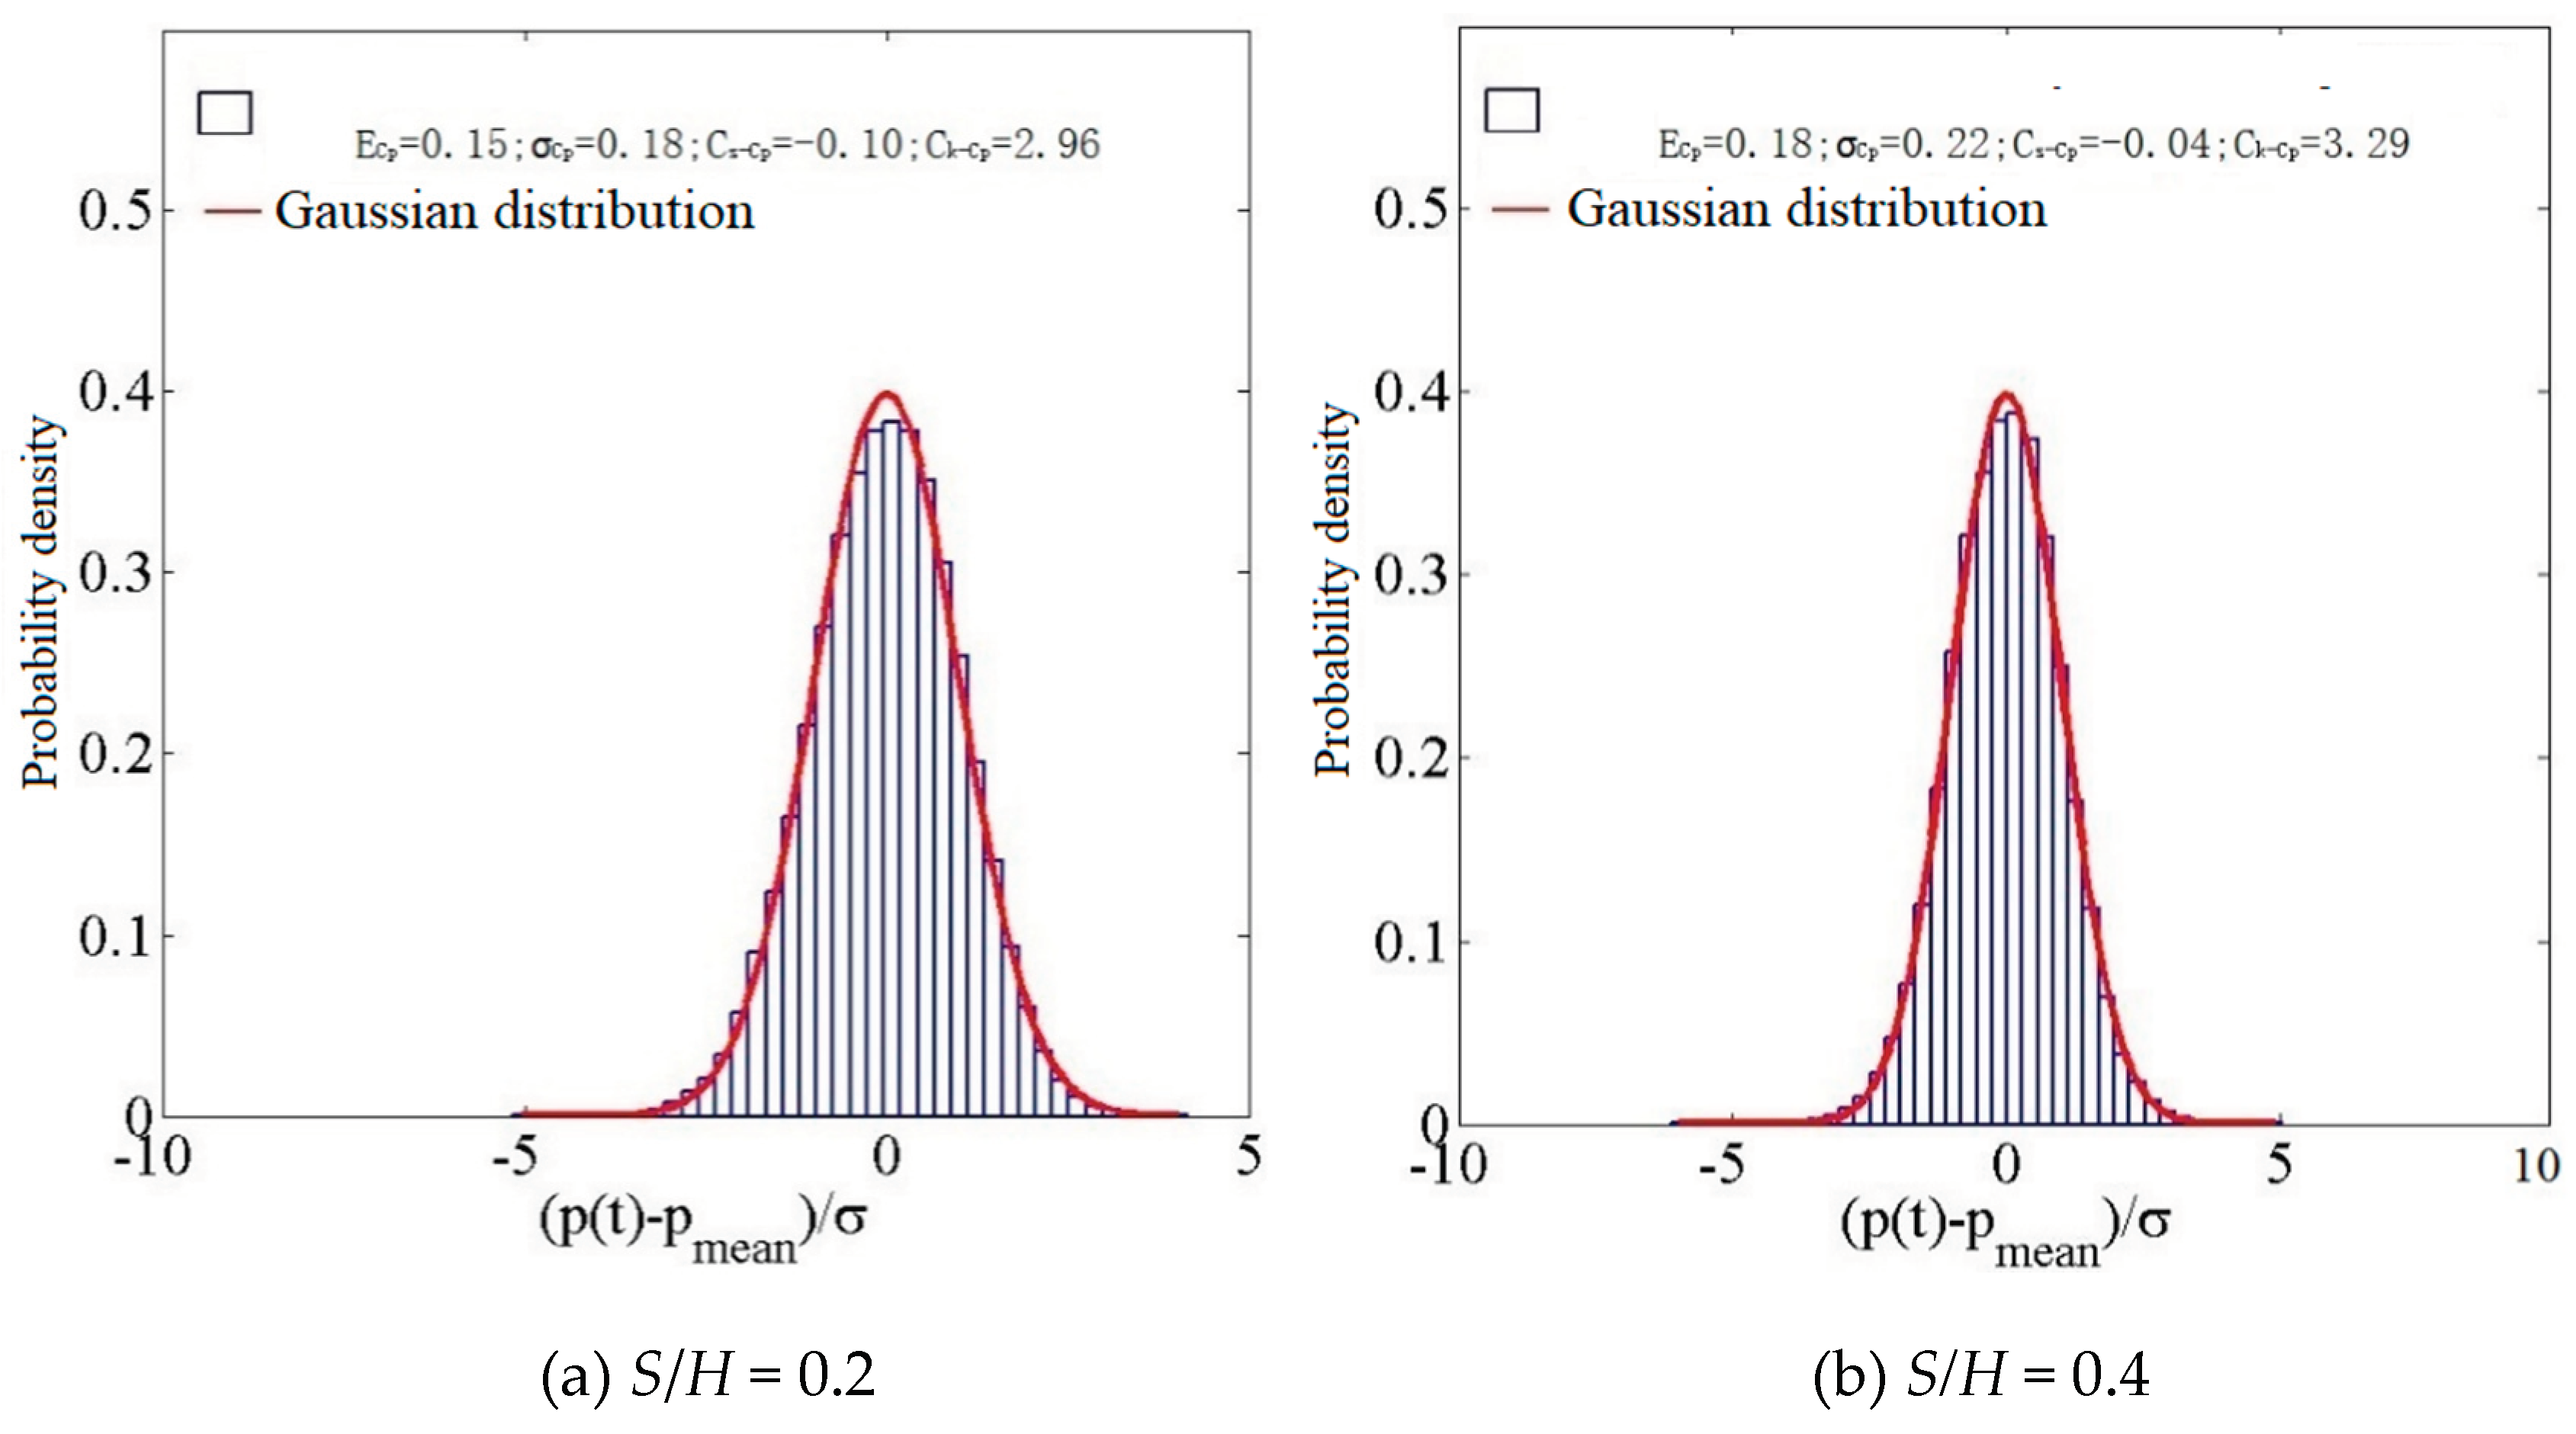
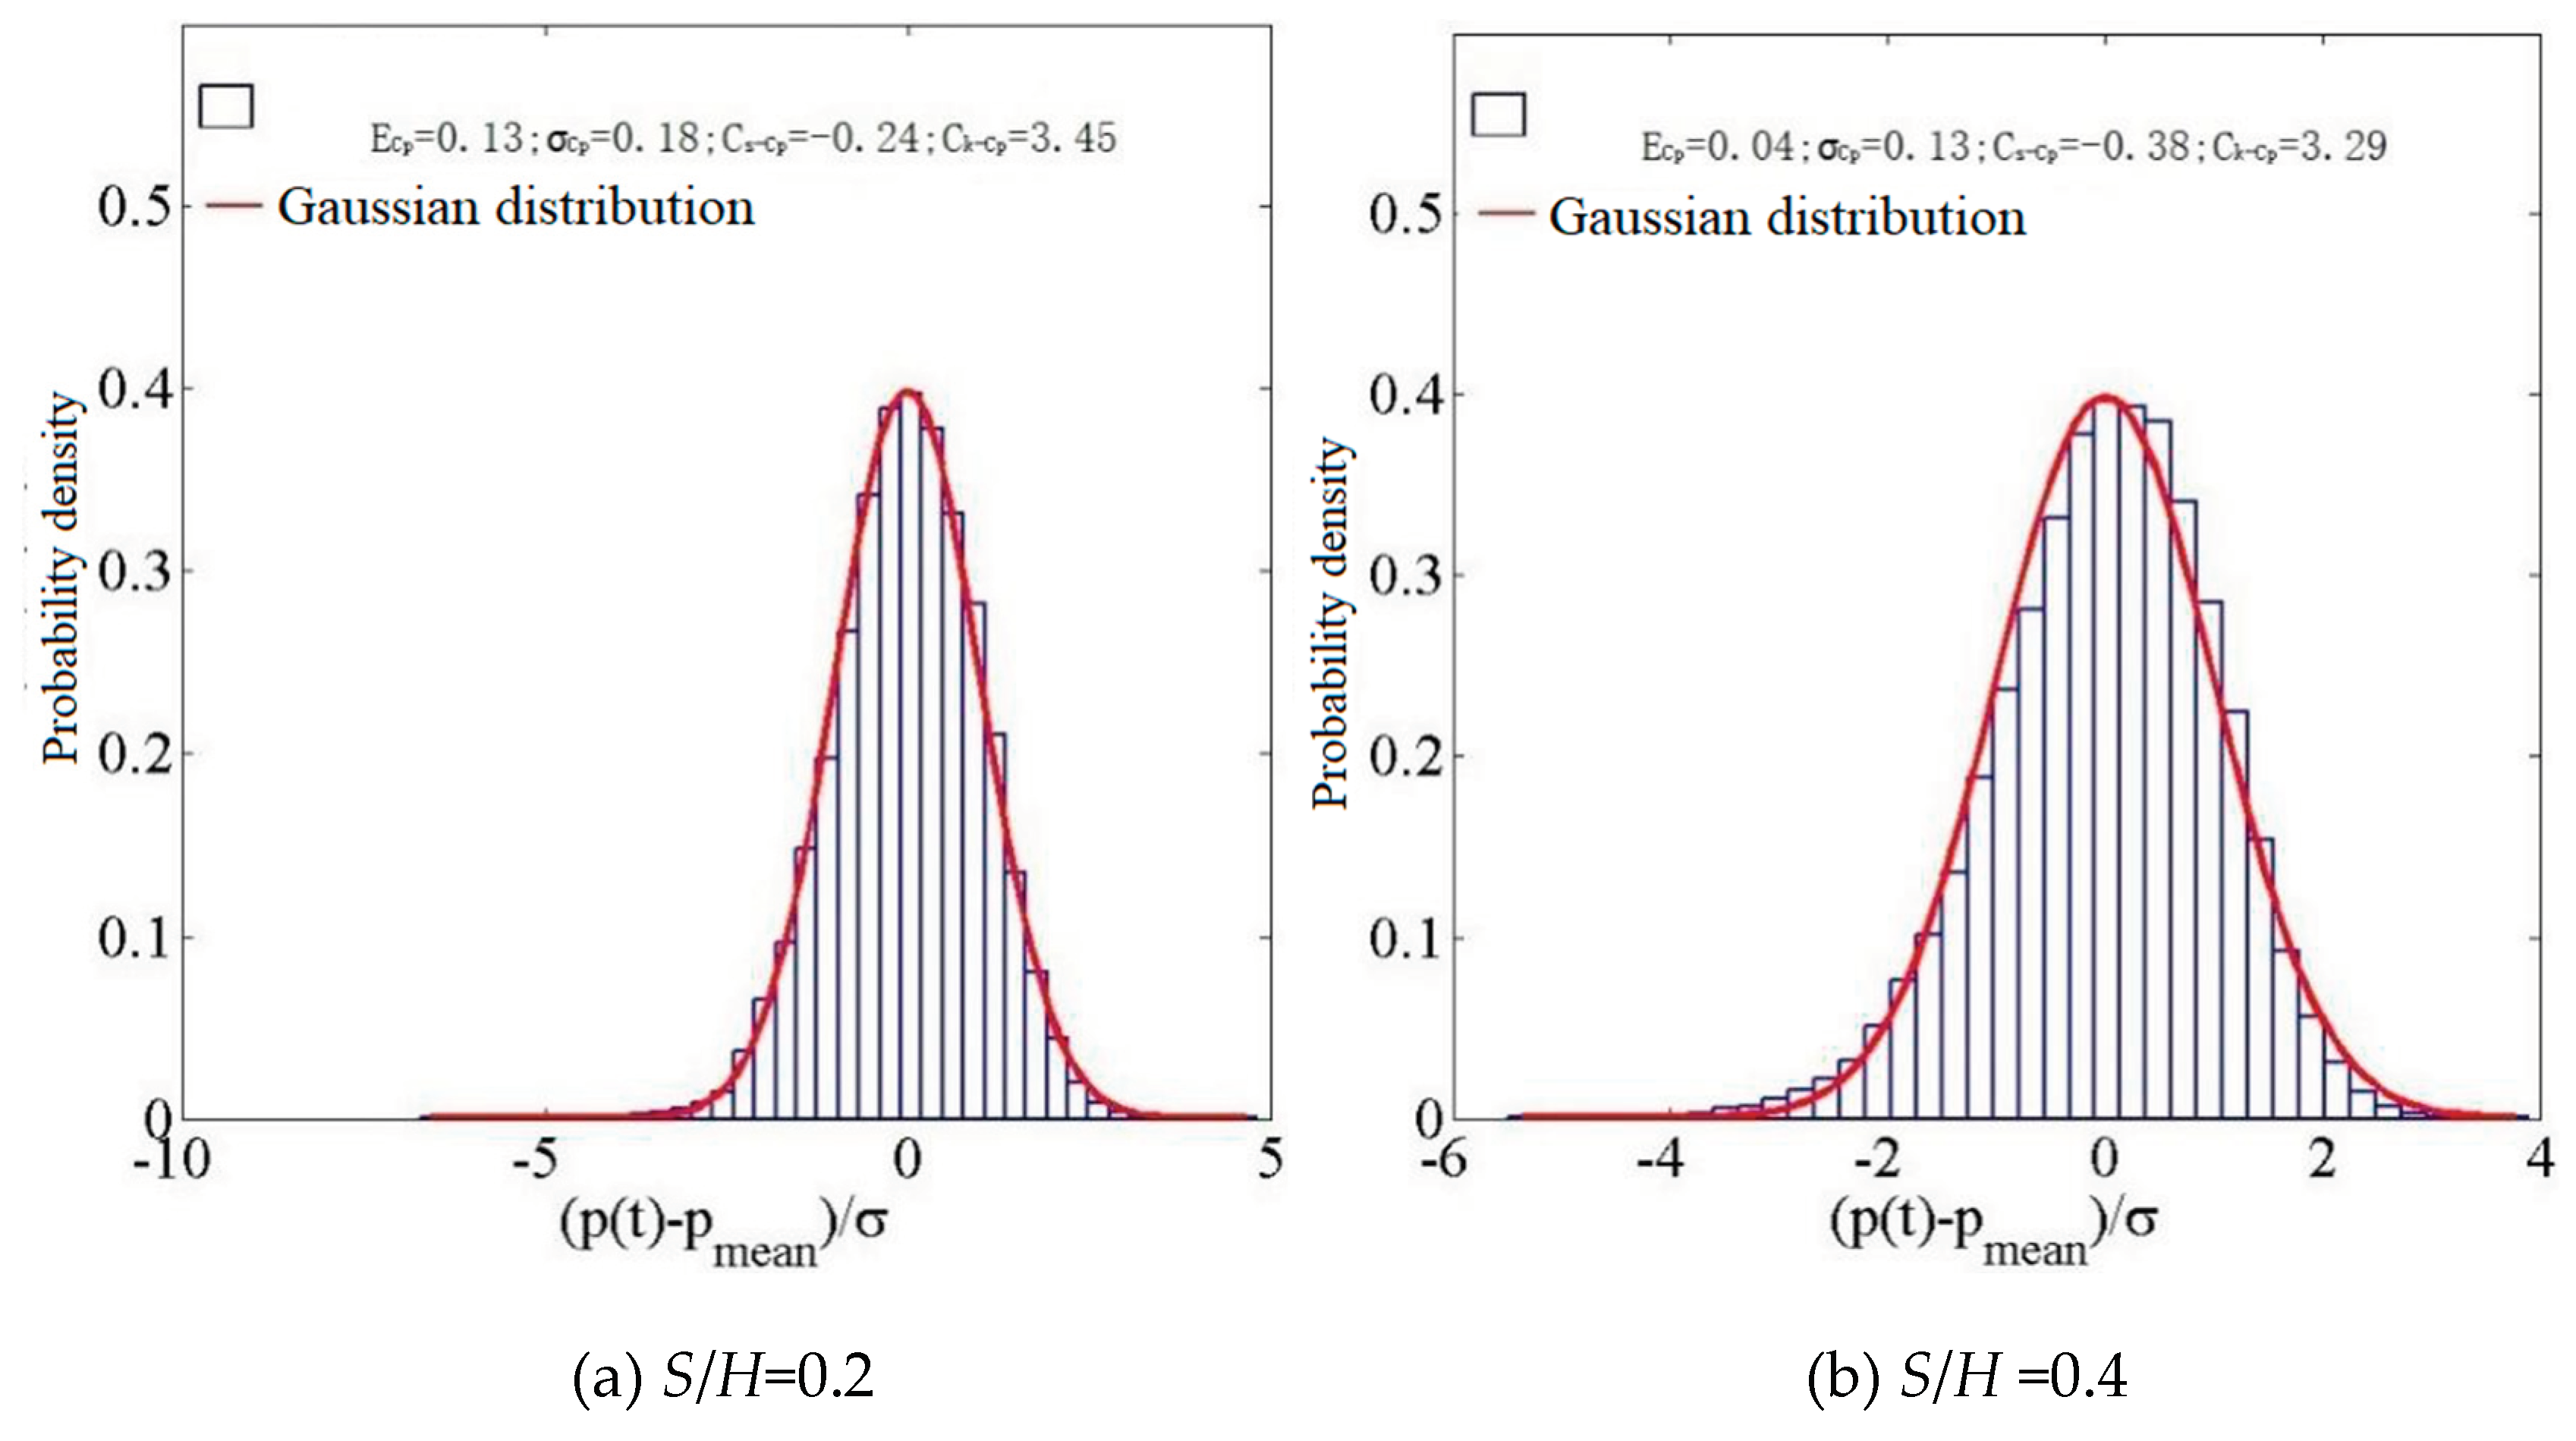
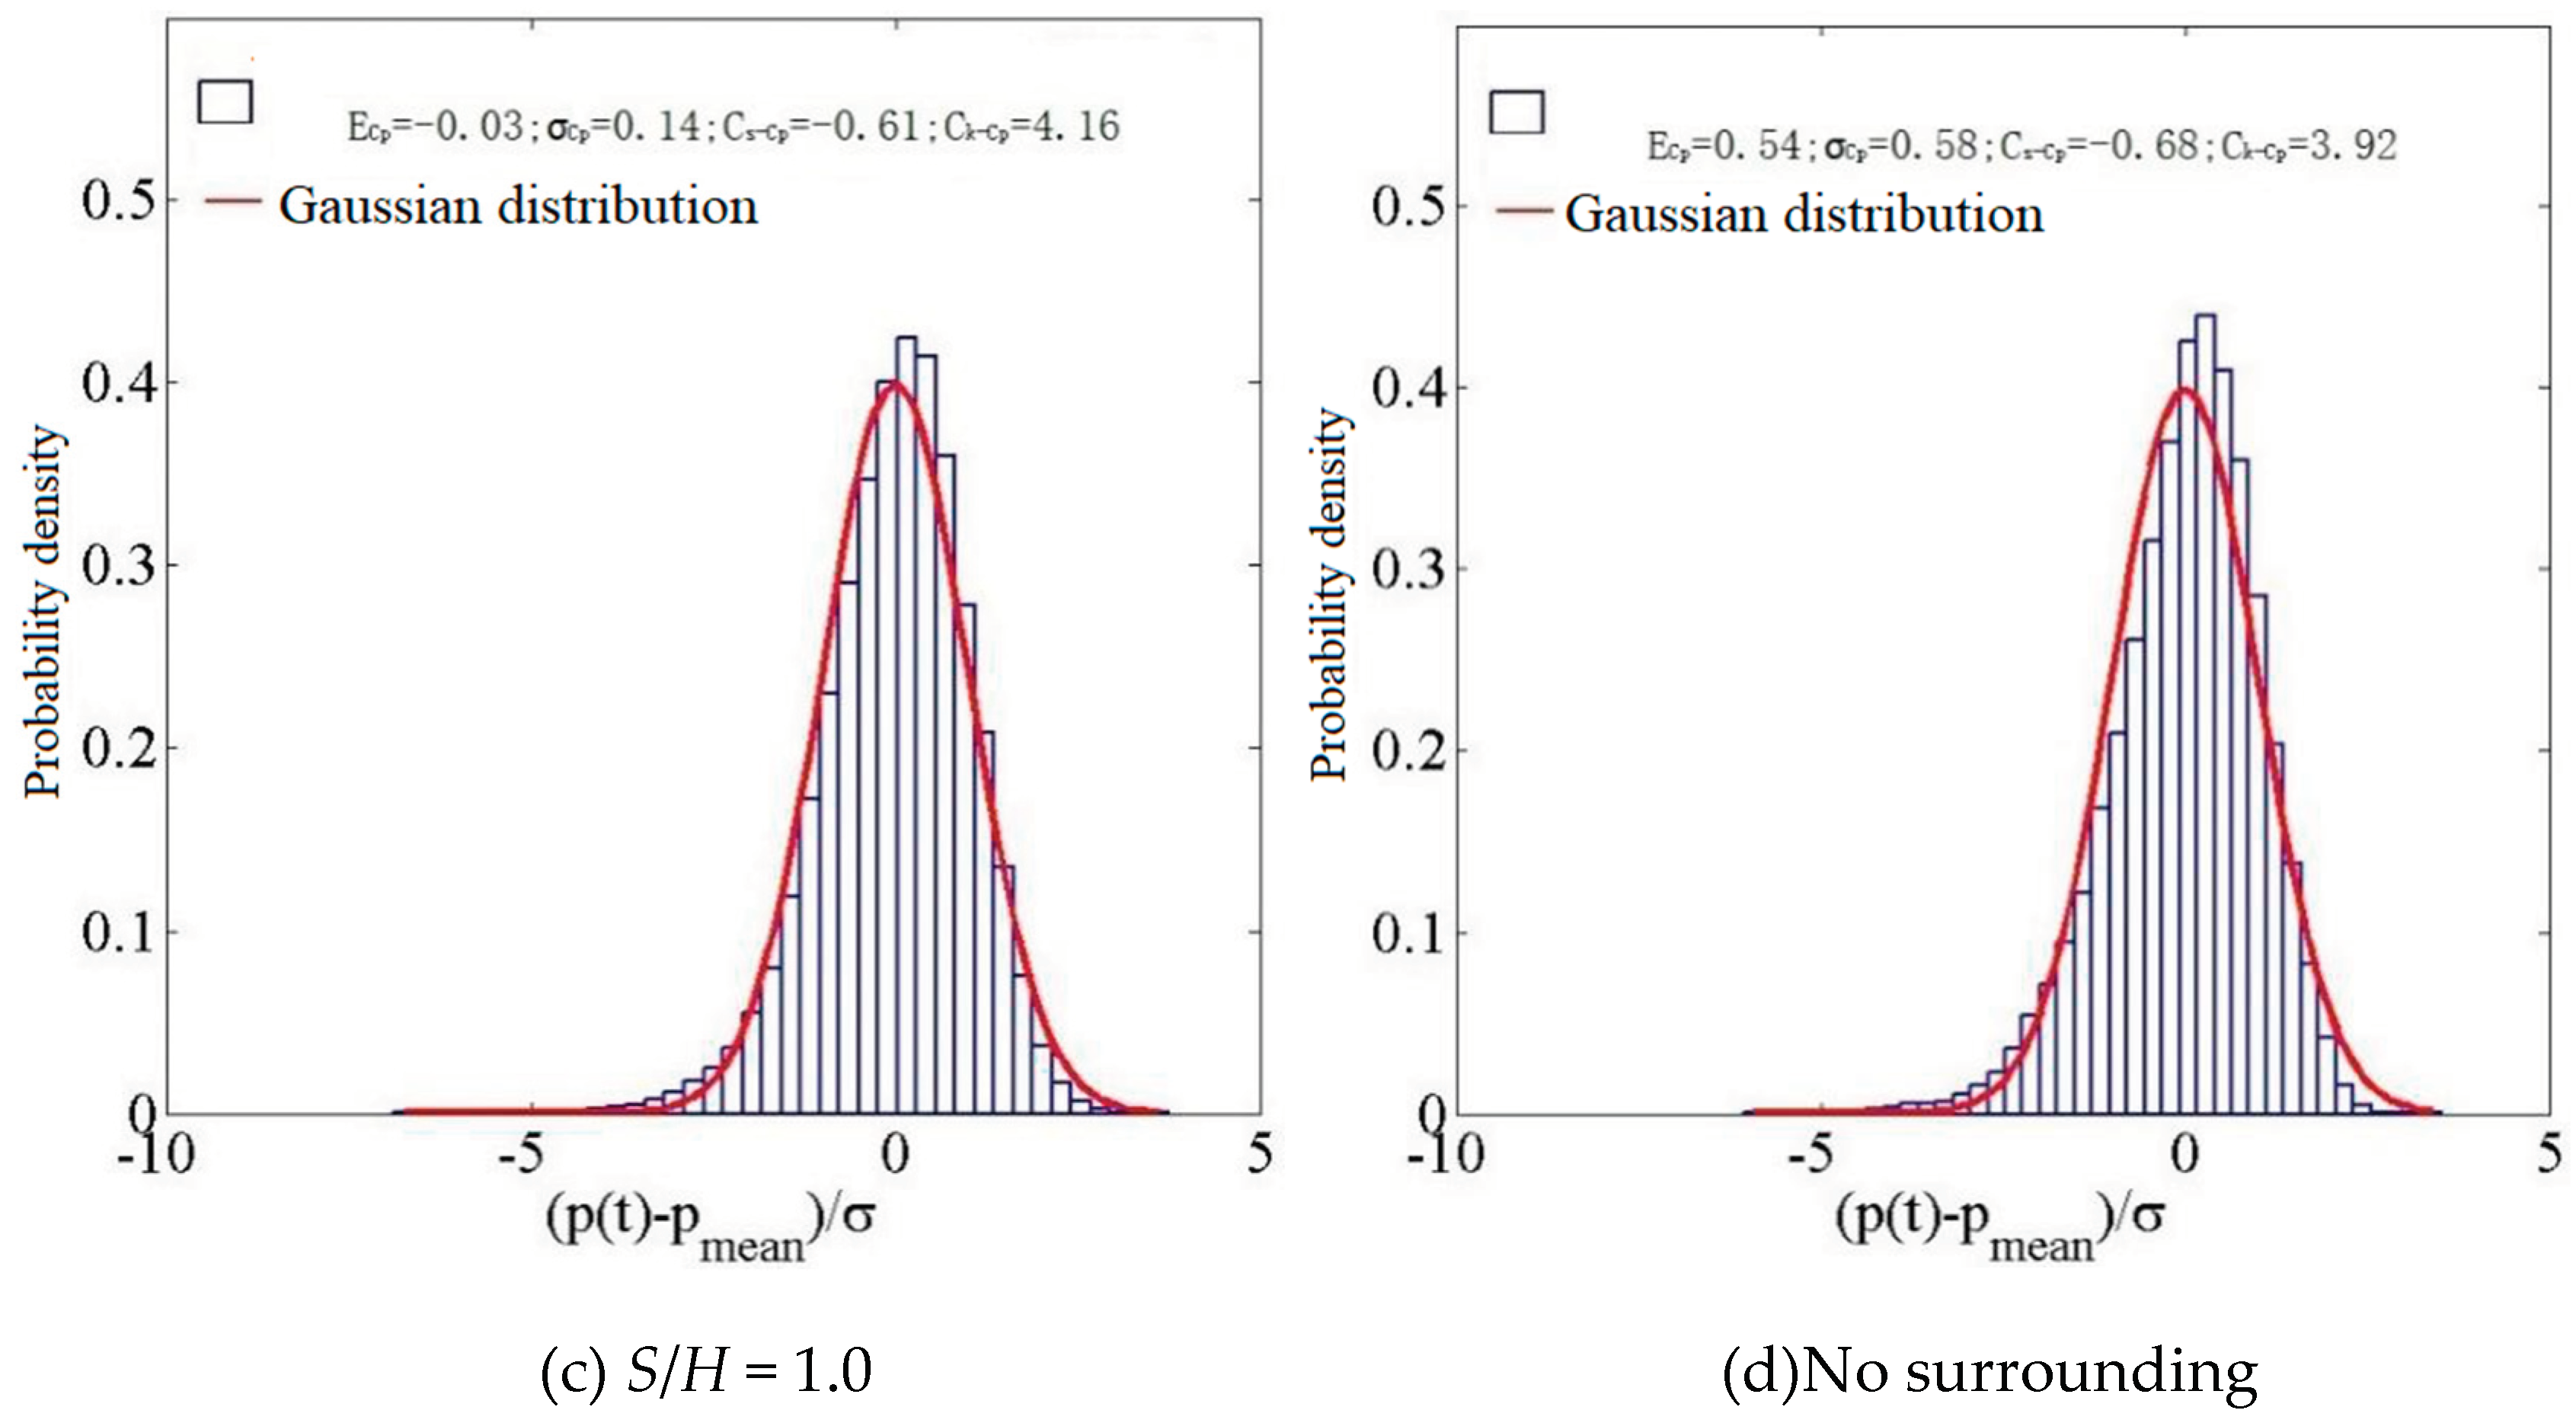
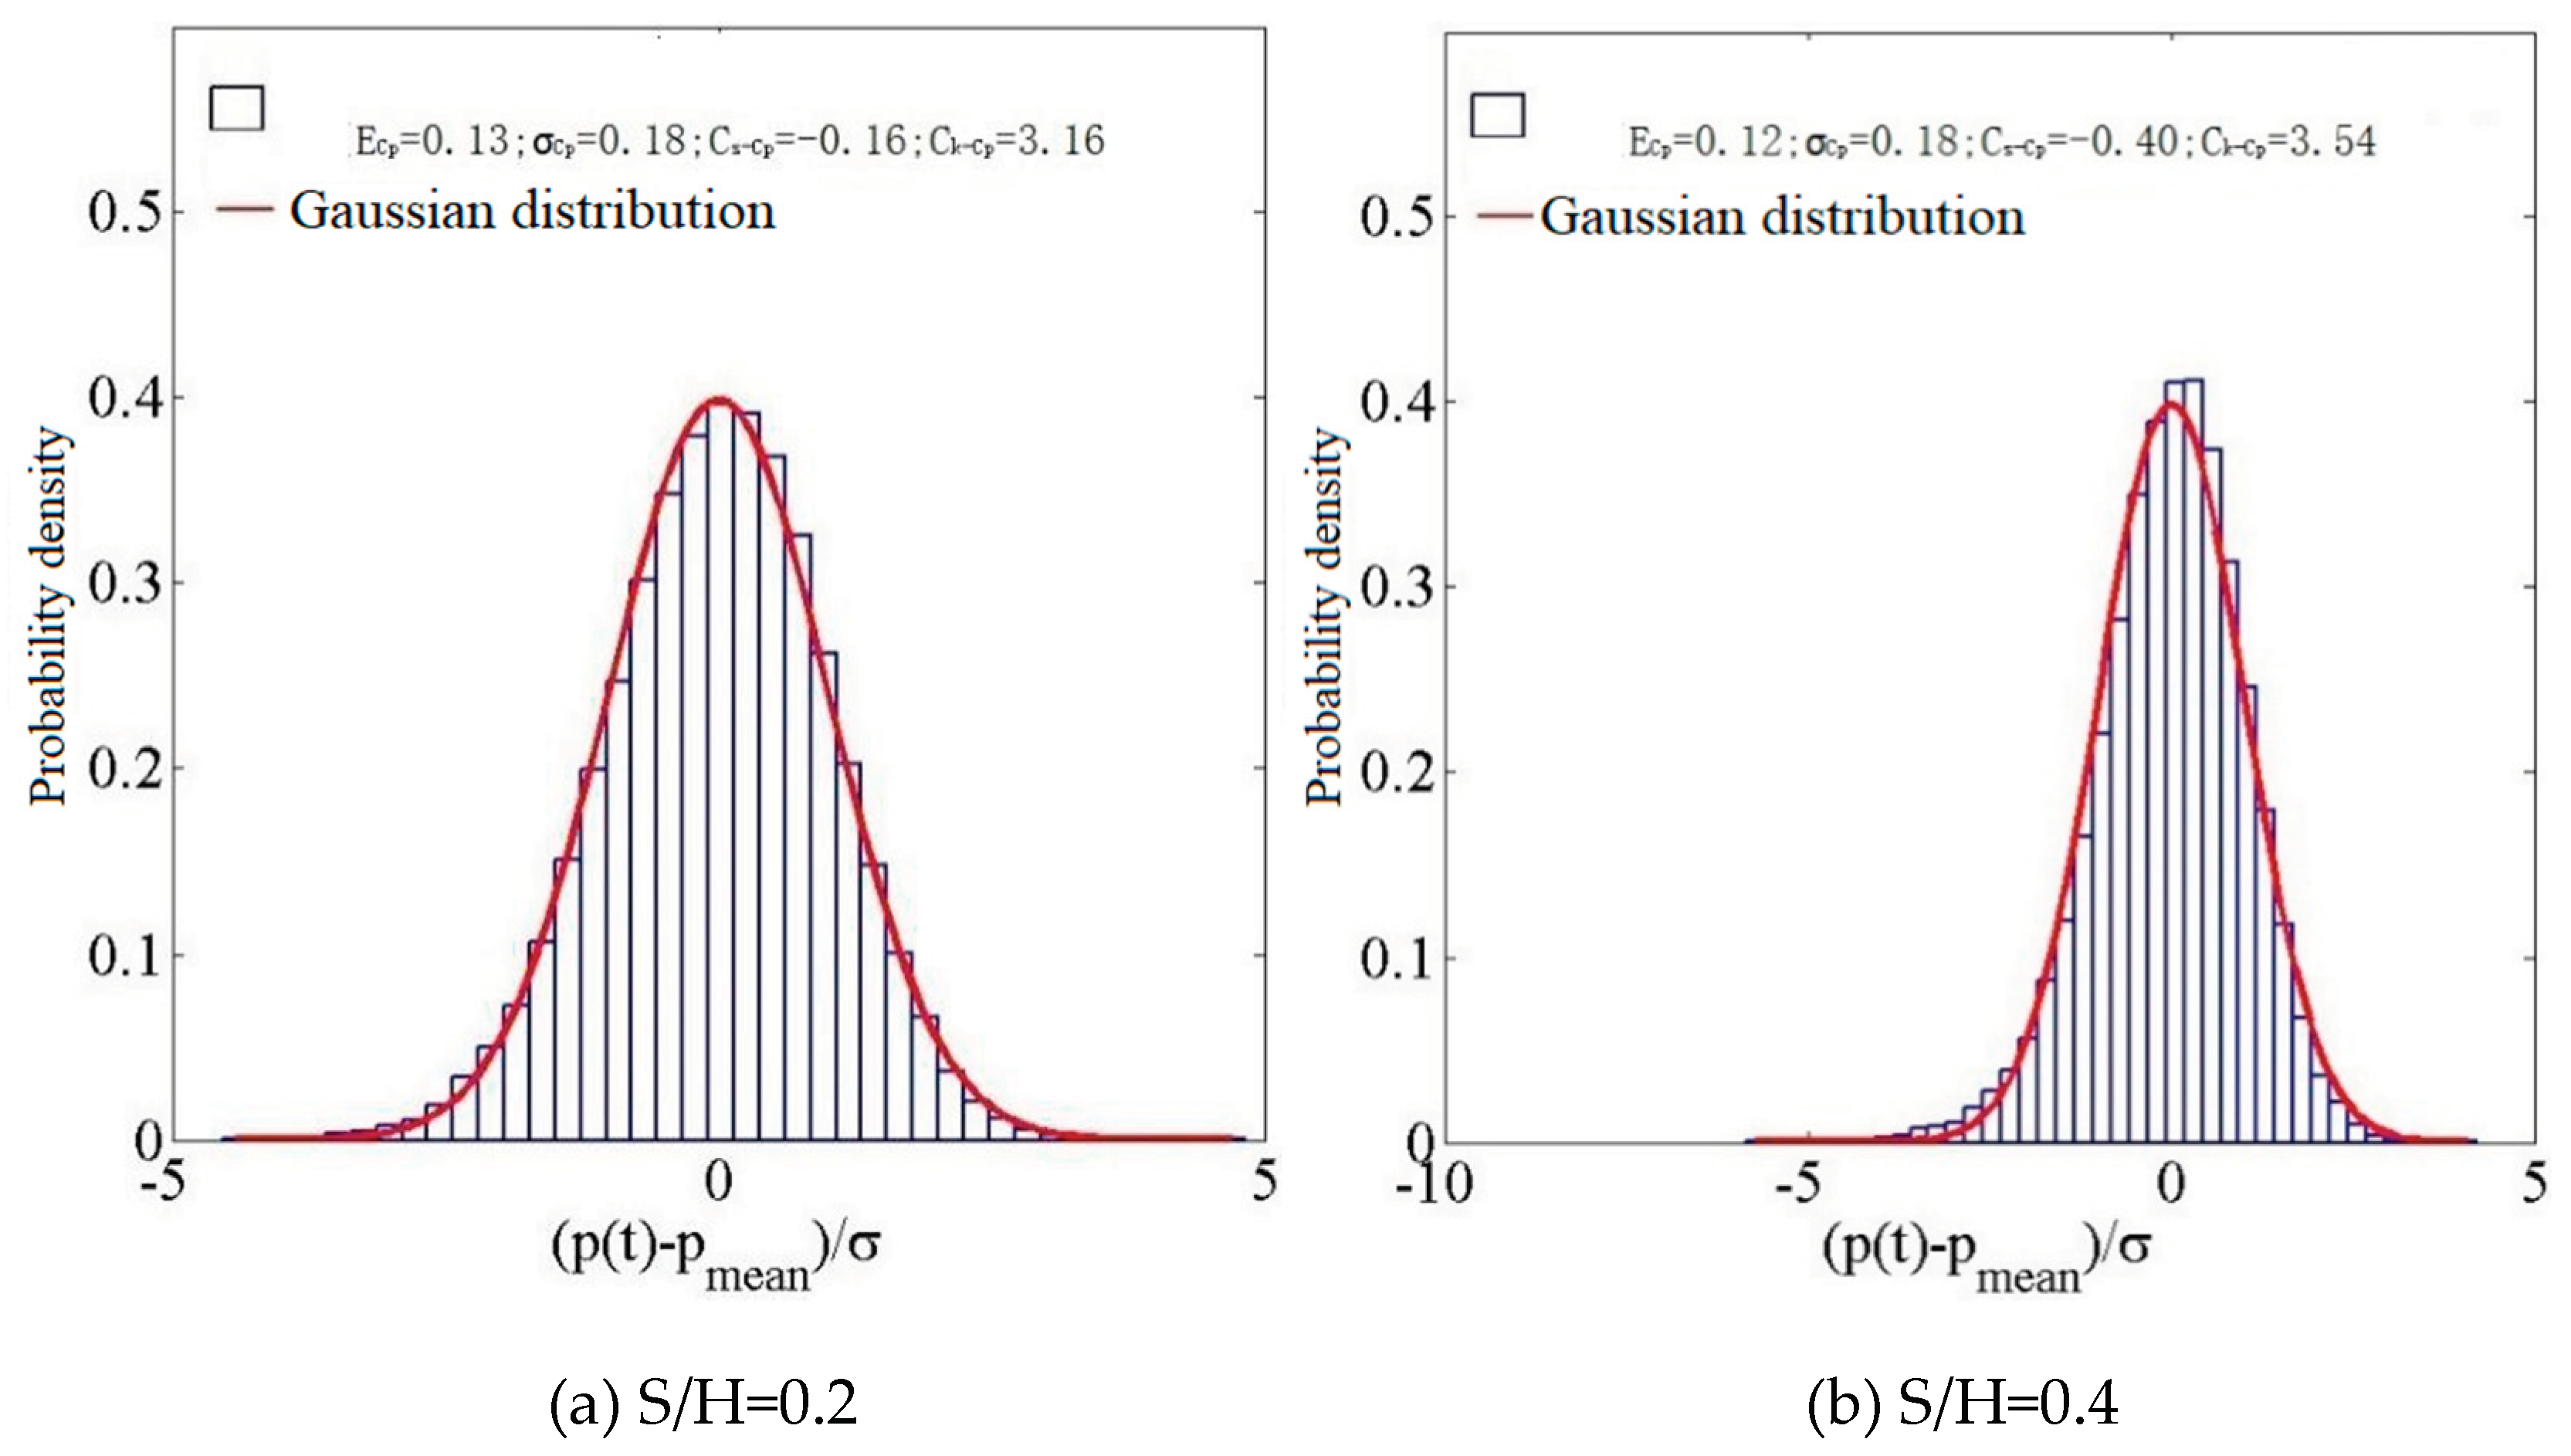
The probability density histograms of representative measurement points are compared, as shown in
Figure 17:
Figure 17.
A histogram depicting the probability density distribution at D5.
Figure 17.
A histogram depicting the probability density distribution at D5.
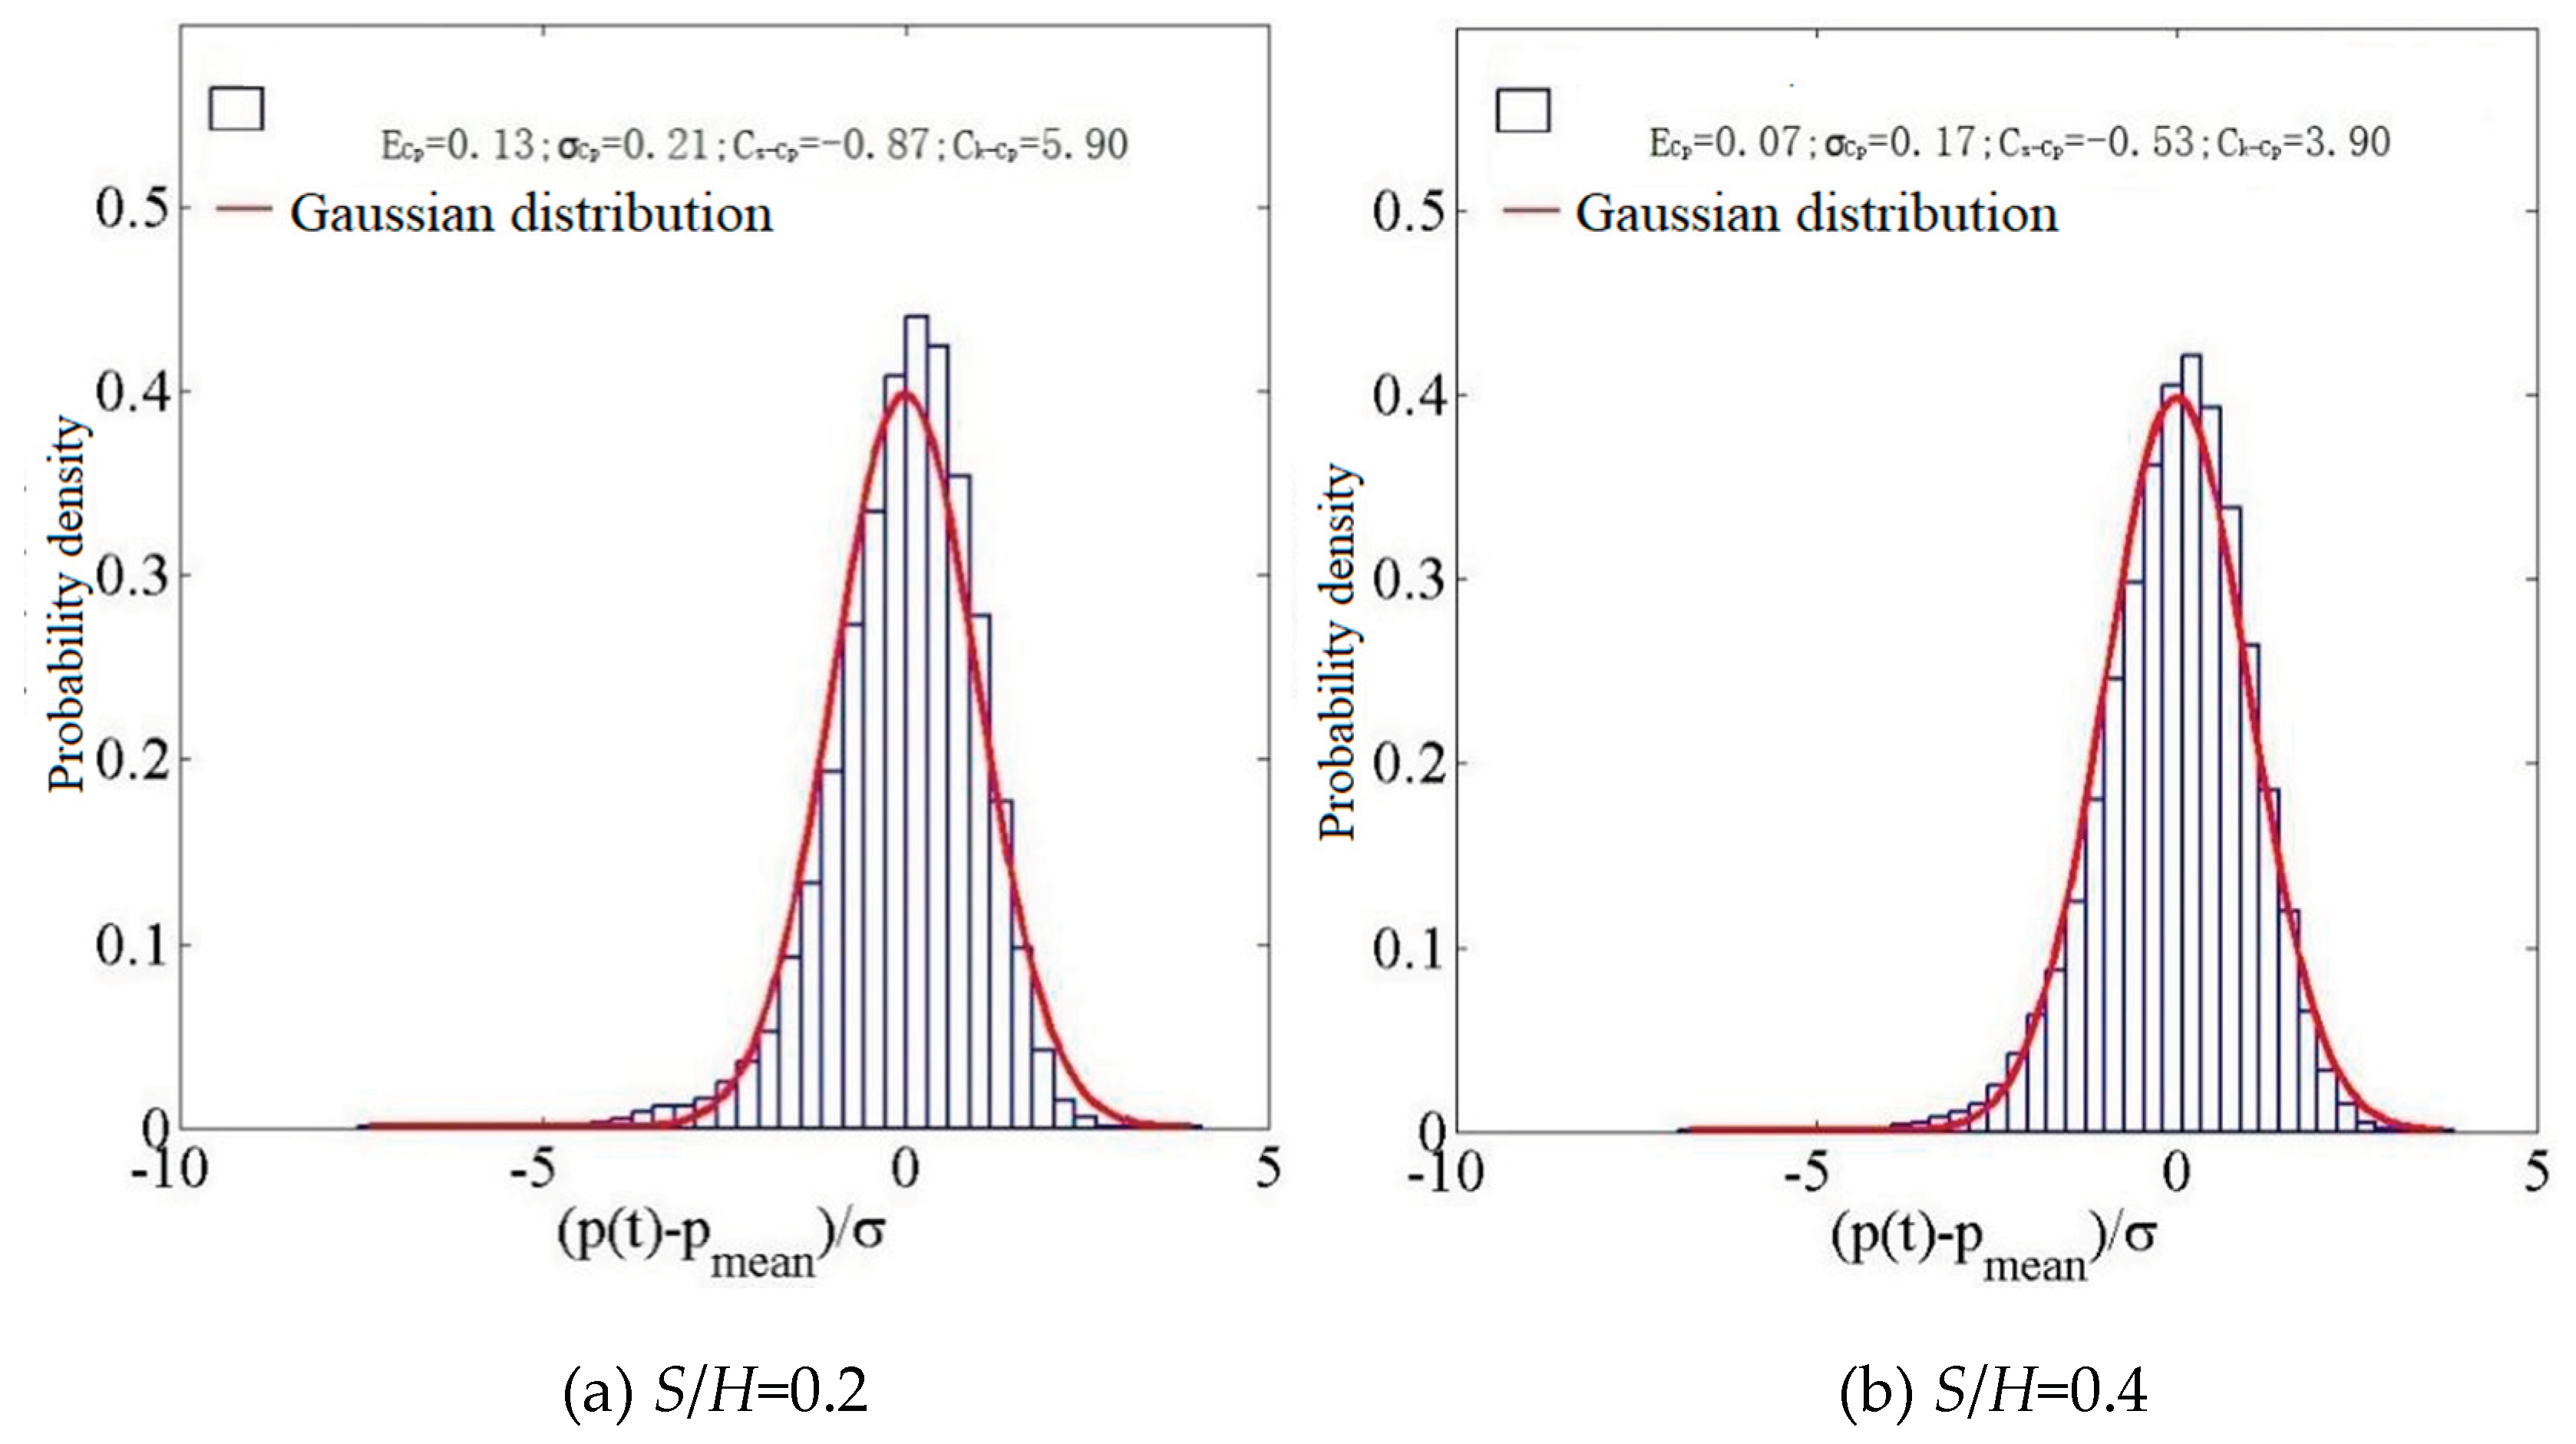
When S/H=0.2, the wind pressure coefficient at the middle of the windward side at 0° exhibits a mean value of 0.13, a root mean square value of 0.18, a skewness of -0.11, and a kurtosis of 3.02. Additionally, the wind pressure probability distribution demonstrates Gaussian characteristics, as evident from above
Figure 17. When the hillside and the building are further apart, with a relative position of S/H=0.4, the wind coefficients remain constant. When S/H= 1.0, the distribution of wind pressure demonstrates Gaussian characteristics. Without external factors, the parameters exhibit growth, while the wind pressure distribution follows a Gaussian pattern.
Figure 18.
A histogram depicting the probability density distribution at D12.
Figure 18.
A histogram depicting the probability density distribution at D12.
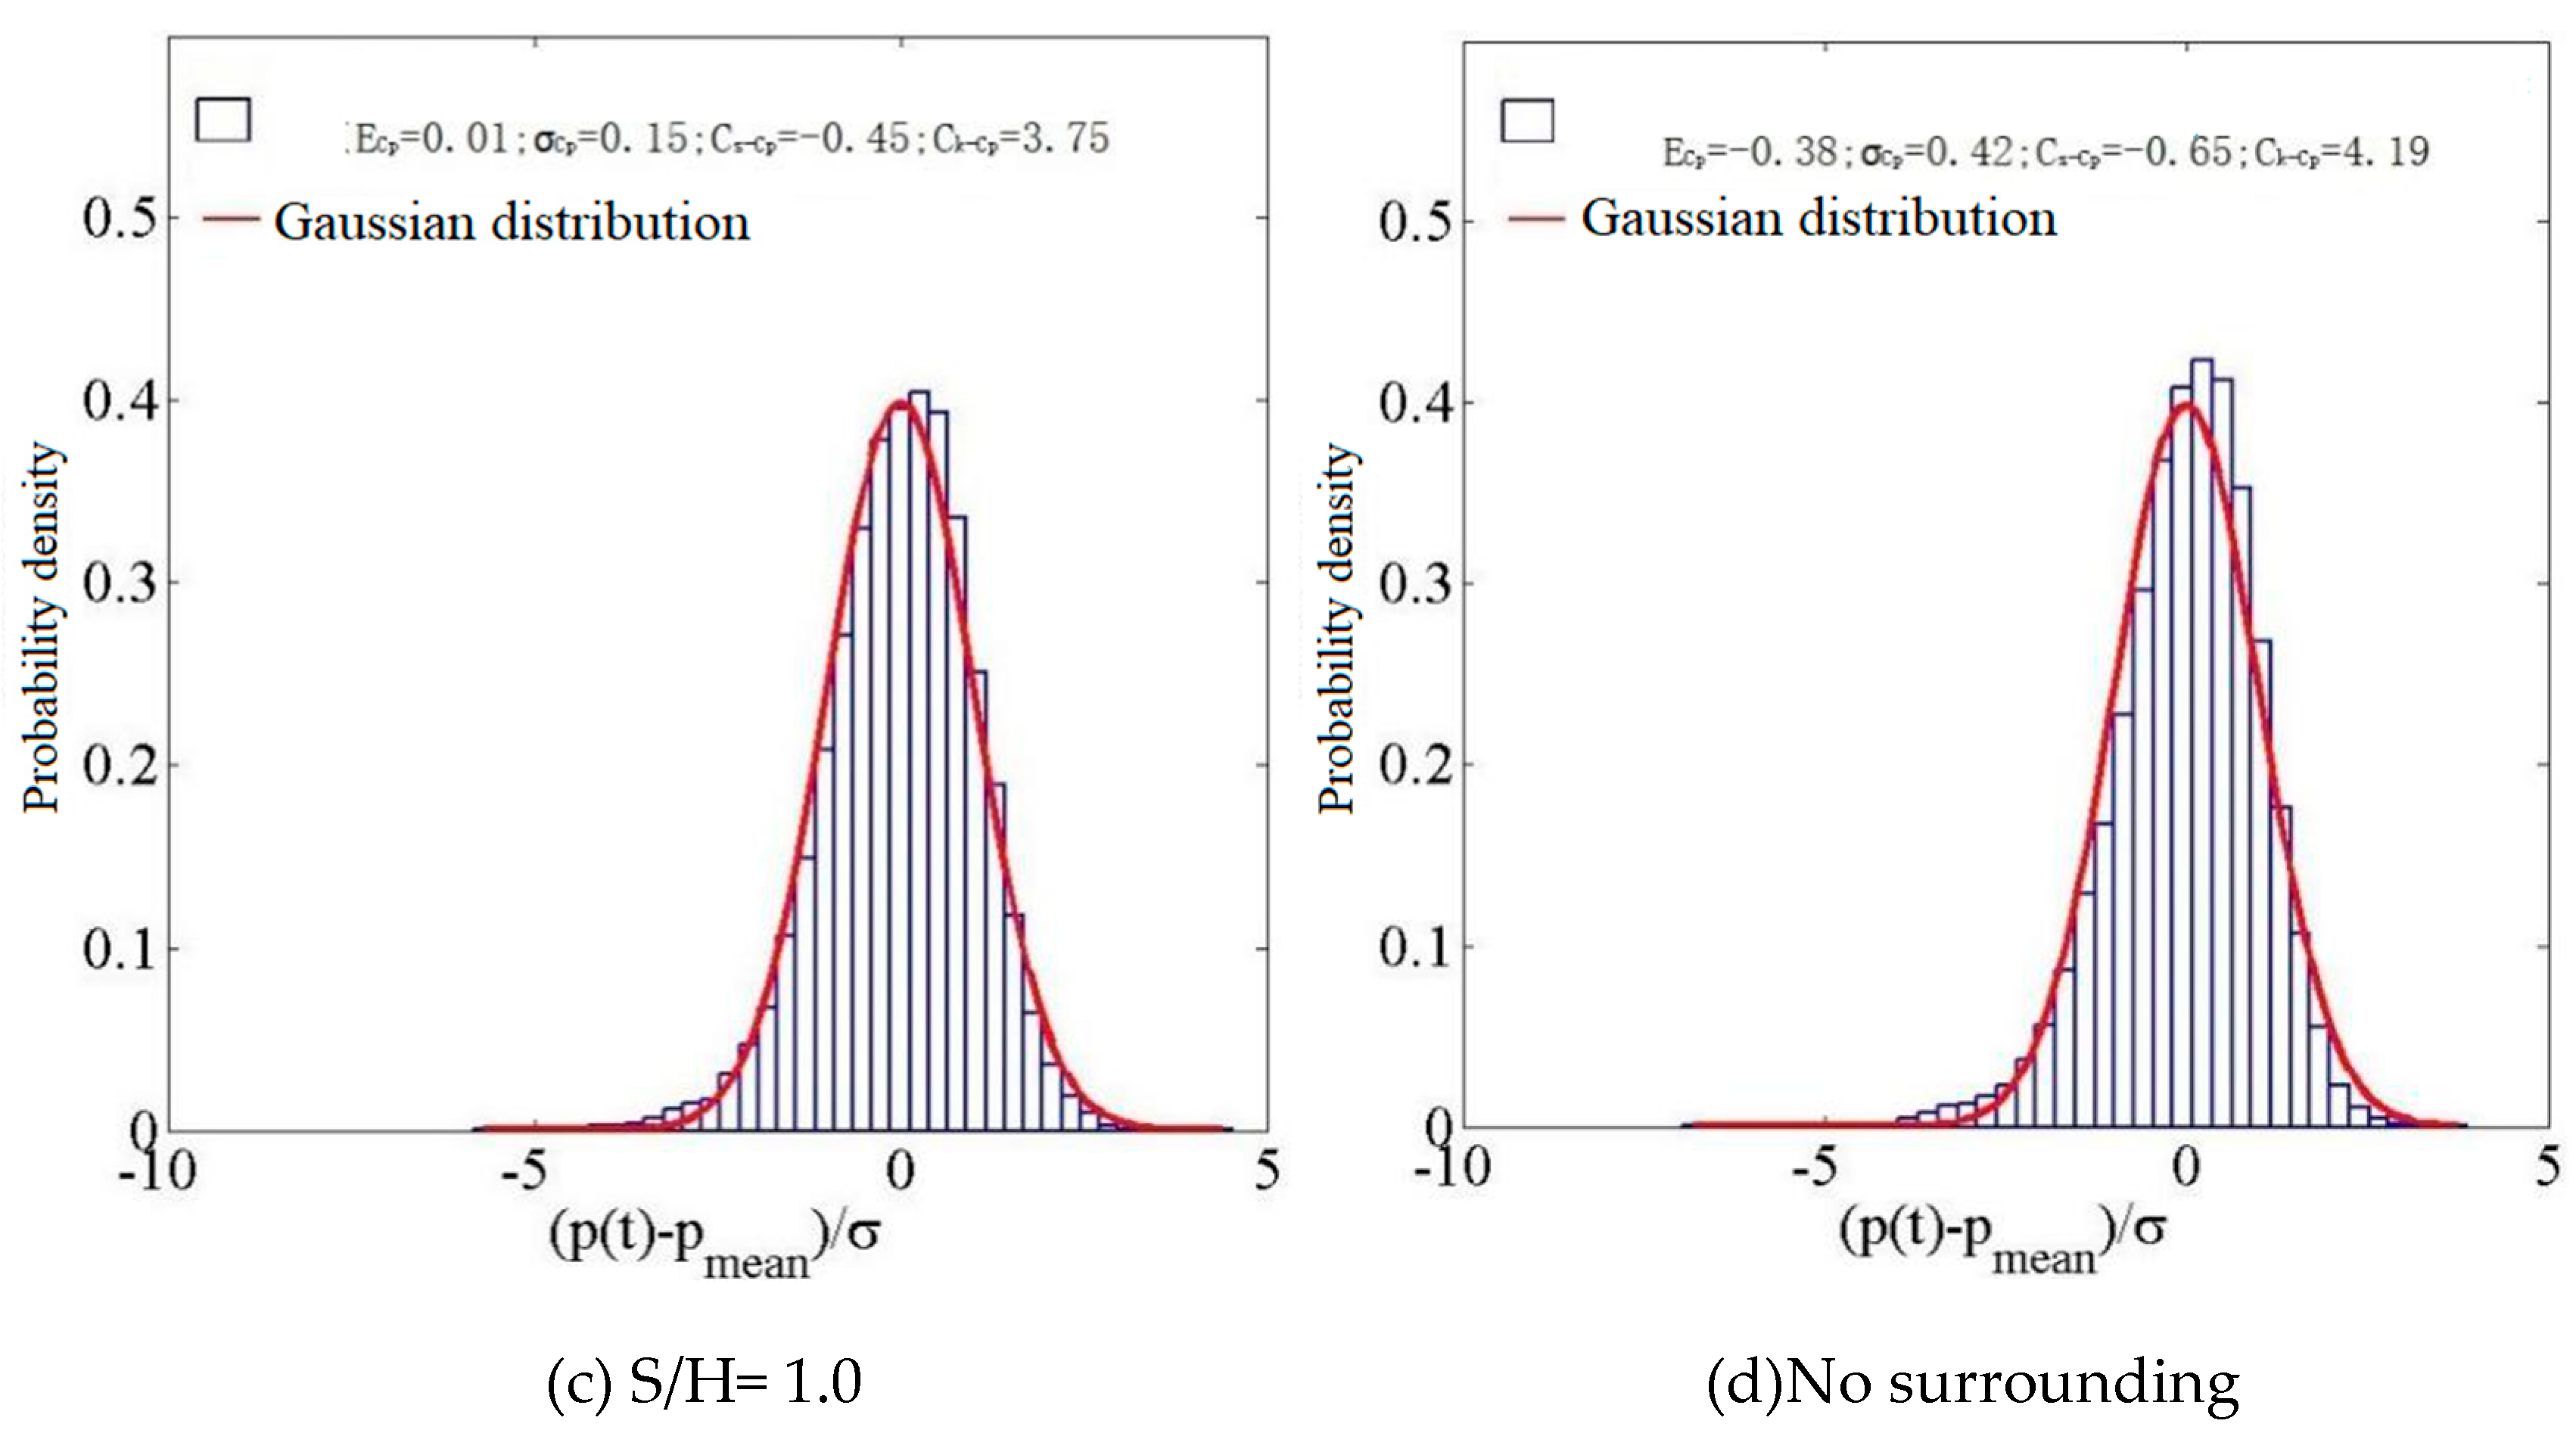
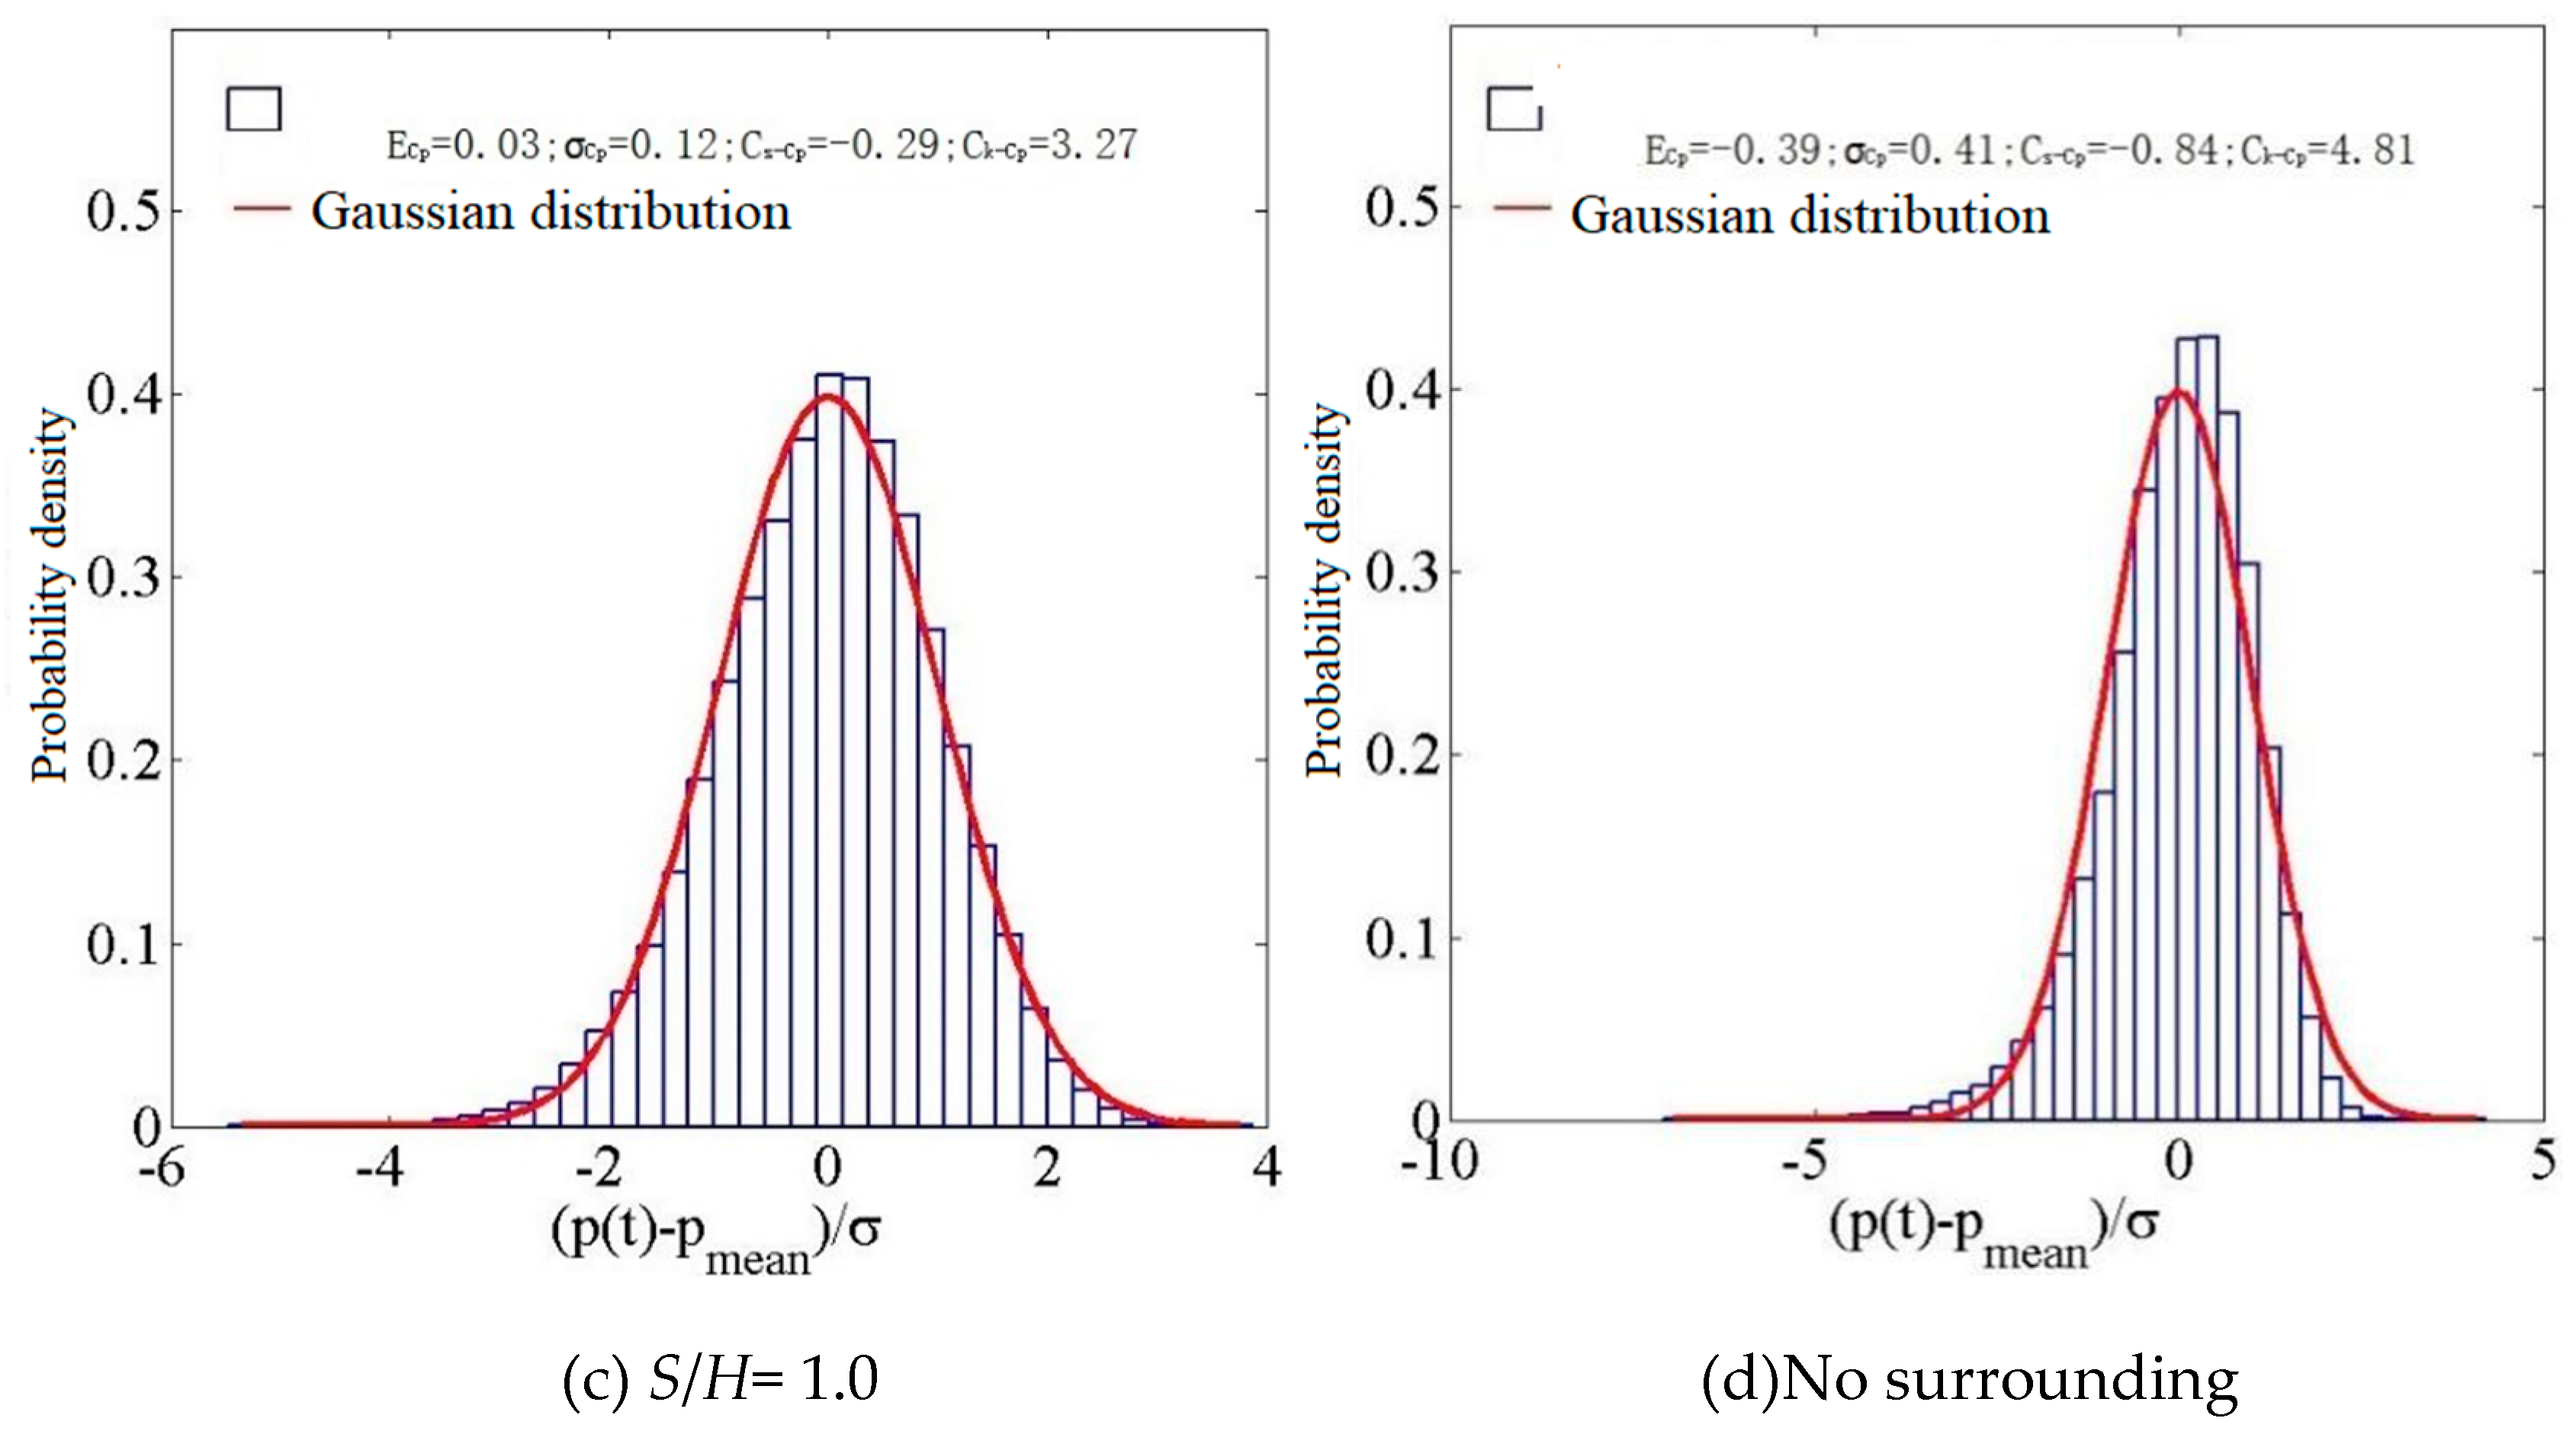
The wind coefficient exhibits Gaussian characteristics in the middle of the left side at 0° wind direction when S/H=0.2. At S/H=0.4, the probability distribution belongs to Gaussian characteristics. At S/H=1.0, the average and RMS values of the wind pressure coefficient decrease, and the distribution exhibits Gaussian characteristics. In the absence of external factors, it is a non-Gaussian probability distribution of wind pressure.
Figure 19.
A histogram depicting the probability density distribution at D19.
Figure 19.
A histogram depicting the probability density distribution at D19.
When S/H=0.2, The wind pressure obeys a Gaussian distribution. At S/H =0.4, the probability wind pressure distribution exhibits Gaussian characteristics. At S/H =1.0, the wind pressure distribution exhibits Gaussian characteristics. In the absence of external factors, it is a non-Gaussian probability distribution of wind pressure.
Figure 20.
A histogram depicting the probability density distribution at D26.
Figure 20.
A histogram depicting the probability density distribution at D26.
The wind coefficient exhibits Gaussian characteristics in the middle of the right side at 0° wind direction. when S/H =0.2, 0.4, the distribution exhibits Gaussian characteristics. At S/H =1.0, the probability distribution exhibits non-Gaussian traits. In the absence of external factors, the mean wind pressure coefficient is a non-Gaussian probability distribution.
Figure 21.
A histogram depicting the probability density distribution of wind pressure at WA7.
Figure 21.
A histogram depicting the probability density distribution of wind pressure at WA7.
In the middle of the leeward eave with a wind direction of 0° when S/H =0.2, the probability distribution exhibits Gaussian traits. When S/H=0.4, the distribution exhibits Gaussian characteristics. At S/H=1.0, the average and RMS values of the wind pressure coefficient decrease, while the distribution exhibits Gaussian characteristics. In the absence of external factors, the mean wind pressure coefficient is a non-Gaussian probability distribution.
Figure 22.
A histogram depicting the probability density distribution at WA20.
Figure 22.
A histogram depicting the probability density distribution at WA20.
The probability distribution in the center of the windward eave with a wind direction of 0°has non-Gaussian characteristics. At S/H =0.4, the probability distribution exhibits non-Gaussian characteristics. At S/H =1.0, the wind pressure distribution exhibits Gaussian characteristics. In the absence of external factors, the wind pressure coefficient belongs to a non-Gaussian probability distribution.
7. Conclusion
1. The wind pressure coefficient on the building surface varies in a specific manner as the distance between the hillside and the building grows. The fluctuating coefficient on the windward side decreases first and then increases. The fluctuating coefficient on the left and right sides increases gradually. At infinity, when there is no influence from the surrounding environment, the value decreases. The fluctuating coefficient of the roof increases gradually and reaches the maximum when there is no influence from the surrounding environment.
2. Due to the existence of the mountain, the energy of the low-frequency is weakened, and the energy of the high-frequency band is enhanced. This is mainly due to the suppression of the spatial large-scale vortex structure by the mountain, resulting in the weakening of the turbulence characteristics of the incoming wind and the increase of the small-scale vortex. With the increase of the distance between the hillside and the building, the energy in the low-frequency band at the windward eaves decreases and the energy in the high-frequency band increases gradually.
3. The variation of the probability distribution of wind pressure at the middle measuring points in different regions under 0° wind direction is analyzed and found with the increase of the relative position between the hillside and the building, the probability distribution has Gaussian characteristics when the lee side has no periphery and the three working conditions. In the middle of windward and leeward eaves, the distribution characteristics gradually changed from non-Gaussian characteristics to Gaussian characteristics.
Author Contributions
Software, M.Z., C.W., and XJ.W; formal analysis, M.Z., and MH.L.; investigation, C.W. and XJ.W.; resources, M.Z. and C.W.; data curation, MH.L., JY.L, and M.Z.; writing—original draft preparation, M.Z., MH.L, and C.W.; writing—review and editing, JY.L. and XJ.W. All authors have read and agreed to the published version of the manuscript.
Funding
The work described in this paper was supported by the Science Research Project of the Hebei Education Department , grant number BJ2020010 and the National Natural Science Foundation Of China , the grant number are 51478179 and 51178180.
Data Availability Statement
Open source data, please contact the author if needed.
Conflicts of Interest
The authors declare no conflicts of interest.
References
- Fan, Y.; Quan, Y.; Gu, M.; Jiang, H. Aerodynamic Interference Effect of Single Surrounding Building on Average Wind Pressure of Industrial Plant Roof. J. Build. Struct. 2011, 32, 24–32. [Google Scholar]
- Van Hooff, T.; Blocken, B. On the effect of wind direction and urban surroundings on natural ventilation of a large semi-enclosed stadium. Comput. Fluid 2010, 39, 1146–1155. [Google Scholar] [CrossRef]
- Akon, A.F.; Kopp, G.A. Mean pressure distributions and reattachment lengths for roof-separation bubbles on low-rise buildings. J. Wind Eng. Ind. Aerodyn. 2016, 155, 115–125. [Google Scholar] [CrossRef]
- Holmes, J.D. Wind pressures on tropical housing. J. Wind. Eng. Ind. Aerodyn. 1994, 53, 105–123. [Google Scholar] [CrossRef]
- Quan, Y.; Gu, M.; Tamura, Y.; Huang, P. Interference effect of Surrounding Buildings on wind pressure of low building roof. J. Tongji Univ. (Nat. Sci. Ed.) 2009, 37, 1576–1580. [Google Scholar]
- Chang, C.H.; Meronry, R.N. The effects of surroundings with different separation distances on surface pressures on low-rise buildings. J. Wind. Eng. Ind. Aerodyn. 2003, 91, 1039–1050. [Google Scholar] [CrossRef]
- Yong, C.K.; Yoshida, A.; Tamera, Y. Characteristics of surface wind pressures on a low-rise building located among a large group of surrounding buildings. Eng. Struct. 2012, 35, 18–28. [Google Scholar] [CrossRef]
- Zhong, H.-Y.; Lin, C.; Shang, J.; Sun, Y.; Kikumoto, H.; Ooka, R.; Qian, F.-P.; Zhao, F.-Y. Wind tunnel experiments on pumping ventilation through a three-story reduce-scaled building with two openings affected by upwind and downwind buildings. Build. Environ. 2022, 109188. [Google Scholar] [CrossRef]
- Kim, Y.C.; Tamura, Y.; Yoon, S.W. Proximity effect on low-rise building surrounded by similar-sized buildings. J. Wind. Eng. Ind. Aerodyn. 2015, 146, 150–162. [Google Scholar] [CrossRef]
- Liu, Z.; Yu, Z.; Chen, X.; Cao, R.; Zhu, F. An investigation on external airflow around low-rise building with various roof types: PIV measurements and LES simulations. Build. Environ. 2020, 106583. [Google Scholar] [CrossRef]
- Quan Yong, Gu Ming, Yukio Tamura, Huang Peng, Masahiro Matsui. Interference factors of surrounding buildings on Wind Load of flat roofs of Low Buildings. J. Civ. Eng. 2010, 43, 20–25.
- Guirguisa, N.; El-Aziz, A.A.; Nassief, M. Study of wind effects on different buildings of pitched roofs. Desalination 2007, 209, 190–198. [Google Scholar] [CrossRef]
- Tominaga, Y.; Akabayashi, S.-I.; Kitahara, T.; Arinami, Y. Air flow around isolated gable-roof buildings with different roof pitches: wind tunnel experiments and CFD simulations. Build. Environ. 2015, 18, 204–213. [Google Scholar] [CrossRef]
- Holmes, J.D. Wind pressures on tropical housing. J. Wind. Eng. Ind. Aerodyn. 1994, 53, 105–123. [Google Scholar] [CrossRef]
|
Disclaimer/Publisher’s Note: The statements, opinions and data contained in all publications are solely those of the individual author(s) and contributor(s) and not of MDPI and/or the editor(s). MDPI and/or the editor(s) disclaim responsibility for any injury to people or property resulting from any ideas, methods, instructions or products referred to in the content. |
© 2024 by the authors. Licensee MDPI, Basel, Switzerland. This article is an open access article distributed under the terms and conditions of the Creative Commons Attribution (CC BY) license (http://creativecommons.org/licenses/by/4.0/).


