Submitted:
04 March 2024
Posted:
05 March 2024
You are already at the latest version
Abstract
Keywords:
1. Introduction
2. Materials and Methods
3. Results and Discussion
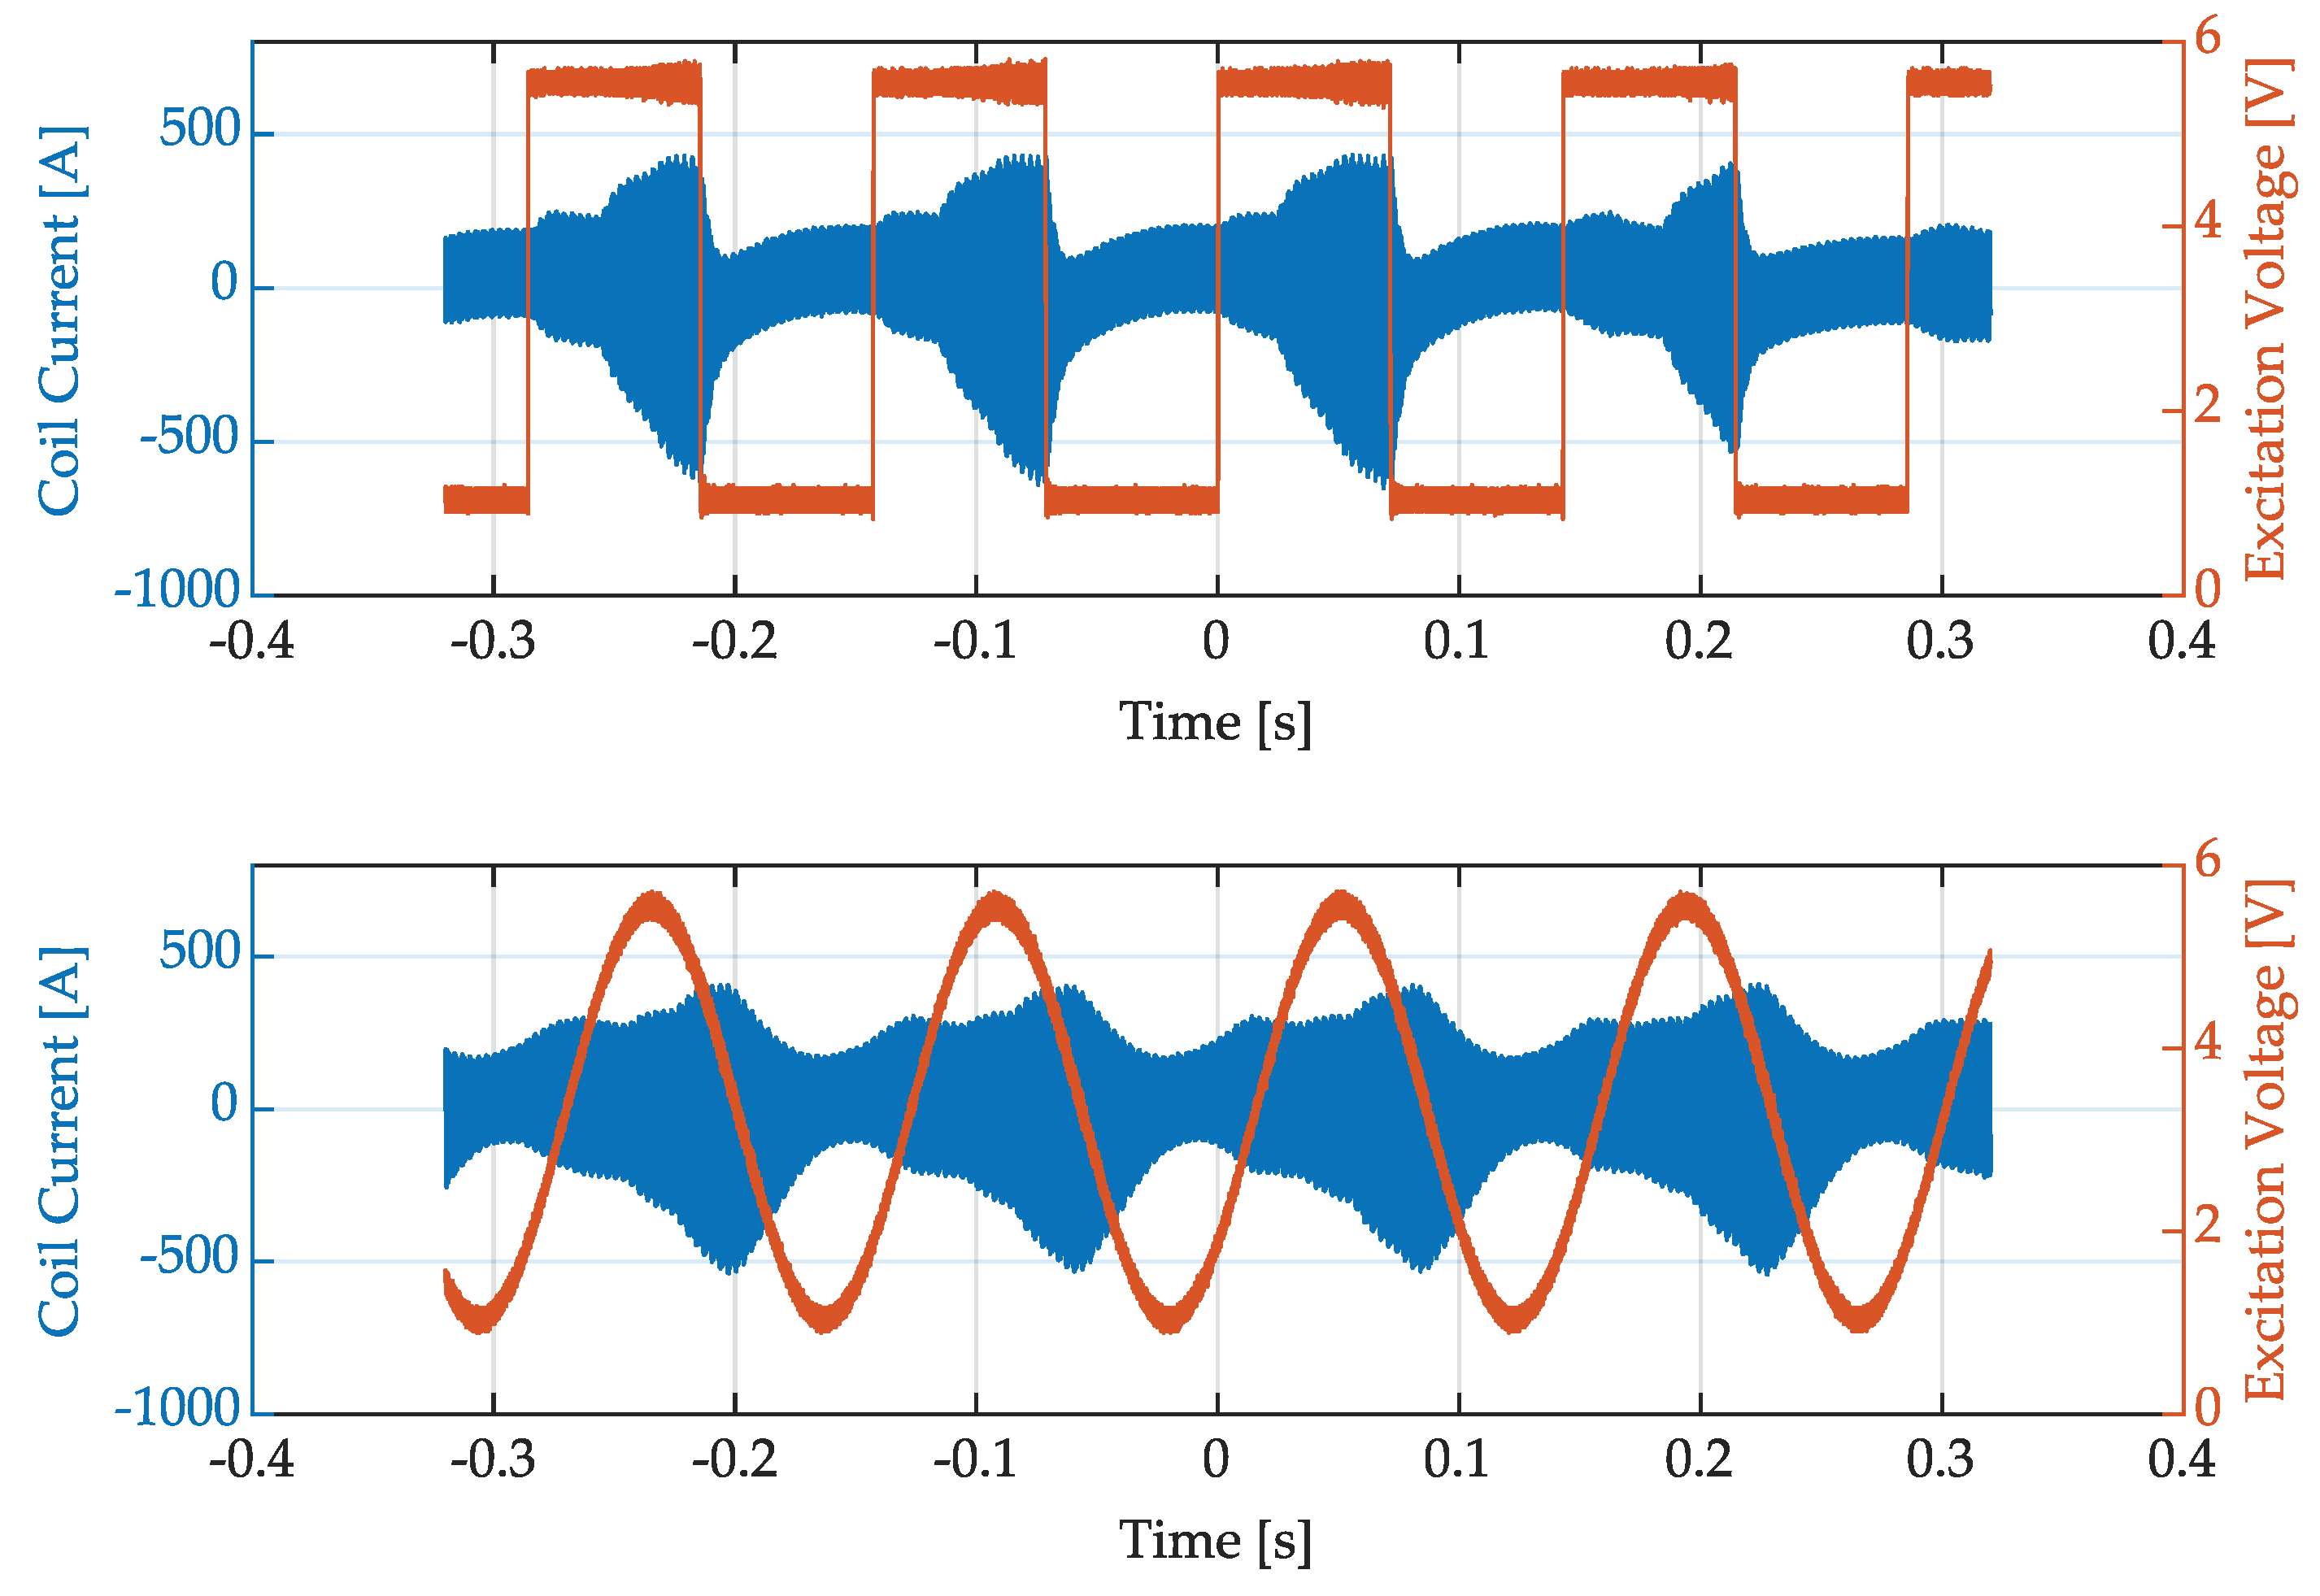
3.1. Generator Response Behavior
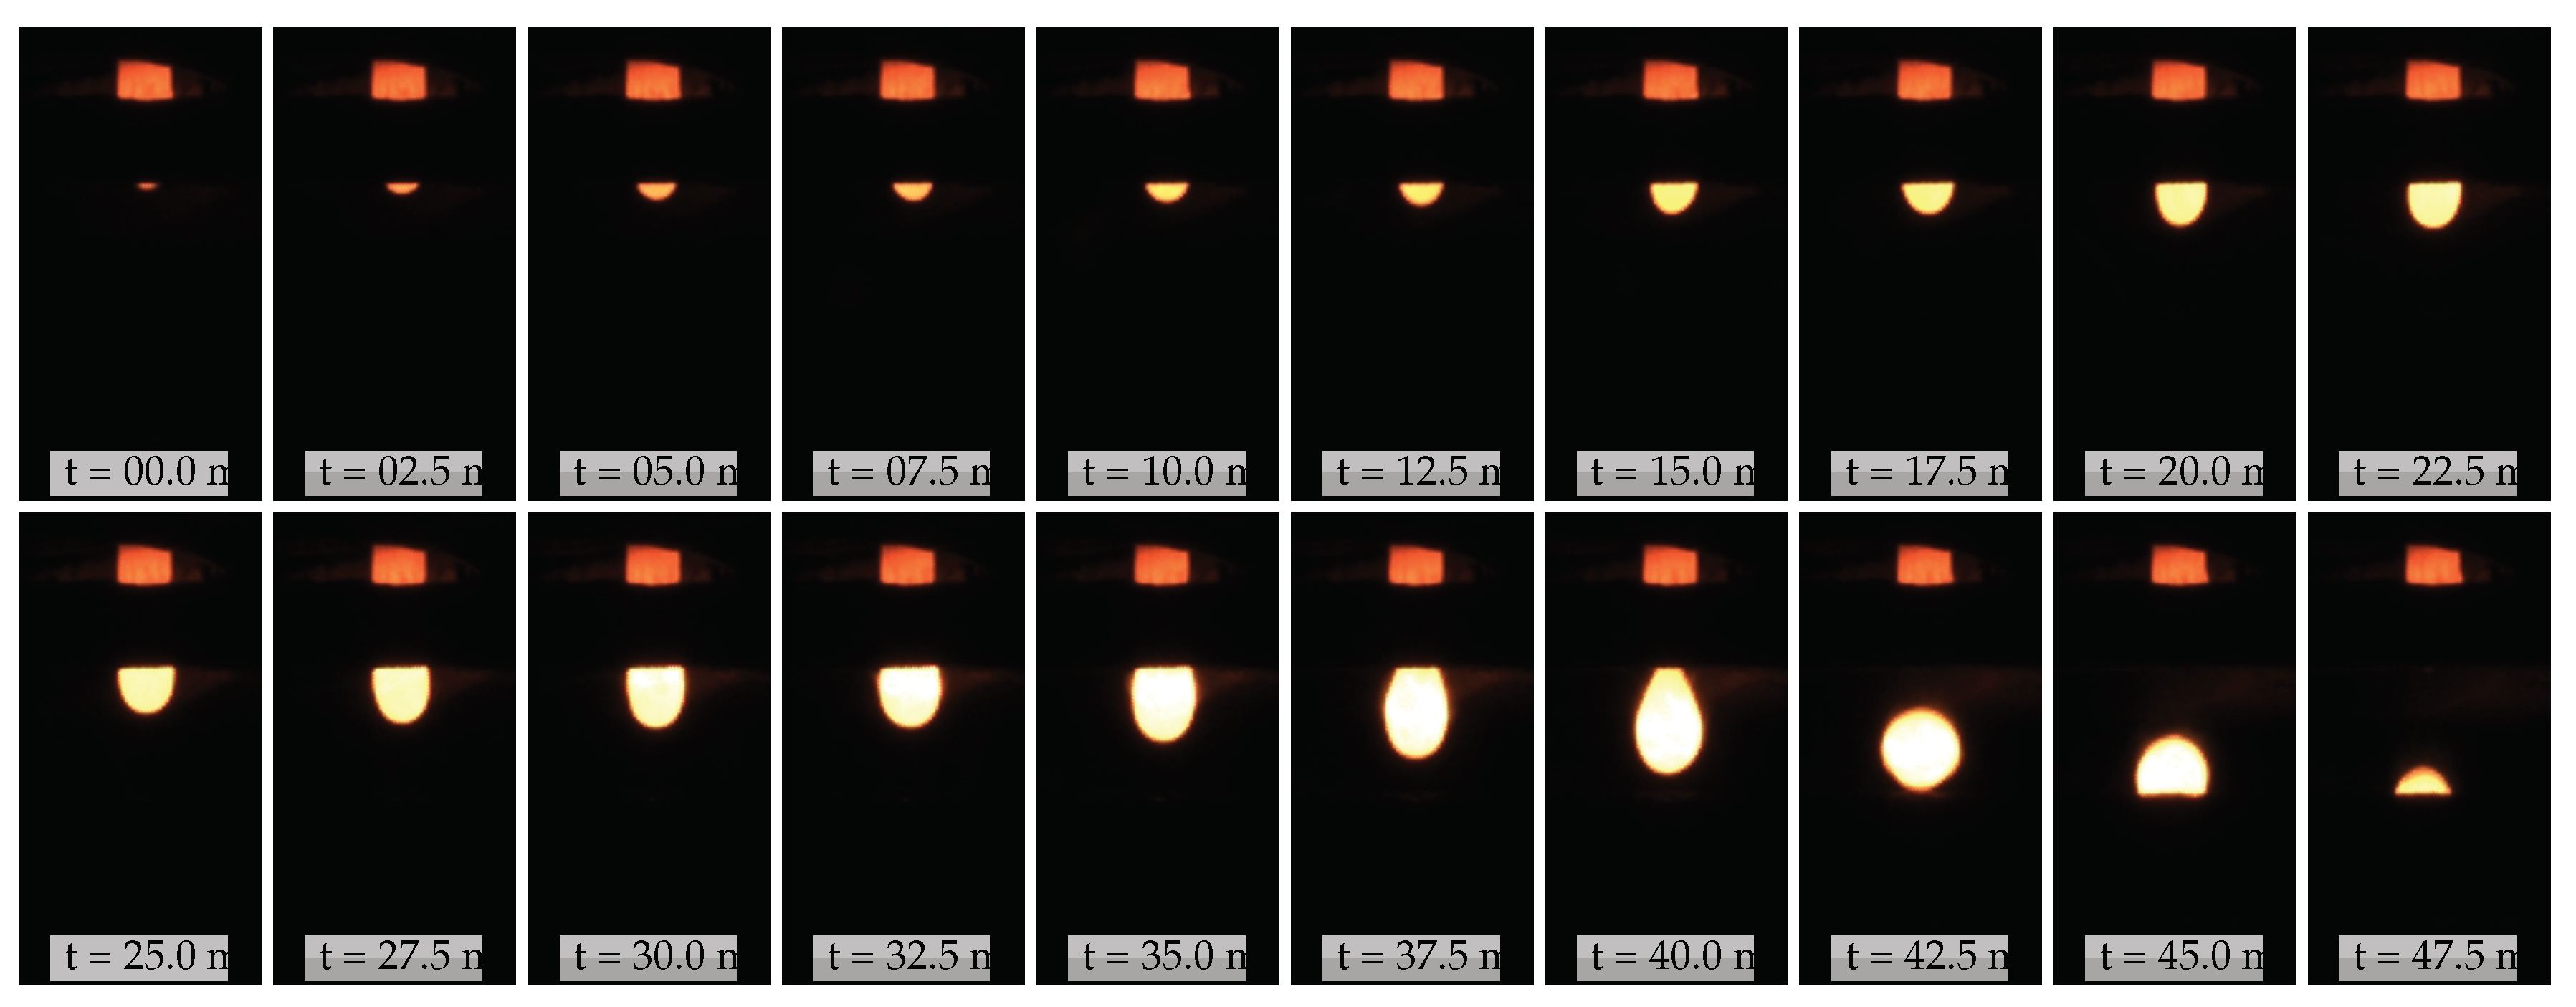
3.2. Droplet Formation and Detachments
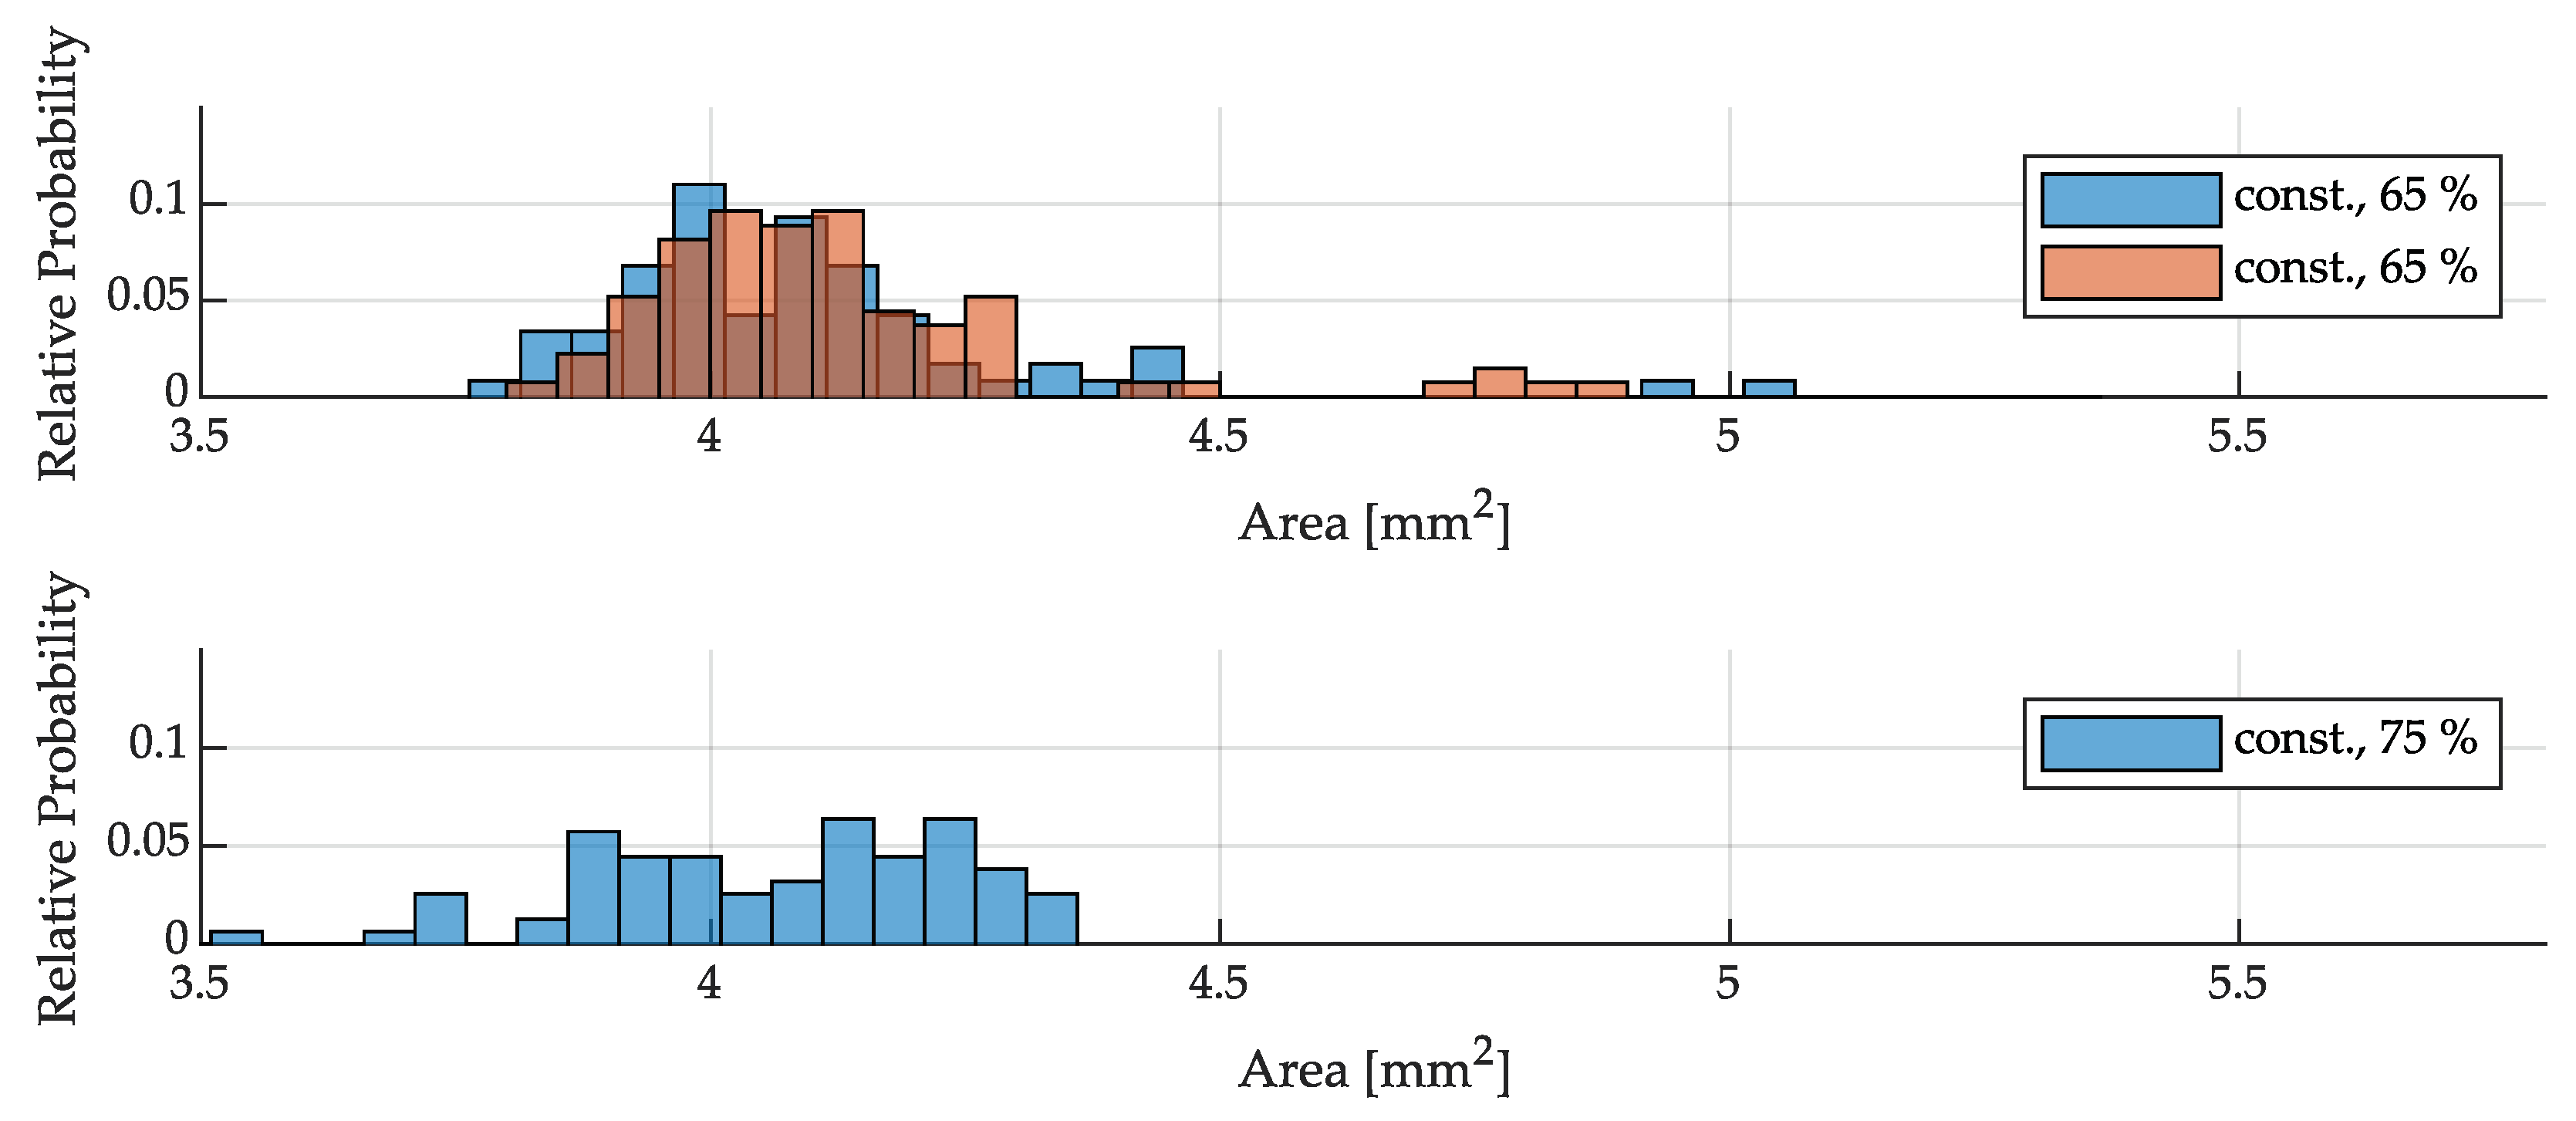
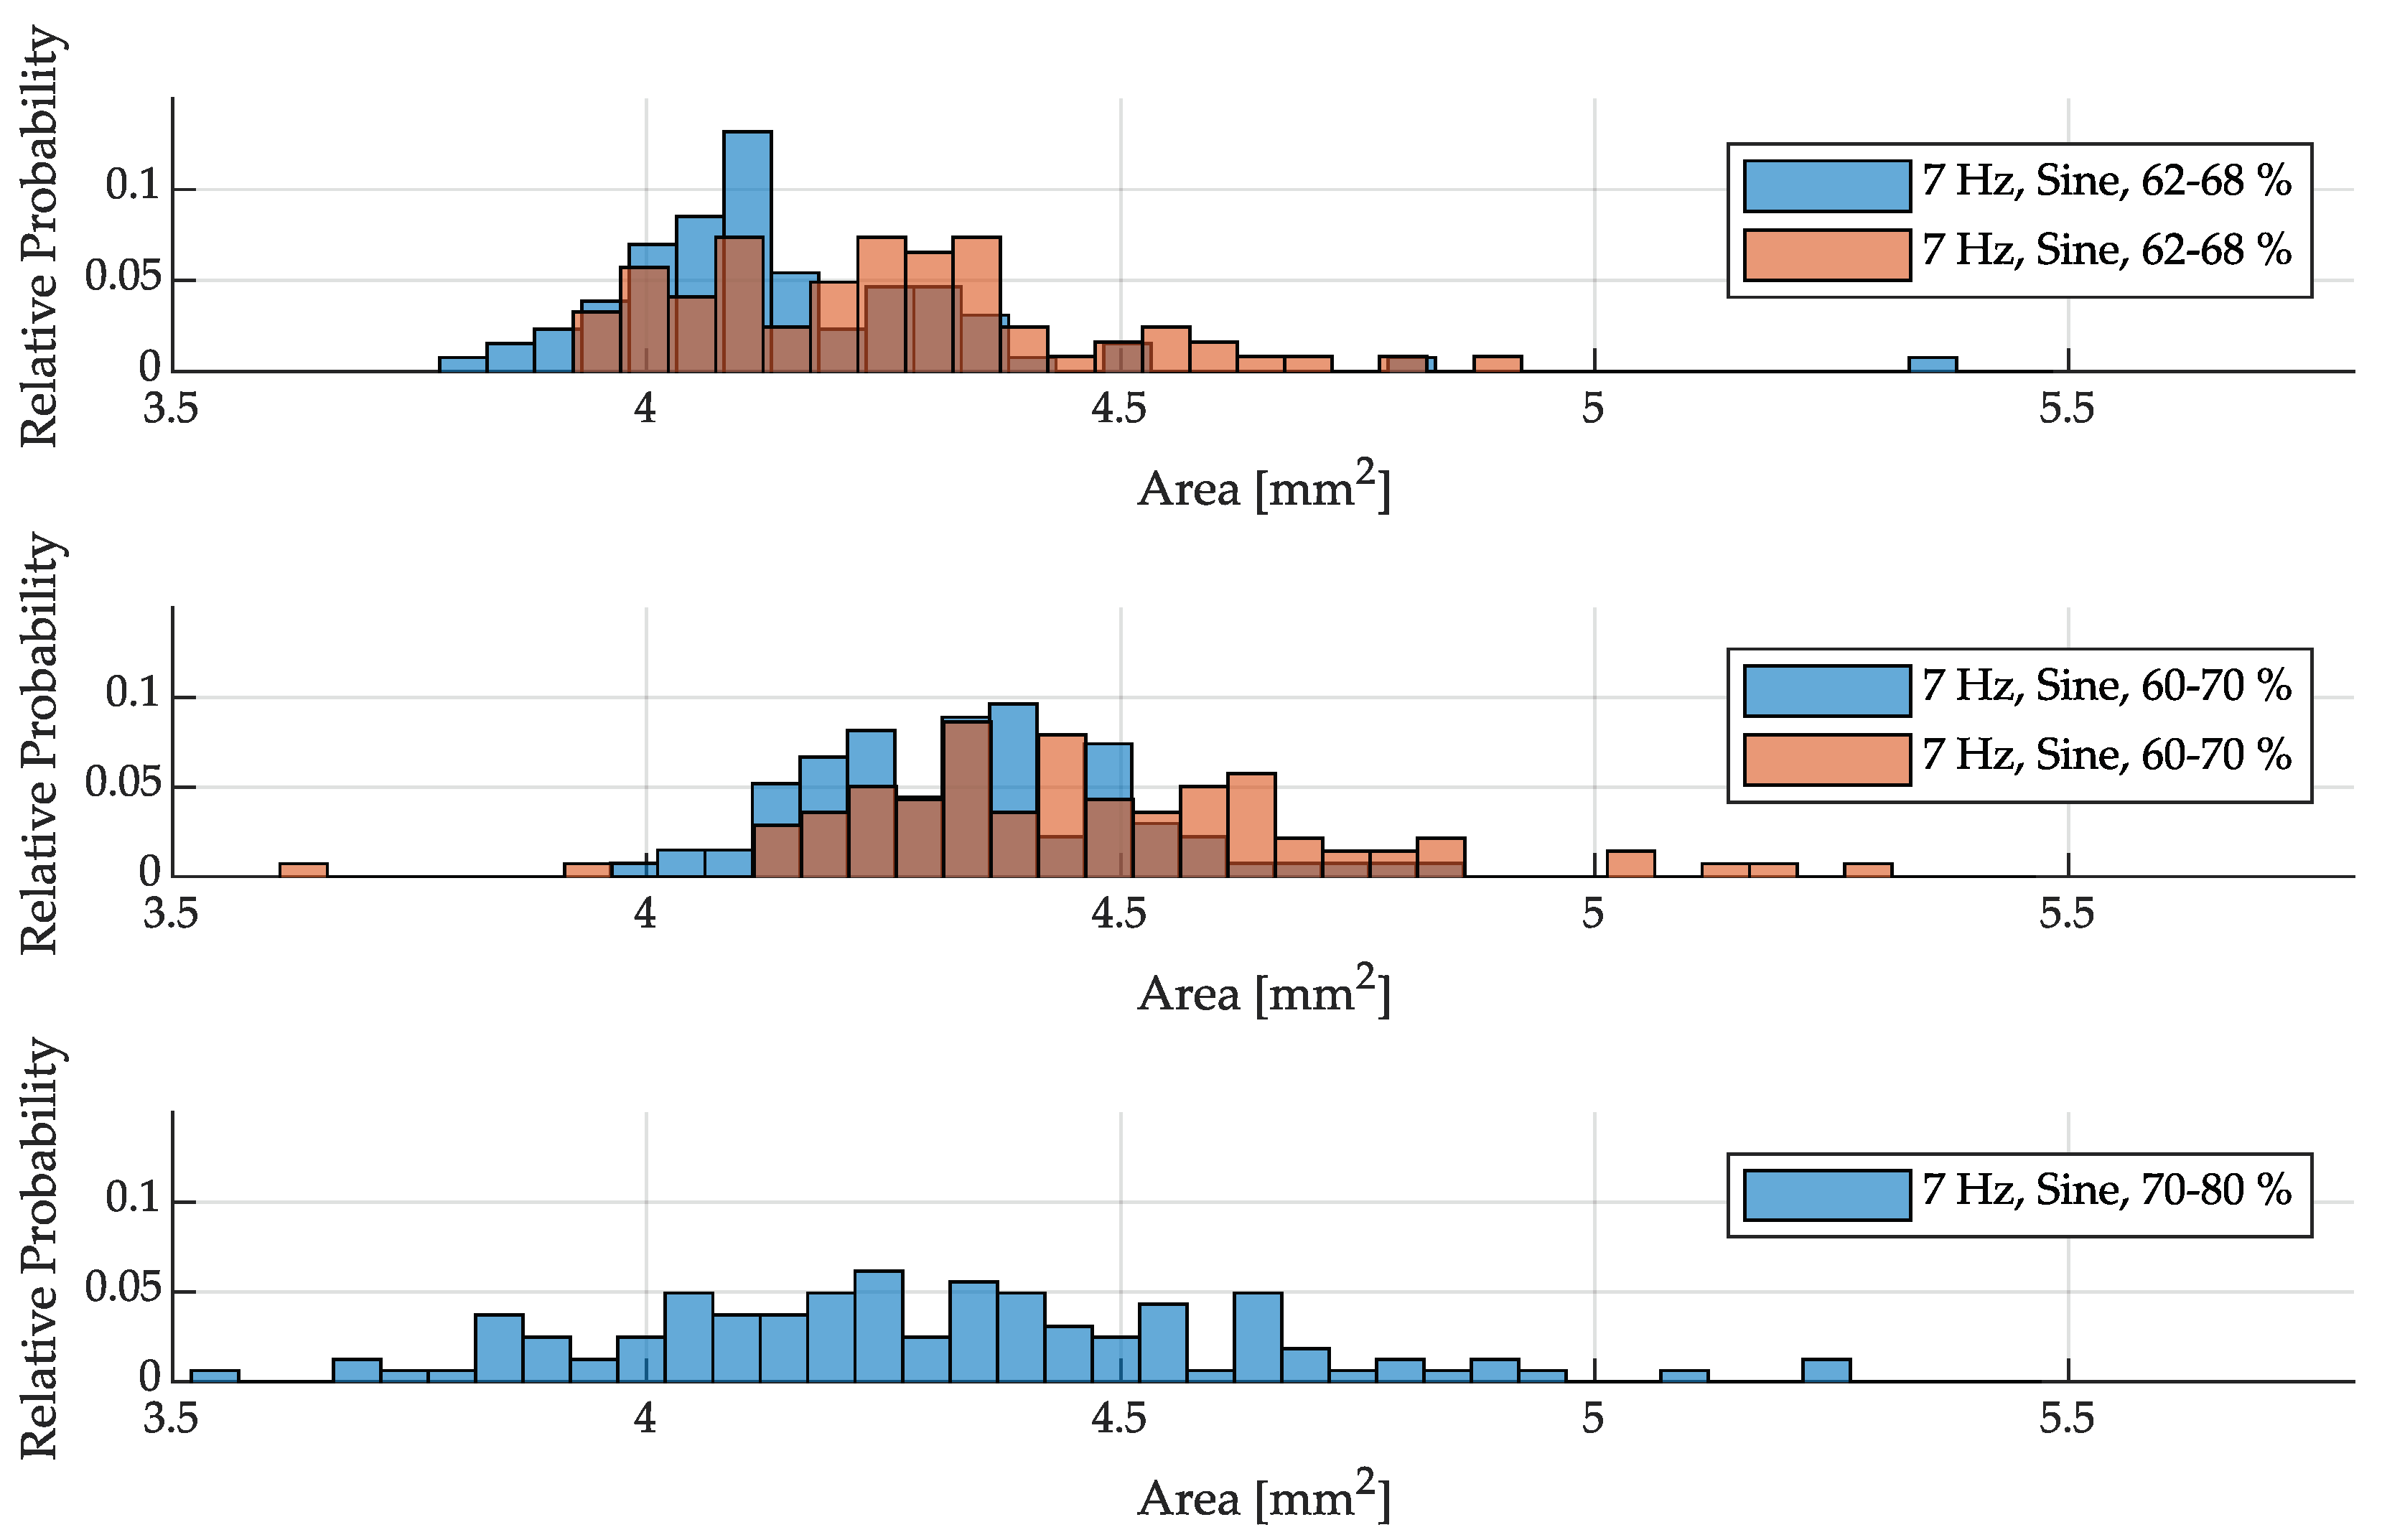
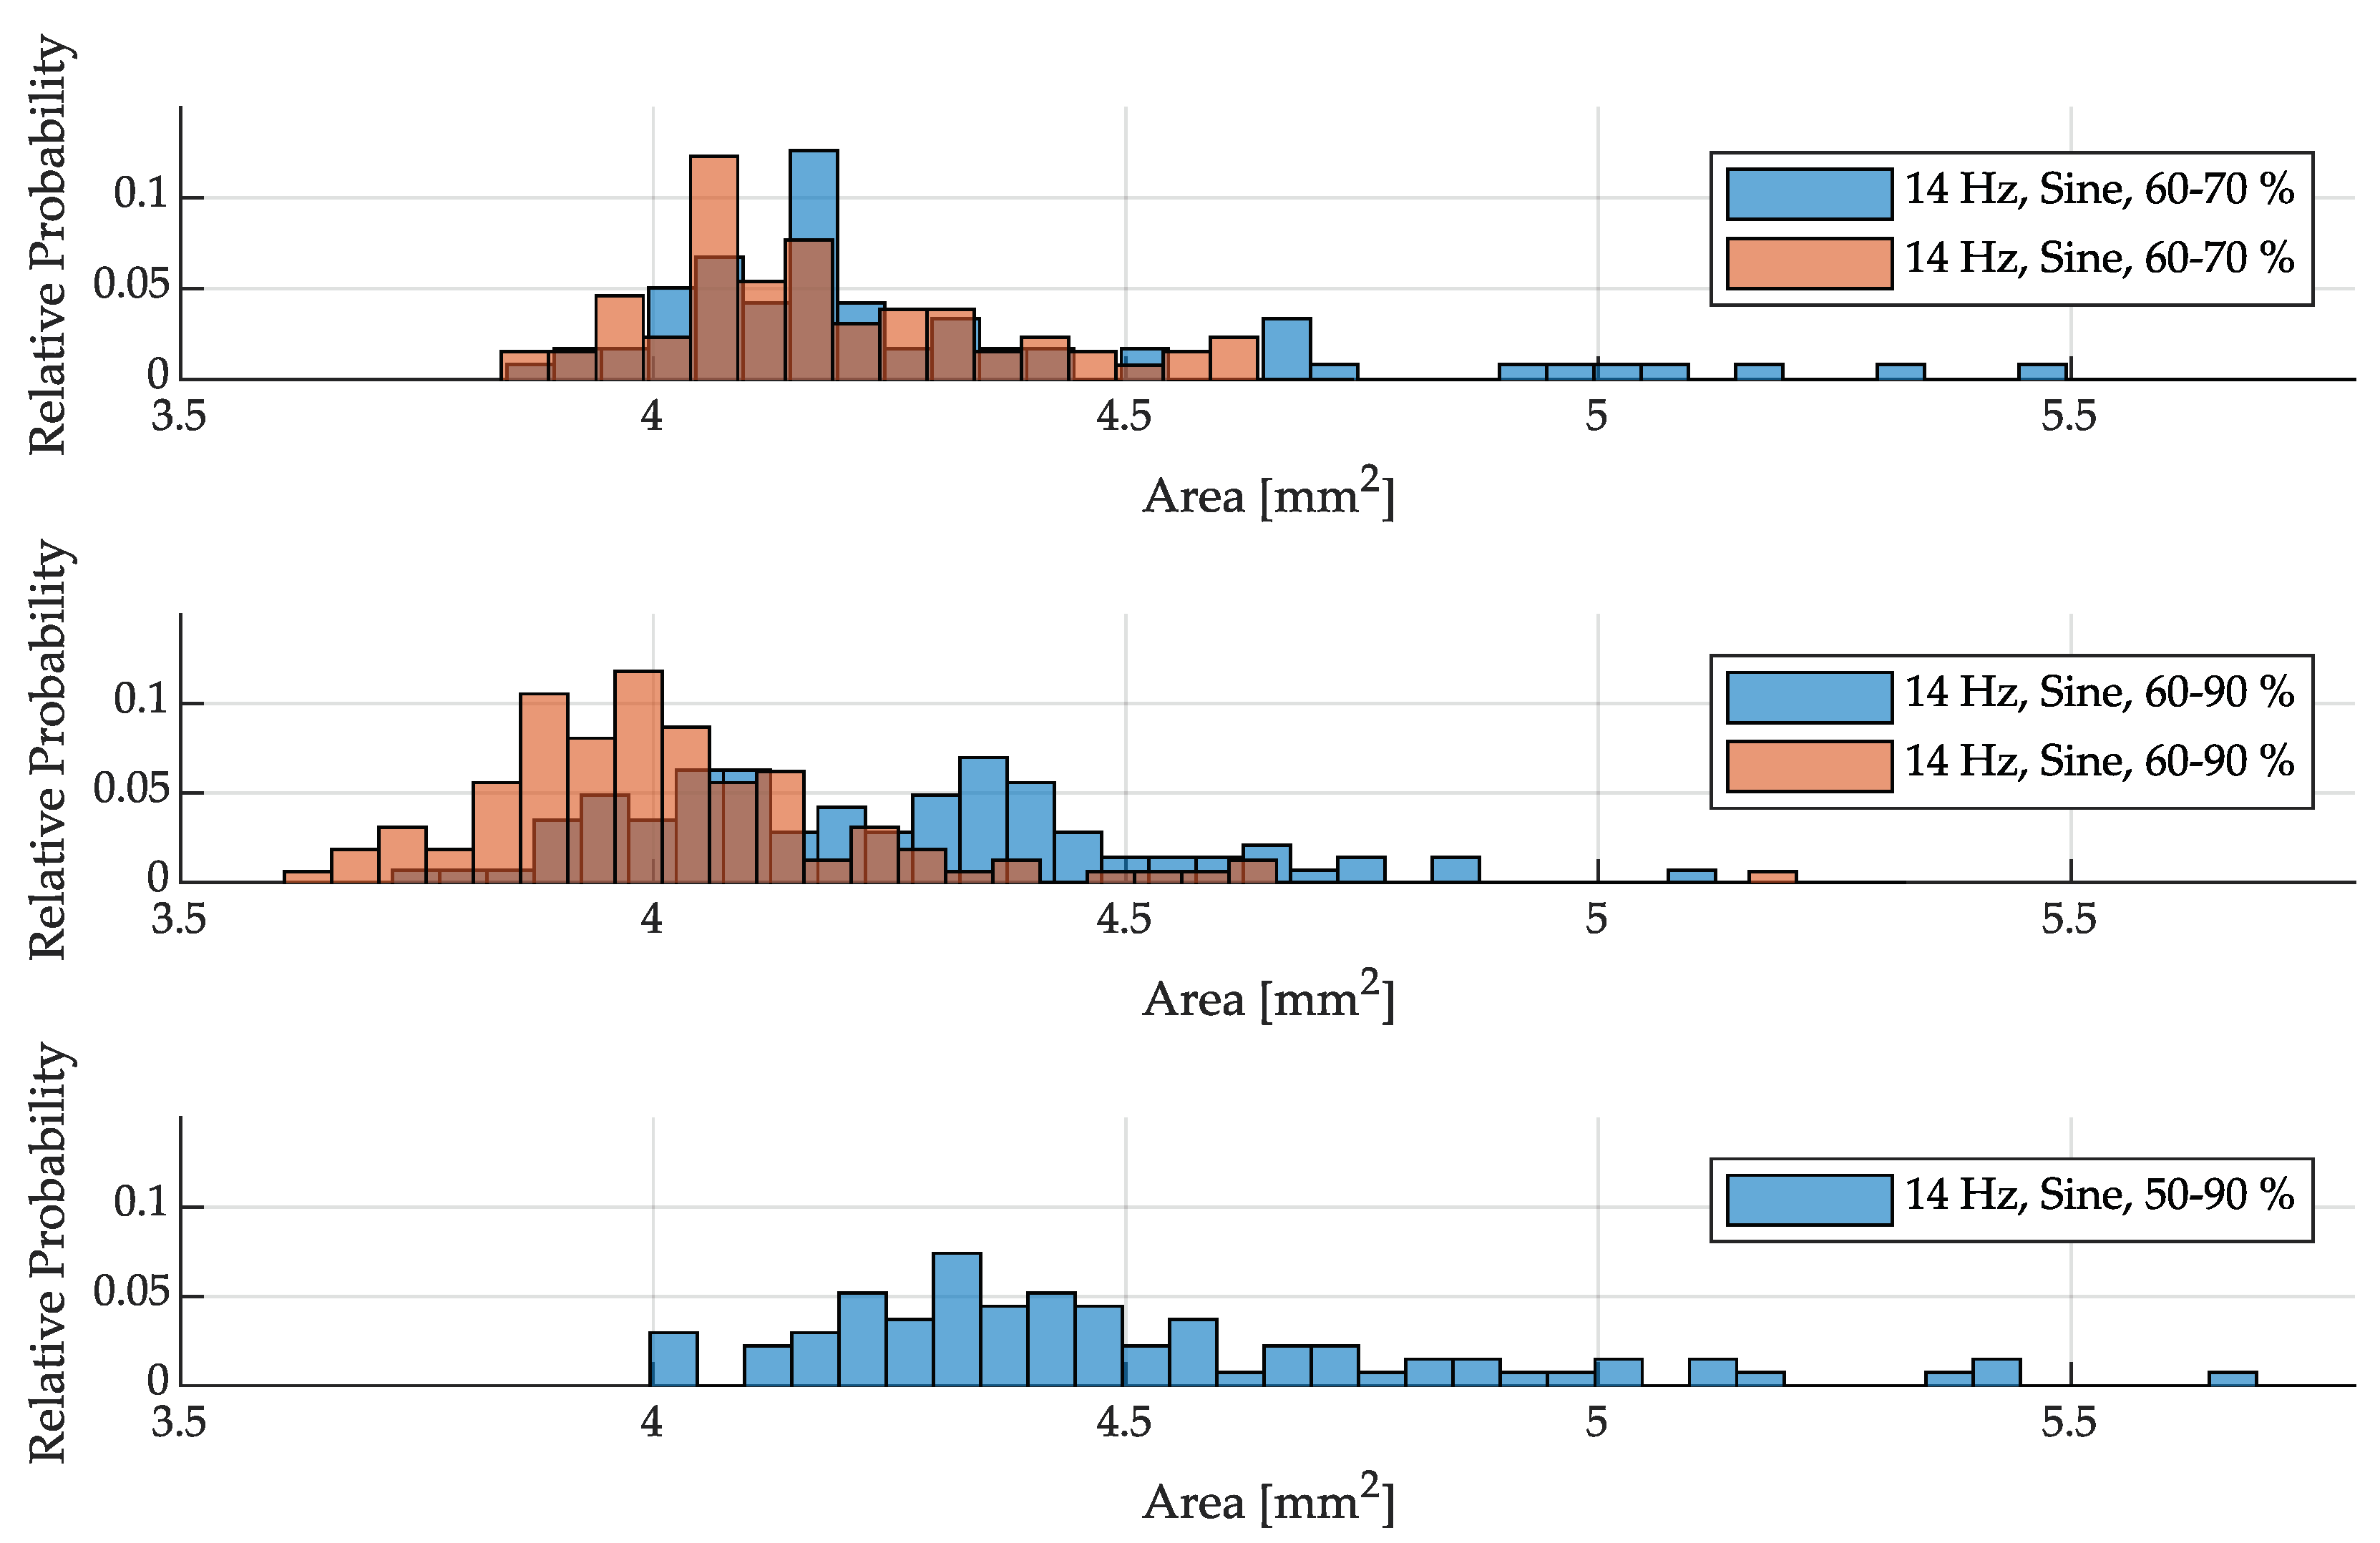
3.3. Size distribution of drops
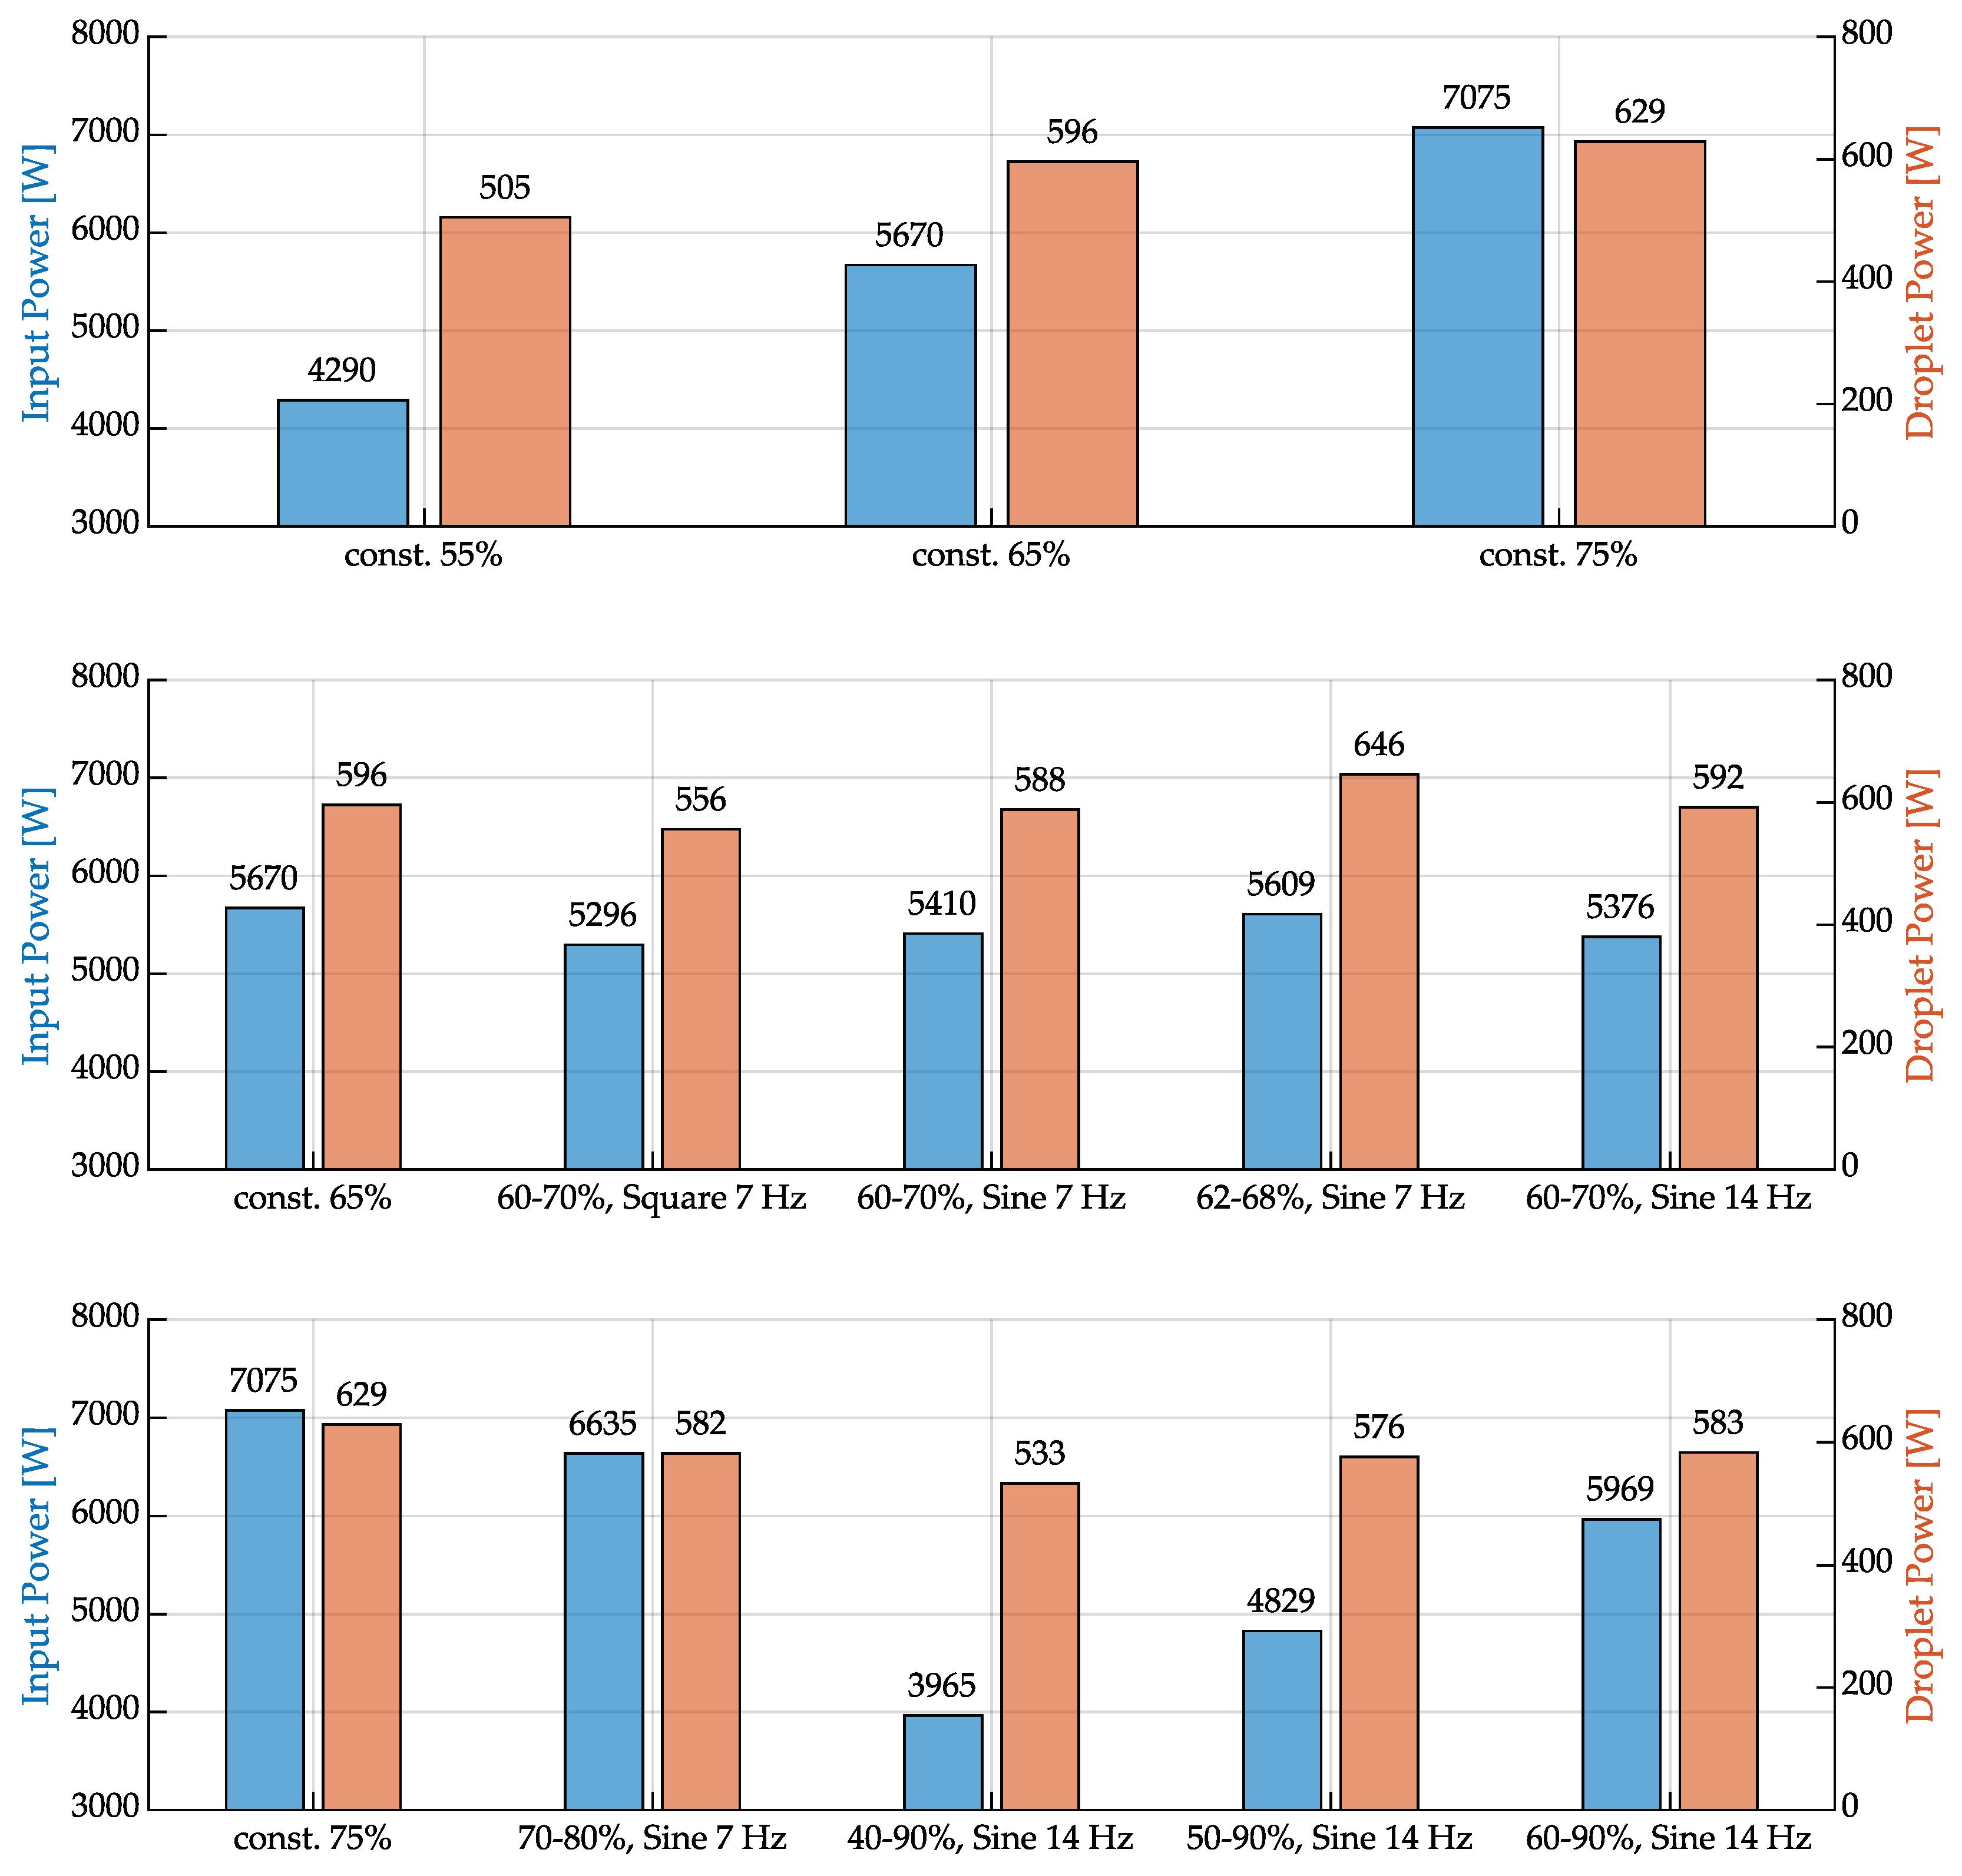
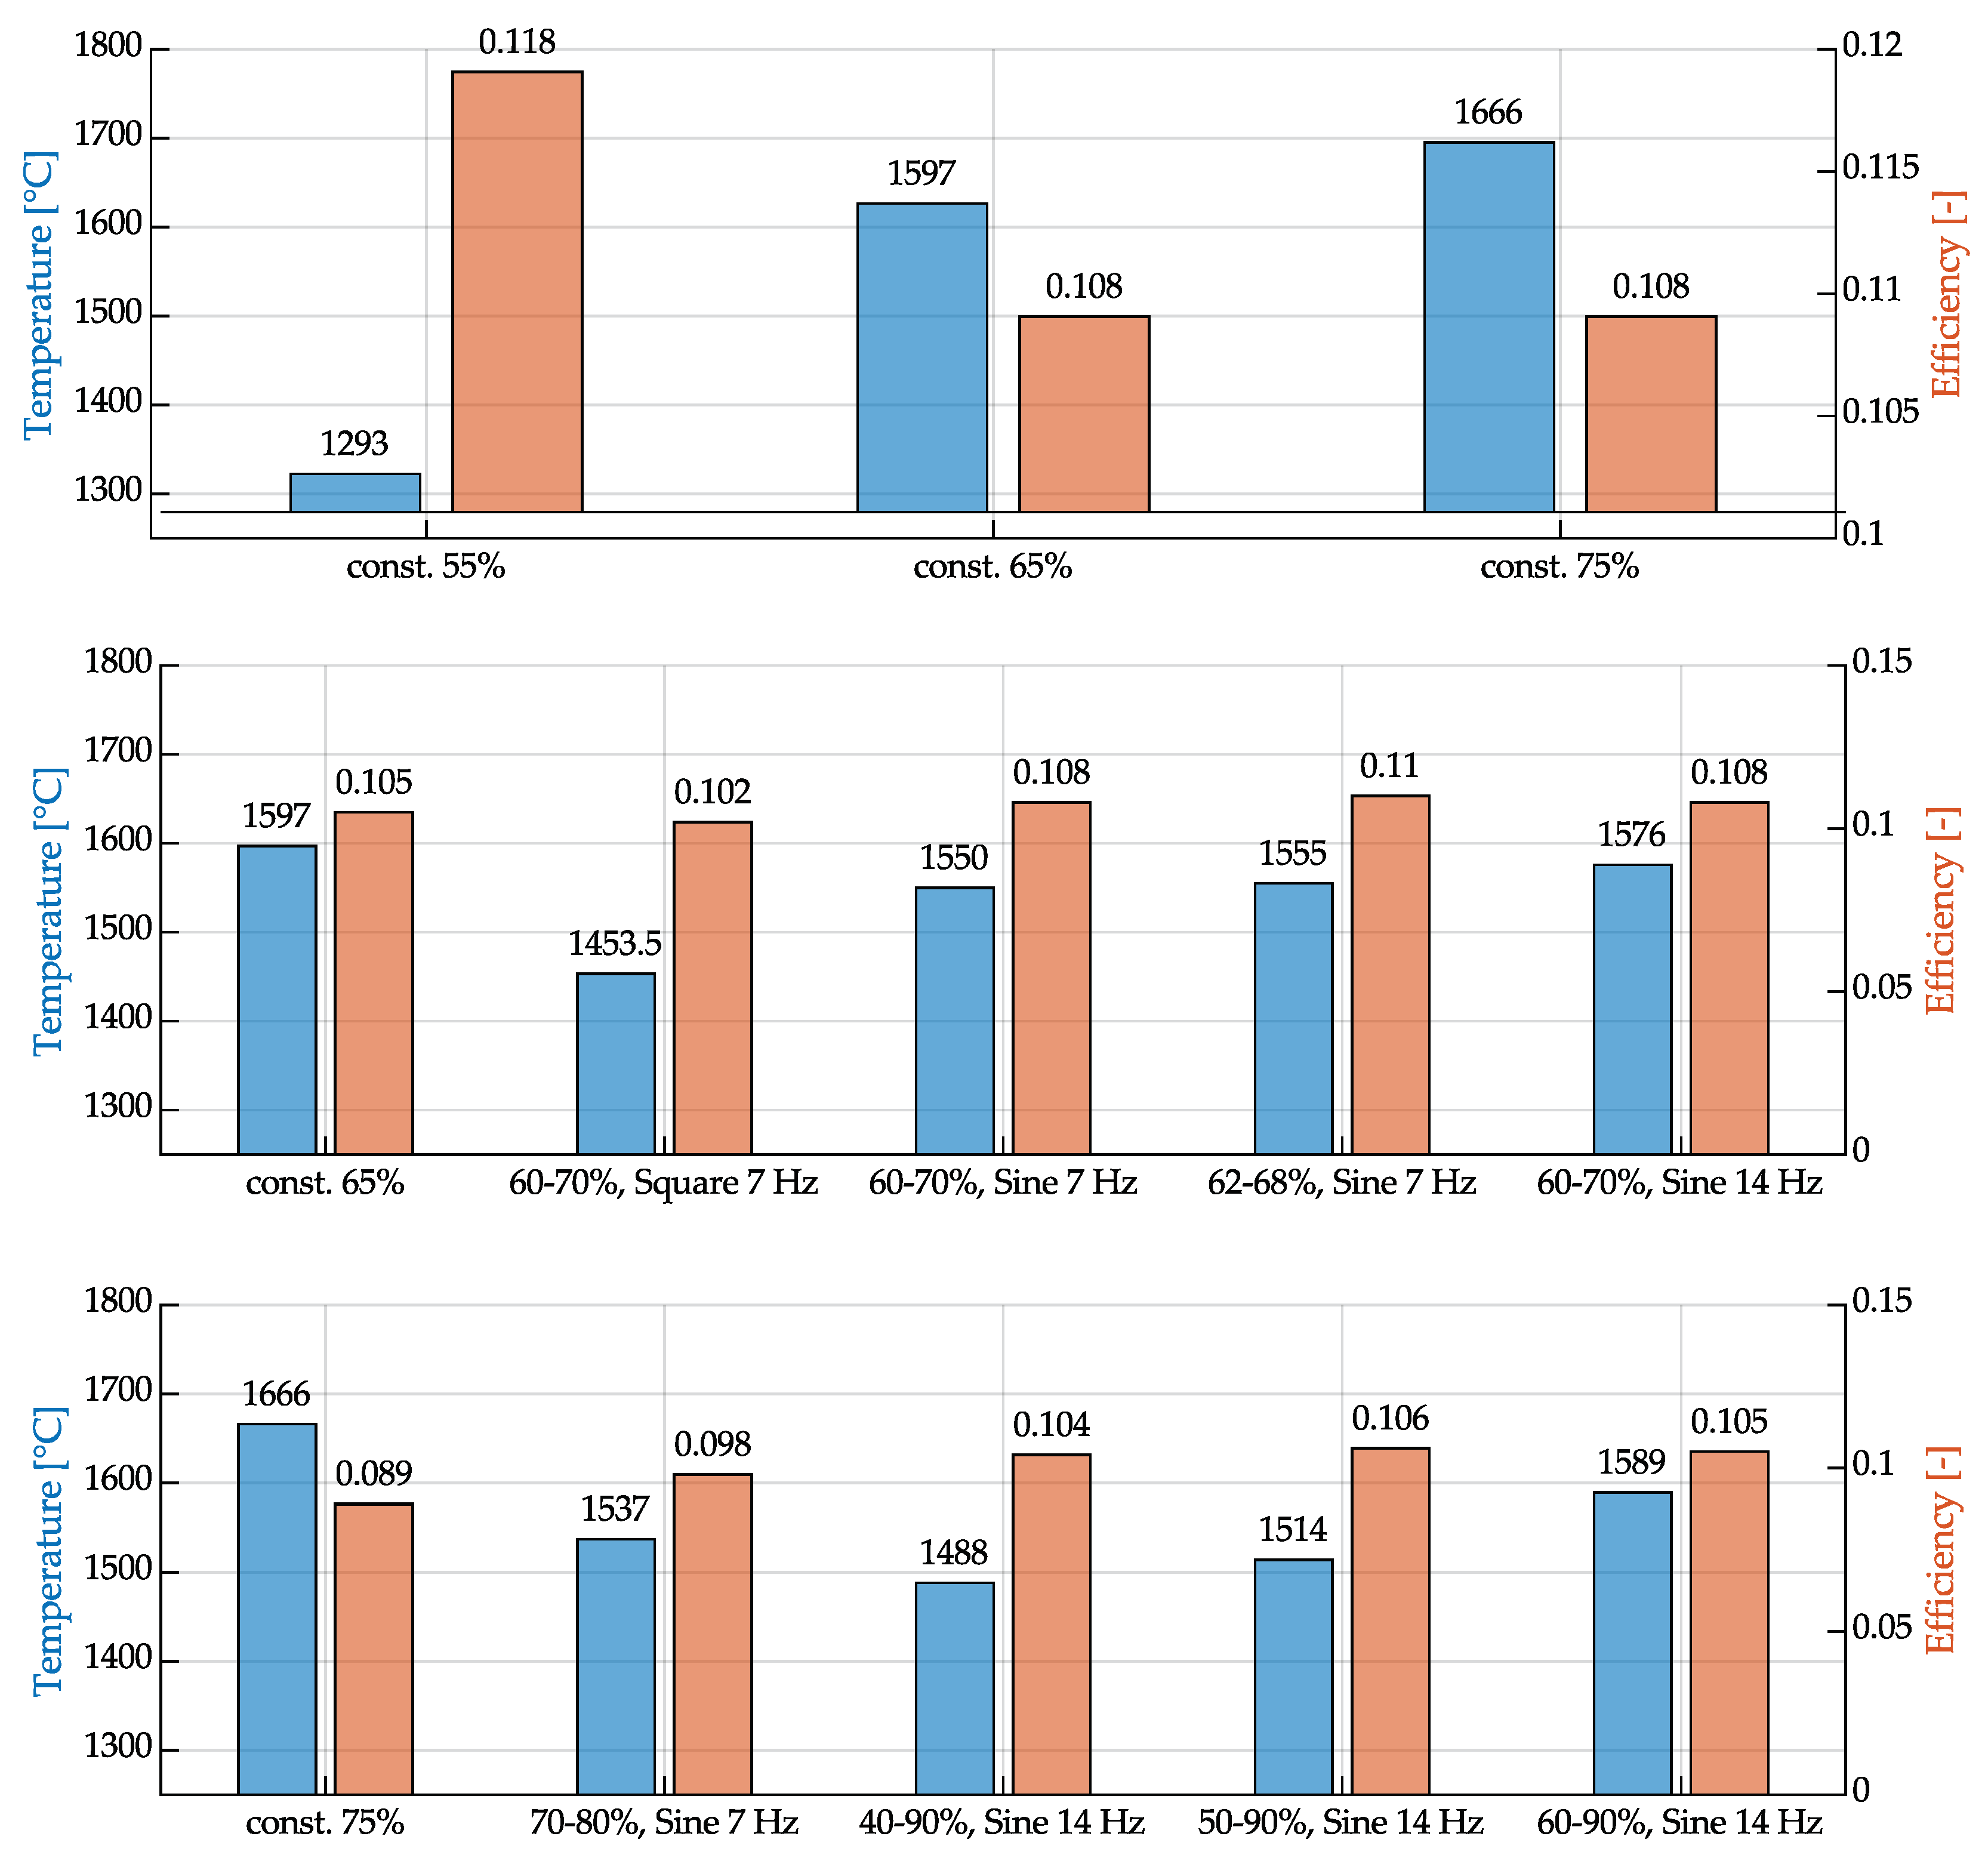
3.4. Droplet Temperature and Efficiency
4. Conclusions
Conflicts of Interest
References
- Wohlers, T.T.; Campbell, I.; Diegel, O.; Huff, R.; Kowen, J. Wohlers report 2022: 3D printing and additive manufacturing global state of the industry. Technical report, Wohlers Associates, 2022.
- Vafadar, A.; Guzzomi, F.; Rassau, A.; Hayward, K. Advances in Metal Additive Manufacturing: A Review of Common Processes, Industrial Applications, and Current Challenges. Applied Sciences 2021, 11, 1213. [Google Scholar] [CrossRef]
- Steenhuis, H.J.; Pretorius, L. Consumer additive manufacturing or 3D printing adoption: an exploratory study. Journal of Manufacturing Technology Management 2016, 27, 990–1012. [Google Scholar] [CrossRef]
- Bhavar, V.; Kattire, P.; Patil, V.; Khot, S.; Gujar, K.; Singh, R. A review on powder bed fusion technology of metal additive manufacturing. In Additive Manufacturing Handbook, 1st ed.; CRC Press, 2017; pp. 251–253. [CrossRef]
- Abd-Elaziem, W.; Elkatatny, S.; Abd-Elaziem, A.E.; Khedr, M.; Abd El-baky, M.A.; Hassan, M.A.; Abu-Okail, M.; Mohammed, M.; Järvenpää, A.; Allam, T.; Hamada, A. On the current research progress of metallic materials fabricated by laser powder bed fusion process: a review. Journal of Materials Research and Technology 2022, 20, 681–707. [Google Scholar] [CrossRef]
- Sing, S.L.; Yeong, W.Y. Laser powder bed fusion for metal additive manufacturing: perspectives on recent developments. Virtual and Physical Prototyping 2020, 15, 359–370. [Google Scholar] [CrossRef]
- Chowdhury, S.; Yadaiah, N.; Prakash, C.; Ramakrishna, S.; Dixit, S.; Gupta, L.R.; Buddhi, D. Laser powder bed fusion: a state-of-the-art review of the technology, materials, properties & defects, and numerical modelling. Journal of Materials Research and Technology 2022, 20, 2109–2172. [Google Scholar] [CrossRef]
- Kumar, S. Additive Manufacturing Solutions; Springer International Publishing: Cham, 2022. [Google Scholar] [CrossRef]
- Ding, D.; Pan, Z.; Cuiuri, D.; Li, H. Wire-feed additive manufacturing of metal components: technologies, developments and future interests. The International Journal of Advanced Manufacturing Technology 2015, 81, 465–481. [Google Scholar] [CrossRef]
- Gisario, A.; Kazarian, M.; Martina, F.; Mehrpouya, M. Metal additive manufacturing in the commercial aviation industry: A review. Journal of Manufacturing Systems 2019, 53, 124–149. [Google Scholar] [CrossRef]
- Rudnev, V.; Loveless, D.; Cook, R.L. Handbook of Induction Heating, 2nd editio ed.; CRC Press: Boca Raton, 2017. [CrossRef]
- Hofmann, C.; Frohlich, A.; Kimme, J.; Wiemer, M.; Otto, T. A Novel Method for Mems Wafer-Level Packaging: Selective and Rapid Induction Heating for Copper-Tin Slid Bonding. 2019 20th International Conference on Solid-State Sensors, Actuators and Microsystems and Eurosensors XXXIII, TRANSDUCERS 2019 and EUROSENSORS XXXIII, 2019. [CrossRef]
- Kräusel, V.; Fröhlich, A.; Kroll, M.; Rochala, P.; Kimme, J.; Wertheim, R. A highly efficient hybrid inductive joining technology for metals and composites. CIRP Annals 2018, 67, 5–8. [Google Scholar] [CrossRef]
- Kimme, J.; Zeisig, J.; Fröhlich, A.; Kräusel, V. Technology Innovation for the Manual Laser Cladding of High-Alloy Tool Steels. Metals 2021, 11, 1820. [Google Scholar] [CrossRef]
- Vega, E.J.; Cabezas, M.G.; Muñoz-Sánchez, B.N.; Montanero, J.M.; Gañán-Calvo, A.M. A novel technique to produce metallic microdrops for additive manufacturing. International Journal of Advanced Manufacturing Technology 2014, 70, 1395–1402. [Google Scholar] [CrossRef]
- Fang, X.; Du, J.; Wei, Z.; Wang, X.; He, P.; Bai, H.; Wang, B.; Chen, J.; Geng, R.; Lu, B. Study on Metal Deposit in the Fused-coating Based Additive Manufacturing. Procedia CIRP 2016, 55, 115–121. [Google Scholar] [CrossRef]
- Du, J.; Wei, Z.; Wang, X.; Fang, X.; Zhao, G. A novel high-efficiency methodology for metal additive manufacturing. Applied Physics A 2016, 122, 945. [Google Scholar] [CrossRef]
- Jayant, H.; Arora, M. Induction Heating Based 3D Metal Printing of Eutectic Alloy Using Vibrating Nozzle; Vol. 975, Springer International Publishing, 2020; pp. 108–118. [CrossRef]
- Sharma, G.K.; Pant, P.; Jain, P.K.; Kankar, P.K.; Tandon, P. On the suitability of induction heating system for metal additive manufacturing. Proceedings of the Institution of Mechanical Engineers, Part B: Journal of Engineering Manufacture 2021, 235, 219–229. [Google Scholar] [CrossRef]
- Sharma, G.K.; Pant, P.; Jain, P.K.; Kankar, P.K.; Tandon, P. Analysis of novel induction heating extruder for additive manufacturing using aluminum filament. Proceedings of the Institution of Mechanical Engineers, Part B: Journal of Engineering Manufacture 2021, 235, 1961–1970. [Google Scholar] [CrossRef]
- Englert, L.; Klumpp, A.; Ausländer, A.; Schulze, V.; Dietrich, S. Semi-solid wire-feed additive manufacturing of AlSi7Mg by direct induction heating. Additive Manufacturing Letters 2022, 3, 100067. [Google Scholar] [CrossRef]
- Hascoët, J.Y.; Parrot, J.; Mognol, P.; Willmann, E. Induction heating in a wire additive manufacturing approach. Welding in the World 2018, 62, 249–257. [Google Scholar] [CrossRef]
- Sun, R.; Shi, Y.; Wang, X.; Guo, Y.; Zhou, X. Understanding the thermal process during laser assisted ultra-high frequency induction deposition with wire feeding. International Journal of Heat and Mass Transfer 2020, 153, 119536. [Google Scholar] [CrossRef]
- Sun, R.; Shi, Y.; Yang, Y.; Wang, X.; Zhou, X. Microstructure, element segregation and performance of Inconel 625 metal layer deposited by laser assisted ultra-high frequency induction deposition. Surface and Coatings Technology 2021, 405, 126715. [Google Scholar] [CrossRef]
- Kimme, J.; Fröhlich, A.; Kroll, M.; Kräusel, V. Novel Process Approach for Additive Manufacturing Using Inductive Wire Melting by Forced Droplet Detachment. BHM Berg- und Hüttenmännische Monatshefte 2023. [CrossRef]
- Kimme, J.; Gruner, J.; Fröhlich, A.; Kroll, M. Study of an additive manufacturing technology using pulsed inductive wire melting. International Journal of Applied Electromagnetics and Mechanics 2024, pp. 1–12. [CrossRef]
- Praveen, P.; Yarlagadda, P.; Kang, M. Advancements in pulse gas metal arc welding. Journal of Materials Processing Technology 2005, 164-165, 1113–1119. [Google Scholar] [CrossRef]
- Haelsig, A.; Kusch, M.; Mayr, P. Calorimetric analyses of the comprehensive heat flow for gas metal arc welding. Welding in the World 2015, 59, 191–199. [Google Scholar] [CrossRef]
- Malin, V.; Sciammarella, F. Controlling heat input by measuring net power. Welding journal 2006, 85, 44–50. [Google Scholar]
- JMatPro. v. 6.1, 2010. Sente Software Ltd., Guildford, UK.
- Rasband, W. ImageJ. v. 1.54f, 2023.
- Matlab. v. 2023b, 2023. MathWorks, Inc., Natick, MA. Natick.
- Benkowsky, G. Induktionserwärmung, 5. auflage ed.; Verl. Technik: Berlin, 1990; p. 259.
- Nacke, B.; Baake, E. Induktives Erwärmen: Wärmen, Härten, Glühen, Löten, Schweißen, 1. edition ed.; Vulkan-Verlag GmbH: Essen, 2013; p. 276.





| Authors | Year | Material | Melting temperature |
Wire diameter | Frequency | Power | Wire feed rate |
|---|---|---|---|---|---|---|---|
| [°C] | [mm] | [kHz] | [kW] | [m/min] | |||
| Vega et al. [15] | 2014 | Sn95Ag4Cu1 | 217 | 1.5 | 750...1150 | 1.68...2.13 | 0.84...1.8 |
| Fang et al. [16] | 2016 | Sn63Pb37 | 183 | n.a. | n.a. | 0.7 | n.a. |
| Hascoët et al. [22] | 2018 | 316L | 1450 | n.a. | n.a. | 4.5 | 0.1...0.12 |
| Jayant et al. [18] | 2020 | Sn99Cu1 | 227 | n.a. | 166 | 0.15 | n.a. |
| Sun et al. [23] | 2020 | Inconel 625 | 1350 | 2.0 | 700...800 | n.a. | 0.72 |
| Sharma et al. [19] | 2021 | AlSi5 | 632 | 1.6 | 100 | 1 | 0.12 |
| Englert et al. [21] | 2022 | AlSi7Mg | 625 | 1.2 | 1500 | 10...12 | 0.9...1.4 |
| C | Si | Mn | P | S | Ni | Cr | Mo | V | Cu | Al | Ti+Zr |
|---|---|---|---|---|---|---|---|---|---|---|---|
| 0.06...0.14 | 0.7...1.0 | 1.3...1.6 | 0.025 | 0.025 | 0.15 | 0.15 | 0.15 | 0.03 | 0.35 | 0.02 | 0.15 |
Disclaimer/Publisher’s Note: The statements, opinions and data contained in all publications are solely those of the individual author(s) and contributor(s) and not of MDPI and/or the editor(s). MDPI and/or the editor(s) disclaim responsibility for any injury to people or property resulting from any ideas, methods, instructions or products referred to in the content. |
© 2024 by the authors. Licensee MDPI, Basel, Switzerland. This article is an open access article distributed under the terms and conditions of the Creative Commons Attribution (CC BY) license (http://creativecommons.org/licenses/by/4.0/).


