2.1. Technical Requirements and Specifications
The FRs within the RESCUER project [
27] have defined a number of technical requirements that are exploited to define the specifications of the candidate tool and allow us to select the most suitable sub-systems for this purpose, e.g., radar sensor, Single Board Computer (SBC), etc. The technical requirements are the following. The tool (i) should have a bootup time of less than 60 s (from turning on to first sensor readout), (ii) should be turned on and off by the user, (iii) could have a battery life of at least 45 minutes. Regarding these requirements, there is a need to attain a bootup time of less than 60 seconds (from turning on to the first sensor readout), as time-saving in a search-and-rescue operation is critical. Next, the tool needs to be turned on and off by the user, which is important for the FRs as it can provide data on demand, minimizing in this way the non-useful information as well as the energy consumption of the tool, which can be critical during a search and rescue operation. The battery life is required to be at least 45 minutes, which is considered sufficient for a search and rescue operation, given the fact that the batteries can last more than 45 minutes and their change with backup ones is convenient.
To satisfy these requirements, we exploited a radar sensor, the corresponding firmware and software needed to communicate and save the data using the proper format in the computing machine, e.g., NVIDIA Jetson Nano [
30], as well as the algorithms for detecting the victim’s presence and his/her vital signs. Moreover, regarding the tool’s capabilities, it needs to operate efficiently even when large obstacles or walls between the radar and the victim are present. These walls and obstacles are expected to be built with materials that allow the penetration of signal, e.g., brick and wood (which covers the majority of domestic structures). Further, the effective range of observation can be up to 9 m, considering an unobstructed view, using a resolution of ~5 cm, which is sufficient to detect the human’s chest movement and obtain the breathing pattern. It is worth mentioning that the attainable range of observation strongly depends on the obstacle’s thickness, material, and density and is expected to be smaller when an obstacle is present compared to the free space case. Another critical capability is the collection time, which is the time that the sensor needs to collect measurements in order to deliver reliable results. In the proposed solution, this time is set to 20 seconds.
In the next
Section 2.2, we discuss the relevant tools proposed in the literature as well as the commercially available solutions, while in
Section 2.3, we present the developed method and the two datasets collected for the purposes of the current study.
2.2. Related Work, Existing Tools and Capabilities
In the previous work in [
26], we reviewed the most relevant commercially available tools and literature-proposed methods for the detection of victims behind walls and large obstacles. In particular, [
26] summarizes the operational characteristics, the algorithms employed, as well as the capabilities of a) UWB-based solutions, b) through-the-wall imaging (TWI) methods, and c) available products.
From [
26], it can be derived that the main tasks that the UWB radar-based solutions can address are five: the estimation of the breathing rate and heart rate, the distance between the victim and the radar, the number of humans within the scanned area, and the designation of human presence or absence. In these solutions, the most examined metric is the breathing rate, and for this purpose, the UWB radar sensor is the most favorable solution. To derive the target quantities, radars with an emission frequency of 0.4 GHz or within the range of 7-10 GHz were exploited. The former frequency allows for efficient detection of the breathing rate, heart rate, and distance from the victim, penetrating thick walls up to 1 m, while the latter frequency can operate efficiently behind walls of up to 40 cm thickness. For the extraction of the breathing and heart rate, the frequency domain was selected from the majority of the methods, as using Fast Fourier Transform (FFT), the breathing rate can be extracted simply by selecting the dominant frequency and multiplying it by 60. For longer distances or in cases with low signal-to-noise-ratio, e.g., due to higher signal attenuation from a denser wall, more sophisticated algorithms need to be employed, such as arctangent demodulation, ensemble empirical mode decomposition-based frequency accumulation method, discrete wavelet transform, convolutional neural networks, and variable mode decomposition. All these methods have attained very high accuracy in all tasks that they addressed. However, they have been tested in a limited number of scenarios, e.g., behind specific walls and in a limited number of humans. For this reason, there is a strong need to validate those methods in a significantly larger number of scenarios and human subjects by including humans with different characteristics, such as breathing patterns, weight, height, etc. In addition, a very small number of openly accessible datasets is available, e.g., one in [
16], and for this reason, a significant number of datasets needs to be published in open access, such as the collected for the purposes of current work in [
29], to give the opportunity to all researchers around the globe to work on the very important task of human detection behind large obstacles, walls and debris. Further, more sophisticated algorithms, such as Deep Learning methods, need to be considered in order to detect humans and their vital signs, especially in cases of low signal-to-noise ratio (longer distances, denser walls, etc.).
A broad gamut of products is also available in the market. The comparative analysis in [
26] has revealed that most of them are bulky and heavy (more than 3 kilos and more than 30 cm), rendering them difficult to deploy. This is a limiting factor in search and rescue operations that need to be completed in a very short time interval, e.g., a case of fire. Further, the penetration capability of these tools is at least 30 cm for standard building materials, such as brick, concrete, wood, etc. Moreover, the majority of radar sensors possess the ability to transmit signals in the Super High Frequency (SHF) spectrum. A significant drawback is that some of these products are impacted by motion within 15 meters from the sensor, e.g., due to the FRs, wind-blown grass, overhead trees, or debris, and this type of motion must be minimized to obtain reliable results. Further, the outputs of these solutions can vary from simply designating human presence to estimating his/her breathing rate.
2.3. Proposed Tool and Solution
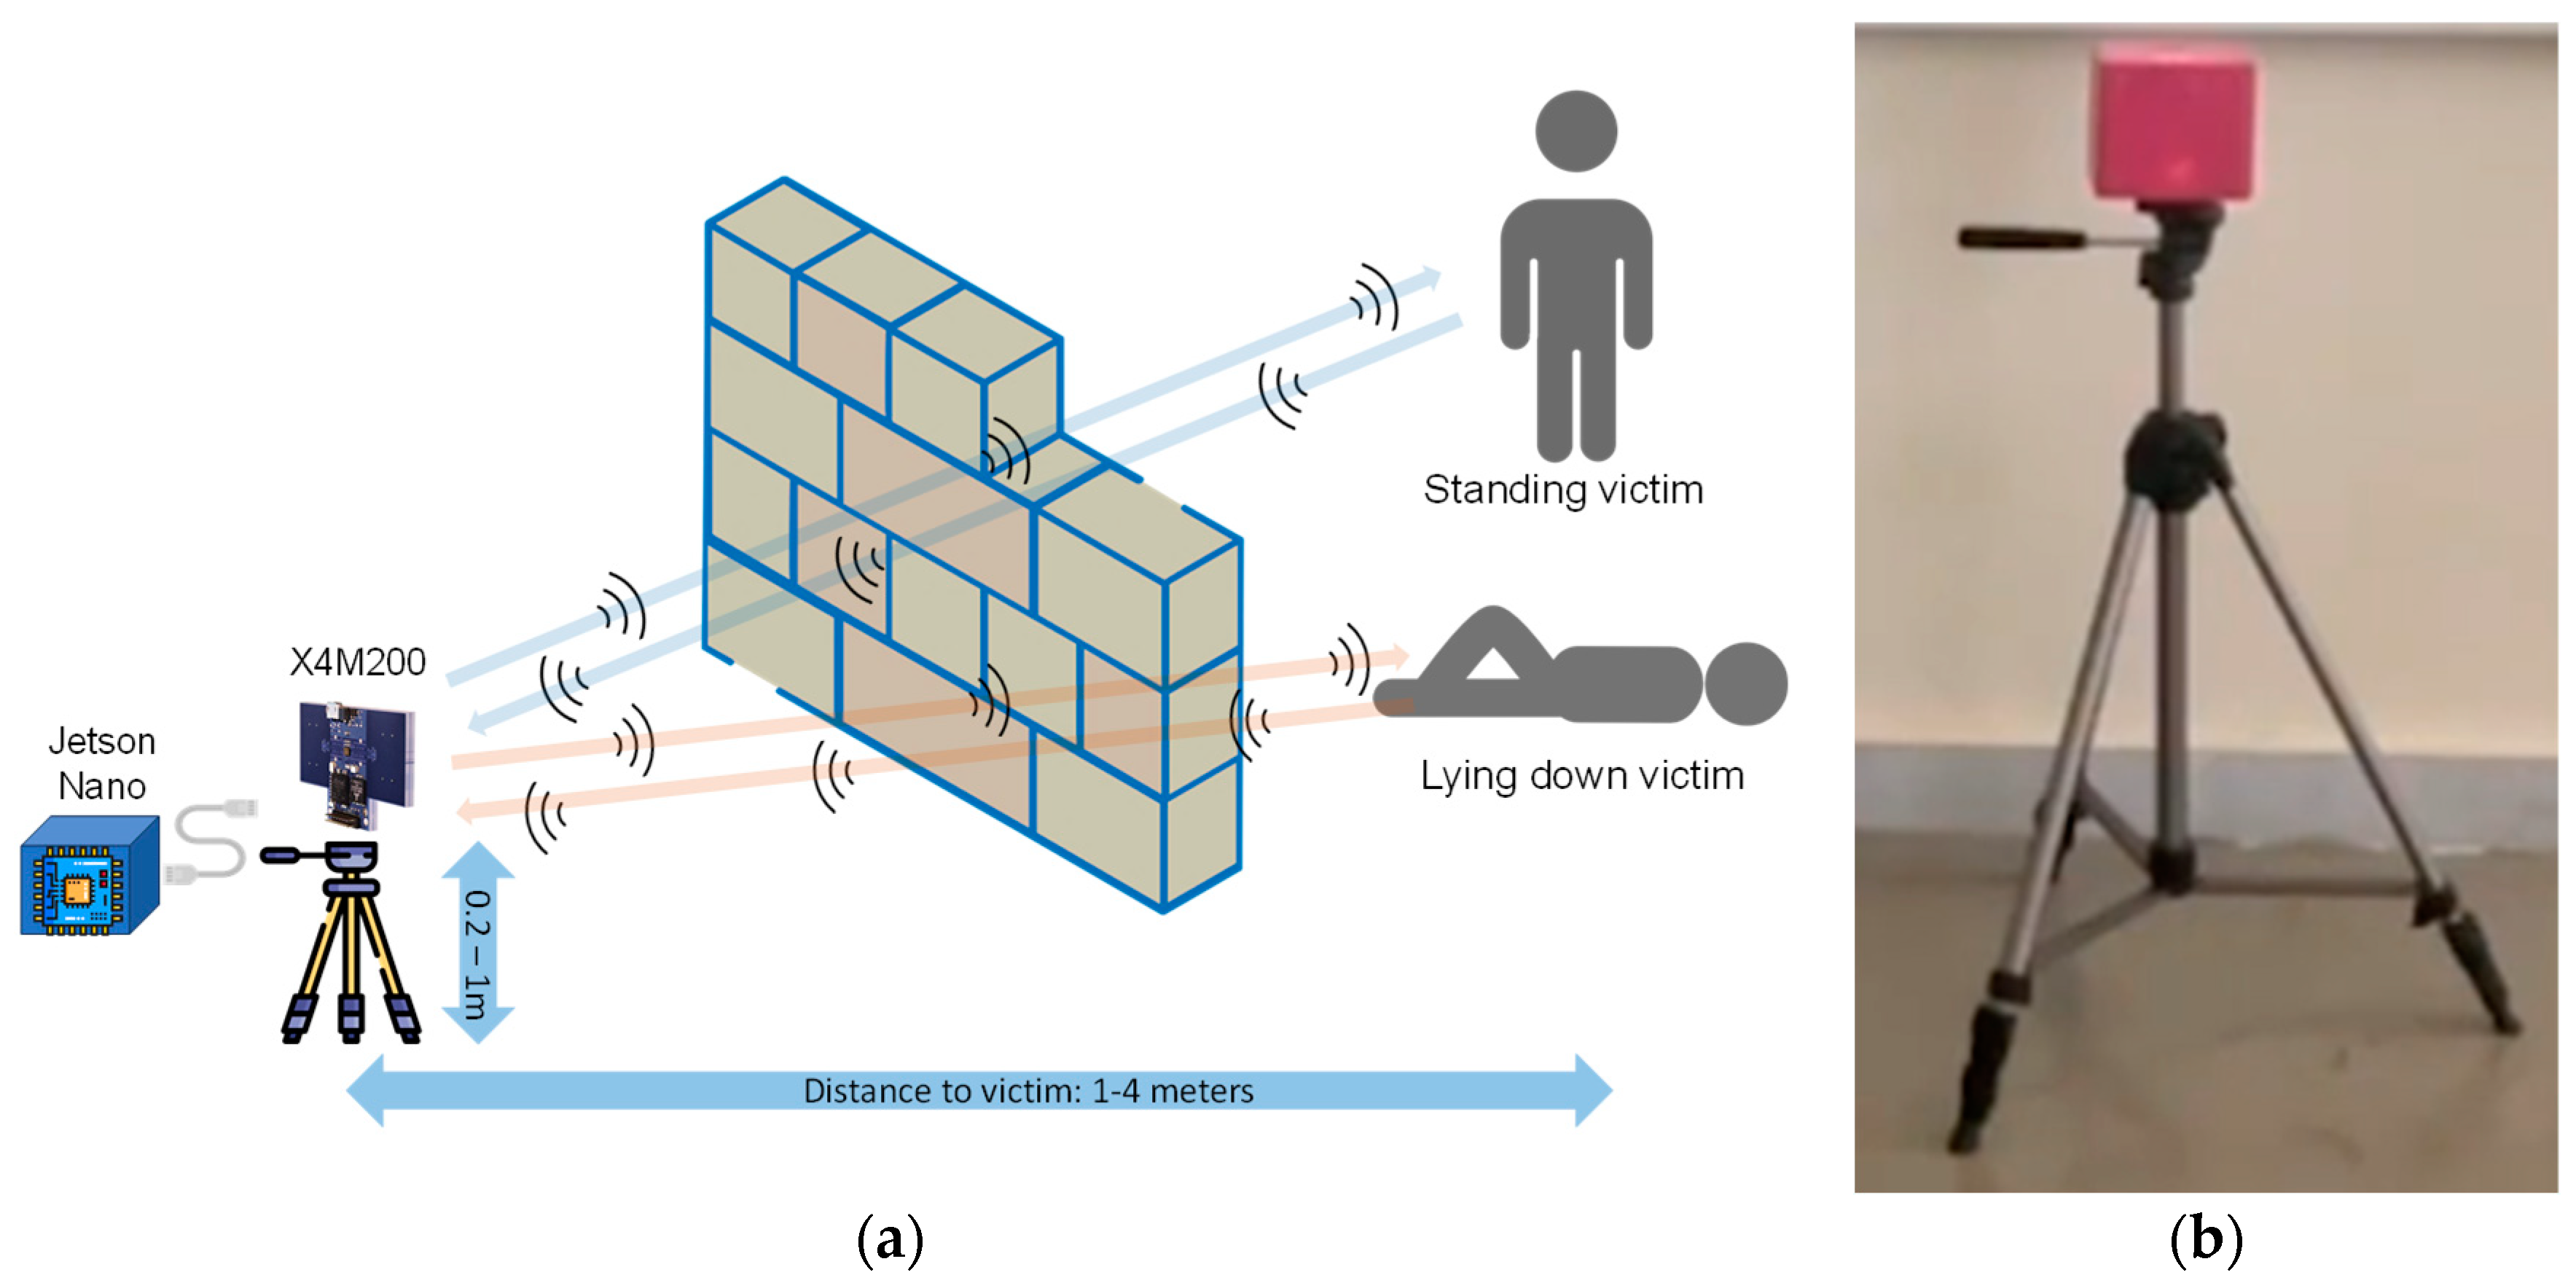
Based on the conclusions derived in the previous sub-section, we developed a method that exploits the X4M200 UWB radar sensor [
28] to collect data and the NVIDIA Jetson Nano [
30] to store and locally process it, providing the victim detection and metrics that are requested by the FR teams of the RESCUER project. In the previous works of [
15,
16], we have concluded that the optimal radar height for the detection of standing victims is 1 m in order to face the human’s chest directly, while in the case of lying down victims, the optimal height is 20 cm and the radar should be facing the wall. Moreover, in this study, the radar is placed between 20 and 50 cm from the wall, and the wall’s material is Ytong, which is a lightweight, precast, and cellular concrete building material. The two cases of interest are pictorially described in
Figure 1. A video demonstrating the tool and its capabilities can be found in [
31].
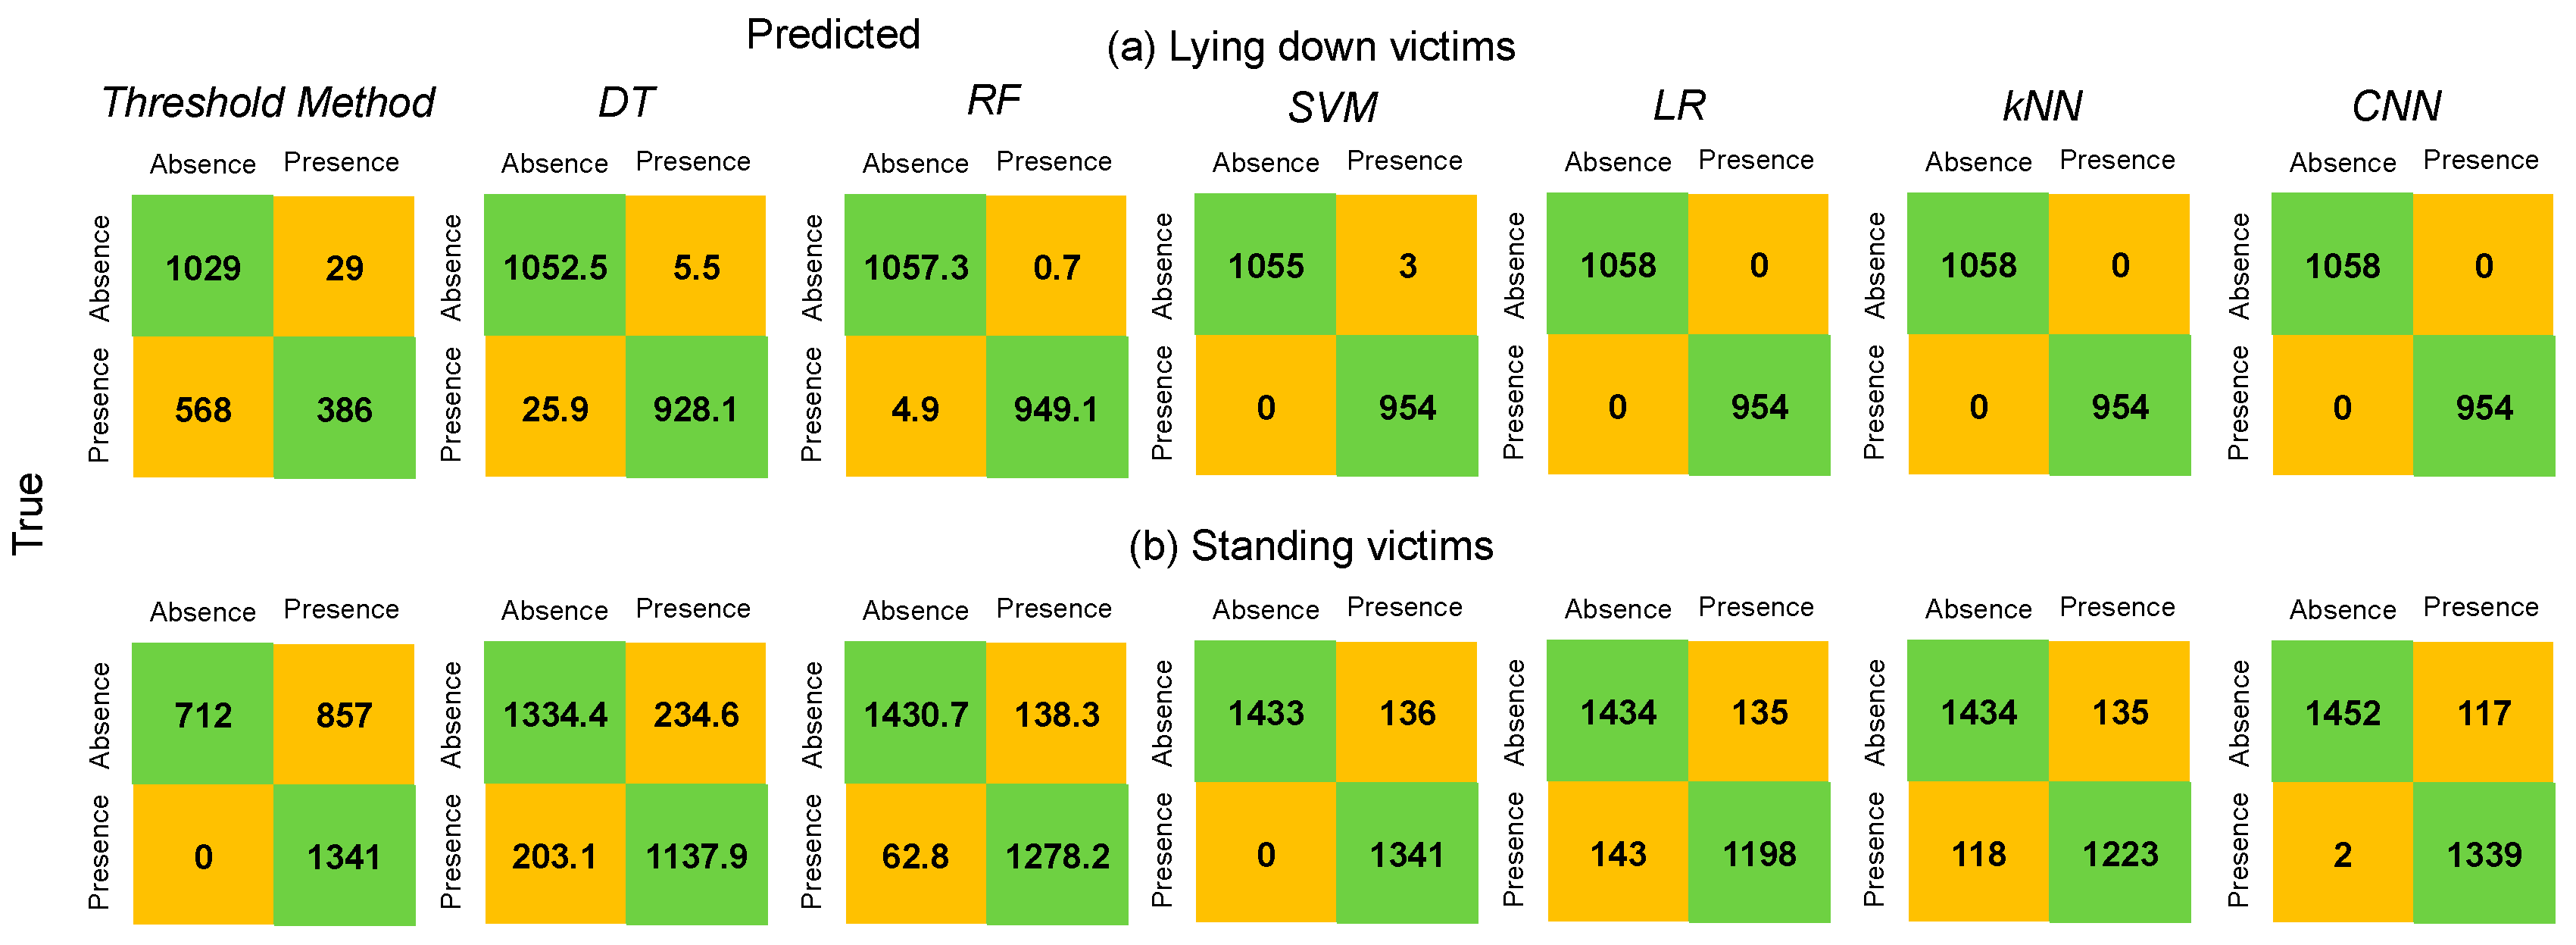
The work presented extends [
15,
16], as it incorporates ML methods to increase the accuracy of estimations, especially in the case of lying down position, where the accuracy in true positive (estimated human presence when a human was present within the area of observation) and true negative (estimated human absence when a human was absent from the area of observation) cases was 95% and 70%, respectively. In addition, the estimation of the distance between the human and the radar is erroneous using the method of [
16], as in the case of lying down victims, the signal is very weak due to the higher attenuation, and more sophisticated methods, like the ML methods considered here, need to be employed.
Two datasets were collected to validate the accuracy of the proposed approach. The first includes data recorded from standing humans positioned behind a wall of 30 cm thickness, and the second incorporates data gathered from lying down humans positioned behind a wall 20 cm thick and distant from the radar between 1 and 4 m. In both datasets, the BioHarness Zephyr 3 belt [
32] that estimates the breathing rate of the victims was exploited in order to enrich the provided dataset with additional data, i.e., the ground truth measurements of the breathing rate in each data collection session, with the aim of being more useful to the research community in future endeavors. Each session lasted about 90 seconds, and the belt provided the breathing rate every second. To obtain reliable measurements, we averaged the breathing rate after the first 60 seconds to acquire a single value for all samples of the same data collection session. Next, the human was moved 0.5 m away from its current position to gather data from the next session. This procedure was followed until the human reached a 4 m distance from the radar, allowing the acquisition of data from a total of 7 sessions (from 1 to 4 m). The details of the dataset with the lying down persons are tabulated in
Table 1, and the details of the dataset of standing persons are tabulated in
Table 2. In both cases, all samples include data of 20-sec duration, exploiting an overlap of 15 sec over the 20-sec window in order to increase the number of available samples. We can observe that, in both datasets, the breathing rates span over a wide range, with a lower limit of approximately 6.8 breaths per minute and an upper limit of approximately 22 breaths per minute. Additionally, we collected a number of data from the same places without any human presence to train our algorithms to detect both human presence and absence efficiently. In particular, the number of samples without human presence is 1569 for the dataset including standing persons, and 1058 for the dataset incorporating lying down persons.
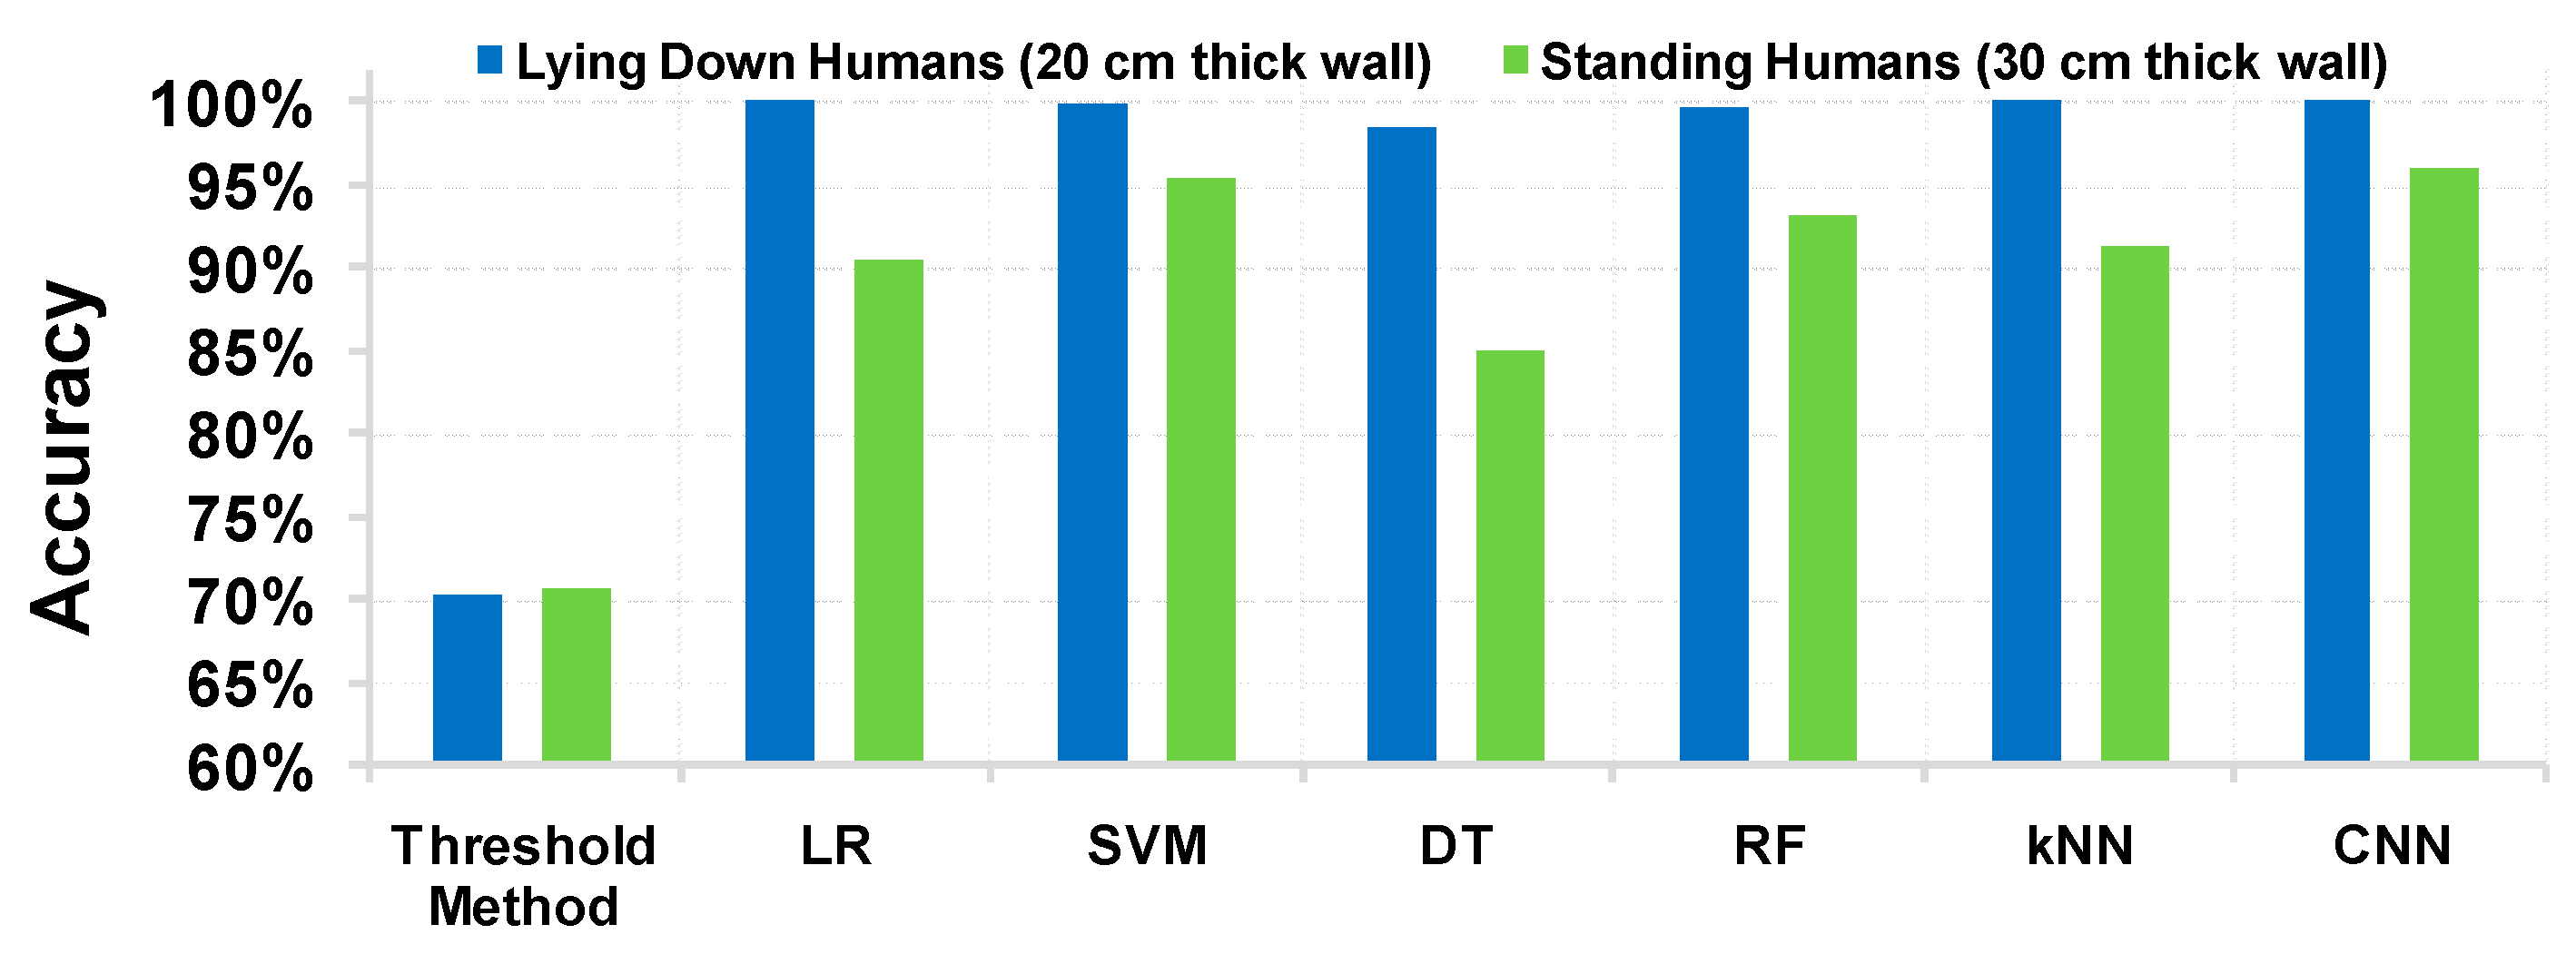
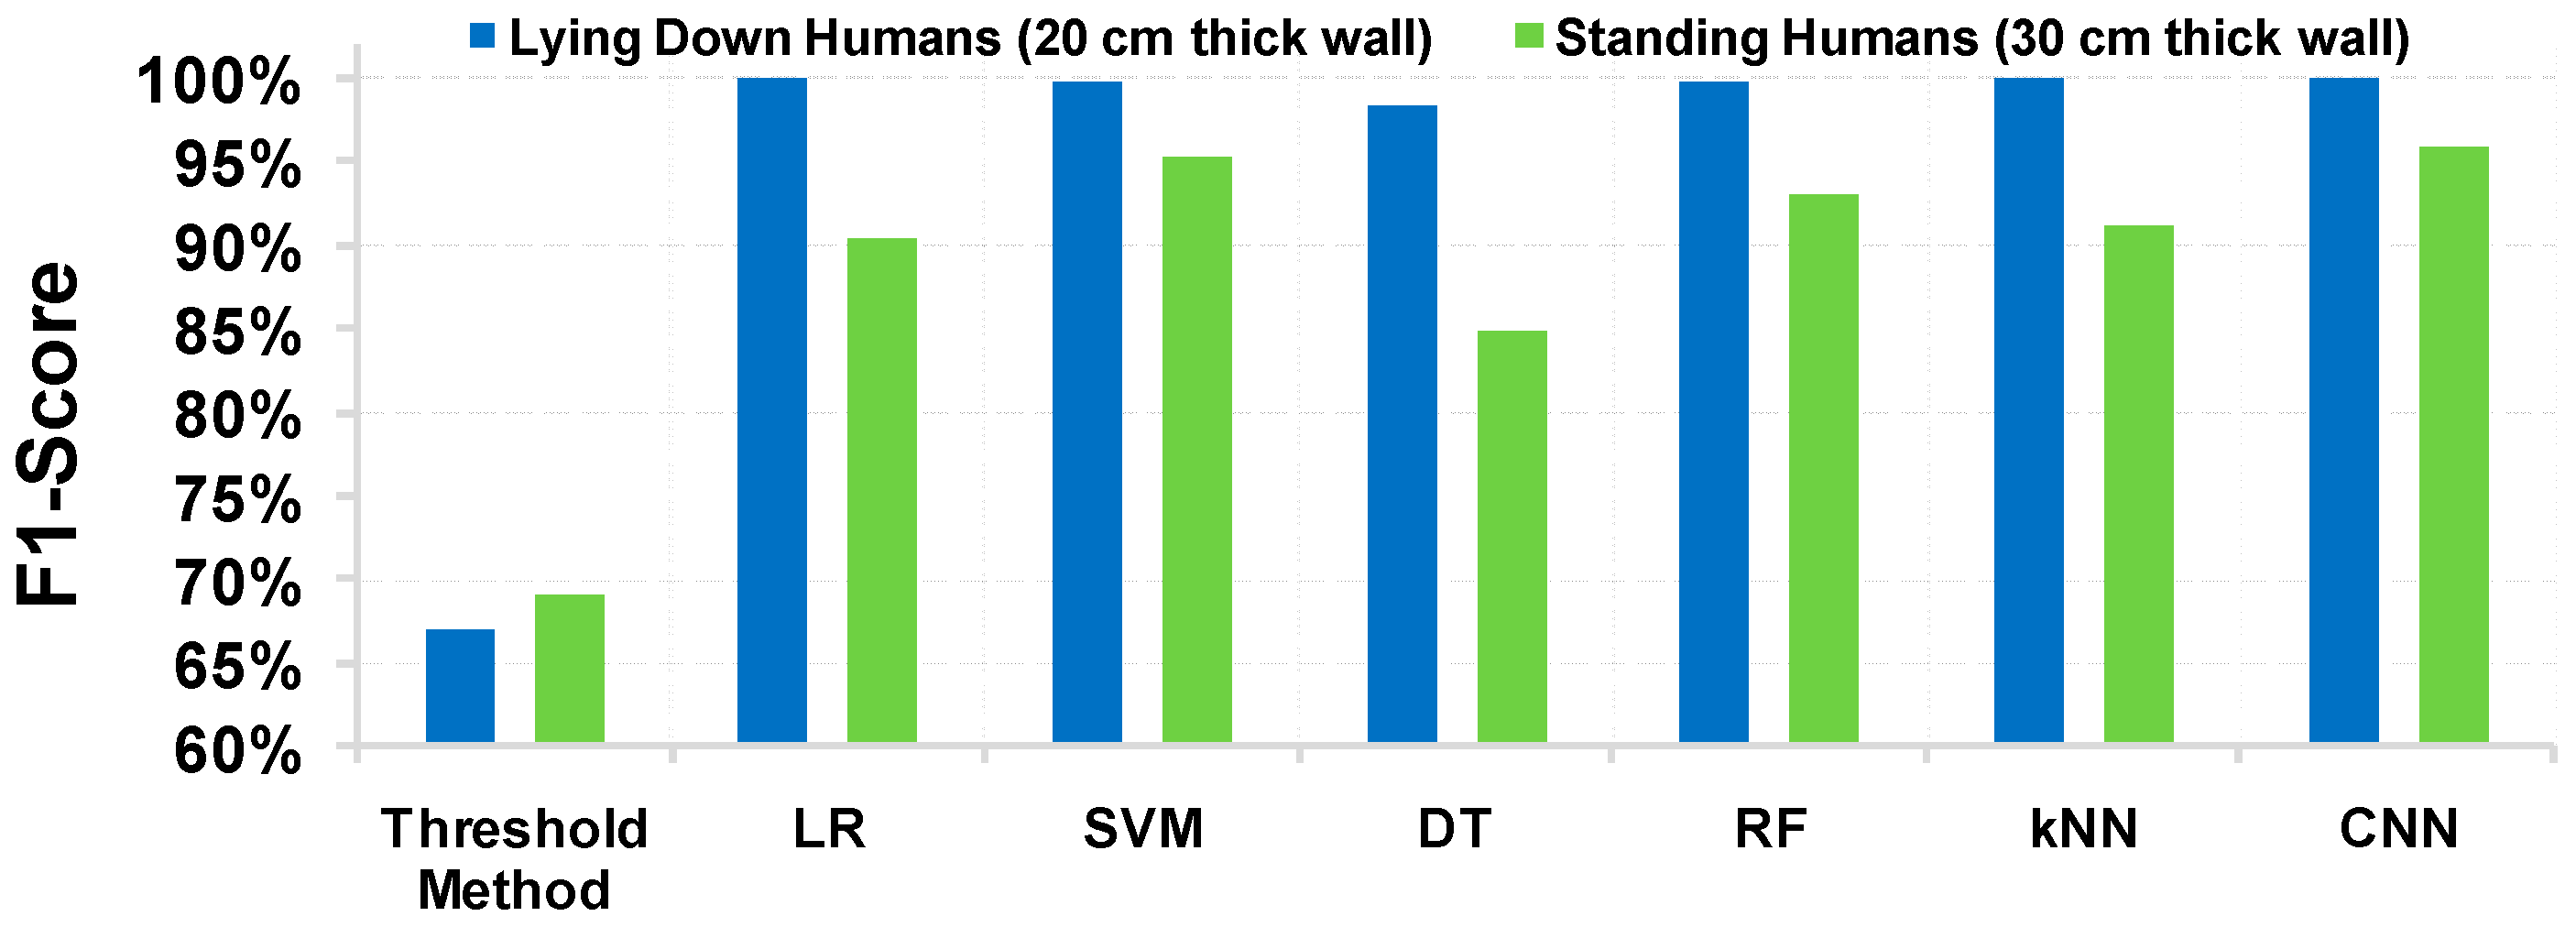
For the human presence detection, we examined six ML algorithms of different computational complexity (Logistic Regression (LR), Support Vector Machine (SVM), Decision Tree (DT), Random Forest (RF), k Nearest Neighbors (kNN), Convolutional Neural Network (CNN)) and an analytical method, named as “threshold method”, as in [
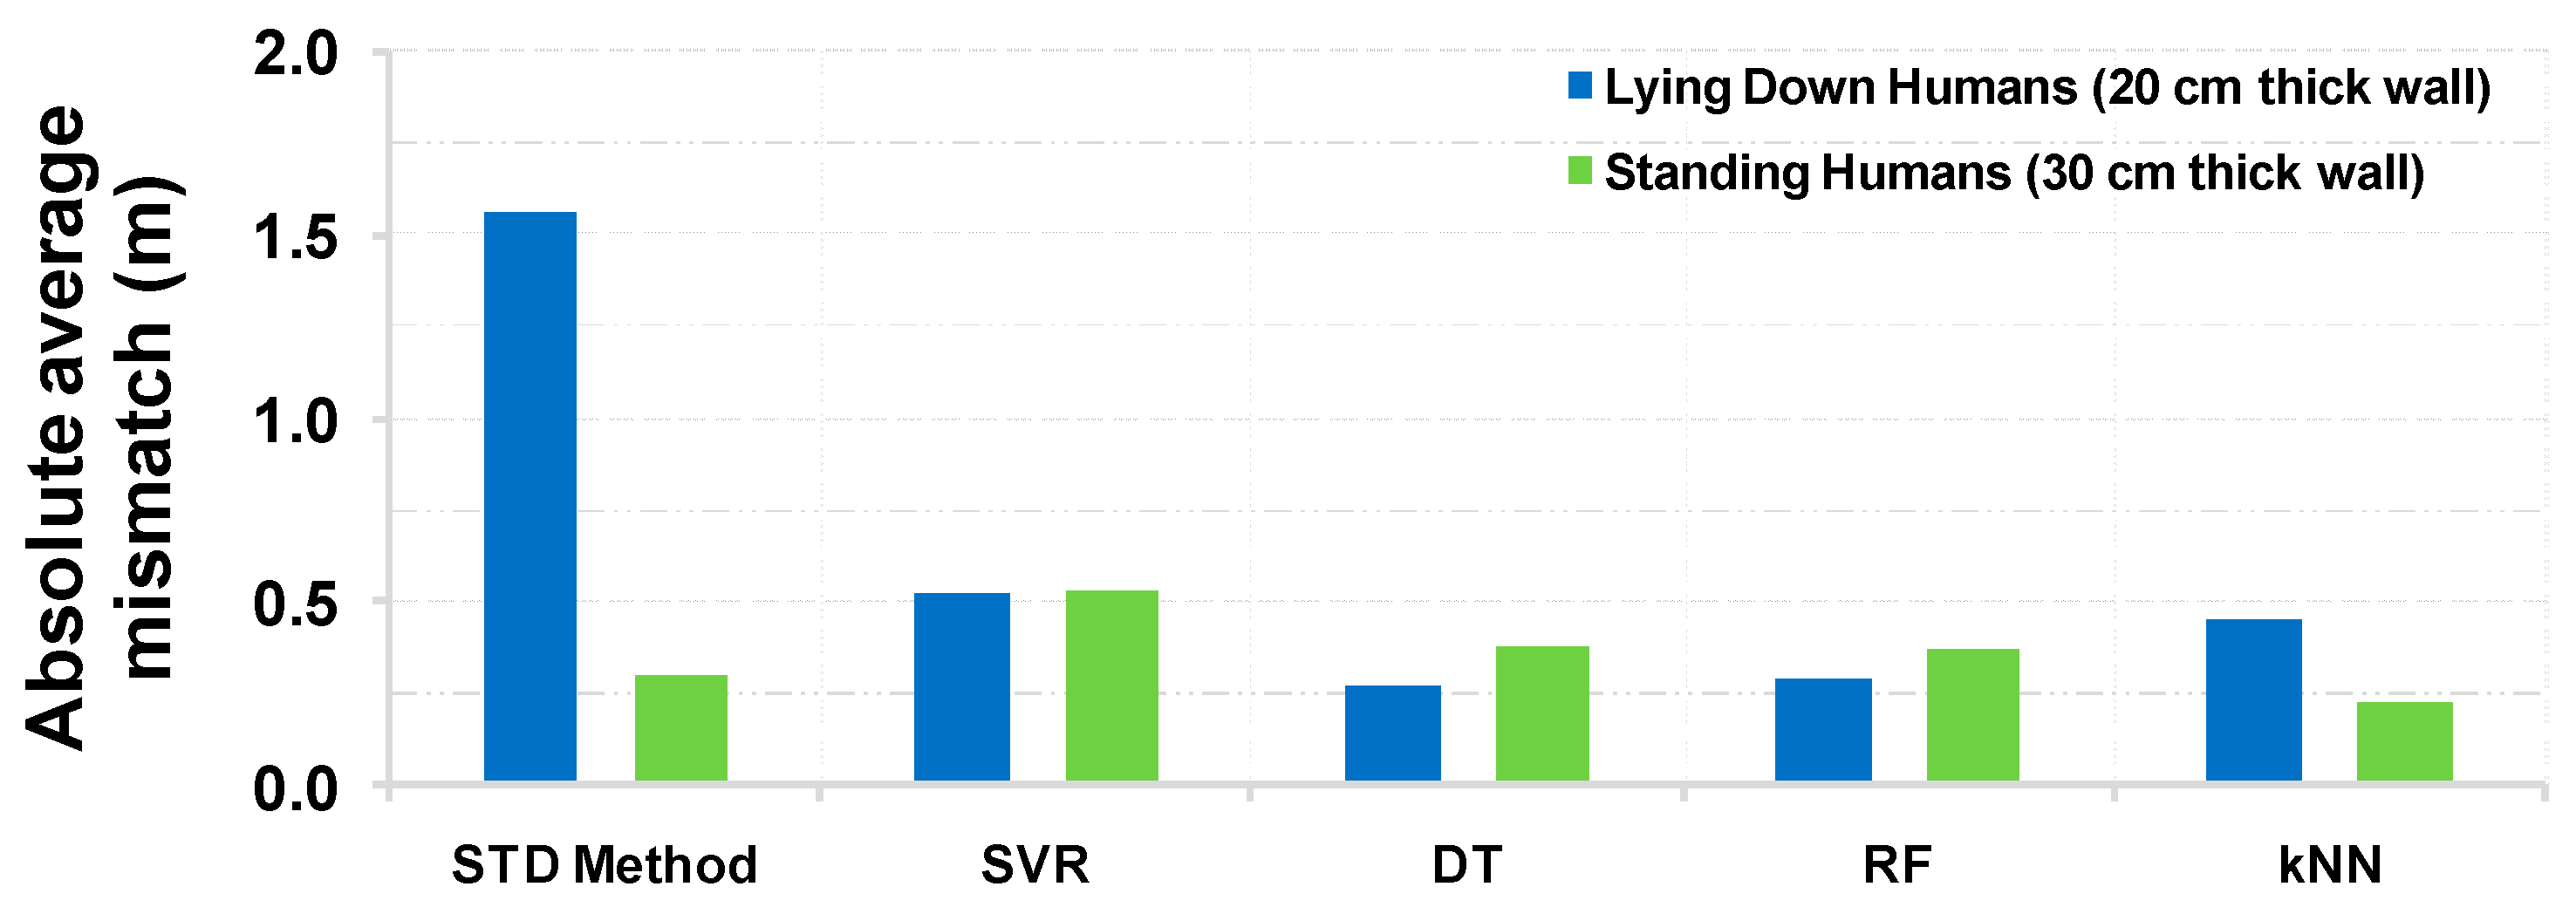
16], in which a threshold was set and compared with the average standard deviation of each sample as follows. If the average standard deviation clears the pre-set threshold, it can designate a human presence as a result of the torso movement due to breathing. On the other hand, when no victim is present, the average standard deviation is expected to be low and human absence is considered. For the distance estimation, four ML algorithms are also examined: Support Vector Regression (SVR), DT, RF, kNN and a low complexity method that is edge deployable, hereinafter named “std method”, which designates presence in the distance with the highest standard deviation.
To feed the ML methods (except CNN), we examined the impact of ten time-dependent features, namely (a) maximum value, (b) minimum value, (c) average value, (d) median value, (e) standard deviation, (f) kurtosis, (g) skewness, (h) number of zero crossings (for normalized signal), (i) 25% percentile and (j) 75% percentile, and only the feature standard deviation was selected, as the other nine were not able to provide any significant improvement in the prediction accuracy. The standard deviation was computed for each distance, reducing the dimension of each input sample from 340 x 109 to 1 x 10⁹. The value 109 denotes the distances in each sample as the detection range is between 0.5 and 6 m, considering a distance step of about 0.05144 m, and 340 samples in time, for a sample rate of 17 samples per second.
Next, for the training of the CNN for both presence and distance detection as well as for the training of the other five ML methods for presence detection, the radar sensor’s values in each distance were normalized by subtracting the mean value and dividing by the standard deviation as:
where
Si denotes the
ith sample of the radar sensor (e.g., in a specific distance),
Zi is its normalized representation and
μ and
σ denote their mean and standard deviation values, respectively. A custom-built CNN was developed to solve the victim detection problem; After a random hyperparameter search, the proposed CNN consists of the following layers:
layer 1: 16 convolutional filters with a size of (1,25). This is followed by a ReLU activation function, a (4,4) strided max-pooling operation and a dropout probability equal to 0.5.
layer 2: 24 convolutional filters with a size of (1,20). Similar to the first layer, this is followed by a ReLU activation function, a (4,4) strided max-pooling operation and a dropout probability equal to 0.5.
layer 3: 32 convolutional filters with a size of (3,7). The 2D convolution operation is followed by a ReLU activation function, a 2D global max-pooling operation and a dropout probability equal to 0.5.
layer 4: 2 fully connected hidden units, followed by a sigmoid activation function.
Finally, during the data analysis for (i) presence detection and (ii) distance detection, which includes the data processing and the training and evaluation of ML methods, we used Python as the programming language, and specifically the Numpy library for matrix multiplications and data pre-processing as well as Pandas library to tabulate the radar input values, load and store them in Comma Separated Values (CSV) formatted files.
