1. Introduction
The analysis of drugs in waste water can be used to assess the drug consumption of specific populations (workplaces, schools, prisons, etc.) in large regions (cities or countries) and small regions, and can be used to obtain trends in the types of drugs consumed or information on new types of drugs through short-term or long-term sampling and testing. The results of the monitoring are of high reference value for the investigation and seizure of drug manufacturing laboratories, the fight against drug crimes and the early warning of new psychoactive substances [
1,
2,
3,
4,
5].
Most of the current research on illegal drugs and its metabolites uses active sampling methods, and then the collected water samples are brought back to the laboratory for pre-treatment and instrumental analysis [
6,
7,
8,
9]. In various laboratories, the most widely used method is solid-phase extraction (SPE) to extract and enrich the drugs in water samples, and then analyze them by Liquid Chromatography-Mass Spectrometry. In the process of solid-phase extraction, due to the variance in the physical and chemical properties of drugs, different types of solid-phase extraction columns are used. The solid-phase extraction columns are those with high recovery rate and wider application include hydrophilic lipophilic reversed-phase adsorption column Oasis HLB
TM and cation-exchange solid-phase extraction column Oasis MCX
TM. However, this technique takes 2-4 hours to manually process a sample with low reproducibility, time-consuming and costly when dealing with urban wastewater with multiple large samples, low levels of drug toxins and complex matrix interferences. Especially in the case of a large number of sewage samples to be tested, the column method inevitably requires activation, buffer activation, drenching, drying, elution, nitrogen blowing and volume fixing before entering the chromatographic analysis, which is a considerable consumption of time and economic costs. Therefore, it is difficult for the current conventional pretreatment methods to meet the actual needs of rapid analysis of trace or ultra-trace drug toxins in urban wastewater, and there is an urgent need to use scientific and efficient pretreatment methods and highly sensitive detection instruments to establish a rapid analytical method for the determination of drug toxins in the wastewater environment, so as to provide the necessary auxiliary tools for the prevention and combating of drug-related crimes [
10,
11,
12,
13,
14,
15,
16].
In recent years, magnetic solid-phase extraction(MSPE) has been more and more applied to the pretreatment of complex samples in the fields of environment, food and biomedicine. Due to its advantages of simple operation, short extraction time, low use of organic reagents, strong adsorption capacity and easy automation, MSPE has attracted the attention of many analytical researchers and has achieved very good application results [
17,
18,
19,
20]. MSPE has three main advantages: first, it makes the extraction process simple, for it does not require expensive equipment, and the magnetic sorbents can be separated in a short time to absorb trace targets in a large volume; second, the amount of chemical substances used in MSPE is greatly reduced, and there is no secondary pollution; third, it can not only extract the target analytes in solution, but also can absorb targets in suspension. Because the impurities in the sample are generally antimagnetic substances, it can effectively avoid the interference of impurities. Therefore, MSPE is widely applied to the separation and enrichment of samples in the fields of environment, food, biology, medicine and so on. This study will develop magnetic materials and establish pre-treatment and analytical methods for common drug toxins in wastewater.
Liquid Chromatography-Mass Spectrometry has high specificity and sensitivity and can meet the requirements of scientific applications, especially for samples with limited amount of samples and low concentration of targets [
21]. However, Conventional liquid chromatography-mass spectrometry analytical techniques usually use gradient elution, which is time-consuming, and the analysis time of one injection may exceed 10 min. In the actual detection the illegal drugs in sewage, the sample volume is usually very large, and there are great difficulties in the rapid detection of hundreds or thousands of actual samples. The traditional method requires the consumption of chromatographic columns (which need to be replaced after thousands of injections), and the reproducibility of the mobile phase configuration is required to be high.
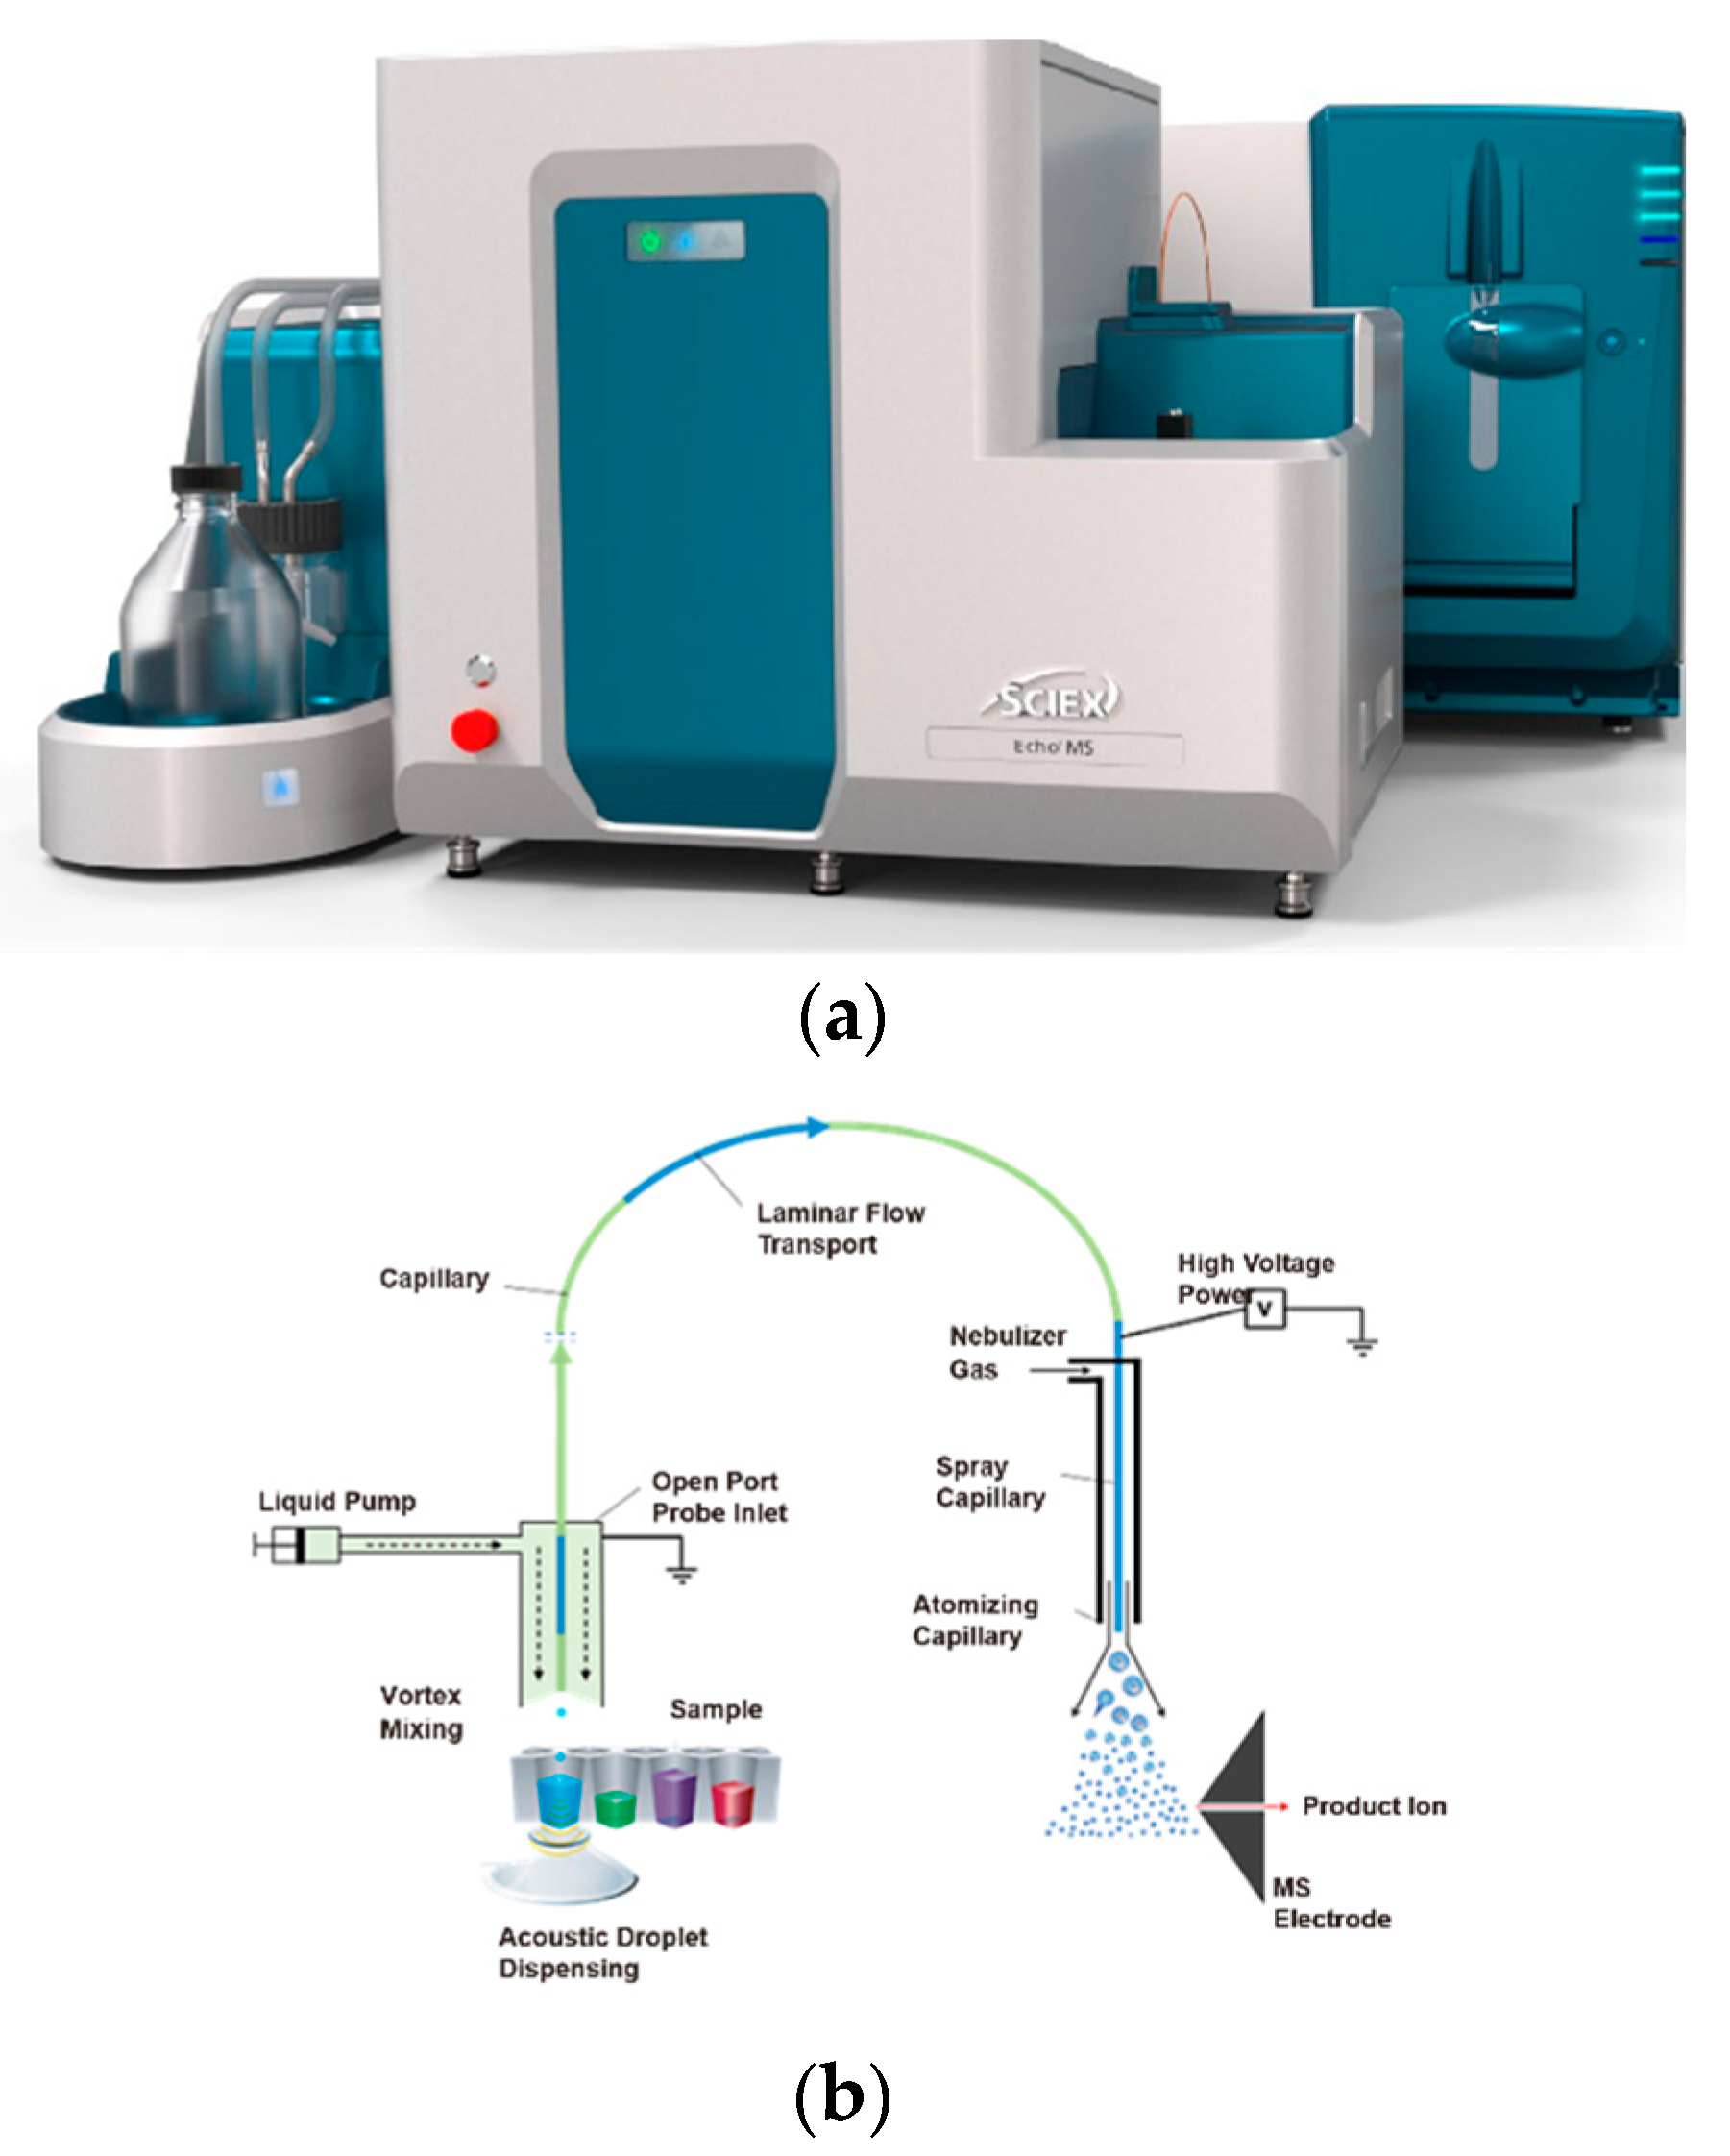
The Echo
® MS system (
Figure 1), Acoustic Ejection Mass Spectrometry (AEMS), is a integrated system consisting of acoustic droplet ejection technology (ADE), an open-port probe sampling interface (OPI), and a powerful quantitative SCIEX Triple Quad™ 6500+ system (with electrospray ionization source,).The Echo
® MS system is optimized for rapid sampling and analysis at 1 sample per second, which is hundreds of times faster per sample than conventional liquid chromatography-mass spectrometry(10min per sample). The Echo
® MS system is compatible with standard 384-well or 1536-well injection plates, which are suitable for rapid, large-volume sample testing. The Echo
® MS system eliminates the need for conventional liquid chromatography consumables such as columns and pre-columns [
22,
23].
In this study, magnetic solid-phase extraction (MSPE) technology was combined with Echo® MS system detection technology to establish pre-treatment and analytical methods for the rapid detection of drug toxins in wastewater.
The conventional Echo® MS could deliver the high analytical throughput. Although it meets the requirement of many drug discovery and synthetic biology assays, it is still challenging to meet the requirement of this particular assay. Combining conventional Echo® MS with high-throughput magnetic solid-phase extraction technology, not only does it save preprocessing time, but it also saves detection time. This study is the first report of integrate the magnetic solid-phase sample pre-concentration with the Echo® MS system, to achieve both high-throughput and high-sensitivity simultaneously.
2. Materials and Methods
2.1. Material and Reagents
Standards and internal standards were obtained from the Third Institute of the Ministry of Public Security. Synthetic magnetic bead reagents were purchased from Beijing Chemical Industry Co Ltd. (Beijing, China). All chemicals can be used directly without further purification.
2.2. Test Instruments and Analytical Methods
The AEMS system was an Echo
® MS system with pure water as the coupling fluid, methanol + 0.1% formic acid as the mobile phase, a flow rate of 360 uL/min, and SP mode (i.e., the sample viscosity is less than that of water) as the injection mode. The injection volume was 2.5 nL and the mass spectrometer was a SCIEX Triple Quad™ 6500+ system. The curtain gas was 20psi, CAD gas was 9 unit, ionspray voltage was 5500V, the source temperature was 300℃, the ion source gas1 was 90psi, and the ion source gas2 was 45psi. MRM ion pair information was shown in
Table 1. Scanning electron mircrographs(SEM) were obtained with a S3400N scanning electron microscope(Hitachi,Japan). Infared spectra were recorded by a Nicolet 6700 FT-IR spectrophotometer(Nicolet, USA). The magnetic properties were analyzed through a vibrating sample magnetometer(VSM, PPMS-9) made by Quantum Design, Ltd.,USA.
2.3. Synthesis of Magnetic Adsorbents
1 g of ferric chloride hexahydrate, 3 g of sodium acetate, and 0.2 g of sodium citrate were added to 100 mL of ethylene glycol and stirred to dissolve for 30 minutes, then added to a 200 mL polytetrafluoroethylene reactor and placed in an oven at 200℃ for 12 hours. After being cooled to room temperature, the magnetic separation was washed three times repeatedly using ethanol and deionized water to obtain magnetic tetraferric oxide particles(Fe3O4). 1 g of 400 nm Fe3O4 was dispersed in 200 mL of ethanol in ultrasonic treatment, and then 50 mL of water was added to the above dispersion by ultrasonic treatment for 5 minutes. After stirring for 30 minutes, 2mL concentrated ammonia was added to the solution and mixed thoroughly for 20 minutes, then 5mL tetraethyl orthosilicate and 1.5mL methacrylic acid-3-(trimethoxymethylsilyl) propyl ester were added drop by drop, and the reaction was continued for 12 hours at room temperature to obtain double-bond modified magnetic silica microspheres(Fe3O4@SiO2-MA).The magnetic separation was cleaned three times with ethanol and deionized water repeatedly, and then the products were placed in a vacuum at 60℃. The magnetic separation was washed three times with ethanol and deionized water and particles were dried in a vacuum oven at 60℃. 2g of the above particles were dispersed in a 1000mL round-bottomed flask and added to 500mL of acetonitrile, and then 3.6mL of divinylbenzene, 7.2mL of vinylpyrrolidone and 0.4g of 2,2-azobisisobutyronitrile were added to the solution. The mixture was allowed to react for 1 hour with mechanical stirring under nitrogen protection. Then, the temperature was set to 75°C and the mixture was allowed to continue to react at that temperature for 8 hours. The magnetic separation was washed three times with deionized water and ethanol and finally, the product(Fe3O4@SiO2-MA@PLS) was dried at room temperature.
2.4. Wastewater Pre-Treatment Method
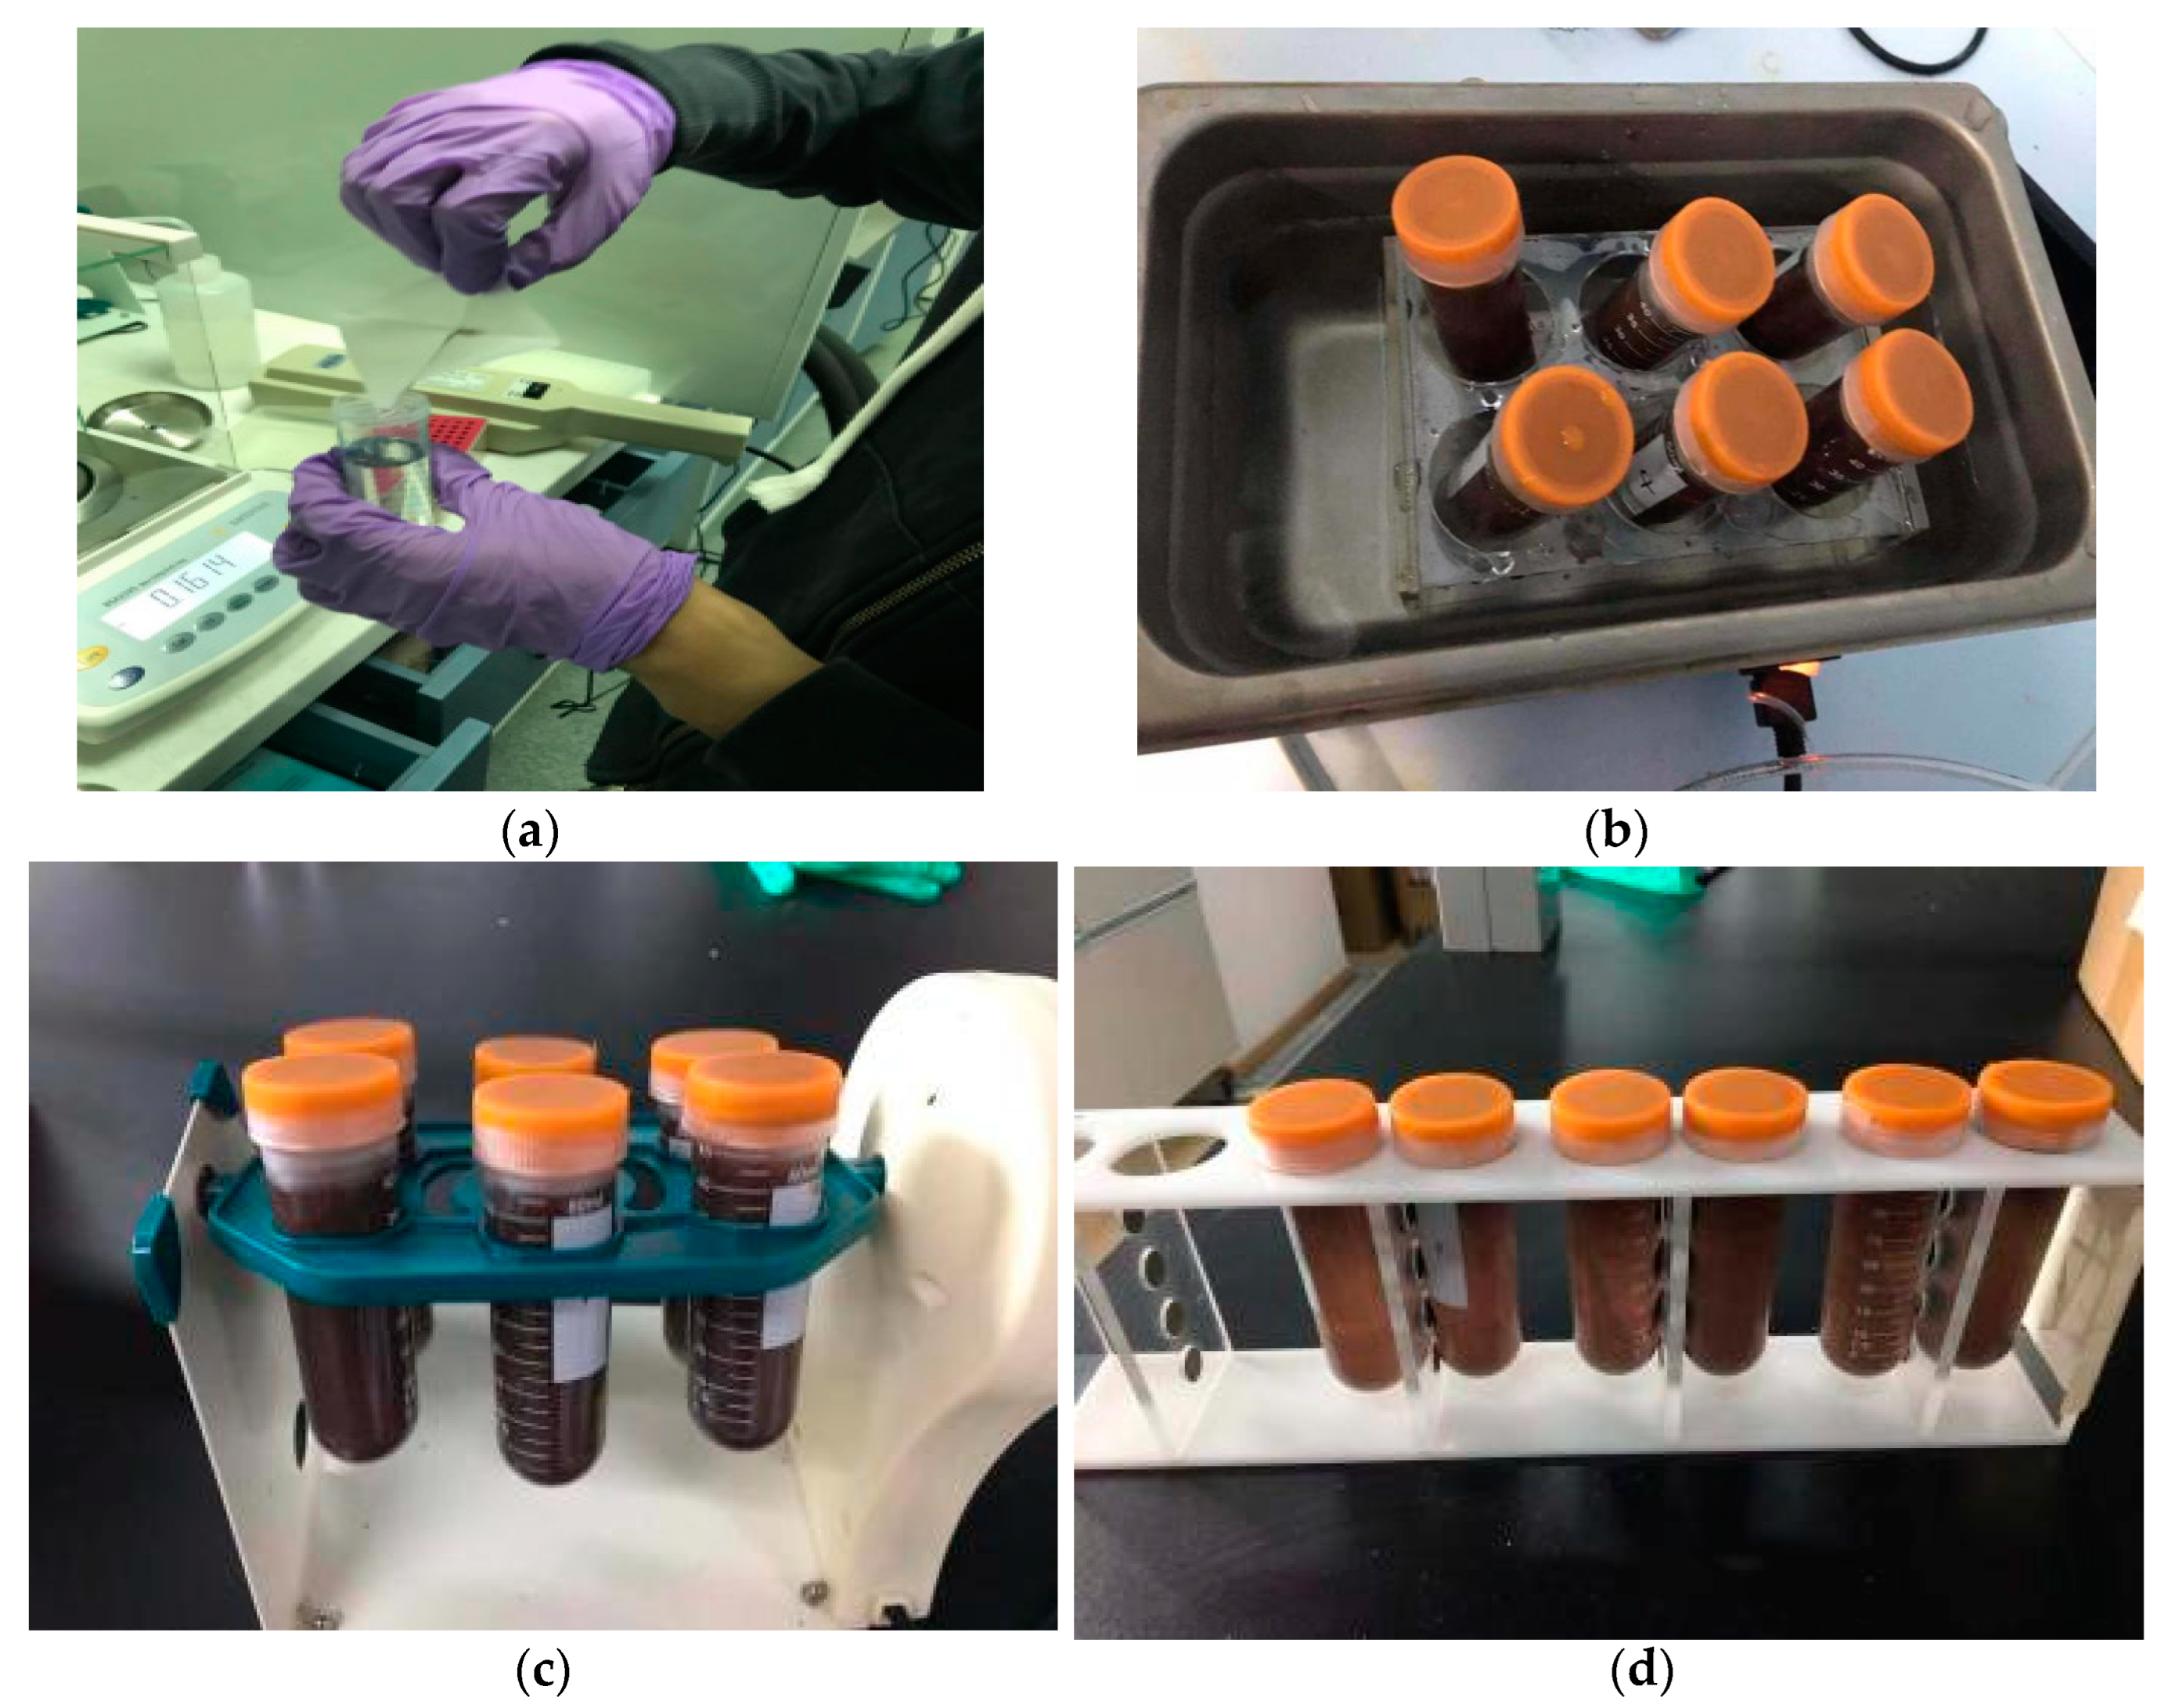
As shown in
Figure 2, 20 mg of MSPE sorbent was added to a centrifuge tube containing 50 mL of wastewater samples (including internal standards), sonicated for 1 min to fully disperse, and then vortexed at room temperature for 10 min. Subsequently, a magnet was placed on the side of the centrifuge tube in order to separate the MSPE sorbent from the solution. The solution became clear after about 60 seconds and the supernatant was carefully removed. The target was eluted from the magnetic solid phase extraction adsorbent by ultrasonic washing for 5 minutes with 3 mL of acetonitrile solution, the eluate was quickly blown dry using nitrogen at 60 ℃, re-solubilized using 200 uL of methanol solution (methanol: water = 2:8, v/v) and passed through a 0.22 um filter membrane to remove impurities, and finally injected into the sample for analysis.
2.5. Method Validation
Mixed standard solutions were sequentially diluted with methanol water (methanol: water = 2:8, v/v) as the solvent to configure standard curves at concentrations of 1, 2, 5, 10, 20, 50, 100, 250, and 500 ng/mL, respectively, (the concentration of the internal standard contained in each standard curve was 250 ng/mL). Linear regression was performed with the mean value of the quantitative ion-pair peak area ratio of the target and the corresponding deuterium internal standard in the extract of the added sample as the vertical coordinate, and the content of the target in the added sample as the horizontal coordinate, and a linear equation was obtained. Based on the quantitative ion-pair peak area values of the target and the corresponding deuterated internal standard in the extract of the sample, the content of the target in the sample was calculated.The method was evaluated by linearity, LOD and LOQ, precision and accuracy and the limit of detection (LOD) and limit of quantification (LOQ) based on signal-to-noise ratios of 3 (S/N=3) and 10 (S/N=10) was determined. Three validation batches were tested to assess the accuracy and precision of the method.
Experiments were conducted to examine matrix sample reproducibility. Effluent blank samples were spiked with 17 drugs (spiked at a concentration of 250 ng/mL) after pre-treatment of the samples, and 3 parallel samples were examined (i.e., sample-5, sample-6, and sample-7), with 6 consecutive injections of each sample, respectively. The matrix effect (in %) of the method was investigated. Effluent blank samples were pre-treated and spiked with 17 drugs (spiked at a concentration of 250 ng/mL), and double-parallel samples were examined (i.e., sample-3, sample-4), with the concentration of each sample calculated under a standard curve and divided by 250 (theoretical spiked concentration). The recovery (in %) of the method was examined. The effluent blank samples were spiked with 17 drugs (added concentration 250 ng/mL) after pre-treatment of the samples, where 3 parallel samples were examined (i.e., sample-5, sample-6, sample-7), and the concentration of each sample was calculated under the standard curve and then divided by 250 (the theoretical added concentration).
3. Results
3.1. Magnetic Solid Phase Extraction Technique and Characterization of Magnetic Materials
Magnetic solid phase extraction is a kind of adsorption coating with magnetic particles as the core and the outer surface modified to have strong adsorption effect on the target. In the magnetic solid phase extraction process, the magnetic adsorbent is not directly filled into the adsorption column, but is added to the solution or suspension of the sample, the target analyte is adsorbed to the dispersed magnetic adsorbent surface, and under the action of an external magnetic field, the target analyte can be separated from the sample matrix.
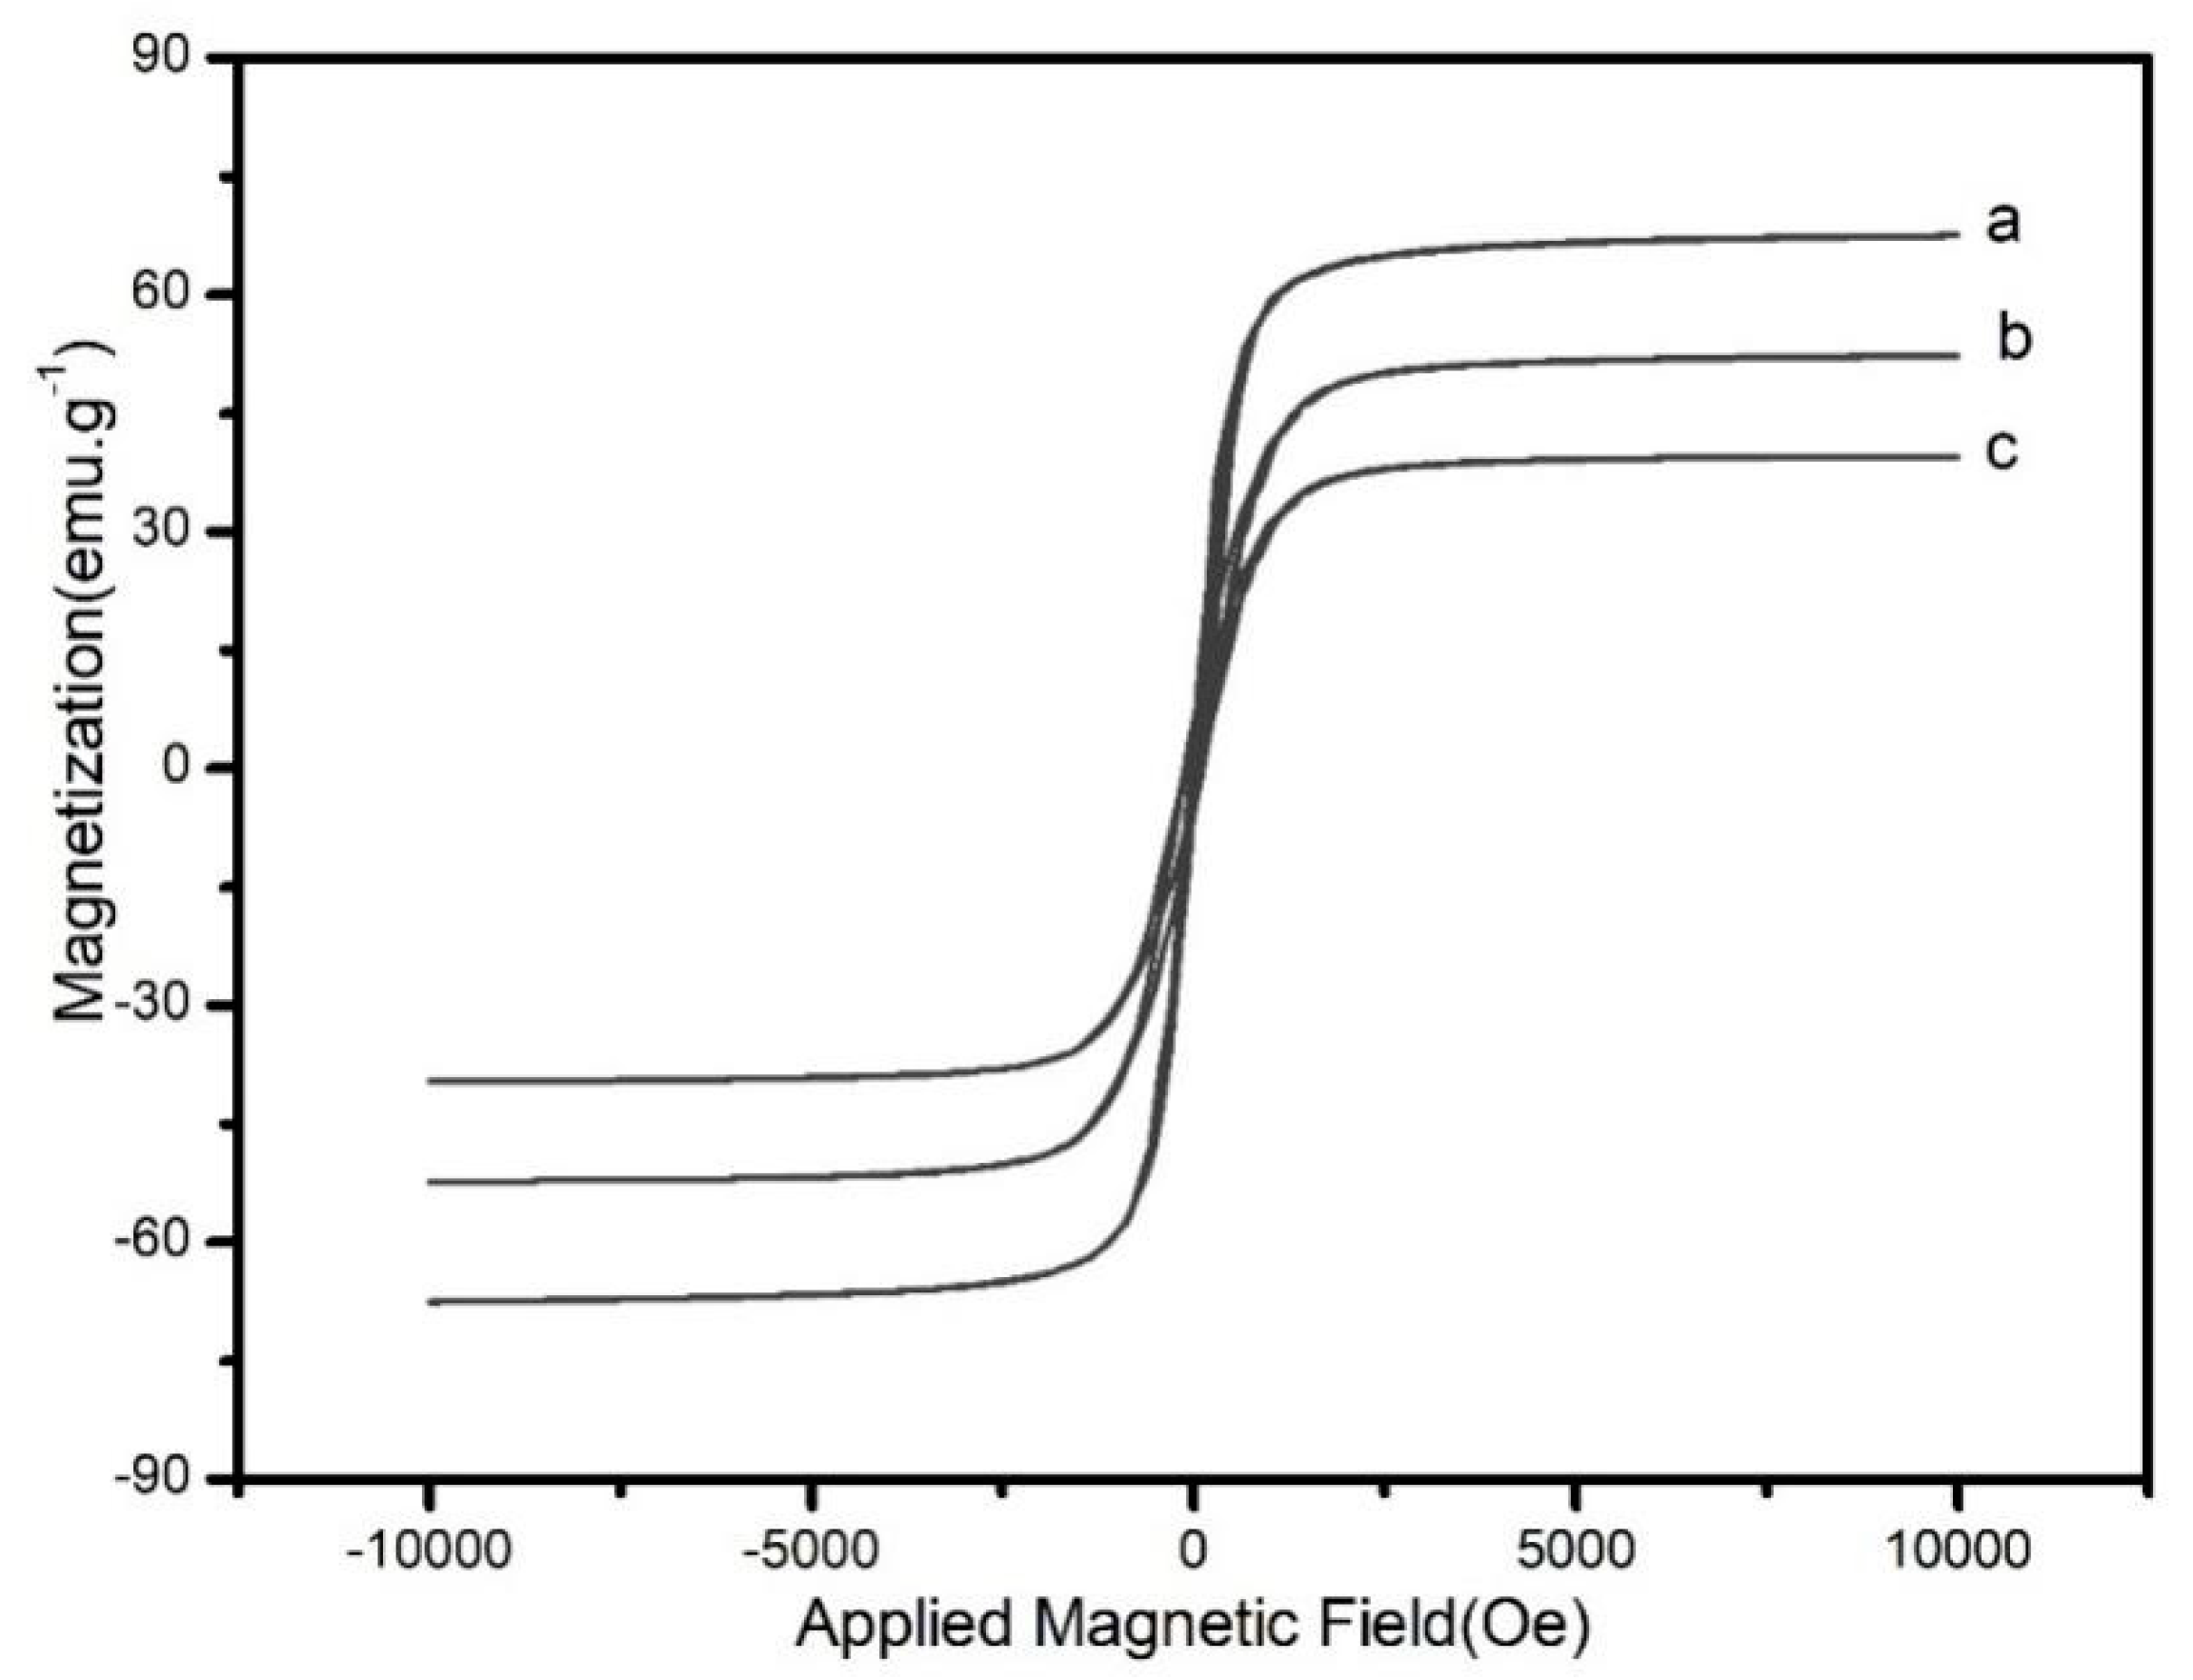
Figure.3 shows the hysteresis curve of Fe3O4, Fe3O4@SiO2-MA and Fe3O4@SiO2-MA@PLS at room temperature. As can be seen, the three curves have a similar shape and symmetry about the origin. The saturation magnetization value was found to be 52.6 emu·g-1for Fe3O4@SiO2-MA and 67.4 emu·g-1 for Fe3O4. This difference might be attributed to the non-magnetic SiO2-MA shell surrounding the magnetite particles. After divinylbenzene and Vinyl pyrrolidone were grafted on Fe3O4@SiO2-MA, saturation magnetization value for Fe3O4@SiO2-MA@PLS was 38.7 emu·g-1. This indicated the formation of PLS shell on the surface of SiO2-MA shell.
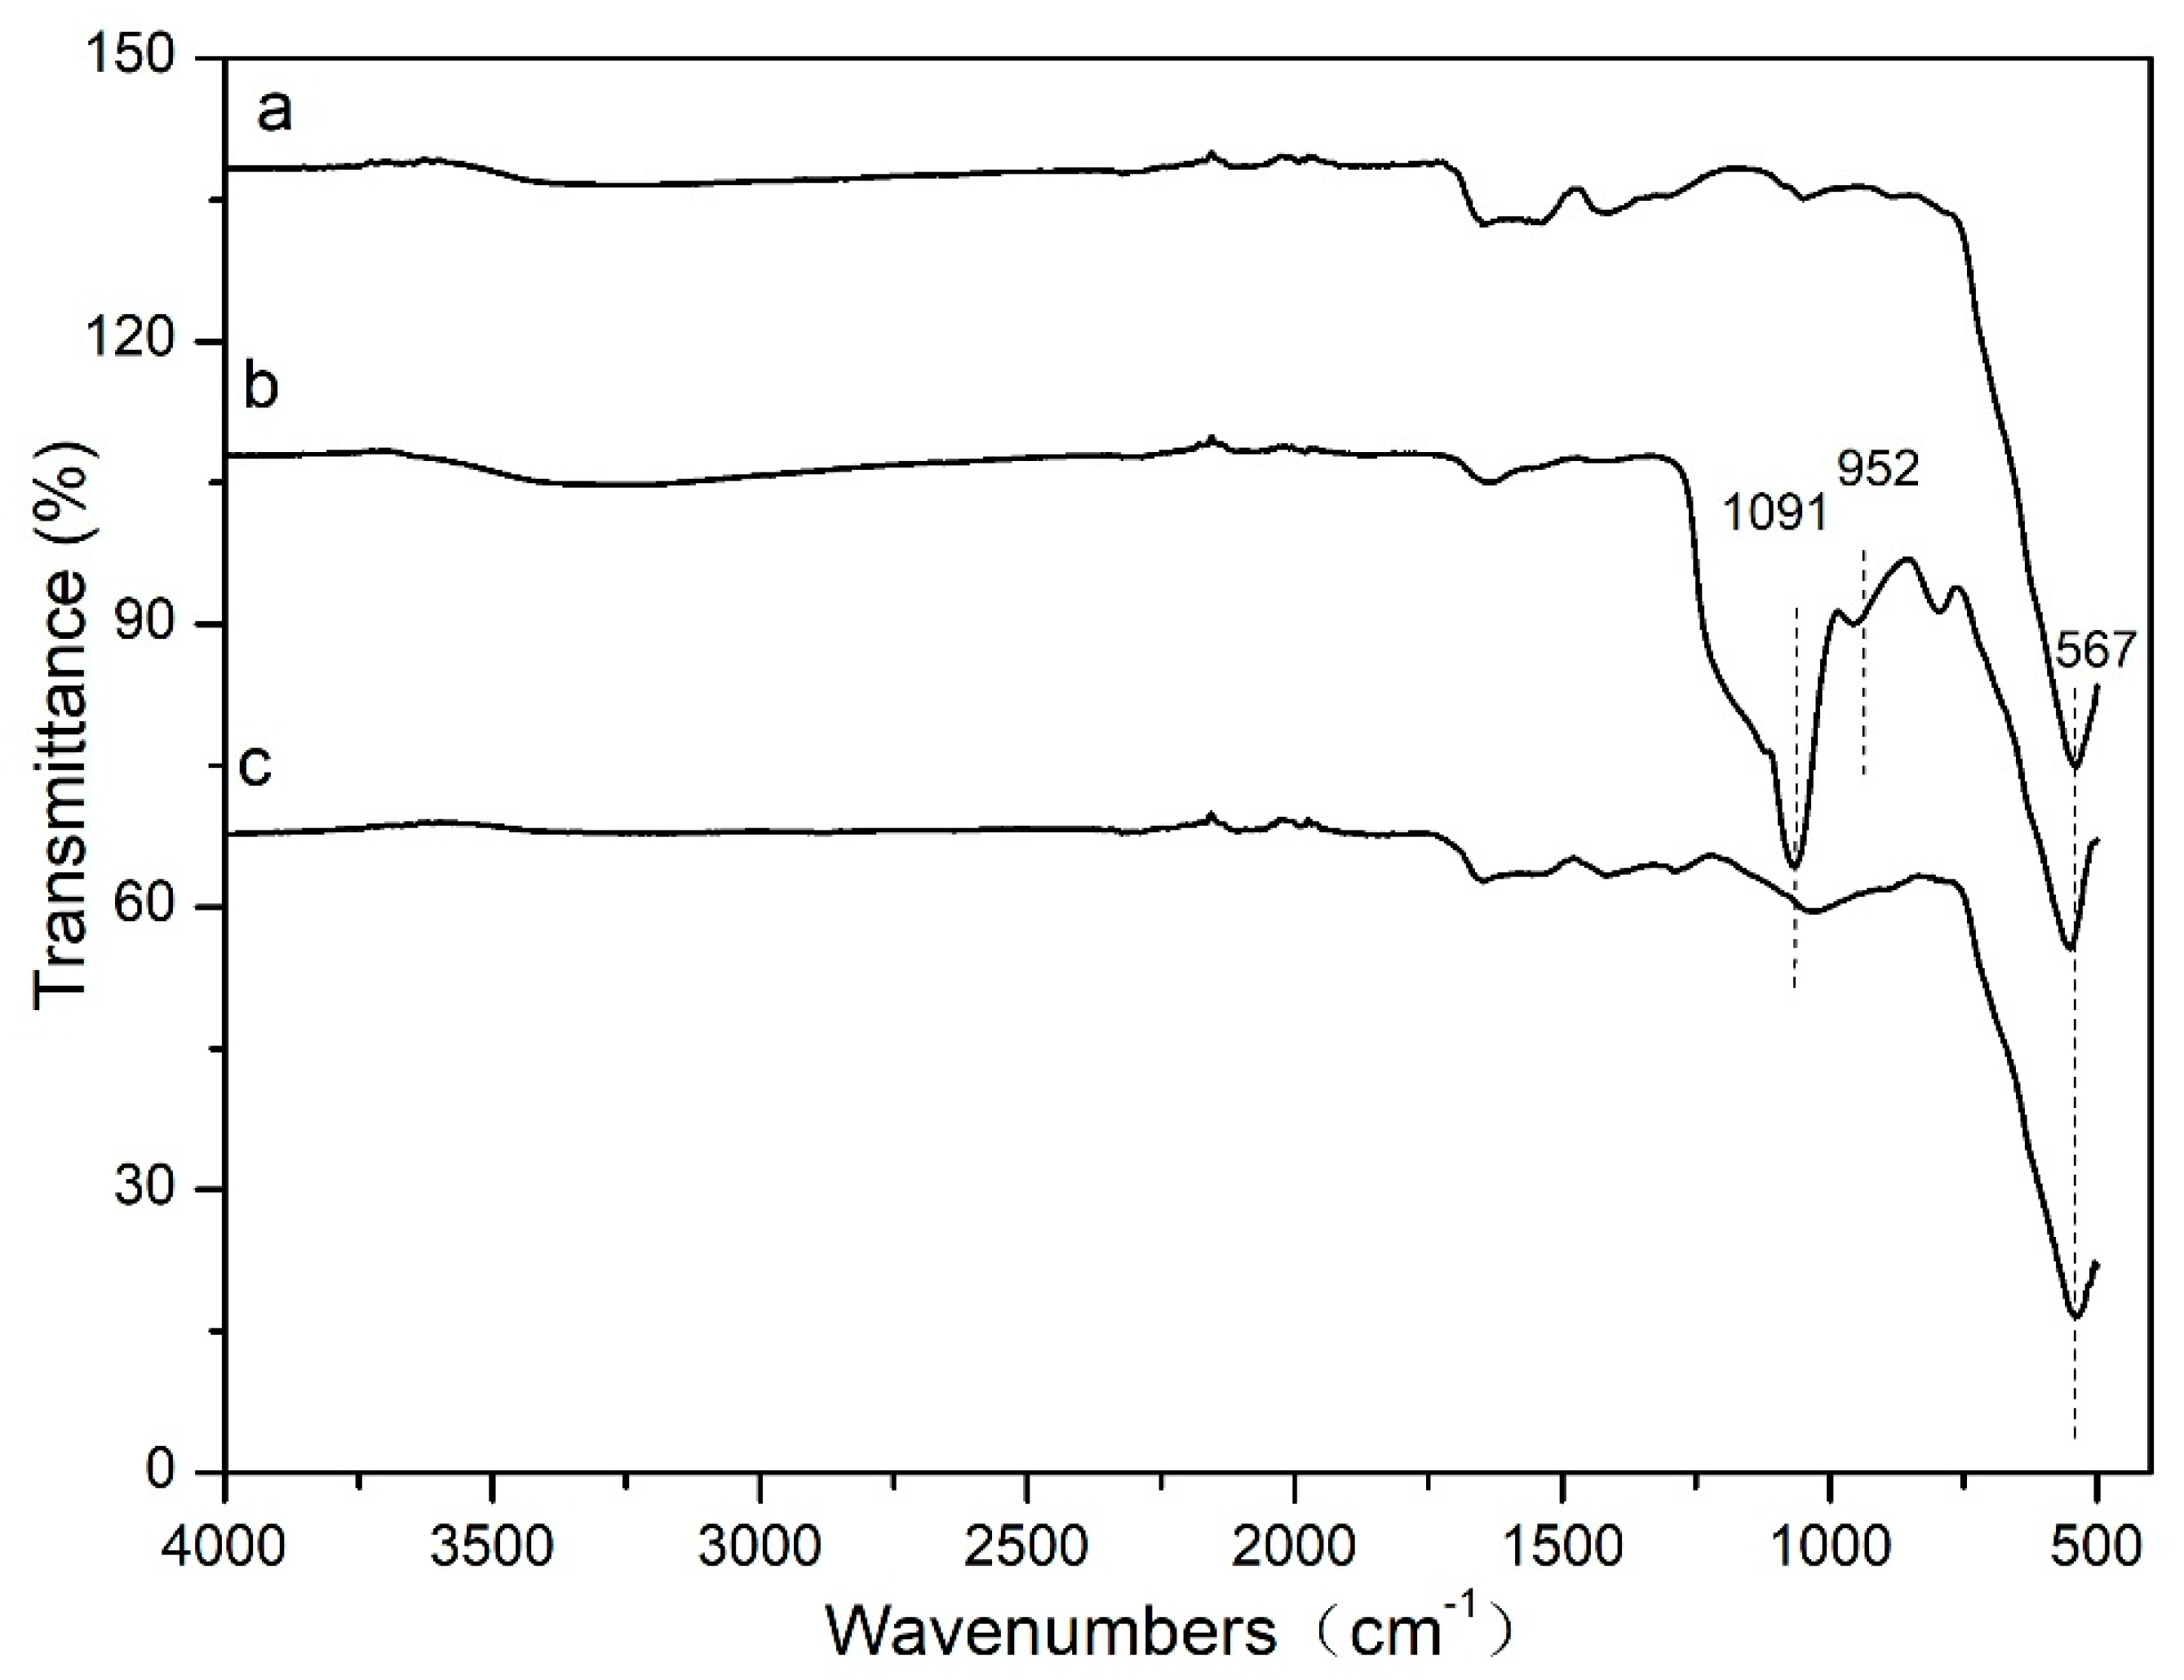
Figure 4 shows The Fourier transform infrared spectroscopy was used to characterize the chemical interaction between Fe
3O
4 and functional groups. As can be seen from Figure. 2, the adsorption band of Fe-O is at 567 cm
-1 (
Figure 1a), which is the characteristic peak of Fe
3O
4 nanoparticles. The two bands at 952 and 1091 cm
-1 (
Figure 2b) are the stretching vibration of Si-O bonds of the SiO
2 shell. These proves that the SiO
2 shell is linked to the surface of the magnetic Fe
3O
4. In
Figure 4c, the peak of 1091 cm
-1 has been almost invisible. And peaks in the region of 1100–1400 cm
-1 are attributed to C-H and C-C stretching vibrations from divinylbenzene and Vinyl pyrrolidone. These results indicate that the divinylbenzene and Vinyl pyrrolidone are successful chemisorbed on the surface of Fe
3O
4@SiO
2-MA@PLS nanoparticles.
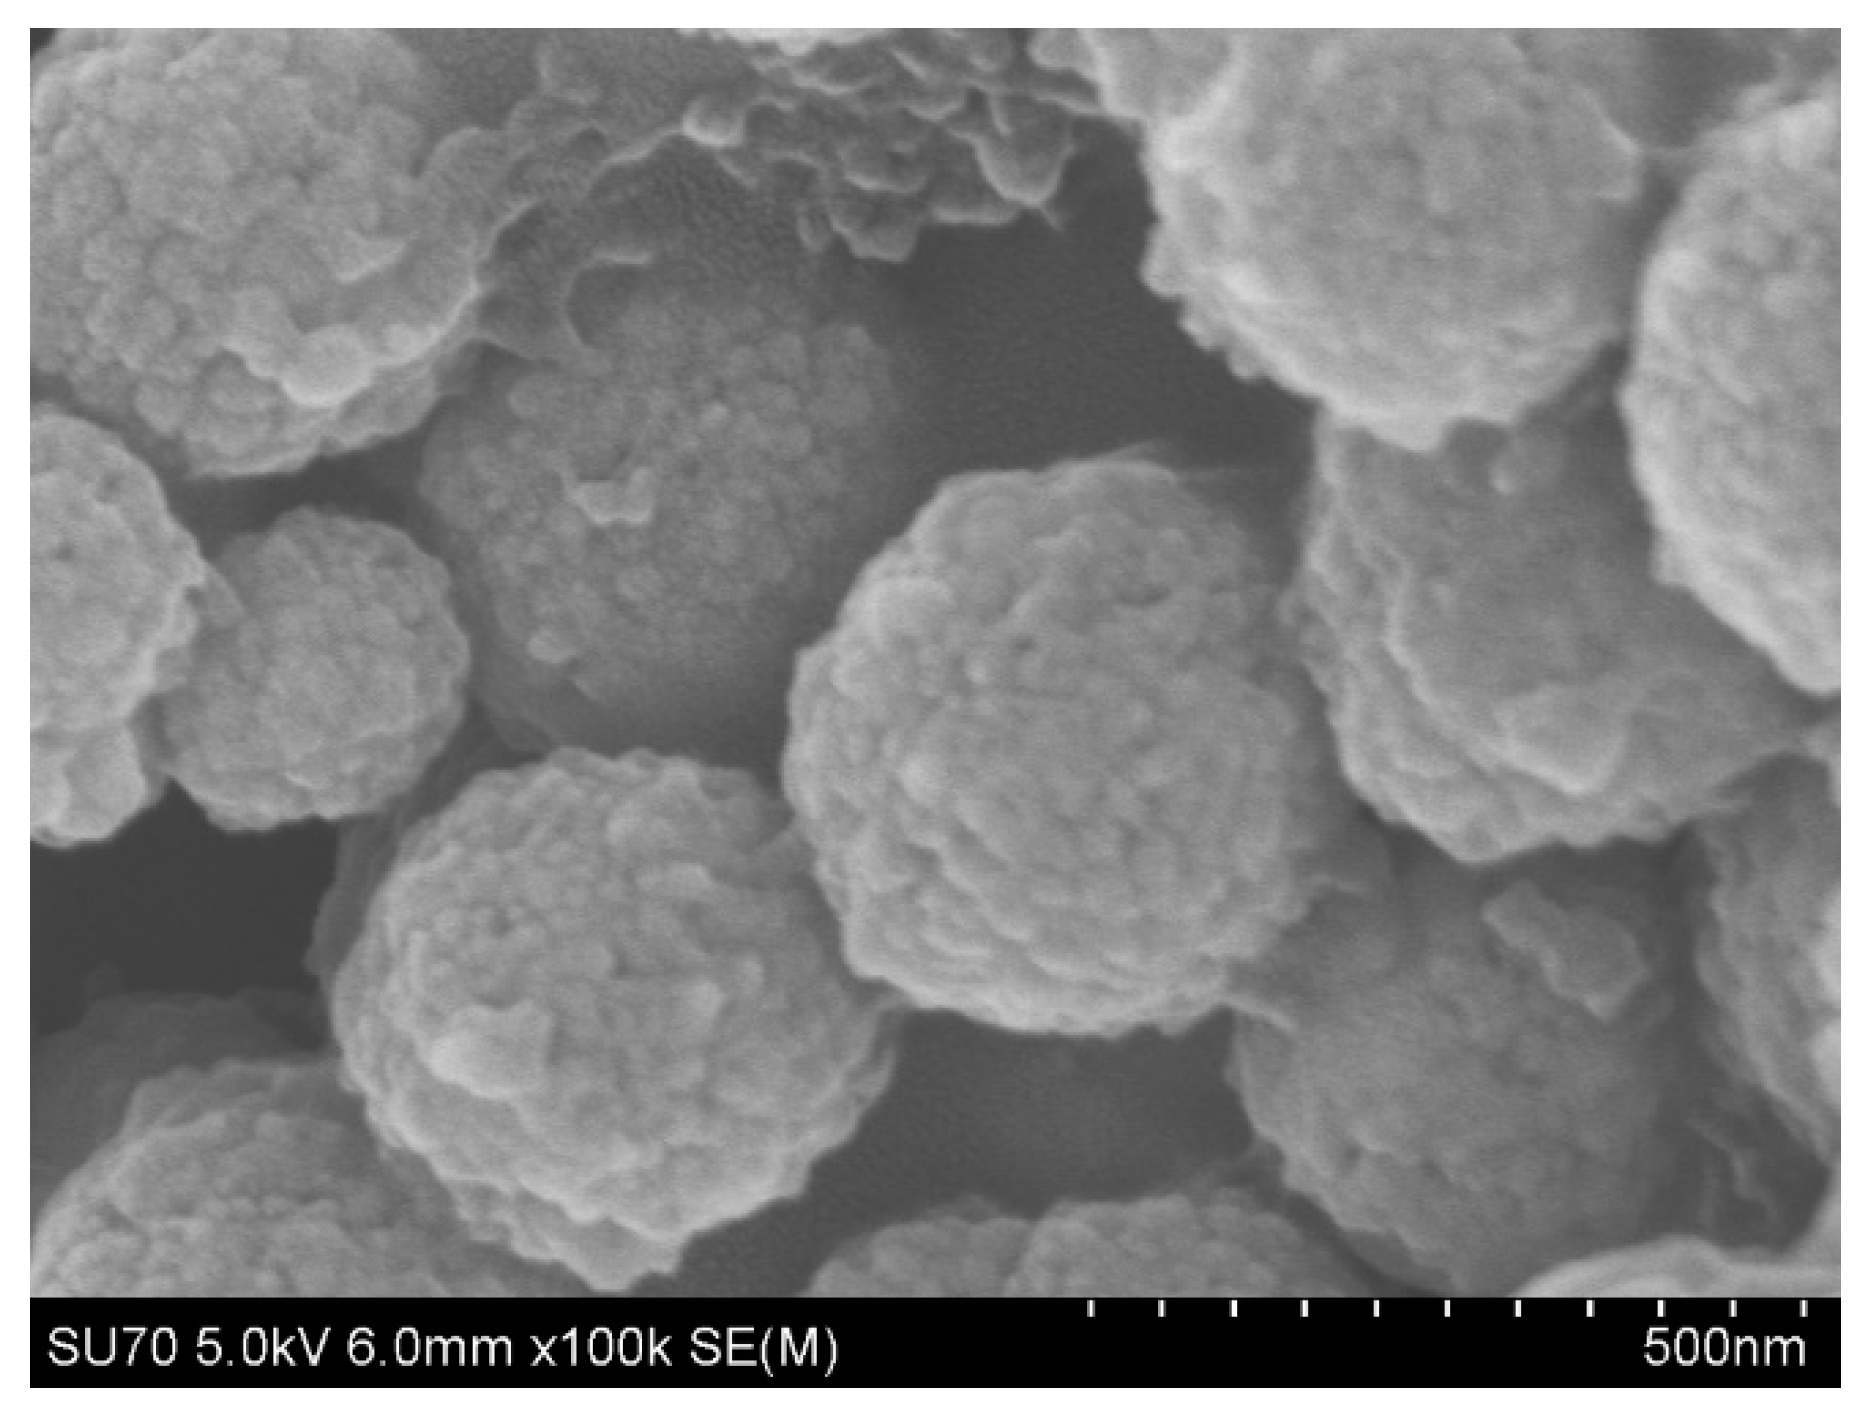
The detailed morphological and structural features of the prepared Fe
3O
4@SiO
2-MA@PLS nanoparticles were characterized using SEM.
Figure 5 indicates that nanoparticles particles are well-dispersed with the average size of 200 nm.
3.2. Method Validation
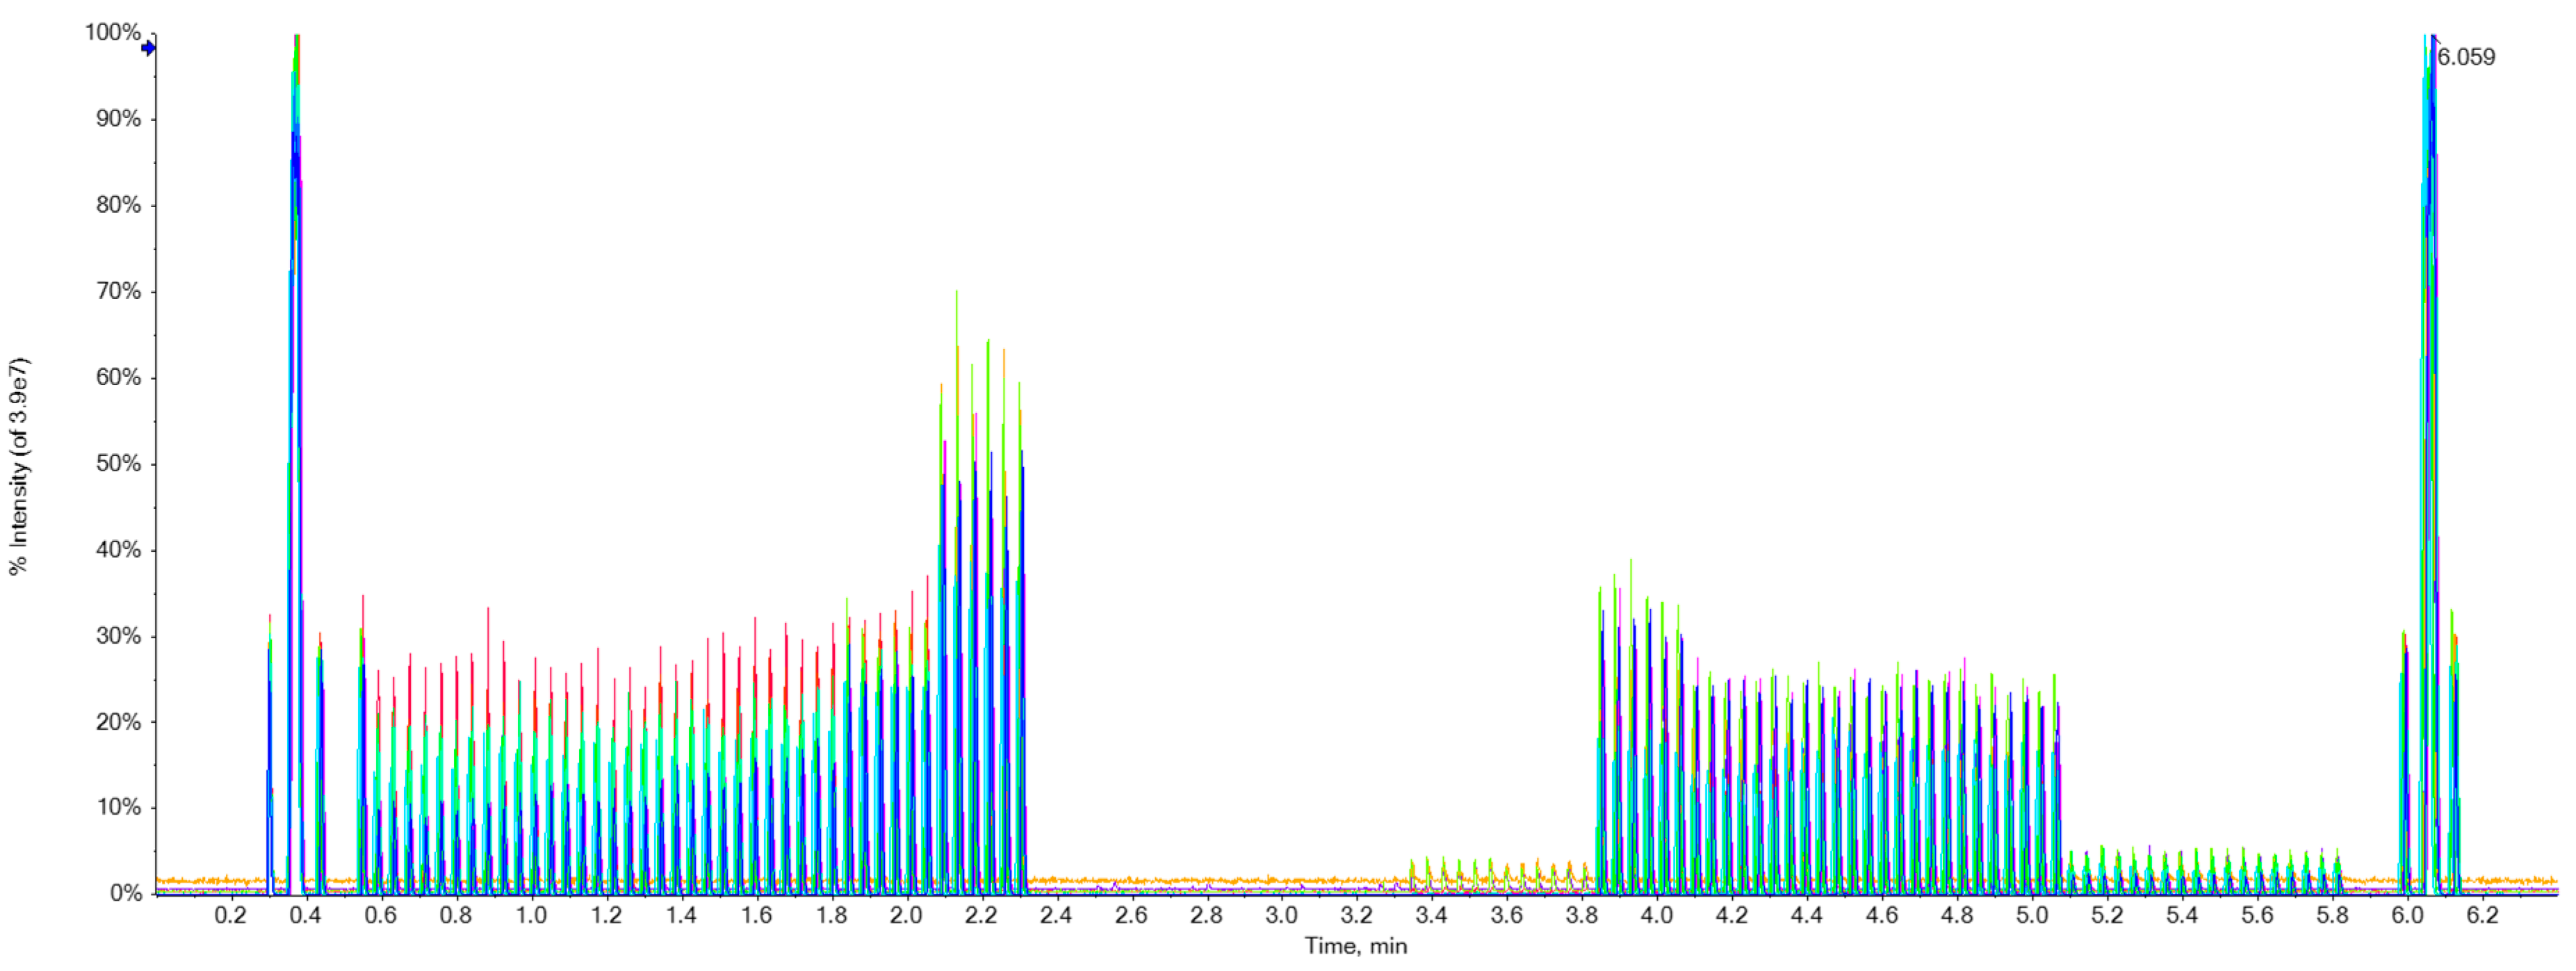
The ion flow chromatogram of XIC extraction for 17 drugs of spiked blank water was shown in
Figure 6, which suggests that the Echo
® MS system can detect the target molecules.
The linear range and the LOQs are shown in
Table 2, which demonstrated that the linear range of 17 drugs was 1-500 ng/L,and the limit of quantitative detection was 1-2 ng/L.
4. Results
This se
The reproducibility of spiked samples indicated that the RSD values of the peak areas of the 17 drugs were less than 5%, and the detailed data were shown in
Table 3 below.
Figure 7a were tipical chromatograms of Methamphetamine-D5 and Methamphetamine in Sample 5, Sample 6, Sample 7 for 6 consecutive injections.
The examination of matrix effects and extraction recovery in wastewater blank samples pre-treated with the addition of 17 drugs were listed in
Table 4, which showed that the matrix effects of the method were all greater than 67% with less matrix interference and the extraction recoveries were above 80 % (except for mechlorethamine and cathinone).
5. Conclusions
In this study, magnetic adsorbents were prepared for the enrichment of drugs and toxins in wastewater, and the magnetic dispersive solid-phase extraction (MSPE) pre-treatment combined with direct injection mass spectrometry (MS) analysis was established to realize the rapid pre-treatment and detection of the target drug and toxin molecules. In this study, magnetic nanomaterials were used as adsorbents, which were mixed with water, and then concentrated by magnetic separation and elution. It is fast, more economical, less time-consuming, and easier to be high throughput than those of the traditional solid-phase extraction. Currently, high-throughput pre-treatment with magnetic solid-phase extraction is common for small-volume samples, such as nucleic acid extraction. High-throughput equipment for large-volume samples (~5 ml) is not common, but is achievable. The magnetic solid phase extraction high throughput preprocessor developed by our team is in the final stages of testing. Once a high-throughput pre-processing instrument is available, its coupling with high-throughput direct-injection mass spectrometry will dramatically reduce detection time.
The Echo® MS system is equipped with ADE technology, which uses acoustic energy to excite the sample from a very small sample volume (2.5 nL) in the sample plate, and the small droplets of sample are transported to the SCIEX Triple Quad™ 6500+ system for analysis and detection via OPI technology, eliminating the need for conventional liquid chromatography consumables, such as columns and pre-columns, in the entire process. The injection volume of the system is 2.5nL, which is 1/1000th of that of a conventional LC-MS/MS. Such a small injection volume is very favorable for complex matrices such as wastewater as the negative effects of matrix effects are greatly diluted; at the same time, it is extremely favorable for the detection of target drugs adsorbed on the surface of the magnetic particles in mass spectrometry, because in the comparison experiments with the conventional LC-MS/MS,we found that the surface of the magnetic beads was enriched with other substances in the wastewater, which would interfere with the detection of the target in the mass spectrometry, but when the injection volume was reduced to 2.5 nl, these interferences were negligible.
The Echo® MS system is equipped with ultra-fast injection speed, 1 sample per second for rapid sampling and analysis, and standard 384-well or 1536-well injection plate, which is suitable for rapid and large-volume sample detection. In our experiment, 127 samples can be completed in 6.3 min, while 1,397 min is needed compared with the traditional sewage drug testing liquid-mass spectrometry detection method. The Echo® MS system analyzes the same samples at a rate of at least 220 times faster than conventional liquid-mass spectrometry methods. The Echo® MS system equipped with the SCIEX Triple Quad™ 6500+ system also possesses powerful quantification capability, and the data showed that the limit of quantification (LOQ) for the 17 drugs could reach 1-2 ng/mL.In the reproducibility study, the Echo® MS system was able to achieve the RSD of matrix samples of <5%. In addition, the data of matrix effect study of the method showed that all 17 drugs could achieve more than 70%. In addition, the matrix effect data of the method showed that all 17 drugs could achieve more than 70%, which indicated that the method had a strong ability to resist matrix interference. The extraction recovery of all 17 drugs could reach more than 80% (except methcathinone and cathinone) in the investigation experiment. The methodological data showed that the method developed by the Echo® MS system for the detection of drugs in wastewater was suitable.
Author Contributions
Conceptualization, Feiyu Yang; methodology,Feiyu Yang and Zhiyuan Li; software, Yicao Cao; validation, Kaijun Ma; resources, Kaijun Ma; writing—original draft preparation,Feiyu Yang; writing—review and editing, Feiyu Yang; funding acquisition, Feiyu Yang and Kaijun Ma. All authors have read and agreed to the published version of the manuscript.”
Data Availability Statement
The data presented in this study are available on request from the corresponding author.
Acknowledgments
The authors express their gratitude to Shanghai Anti-Drug Office for their guidance and to the technical and application support from the AB Sciex Analytical Instrument Trading Co., Ltd..
Conflicts of Interest
The authors declare no conflicts of interest.
References
- Zuccato, E.; Chiabrando, C.; Castiglioni, S.; Calamari, D.; Bagnati, R.; Schiarea, S.; Fanelli, R. Cocaine in surface waters: a new evidence-based tool to monitor community drug abuse. Environ. Health, 2005, 4, 14–20. [Google Scholar] [CrossRef] [PubMed]
- Castiglioni S.;Bijlsma L.; Covaci A. Evaluation of uncertainties associated with the determination of community drug use through the measurement of sewage drug biomarkers.Environ. Sci. Technol. 2013,47(3):1452—1460..
- Daughton C. G.Real—time estimation of small—area populations with human biomarkers in sewage.Science of the Total Environment,2012,414:6-21.
- Burgard, D.A.; Fuller, R.; Becker, B.; Ferrell, R.;Dinglasan-Panlilio, M.J.Potential trends in Attention Deficit Hyperactivity Disorder (ADHD) drug use on a college campus: Wastewateranalysis of amphetamine and ritalinic acid. Sci. Total Environ. 2013,450-451, 242–249.
- Castiglioni, S.; Borsotti, A.; Senta, I.; Zuccato, E. Wastewater analysis to monitor spatial and temporal patterns of use of two syntheticr ecreational drugs, Ketamine and Mephedrone, in I taly. Environ. Sci. Technol. 2015, 49, 5563–5570. [Google Scholar] [CrossRef] [PubMed]
- Daughton, C G. Emerging pollutants, and communicating the science of environmental chemistry and mass spectrometry: pharmaceuticals in the environment .J. Am. Soc. Mass Spectrom. 2001, 12: 1067-107. 1.
- Zuccato E.; Chiabrando C.; Castiglioni.; Bagnati, R.; Fanelli, R.l. Estimating community drug abuse by wastewater analysis.Environ Health Persp. 2008, 116(8): 1027-1032.
- Van Nuijs A.; Mougel J.F.; Tarcomnicu I.; Bervoets L.; Blust R.; Philippe G. J.; Neels H.; Covaci V. Sewage epidemiology: a real-time approach to estimate the consumption of illicit drugs in Brussels, Belgium. Environ Int. 2011, 27: 612-621.
- Postigo, C.; Lopez DE Alda M., J.; Barceló, D. Analysis of drugs of abuse and their human metabolites in water by LC-MS2: A non-intrusive tool for drug abuse estimation at the community level. Trends Anal Chem 2008, 27, 1053–1069. [Google Scholar] [CrossRef]
- Zuccato, E.; Gracia-Lor, E.; Rousis, N.I.; Parabiaghi, A.; Senta, I.; Riva, F; Castiglioni, S. Illicit drug consumption in school populations measured by wastewater analysis. Drug Alcohol. Depen. 2017, 178, 2852–2890. [Google Scholar] [CrossRef] [PubMed]
- Zhang X.H.; Tan Y.Z.; Li P.; Ren Y. Can water quality indicators and biomarkers be used to estimate realtime population?Sci. Total Environ. 2019, 660:603-610.
- Rico M, Andrés-Costa M J, Picó Y. Estimating population size in wastewater-based epidemiology. Valencia metropolitan area as a case study.J. Hazard Mater.2017,323:156-165.
- Archer E.; Castrignanò E.; Kasprzyk-Hordern B.;Wolfaardt, G. M. Wastewater-based epidemiology and enantiomeric profiling for drugs of abuse in South African wastewaters. Sci. Total Environ., 2018, 625:792-800.
- Been F; Bifisma L.; Benaglia L.; Berset J.D.; Botero-Coy A.M.;Castiglioni S.; Kraus L.; Zobel F.; Schaub M.P.; Buecheli A.; Hernandez F.; Delemont O.; Esseiva P.; Ort C. Assessing geographical differences in illicit drug consumption—A comparison of results from epidemiological and wastewater data in Germany and Switzerland. Drug Alcohol Depen. 2016,161,189-199.
- Raimondo B.; Methsiri E.; Wayne H.; Jochen F. M.; Foon Y. L.; Jake W. O.; Phong K. T. Association between purity of drug seizures and illicit drug loads measured in wastewater in a South East Queensland catchment over a six year period. Sci.Total. Environ. 2018, 635: 779-783.
- Heuett, N. V.; Ramirez, C.E.; Fernandez, A.; Gardinali, P.R. Analysis of drugs of abuse by online SPE-LC high resolution mass spectrometry : Communal assessment of consumption. Sci. Total Environ. 2015, 511, 319–330. [Google Scholar] [CrossRef]
- Yang, F.Y.; Zou, Y.; Ni, C.F.; Wang, R.; Liang, C.; Zhang, J.B.; Yuan, X.L.; Liu, W.B. Megnetic dispersive solid-phase extraction based on modified magnetic nanopaticles for the detection of cocaine and cocaine metabolites in human urine by high-performance LC-MS. J.Sep. Sc. 2017, 40, 4234–4245. [Google Scholar] [CrossRef] [PubMed]
- Ibrahim W. A. W.; Nodeh H. R. , Aboul-Enein H.Y. ; Sanagi M.M. Magnetic solid-phase extraction based on modifiedferum oxides for enrichment, preconcentration, and isolation of pesticides and selected pollutants.Crit. Rev. Anal. Chem., 2015, 45, 270–287,.
- Ramandi N., F.; Shemirani, F. Selective ionic liquid ferrofluid based dispersive-solid phase extraction for simultaneouspreconcentration/separation of lead and cadmium in milk andbiological samples. Talanta. 2015, 404–411. [Google Scholar] [CrossRef] [PubMed]
- Li, Y.W.; Lian, R.; Yang, F.Y.; Xu, Z.R.; Cao, F.Q.; Wang, R.; Liang, C.; Zhang, Y.R. Rapid quantitation of three synthetic cathinones in urine by magnetic dispersive solid-phase extraction combined with DART-HRMS. Anal. Methods. 2021, 13, 5048–5055. [Google Scholar] [CrossRef] [PubMed]
- Kinyua, J.; Covaci, A.; Maho, W.; McCall, A.; Neels, H.; Nuijs, A.L.N. Sewage-basedepidemiology in monitoring the use of new psychoactive substances: Validation and applicationof an analytical method using LC-MS/MS. Drug Test. Anal. 2015, 7, 812–818. [Google Scholar] [CrossRef] [PubMed]
- Zhang, H.;Liu, C.;Hua; Ghislain, L.P.; Troutman, M.D. Acoustic ejection mass spectrometry for high-throughput analysis. Anal. Chem. 2021, 93(31), 10850–10861. [Google Scholar] [CrossRef] [PubMed]
- Liu, C. Acoustic ejection mass spectrometry: fundamentals and applications in high-throughput drug discovery. Expert Opin. Drug Discov. 2022, 17(7), 775–787. [Google Scholar] [CrossRef] [PubMed]
|
Disclaimer/Publisher’s Note: The statements, opinions and data contained in all publications are solely those of the individual author(s) and contributor(s) and not of MDPI and/or the editor(s). MDPI and/or the editor(s) disclaim responsibility for any injury to people or property resulting from any ideas, methods, instructions or products referred to in the content. |
© 2024 by the authors. Licensee MDPI, Basel, Switzerland. This article is an open access article distributed under the terms and conditions of the Creative Commons Attribution (CC BY) license (https://creativecommons.org/licenses/by/4.0/).
