1. Introduction
Liquid membranes are systems made up of three immiscible phases: an aqueous source phase, which contains the chemical species of interest for valorization or removal from the system, an organic membrane phase that ensures the selective transport of the considered chemical species and an aqueous receiving phase in which it will be immobilized [
1,
2,
3]. Liquid membranes are usually differentiated based on the amount and form in which the membrane phase is found in the system, in: volume liquid membranes (bulk liquid membranes, BLM), liquid membranes on support (supported liquid membranes, SLM) and emulsion liquid membrane (emulsion liquid membranes, ELM) [
4,
5,
6]. The liquid membranes have been continuously developed because they ensure transport selectivity, allow chemical reactions in the source, membrane and receiving phases, and can be made in various designs in order to meet process requirements (low investments, productivity, large contact surfaces, easy operation) [
7,
8,
9,
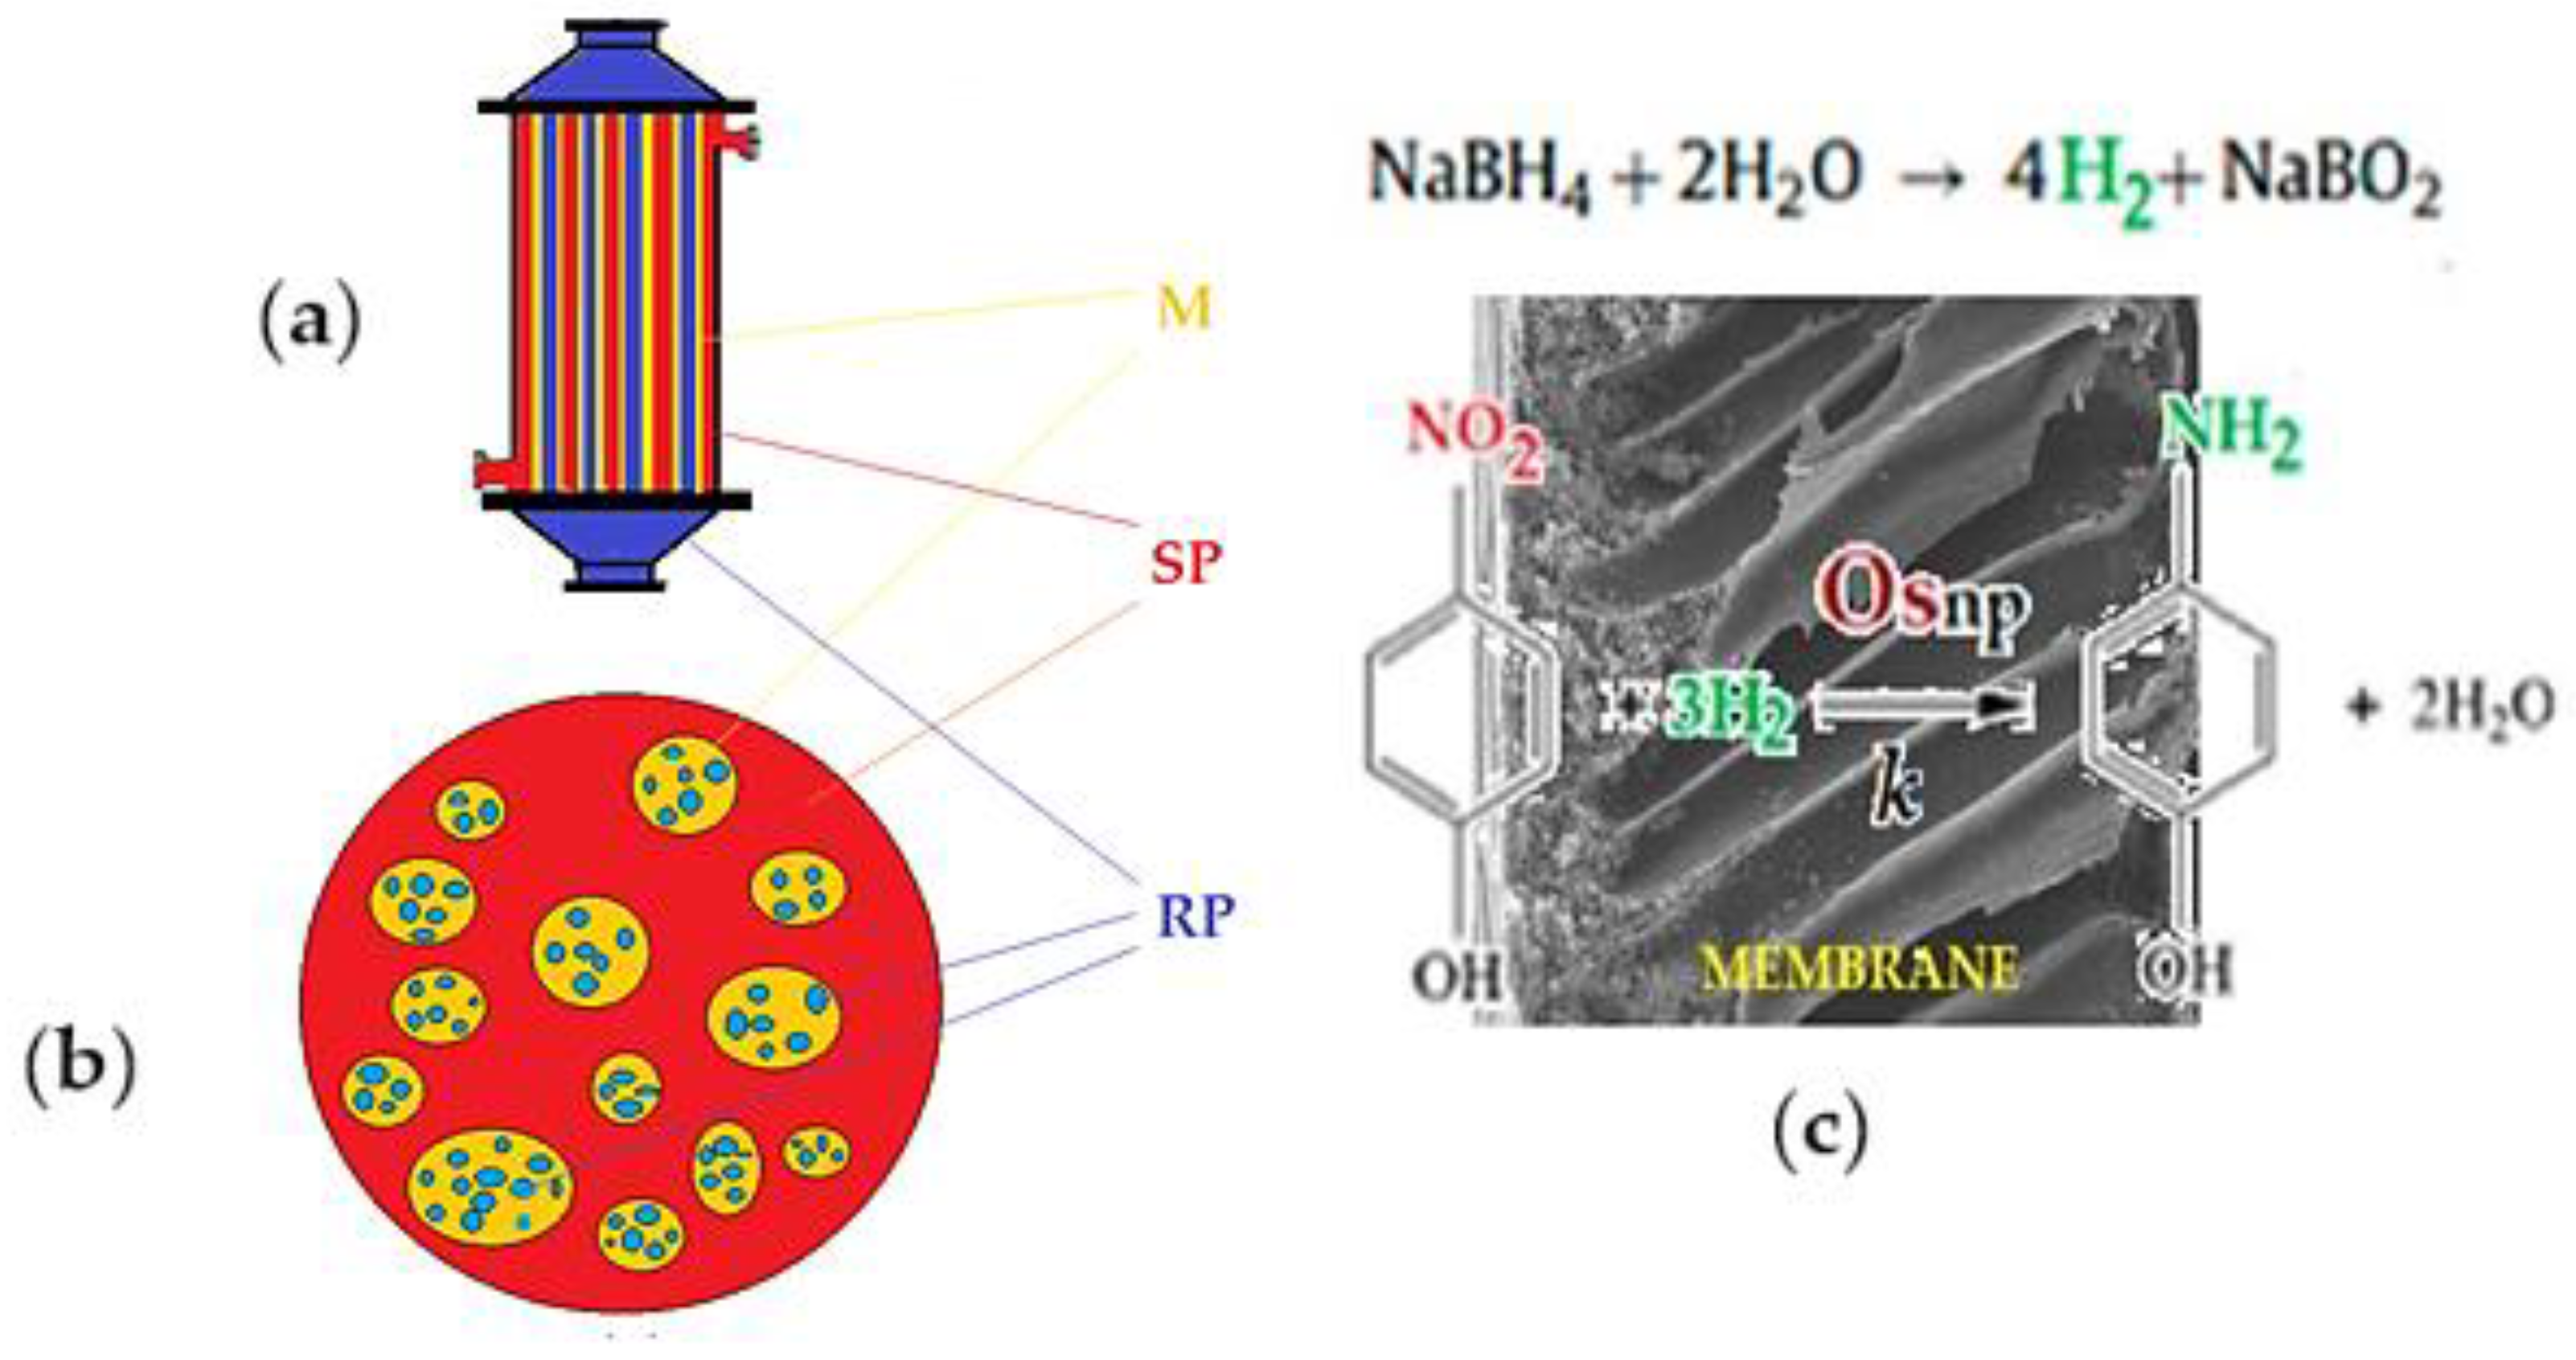
10]. From the scale-up point of view, SLM and ELM (Figures 1a and 1b) are in direct competition in order to optimize: the contact surface between the phases, the stability of the membrane and the losses of membrane material in the aqueous phases, the recovery of the solvent membrane and of the chemical species of interest [
11,
12,
13]. Liquid membranes, usually those based on organic solvent, consist of a pure solvent, a solution or a dispersion in which the continuous phase is the membrane solvent [
14,
15]. The chemical species that are added to the membrane solvent mainly have the role of transporter [
16], but more and more often they also ensure the catalysis of a reaction process that takes place in the membrane to favor the separation in the desired chemical form of the target chemical species (
Figure 1c) [
17].
In this work, the target chemical species is p–nitrophenol, both because it can be easily reduced with molecular hydrogen, and because this reaction can be observed through accessible means (UV-Vis, from yellow to colorless) [
18].
The reactive membrane systems recently tested for the reduction and separation of p–nitrophenol (pNP) from source aqueous solutions, use polymers as membrane phases (
Figure 1c) or medium-chain n–alcohols, in which nanoparticles are dispersed [
19,
20,
21,
22,
23].
The source of metallic osmium is represented by the remains (waste) of osmium tetroxide (OsO
4) recovered in a polar or non-polar solvent, which makes it usable in reactions a homogenous medium, which aim to obtain osmium nanoparticles, through reduction [
19,
20].
The osmium recovery process involves fixing or removing oxygen from osmium tetroxide (equation (1)):
Of course, it is preferable that the reductant or its reaction products are not necessarily removed from the reaction mass [
22,
23,
24,
25,
26].
The osmium nanoparticles obtained in this way were used both in oxidation and reduction processes with membrane systems [
19,
20], but the proposed membrane systems did not have the expected impact among researchers. The reluctance that researchers have regarding the use of osmium as catalyst refers in particular to its toxicity, related to the increased volatility of osmium tetroxide, but also to the aggressiveness of this oxide on the human body, since tetroxide seems to react with the side chains of the proteins [
27,
28,
29]. Thus, because of the concerns regarding the toxicity of osmium, but mainly due to the apparent reaction rate constant close to, but lower than most nanometric catalysts, based on platinum metals, it was less often used [
30,
31,
32,
33,
34,
35,
36,
37,
38] (
Table 1).
The data in
Table 1 were calculated similarly to the comparison data, taking into account the most probable kinetic equation (2) [
38,
39]:
where
C and
C0 are the concentrations (in mg/L) of pNP at
t=0 and
t≠
0, respectively,
t being the reaction time,
k being the reaction rate constant (mg/(L×min)),
K being the adsorption coefficient of the reactant (L/mg), and
kapp (s
−1) being the apparent catalytic rate constant when the concentration (
C0) is very low [
34,
35,
36,
37].
The reaction kinetics describe the pNP reduction as a reaction of a pseudo first-order reaction [
30,
31,
32,
33,
34,
35,
36,
37,
38,
39]. On the other hand, the osmium nanoparticles were synthesized by various procedures, depending on their destination [
40,
41,
42,
43,
44,
45,
46,
47,
48,
49].
In this paper we study nanodispersions with osmium nanoparticles obtained by synthesis from osmium tetroxide reduced with undecenoic acid in n–dodecanol (nDD) or n–decanol (nD) medium. The catalytic activity was determined by the reduction of p–nitrophenol (pNP) to p–aminophenol (pAP) in an emulsion membrane system. In this case, the membrane in the emulsion membrane system is the osmium nanodispersion in the chosen organic solvent, the source phase is an aqueous solution of p–nitrophenol and sodium tetraborate, and the receiving phase is an acidic aqueous solution.
2. Results
The obtained results in this work were systematized in:
Morphological characterization of nanodispersions in n–dodecanol by transmission electron microscopy (TEM), scanning electron microscopy (SEM) and dynamic light scattering (DLS);
Compositional characterization of nanodispersions in n–dodecanol performed by energy-dispersive spectroscopy analysis (EDAX) and thermal analysis coupled with gas chromatography (GC) and Fourier Transform InfraRed spectroscopy (TA–GC–FTIR);
Determination of the process performances of nanodispersions of osmium particles in n–decanol or n–dodecanol for the reduction of p–nitrophenol.
2.1. Morphological Characterization of the Obtained Nanodispersions
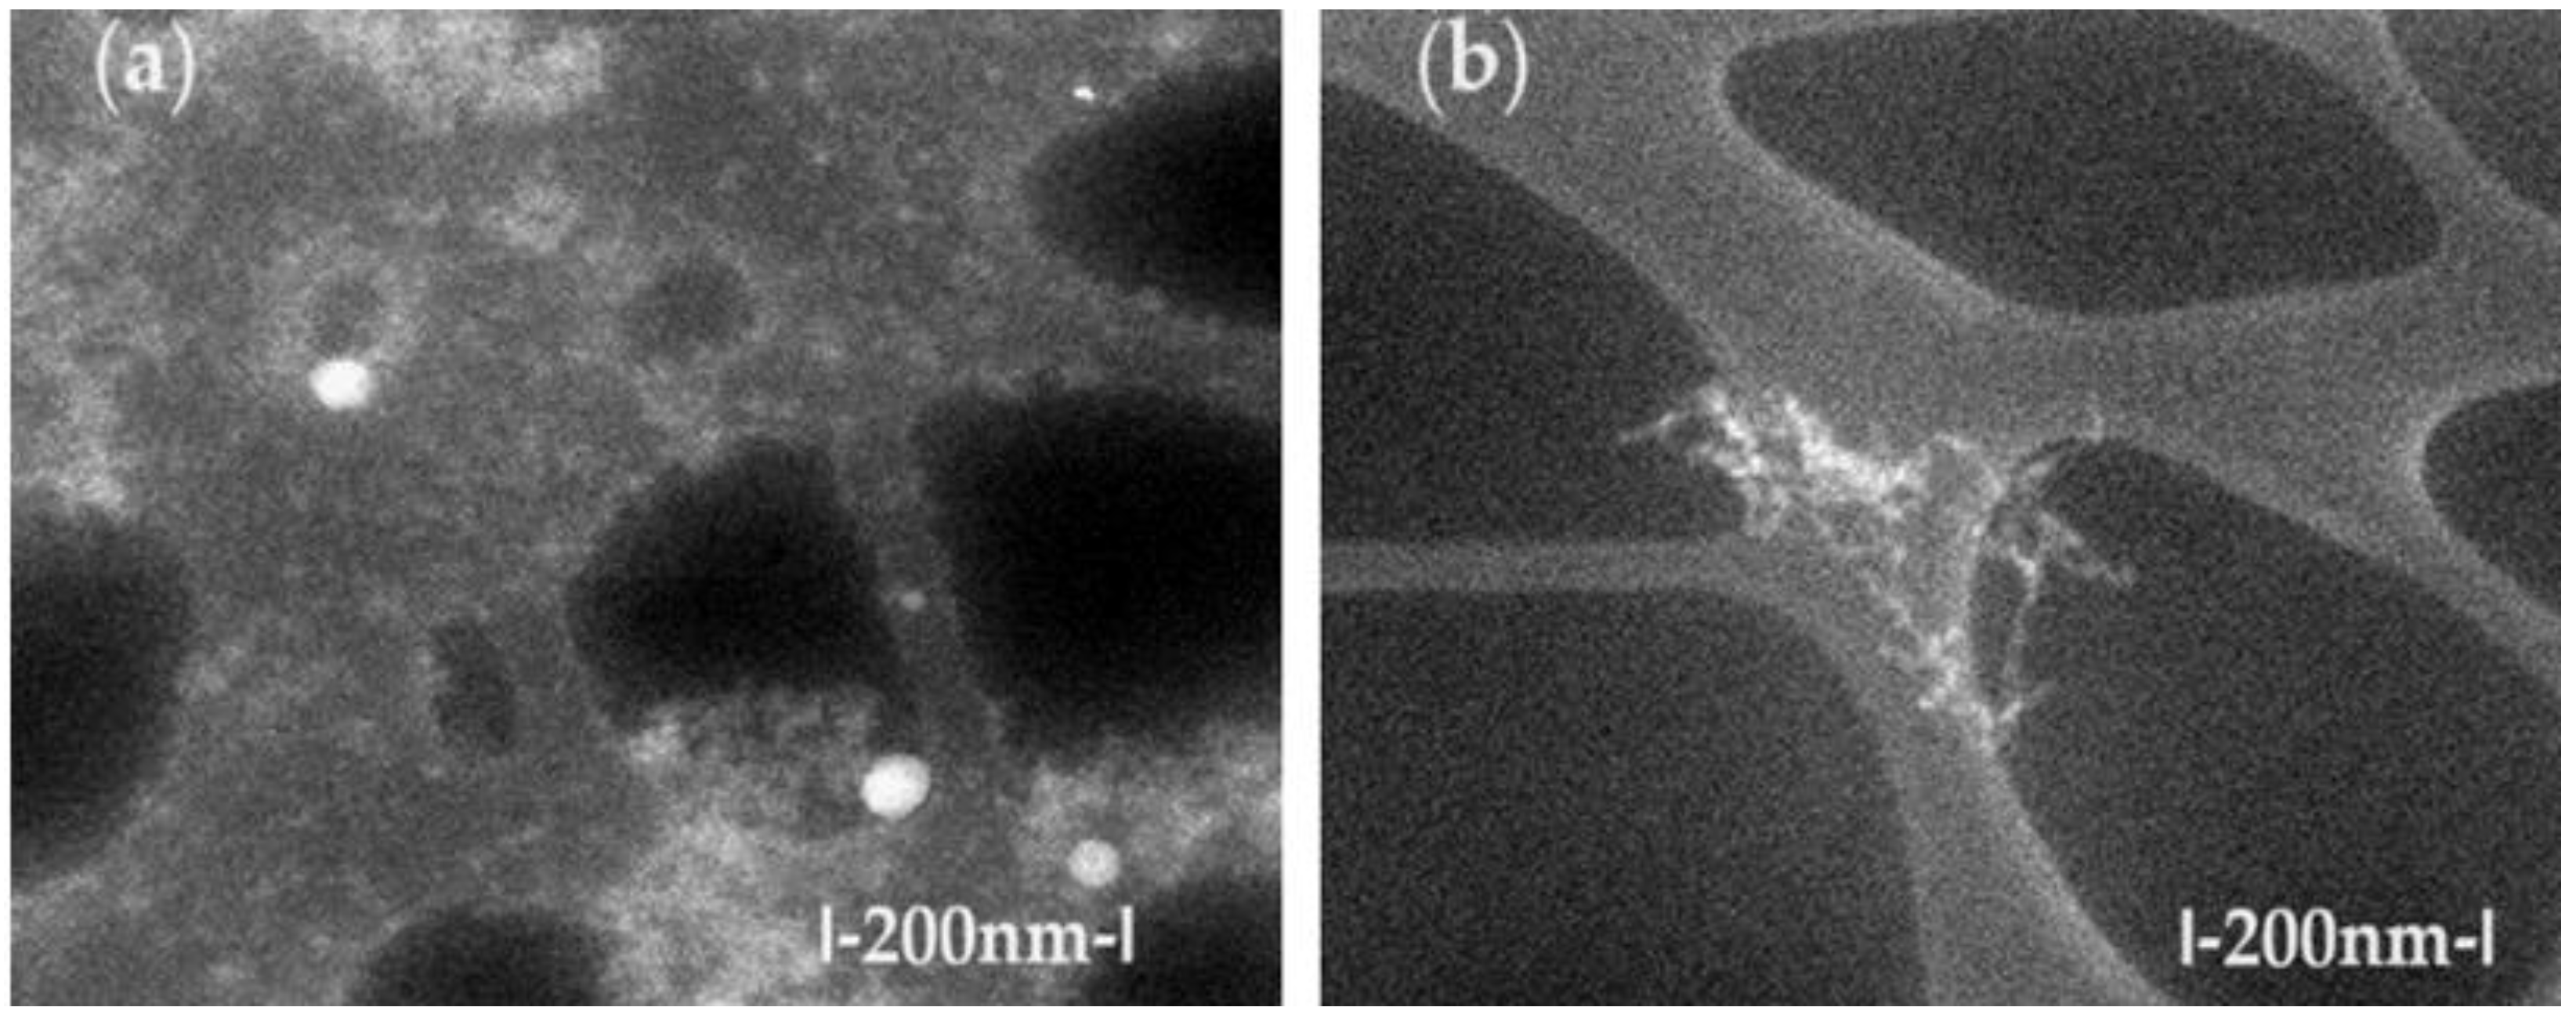
The TEM characterization of osmium nanodispersions in n–dodecanol was performed by washing with ethanol, which would have assumed the possibility of visualizing individual osmium nanoparticles. Unexpectedly, in the obtained images (
Figure 2), the sample has an alveolar appearance with walls containing osmium nanoparticles. We can state that, despite the sample preparation (washing) with ethanol, the osmium nanoparticles remain covered by the organic solvent. Thus, the observed aggregates separate in the alveolar walls containing n–dodecanol, both before the p–nitrophenol reduction process (
Figure 2a) and after processing (
Figure 2b). Unfortunately, this organic coating prevented the increase in the resolution of the images, because the sample shows an internal combustion of the alcohol with the osmium nanoparticles, which is practically highlighted by the disappearance of matter in the examined areas. The affected areas present themselves as bright spots, confirming an observation previously described in the literature [
30].
Although they were difficult to obtain, the images allow the observation of aggregates of osmium nanoparticles as well as individual particles of about 10–50 nm.
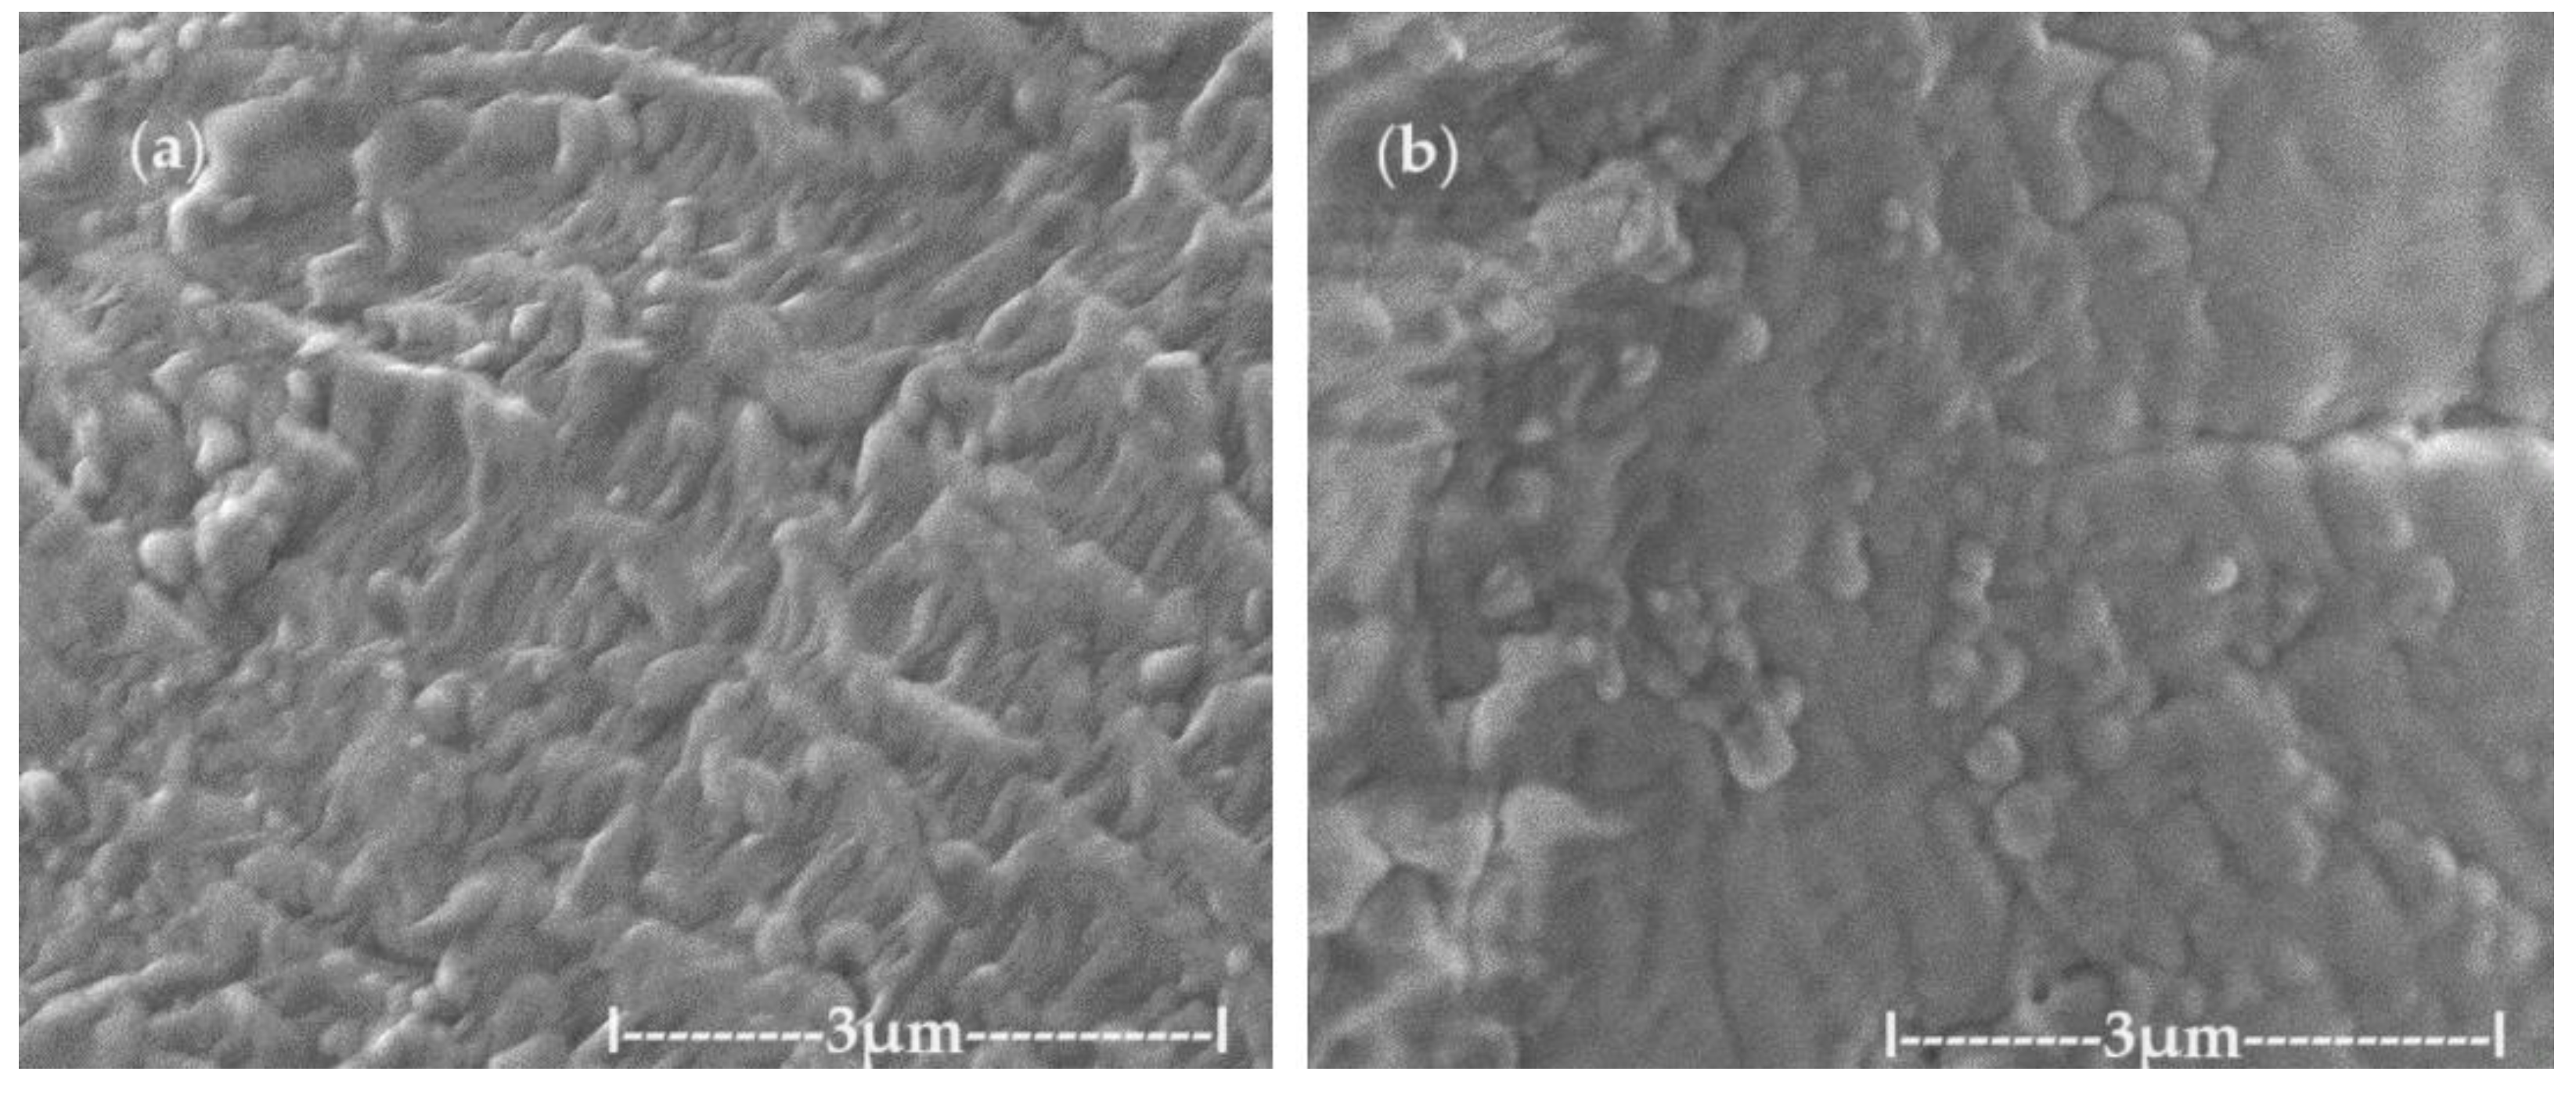
In order to avoid the oxidation observed in the transmission electron microscopy (TEM) analysis, scanning electronic microscopy (SEM) examination was attempted. Thus, the dispersion deposited on an aluminum support was dried in vacuum and covered with a 50 nm gold film. Through this process, overheating of the sample was avoided, obtaining the morphology of the aggregates from the primary nanodispersion of osmium/ n–dodecanol (
Figure 2a) and those obtained after the p–nitrophenol reduction process (
Figure 2b). After processing in the p–nitrophenol reduction process, the morphology of the dispersions does not change drastically (
Figure 2b), but the aggregates of osmium nanoparticles are more easily visible.
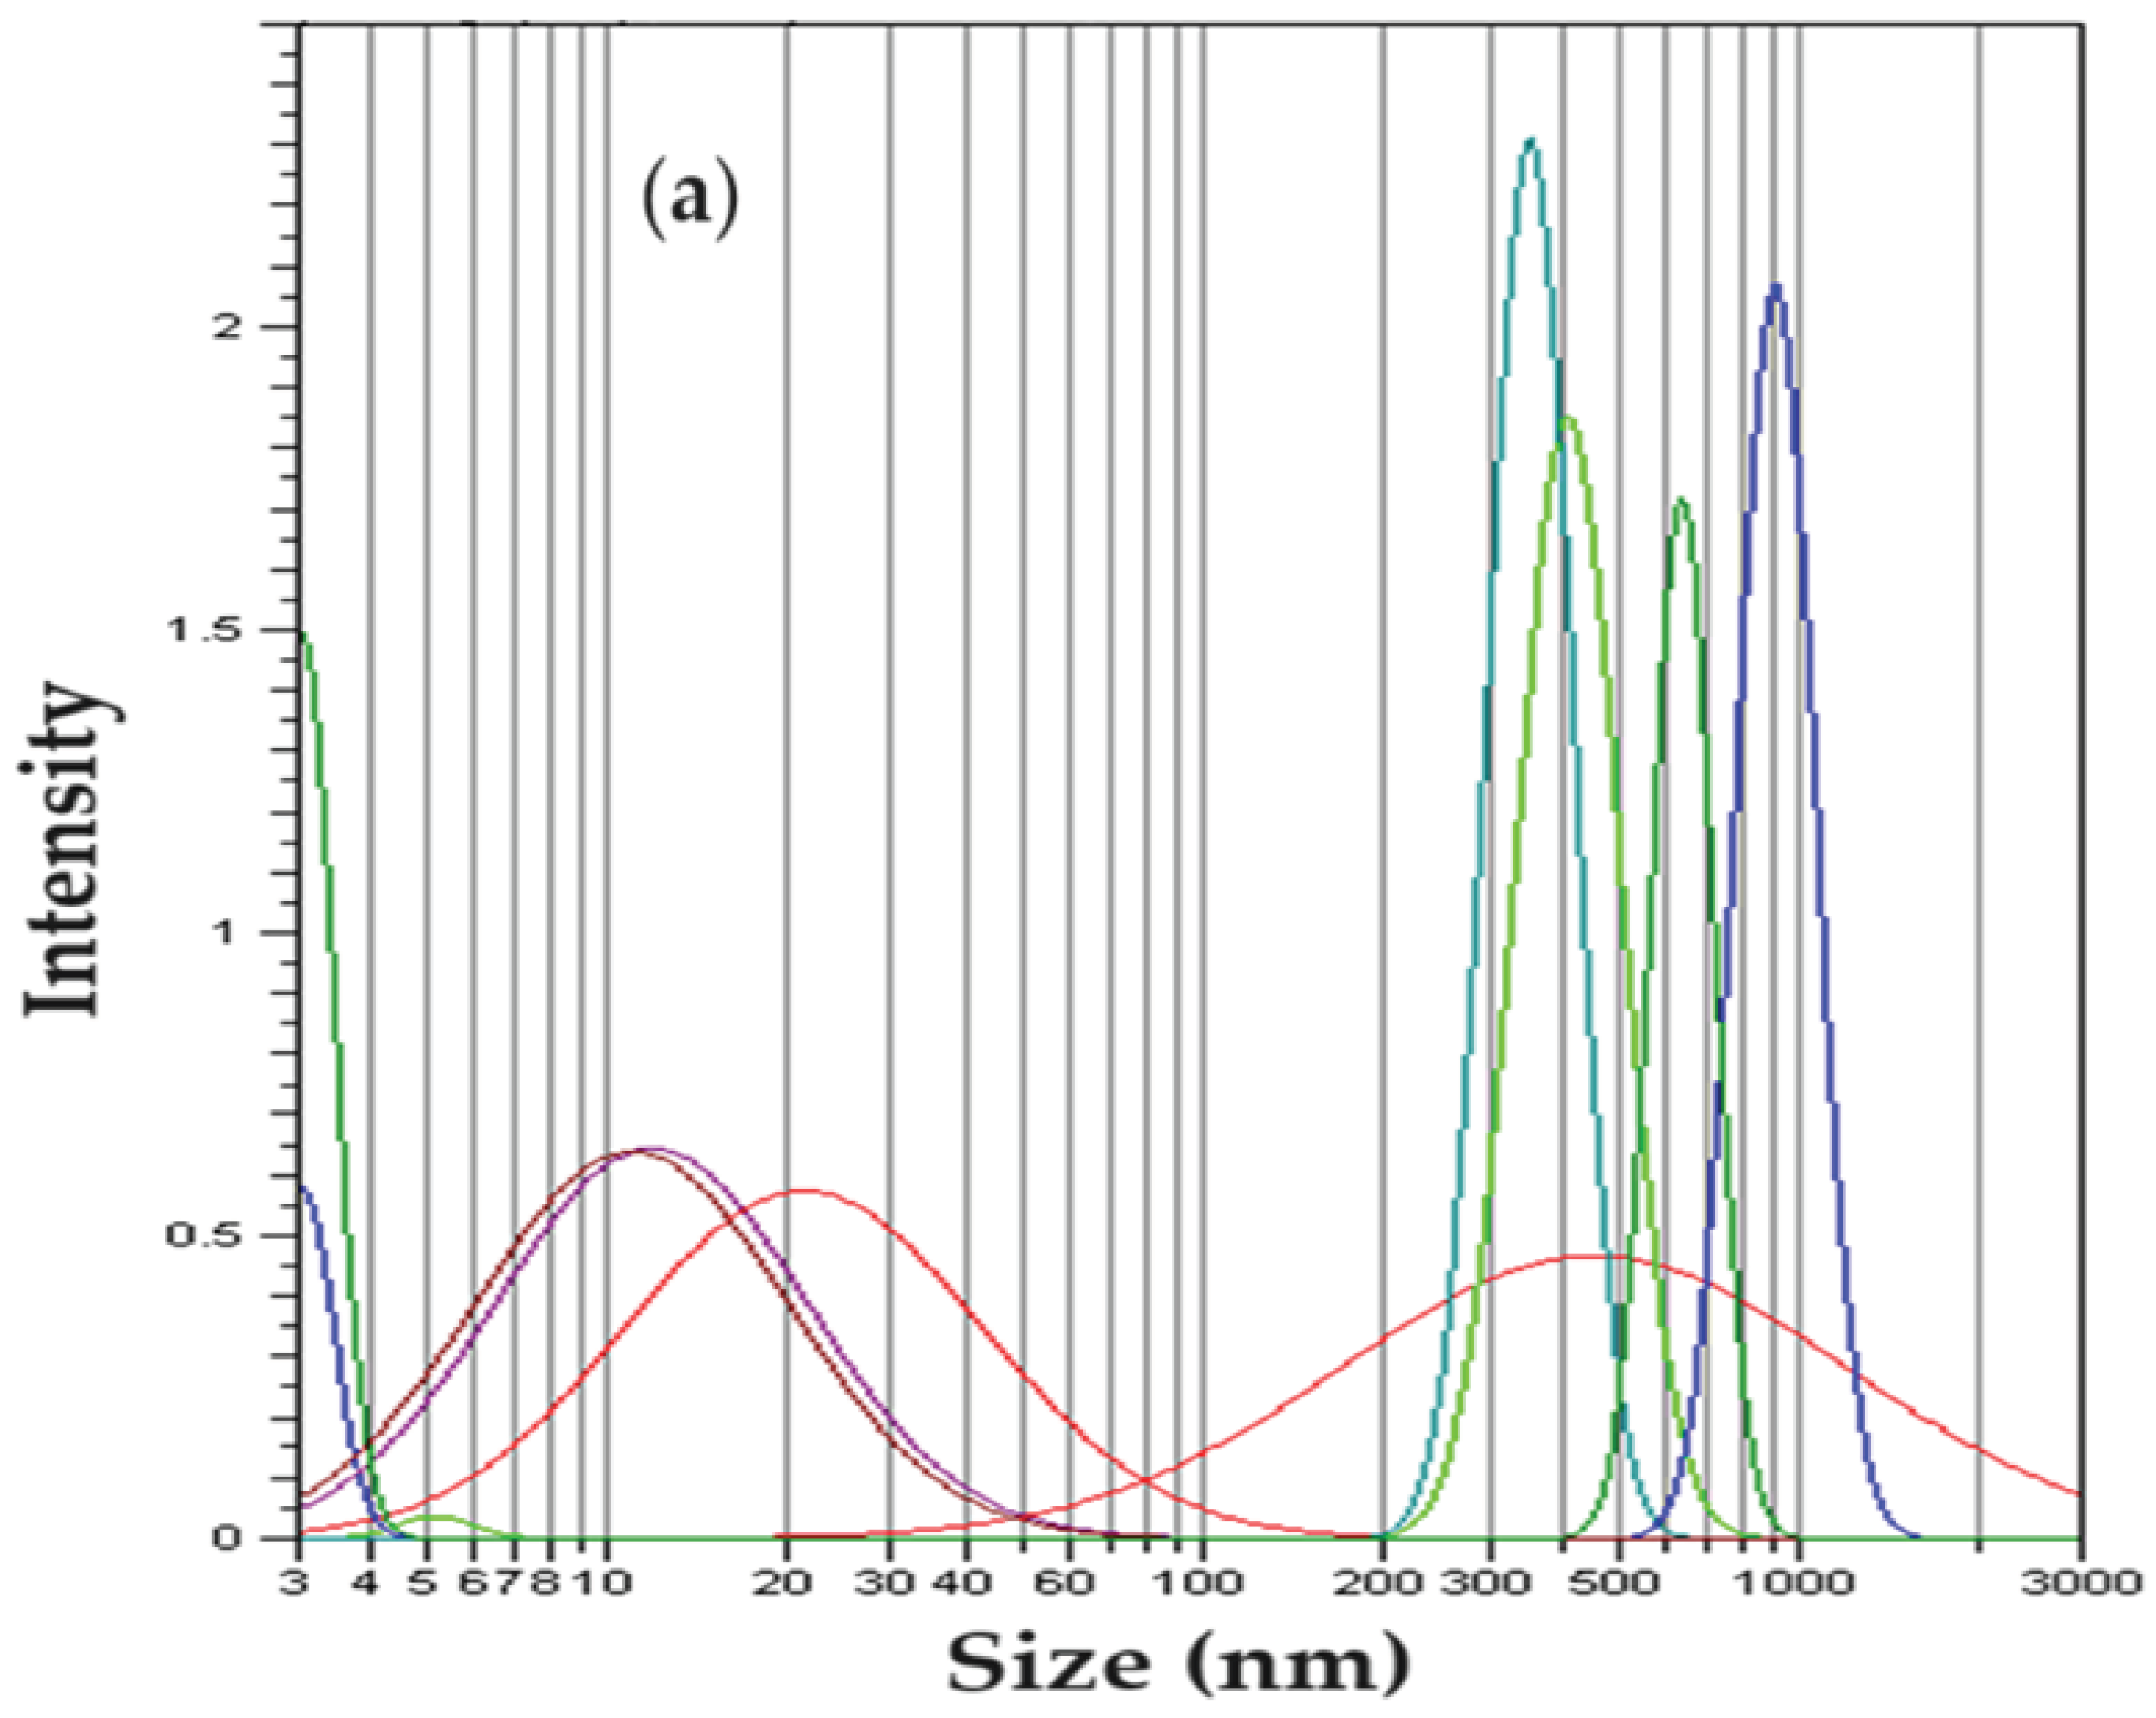
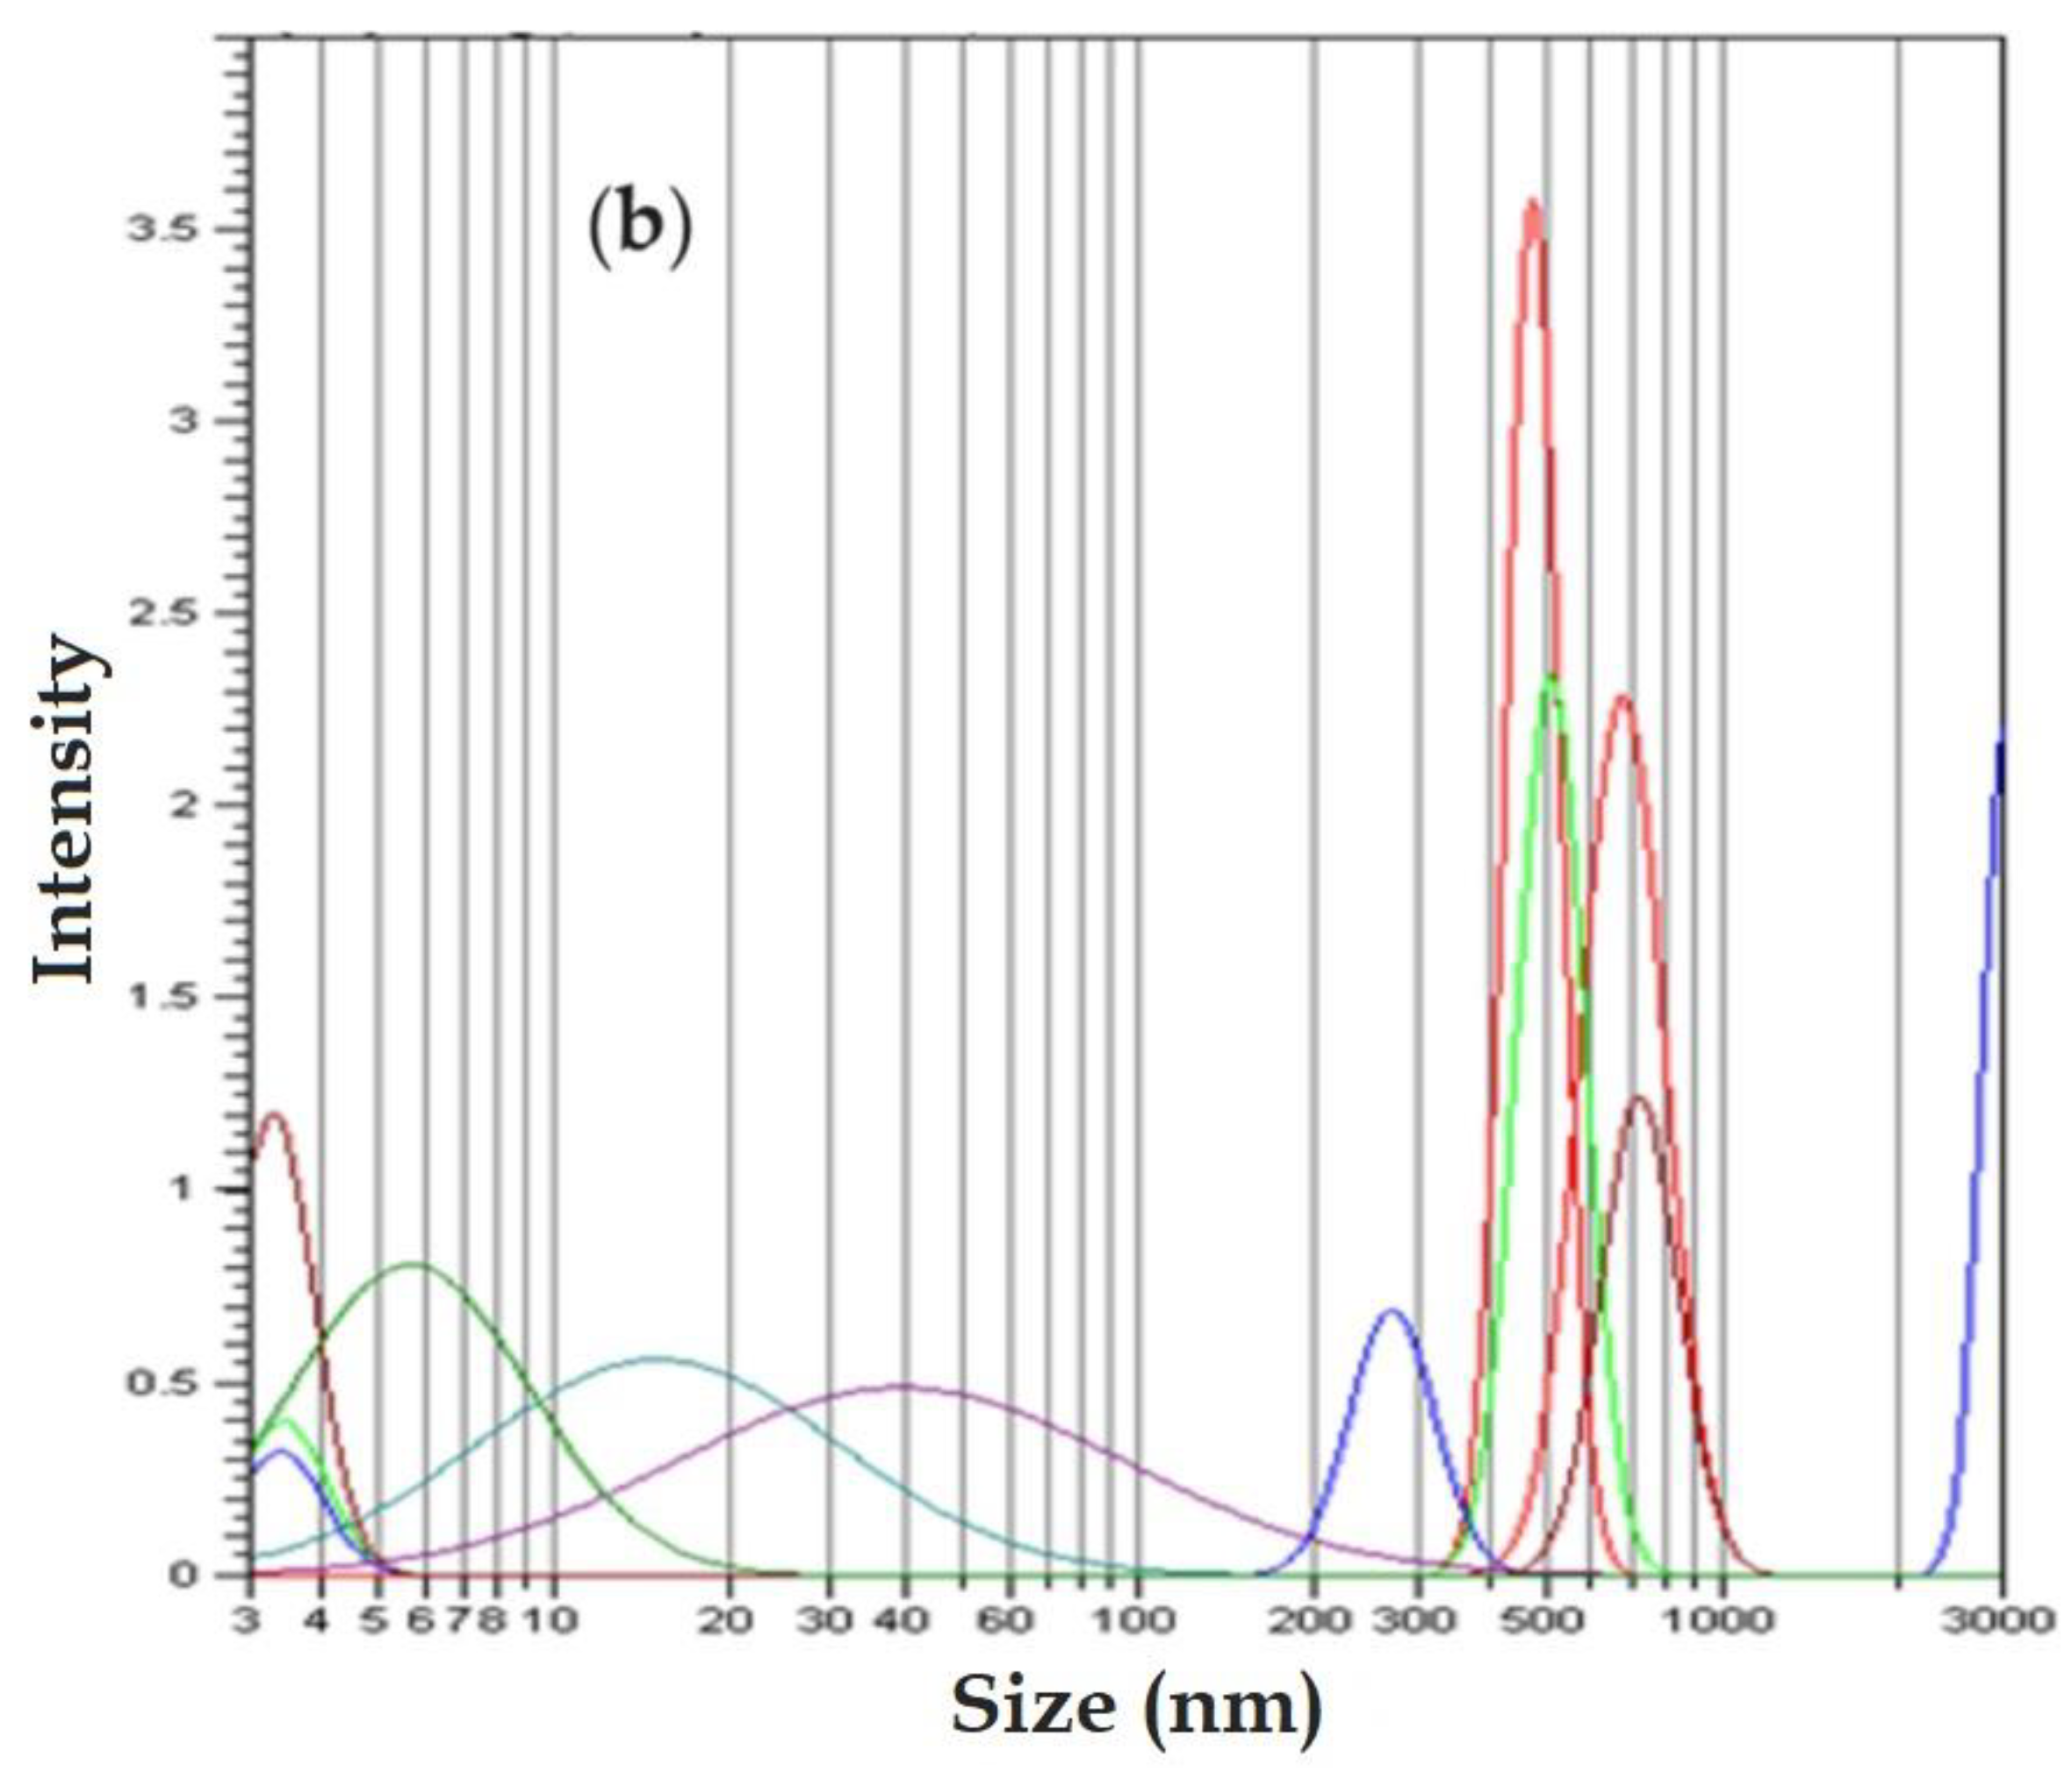
In order to obtain the size of osmium nanoparticles and their aggregates, dynamic light scattering (DLS) analysis was performed, after dispersing the sample in isopropyl alcohol.
Dynamic light scattering (DLS) analysis shows two-peak curves of some Gaussian-type distributions (
Figure 4). The analysis of the dimensional distribution of the nanodispersion before use in the reduction process of p–nitrophenol (
Figure 4a) does not essentially differ from the dimensional distribution of nanodispersion after the reduction process (
Figure 4b). It can be stated that the particles in nanodispersion have approx. 5–20 nm, and the aggregates of nanoparticles have sizes between 0.3 µm and 1.1 µm.
The dimensional analysis of nanodispersions of osmium nanoparticles in n–dodecanol provides the following information:
Transmission electron microscopy (TEM) reveals agglomerations of nanoparticles from 10 nm to 30 nm both before and after the processing of the nanodispersions in the reduction process of p–nitrophenol;
Scanning electron microscopy (SEM) image analysis confirms the nanoparticle sizes in the nanodispersion;
Dynamic light scattering (DLS) analysis most relevantly indicates the size of nanoparticles in the range of 5 nm to 20 nm, as well as aggregates of nanoparticles with dimensions of 0.3 µm to 1.1 µm.
2.2. Compositional Characterization of the Obtained Nanodispersions
The composition of the dispersion of osmium nanoparticles had the following objectives:
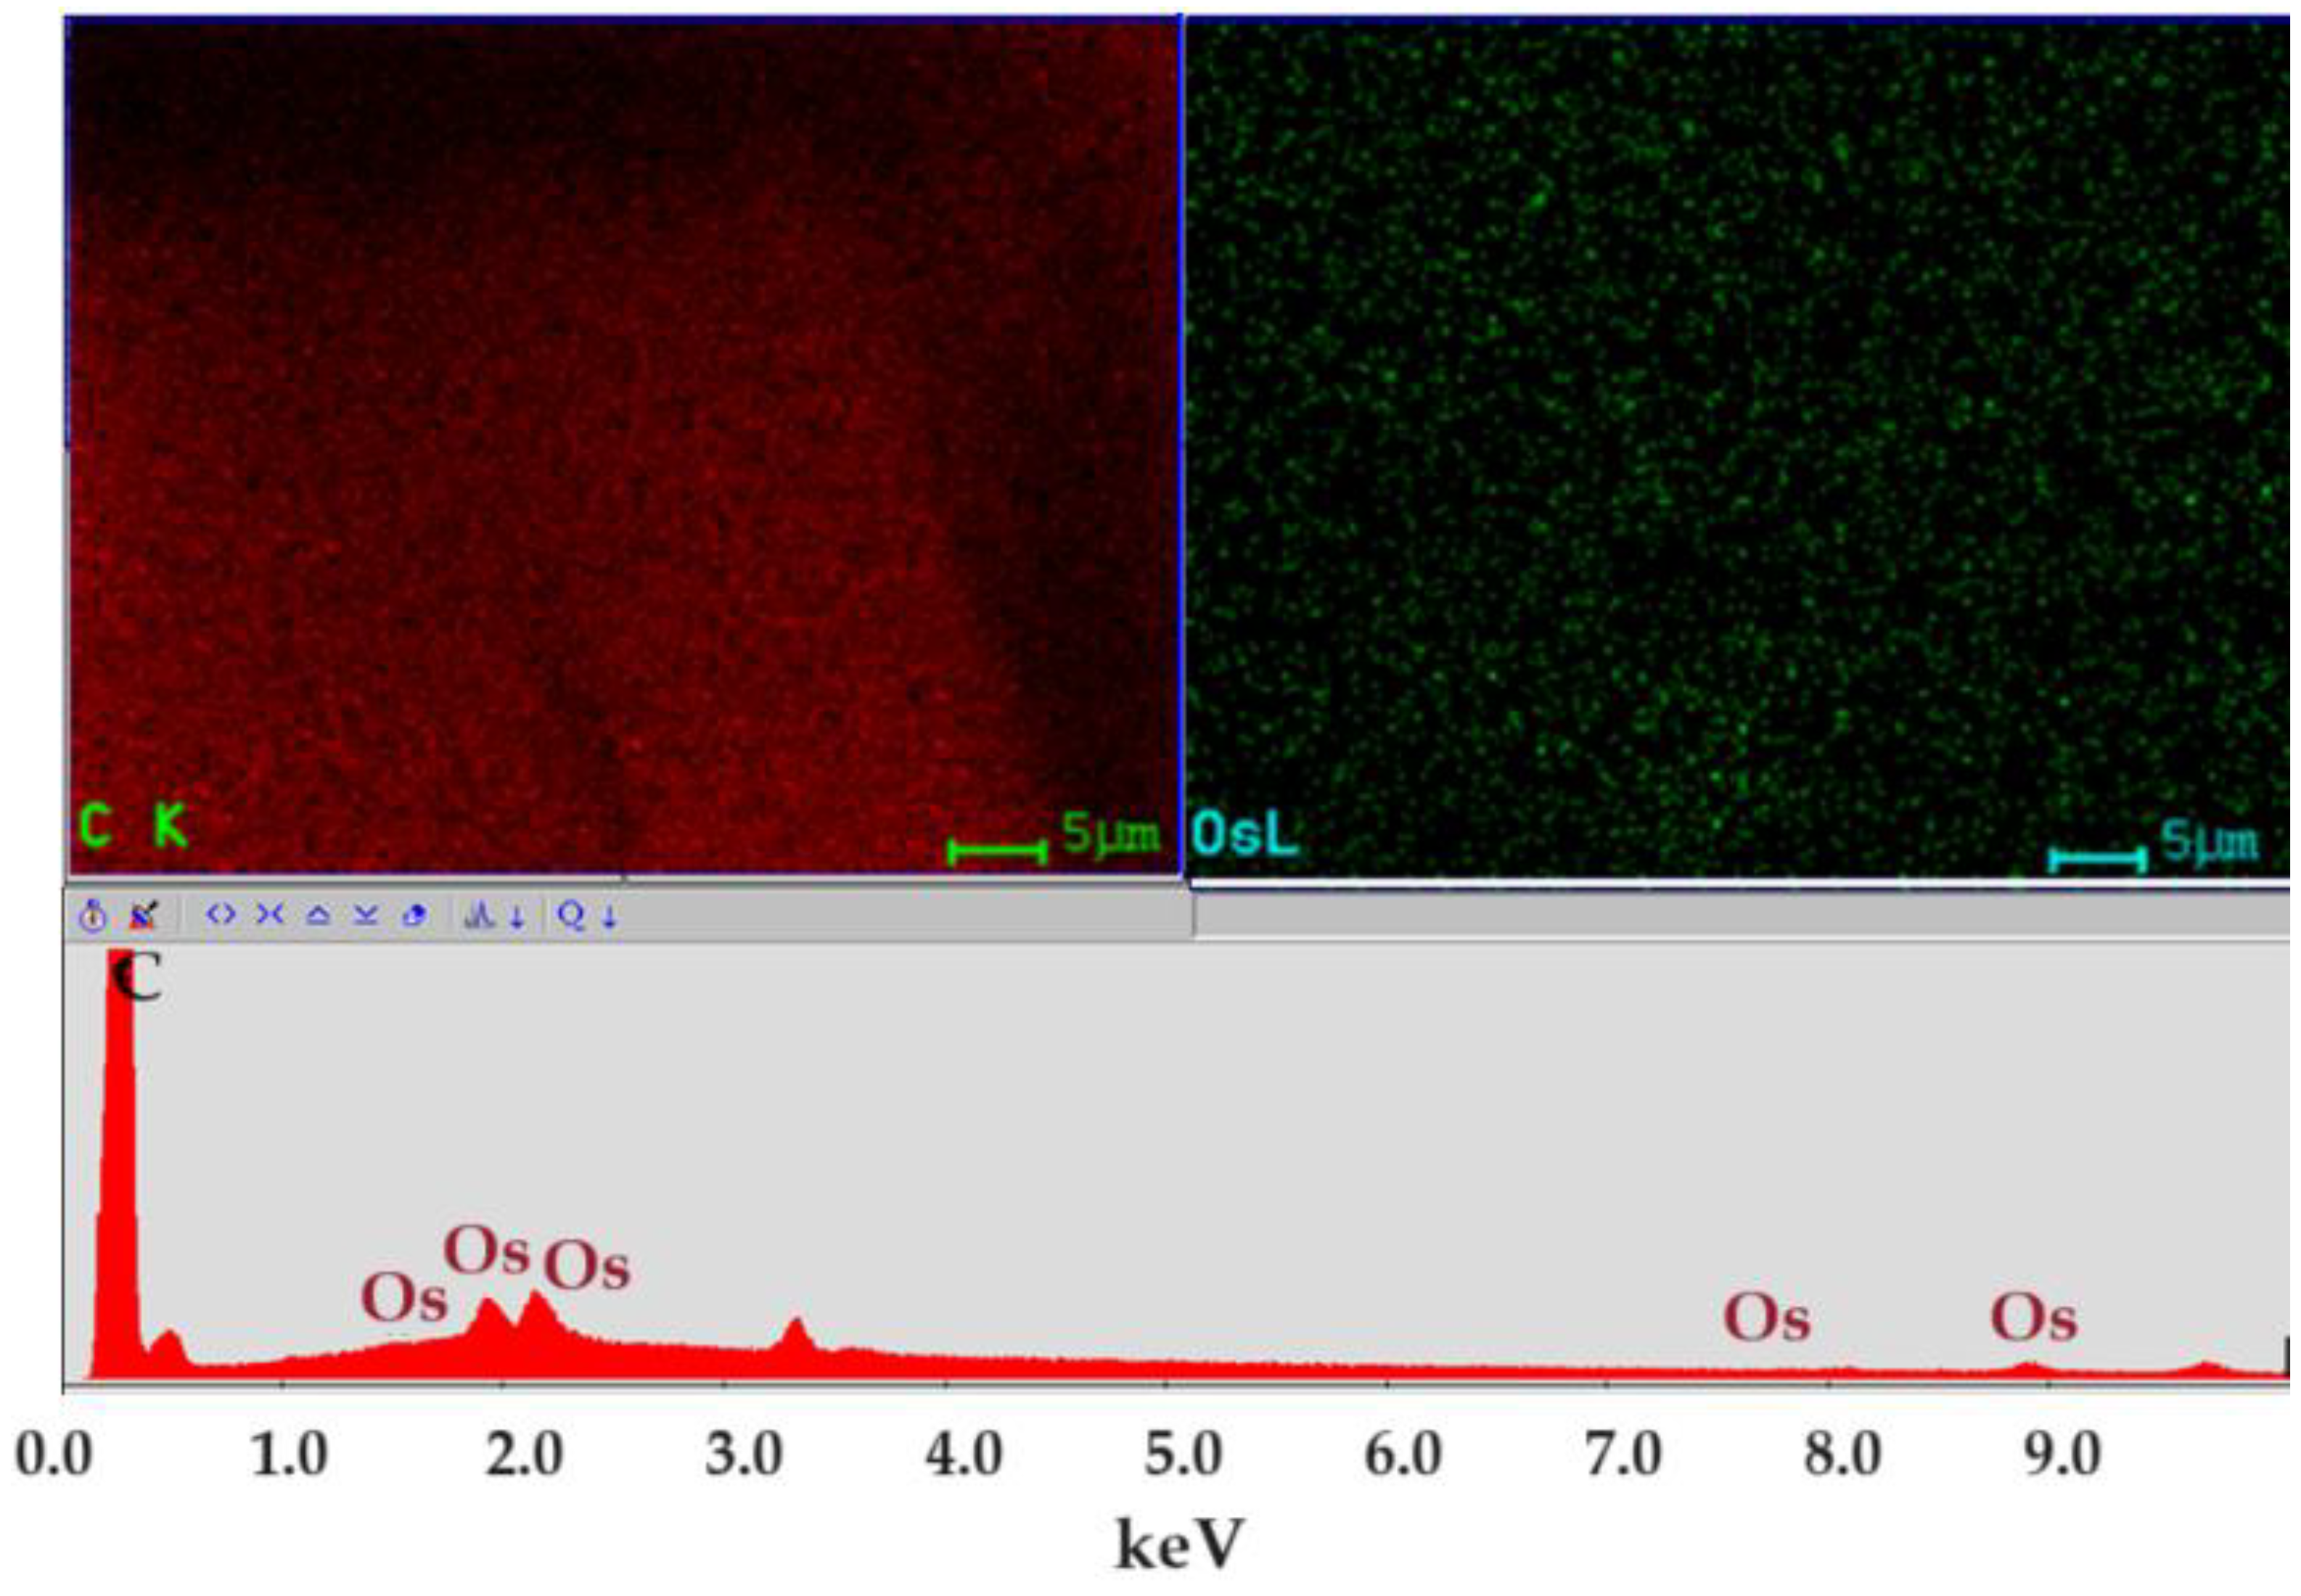
Determination of the composition and distribution of nanoparticles in nanodispersion by energy-dispersive spectroscopy analysis (EDAX).
Determination of the composition of the solvents that remain in the nanodispersion after repeated washing with water by thermal analysis coupled with gas chromatography and Fourier transform infrared spectroscopy (TA–GC–FTIR).
Figure 5 shows the spectrum of the nanodispersion in which the carbon atoms generated by organic solvents and elemental osmium are present. The distribution map of the two elements is uniform in nanodispersion, which ensures its stability.
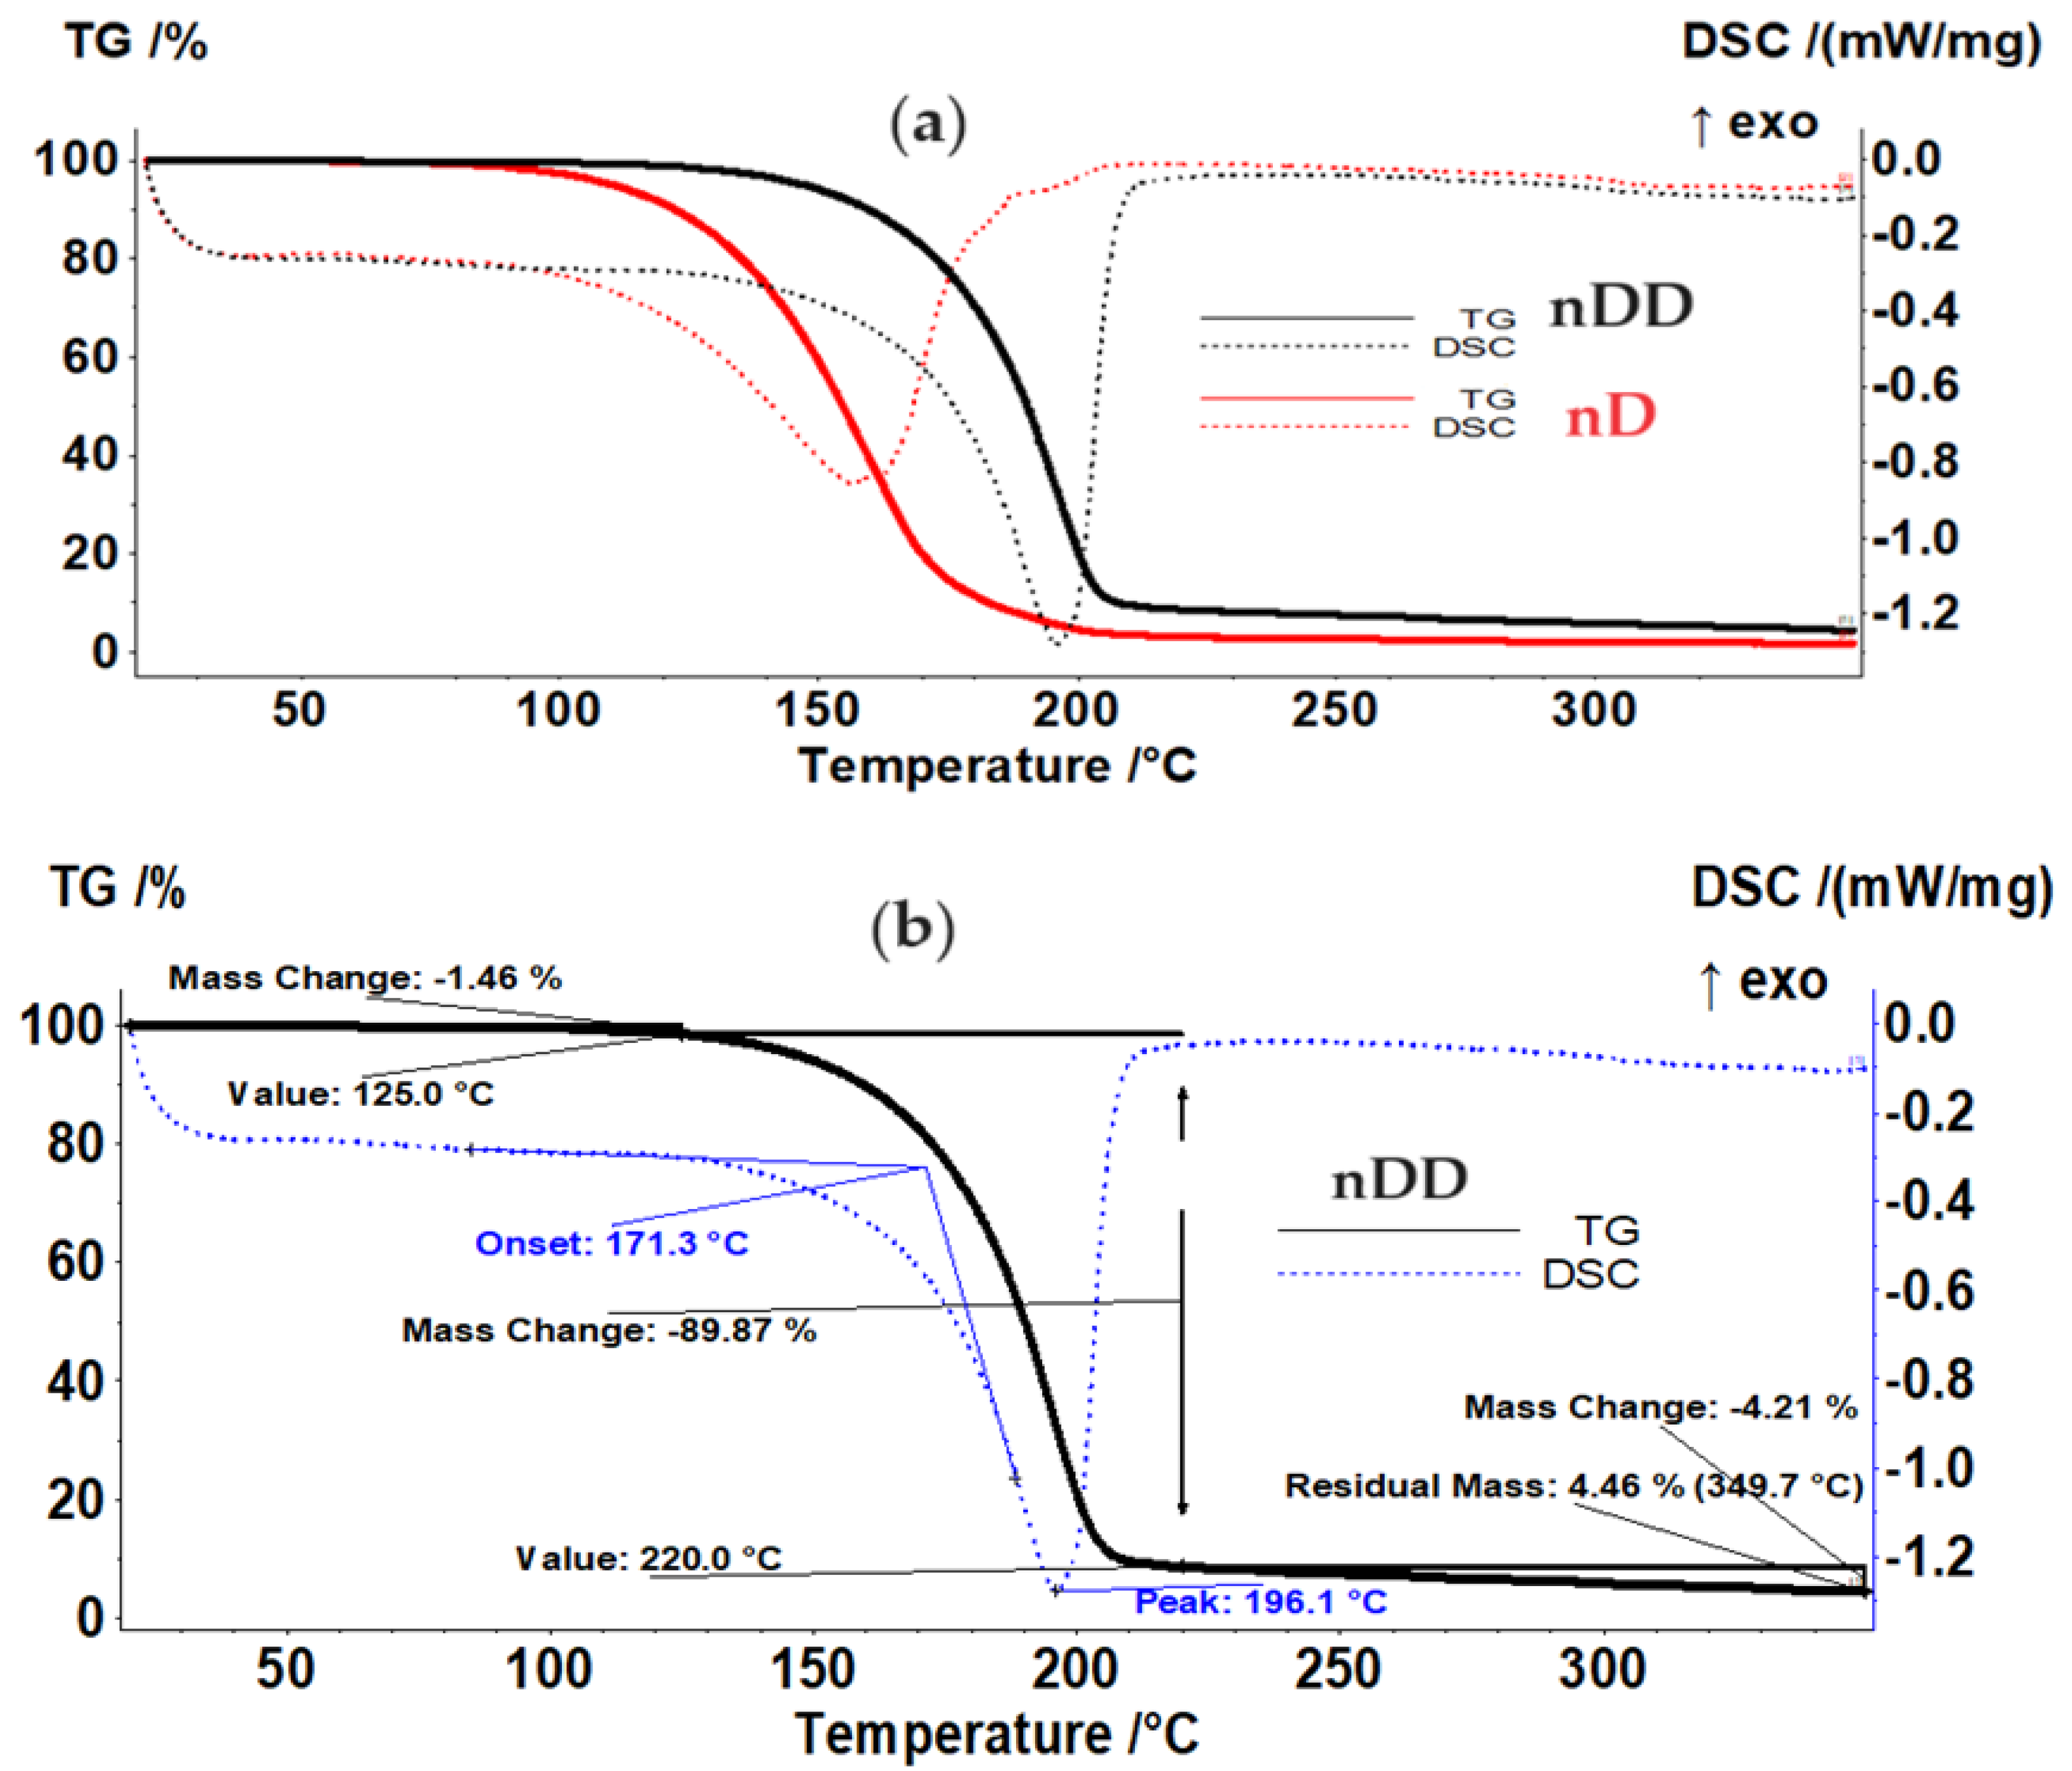
Thermal analysis (TG and DSC) was performed to determine the composition of the solvents in nanodispersion. The analyses were carried out in an N2 atmosphere, so no oxidation of the organic substance or osmium is foreseen.
Os/n–dodecanol (nDD) dispersion in comparison with n–decanol (nD) dispersion sample (
Figure 6a,
Table 2) is starting to lose the liquid part over 125 °C, the evaporation between 125–220 °C representing 89.87% of the initial mass. The process is accompanied, on DSC curve, by an endothermic effect with the minimum at 196.1 °C, generated by the evaporation of the solvent, undecylenic acid, but the boiling point is lower than the value reported by literature, i.e.
, 275 °C. The residual mass is 4.46% and is consisting of osmium compounds (
Figure 6b).
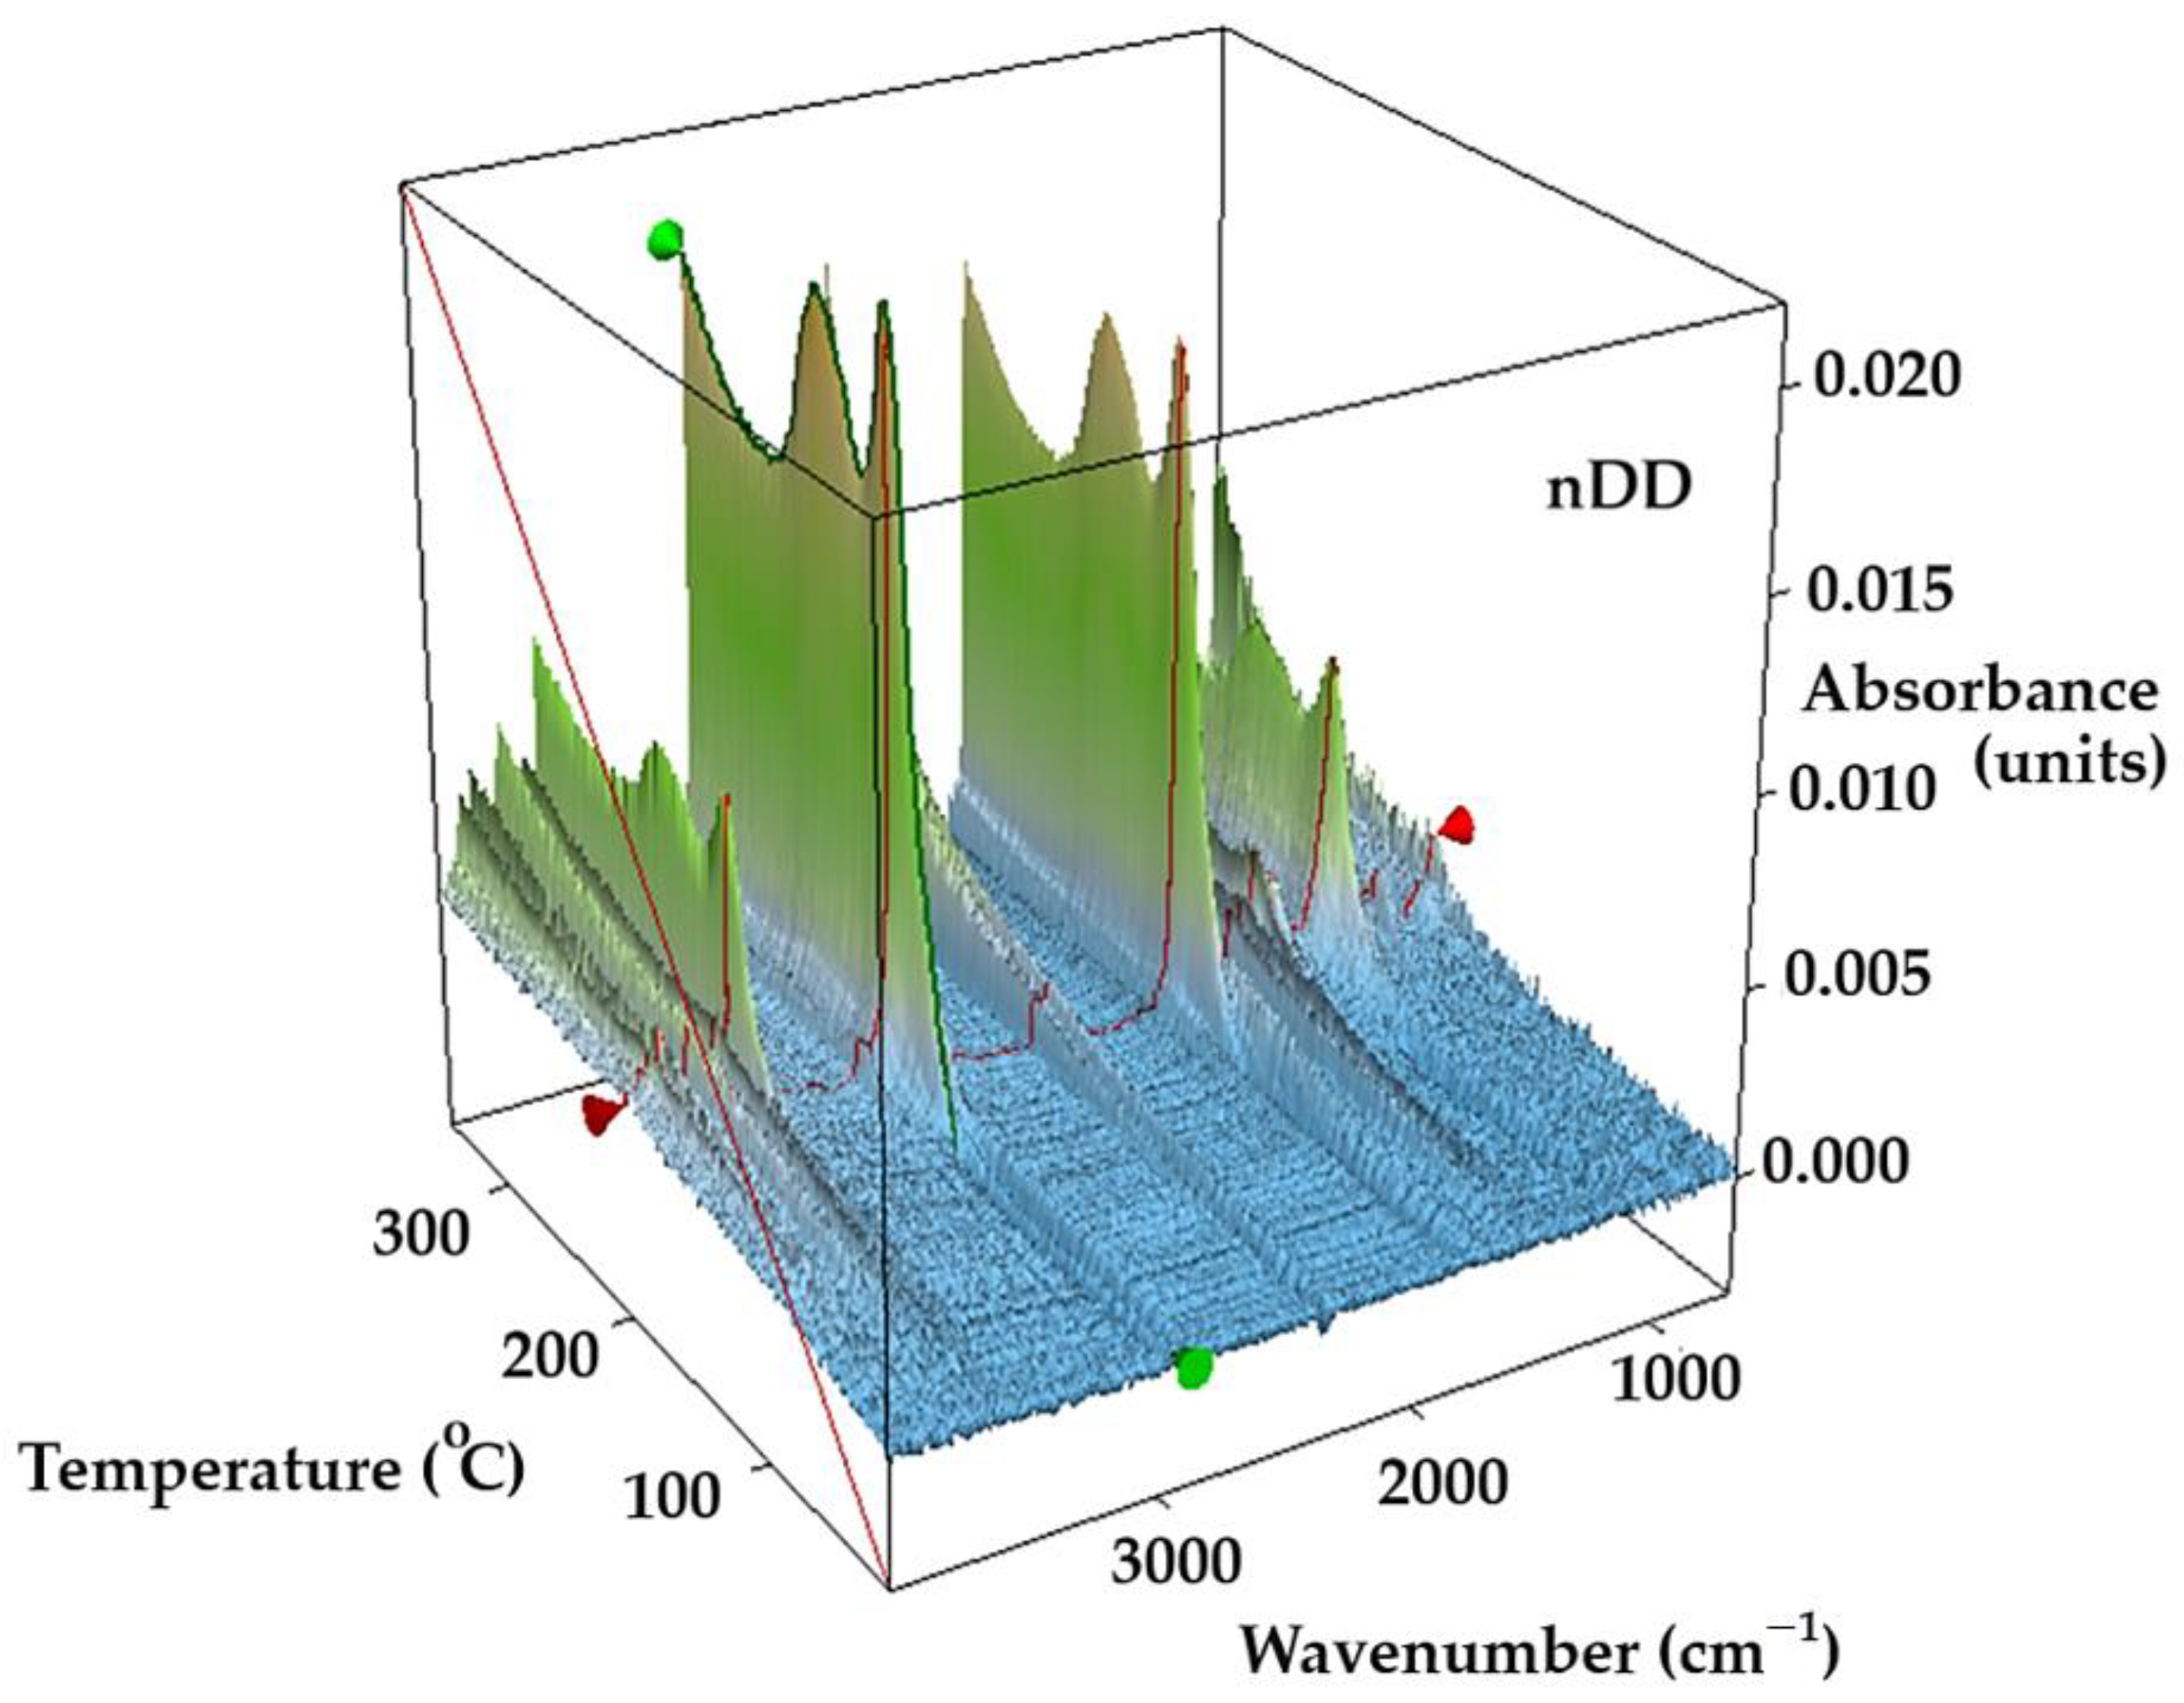
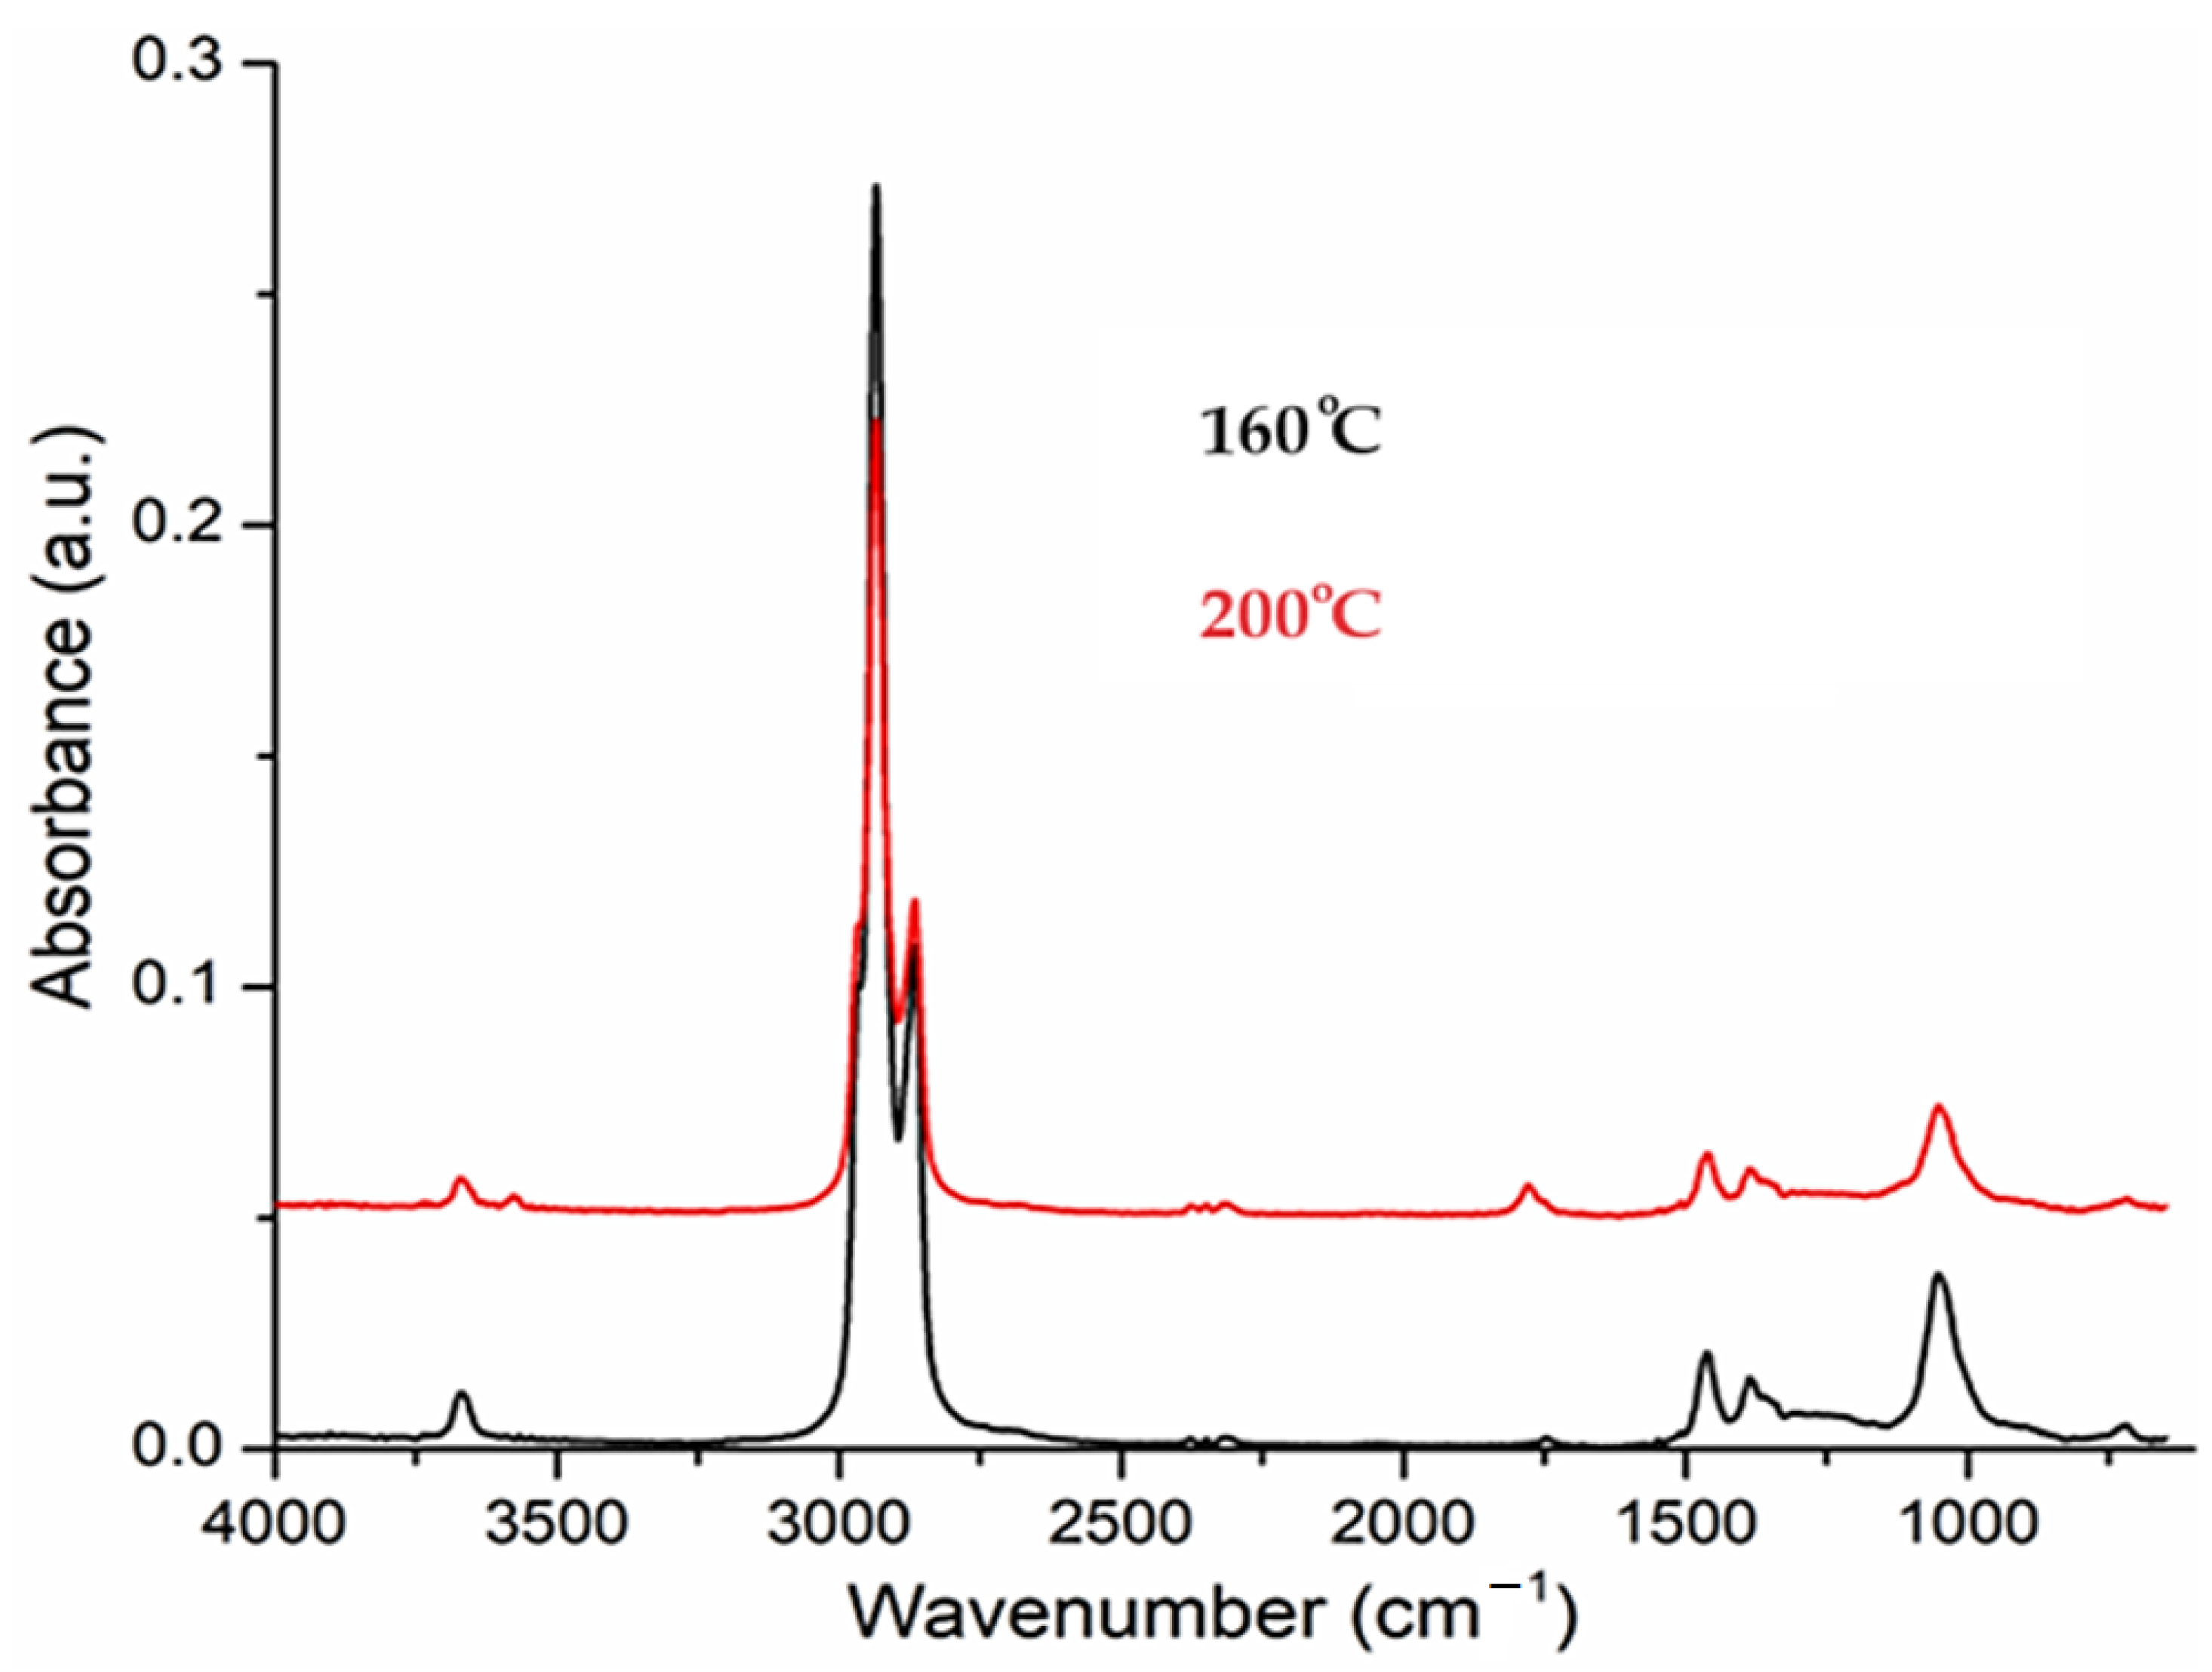
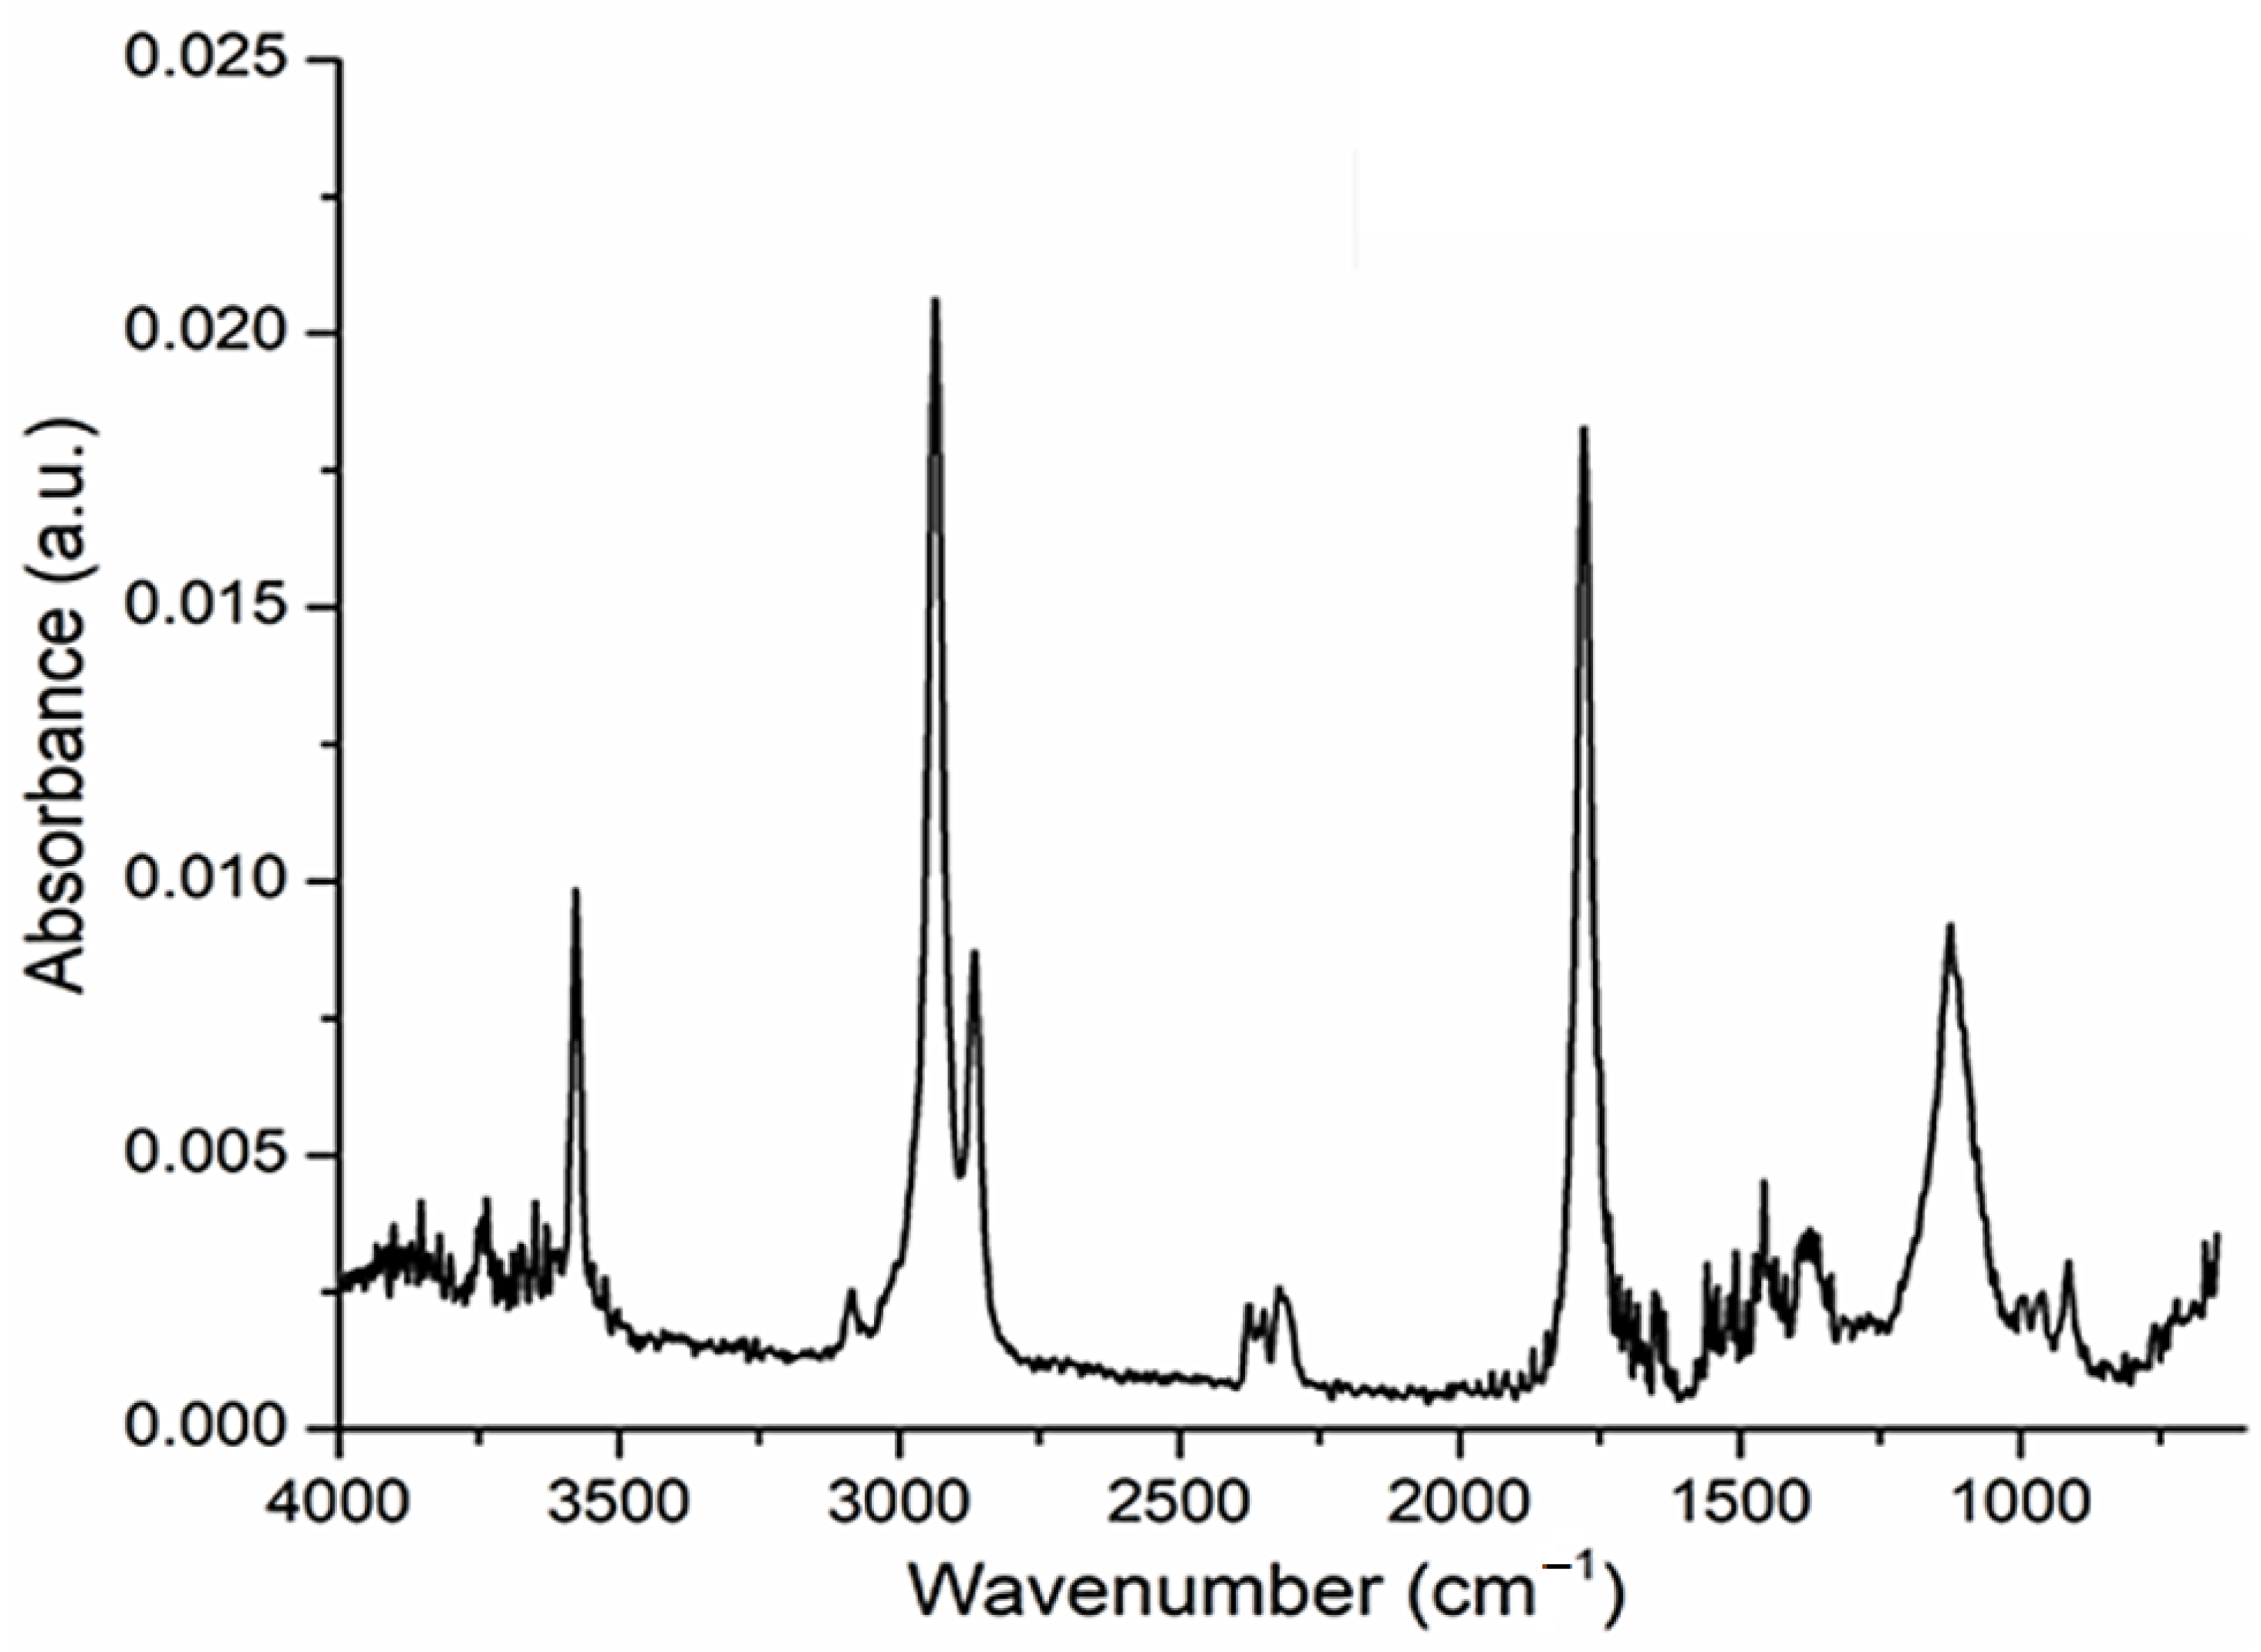
In the tridimensional FTIR spectra for Os–nDD up to 200 °C (
Figure 6), the presence of CO
2 is mostly seen at 2355 cm
−1, traces of CO at 2169 cm
−1, water, but also the corresponding vibration of Csp
3–H at 2964 cm
−1. A small peak is observed at 3072 cm
−1 corresponding to Csp
2–H fragments (
Figure 6 and
Figure 7) [
31].
As the temperature increases, the peak from 1721 cm−1 is attributed to C=O bond from undecylenic acid, which is eliminated at higher temperatures (
Figure 8) and is not completely consumed when preparing the dispersion by reduction [
20,
30,
31].
The compositional characterization of osmium nanoparticle nanodispersions in n–alcohols show that:
Osmium nanodispersions in n–dodecanol have the elemental composition (EDAX) which indicates the presence of carbon and osmium;
The distribution map (EDAX) of the two elements, osmium and carbon, shows uniformity on the surface;
The thermal analysis coupled with gas chromatography and Fourier Transform InfraRed (TA–GC–FTIR) of the n–dodecanol based nanodispersion highlights the presence of n–decanol, but also of unreacted undecylenic acid.
2.3. Determining the Process Performances for p–Nitrophenol Reduction
The performances evaluation of the nanodispersion of osmium nanoparticles in an emulsion membrane system with the n–dodecanol membrane was performed comparatively through parallel experiments with a similar nanodispersion in n–decanol [
20,
30].
The chosen chemical species for conducting the experiments is p–nitrophenol, for which the specialized literature provides numerous and conclusive data (
Table 1). At the same time, p–nitrophenol is a toxic substance that is easy to follow spectrophotometrically, when it passes, through reduction, in p–aminophenol [
20,
30,
31,
32,
33,
34,
35,
36,
37,
38,
39]. In this paper, the accuracy of the determinations is ±1%, imposed both by the method of sampling and preparation of the samples, as well as by the interaction of the chemical species dissolved in the aqueous phase with nitrophenol (alkaline medium, sodium ions, n–alcohols).
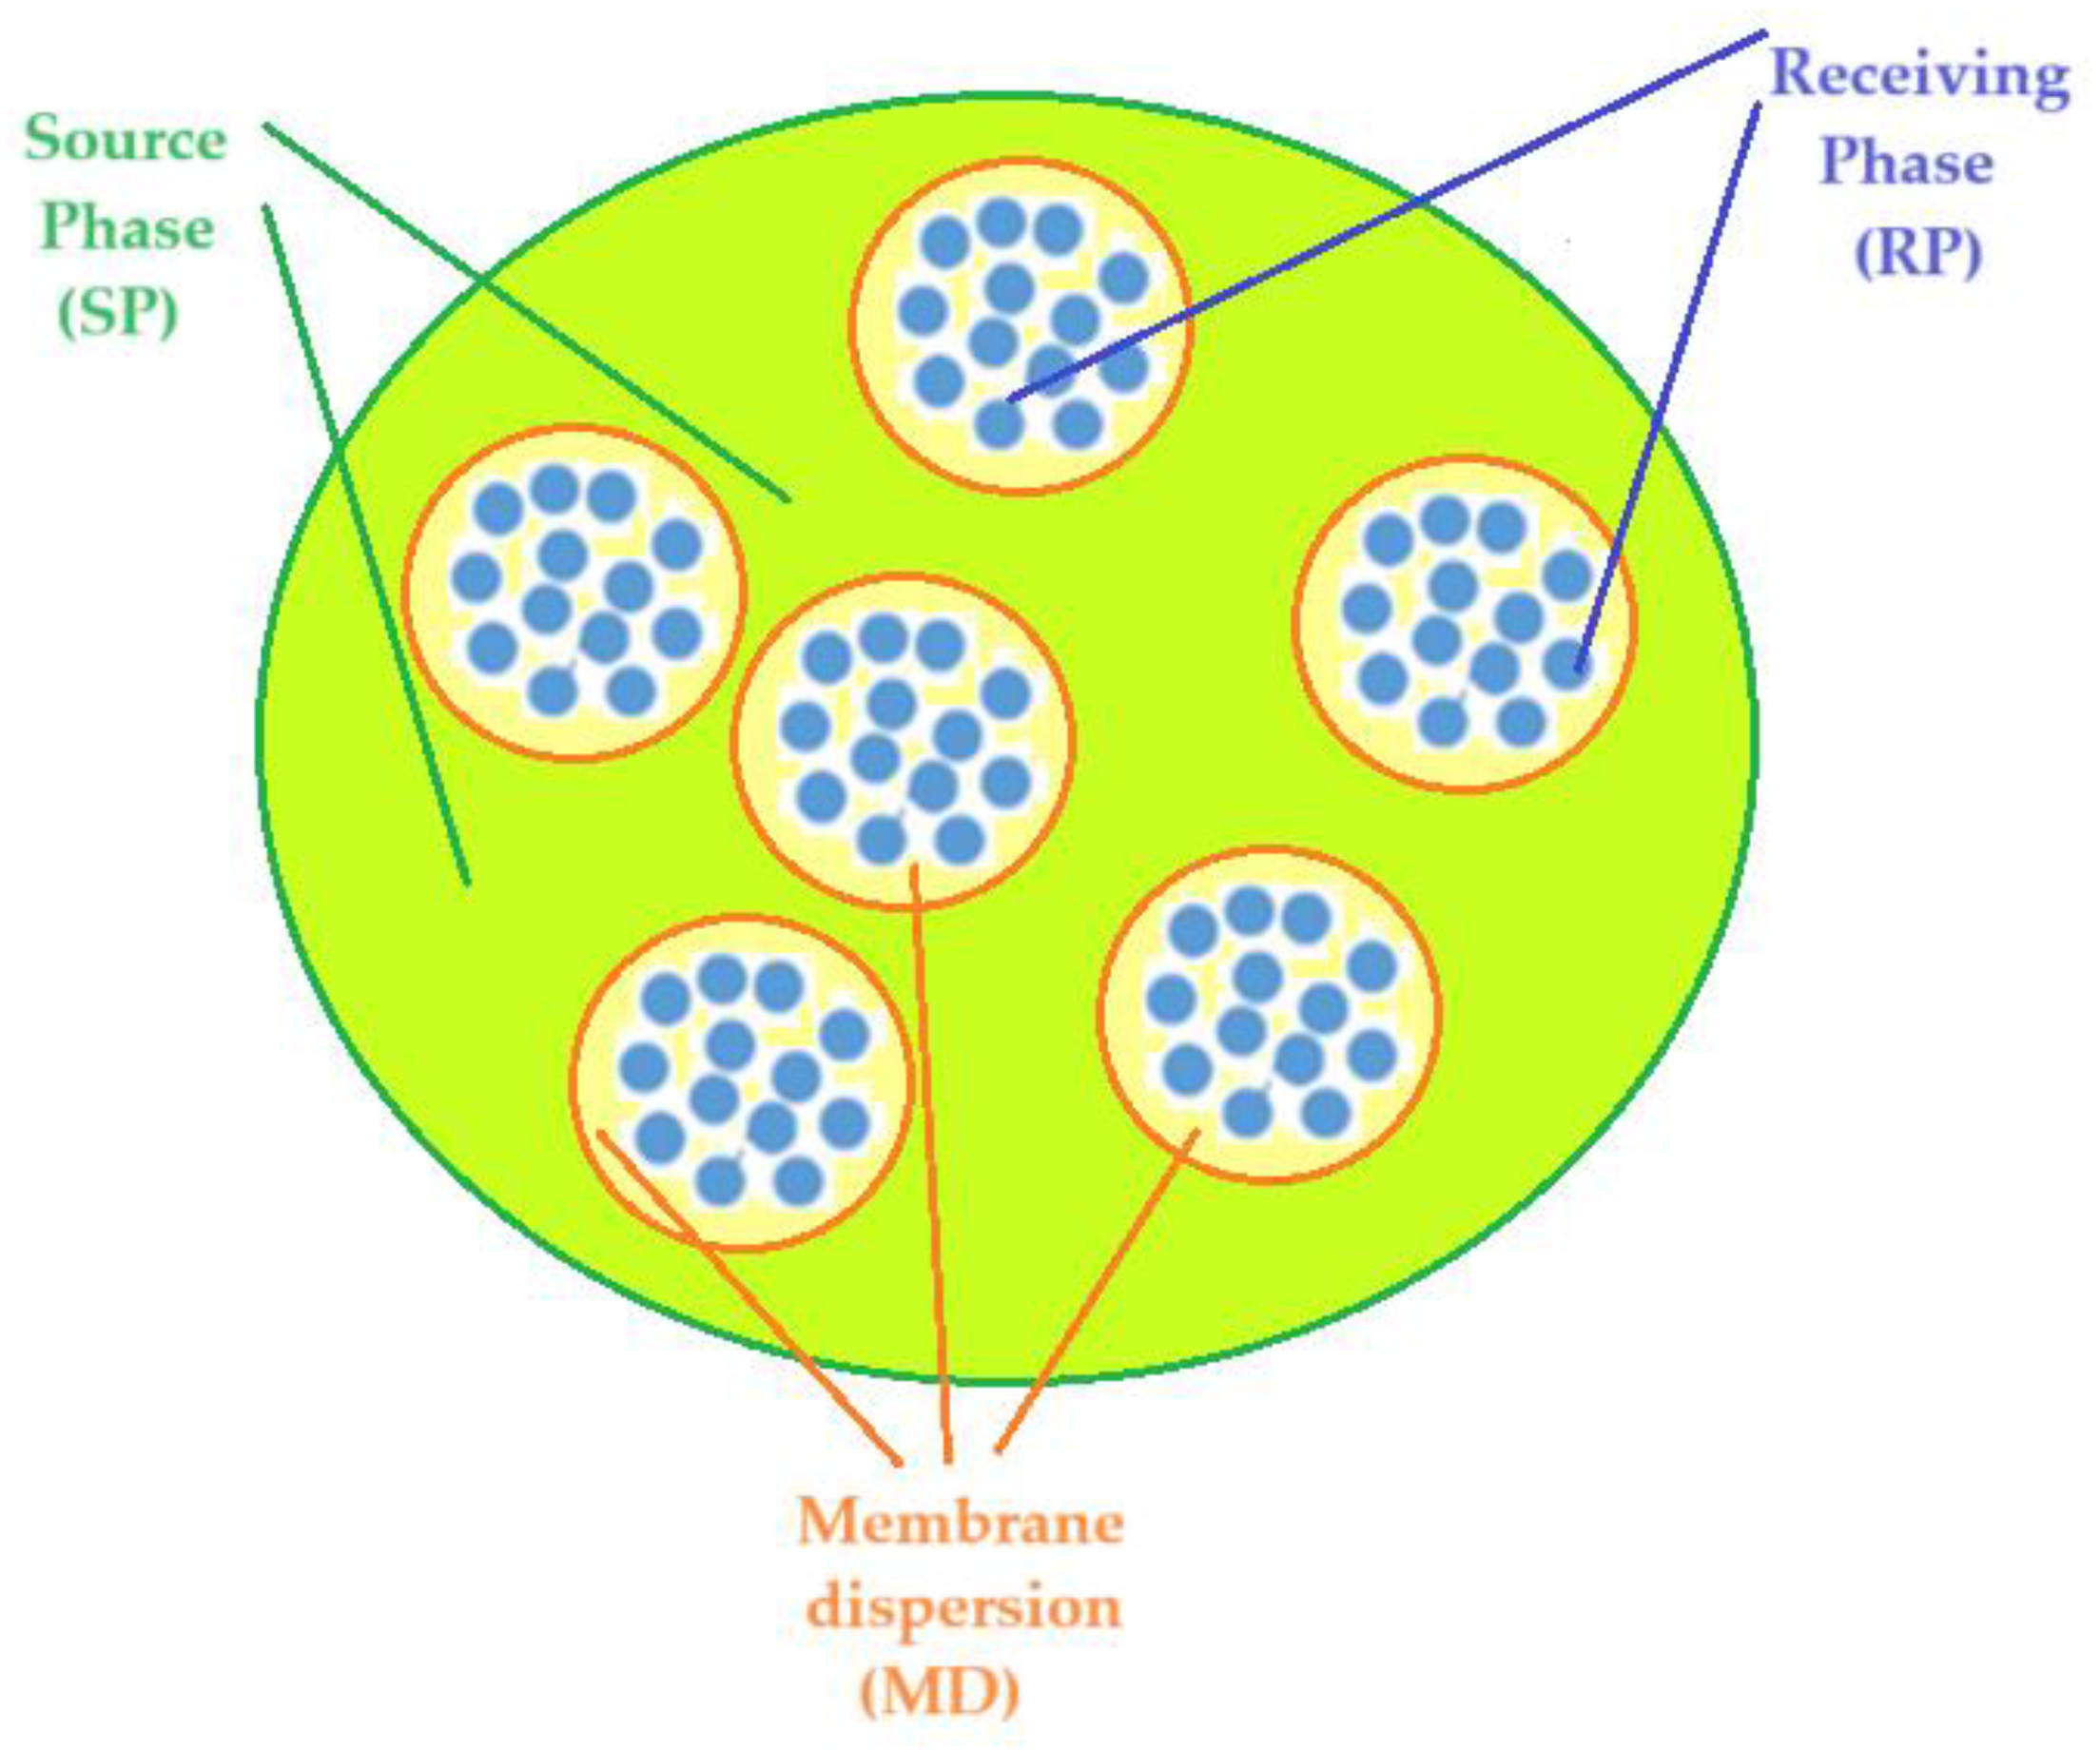
The experiments show the results of p–nitrophenol reduction to p–aminophenol using an ELM, which contains the acidic aqueous receiving phase (blue) found inside the nanodispersion emulsion containing osmium nanoparticles (yellow), and an aqueous basic source phase (green) containing p–nitrophenol and sodium borohydride, outside the emulsion (
Figure 9).
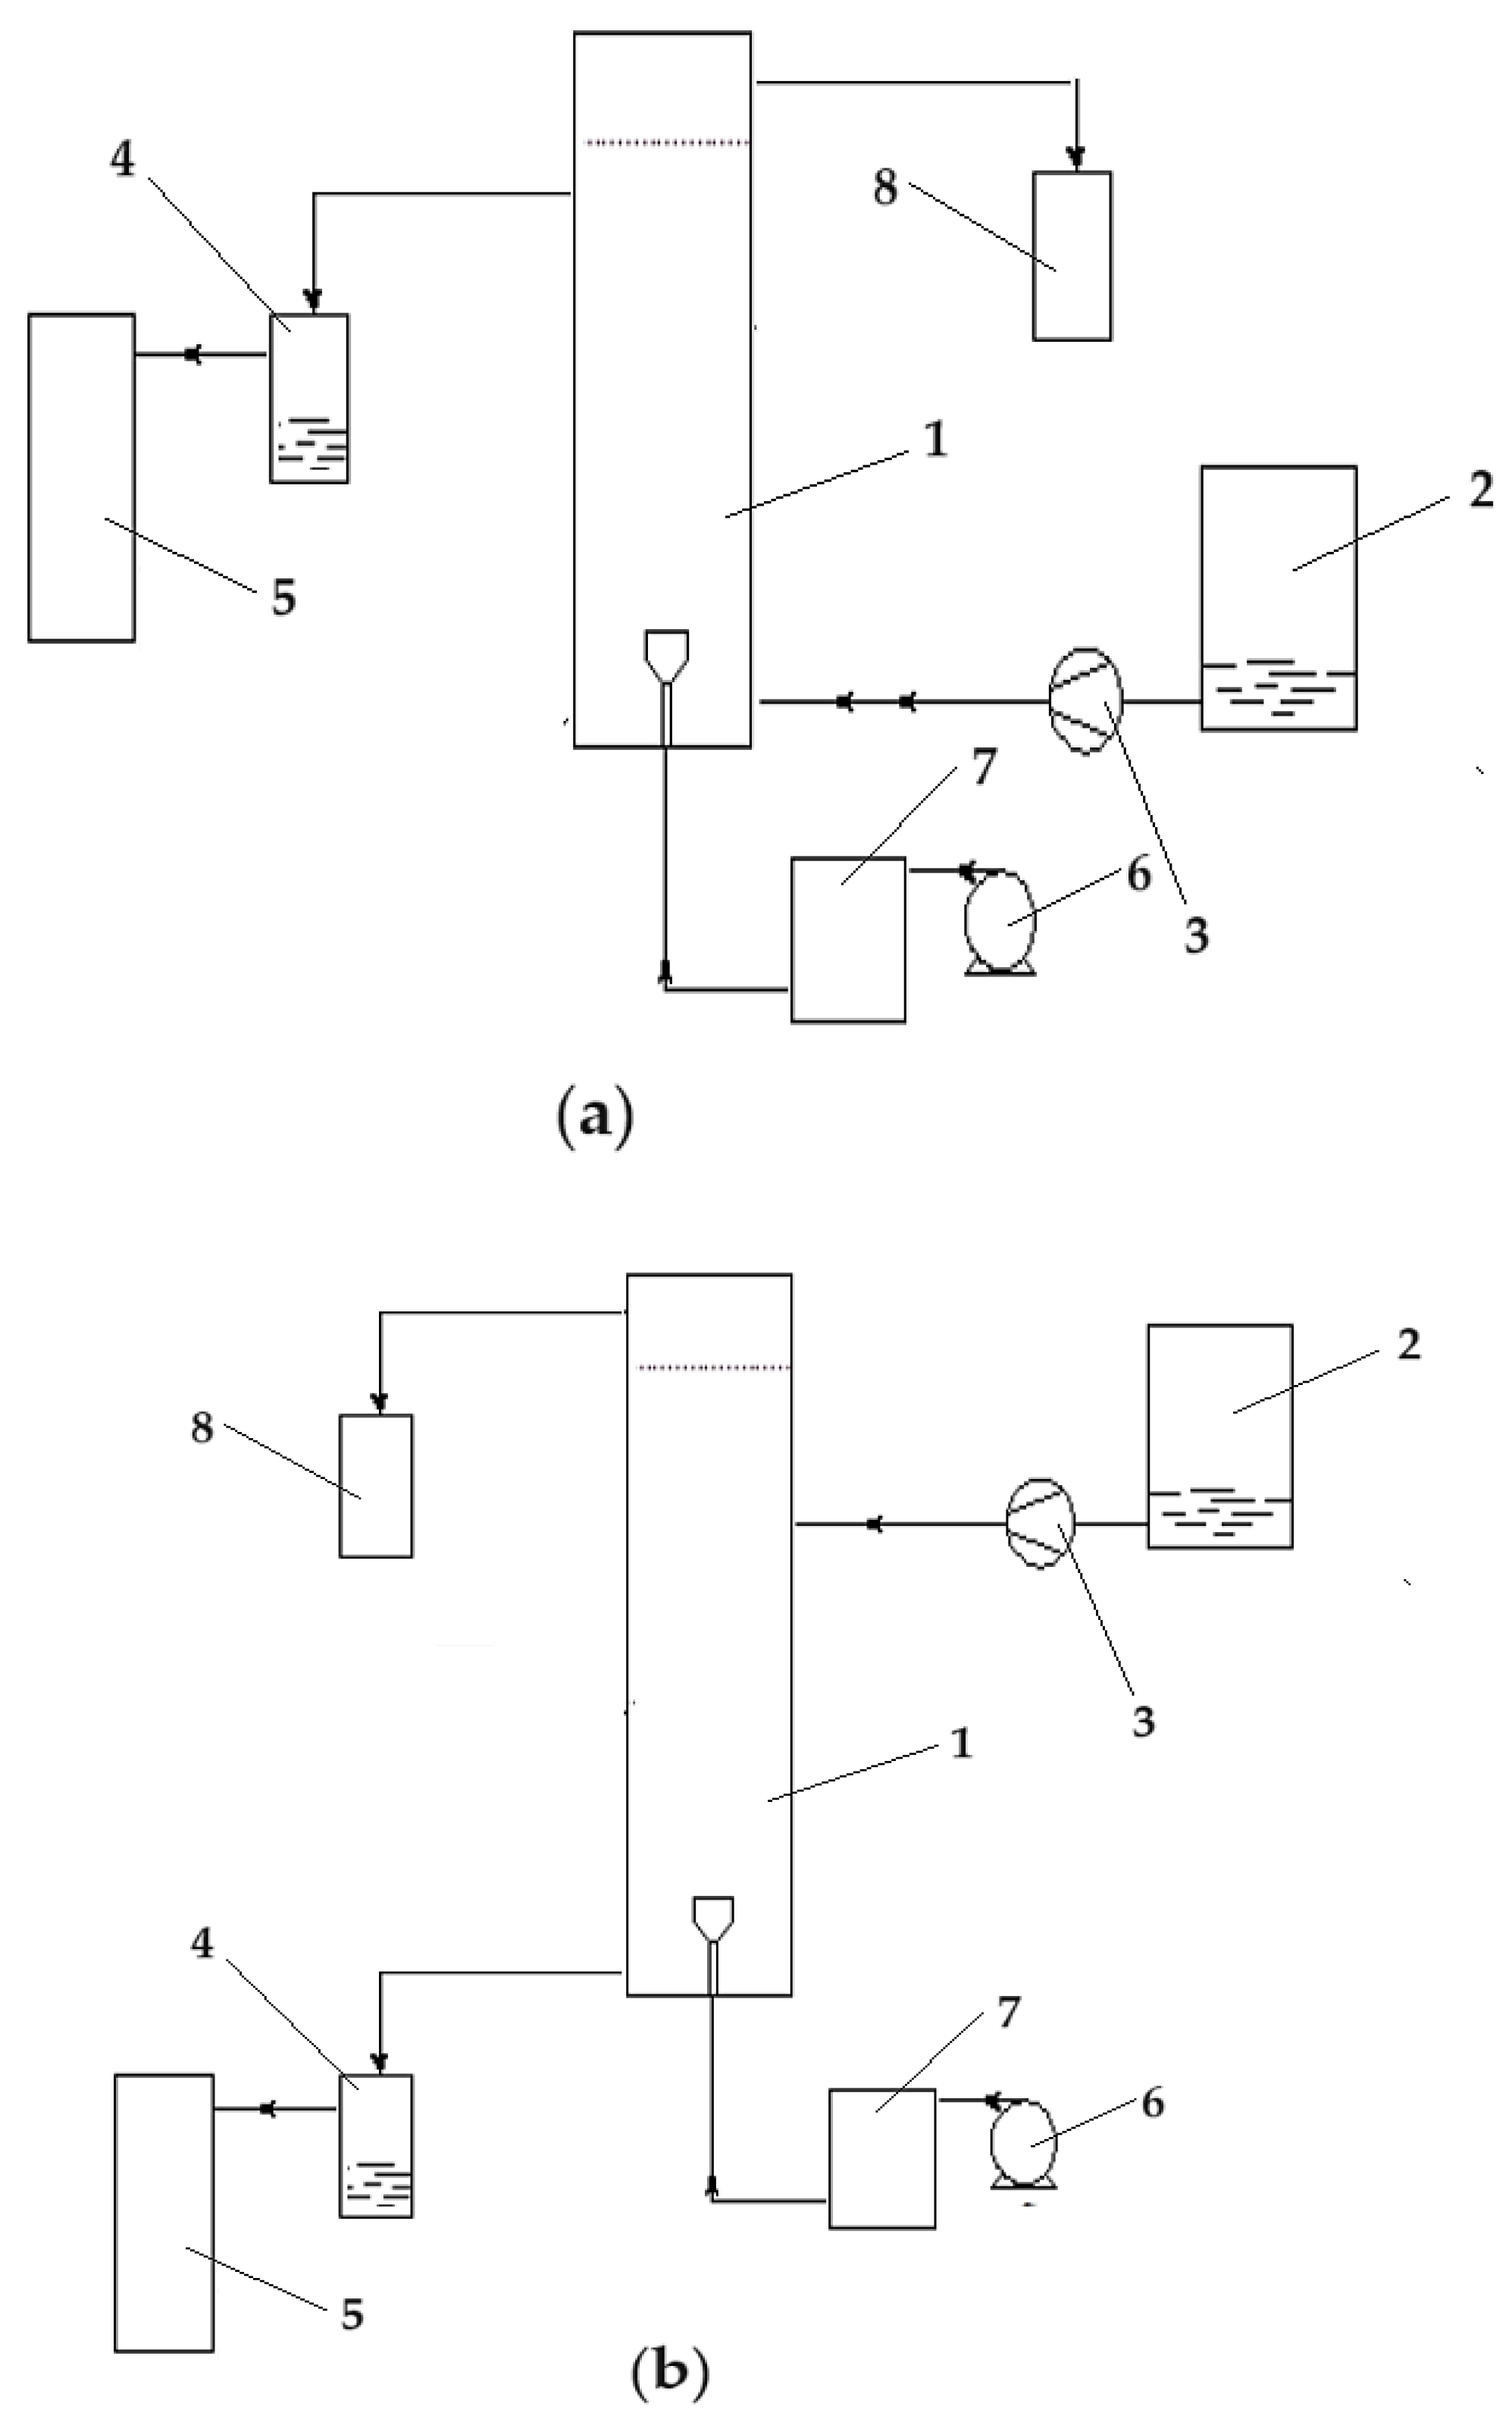
The reduction reaction takes place in a column-type reactor fed at the base with emulsion containing the receiving phase, and the source phase is introduced either at the base of the column (co-current) (
Figure 11a) or at the top (counter-current) (
Figure 11b).
The conversion (η %) or extraction efficiency (
EE%) for the species of interest using the concentration of the solutions [
19,
20,
21] was calculated as follows:
where:
cf is the final concentration of the solute (considered chemical species) and
c0 is the initial concentration of solute (considered chemical species).
The same extraction efficiency can also be computed based upon the absorbance of the solutions [
30,
31], as in:
where:
A0 is the initial absorbance of sample solution and
As is the current absorbance of the sample.
At a pH higher than 10 of the source phase and a pH less than 4 of the receiving phase, the results of conversion (η) of p–nitrophenol to p–aminophenol, with the emulsion based on alcoholic nanodispersion containing osmium nanoparticles, are superior to those presented previously [
20,
30,
31], using supported liquid membranes (SLM) or bulk liquid membranes (BLM). This observation determined the study of the conversion of p–nitrophenol with emulsion membranes based on osmium nanoparticles and n–decanol or n–dodecanol.
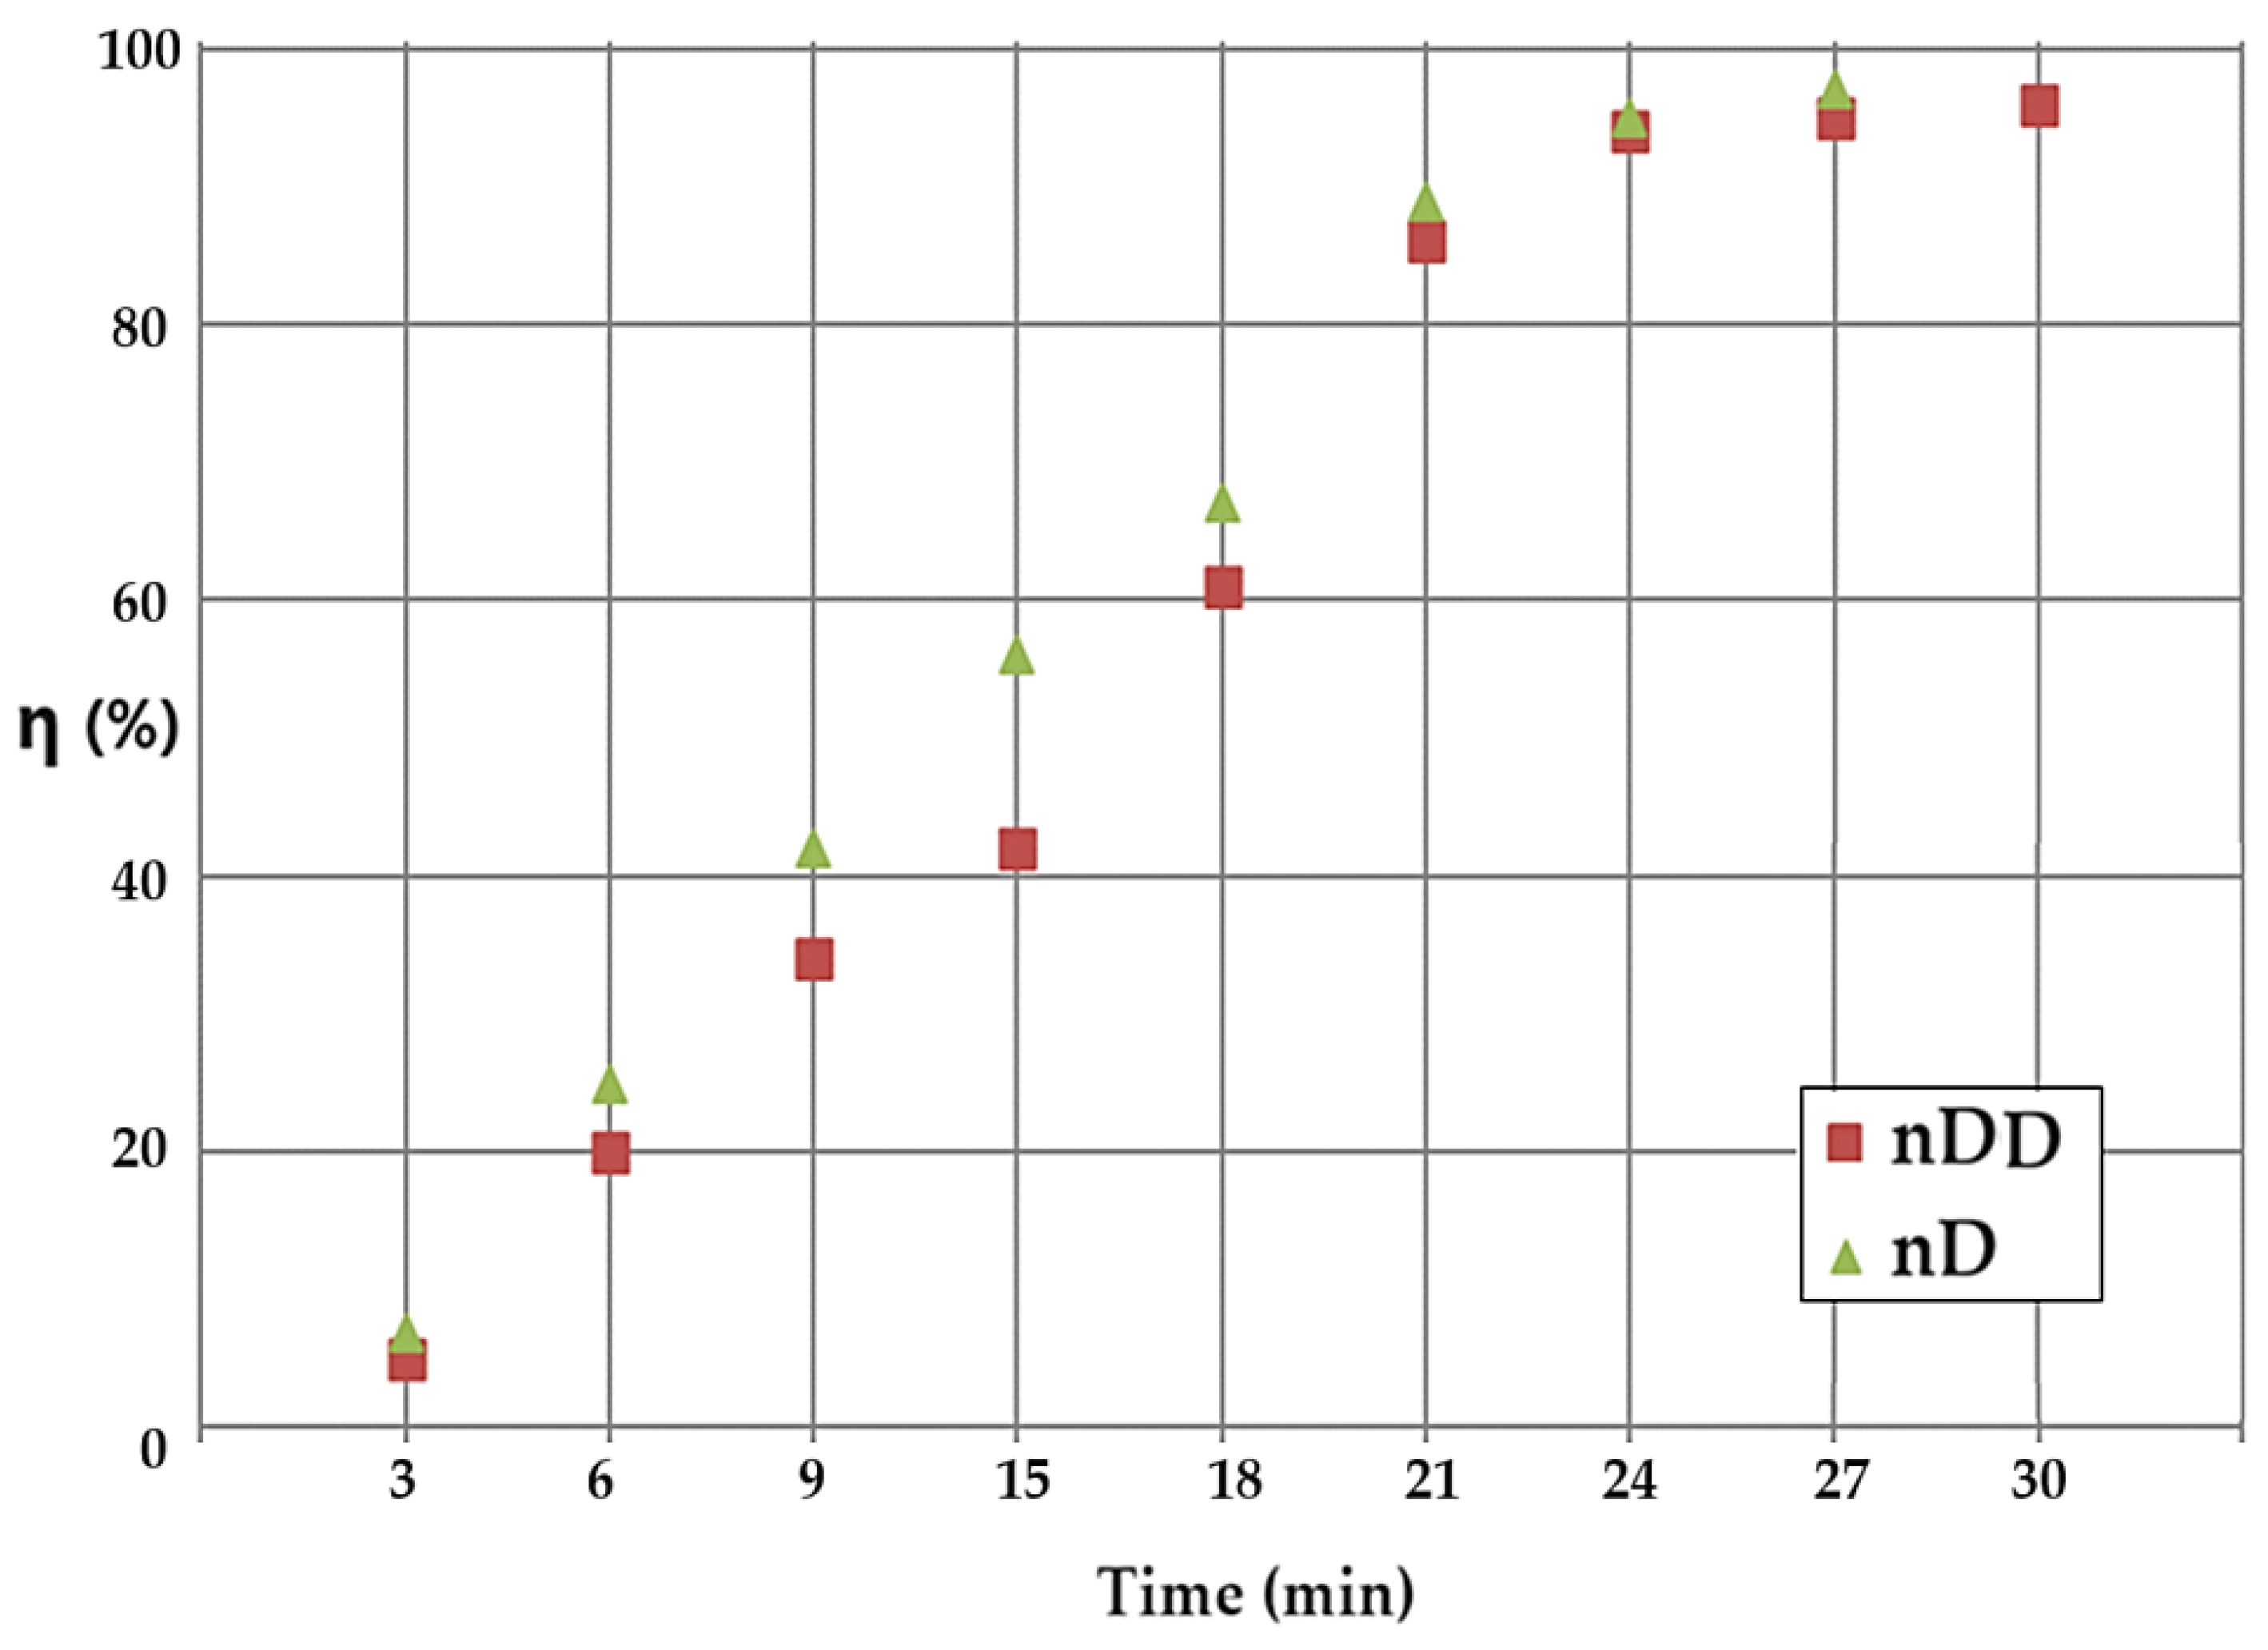
The current data are presented by comparing the results obtained with the nanodispersion of n–dodecanol (curve with brown squares) and, respectively, in n–decanol (curve with green triangles) (
Figure 12), in a co-current system. Throughout the process, the conversion obtained with the nanodispersion based on n–decanol is superior to that based on n–decanol.
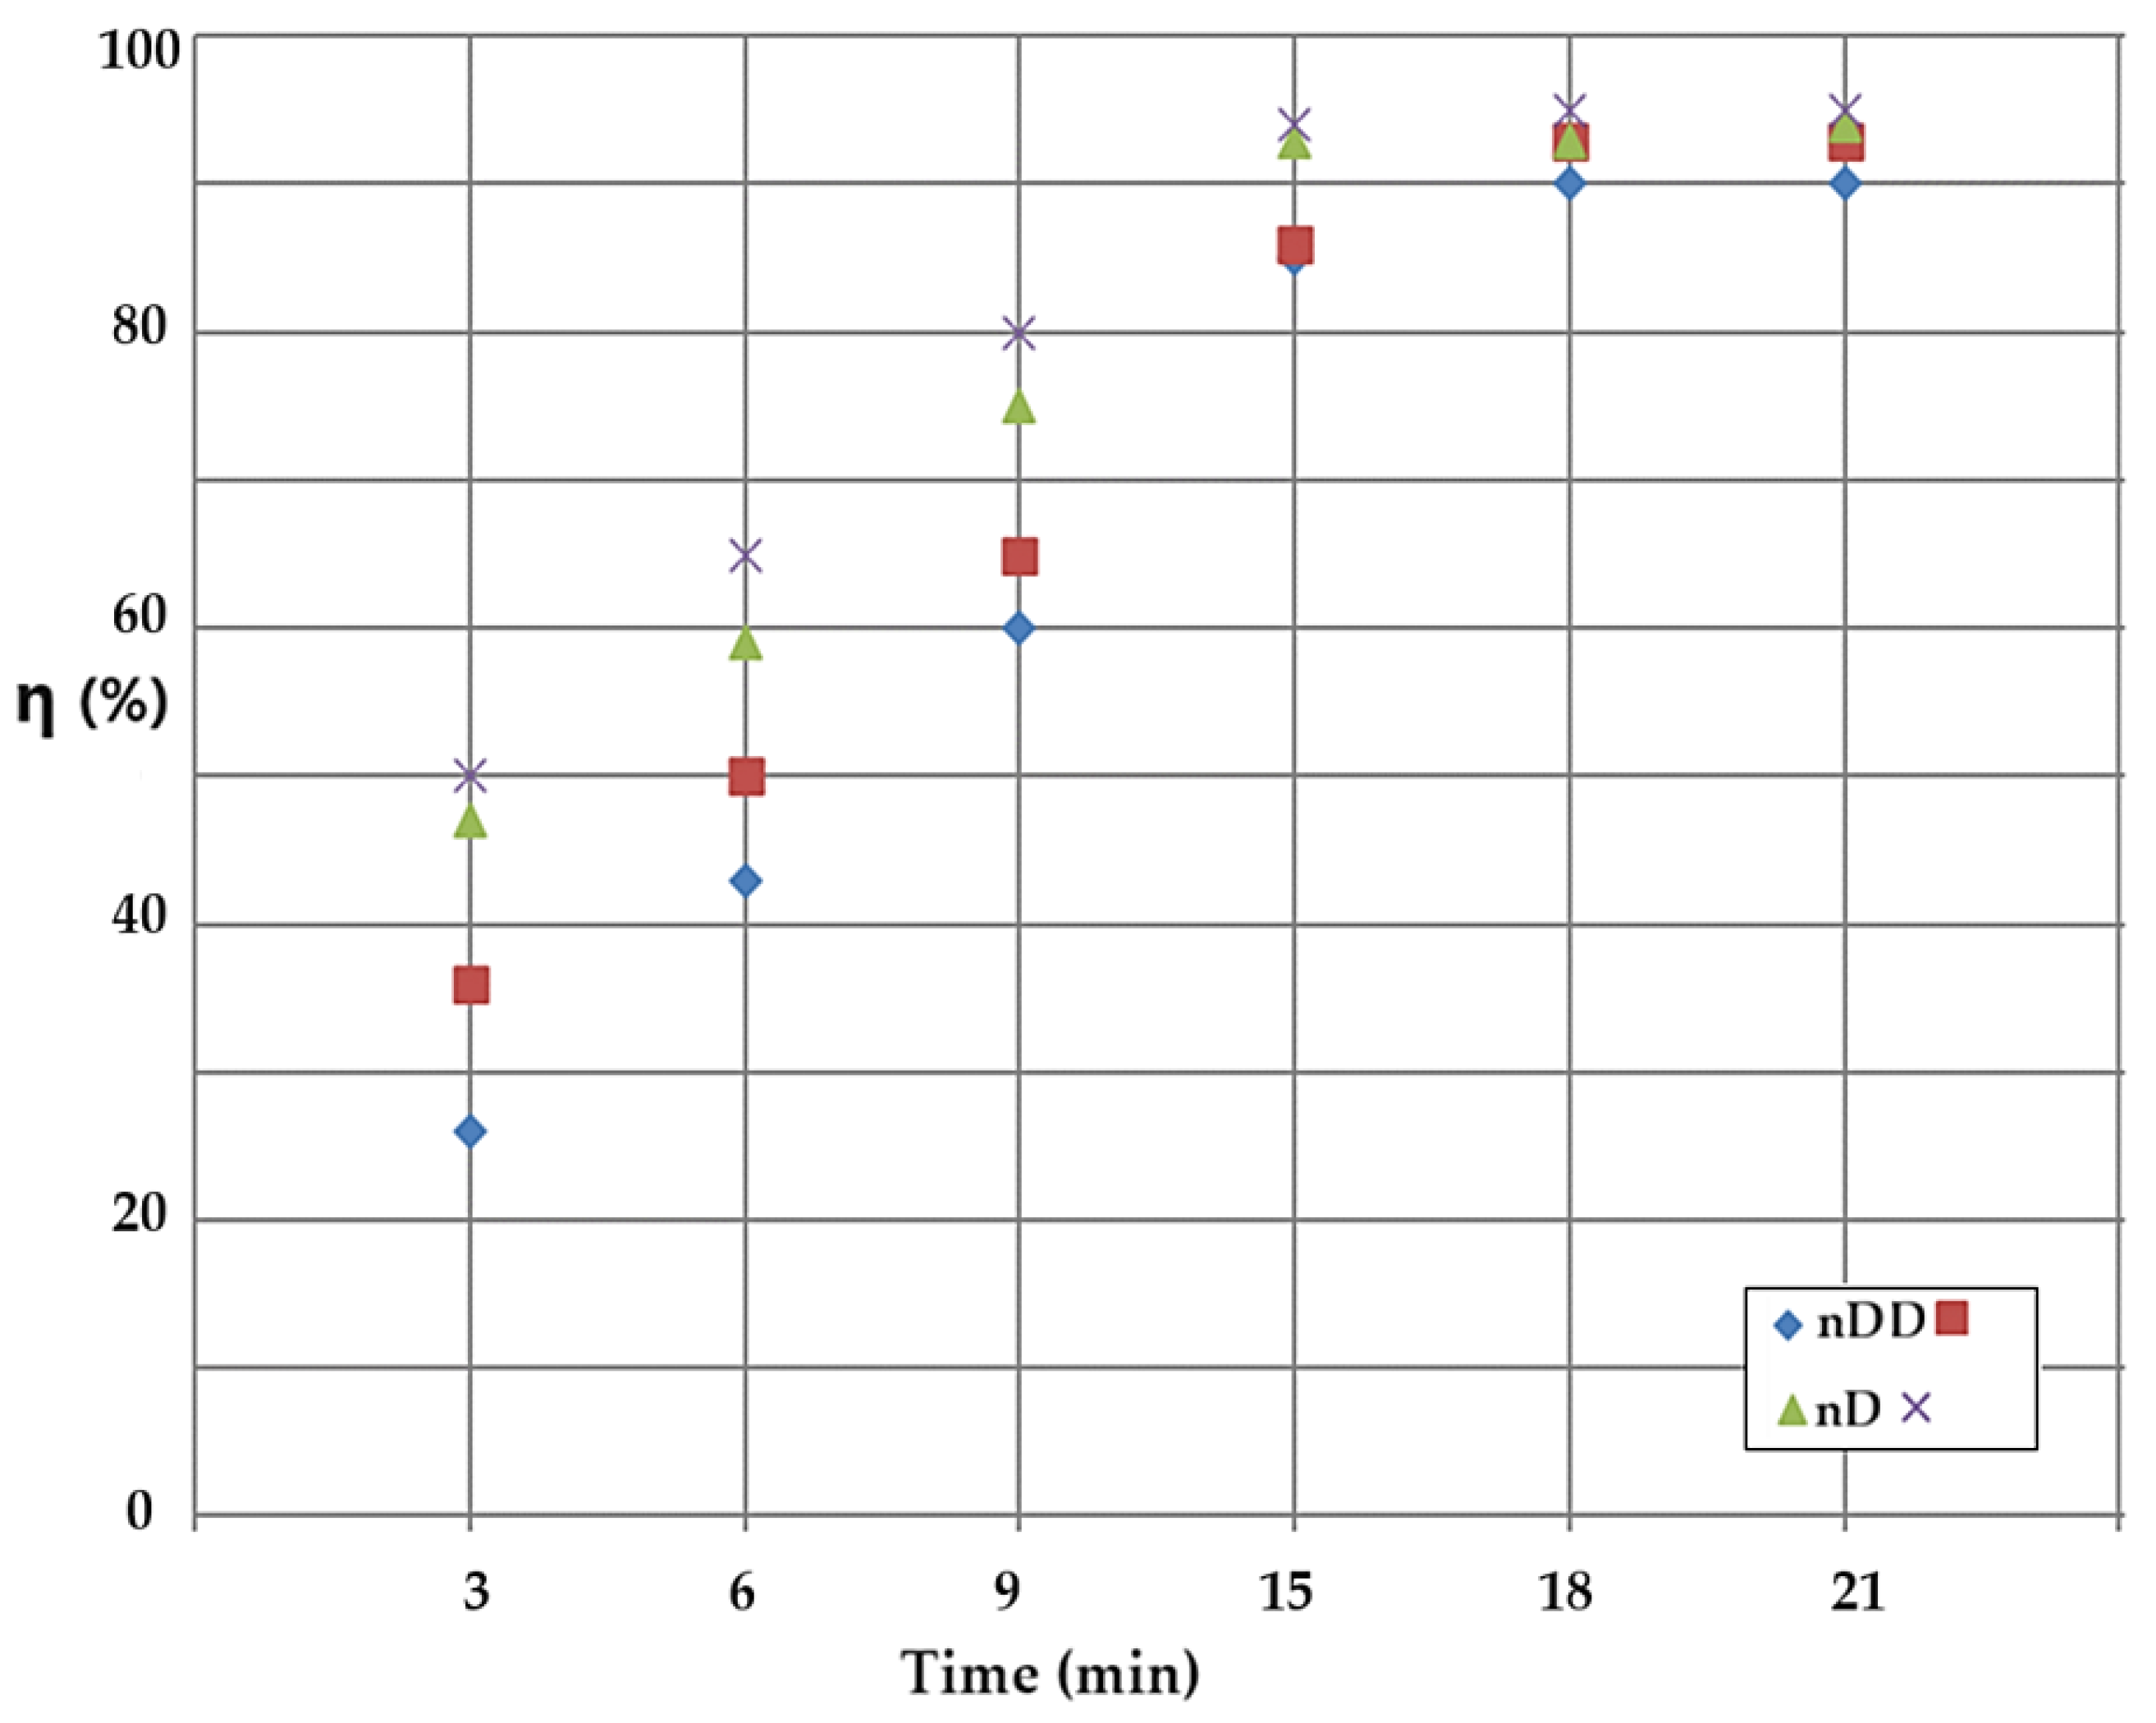
In the stripping column with emulsion membranes containing drops of the aqueous phase of pH 2 and source aqueous solution of pH 12, the conversion (η) was studied depending on the type of the membrane solvent and on the flow mode of the phases. Over the entire the working range, the conversion results obtained with membranes based on n–decanol (green triangles and black crosses) are superior to those obtained with dispersion in n–dodecanol (blue diamonds and brown squares) (
Figure 13). At the same time, the results of the conversion obtained in the counter-current flow version (brown squares and black crosses) are superior to those obtained by the recirculation of the phase in co-current (blue diamonds and green triangles) (
Figure 13).
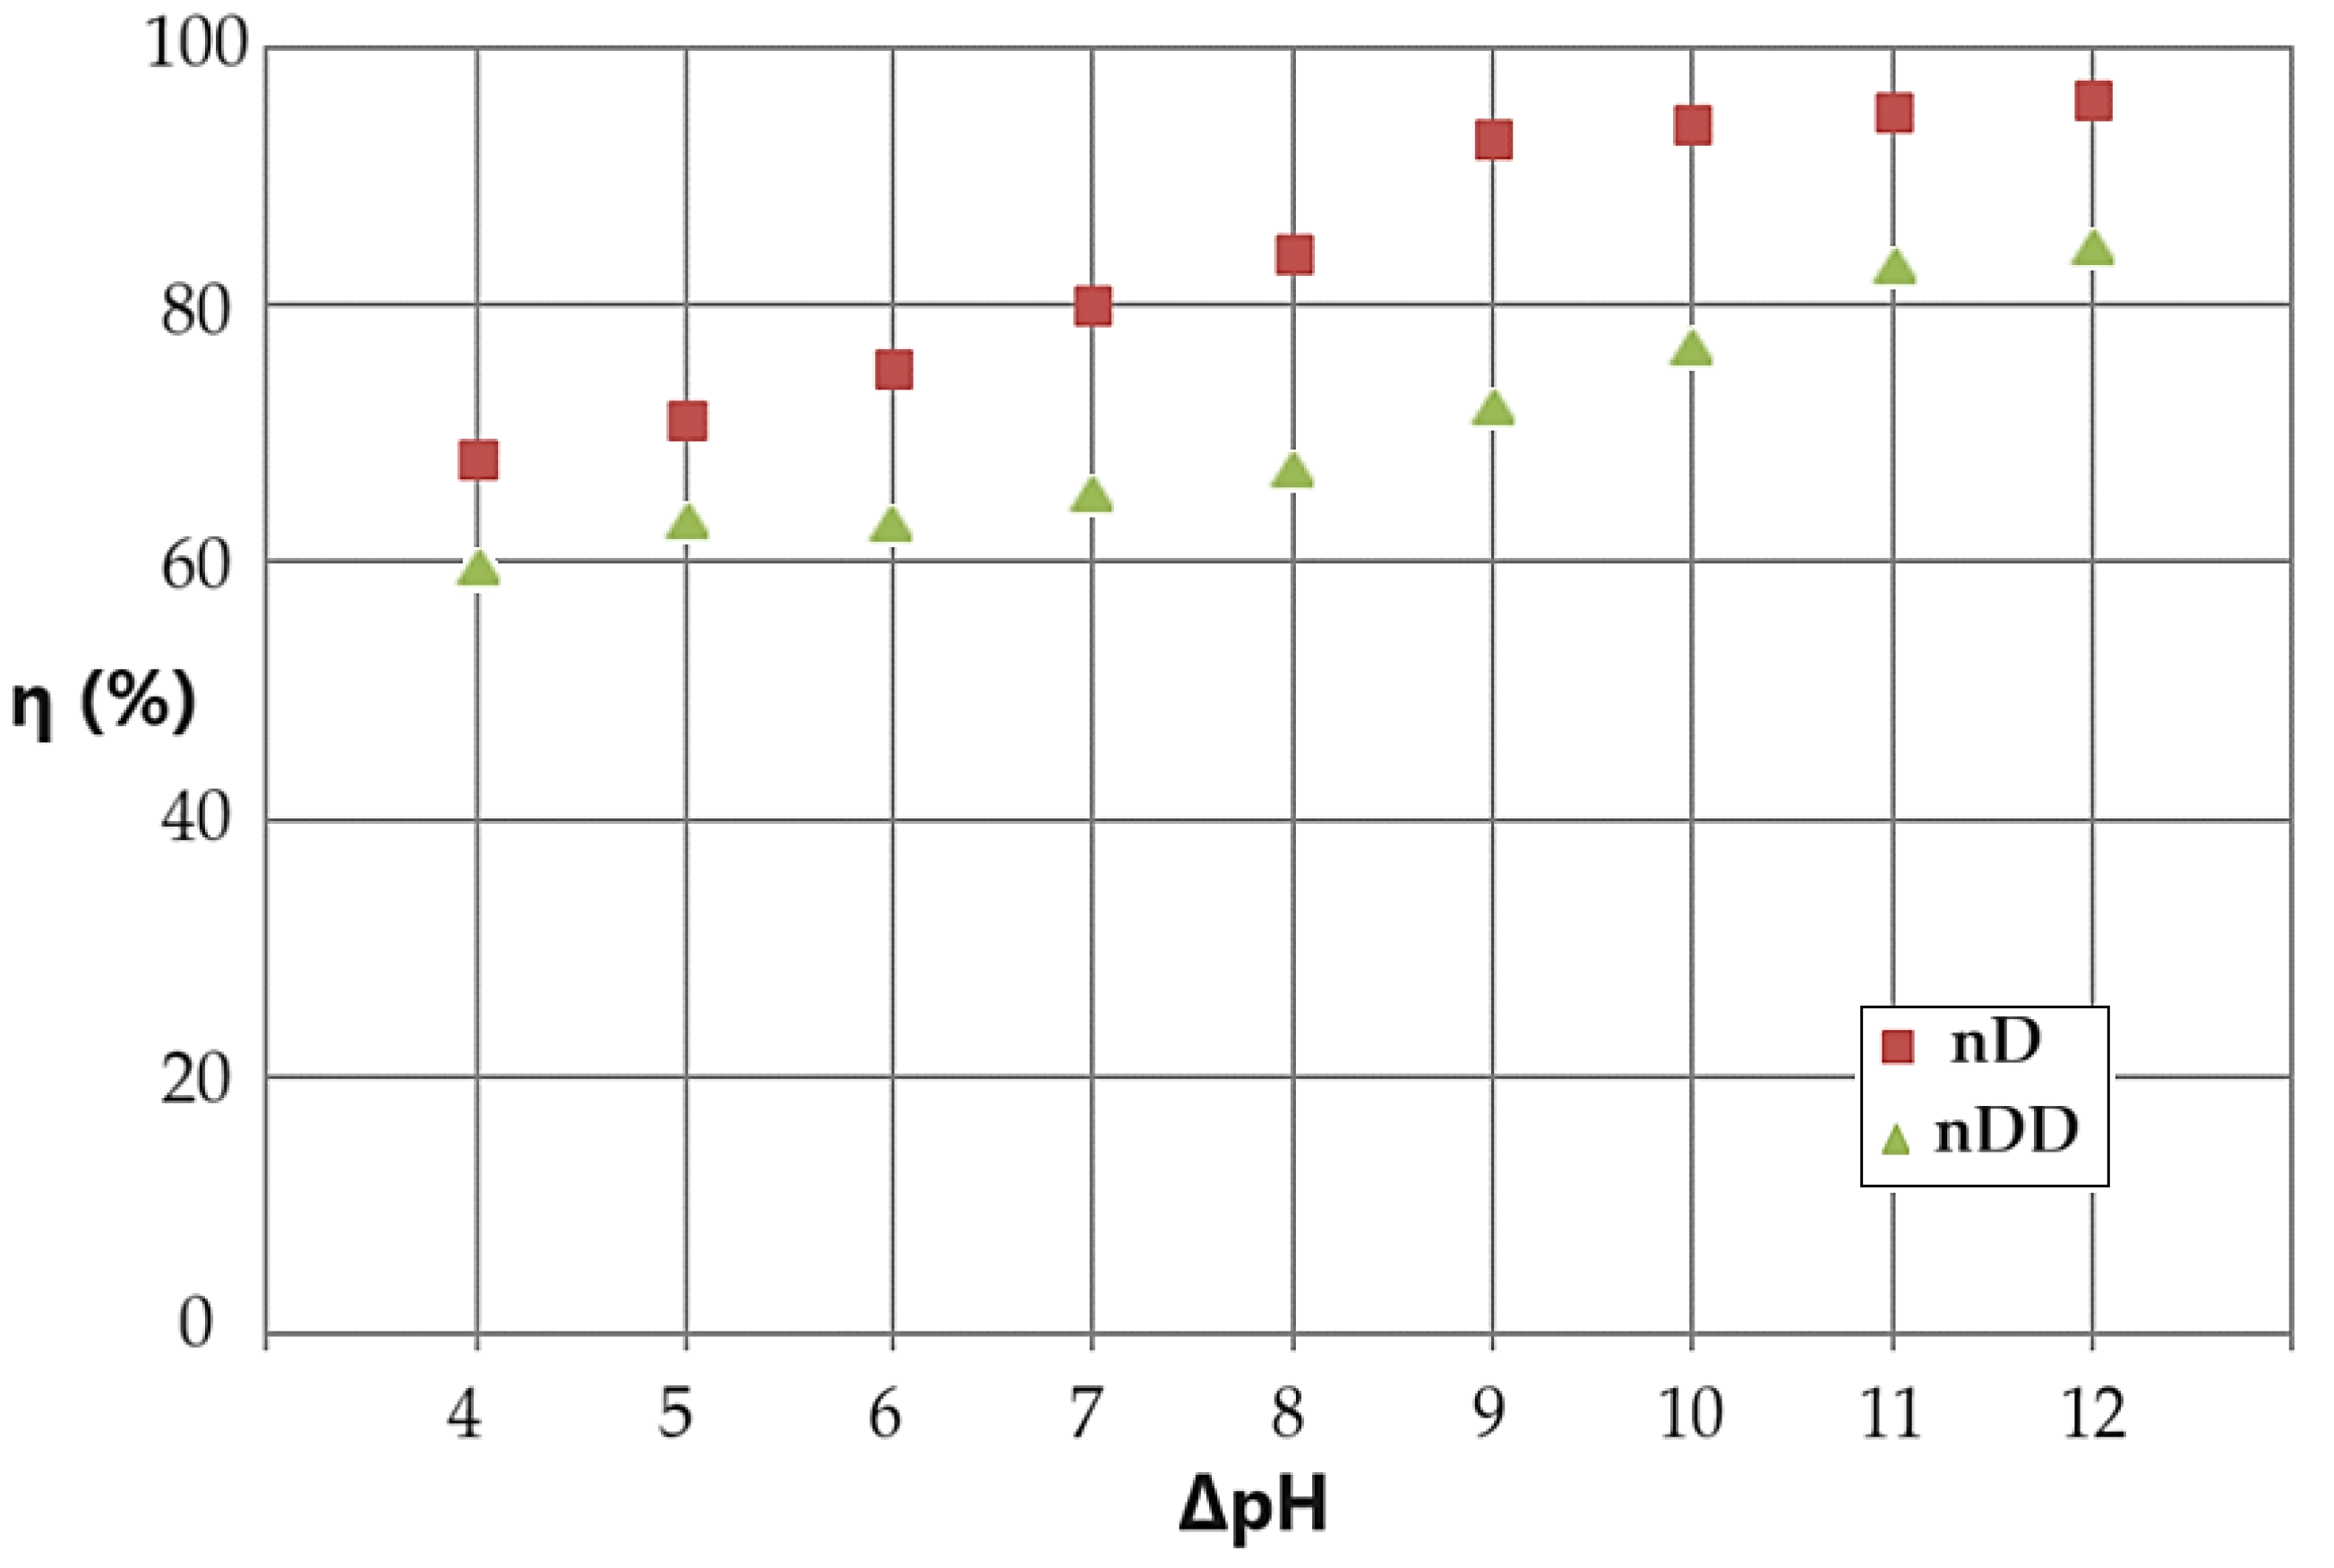
By choosing the experimental variant with the circulation of the aqueous phase, the basic source in counter-current with the nanodispersion based on n–decanol or n–dodecanol containing drops of the acidic aqueous phase, the conversion variation (η) was followed according to the pH difference between the aqueous phases, at an operating time constant for 15 minutes. (
Figure 14).
The conversion of p–nitrophenol to p–aminophenol increases with the increase in the pH difference between the aqueous phases of the membrane system (
Figure 14). Thus, if the pH difference between the source and receiving aqueous phases is 4 units then we have a conversion of 69%, and at a difference of 12 units we have a conversion is of 98% for n–decanol, and from 60% to 85%, respectively, for n–dodecanol. Practically, if we aim for an optimal conversion, then the difference in pH between the aqueous phases must be at least 9 units.
An important aspect of the study of catalytic materials is the regeneration problem. Even more so in membrane-type heterogeneous catalysis, this aspect must be treated carefully.
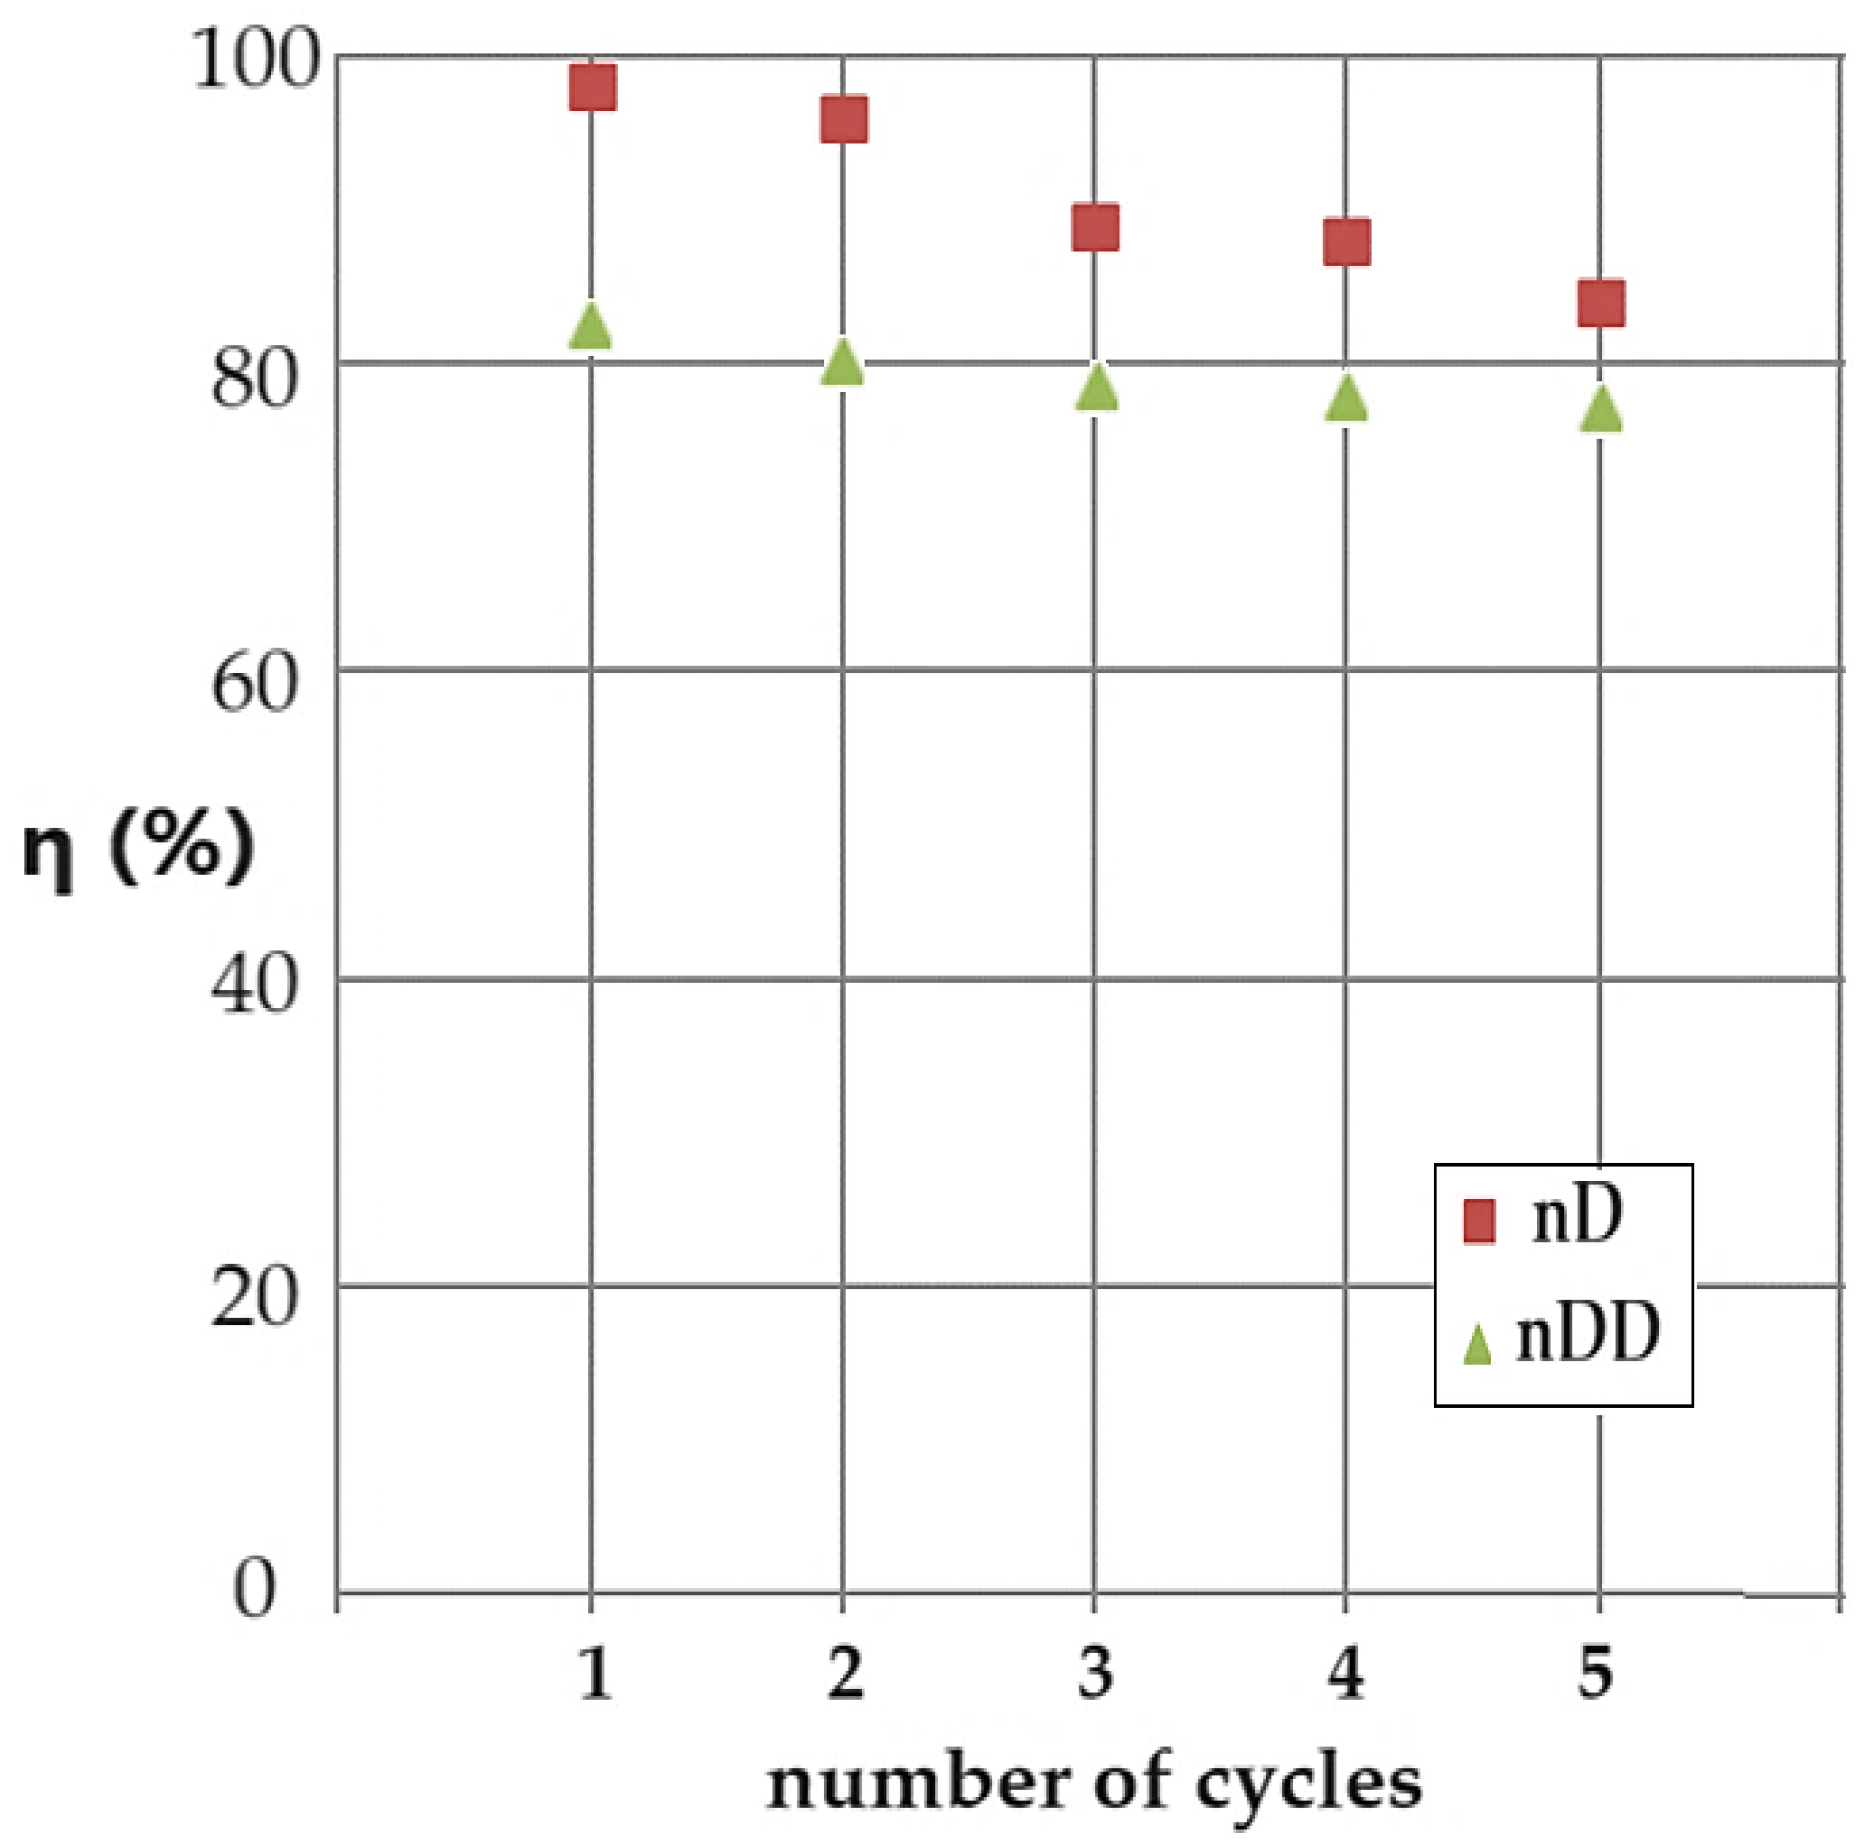
Figure 15 shows the conversion (η) values for 5 cycles of reuse of the ELM based on osmium nanodispersions in n–decanol. The cyclic catalysis process was carried out with the emulsion based on osmium nanoparticles in n–decanol, in counter-current with the source phase of pH 12. The receiving aqueous phase, of pH 2, is recirculated as such, by means of the nanodispersion. The pH 12 source phase is refreshed at each reaction cycle with an equal concentration of p–nitrophenol and sodium borohydride.
The decrease in conversion by almost twenty percent depending on the number of contact cycles of the phases is caused by the increase in pH in the receiving phase, which determines a decrease in the pH differences between phases, although the pH of the source phase remains relatively constant, to the value 12. In the case of dodecanol, the initial conversion is lower (approx. 83%), but the decrease depending on the number of cycles is smaller, at approx. 78%. Practically, if the catalytic emulsion is to be reused, the one based on n–dodecanol is more advantageous, and if a higher conversion is desired, the one based on n–decanol is used, but the number of reuse cycles will be reduced.
The extraction efficiency (
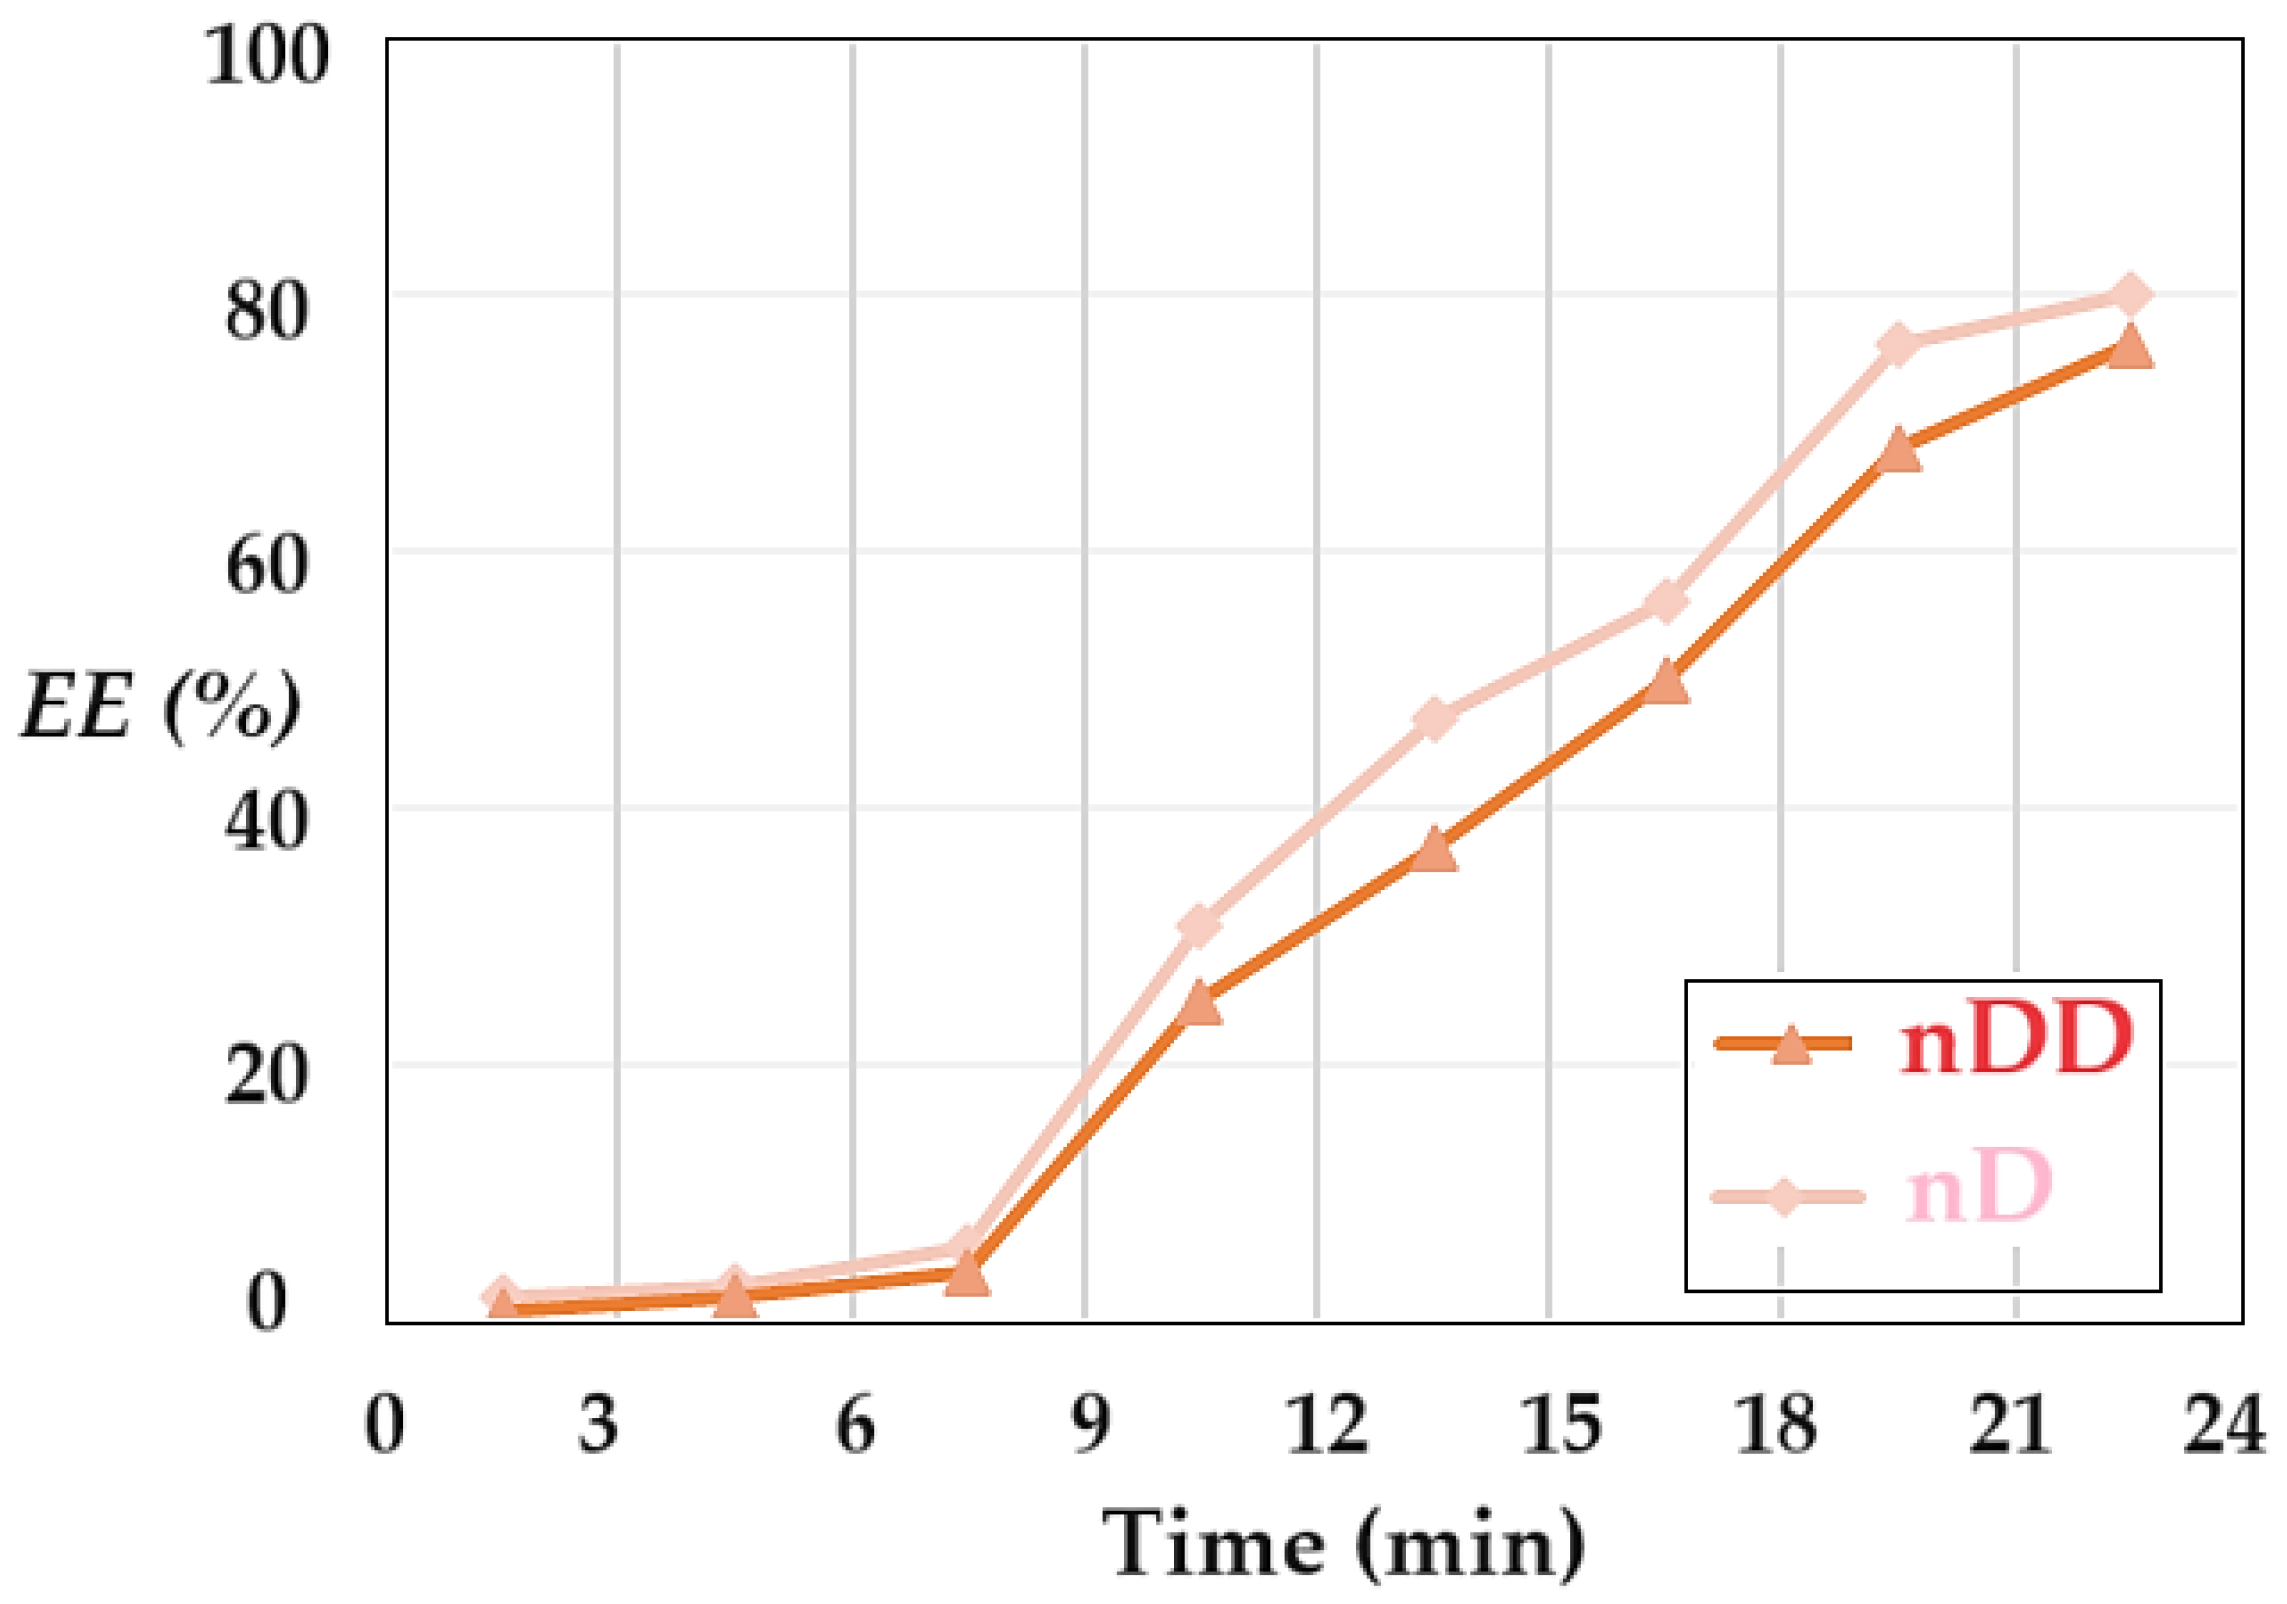
EE) of p–aminophenol was determined by separating the emulsion membrane in the nanodispersion containing osmium nanoparticles in n–dodecanol, and the receiving aqueous phase of pH 12. For the separation of the phases from the emulsion (collapse or breaking of the emulsion) a membrane based on cellulose acetate was used in a Sartorius ultrafiltration module of the dead-end filtration type. The results of p–aminophenol extraction efficiency is presented in
Figure 16. It is noted that the separation efficiency starts with low values in the first-time interval, then it develops rapidly until reaching the value of 75–80%. The separation efficiency with n–decanol membranes is superior over the entire time interval to that with n–dodecanol-based membranes.
The delay in the separation of p–aminophenol compared to the conversion of p–nitrophenol to p–aminophenol can be justified both by the diffusion process through the liquid membrane and by the slow transfer from the liquid membrane to the acidic environment of the receptor phase. The extraction efficiency value is lower than the conversion value at the same operating time.
The performances determination of the process of reducing p–nitrophenol to p–aminophenol, with osmium nanodispersions in n–decanol and n–dodecanol, in the liquid membrane emulsion system, shows that:
- -
The liquid membrane emulsion system consists of:
The aqueous source phase of alkaline pH, containing p–nitrophenol and sodium borohydride;
The membrane phase – dispersion of osmium nanoparticles in n–decanol or n–dodecanol;
The receiving phase solution of acid pH.
- -
The installation (working plant) allows the co-current or counter-current circulation of the phases, the basic source and the emulsion, which contains drops of acidic aqueous solution in the osmium nanodispersion in n–decanol or n–dodecanol;
- -
The system that operates with nanodispersion in n–decanol ensures a conversion of p–nitrophenol to p–aminophenol, higher than nanodispersion in n–dodecanol;
- -
Counter-current operation of the phases leads to higher conversions than co-current operation;
- -
At the same operating time, the increase in the pH difference between the source and receiver aqueous phases leads to the increase in the conversion of p–nitrophenol to p–aminophenol;
- -
Repeating the use of the catalytic emulsion, containing osmium nanodispersions in n–dodecanol, in a counter-current flow regime, decreases the conversion value from approx. 98% in the first cycle, to approx. 83% in the fifth cycle for n–decanol and from 60% to 85% for n–dodecanol;
- -
The p–aminophenol separation efficiency is below the p–nitrophenol conversion value over the entire operating time interval.
3. Discussion
Various catalytic materials for the reduction of p–nitrophenol to p–aminophenol have been recently reported and have very good results both in terms of conversion and catalyst regeneration [
50,
51,
52,
53,
54,
55,
56,
57,
58,
59,
60,
61].
Catalytic systems based on osmium nanoparticles, coupled with polymer or liquid membranes processes have been less frequently reported [
19,
20,
21,
30,
31]. In these hybrid, membrane-catalytic processes, p–nitrophenol is reduced to p–aminophenol with osmium nanoparticles. The hybrid process involves both the conversion of p–nitrophenol in the source phase, and the separation of p–aminophenol, in the receiver phase, through a membrane process. Previously, bulk liquid membranes based on osmium nanoparticles were tested [
20,
21,
30], but also liquid membranes on support (SLM) [
19,
31].
The emulsion membrane based on the nanodispersion of osmium in n–decanol or n–dodecanol has superior performance both in the conversion of p–nitrophenol and in the separation of p–aminophenol from the system. Taking into account relation (2), an apparent constant (
kapp) was obtained, with maximum values between 0.1×10
−3 s
−1 for dodecanol and 0.9×10
−3 s
−1 for decanol. These values are about an order of magnitude higher than the other systems with membranes based on osmium nanoparticles previously reported [
19,
20,
30,
31], but below the values reported in the specialized literature, for catalysts based on nanoparticles obtained from the elements platinum group [
32,
33,
34,
35,
36,
37,
38,
39].
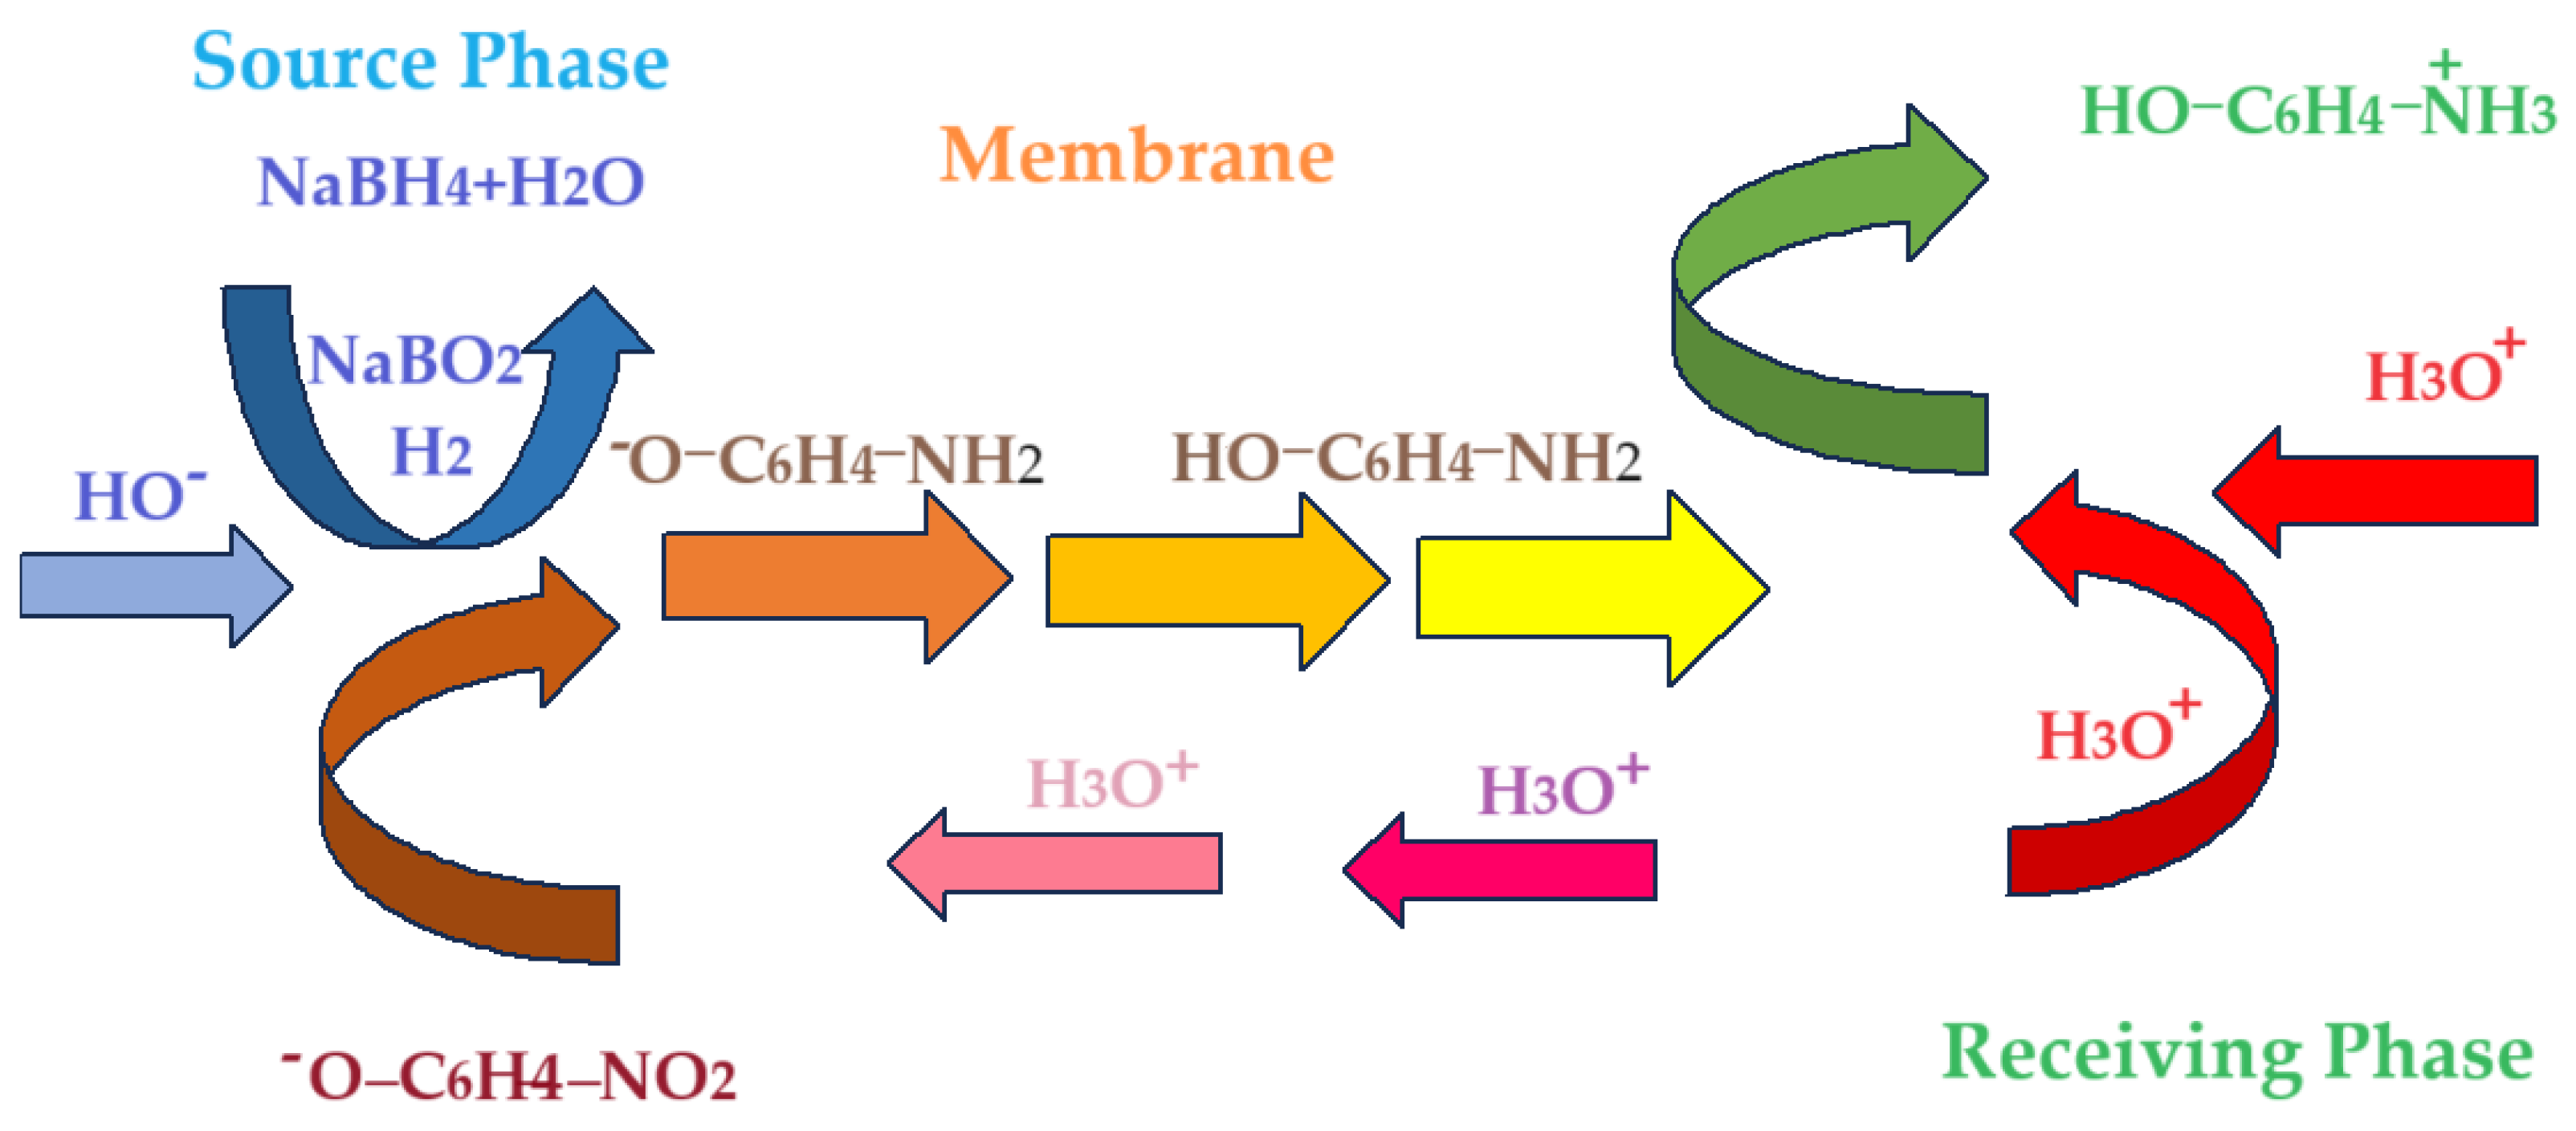
Figure 17 shows schematically the hybrid process of catalytic reduction of p–nitrophenol and membrane recovery of p–aminophenol through the new emulsion type membrane.
For the conversion of p–nitrophenol and the efficiency of p–aminophenol separation according to the scheme in
Figure 17, the following can be taken into consideration: different molar mass of n–alcohols, mutual solubility of n–alcohols in water and of water in n–alcohols, viscosity, relative polarity and the pKa value (
Table 3).
Through the proposed mechanism, two interfaces:
The source phase/organic phase interface, containing osmium nanoparticles;
Organic phase/aqueous receiving phase interface.
and three phases:
are considered responsible for the conversion of p–nitrophenol and the transport of p–aminophenol in water.
A simplified model of conversion of p–nitrophenol and transport of p–aminophenol involves five steps:
Diffusion of p–nitrophenolate and molecular hydrogen from the source aqueous phase to the interface with the catalytic organic phase, due to the content of osmium nanoparticles.
Penetration of the source aqueous phase/organic phase interface, simultaneously with the conversion of p–nitrophenolate to p–aminophenol;
Diffusion of p–aminophenol across the membrane to the organic phase/’receiving aqueous phase’ interface;
Penetration of the organic phase/ receiving aqueous phase interface, simultaneously with the reaction of p–aminophenol with the proton;
Diffusion of protonated aminophenol in the receiving aqueous phase.
In the proposed model, all the parameters of the working system favor the n–decanol-based membrane (
Table 3), as follows:
The two presented aspects lead to friendlier interfaces between the organic phase (n–alcohol) and respectively the two aqueous phases (source and receiver). This means that the interfaces with n–decanol contain more water in n–decanol and more n–decanol in water, favoring the diffusion and penetration of the interface by p–nitrophenol and the source of molecular hydrogen. Of course, the parameters of n–decanol (solubility and viscosity) being an order of magnitude higher than those of n–dodecanol, will disfavor both the conversion of p–nitrophenol and the transport of p–aminophenol.
The proposed model responds to the results presented previously (
Figure 12,
Figure 13 and
Figure 16), in which the results are better for the membrane containing n–decanol than the one based on n–dodecanol.
From a practical point of view, the only deficiency of n–decanol is that it remains in the aqueous phases at the maximum concentration of 0.037 g/L compared to n–dodecanol of 0.004 g/L. In technological exploitation, this observation leads to the design of a method for the elimination of n–decanol from aqueous effluents. The two n–alcohols with an even number of carbon atoms are biodegradable, which would solve, through bio-degradation, the problem.
Compared to the heterogeneous catalytic systems with solid catalysts, the system with the dispersion of osmium nanoparticles in n–alcohols differ in the type of interface: adsorption in the first case, and absorption in the second. Depending on the nature of the nitroderivative, either heterogeneous adsorption catalysis or heterogeneous absorption catalysis can be favored.
A favorable aspect of the chosen working method would be the reception of p–aminophenol resulting from the reduction of p–nitrophenol in the receiving phase at a concentration 10 times higher. This concentration factor would create the possibility of using the p–aminophenol solution as such in the pharmaceutical or dye industry.
If in terms of reduction, osmium-based membrane systems are inferior to other catalyst systems, it would be interesting for the system to be used in selective oxidation processes.
4. Materials and Methods
4.1. Reagents and Materials
All reagents used in the presented work were of analytical grade. They were purchased from Merck (Merck KGaA, Darmstadt, Germany): osmium tetroxide, sodium hydroxide, hydrochloric acid, NaBH4, p–aminophenol and p–nitrophenol.
The membrane components were purchased from Sigma-Aldrich (Merck KGaA, Darmstadt, Germany): t–butyl alcohol, n–octanol
, n–dodecanol, and 10–undecylenic acid (undecenoic acid) have the characteristics presented in
Table 4.
The purified water characterized by 18.2 μS/cm conductivity was obtained with a RO Millipore system (MilliQ® Direct 8 RO Water Purification System, Merck, Darmstadt, Germany).
4.2. Methods and Procedures
4.2.1. Analytical Methods
Dynamic light scattering (DLS) analysis [
30]: granulometer equipment: Coulter N4 Plus (laser He–Ne, 632.8 nm) (Beckman Coulter GmbH, Krefeld, Deutschland)
For transmission electron microscopy (TEM) using a High-Resolution 80–200 kV Titan THEMIS transmission microscope (Thermo Fisher Scientific, former FEI, Hillsboro, OR, USA) equipped with an Image Corrector and EDXS detector in the column. The microscope is operated at a 200 kV voltage in transmission mode [
30,
31].
The scanning electron microscopy studies, SEM and HFSEM, were performed on a Hitachi S4500 system (Hitachi High-Technologies Europe GmbH, Germany) [
21,
22].
Thermal analysis, TG–DSC was performed with a STA 449C F3 apparatus, from Netzsch (Selb, Germany with a FTIR Tensor 27 from Bruker (Bruker Co., Ettlingen, Germany) [
19,
20,
21].
The UV–Vis studies were performed on dual-beam UV equipment–Varian Cary 50 (Agilent Technologies Inc., Santa Clara, CA, USA.) at a resolution of 1 nm, spectral bandwidth of 1.5 nm, and a scan rate of 300 nm/s. [
19].
The UV–Vis validation analysis of the p–nitrophenol solutions was performed on a CamSpec M550 spectrometer (Spectronic CamSpec Ltd., Leeds, UK [
21,
23].
The electrochemical analysis was followed up with a PARSTAT 2273 Potentiostat (Princeton Applied Research, AMETEK Inc., Oak Ridge, TN, USA) [
19,
20].
The pH, conductance and anions concentration (in the source phase or in the receiving phase) were determined using a conductance cell or combined selective electrode (HI 4107, Hanna Instruments Ltd., Leighton Buzzard, UK) and a multi-parameter system (HI 5522, Hanna Instruments Ltd., Leighton Buzzard, UK) [
19,
22].
4.2.2. Preparation of Nanodispersion of Osmium Nanoparticles in n–Dodecanol and n–Dodecanol
The preparation of nanodispersion of osmium nanoparticles in n–decanol was previously presented [
30]. Briefly, to obtain the dispersion of osmium nanoparticles, dissolve 1g (0.0039 mol) of osmium tetroxide in 50 mL t–butanol at room temperature, in a 100 mL conical vessel.
Separately, in a 2,000 mL vessel with a hemispherical bottom, introduce 1,250 mL (1,000 g) of n–dodecanol or n–decanol, to which 7.249 g (0.039 mol) of 10–undecylenic acid. After approx. 10 minutes of homogenization, the osmium tetroxide solution is added in drops, when it will be possible to observe the instant formation of an intensely black dispersion. The dispersion obtained (Os–np/nDD or Os–np/nD) is washed five times with 200 mL of pure water which is analyzed spectrophotometrically to track the removal of t–butanol or other organic components.
The stability of the prepared nanodispersion is monitored by contacting it with 200 mL of pure water for two weeks, the aqueous layer being analyzed daily spectrophotometrically, and the osmium dispersion at the water interface with a Motic microscope (MoticEurope, S.L.U., Barcelona, Spain).
4.2.3. Preparation of Emulsion of Acidic Aqueous Solution (Receiving Phase) in n–Alcohols
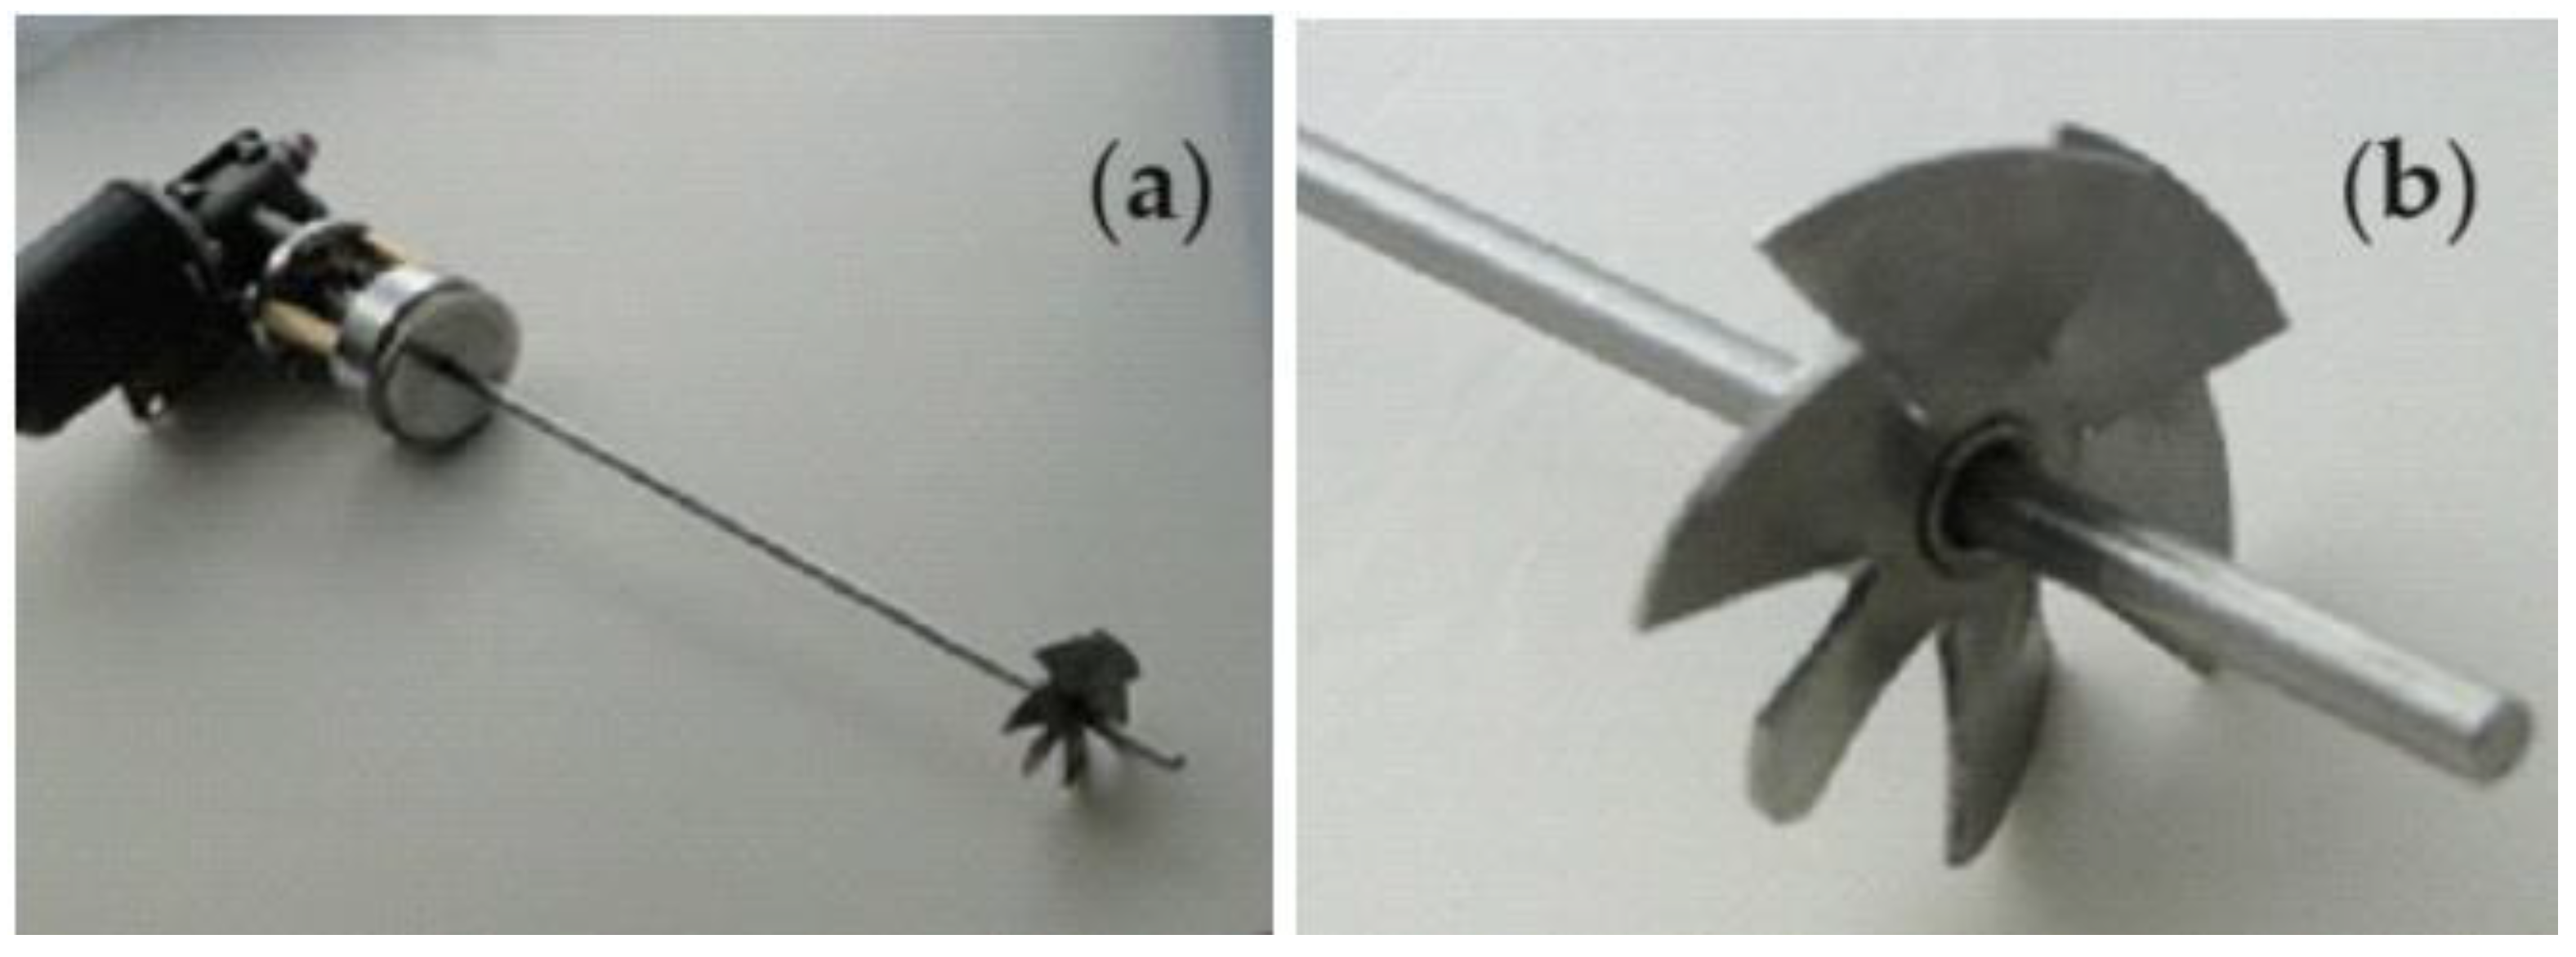
A stock emulsion is prepared by intensively mixing 500 mL of osmium dispersion in n–alcohol and 500 mL of acidic aqueous solution. The intense stirring of the immiscible phases is carried out with a propeller type stirrer (
Figure 18) with 150 rotations per minute. A black dispersion is obtained whose conductance is lower than that of ultrapure water.
4.2.4. Reduction of p–Nitrophenol to p–Aminophenol
The source phase consisting of a solution of p–nitrophenol 2.78 g/L (2×10⁻² mol/L) in ultrapure water is mixed with a freshly prepared solution of sodium borohydride 7.566 g/L (0.2 mol/L).
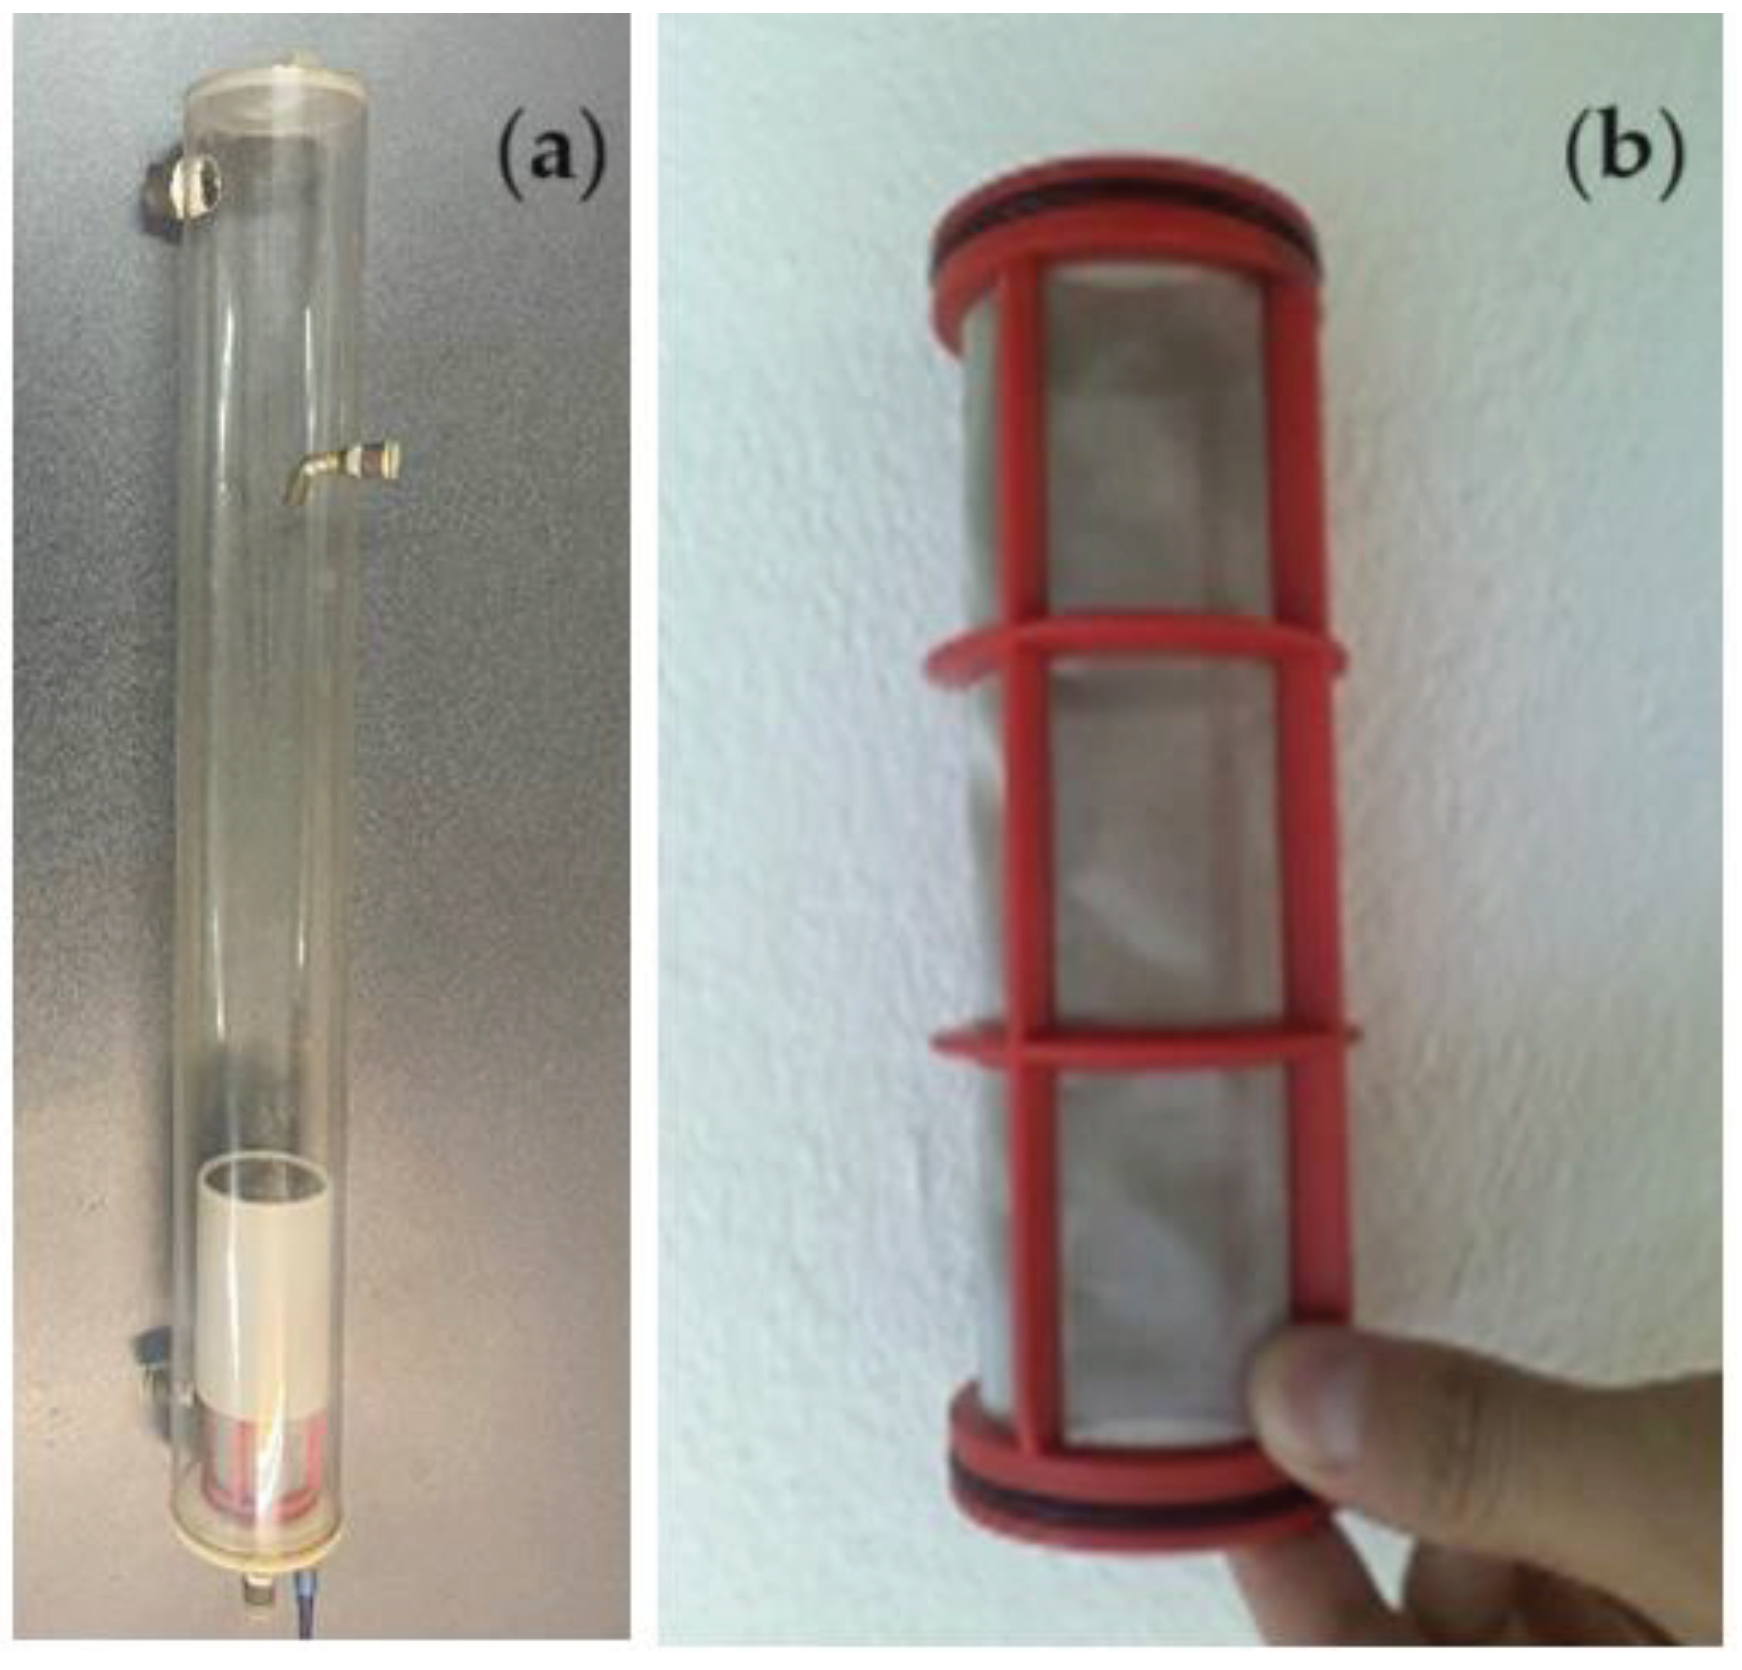
1,000 mL of such a solution is introduced into the 1,500 mL reaction column (
Figure 19a), and recirculated by means of a peristaltic pump, with a flow rate of 15.0 mL/s. The source solution is recirculated either co-current or counter-currently (
Figure 11) with 200 mL of emulsion containing the receiving phase (100 mL) embedded in the osmium nanodispersion in n–alcohols (100 mL). The dispersion of the emulsion containing the receptor phase is carried out with a specific device (Figures 19b) with the help of the peristaltic pump with a flow rate of 3.5 mL/s.
Monitoring the progress of the reaction is done by taking 1.0 mL of the source solution at predetermined operation interval, then subjected to spectrophotometric determination at λ=404 nm. Calculation of conversion or separation efficiency is done by relations (3) and (4).
Author Contributions
Conceptualization, A.P., A.C.N. V.-A.G. and G.N.; methodology, A.R.G., O.C.O, C.M., P.C.A. and B.Ș.V.; validation, A.C.N., V.-A.G. and G.N.; formal analysis, G.N. and V.-A.G.; investigation, A.P., A.C.N., S.K.T., O.C.O., A.R.G., C.M., P.C.A., V.-A.G., B.Ș.V., and G.N.; resources, A.P., A.C.N., G.N.; data curation, A.R.G., V.-A.G. and A.C.N.; writing—original draft preparation, A.P., O.C.O., A.C.N. V.-A.G. and G.N.; writing—review and editing, A.P., V.-A.G. and G.N. All authors have read and agreed to the published version of the manuscript.
Funding
This research received no funding.
Institutional Review Board Statement
Not applicable.
Informed Consent Statement
Not applicable
Data Availability Statement
Data are contained within the article.
Acknowledgments
The authors gratefully acknowledge the valuable help and friendly assistance of eng. Roxana Truşcă for performing the membrane scanning microscopy analysis.
Conflicts of Interest
The authors declare no conflicts of interest.
References
- Kostanyan, A.E.; Belova, V.V.; Voshkin, A.A. Three- and Multi-Phase Extraction as a Tool for the Implementation of Liquid Membrane Separation Methods in Practice. Membranes 2022, 12, 926. [Google Scholar] [CrossRef]
- Shyam Sunder, G.S.; Adhikari, S.; Rohanifar, A.; Poudel, A.; Kirchhoff, J.R. Evolution of Environmentally Friendly Strategies for Metal Extraction. Separations 2020, 7, 4. [Google Scholar] [CrossRef]
- Bóna, Á.; Bakonyi, P.; Galambos, I.; Bélafi-Bakó, K.; Nemestóthy, N. Separation of Volatile Fatty Acids from Model Anaerobic Effluents Using Various Membrane Technologies. Membranes 2020, 10, 252. [Google Scholar] [CrossRef] [PubMed]
- Kostanyan, A.E.; Belova, V.V.; Zakhodyaeva, Y.A.; Voshkin, A.A. Extraction of Copper from Sulfuric Acid Solutions Based on Pseudo-Liquid Membrane Technology. Membranes 2023, 13, 418. [Google Scholar] [CrossRef] [PubMed]
- Aldwaish, M.; Kouki, N.; Algreiby, A.; Tar, H.; Tayeb, R.; Hafiane, A. An Ionic supported liquid membrane for the recovery of bisphenol A from aqueous solution. Membranes 2022, 12, 869. [Google Scholar] [CrossRef] [PubMed]
- Khalaf, Z.A.; Hassan, A.A. Studying of the effect of many parameters on a bulk liquid membrane and its opposition in Cd(II) removal from wastewater. J. Phys. Conf. Ser. 2021, 1973, 012097. [Google Scholar] [CrossRef]
- Kárászová, M.; Bourassi, M.; Gaálová, J. Membrane Removal of Emerging Contaminants from Water: Which Kind of Membranes Should We Use? Membranes 2020, 10, 305. [Google Scholar] [CrossRef] [PubMed]
- Li, L.; Ma, G.; Pan, Z.; Zhang, N.; Zhang, Z. Research Progress in Gas Separation Using Hollow Fiber Membrane Contactors. Membranes 2020, 10, 380. [Google Scholar] [CrossRef]
- León, G.; Hidalgo, A.M.; Miguel, B.; Guzmán, M.A. Pertraction of Co(II) through Novel Ultrasound Prepared Supported Liquid Membranes Containing D2EHPA. Optimization and Transport Parameters. Membranes 2020, 10, 436. [Google Scholar] [CrossRef]
- Kim, D.; Nunes, S.P. Green solvents for membrane manufacture: Recent trends and perspectives. Curr. Opin. Gr. Sustain. Chem. 2021, 28, 100427. [Google Scholar] [CrossRef]
- Kostanyan, A.E.; Voshkin, A.A.; Belova, V.V.; Zakhodyaeva, Y.A. Modelling and Comparative Analysis of Different Methods of Liquid Membrane Separations. Membranes 2023, 13, 554. [Google Scholar] [CrossRef] [PubMed]
- Atlaskin, A. A.; Kryuchkov, S.S.; Yanbikov, N.R.; Smorodin, K.A.; Petukhov, A.N.; Trubyanov, M.M.; Vorotyntsev, V.M.; Vorotyntsev, I.V. Comprehensive experimental study of acid gases removal process by membrane-assisted gas absorption using imidazolium ionic liquids solutions absorbent, Sep. Pur. Technol. 2020, 239, 116578. [Google Scholar] [CrossRef]
- Bazhenov, S.D.; Bildyukevich, A.V.; Volkov, A.V. Gas-liquid hollow fiber membrane contactors for different applications. Fibers 2018, 6, 76. [Google Scholar] [CrossRef]
- Lee, W.J.; Goh, P.S.; Lau, W.J.; Ismail, A.F.; Hilal, N. Green Approaches for Sustainable Development of Liquid Separation Membrane. Membranes 2021, 11, 235. [Google Scholar] [CrossRef] [PubMed]
- Mulder, M. Basic principles of membrane technology. Kluwer Academic Publishers: A.H. Dordrecht, Netherlands, 1996; pp. 340–347. ISBN 0792309782. [Google Scholar] [CrossRef]
- Baker, W. Membrane Technology and Applications, 3rd ed. John Wiley & SonsLtd.: Chichester (UK), 2012; pp. 148–149. ISBN 9780470743720. [Google Scholar] [CrossRef]
- León, G.; Hidalgo, A.M.; Gómez, M.; Gómez, E.; Miguel, B. Efficiency, Kinetics and Mechanism of 4-Nitroaniline Removal from Aqueous Solutions by Emulsion Liquid Membranes Using Type 1 Facilitated Transport. Membranes 2024, 14, 13. [Google Scholar] [CrossRef]
- Đurasović, I.; Štefanić, G.; Dražić, G.; Peter, R.; Klencsár, Z.; Marciuš, M.; Jurkin, T.; Ivanda, M.; Stichleutner, S.; Gotić, M. Microwave-Assisted Synthesis of Pt/SnO2 for the Catalytic Reduction of 4-Nitrophenol to 4-Aminophenol. Nanomaterials 2023, 13, 2481. [Google Scholar] [CrossRef] [PubMed]
- Nechifor, A.C.; Goran, A.; Grosu, V.-A.; Pîrțac, A.; Albu, P.C.; Oprea, O.; Grosu, A.R.; Pașcu, D.; Păncescu, F.M.; Nechifor, G.; Tanczos, S.-K.; Bungau, G.S. Reactional Processes on Osmium–Polymeric Membranes for 5–Nitrobenzimidazole Reduction. Membranes 2021, 11, 633. [Google Scholar] [CrossRef]
- Albu, P.C.; Ferencz, A.; Al-Ani, H.N.A.; Tanczos, S.-K.; Oprea, O.; Grosu, V.-A.; Nechifor, G.; Bungău, S.G.; Grosu, A.R.; Goran, A.; Nechifor, A.C. Osmium Recovery as Membrane Nanomaterials through 10–Undecenoic Acid Reduction Method. Membranes 2022, 12, 51. [Google Scholar] [CrossRef]
- Albu, P.C.; Tanczos, S.-K.; Ferencz, A.; Pîrțac, A.; Grosu, A.R.; Pașcu, D.; Grosu, V.-A.; Bungău, C.; Nechifor, A.C. pH and Design on n–Alkyl Alcohol Bulk Liquid Membranes for Improving Phenol Derivative Transport and Separation. Membranes 2022, 12, 365. [Google Scholar] [CrossRef]
- Nechifor, G.; Grosu, A.R.; Ferencz, A.; Tanczos, S.-K.; Goran, A.; Grosu, V.-A.; Bungău, S.G.; Păncescu, F.M.; Albu, P.C.; Nechifor, A.C. Simultaneous Release of Silver Ions and 10–Undecenoic Acid from Silver Iron–Oxide Nanoparticles Impregnated Membranes. Membranes 2022, 12, 557. [Google Scholar] [CrossRef]
- Ferencz, A.; Grosu, A.R.; Al-Ani, H.N.A.; Nechifor, A.C.; Tanczos, S.-K.; Albu, P.C.; Crăciun, M.E.; Ioan, M.-R.; Grosu, V.-A.; Nechifor, G. Operational Limits of the Bulk Hybrid Liquid Membranes Based on Dispersion Systems. Membranes 2022, 12, 190. [Google Scholar] [CrossRef]
- Bolitho, E.M.; Coverdale, J.P.C.; Bridgewater, H.E.; Clarkson, G.J.; Quinn, P.D.; Sanchez-Cano, C.; Sadler, P.J. Tracking Reactions of Asymmetric Organo-Osmium Transfer Hydrogenation Catalysts in Cancer Cells. Angew. Chem. Int. Ed. 2021, 60, 6462–6472, International Edition. [Google Scholar] [CrossRef]
- Sharpless, K.B.; Amberg, W.; Bennani, Y.L.; Crispino, G.A.; Hartung, J.; Jeong, K.S.; Kwong, H.L.; Morikawa, K.; Wang, Z.M. The osmium-catalyzed asymmetric dihydroxylation: A new ligand class and a process improvement. J. Org. Chem. 1992, 57, 2768–2771. [Google Scholar] [CrossRef]
- Uribe-Godínez, J.; Castellanos, E.; Borja-Arco, R.H.; Altamirano-Gutiérrez, A.; Jiménez-Sandoval, O. Novel osmium-based electrocatalysts for oxygen reduction and hydrogen oxidation in acid conditions. J. Power Sources 2008, 177, 286–295. [Google Scholar] [CrossRef]
- Heller, A. Electron-conducting redox hydrogels: Design, characteristics and synthesis. Curr. Opin. Chem. Biol. 2006, 10, 664–672. [Google Scholar] [CrossRef] [PubMed]
- Keith, L.; Telliard, W. Priority Pollutants. Environ. Sci. Technol. 1979, 13, 416–423, doi:10.1021/es60152a60[29] Adams, C.W.M.; Abdulla, Y.H.; Bayliss, O.B. Osmium tetroxide as a histochemical and histological reagent. Histochemie 1967, 9, 68–77. [Google Scholar] [CrossRef]
- Verma, R; Jaggi, N. A DFT investigation of Osmium decorated single walled carbon nanotubes for hydrogen storage. International Journal of Hydrogen Energy 2024, 54, 1507–1520. [Google Scholar] [CrossRef]
- Nechifor, A.C.; Goran, A.; Tanczos, S.-K.; Păncescu, F.M.; Oprea, O.-C.; Grosu, A.R.; Matei, C.; Grosu, V.-A.; Vasile, B.Ș.; Albu, P.C. Obtaining and Characterizing the Osmium Nanoparticles/n–Decanol Bulk Membrane Used for the p–Nitrophenol Reduction and Separation System. Membranes 2022, 12, 1024. [Google Scholar] [CrossRef] [PubMed]
- Nechifor, G.; Păncescu, F.M.; Grosu, A.R.; Albu, P.C.; Oprea, O.; Tanczos, S.-K.; Bungău, C.; Grosu, V.-A.; Pîrțac, A.; Nechifor, A.C. Osmium Nanoparticles-Polypropylene Hollow Fiber Membranes Applied in Redox Processes. Nanomaterials 2021, 11, 2526. [Google Scholar] [CrossRef] [PubMed]
- Zhang, T.; Ouyang, B.; Zhang, X.; Xia, G.; Wang, N.; Ou, H.; Ma, L.; Mao, P.; Ostrikov, K.K.; Di, L.; et al. Plasma-enabled synthesis of Pd/GO rich in oxygen-containing groups and defects for highly efficient 4-nitrophenol reduction. Appl. Surf. Sci. 2022, 4, 153727. [Google Scholar] [CrossRef]
- Wang, G.; Lv, K.; Chen, T.; Chen, Z.; Hu, J. A versatile catalyst for p-nitrophenol reduction and Suzuki reaction in aqueous medium. Int. J. Biol. Macromol. 2021, 184, pp–358. [Google Scholar] [CrossRef]
- Scheuerlein, M.C.; Muench, F.; Kunz, U.; Hellmann, T.; Hofmann, J.P.; Ensinger, W. Electroless Nanoplating of Iridium: Template-Assisted Nanotube Deposition for the Continuous Flow Reduction of 4-Nitrophenol. ChemElectroChem 2020, 7, 3496–3507. [Google Scholar] [CrossRef]
- Li, J.; Wu, F.; Lin, L.; Guo, Y.; Liu, H.; Zhang, X. Flow fabrication of a highly efficient Pd/UiO-66-NH2 film capillary microreactor for 4-nitrophenol reduction. Chem.Eng. J. 2018, 333, 146–152. [Google Scholar] [CrossRef]
- Xu, B.; Li, X.; Chen, Z.; Zhang, T.; Li, C. Pd@MIL-100(Fe) composite nanoparticles as efficient catalyst for reduction of 2/3/4-nitrophenol: synergistic effect between Pd and MIL-100(Fe). Microporous Mesoporous Mater. 2018, 255, 1–6. [Google Scholar] [CrossRef]
- Guan, H.; Chao, C.; Kong, W.; Hu, Z.; Zhao, Y.; Yuan, S.; Zhang, B. Magnetic nanoporous PtNi/SiO2 nanofibers for catalytic hydrogenation of p-nitrophenol. Nanopart Res. 2017, 19, 187. [Google Scholar] [CrossRef]
- Ramírez-Crescencio, F.; Redón, R.; Herrera-Gomez, A.; Gomez-Sosa, G.; Bravo-Sanchez, M.; Fernandez-Osorio, A.L. Facile obtaining of Iridium (0), Platinum (0) and Platinum (0)-Iridium (0) alloy nanoparticles and the catalytic reduction of 4-nitrophenol. Materials Chemistry and Physics 2017, 201, 289–296. [Google Scholar] [CrossRef]
- Xu, D.; Diao, P.; Jin, T.; Wu, Q.; Liu, X.; Guo, X.; Gong, H.; Li, F.; Xiang, M.; Ronghai, Y. Iridium oxide nanoparticles and iridium/iridium oxide nanocomposites: photochemical fabrication and application in catalytic reduction of 4-nitrophenol. ACS Applied Materials & Interfaces 2015, 7, 16738–16749. [Google Scholar] [CrossRef]
- Hirai, H.; Nakao, Y.; Toshima, N. Preparation of Colloidal Transition Metals in Polymers by Reduction with Alcohols or Ethers. J Macromol Sci Chem. 1979, A13, 727–750. [Google Scholar] [CrossRef]
- Von Willingh, G. Recent Advancements in the Development of Osmium Catalysts for Various Oxidation Reactions: A New Era? Comment Inorg Chem. 2021, 41, 249–266. [Google Scholar] [CrossRef]
- Yung, K.F.; Wong, W.T. Synthesis and catalytic studies of uniform Os & Os-Pd nanoparticles supported on MWNTs. J Clust Sci. 2007, 18, 51–65. [Google Scholar] [CrossRef]
- Low, J.E.; Foelske-Schmitz, A.; Krumeich, F.; Wörle, M.; Baudouin, D.; Rascón, F.; Copéret, C. Narrowly dispersed silica supported osmium nanoparticles prepared by an organometallic approach: H2 and CO adsorption stoichiometry and hydrogenolysis catalytic activity. Dalton Trans. 2013, 42, 12620–12625. [Google Scholar] [CrossRef]
- Pitto-Barry, A.; Perdigao, L.M.; Walker, M.; Lawrence, J.; Costantini, G.; Sadler, P.J.; Barry, N.P. Synthesis and controlled growth of osmium nanoparticles by electron irradiation. Dalton Trans. 2015, 44, 20308–20311. [Google Scholar] [CrossRef]
- Pitto-Barry, A.; Geraki, K.; Horbury, M.D.; Stavros, V.G.; Mosselmans, J.F.W.; Walton, R.I.; Sadler, P.J.; Barry, N.P. Controlled fabrication of osmium nanocrystals by electron, laser and microwave irradiation and characterisation by microfocus X-ray absorption spectroscopy. Chem Commun (Camb). 2017, 53, 12898–12901. [Google Scholar] [CrossRef]
- Chakrapani, K.; Sampath, S. Interconnected, ultrafine osmium nanoclusters: preparation and surface enhanced Raman scattering activity. Chem Commun (Camb). 2013, 49, 6173–6175. [Google Scholar] [CrossRef]
- Anantharaj, S.; Nithiyanantham, U.; Ede, S.R.; Kundu, S. Osmium Organosol on DNA: Application in Catalytic Hydrogenation Reaction and in SERS Studies. Ind Eng Chem Res. 2014, 53, 19228–19238. [Google Scholar] [CrossRef]
- Santacruz, L.; Donnici, S.; Granados, A.; Shafir, A. Vallribera, A,Fluoro-tagged osmium and iridium nanoparticles in oxidation reactions. Tetrahedron. 2018, 74, 6890–6895. [Google Scholar] [CrossRef]
- Cheng, Y.; Fan, X.; Liao, F.; Lu, S.; Li, Y.; Liu, L.; Li, Y.; Lin, H.; Shao, M.; Lee, S.T. Os/Si nanocomposites as excellent hydrogen evolution electrocatalysts with thermodynamically more favorable hydrogen adsorption free energy than platinum. Nano Energy. 2017, 39, 284–290. [Google Scholar] [CrossRef]
- Elhenawy, S.; Khraisheh, M.; AlMomani, F.; Hassan, M. Key Applications and Potential Limitations of Ionic Liquid Membranes in the Gas Separation Process of CO2, CH4, N2, H2 or Mixtures of These Gases from Various Gas Streams. Molecules 2020, 25, 4274. [Google Scholar] [CrossRef]
- Shimoga, G.; Palem, R.R.; Lee, S.-H.; Kim, S.-Y. Catalytic Degradability of p-Nitrophenol Using Ecofriendly Silver Nanoparticles. Metals 2020, 10, 1661. [Google Scholar] [CrossRef]
- Brown, H.K.; El Haskouri, J.; Marcos, M.D.; Ros-Lis, J.V.; Amorós, P.; Úbeda Picot, M.Á.; Pérez-Pla, F. Synthesis and Catalytic Activity for 2, 3, and 4-Nitrophenol Reduction of Green Catalysts Based on Cu, Ag and Au Nanoparticles Deposited on Polydopamine-Magnetite Porous Supports. Nanomaterials 2023, 13, 2162. [Google Scholar] [CrossRef] [PubMed]
- Chen, H.; Yang, M.; Liu, Y.; Yue, J.; Chen, G. Influence of Co3O4 Nanostructure Morphology on the Catalytic Degradation of p-Nitrophenol. Molecules 2023, 28, 7396. [Google Scholar] [CrossRef] [PubMed]
- Minisy, I.M.; Taboubi, O.; Hromádková, J. One-Step Accelerated Synthesis of Conducting Polymer/Silver Composites and Their Catalytic Reduction of Cr(VI) Ions and p-Nitrophenol. Polymers 2023, 15, 2366. [Google Scholar] [CrossRef]
- Da’na, E.; Taha, A.; El-Aassar, M.R. Catalytic Reduction of p-Nitrophenol on MnO2/Zeolite -13X Prepared with Lawsonia inermis Extract as a Stabilizing and Capping Agent. Nanomaterials 2023, 13, 785. [Google Scholar] [CrossRef]
- Wang, C.; Zhu, D.; Bi, H.; Zhang, Z.; Zhu, J. Synthesis of Nitrogen and Phosphorus/Sulfur Co-Doped Carbon Xerogels for the Efficient Electrocatalytic Reduction of p-Nitrophenol. Int. J. Mol. Sci. 2023, 24, 2432. [Google Scholar] [CrossRef] [PubMed]
- Zhao, Y.; Yuan, P.; Xu, X.; Yang, J. Removal of p-Nitrophenol by Adsorption with 2-Phenylimidazole-Modified ZIF-8. Molecules 2023, 28, 4195. [Google Scholar] [CrossRef]
- Qi, K.; Wang, X.; Liu, S.; Lin, S.; Ma, Y.; Yan, Y. Visible Light Motivated the Photocatalytic Degradation of P-Nitrophenol by Ca2+-Doped AgInS2. Molecules 2024, 29, 361. [Google Scholar] [CrossRef] [PubMed]
- Li, S.; Guo, Y.; Liu, L.; Wang, J.; Zhang, L.; Shi, W.; Aleksandrzak, M.; Chen, X.; Liu, J. Fabrication of FeTCPP@CNNS for Efficient Photocatalytic Performance of p-Nitrophenol under Visible Light. Catalysts 2023, 13, 732. [Google Scholar] [CrossRef]
- Bukhamsin, H.A.; Hammud, H.H.; Awada, C.; Prakasam, T. Catalytic Reductive Degradation of 4-Nitrophenol and Methyl orange by Novel Cobalt Oxide Nanocomposites. Catalysts 2024, 14, 89. [Google Scholar] [CrossRef]
- Kuźniarska-Biernacka, I.; Ferreira, I.; Monteiro, M.; Santos, A.C.; Valentim, B.; Guedes, A.; Belo, J.H.; Araújo, J.P.; Freire, C.; Peixoto, A.F. Highly Efficient and Magnetically Recyclable Non-Noble Metal Fly Ash-Based Catalysts for 4-Nitrophenol Reduction. Catalysts 2024, 14, 3. [Google Scholar] [CrossRef]
Figure 1.
(a) Supported liquid membrane (SLM);
(b) emulsion liquid membrane (ELM); and
(c) catalytic p–nitrophenol reduction with molecular hydrogen through osmium–nanoparticles–polymeric membrane [
19,
20]; M: membrane; SP: source phase; RP: receiving phase.
Figure 1.
(a) Supported liquid membrane (SLM);
(b) emulsion liquid membrane (ELM); and
(c) catalytic p–nitrophenol reduction with molecular hydrogen through osmium–nanoparticles–polymeric membrane [
19,
20]; M: membrane; SP: source phase; RP: receiving phase.
Figure 2.
The scanning electronic microscopy (SEM) images for Os/ n–dodecanol nanodispersions (a) before use; and: (b) after use; in the reduction process of p–nitrophenol.
Figure 2.
The scanning electronic microscopy (SEM) images for Os/ n–dodecanol nanodispersions (a) before use; and: (b) after use; in the reduction process of p–nitrophenol.
Figure 3.
The images obtained by scanning electronic microscopy (SEM): for the primary Os/ n–decanol dispersion (a); and for the Os/ n–dodecanol dispersion (b); obtained after the p–nitrophenol reduction process.
Figure 3.
The images obtained by scanning electronic microscopy (SEM): for the primary Os/ n–decanol dispersion (a); and for the Os/ n–dodecanol dispersion (b); obtained after the p–nitrophenol reduction process.
Figure 4.
Size distribution of osmium nanoparticles in n–dodecanol: (a) before use; and: (b) after use; in the p–nitrophenol reduction process.
Figure 4.
Size distribution of osmium nanoparticles in n–dodecanol: (a) before use; and: (b) after use; in the p–nitrophenol reduction process.
Figure 5.
Energy-dispersive spectroscopy analysis (EDAX) for osmium nanodispersion in n–dodecanol.
Figure 5.
Energy-dispersive spectroscopy analysis (EDAX) for osmium nanodispersion in n–dodecanol.
Figure 6.
(a) Thermal analysis of the Os/n–dodecanol (nDD) in comparison with n–decanol (nD) dispersion sample; and: (b) detailed thermal nDD dispersion sample analysis.
Figure 6.
(a) Thermal analysis of the Os/n–dodecanol (nDD) in comparison with n–decanol (nD) dispersion sample; and: (b) detailed thermal nDD dispersion sample analysis.
Figure 7.
The 3D FTIR diagram vs. temperature for the evolved gases.
Figure 7.
The 3D FTIR diagram vs. temperature for the evolved gases.
Figure 8.
The FTIR spectrum of evolved gases at 160 and 200 °C indicates the presence of n–dodecanol.
Figure 8.
The FTIR spectrum of evolved gases at 160 and 200 °C indicates the presence of n–dodecanol.
Figure 9.
The FTIR spectrum of evolved gases up to 200 °C indicates the presence of undecylenic acid.
Figure 9.
The FTIR spectrum of evolved gases up to 200 °C indicates the presence of undecylenic acid.
Figure 10.
Emulsion membrane based on osmium nanodispersions in n–alcohol (yellow), containing p–nitrophenol and sodium borohydride in the source aqueous phase (green) and the acid solution in the receiver phase (blue).
Figure 10.
Emulsion membrane based on osmium nanodispersions in n–alcohol (yellow), containing p–nitrophenol and sodium borohydride in the source aqueous phase (green) and the acid solution in the receiver phase (blue).
Figure 11.
Phase circulation in the column for the reduction of p–nitrophenol to p–aminophenol: (a) co-current; and (b) counter-current. 1 – the reaction column; 2 – source phase (SP) tank; 3 – source phase metering pump; 4 – source phase level maintenance vessel; 5 – source phase tank; 6 – emulsion dosing pump; 7 – intermediate emulsion vessel; 8 – emulsion collector vessel.
Figure 12.
Comparison of the results, as a function of time, obtained from the conversion of p–nitrophenol with the nanodispersion of n–dodecanol (brown squares), and respectively, n–decanol (green triangles).
Figure 12.
Comparison of the results, as a function of time, obtained from the conversion of p–nitrophenol with the nanodispersion of n–dodecanol (brown squares), and respectively, n–decanol (green triangles).
Figure 13.
Comparison of the results obtained during the conversion (η) of p–nitrophenol with the nanodispersion of n–dodecanol (blue diamond, brown squares), and respectively, of n–decanol (green triangle and black crosses) depending on time and the flow mode of the phases in the stripping column: counter-current (brown square and black crosses) and co-current (blue diamonds and green triangles).
Figure 14.
Results of the conversion (η) depending on the pH difference between the source and receiving phases, which circulate in counter-current for the emulsion based on n–decanol (brown squares) or n–dodecanol (green triangles).
Figure 14.
Results of the conversion (η) depending on the pH difference between the source and receiving phases, which circulate in counter-current for the emulsion based on n–decanol (brown squares) or n–dodecanol (green triangles).
Figure 15.
Conversion results (η) depending on the number of conversion cycles with the same emulsion based on osmium nanoparticles in n–decanol (brown squares) or n–dodecanol (green triangles), containing the receiver phase of pH 2, and the source phase of pH 12 containing p–nitrophenol and refreshed sodium borohydride, which circulates in the counter-current.
Figure 16.
The separation efficiency (EE) of p–aminophenol from the emulsion formed by osmium nanodispersion in n–dodecanol or n–decanol and the receiving aqueous phase of pH 2, depending on the operating time.
Figure 16.
The separation efficiency (EE) of p–aminophenol from the emulsion formed by osmium nanodispersion in n–dodecanol or n–decanol and the receiving aqueous phase of pH 2, depending on the operating time.
Figure 17.
Schematic representation of the hybrid process, of catalytic reduction of p–nitrophenol and membrane recovery of p–aminophenol.
Figure 17.
Schematic representation of the hybrid process, of catalytic reduction of p–nitrophenol and membrane recovery of p–aminophenol.
Figure 18.
Helix propeller stirrer for dispersing osmium nanoparticles in n–alcohols: (a) overview; (b) detail of the stirring component.
Figure 18.
Helix propeller stirrer for dispersing osmium nanoparticles in n–alcohols: (a) overview; (b) detail of the stirring component.
Figure 19.
The p–nitrophenol reduction reaction column (a); and the detail of the emulsion distribution device, containing the receiving phase emulsion in n–alcohols (b).
Figure 19.
The p–nitrophenol reduction reaction column (a); and the detail of the emulsion distribution device, containing the receiving phase emulsion in n–alcohols (b).
Table 1.
Comparative data of the ‘apparent catalytic rate constant (kapp)’ in the catalytic reduction reaction of p–nitrophenol to p–aminophenol.
Table 1.
Comparative data of the ‘apparent catalytic rate constant (kapp)’ in the catalytic reduction reaction of p–nitrophenol to p–aminophenol.
| Catalytic material |
kapp (s−1) |
Year |
Refs. |
| Os-nanoparticles on Polypropylene hollow fiber membranes |
2.04×10⁻⁴ – 8.05×10⁻⁴
|
2022 |
[30] |
| Osmium Nanoparticles/n–Decanol Bulk Membrane |
0.8×10⁻⁴ – 4.9×10⁻⁴
|
2022 |
[31] |
| Plasma-enabled synthesis of Pd/GO rich in oxygen-containing groups and defects |
13.9×10⁻³
|
2022 |
[32] |
| Immobilizing of palladium on melamine functionalized magnetic chitosan beads |
16.5×10⁻³
|
2021 |
[33] |
| Ultra-small iridium nanoparticles as active catalysts |
5.3×10⁻³ |
2020 |
[34] |
| Pd@MIL–100(Fe) composite nanoparticles as efficient catalyst |
6.5×10⁻³
|
2018 |
[35] |
| Highly efficient Pd/UiO–66–NH2 film capillary microreactor |
62.3×10⁻³
|
2017 |
[36] |
| Magnetic nano-porous PtNi/SiO2 nanofibers |
12.84×10⁻³
|
2017 |
[37] |
| Iridium (0), Platinum (0) and Platinum (0)–Iridium (0) alloy nanoparticles |
0.41×10⁻³ (Pt)
0.21×10⁻⁴ (Ir) |
2017 |
[38] |
| Iridium oxide nanoparticles and iridium/iridium oxide nanocomposites |
2.5×10⁻³ – 5.5×10⁻³
|
2015 |
[39] |
Table 2.
The thermal characteristics of the dispersion diagrams of osmium nanoparticles in n–decanol and n–dodecanol.
Table 2.
The thermal characteristics of the dispersion diagrams of osmium nanoparticles in n–decanol and n–dodecanol.
| Sample |
Mass loss up to |
Solvent removal |
Endo peak |
Residual mass |
| n–decanol |
1.96% at 95 °C |
94.94%
between 95–220 °C |
156.8 °C |
1.70% |
| n–dodecanol |
1.46% at 125 °C |
89.87%
between 125–220 °C |
196.1 °C |
4.46% |
Table 3.
The main properties of membrane n–alcohols.
Table 3.
The main properties of membrane n–alcohols.
| Organic compounds |
Molar mass (g/Mol) |
Solubility in
water (g/L) |
Water
solubility
(g/L) |
Viscosity
(cP) |
Relative polarity measure |
pKa |
| n–decanol (nD) |
158.28 |
0.037 |
0.0211 |
12.05 |
−0.540 |
15.21 |
| n–dodecanol (nDD) |
186.34 |
0.004 |
0.0019 |
18.80 |
−0.511 |
16.84 |
Table 4.
The characteristics of the substances used for the emulsion liquid membrane preparation.
|
Disclaimer/Publisher’s Note: The statements, opinions and data contained in all publications are solely those of the individual author(s) and contributor(s) and not of MDPI and/or the editor(s). MDPI and/or the editor(s) disclaim responsibility for any injury to people or property resulting from any ideas, methods, instructions or products referred to in the content. |
© 2024 by the authors. Licensee MDPI, Basel, Switzerland. This article is an open access article distributed under the terms and conditions of the Creative Commons Attribution (CC BY) license (http://creativecommons.org/licenses/by/4.0/).
