1. Introduction
Tuberculosis (TB), caused by
Mycobacterium tuberculosis, is the second leading cause of death from single infectious agents, with 7.5 million people newly diagnosed and 1.3 million deaths in 2022. TB also seriously threatens public health worldwide, such as HIV and malaria [
1]. BCG, a live attenuated vaccine developed using
Mycobacterium bovis (
M.
bovis), is commonly used to vaccinate newborns, effectively preventing severe incidence and transmission of the disease in childhood and adolescence [
1,
2,
3,
4]. However, the duration of protective efficacy is unstable in adults and adolescents, and the efficacy of BCG varies by age, area, and ethnicity. Additionally, the rate of infection and death due to tuberculosis rapidly increased after the COVID-19 pandemic, particularly in low-to-middle-income countries. Therefore, developing novel vaccines, either BCG replacements or BCG boosters, is urgently needed. Fourteen vaccine candidates are currently in different stages of clinical trials and are expected to prevent TB infections and disease development [
5,
6]. Most vaccines in clinical trials are composed of protein subunits combined with adjuvants, viral vectors based on either modified vaccinia virus, adenovirus, or influenza virus, or mRNA vaccines.
Viral vector vaccines, including MVA 85A such as Modified Vaccinia Ankara (MVA), have consistently remained in the TB vaccine pipeline. The attenuated vaccinia virus has been used as a vaccine platform as it can deliver and express foreign or large gene(s) and induce strong CD4+ and CD8+ cellular immunity. Hence, cytoplasmic gene expression could prevent the risk of integration into the host genome [
6,
7,
8,
9,
10,
11,
12,
13].
KVAC103, an innovative third-generation smallpox vaccine candidate, was developed using the Lancy-Vaxina strain [
14]. This candidate has demonstrated a reduction in virulence and an augmentation in immune response, evidenced by elevated levels of neutralizing antibodies and IFN-γ production in murine and rabbit models. Genomic analysis identified significant deletions compared with the progenitor strain, indicating an enhancement in both the safety and efficacy profiles of KVAC103, making it a viable candidate for smallpox vaccination [
14]. Concurrently, research efforts have focused on using attenuated vaccinia virus vectors to develop vaccines against infectious diseases and therapeutic vaccines for cancer [
15,
16]. Recent advancements in vaccine development using KVAC103 as a viral vector have underscored its versatility and potential for addressing various infectious diseases. Notably, a bivalent vaccine targeting anthrax and smallpox was formulated by integrating the gene encoding the protective antigen of
Bacillus anthracis into the KVAC103 genome [
7]. This innovative approach utilizing KVAC103 demonstrates the adaptability of the platform for developing vaccines against different pathogens, including a promising tuberculosis vaccine candidate.
The antigen 85 complex consists of the genes
fbpA,
fbpB, and
fbpC encoding Ag85A, Ag85B, and Ag85C, respectively, which display enzymatic activity in the mycobacterial envelope. The Ag85 complex is correlated with human tuberculosis and comprises 20–30% of constitutive proteins present in the supernatant in short-term culture [
8,
9,
10]. In particular, Ag85A (
fbpA) and Ag85B (
fbpB) have been selected as targets for developing TB vaccine candidates [
7,
9,
10,
11,
12,
13,
14,
15,
16,
17,
18], and at least seven vaccines are currently in the clinical phase including Ag85A and Ag85B.
We determined a recombinant virus expressing the Ag85B protein based on attenuated vaccinia virus KVAC103 (rKVAC85B) and evaluated the vaccine efficacy for two types of vaccination, the prime-boost of rKVAC85B and BCG-prime-rKVAC85B-boost. Additionally, the mice were challenged via aerosol using 2-strains, M. tuberculosis H37Rv and the hypervirulent strain HN878, to evaluate their protective effects on the bacterial load in the lung.
2. Materials and Methods
2.1. Animals and Ethics Statement
Four to five-week-old female C57BL/6 mice were procured from DooYeol Biotech (Seoul, Korea). Upon arrival, the mice were allowed to acclimatize for a period of one week in the controlled environment of the animal care facility at the Korea Disease Control and Prevention Agency (KDCA). The subsequent experimental procedures were conducted in strict adherence to the ethical guidelines of the Institutional Animal Care and Use Committee (IACUC) of the KDCA under the approved protocol (permit number: IACUC-KCDC-124-19-2A).
2.2. Bacterial Strains
M. bovis BCG Pasteur, M. tuberculosis H37Rv, and M. tuberculosis HN878 strains were cultured in Middlebrook 7H9 broth (BD, NJ, USA) enriched with 0.02% glycerol (Sigma, MO, USA), 0.05% Tween 80 (Sigma), and 10% albumin dextrose catalase (BD) until they reached an optical density (OD) of 0.6–0.8. The cultures were then centrifuged at 4290 x g for 20 min and washed three times with PBS. To reduce clumping, the pellets were homogenized using a 26-gauge syringe. Colony-forming units (CFUs) for each strain were determined by plating on Middlebrook 7H10 agar (BD) supplemented with 0.05% glycerol and 10% oleic acid albumin dextrose catalase (BD), and incubating at 37 °C for 3–4 weeks.
2.3. Generation and Verification of Recombinant KVAC103 Expressing Ag85B
Ag85B, codon-optimized for human expression, was cloned into the vaccinia virus shuttle vector pVVT-1, which included the TK-R and TK-L regions, for homologous recombination to generate rKVAC85B (
Figure 1A). Vero cells were cultured in DMEM (Gibco, NY, USA) supplemented with 10% FBS (Gibco) and antibiotics. The medium was replaced with Opti-MEM (Gibco) containing 2% FBS to the produce KVAC103 expressing GFP (rKVAC-GFP) and rKVAC85B cells. Cells adapted to 2% FBS were infected with rKVAC103 at a Multiplicity of Infection (MOI) of 0.02 for 2 hours in an environment maintained at 37 °C and 5% CO
2, followed by transfection with 1.5 µg pVVT-Ag85B using Lipofectamine 2000 (ThermoFisher, CA, USA). After 5 h, the supernatants were replaced with Opti-MEM containing 2% FBS, and plaque isolation was performed after two days to select the recombinants, confirmed by using PCR and western blotting. For western blotting, polyclonal antibodies specific for
M. tuberculosis Ag85B (1:1000; Abcam, Cambridge, UK) were used to detect the expressed proteins. The PCR confirmation of rKVAC85B used specific primers: forward 5′-tttgaagcattggaagcaact-3′ and reverse 5′-acgttgaaatgtcccatcgagt-3′. The attenuated vaccinia viruses, KVAC103 and rKVAC85B were grown in Opti-MEM containing 2% FBS without antibiotics for three days and titrated using the plaque-formation assay.
2.4. Animal Immunization and M. tuberculosis H37Rv and HN878 Infection via Aerosol
Mice were subjected to two distinct immunization strategies: a direct prime-boost with rKVAC85B, an administration via single inoculations at four-week intervals, and a BCG prime followed by a rKVAC85B boost, with the latter administered 10 weeks after the initial BCG administration (2 × 10⁵ CFUs per mouse). Immunogenicity assessments were performed one week after the final immunization at 15 weeks of age. Five groups of mice were euthanized via CO2 inhalation. The immune response was evaluated by analyzing lung lymphocytes and splenocytes using an ELISpot assay, intracellular cytokine staining (ICS), quantification of IgG titers, and an MGIA assay.
To challenge with M. tuberculosis, a separate cohort of mice (n = 5) was exposed to the H37Rv and HN878 strains three weeks post-final immunization. Infection was performed using a Glas-Col aerosol generator (Glas-Col LLC., IN, USA) to ensure a consistent initial dose of 100–200 CFUs per mouse. To ascertain the initial bacterial load, lung tissues from the infected mice were homogenized in DPBS the day after exposure. Homogenates were cultured on 7H10 agar plates for 3–4 weeks at 37 °C to facilitate colony formation. Eight weeks post-exposure, the mice were sacrificed, and the bacterial burdens in the lungs and spleen were determined by culturing on 7H10 agar for an additional 3–4 weeks.
2.5. Measurement of Antigen-Specific IgG and Bead Base Analysis of Cytokines
ELISA was conducted to quantify the antibody concentrations within a 1:100 ratio diluted sera, with a focus on IgG levels assessed against plates coated with Ag85B recombinant protein antigen (100 ng/well; Abcam, Cambridge, UK) and the optical density at 450 nm was measured. To evaluate the immune response further, cytokines and chemokines were quantified in immune cells isolated from lung and spleen tissues. Cells were plated at a density of 5 × 10⁵ cells/well and stimulated with a peptide mixture derived from Ag85B (JPT Peptide Technologies) for 36 h. The subsequent bead-based ELISA analysis, conducted in triplicate using the cell supernatant, enabled the measurement of ten-cytokine panel: interferon-gamma (IFN-γ), interleukin-2 (IL-2), tumor necrosis factor-alpha (TNF-α), interleukin-12p40 (IL-12p40), interleukin-12p70 (IL-12p70), interleukin-17A (IL-17A), interleukin-6 (IL-6), interleukin-10 (IL-10), granulocyte-macrophage colony-stimulating factor (GM-CSF), and monocyte chemoattractant protein-1 (MCP-1). Comprehensive cytokine profiling was performed using a customized Bio-Plex mouse cytokine 10-plex assay (Bio-Rad, Hercules, CA, USA).
2.6. INF-γ ELISPOT and Intracellular Cytokine Staining
Isolated cells from the lung and spleen were stimulated using a purchased peptide mixture of Ag85B, which was subsequently subjected to ELISPOT (for IFN-γ-released cells) and intracellular staining (for T-cells secreting three types of cytokines). For the IFN-γ ELISPOT assay, 5×10⁵ cells/well were seeded in plates coated with anti-mouse IFN-γ mAb. The assay was performed following the protocol provided by the manufacturer (BD Bioscience). Each isolated cell was stimulated with an Ag85B peptide mixture (100 ng/well) for 6 h, stained with antibodies developed against surface markers, and the results were analyzed using FlowJo software (BD Biosciences, San Jose, CA, USA).
2.7. Mycobacterium Growth Inhibition Assay (MGIA)
To generate a standard curve, a series of dilutions were prepared using M. bovis BCG 1173P2 (1 × 10⁸ CFU/mL) and phosphate-buffered saline with Tween 80. These dilutions, spanning seven 10-fold increments, were inoculated into MGIT tubes (BD Biosciences) containing MGIT PANTA (BD’s MGIT growth supplement). Time to detection (TTD) was measured using an MGIT 960 instrument, which monitored the tubes for positivity at hourly intervals. Additionally, the dilutions were cultured on 7H10 plates to enumerate CFUs. To assess the TTD of isolated splenocytes, immunized splenocytes (1 × 10⁶ cells/300 µl per well) were first resuspended in RPMI1640 supplemented with HEPES and L-glutamine (Hyclon, Waltham, MA). The cell suspension was then transferred to a 12-well plate, and M. bovis BCG (50 CFUs/300 µl) was added using the same medium. This co-culture was maintained for four days at 37 ℃ in a 5% CO2 incubator. Following the co-culture period, the splenocyte-BCG mixture was transferred to 1.5 mL tubes and centrifuged at 16,260 x g for 10 minutes at 4 ℃. The supernatant was carefully removed, and the pellet was resuspended in 600 µl tissue-culture-grade water. The resuspended pellet was inoculated into MGIT tubes containing MGIT PANTA. The tubes were placed in an MGIT 960 instrument and continuously monitored until they were registered as positive.
2.8. Statistical Analysis
Statistical analyses to assess the significance of the results were conducted using GraphPad Prism software. For multiple group comparisons, one-way ANOVA followed by the Tukey–Kramer multiple comparison test was used. The levels of significance are marked as follows: *p < 0.05, **p < 0.01, ***p < 0.001; ‘ns’ denotes lack of statistical significance.
4. Discussion
In the realm of TB prophylaxis, the Bacillus Calmette-Guérin (BCG) vaccine has been the predominant intervention in the last century, effectively reducing TB incidence in individuals from infancy to young adulthood. However, the efficacy of the BCG vaccine varies and tends decreases in the adult population, creating a significant gap in TB control, particularly in the absence of alternative vaccines [
1,
2,
3]. Current research is heavily focused on developing innovative TB vaccines that either supplement or enhance the immunity provided by BCG. This research includes various advanced immunological approaches, such as heterologous prime-boost strategies that utilize protein subunits, RNA-based vaccines, and viral-vectored vaccines [
9,
11,
19,
20,
21,
22,
23]. These methods aim to amplify the initial immune response triggered by BCG, overcoming its limitations and offering extended protection in adulthood.
According to the TB Vaccine Initiative TB vaccine development pipeline, clinical trials are currently underway to identify viral vector-based vaccine candidates, including those derived from MVA and chimpanzee adenovirus vectors [
24]. These trials are exploring innovative vaccination regimens that involve mono-or heterologous prime-boost strategies, utilizing these viral vectors in various combinations to enhance their immunogenicity and efficacy against TB [
6]. The use of viral vectors such as MVA, adenovirus, and parainfluenza virus 5 effectively enhances the immunity elicited by the BCG vaccine [
21]. This enhancement is primarily attributed to the induction of robust CD4+ and CD8+ T-cell mediated immune responses, which include antigen-specific multifunctional T-cells and IFN-γ-secreting cells, crucial for the efficacy of TB vaccines [
14,
22,
25,
26,
27].
In this study, we developed rKVAC85B, a recombinant vaccinia virus expressing the Ag85B antigen, using the attenuated vaccinia virus KVAC103 as a novel vaccine platform [
6,
7]. KVAC103 is a derivative of the vaccinia virus, closely related to the Lister and VACV107 strains, and demonstrates significant genomic alterations with 23 deleted and four truncated genes compared to VACV107. These alterations included the absence of virulence-related genes, such as the Bcl-2 homolog F1L, and deletions of the K1L and K3L genes, suggesting reduced virulence and cutaneous toxicity. Furthermore, KVAC103 shares 98.35% homology with MVA, indicating its potential use as a viral vector [
14]. Research conducted in 2010 expanded the understanding of factors influencing MVA host range and virulence, revealing that the phenotypic traits of MVA are governed not only by known host range genes (K1L, C7L, C12L/SPI-1, E3L, and K3L) but also by additional, yet unidentified, viral genes. Among the 31 open reading frames (ORFs) in the six large deletions of MVA, it is hypothesized that one or more uncharacterized genes significantly influence the virus’s host range in vitro and reduce virulence in mammalian hosts, particularly in the parental chorioallantois vaccinia virus Ankara (CVA) background [
28]. Using advanced genetic engineering with a fully sequenced bacterial artificial chromosome clone of CVA, we sequentially introduced these six major deletions into KVAC103 to avoid unwanted mutations. Interestingly, this only moderately reduced the overall virulence and significantly impaired replication in rabbit T-cells. The growth pattern of the recombinant vaccinia virus, rKVAC85B, was consistent with that of its parent strain, KVAC103, and the foreign Ag85B antigen was successfully expressed. This indicates the potential of KVAC103 as a versatile vaccine platform for TB and other infectious diseases. The insights into KVAC103’s genetic modifications, particularly its relationship with MVA and its distinct genomic traits, make it a promising candidate for vaccine development. The reduced virulence and specific host range of KVAC103, coupled with its high homology to MVA, suggest its potential advantages in safety and efficacy as a viral vector. This understanding of genetic factors, illuminated by over a decade of research, is crucial for designing and developing targeted and safe vaccines.
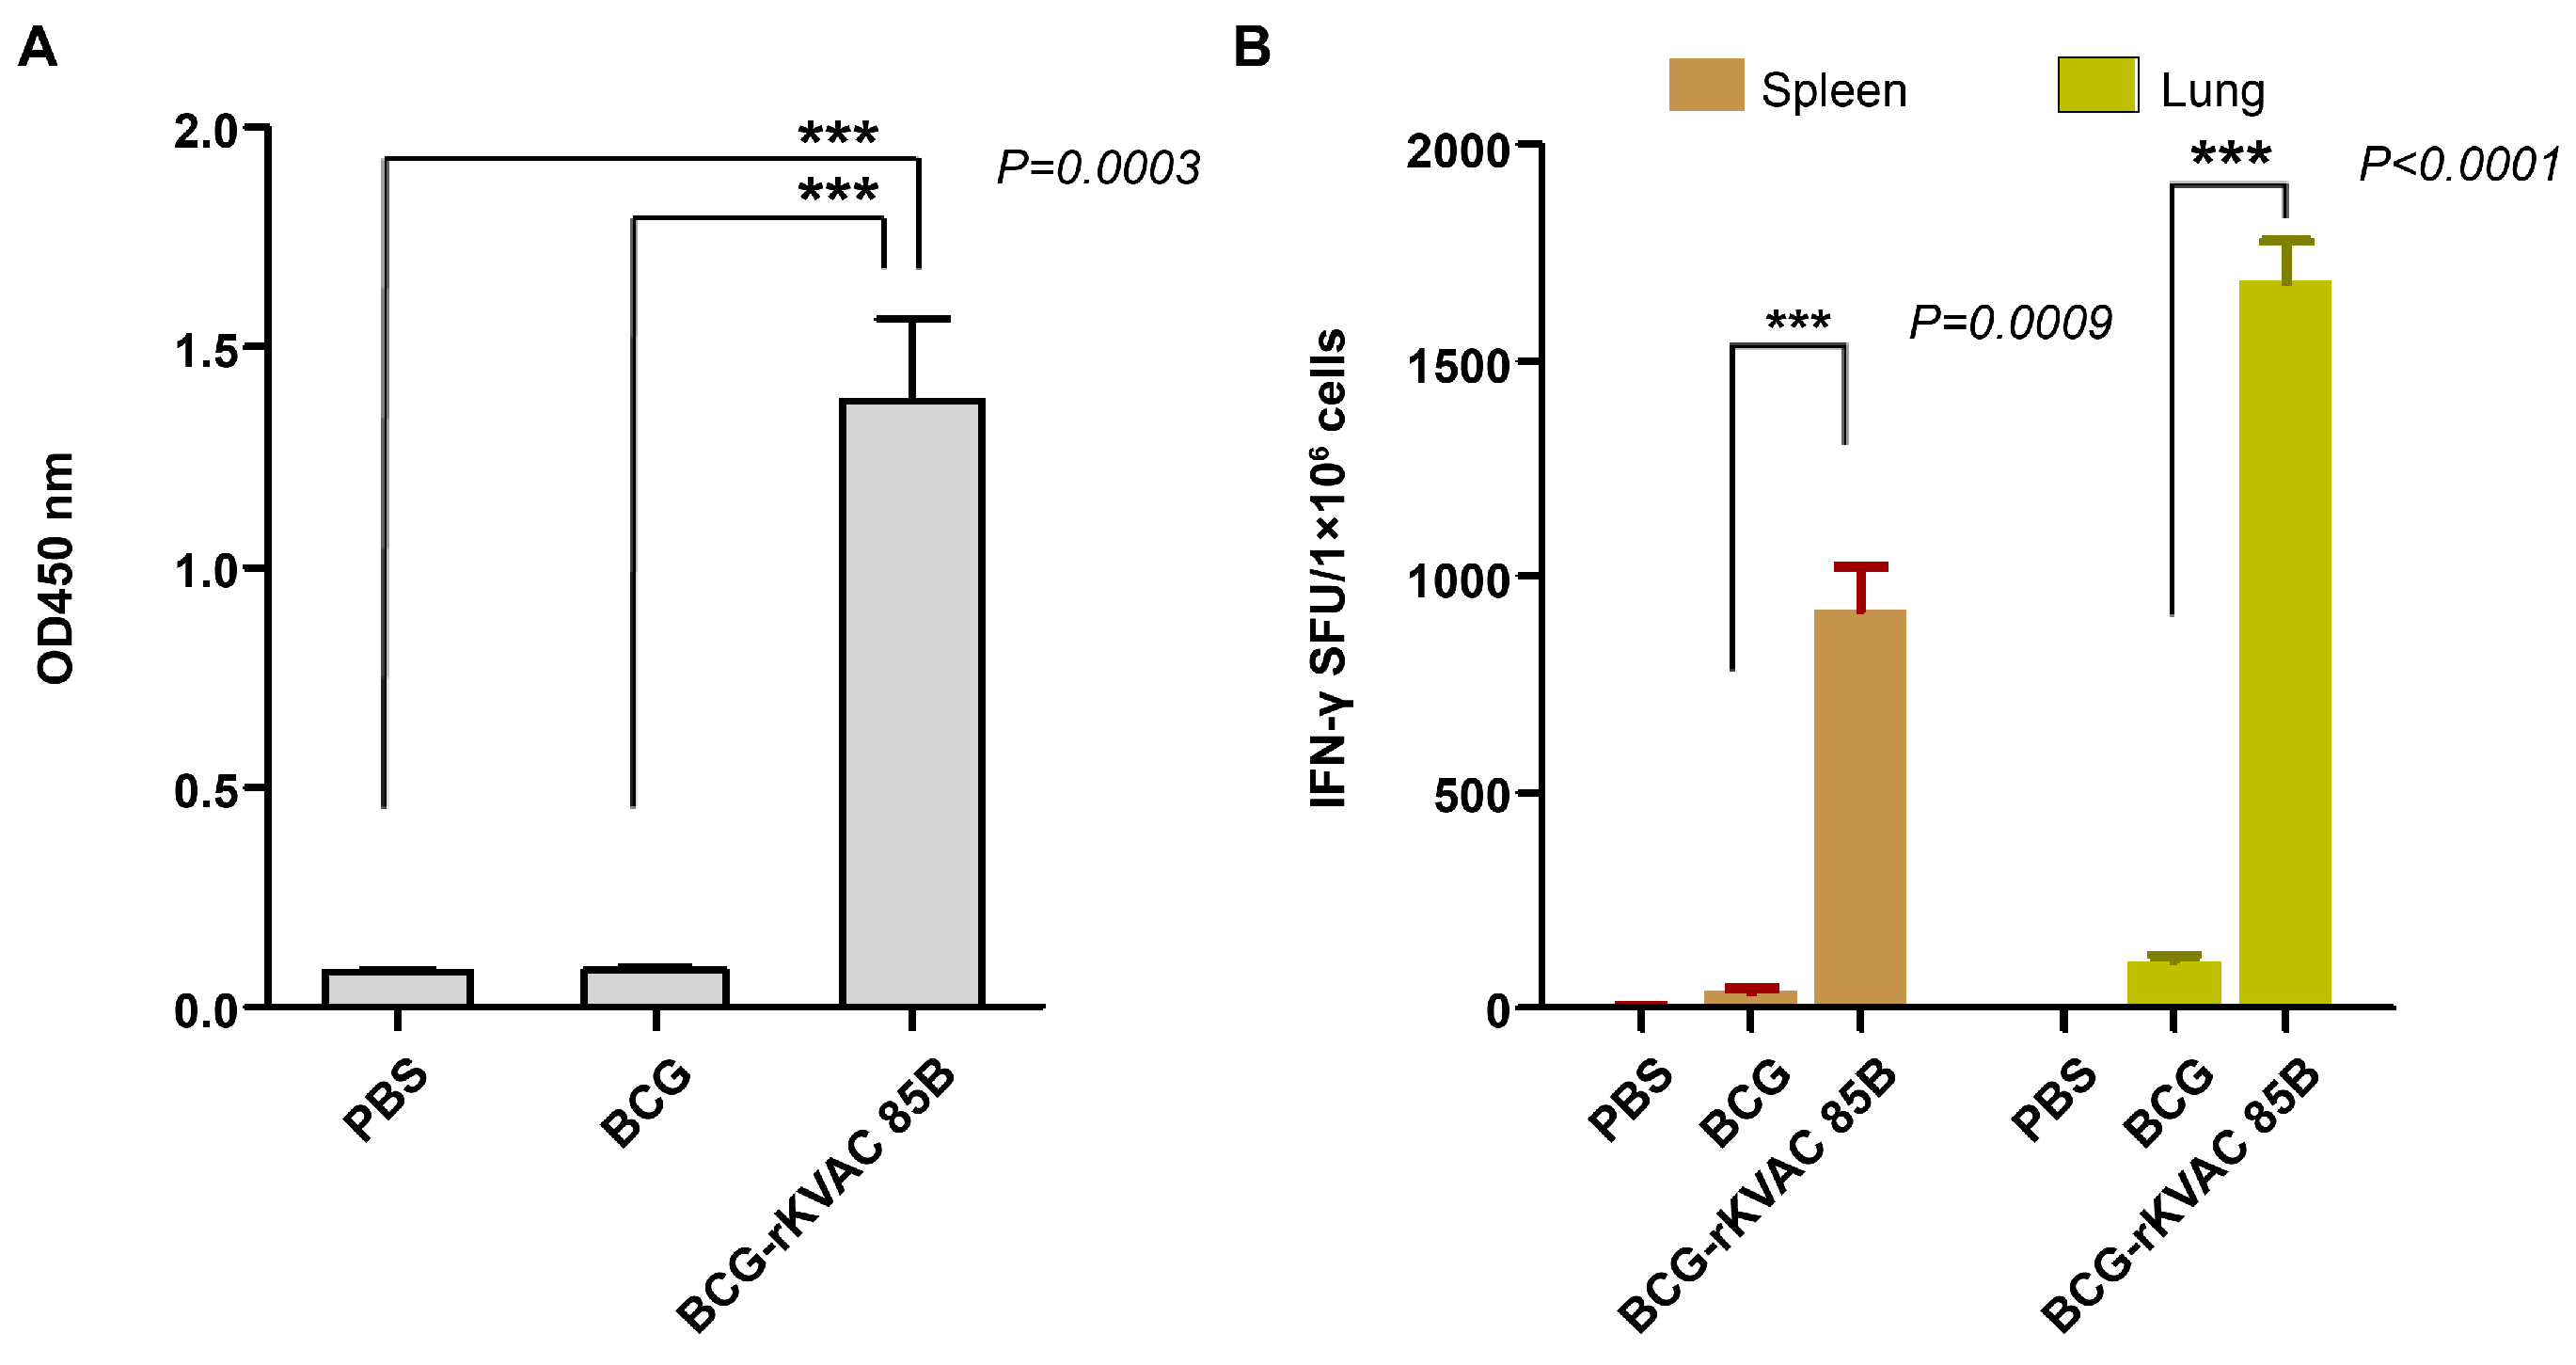
This study, we evaluated the immune responses elicited by two vaccination strategies in a murine model: rKVAC85B prime-boost and BCG prime-rKVAC85B boost. Administration of the rKVAC85B vaccine in both vaccination models led to a significantly increased antigen-specific IgG and IFN-γ, a cytokine essential for controlling infections caused by intracellular pathogens. The increase in IFN-γ levels following rKVAC85B vaccination highlights the vaccine’s potential to elicit a strong immune defense against intracellular infections. Our study compared two immunization strategies: rKVAC85B-prime-boost and BCG prime-rKVAC85B boost. Both strategies effectively induced IFN-γ production in response to specific antigens. However, a notable difference was observed in the magnitude of the response. The BCG-prime rKVAC85B boost strategy elicited a response that was 30-fold stronger than that achieved with BCG alone, as shown in
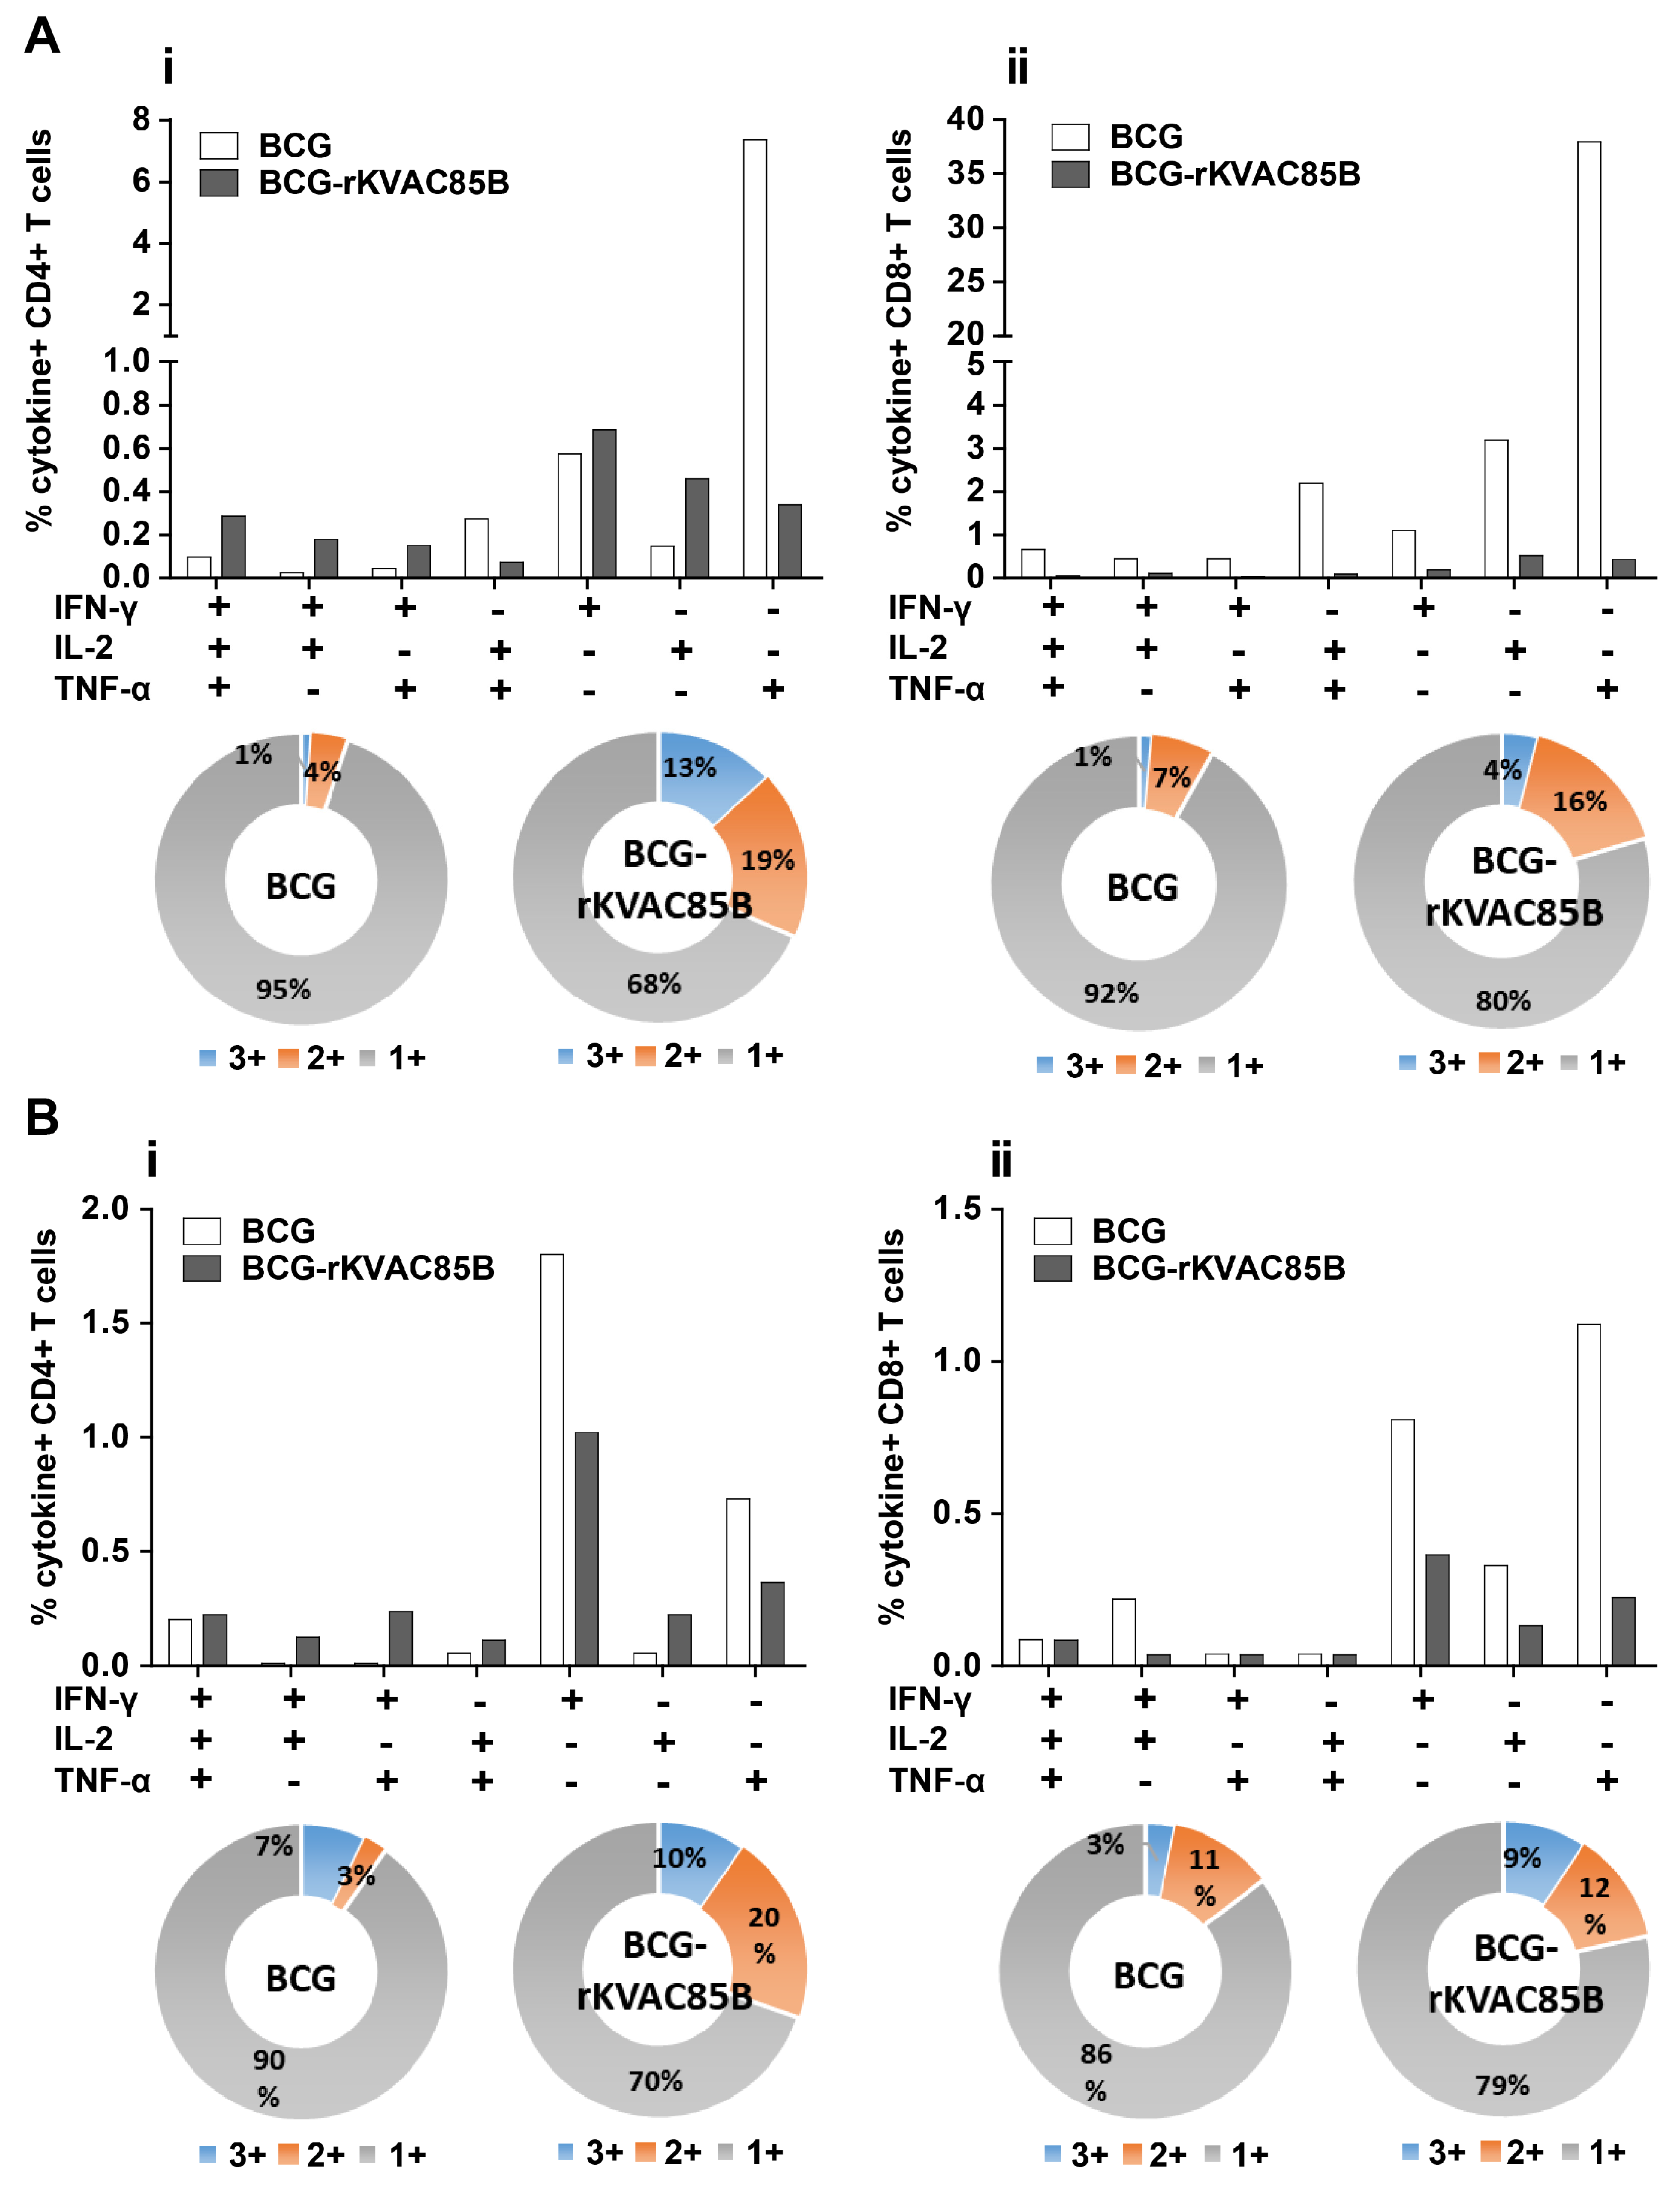
Figure 3B. This significant enhancement in IFN-γ response with BCG prime-rKVAC85B boost underscores its superior efficacy in inducing robust and potent immune responses. Additionally, in the BCG prime-rKVAC85B boost group, there was a notable increase in the production of polyfunctional T cells. These T-cells secreted cytokines critical for Th1 immunity, specifically IL-2, IFN-γ, and TNF-α. In both vaccination models, a marked increase in the levels of IFN-γ-secreting T-cells was observed. Additionally, the BCG prime-rKVAC85B boost strategy was particularly effective in inducing potent CD4+ and CD8+ multifunctional T cell responses in the lungs, capable of secreting two or three cytokines (
Figure 5). This finding is consistent with previous studies highlighting the efficacy of viral vector-assisted immunization following BCG priming in enhancing cellular immunity [
9,
10,
11,
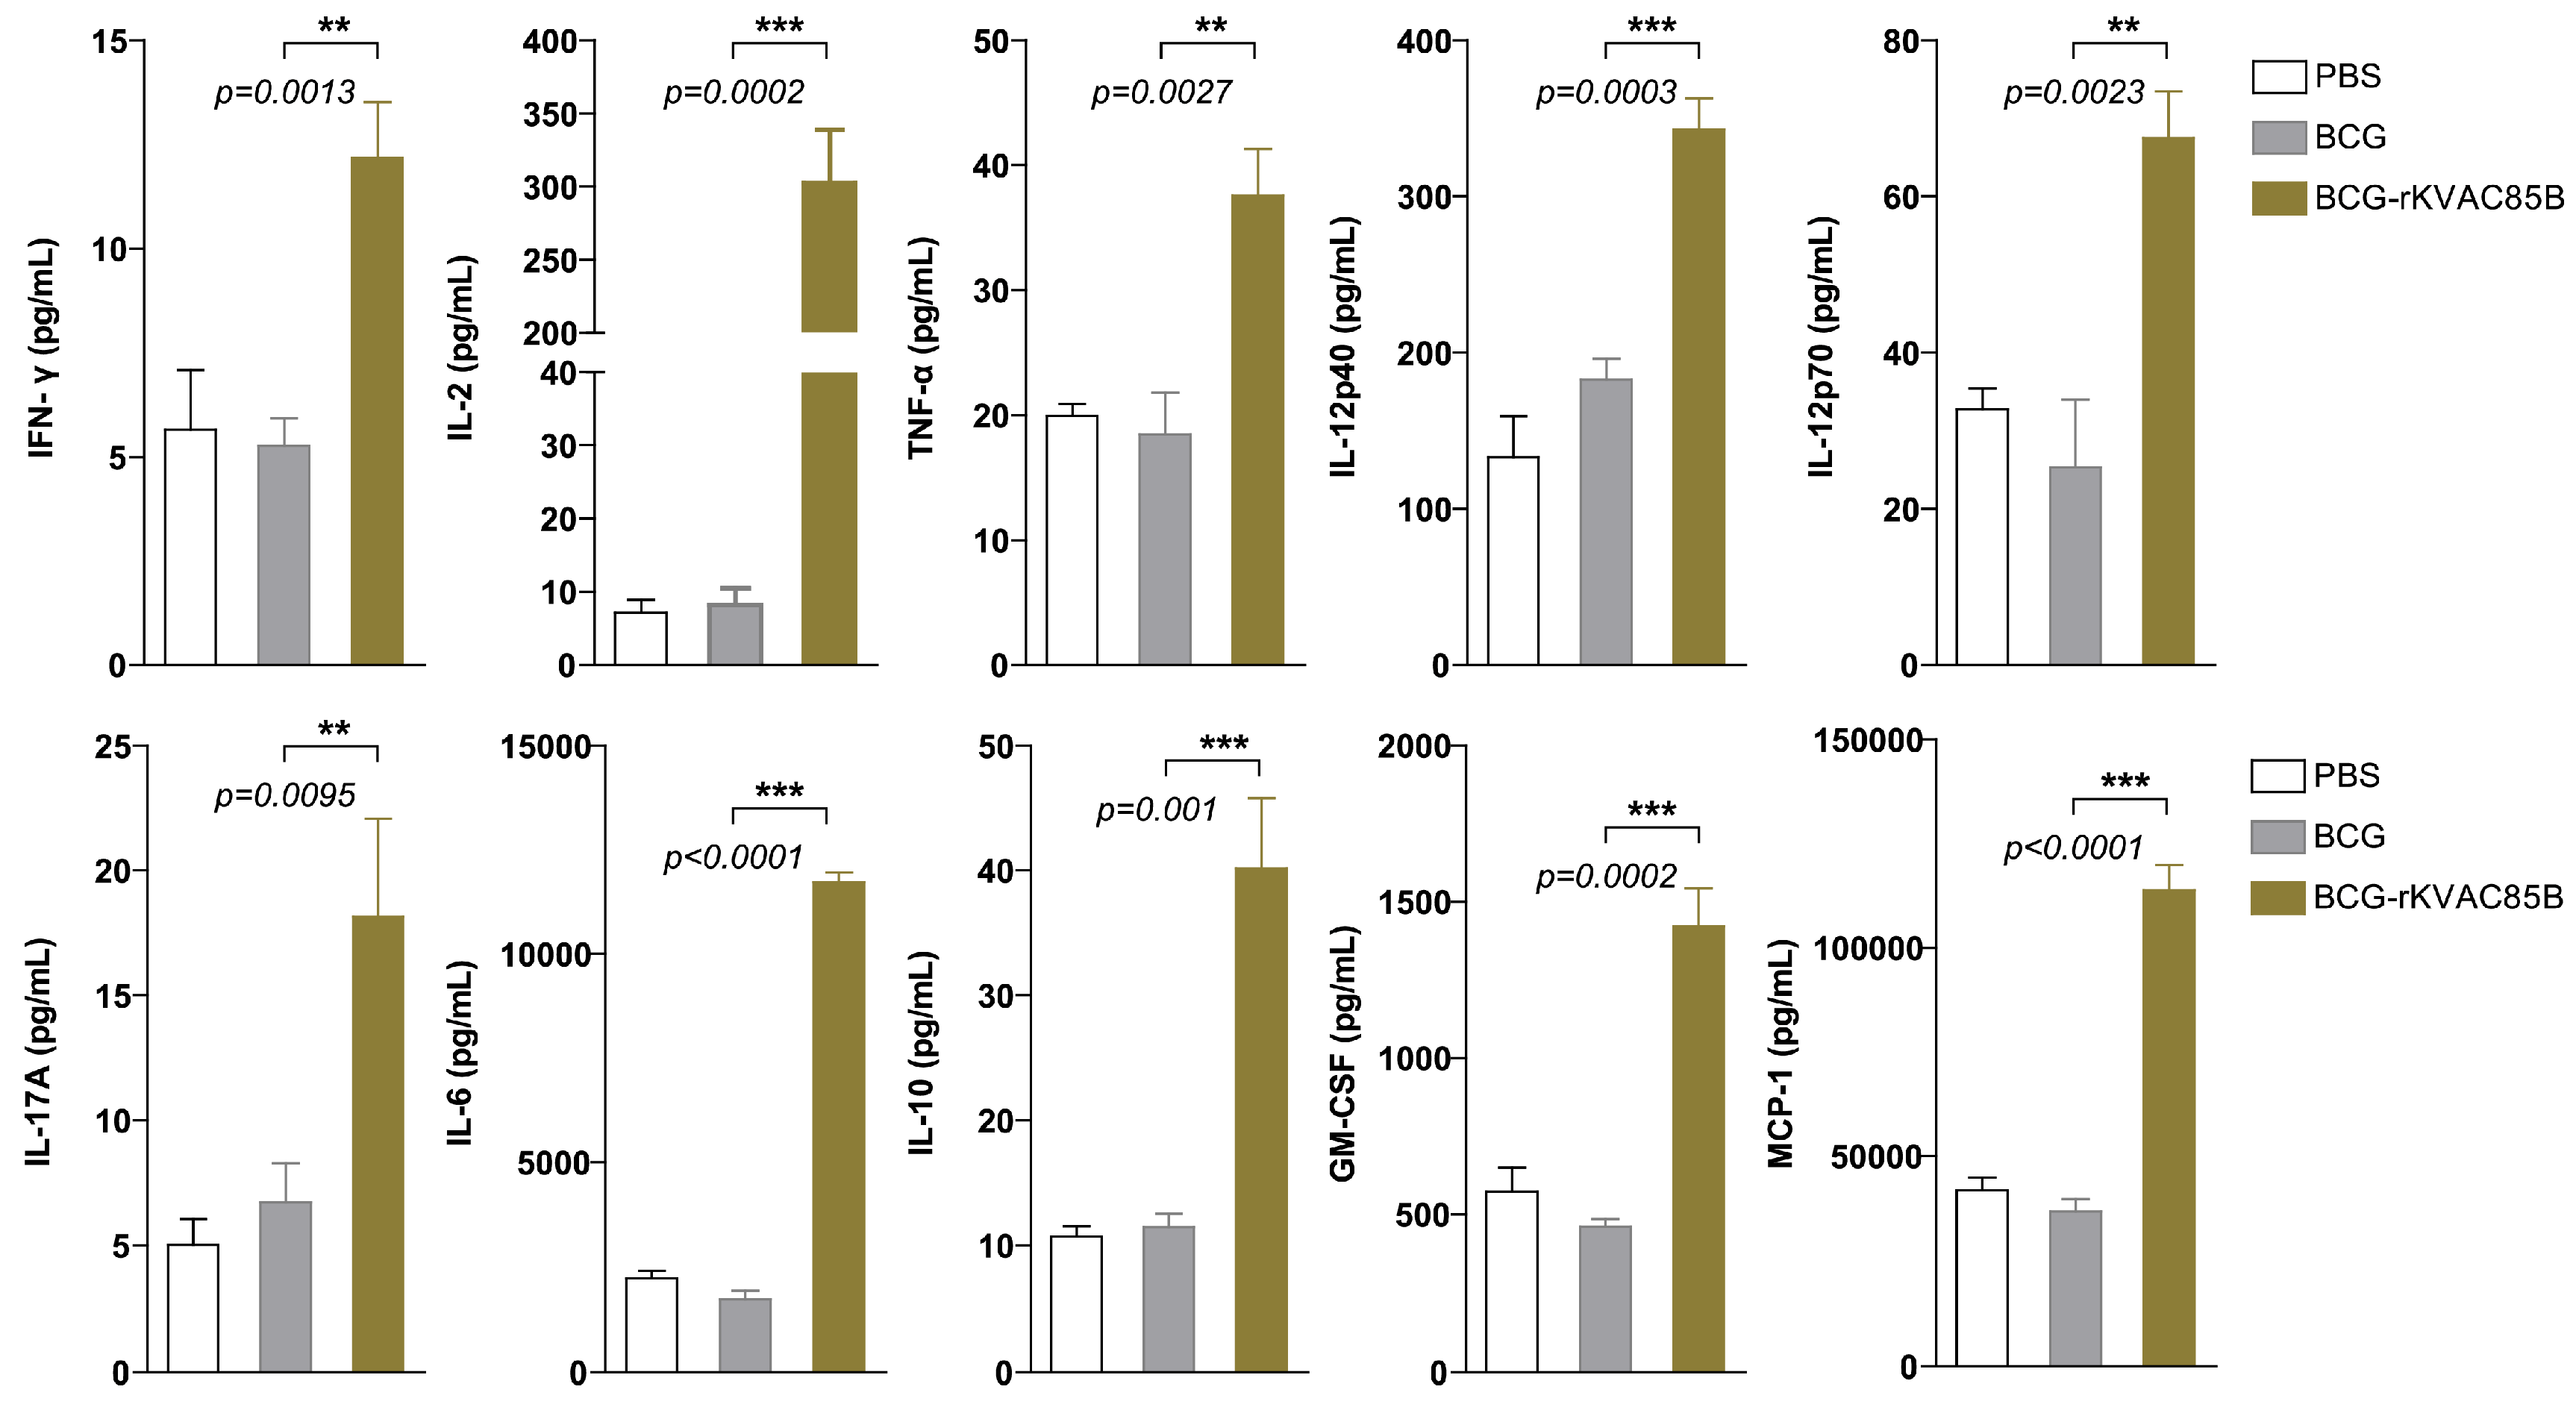
12]. Furthermore, our analysis revealed a substantial enhancement in the levels of cytokines related to Th1 and Th17 responses (IFN-γ, TNF-α, and IL-17) in the lungs (
Figure 5). Although IL-2 is generally associated with Th1 and Th2 immune responses, the presence of IL-2 alone in our study did not provide sufficient evidence of a significant Th2 response. Instead, the observed cytokine profile and T cell responses suggested that the rKVAC85B vaccine, especially in conjunction with BCG priming, primarily drives Th1 and Th17 immune responses. This comprehensive activation of the immune system underscores the potential of rKVAC85B as an effective component of tuberculosis vaccines, leveraging its ability to induce a broad and potent immune response.
Recent studies have underscored the pivotal role of IL-17 in the immune response to
M. tuberculosis. This cytokine is particularly crucial in certain models of intracellular infection, where it aids in inducing the Th1 response by promoting IL-12 production. In TB, IL-17 mediates the protective effects of vaccines against
M. tuberculosis. These findings suggest that the IL-17 pathway plays a significant role in the primary immune response following
M. tuberculosis infection [
29,
30]. Choi et al. demonstrated the effectiveness of the HSP90-E6/CIA05 vaccine in enhancing BCG-induced immunity against a hypervirulent
M. tuberculosis HN878 strain in mice. This effect is primarily attributed to the expansion of IFN-γ/IL-17-producing lung cells. While IFN-γ-producing T-cells are necessary for tuberculosis defense, they are insufficient on their own. Instead, the presence of cells producing both IFN-γ and IL-17 is crucial for effective protection [
29]. These findings shed light on the essential role of IL-17 in TB immunity and offer new avenues for improving BCG-boosted vaccines.
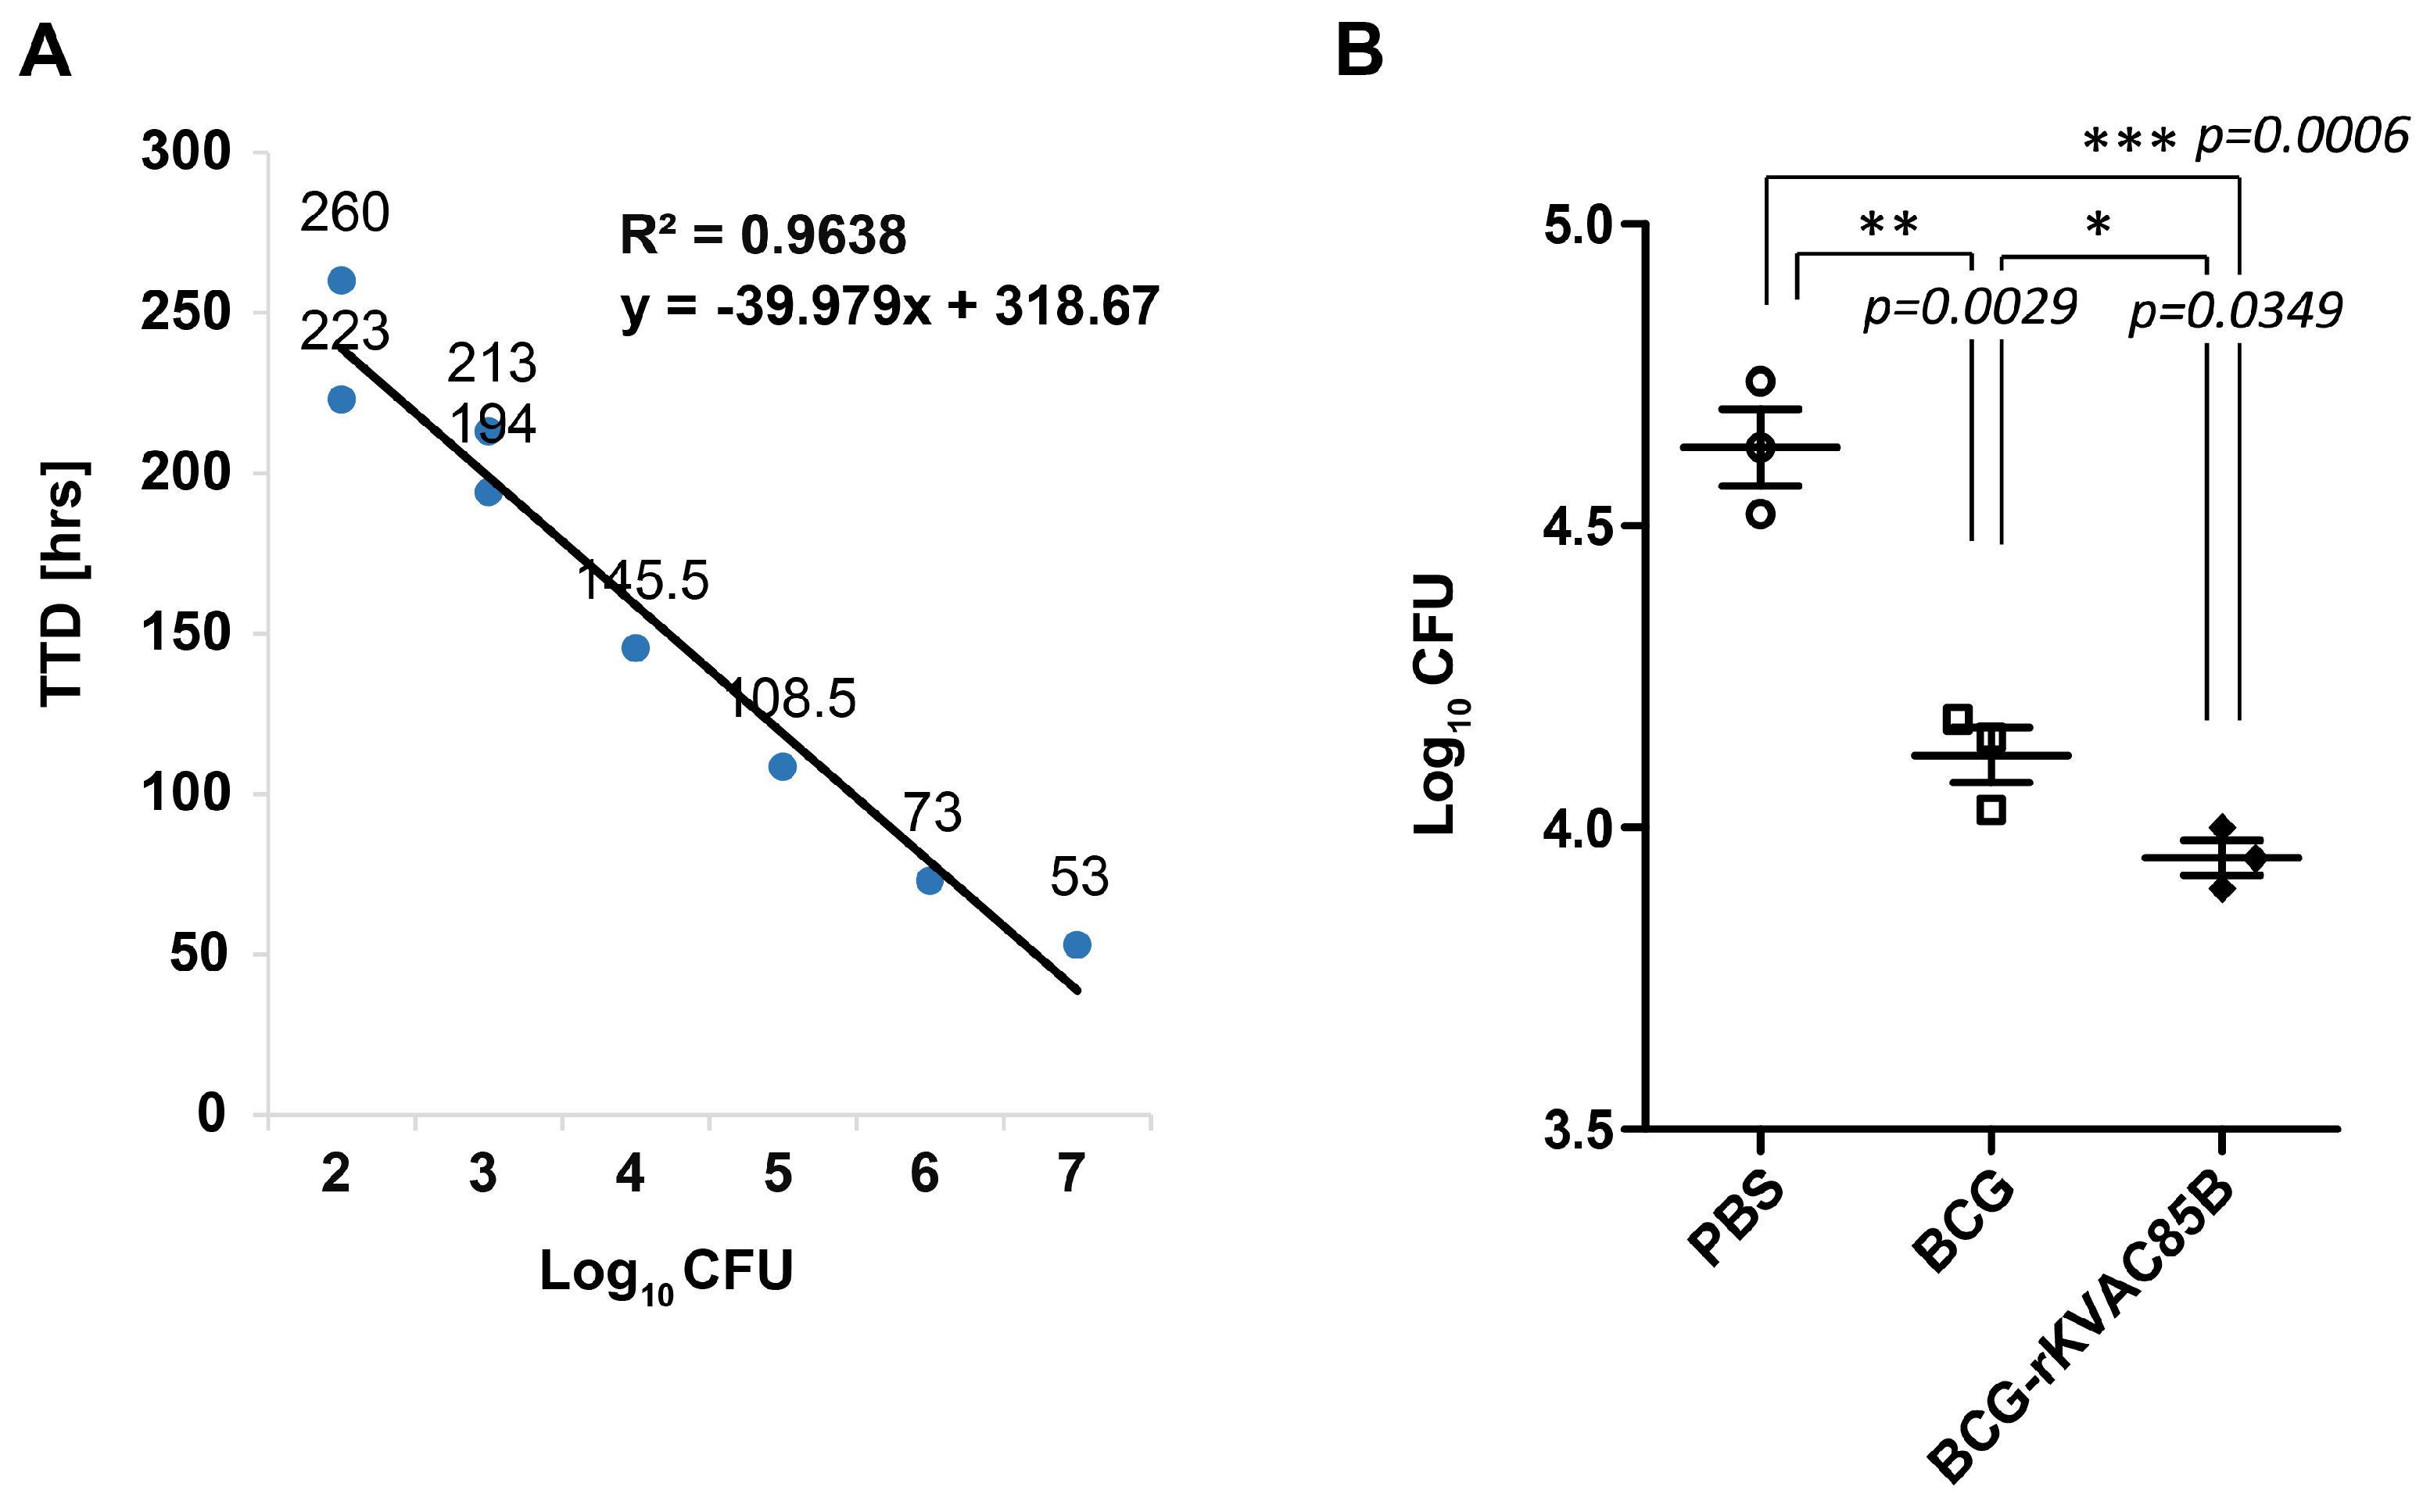
In the current study, we assessed the in vitro growth inhibition ability of BCG and a BCG prime-rKVAC85B boost using MGIAs. Immunized splenocytes from the BCG prime-rKVAC85B boost group demonstrated a significantly reduced CFUs compared to those from the BCG-only group (
Figure 6B). This observation is consistent with the protective efficacy observed in the BCG prime-rKVAC85B boost group.
MGIAs, regarded as surrogate markers for protection, have been developed to establish in vitro functional assays that correlate with protection. In this context, splenocytes immunized with BCG were subjected to MGIA, and the isolated RNA was subsequently analyzed via microarray analysis. Notably, the gene expressions associated with Th1 responses, including IFN-γ and IL-17, exhibited enhancement [
30]. Furthermore, many reports have highlighted the advantages of this analytical method in the context of vaccine testing, allowing longitudinal monitoring of immunological development in the same animal subjects [
31,
32].
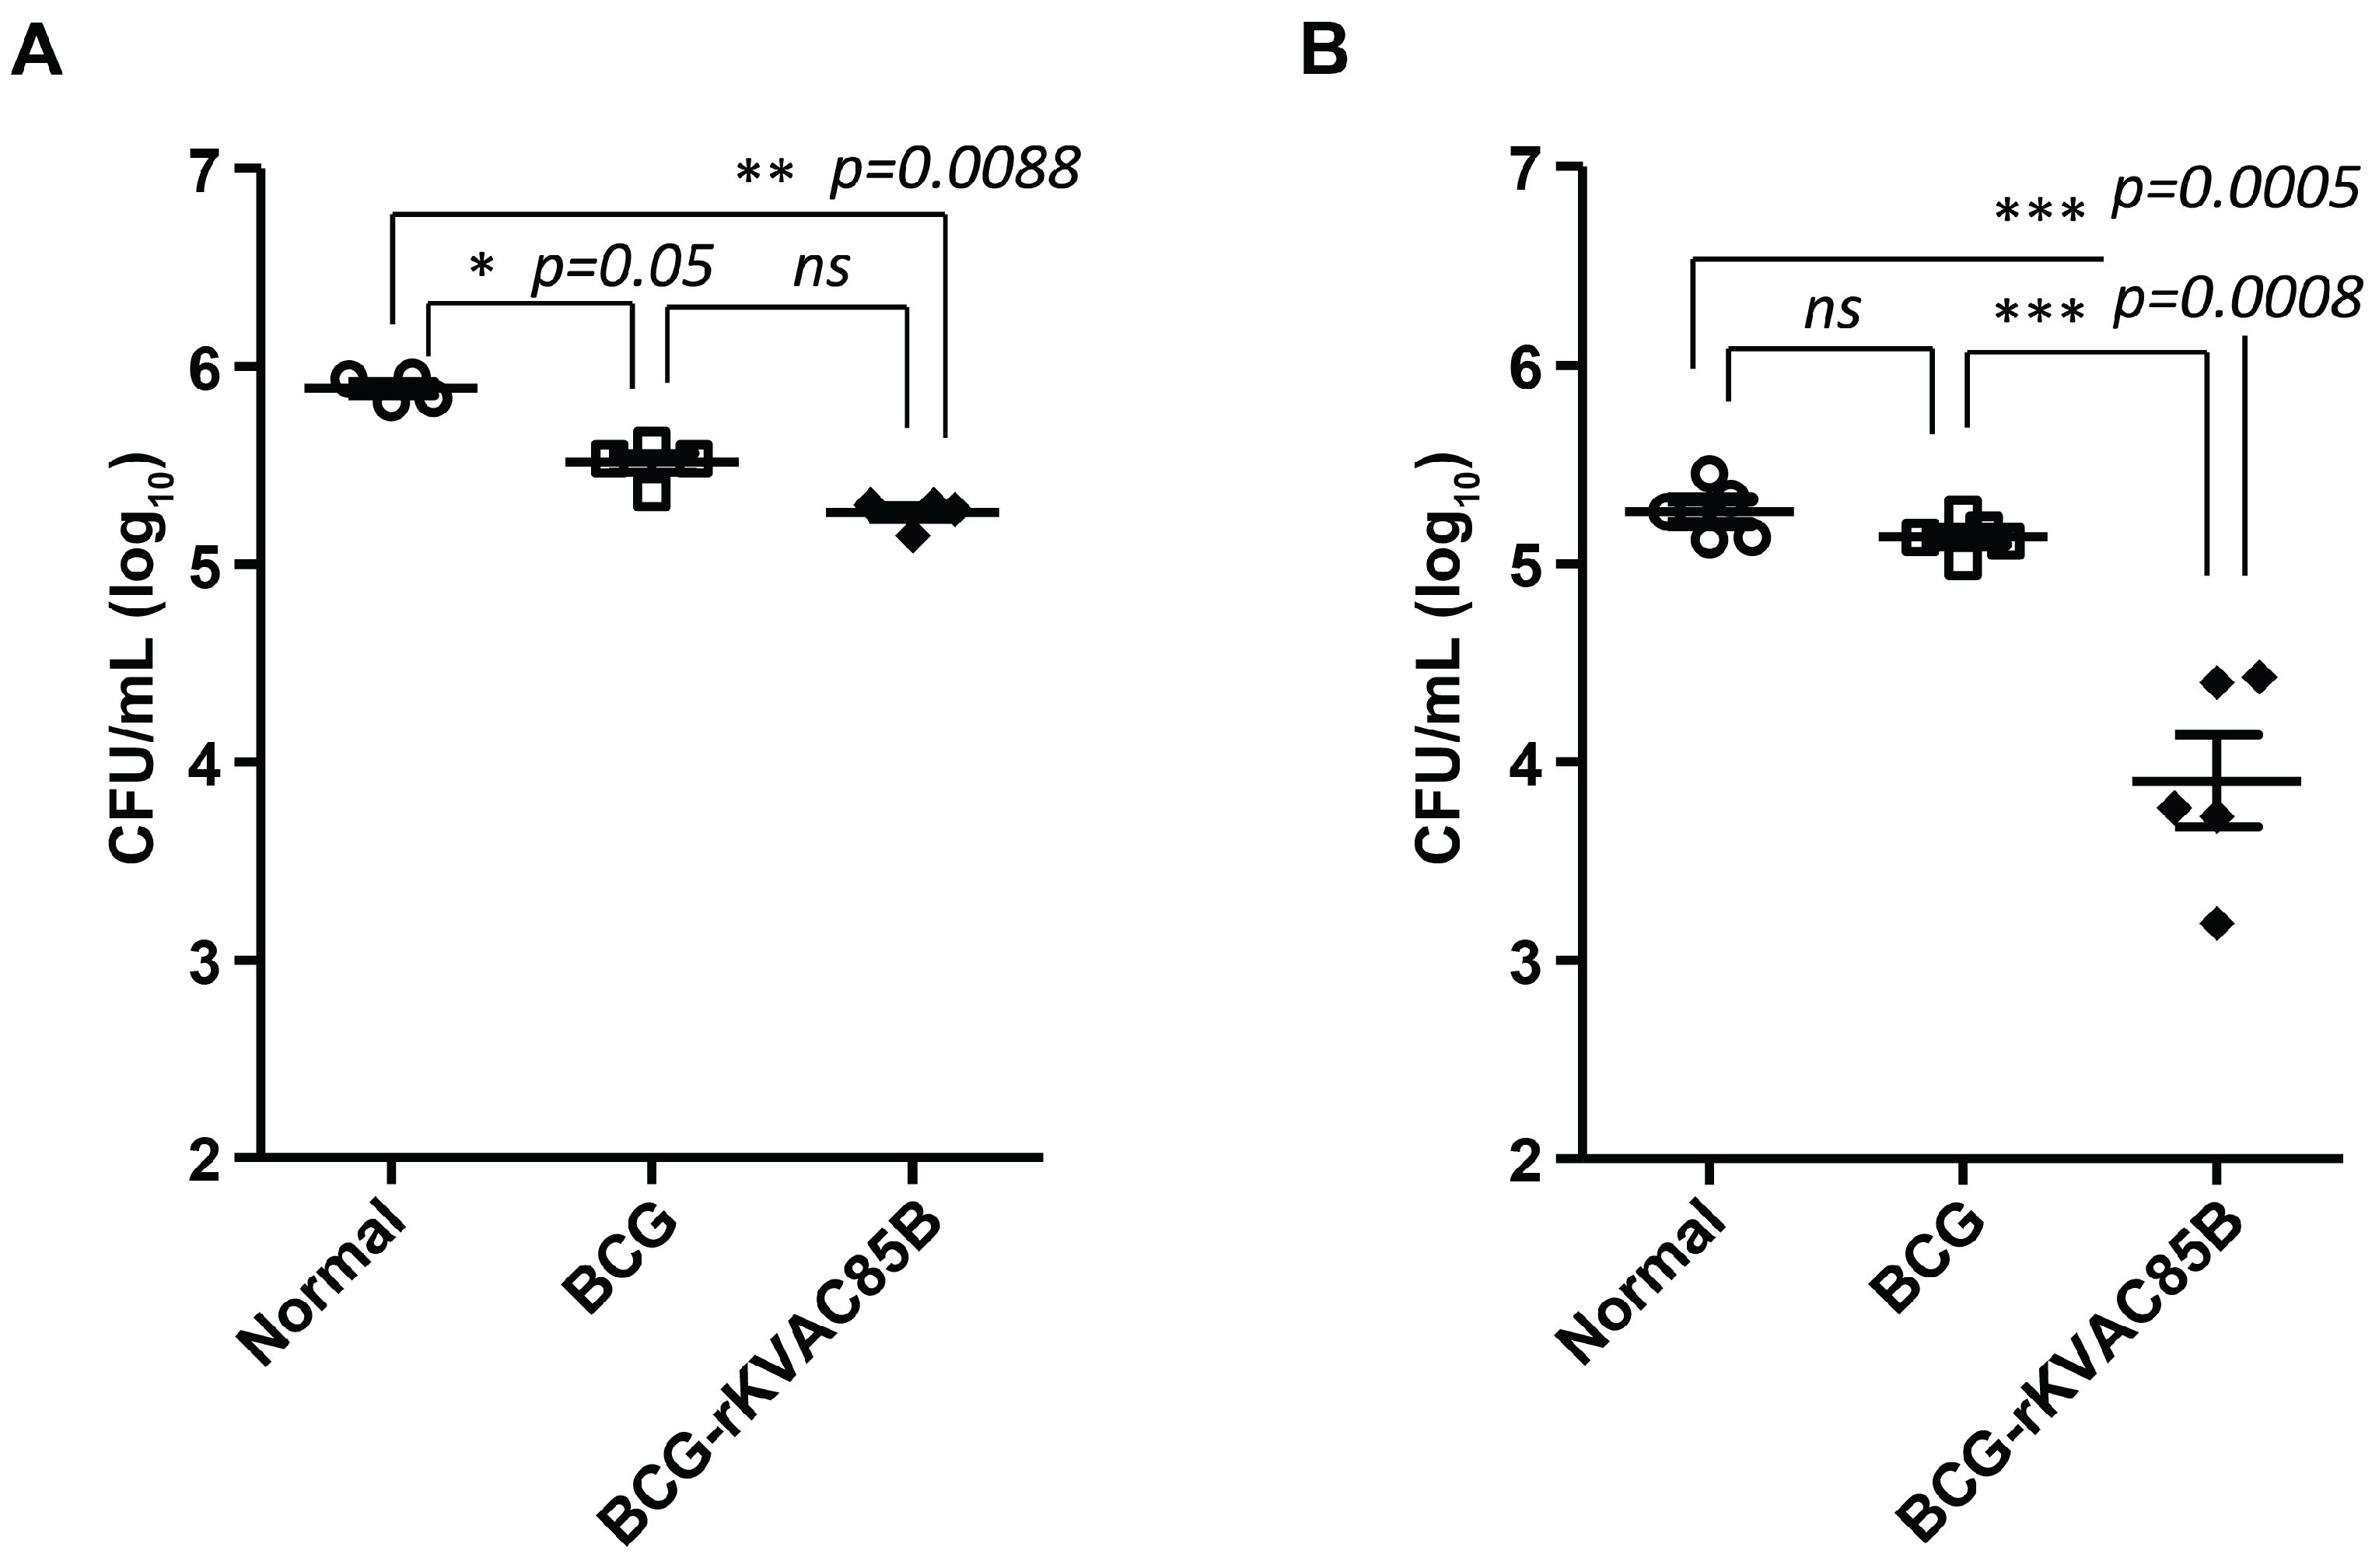
To assess the protective effect of rKVAC85B against bacterial infection, immunized mice were exposed to both H37Rv and hypervirulent HN878 strains, and the bacterial load in the lungs was subsequently measured. In our study, immunization with rKVAC85B alone resulted in some reduction in the bacterial burden in H37Rv infection via aerosols; this decrease was not significantly greater than that in the BCG-immunized group (data not shown). However, notably, the BCG prime-rKVAC85B boost markedly inhibited the growth of the hypervirulent HN878 strain more effectively than the laboratory strain H37Rv (
Figure 7). This suggests that rKVAC85B can potentially enhance the vaccine efficacy of BCG, particularly against the more virulent
M. tuberculosis strains. The W-Beijing family of
M. tuberculosis, the predominant genetic lineage of
M. tuberculosis strains, is widespread globally and especially prevalent in East Asia [
33]. Epidemiological studies have revealed that W-Beijing strains are isolated more frequently from BCG-vaccinated TB patients than from non-vaccinated patients, suggesting a selective advantage of this genotype in the context of BCG vaccination [
21]. Additionally, the BCG vaccination in mice offers less protection against isolates from the W-Beijing family than the standard laboratory
M. tuberculosis H37Rv strain [
34,
35]. Notably, clinical isolate HN878, a hypervirulent strain associated with increased mortality rates, exemplifies the challenges posed by virulent strains [
36,
37]. These observations emphasize the critical need for vaccine development strategies effect against the most prevalent and virulent
M. tuberculosis genotypes, such as the W-Beijing family.
According to the Global TB Report 2021, TB cases in individuals older than 15 years accounted for 89% of the total TB cases reported in 2020 [
1], which poses the demand for a novel TB vaccine acting as a BCG booster in adults. In the present study, we used KVAC103, a new attenuated vaccinia virus vector, to develop a novel TB vaccine candidate. Using KVAC103 to express Ag85B represents a promising development in the field of TB vaccine research, particularly in adult populations. rKVAC85B, formulated using this innovative vector, has shown encouraging results by eliciting enhanced immune responses and notable protective effects in a BCG prime-boost regimen. Although these initial findings are promising, they suggest the potential of KVAC103 as an effective BCG booster and a possible frontrunner in the search for advanced TB vaccine solutions. This approach underscores the importance of exploring new avenues of virology for TB vaccine development, with KVAC103 showing considerable promise.
Figure 1.
Construction and expression of rKVAC85B in Vero cells. (A) Schematic structure illustrating the generation of recombinant KVAC virus expressing the M. tuberculosis Ag85B protein. To create rKVACAg85B, a codon-optimized Rv1886c was inserted into the KVAC genome, containing TK-L and TK-R regions, through homologous recombination. TK: thymidine kinase. (B) Confirmation of Ag85B protein expression was conducted through western blot analysis using a rabbit polyclonal antibody against Ag85B. Purchased Ag85B protein served as a positive control, while the lysate obtained from the rKVAC-GFP infected group served as a negative control. M: protein marker; Line 1: positive control (purified Ag85B protein), Line 2: Negative control (Vero cell lysate), Line 3: rKVAC85B (Vero cell-infected lysate). (C) Comparative growth analysis was performed for the rKVAC85B and rKVAC-GFP groups. The growth titration of these two viruses was assessed in Vero cells at a multiplicity of infection (MOI) of 0.1, and the supernatants from cultured viruses were collected and harvested at 24-hour intervals. Virus titrations were determined using a plaque assay.
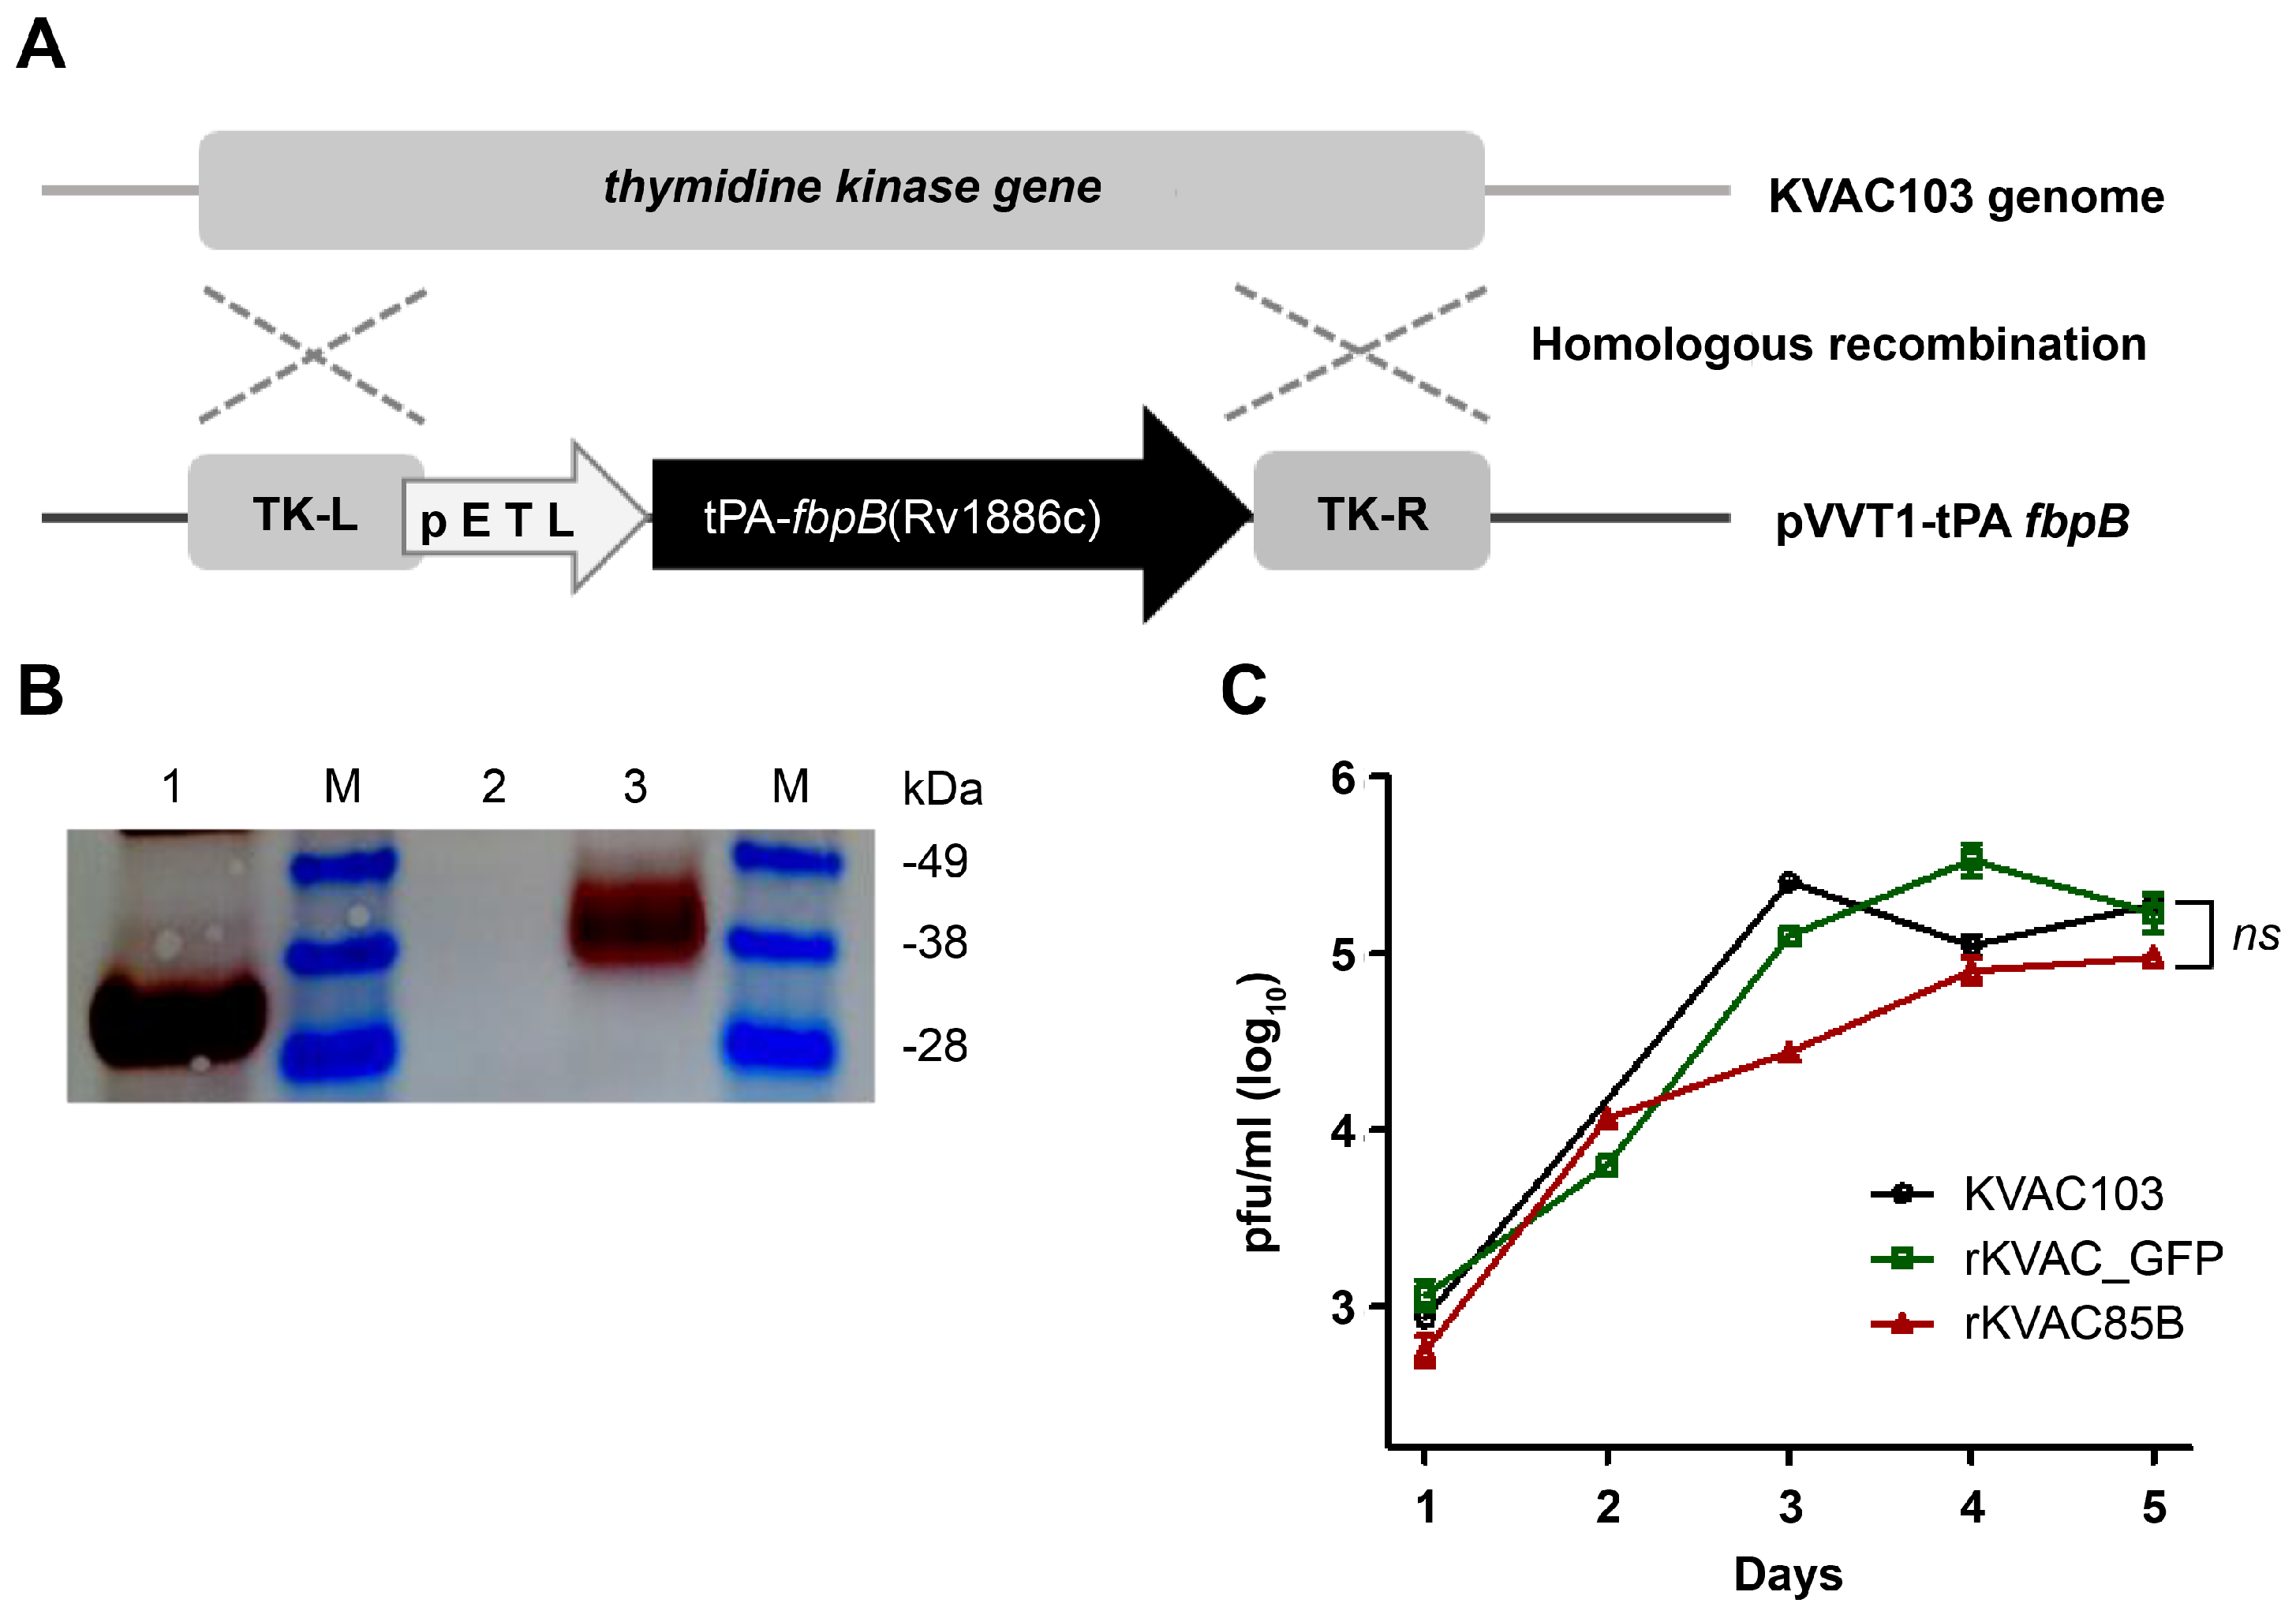
Figure 2.
Immune responses of rKVAC85B prime-boost-immunized mice. (A) IgG Antibody Response to M. tuberculosis Antigen Ag85B. Serum levels of antigen-specific IgG were quantified using ELISA, with microtiter plates coated with recombinant Ag85B protein to assess humoral immunity post-vaccination. (B) Frequency of IFN-γ-secreting T-cells in the lungs and spleens as measured via ELISPOT. Lymphocytes isolated from the lungs and spleens of vaccinated mice were stimulated ex vivo with M. tuberculosis Ag85B antigen. Spot-forming units (SFUs) per 1 × 10⁶ cells were enumerated to determine the Ag-specific T-cell responses. (C) Polyfunctionality of CD4+ T-cells. The chart represents the percentage of CD4+ T-cells secreting different combinations of IFN-γ, TNF-α, and IL-2 upon stimulation with Ag85B protein. Pie charts illustrate the distribution of T-cells based on cytokine secretion profiles: single (gray), double (orange), and triple (blue) cytokine producers. (D) Polyfunctionality of CD8+ T-cells. Similar to panel (C), this chart depicts the percentage of CD8+ T-cells secreting cytokines IFN-γ, TNF-α, and IL-2, with accompanying pie charts showing the proportions of mono-, bi-, and tri-cytokine-secreting cells.
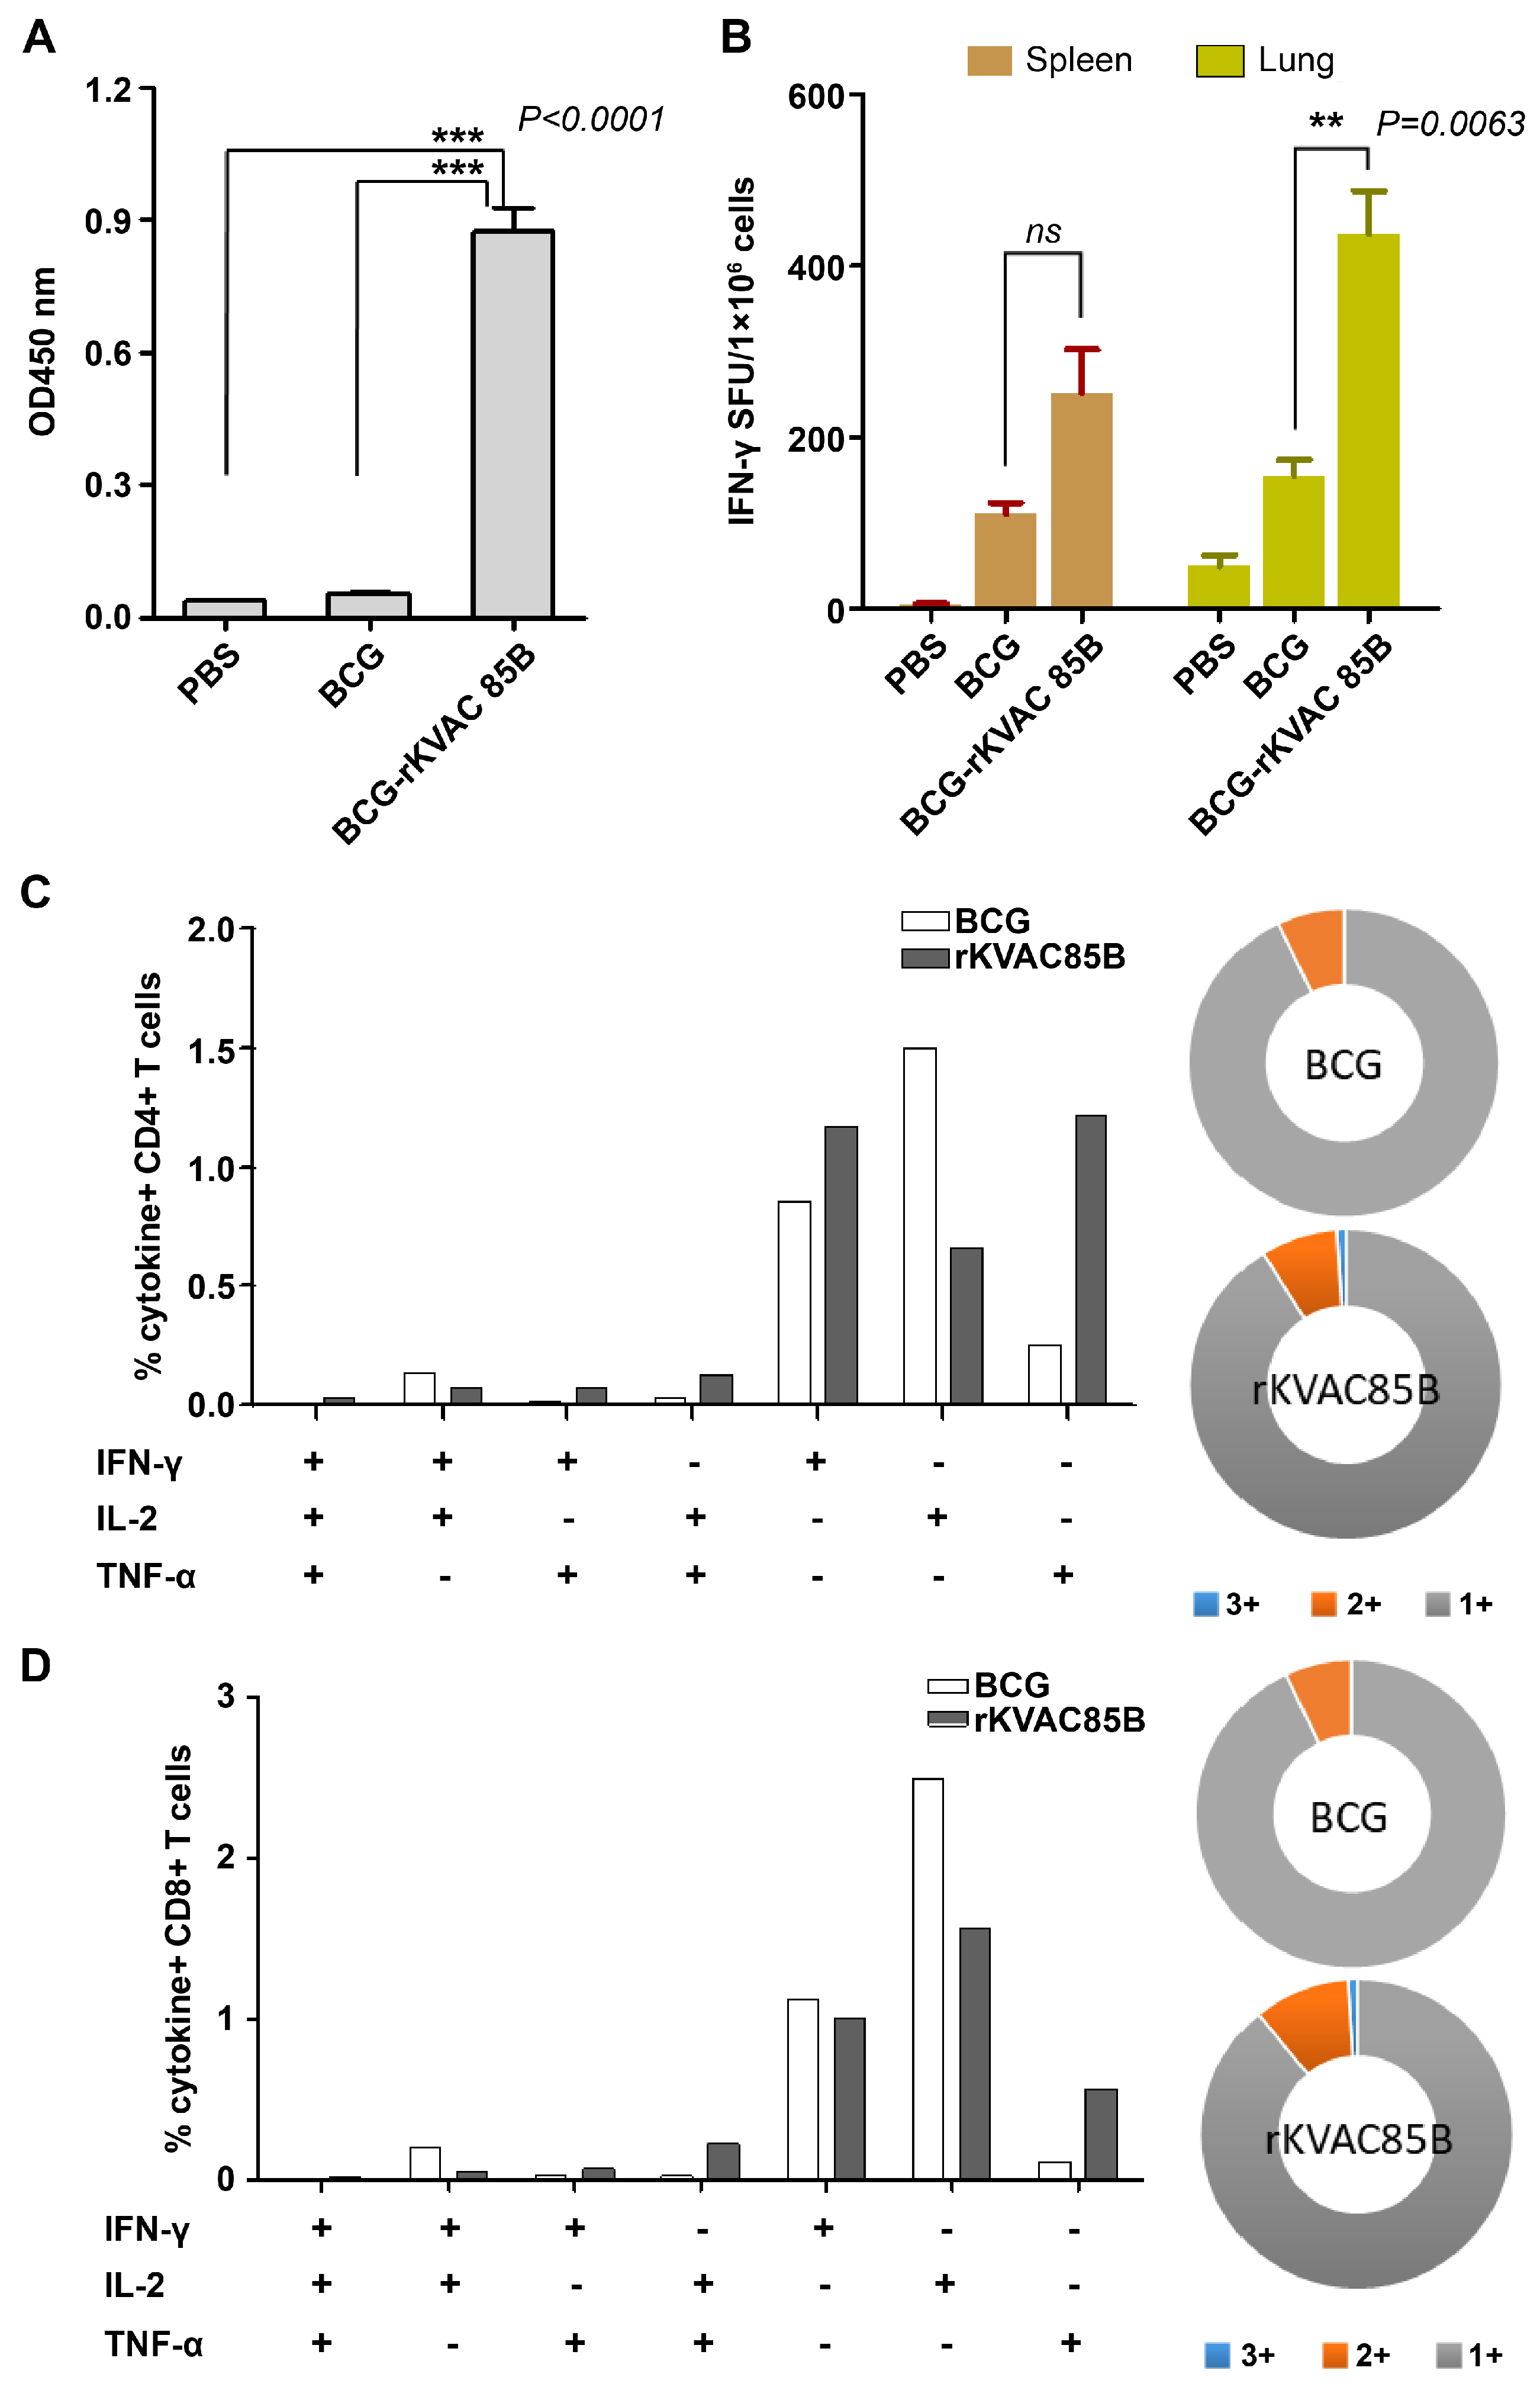
Figure 3.
Assessment of IgG titers and IFN-γ ELISPOT responses via BCG-prime rKVAC85B-boost immunization in mice. (A) Determination of Ag85B-specific IgG Titers. Sera from the immunized mice were diluted at a 1:200 ratio and applied to ELISA plates coated with the Ag85B antigen to measure specific IgG titers. The optical density was recorded at 450 nm (OD_450 nm). (B) IFN-γ ELISPOT assay to identify activated T-cells. The ELISPOT method was used to quantify IFN-γ-secreting T-cells in the spleen and lung tissues. Cells were stimulated with Ag85B peptides for 36 hours, and the frequency of IFN-γ-producing cells was measured. Notably, the lung tissue from the rKVAC85B-boosted mice showed a significant elevation in IFN-γ-secreting cells (***p < 0.0001) compared to the spleen, which displayed a less marked increase (***p = 0.0009).
Figure 4.
Polyfunctional T-cell responses via BCG-prime-rKVAC85B-boost immunization in mice. Polyfunctional T-cell profiling was conducted to assess the capacity of CD4+ and CD8+ T-cells to secrete the cytokines IFN-γ, TNF-α, and IL-2 following antigenic stimulation. (A) Frequency of polyfunctional CD4+ (i) and CD8+ T-cells (ii) in the spleen. Data are presented as the percentage of cells secreting any combination of the three cytokines, with pie charts reflecting the cell proportion secreting mono-, bi-, or tri-cytokines. (B) Frequency of polyfunctional CD4+ T-cells (i) and CD8+ T-cells (ii) in the lungs. Pie charts show the distribution of T-cells based on their cytokine secretion profiles, categorized by their ability to secrete mono-, bi-, or tri-cytokines.
Figure 5.
Augmented pulmonary cytokine response following BCG-prime-rKVAC85B-boost. Cytokine responses in the pulmonary compartment were quantified following a prime-boost vaccination regimen using bead-based ELISA. Lung cells were harvested and stimulated with antigen Ag85B peptides for 36 h to assess post-vaccination cytokine levels. This comparative analysis delineated cytokine induction across three groups: PBS control, BCG priming alone, and BCG priming followed by rKVAC85B booster. The cytokines measured include IFN-γ, IL-2, TNF-α, IL-12p40, IL-12p70, IL-17A, IL-6, IL-10, GM-CSF, and MCP-1. Results are expressed as the mean ± standard deviation (SD), and levels of statistical significance are marked by asterisks: **p < 0.01, ***p < 0.001, indicating a statistically significant increase in cytokine levels in the BCG and rKVAC85B co-immunized group.
Figure 6.
In vitro growth inhibition of M. bovis BCG with splenocytes isolated from BCG-prime-rKVAC85B-boost immunized mice. (A) MGIA test standard curve, depicting the relationship between the logarithm of colony-forming units (Log_10 CFUs) and time to detection (TTD) in days. The standard curve demonstrates a high coefficient of determination (R2 = 0.9638), indicating a strong inverse correlation between Log_10 CFUs and TTD, as described by the linear regression equation y = −39.979x + 318.67. (B) At one week after final immunization, 1 × 10⁶ splenocytes from immunized mice groups were co-cultured with 50 CFUs of M. bovis BCG. Splenocytes were obtained from six control animals in each group, represented by an individual data point. The p-values of the differences were determined via one-way ANOVA with Tukey’s multiple comparison tests.
Figure 7.
Comparative efficacy of BCG-prime-rKVAC85B-boost immunization against M. tuberculosis H37Rv and HN878. Bacterial-load quantification in the lungs of mice, following an immunization schedule of BCG priming and subsequent rKVAC85B boosts, was performed to determine the immunoprotective effects against two distinct strains of M. tuberculosis. (A) H37Rv strain challenge: Mice were challenged with M. tuberculosis H37Rv three weeks after the last immunization dose. Eight weeks post-infection, CFUs in the lung tissue were enumerated to quantify the bacterial burden and infer the level of protection conferred by immunization. (B) HN878 strain challenge: In an experimental setup similar to that in (A), mice were challenged with the HN878 strain. Lung CFUs were counted after eight weeks to determine the strain-specific protective efficacy of the vaccine regimen. Statistical analyses for both (A) and (B) were performed using one-way ANOVA.


