1. Introduction
Use of additive manufacturing (AM) in aerospace component manufacturing and repair is on the rise due to its material and cost-saving capabilities, without compromising the mechanical properties of the components. According to the European patent office publication [
1], aerospace is the largest field among the transportation industry that uses AM to manufacture lightweight components, thereby aiding in the reduction of weight, fuel consumption, and emissions. In this regard, titanium (Ti) alloys are often selected as candidate materials in such applications due to their high specific strength and good corrosion resistance at elevated temperatures [
2,
3].
When considering Ti alloy use in aerospace industry, they are often utilized in constructing airframe parts, and gas turbine engines parts [
2,
3,
4,
5]. In order to meet the present day demand for improved mechanical properties and also to manufacture low cost Ti alloys, various Ti metal matrix composites (MMC) with particle reinforcements of borides, carbides, nitrides, and graphene were studied [
6,
7,
8]. In this regard, it was reported in [
9,
10,
11] that Ti MMCs with TiB show great promise as TiB exhibits high elastic modulus and thermal stability.
One of the disadvantages of considering AM over conventional manufacturing processes is that the materials manufactured through AM techniques often show anisotropic properties with respect to the AM build directions due to their layer-by-layer material build technique and the microstructure and defects associated with it [
12,
13,
14]. In this context, often Ti-6Al-4V alloys manufactured through selective laser melting (SLM) and direct energy deposition (DED) were experimentally studied [
15,
16,
17,
18]. All three of these studies reported anisotropic fatigue strength of Ti-6Al-4V with respect to AM build directions. Further, they reported higher fatigue strengths when the test axes were along 0º [
15,
16], and 90º [
17,
18] to the AM direction.
The fatigue study in [
15] investigated the directional fatigue strength of SLM Ti-6Al-4V. It utilized machined test specimens from SLM rods, testing them at room temperature on an electromagnetic resonance fatigue machine (QBG-25). The fatigue anisotropy observed in this study was attributed to the crystallographic texture and columnar grains in the SLM material build. In [
16], as built AM Ti-6Al-4V samples via SLM were tested for directional fatigue strength on MTS 810 fatigue testing machine at room temperature. In this study, the observed anisotropic fatigue strengths at 0º and 90º angles to the AM directions were attributed mainly to the weak inter layer bonding. In [
17], the directional fatigue study was carried out using both machined and as built SLM Ti-6Al-4V samples on a MTS load frame at room temperature. This study suggested that the aspects associated with SLM process such as porosity, microstructure and surface roughness could have contributed to the observed fatigue anisotropy. In [
18], directional fatigue strength of Ti-6Al-4V manufactured by DED process was studied. In this work machined test specimens from DED block were tested on an Instron 8801-100 kN hydraulic servo fatigue tester at room temperature. This study attributed the crystallographic texture and alpha colonies with directional characteristics to the fatigue anisotropy.
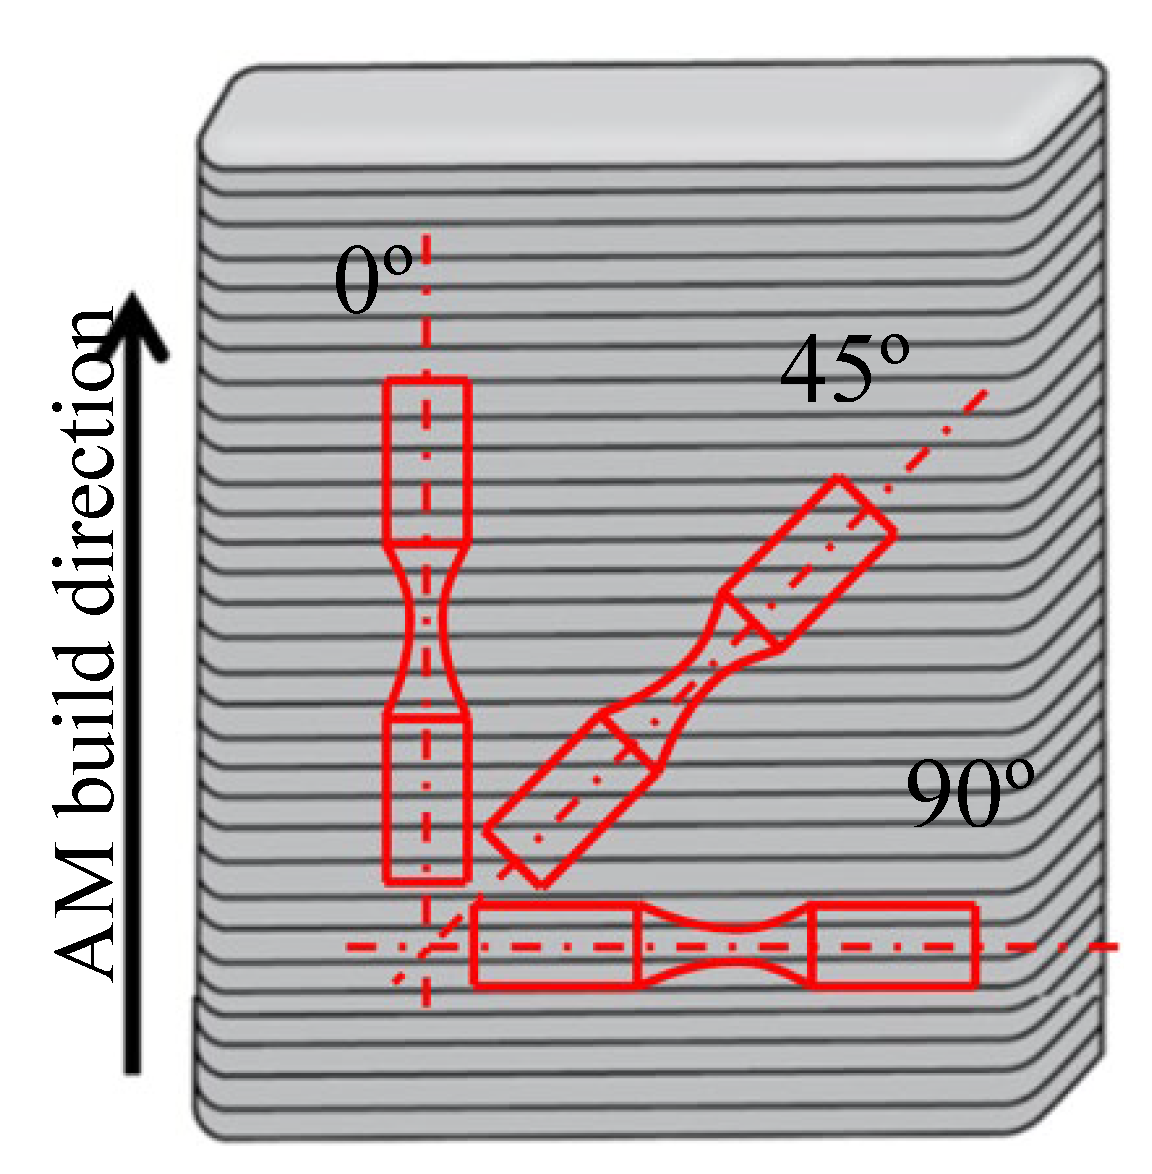
In the present work, directional isothermal-fatigue of Ti-TiB MMC manufactured by plasma transferred arc solid free-form fabrication (PTA-SFFF) was investigated at 350ºC in three AM build orientations: 0º (test axis is parallel to), 45º (test axis is 45º to), and 90º (test axis is perpendicular to) AM direction. Among these three AM directions, experimental data in 45º and 90º AM build directions were collected in the present study. The data in 0º AM build direction at 350ºC was extracted from the current authors’ previous experimental work reported in [
19]. Further, the fatigue data for the current work was collected using a rotating beam fatigue (RBF) tester following the experimental setup described in [
19]. Moreover, to investigate influence of TiB on crack initiations, propagations, and the overall directional fatigue strength of the Ti-TiB MMC, electron microscopy images were collected from polished as well as fatigue fractured specimens. In addition to the current fatigue and electron microscopy experimental work, an analytical investigation on the fatigue life predictability of the modified Paris’ equation described in [
19] was tested against general Paris’ equation using current and literature [
19] experimental data.
The above-described directional isothermal-fatigue investigation of AM Ti-TiB MMC are further detailed in the remainder of this manuscript under
Section 2,
Section 3 and
Section 4. In
Section 2, specimen orientations, current experimental results on isothermal fatigue in 45º and 90º AM build directions, and electron microscopy images are provided. In
Section 3, the experimental findings on directional fatigue (in 0º, 45º, and 90º AM build directions), and Ti-TiB MMC fracture characteristics at 350 º are analysed. This section also presents fatigue calculations associated with the current experimental data using Paris’ and modified Paris’ equations. Finally, the findings of the current experimental and analytical work are presented in
Section 4.
2. Specimen Orientations and Experimental Results
The present work is a continuation of the research work presented in [
19]. As such, the compositional information of the Ti-TiB MMC, the dimensions of the fatigue specimens, the sample preparation procedures, and the RBF setup can be found in [
19]. However, in contrast to the specimens used in [
19], which were machined to have their fatigue test axis perpendicular to the AM build direction (0º), the specimens for the present study were machined in 45º and 90º AM build direction as shown in
Figure 1.
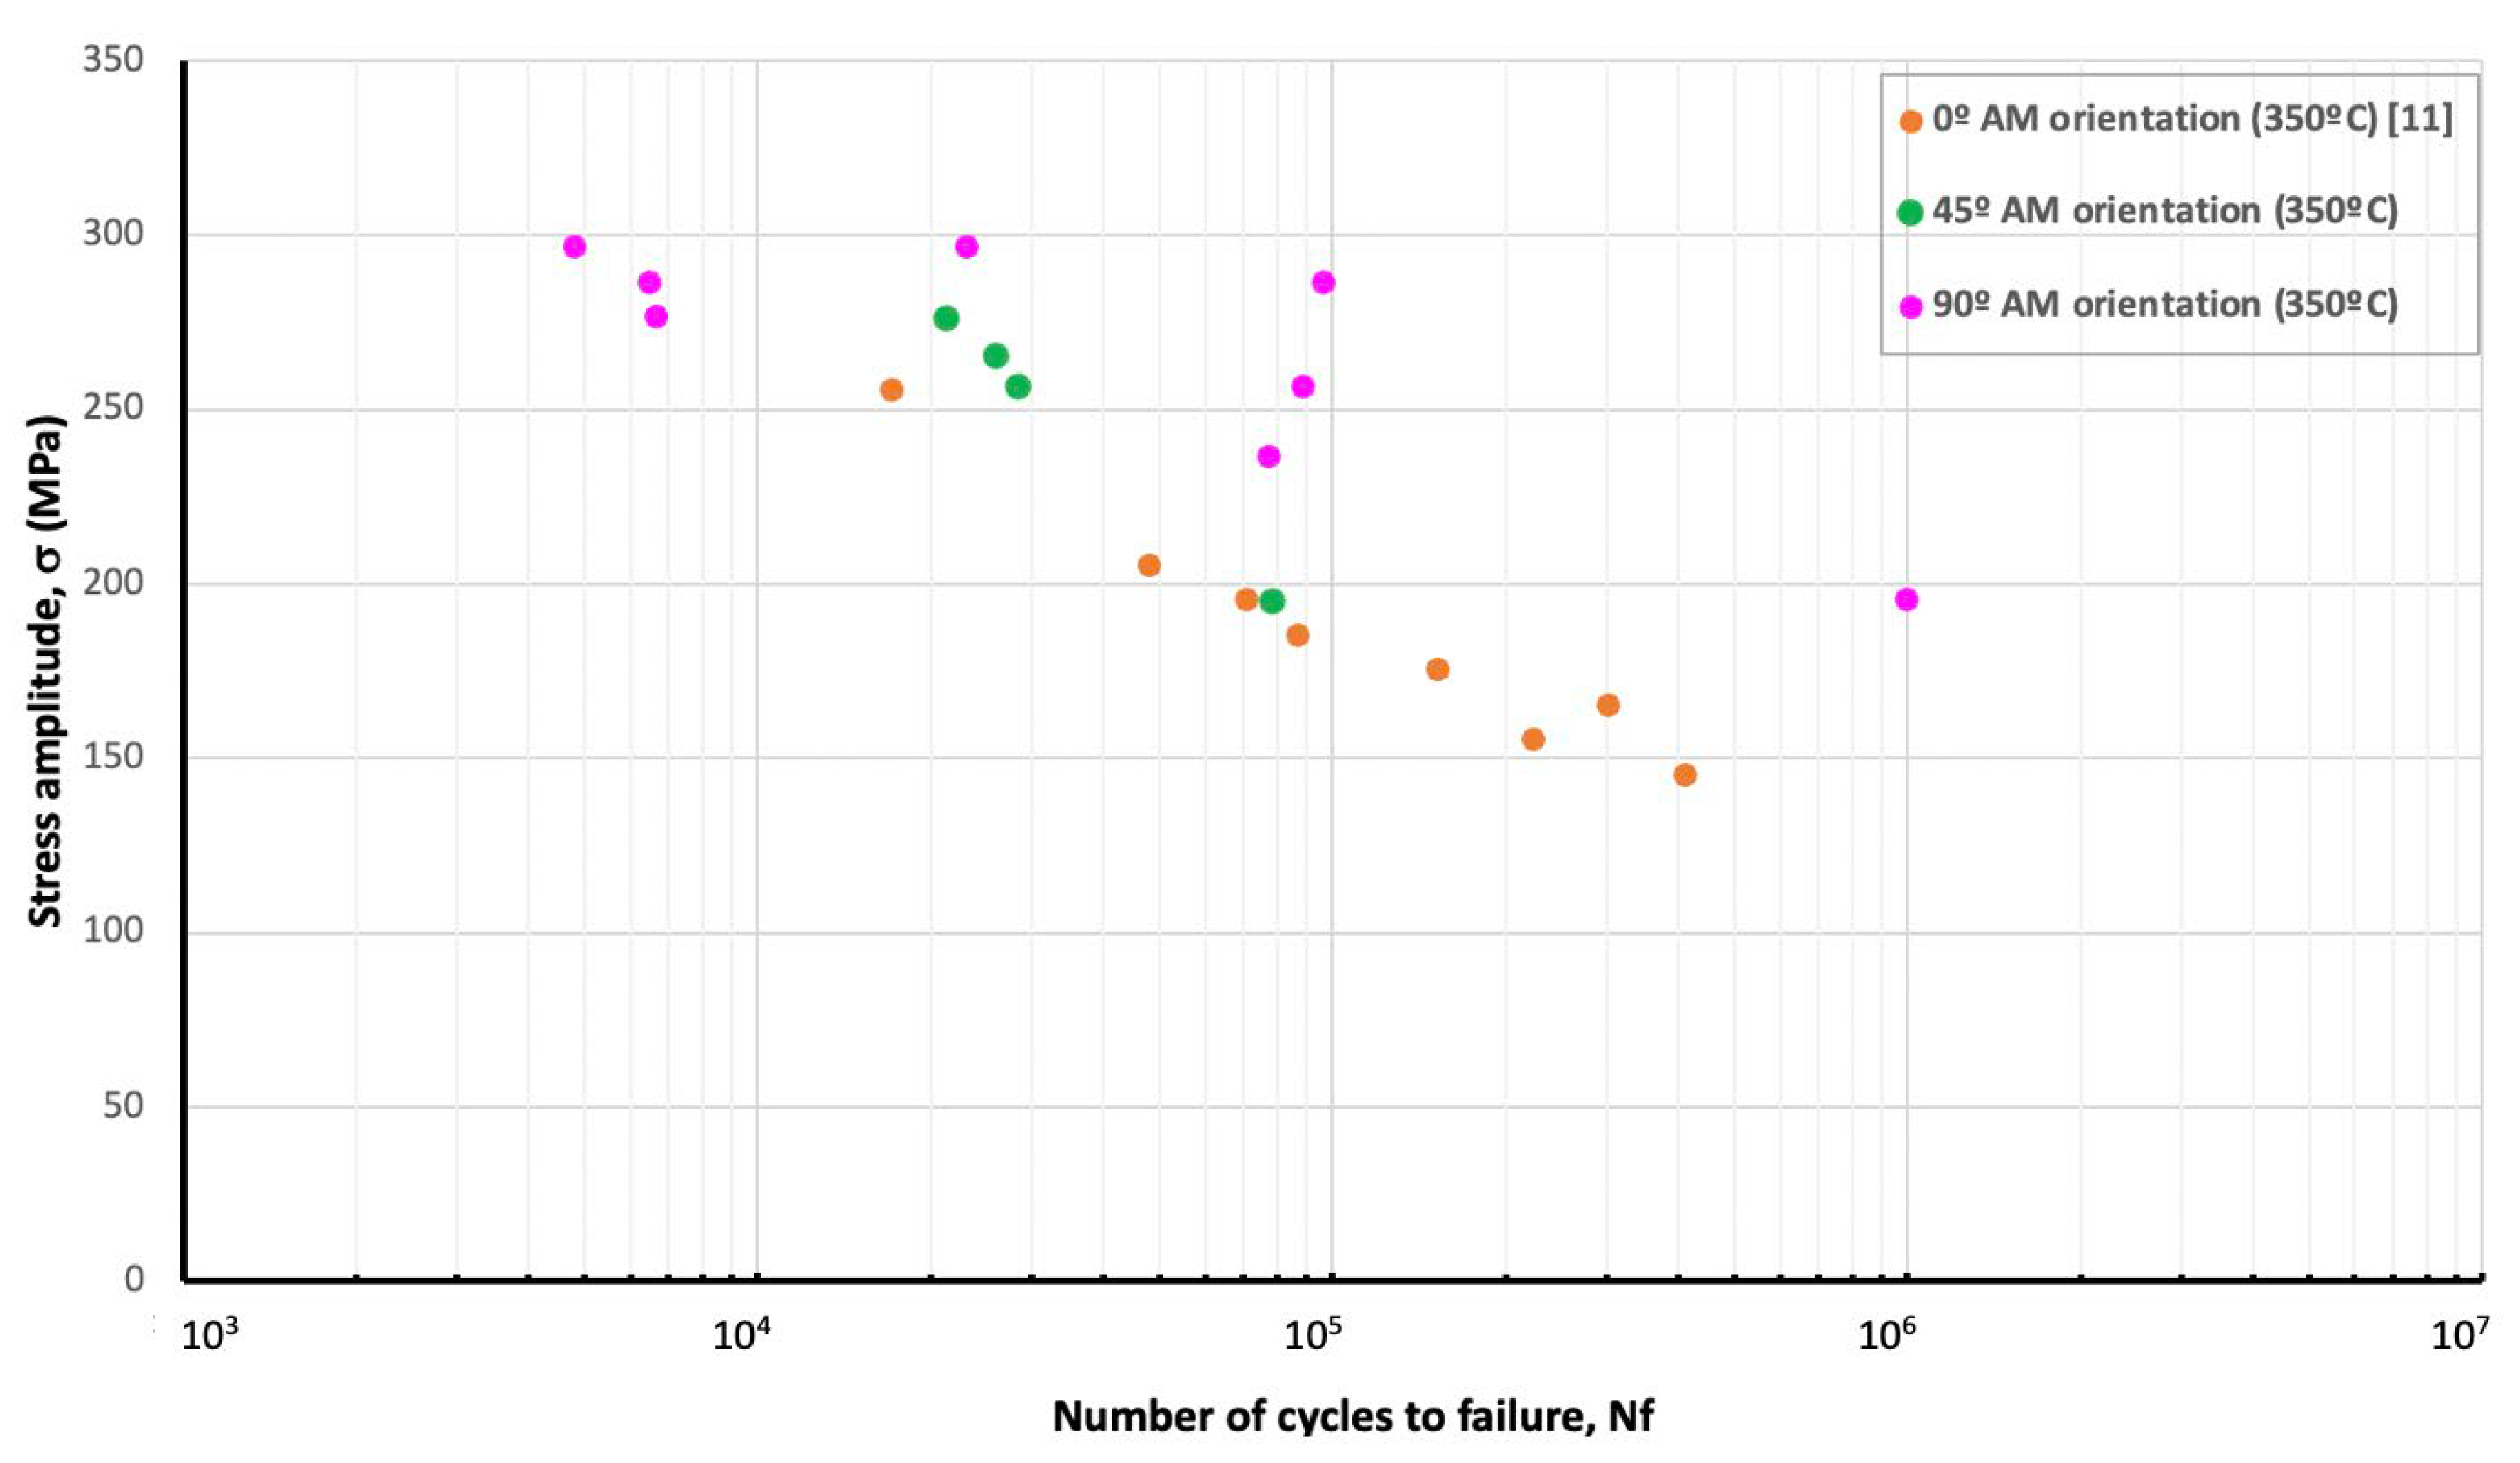
The current experimental fatigue data for AM Ti-TiB MMC at 350 ºC in 45º, and 90º AM build directions along with fatigue data from the literature [
19] in 0º AM build direction at 350 ºC are presented in
Figure 2.
The electron microscopy images collected from the fractured fatigue specimens as well as from polished and etched specimens with 0º, 45º, and 90º AM build directions are given in
Figure 3,
Figure 4,
Figure 5 and
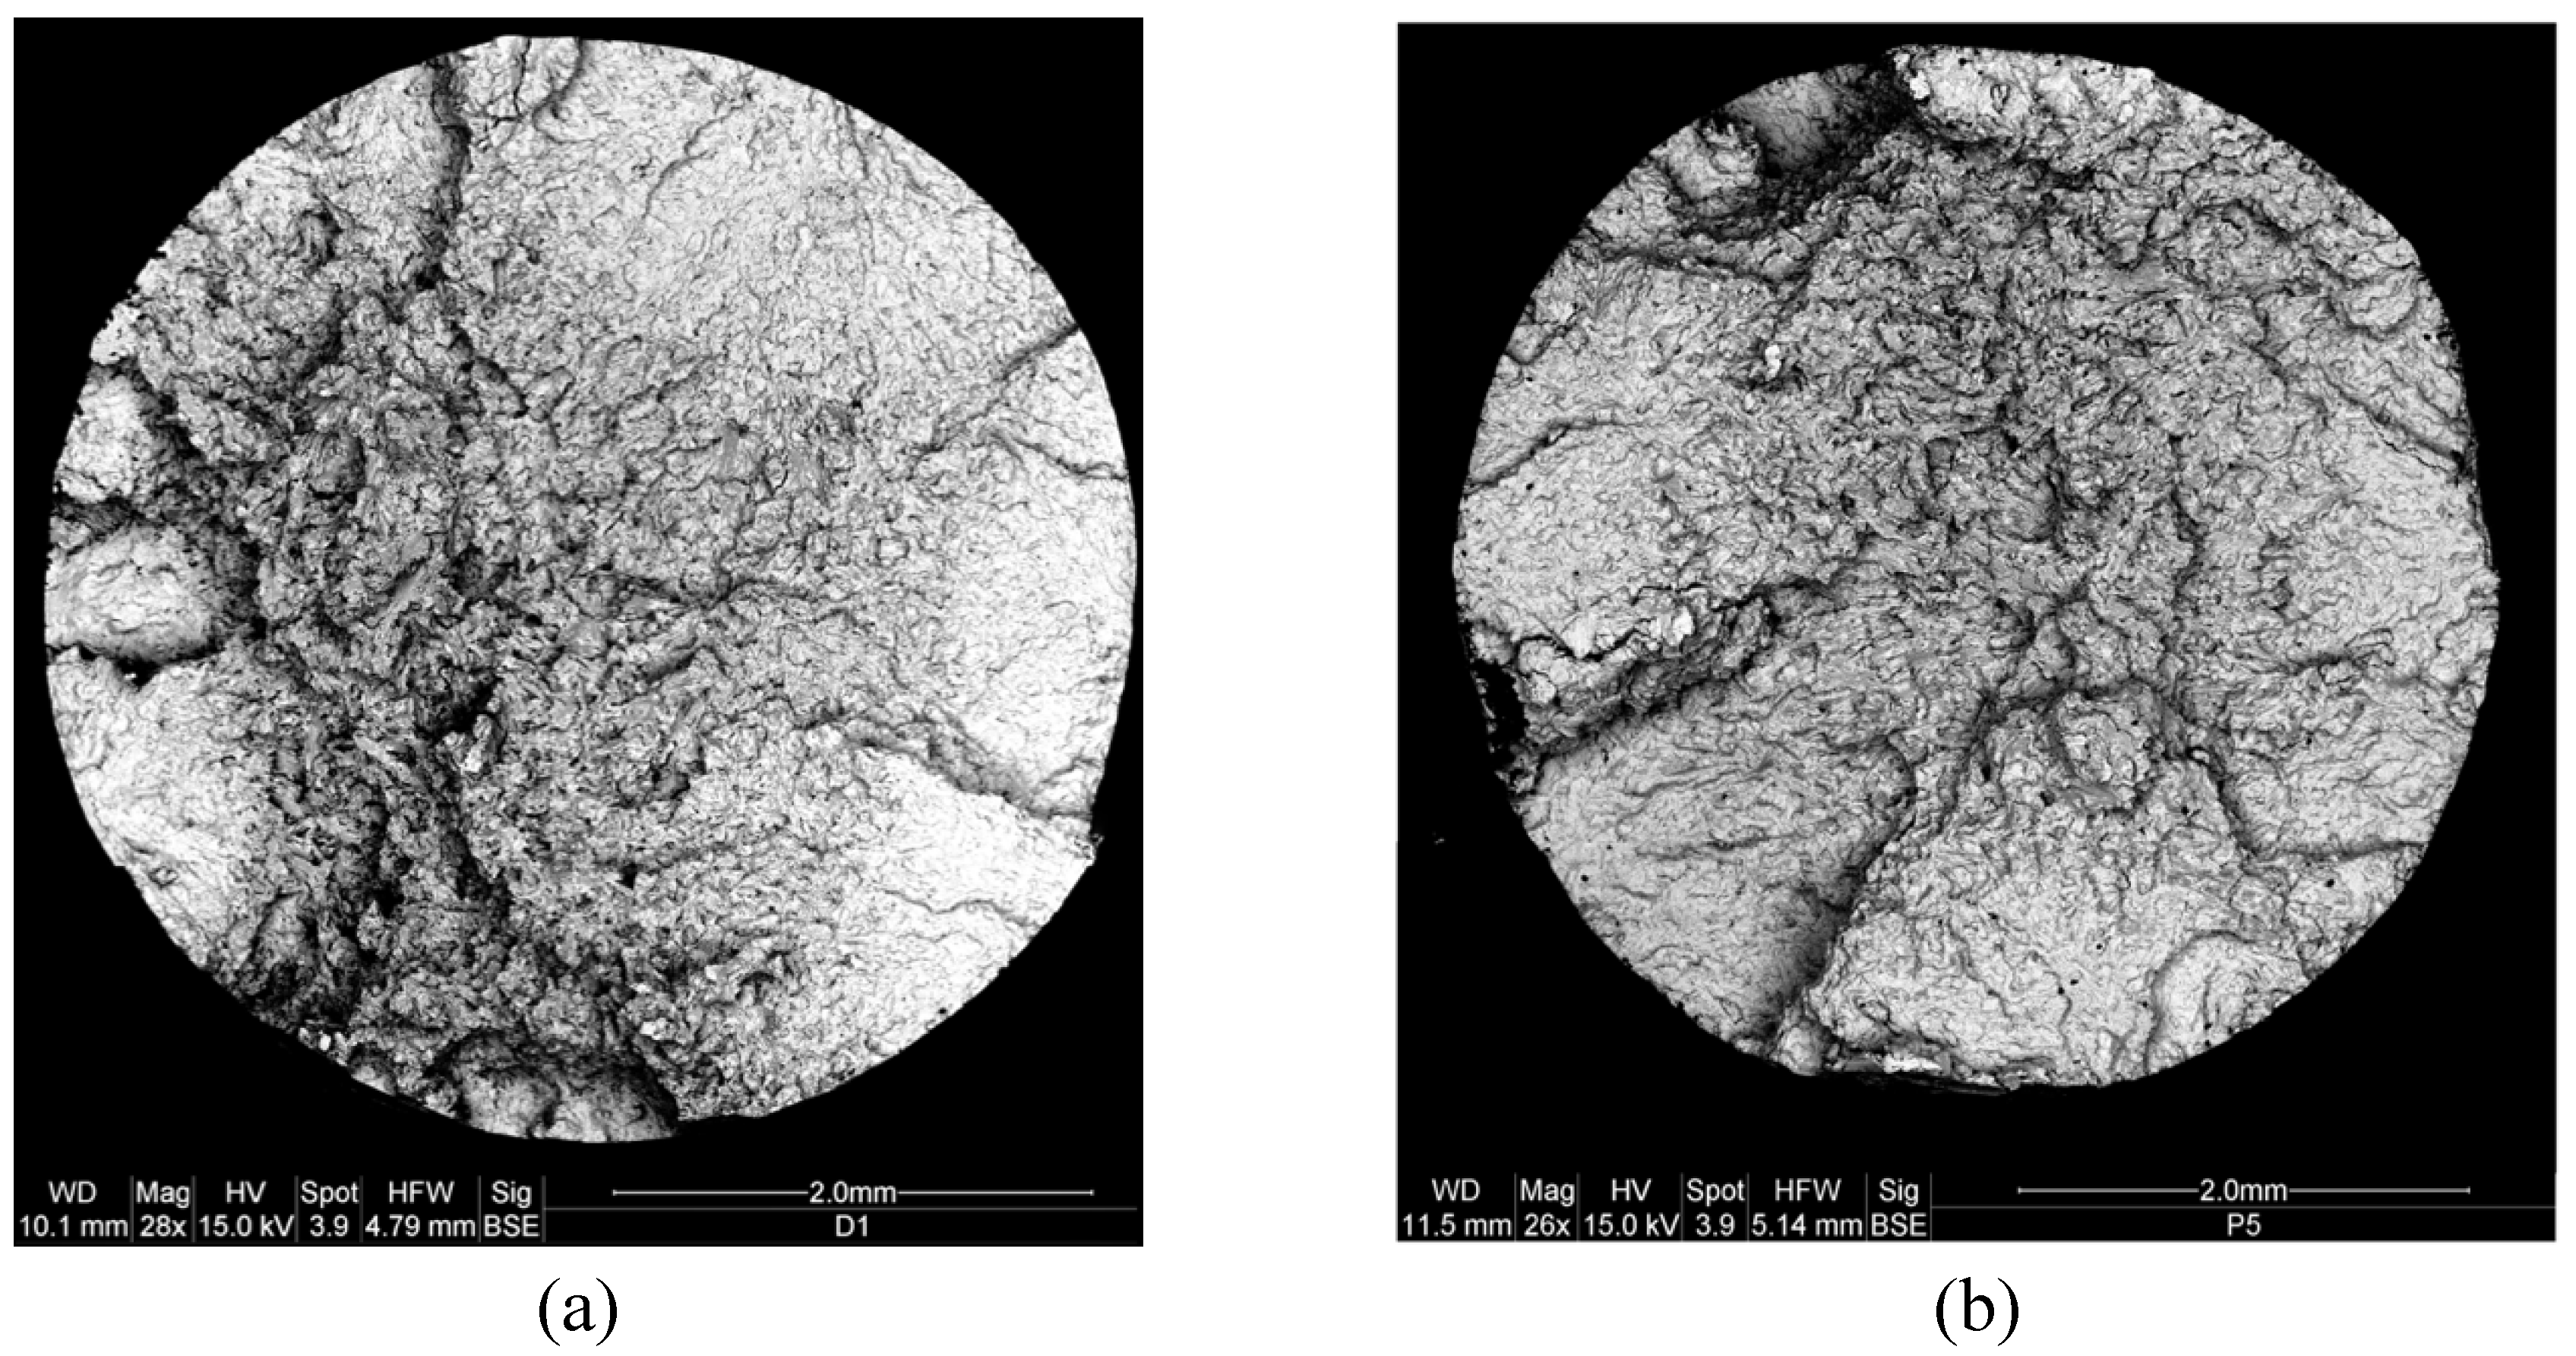
Figure 6. The specimens that were polished and etched were cut in such a manner that representative cross sections of the fatigue specimens with 0º, 45º, and 90º AM builds could be studied. The low magnification (28x) back scattered electron (BSE) images in
Figure 3 show the complete fracture surfaces of fractured fatigue specimens with 45º and 90º AM build orientations. The high magnification (in the range of 600x-8000x) BSE images in
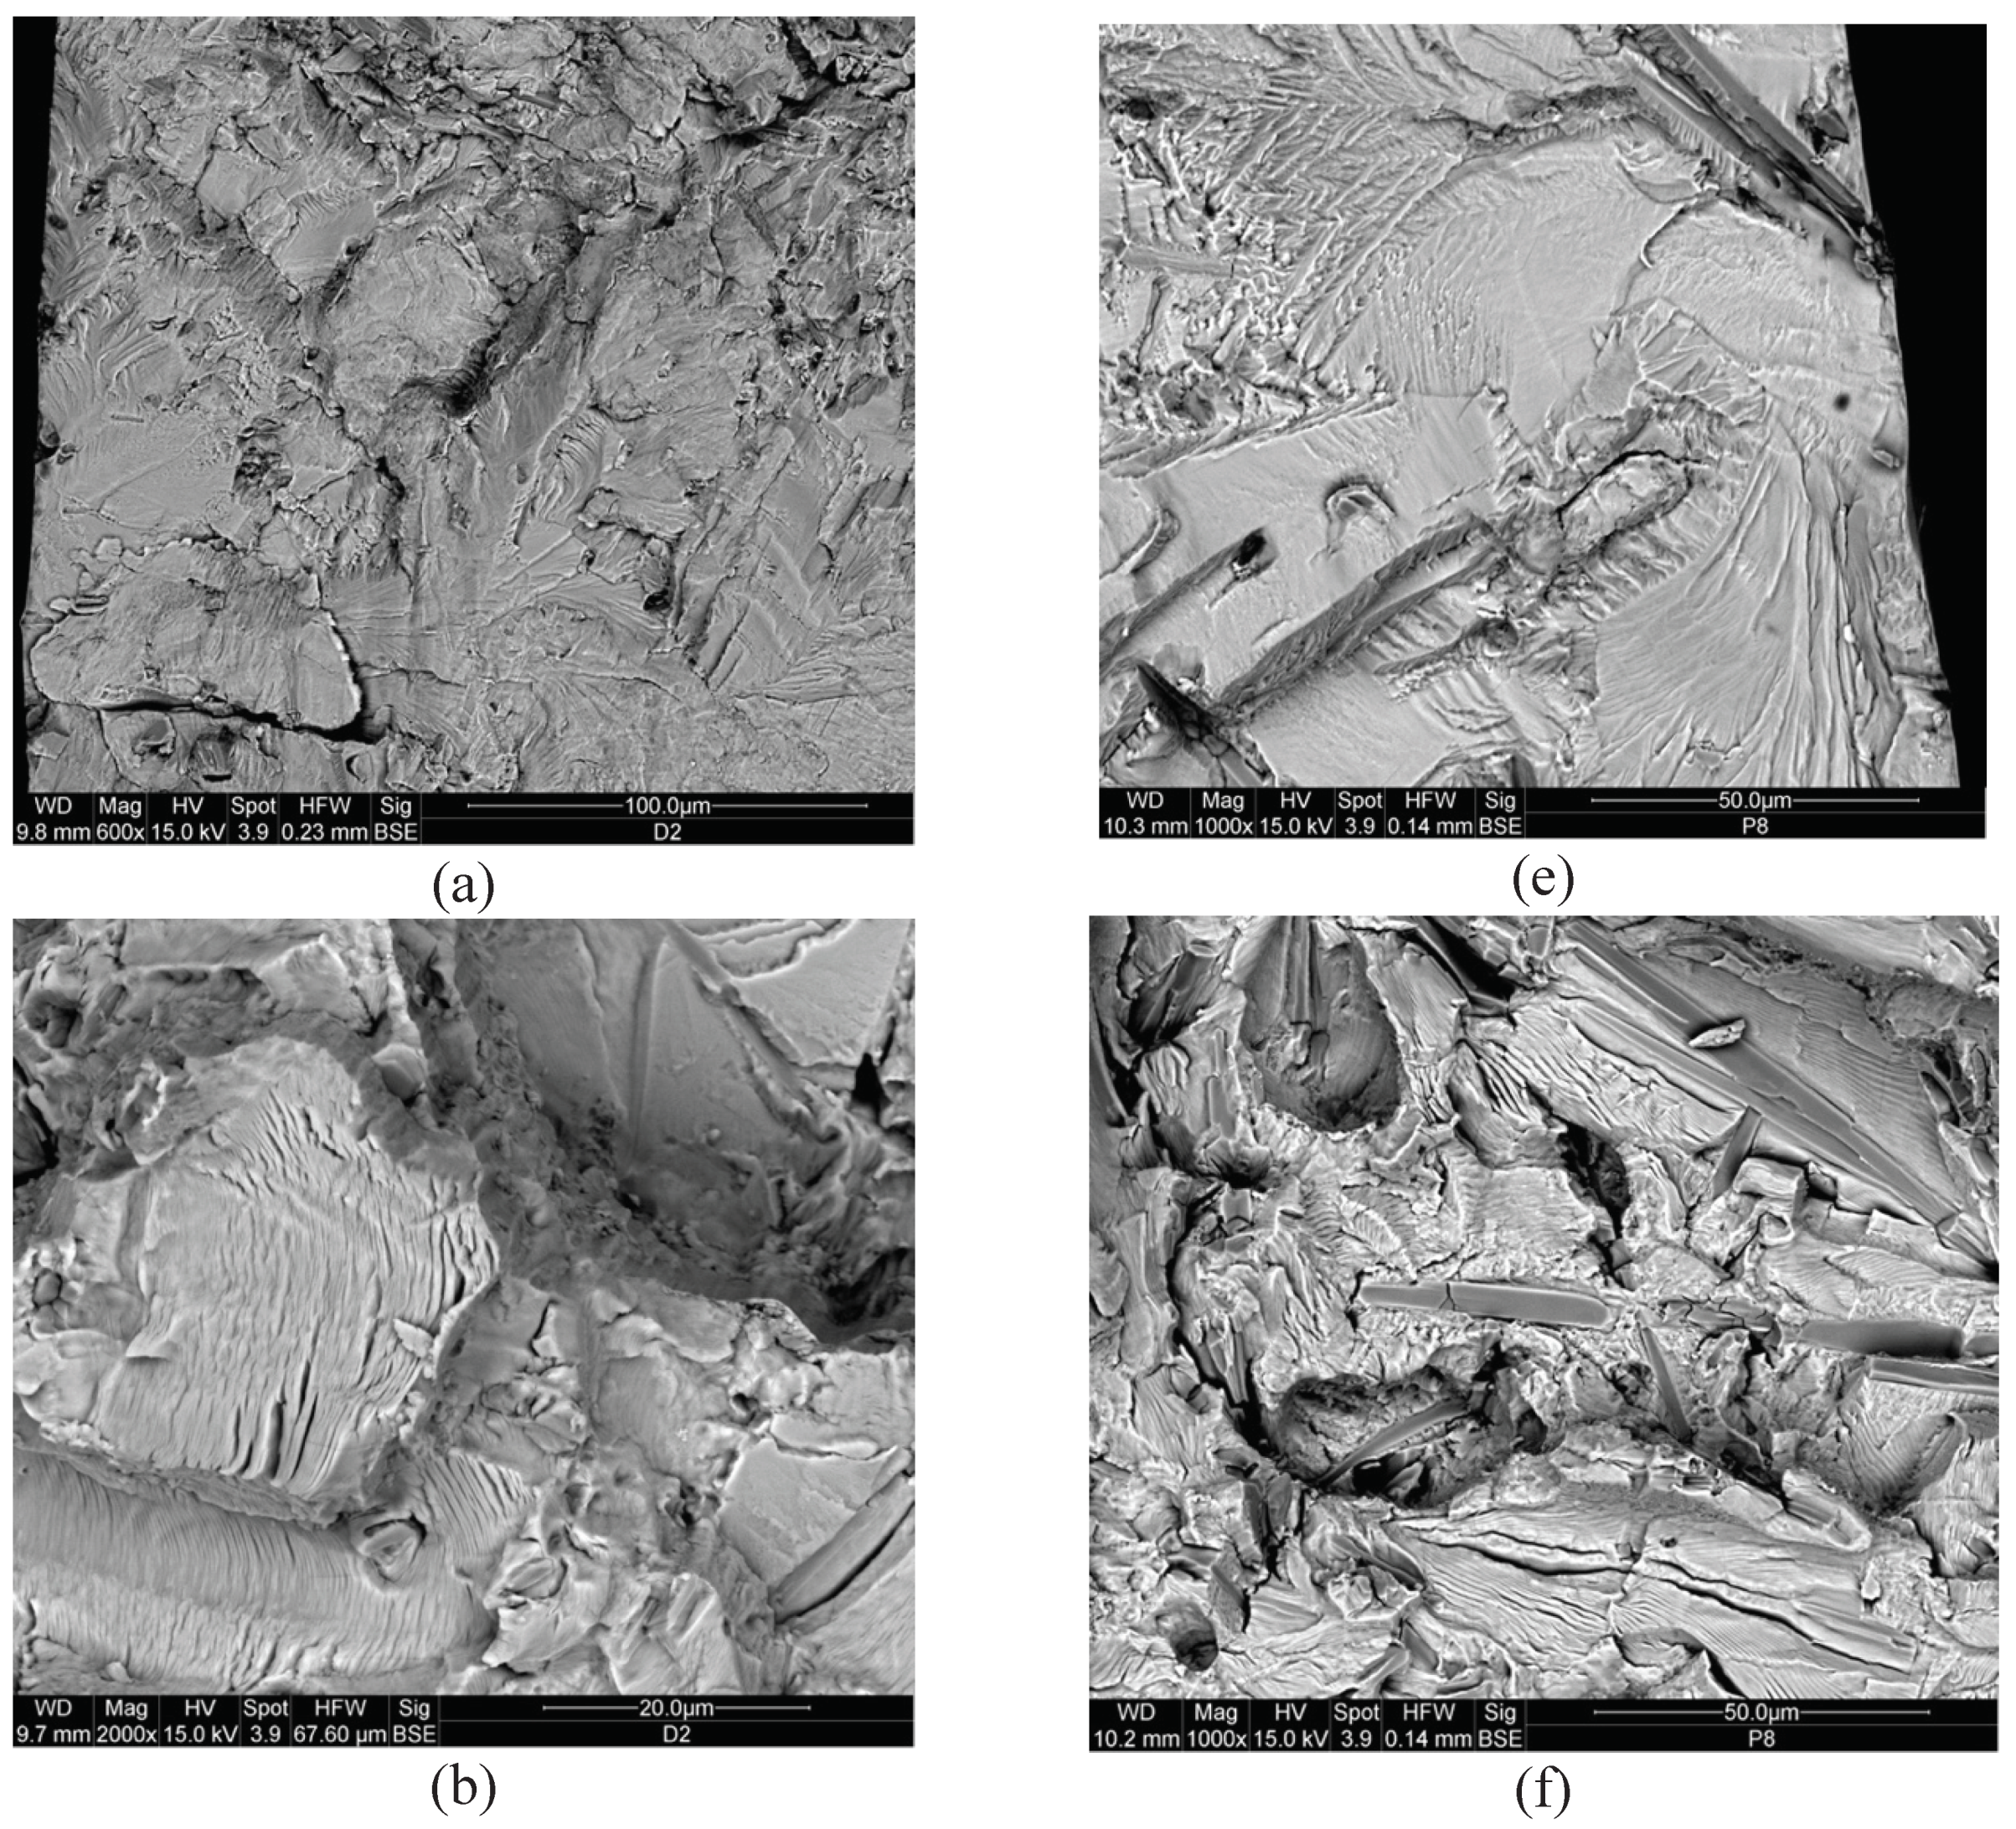
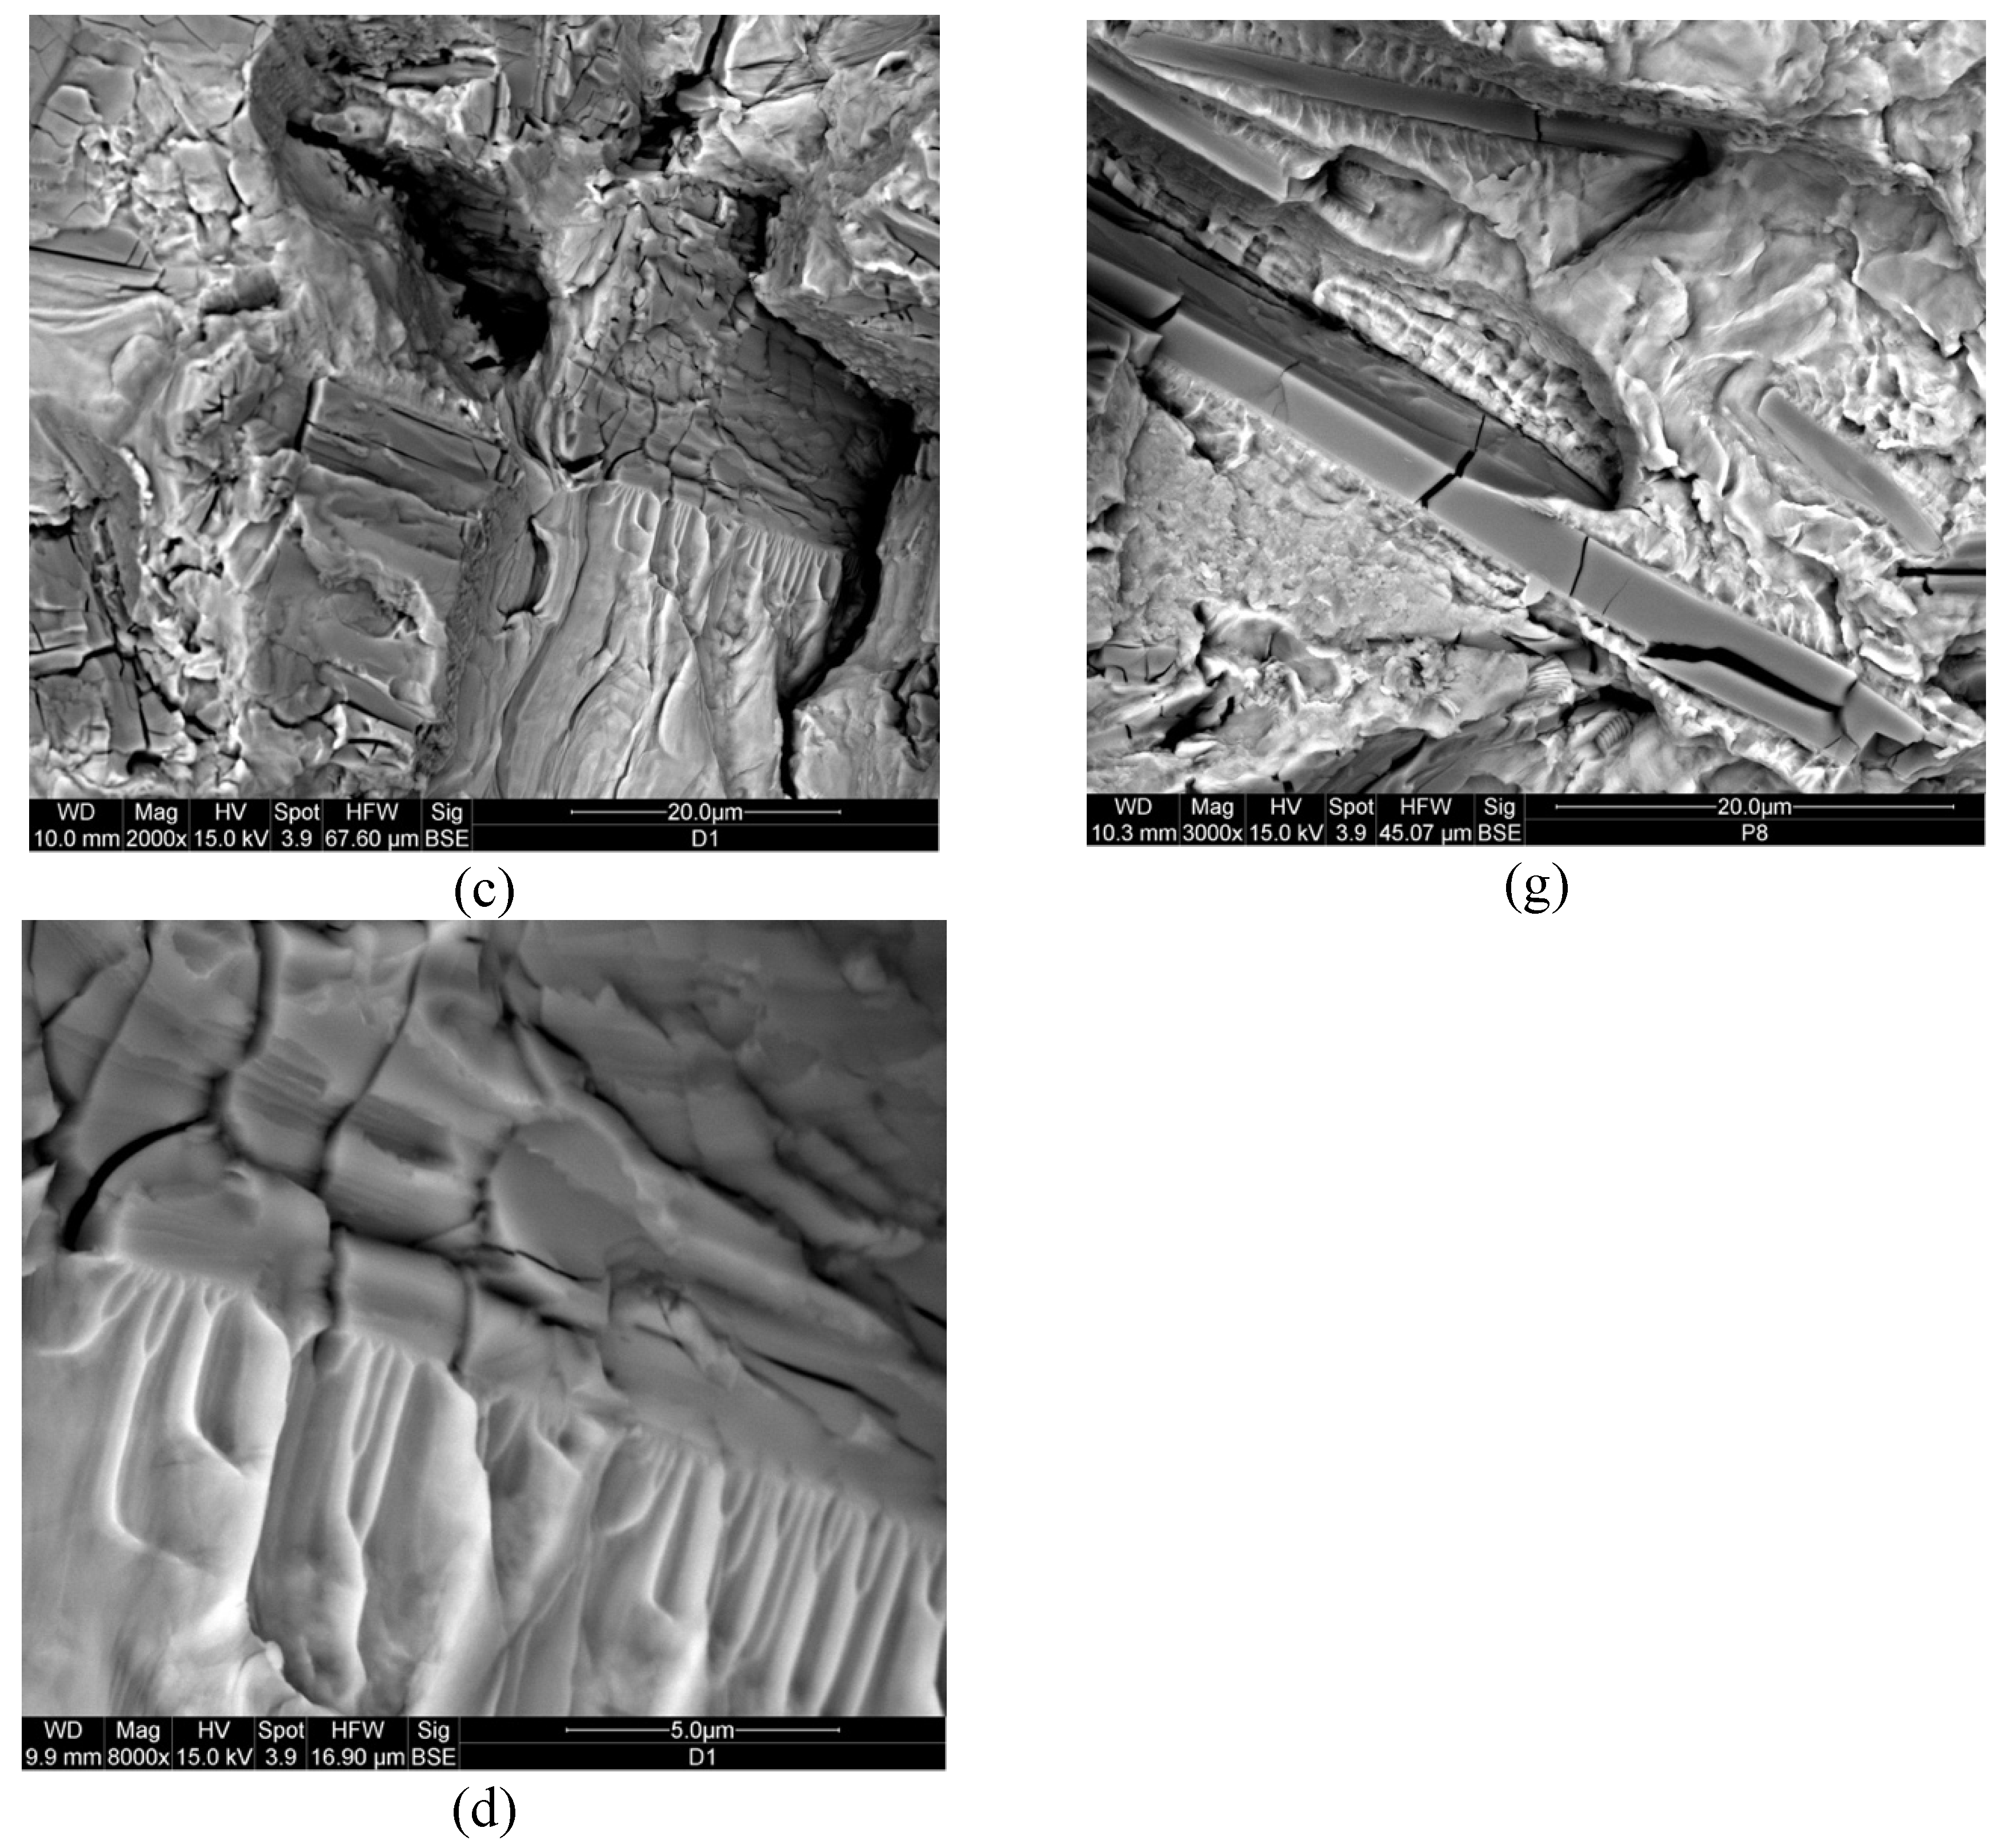
Figure 4 show various fracture characteristics that were observed in 45º and 90º AM orientation samples.
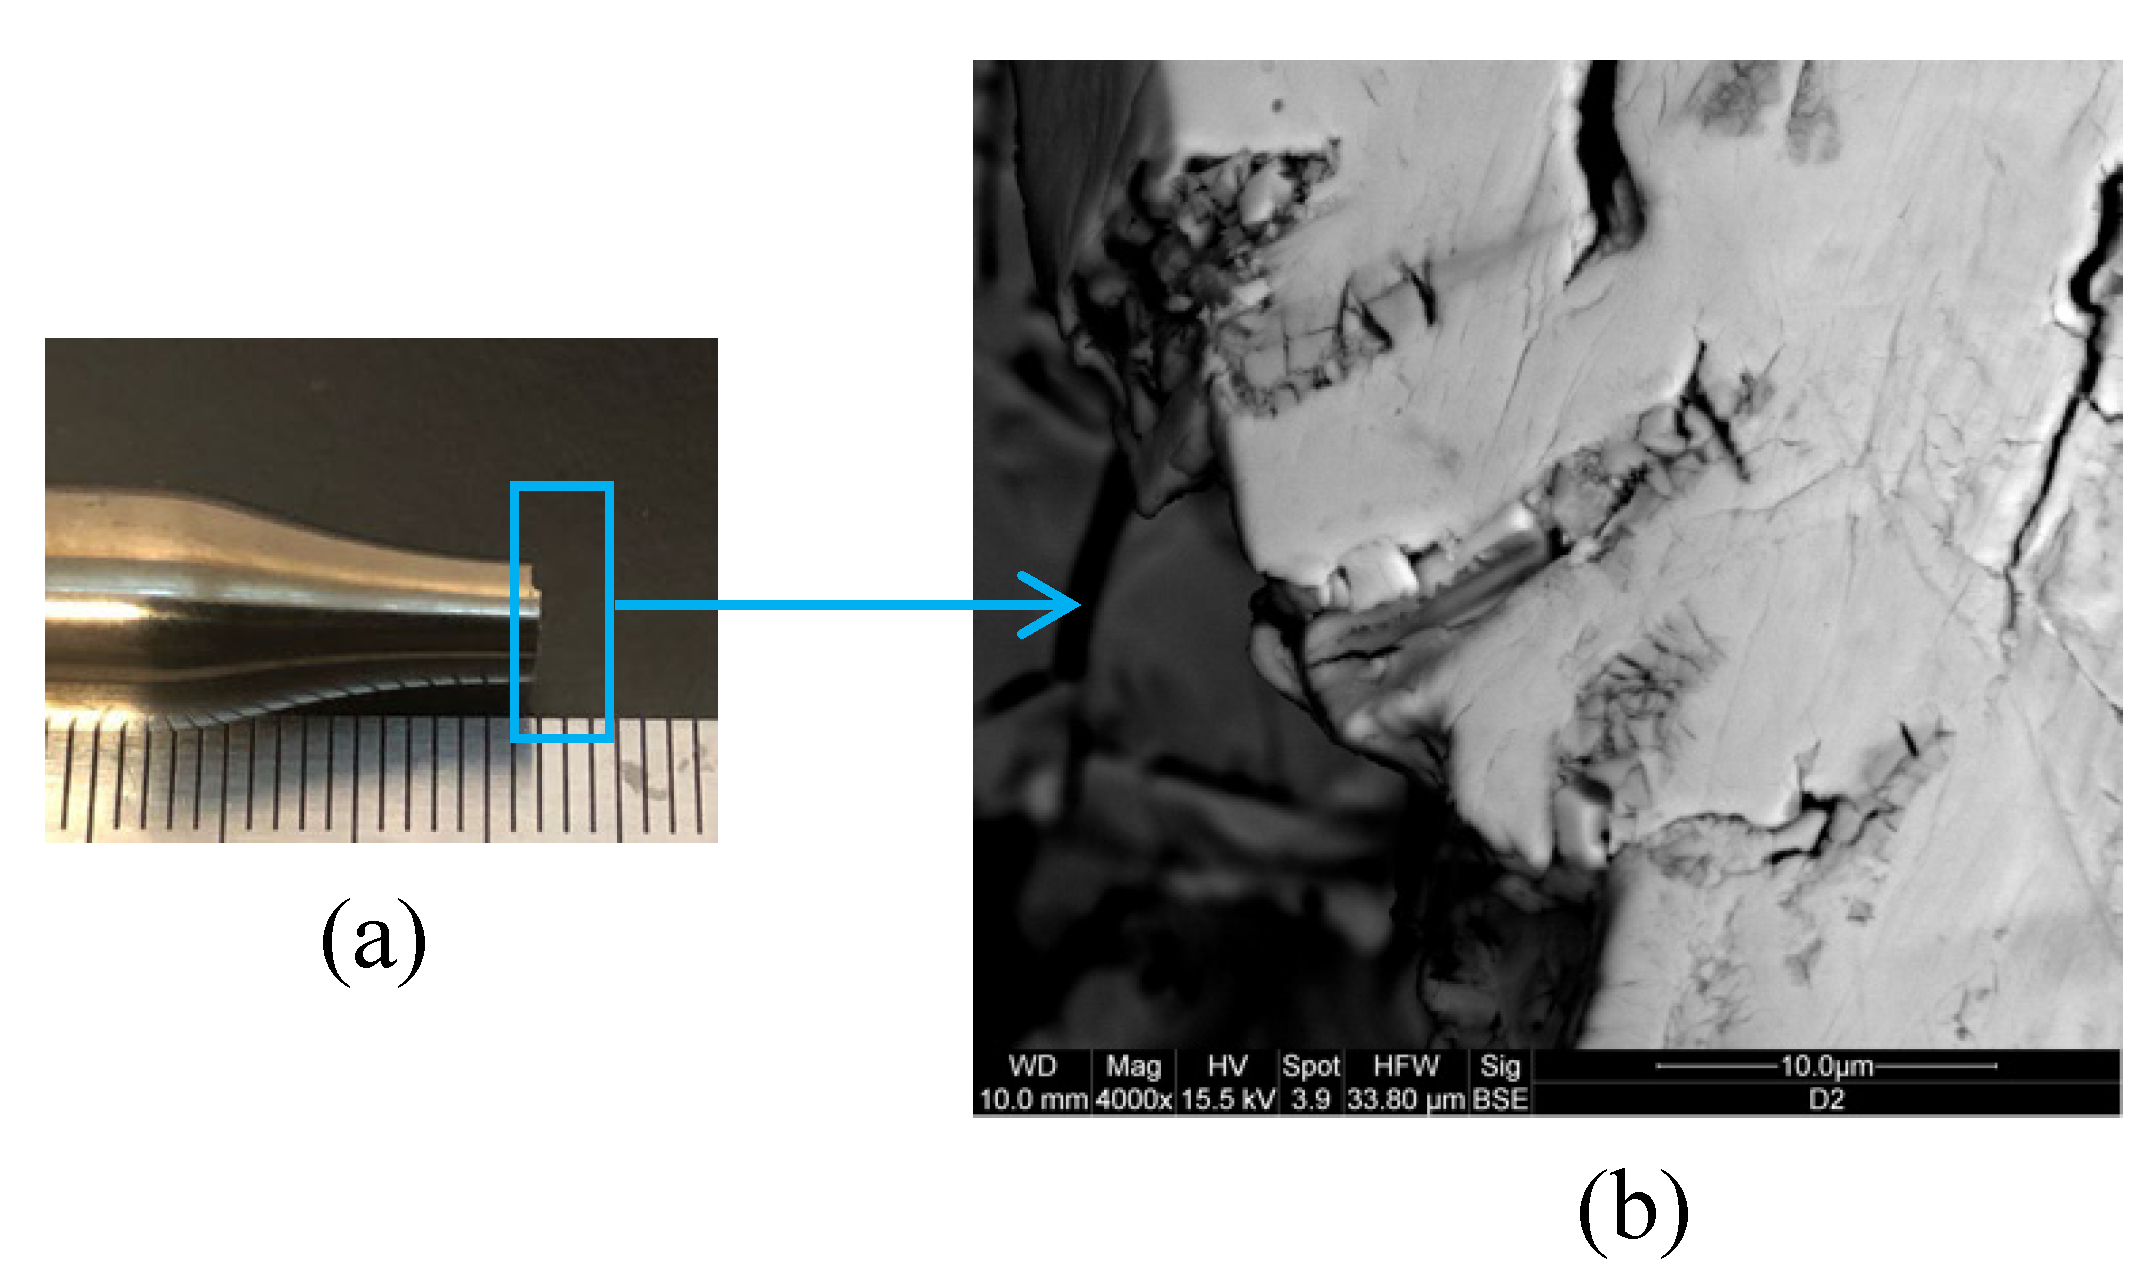
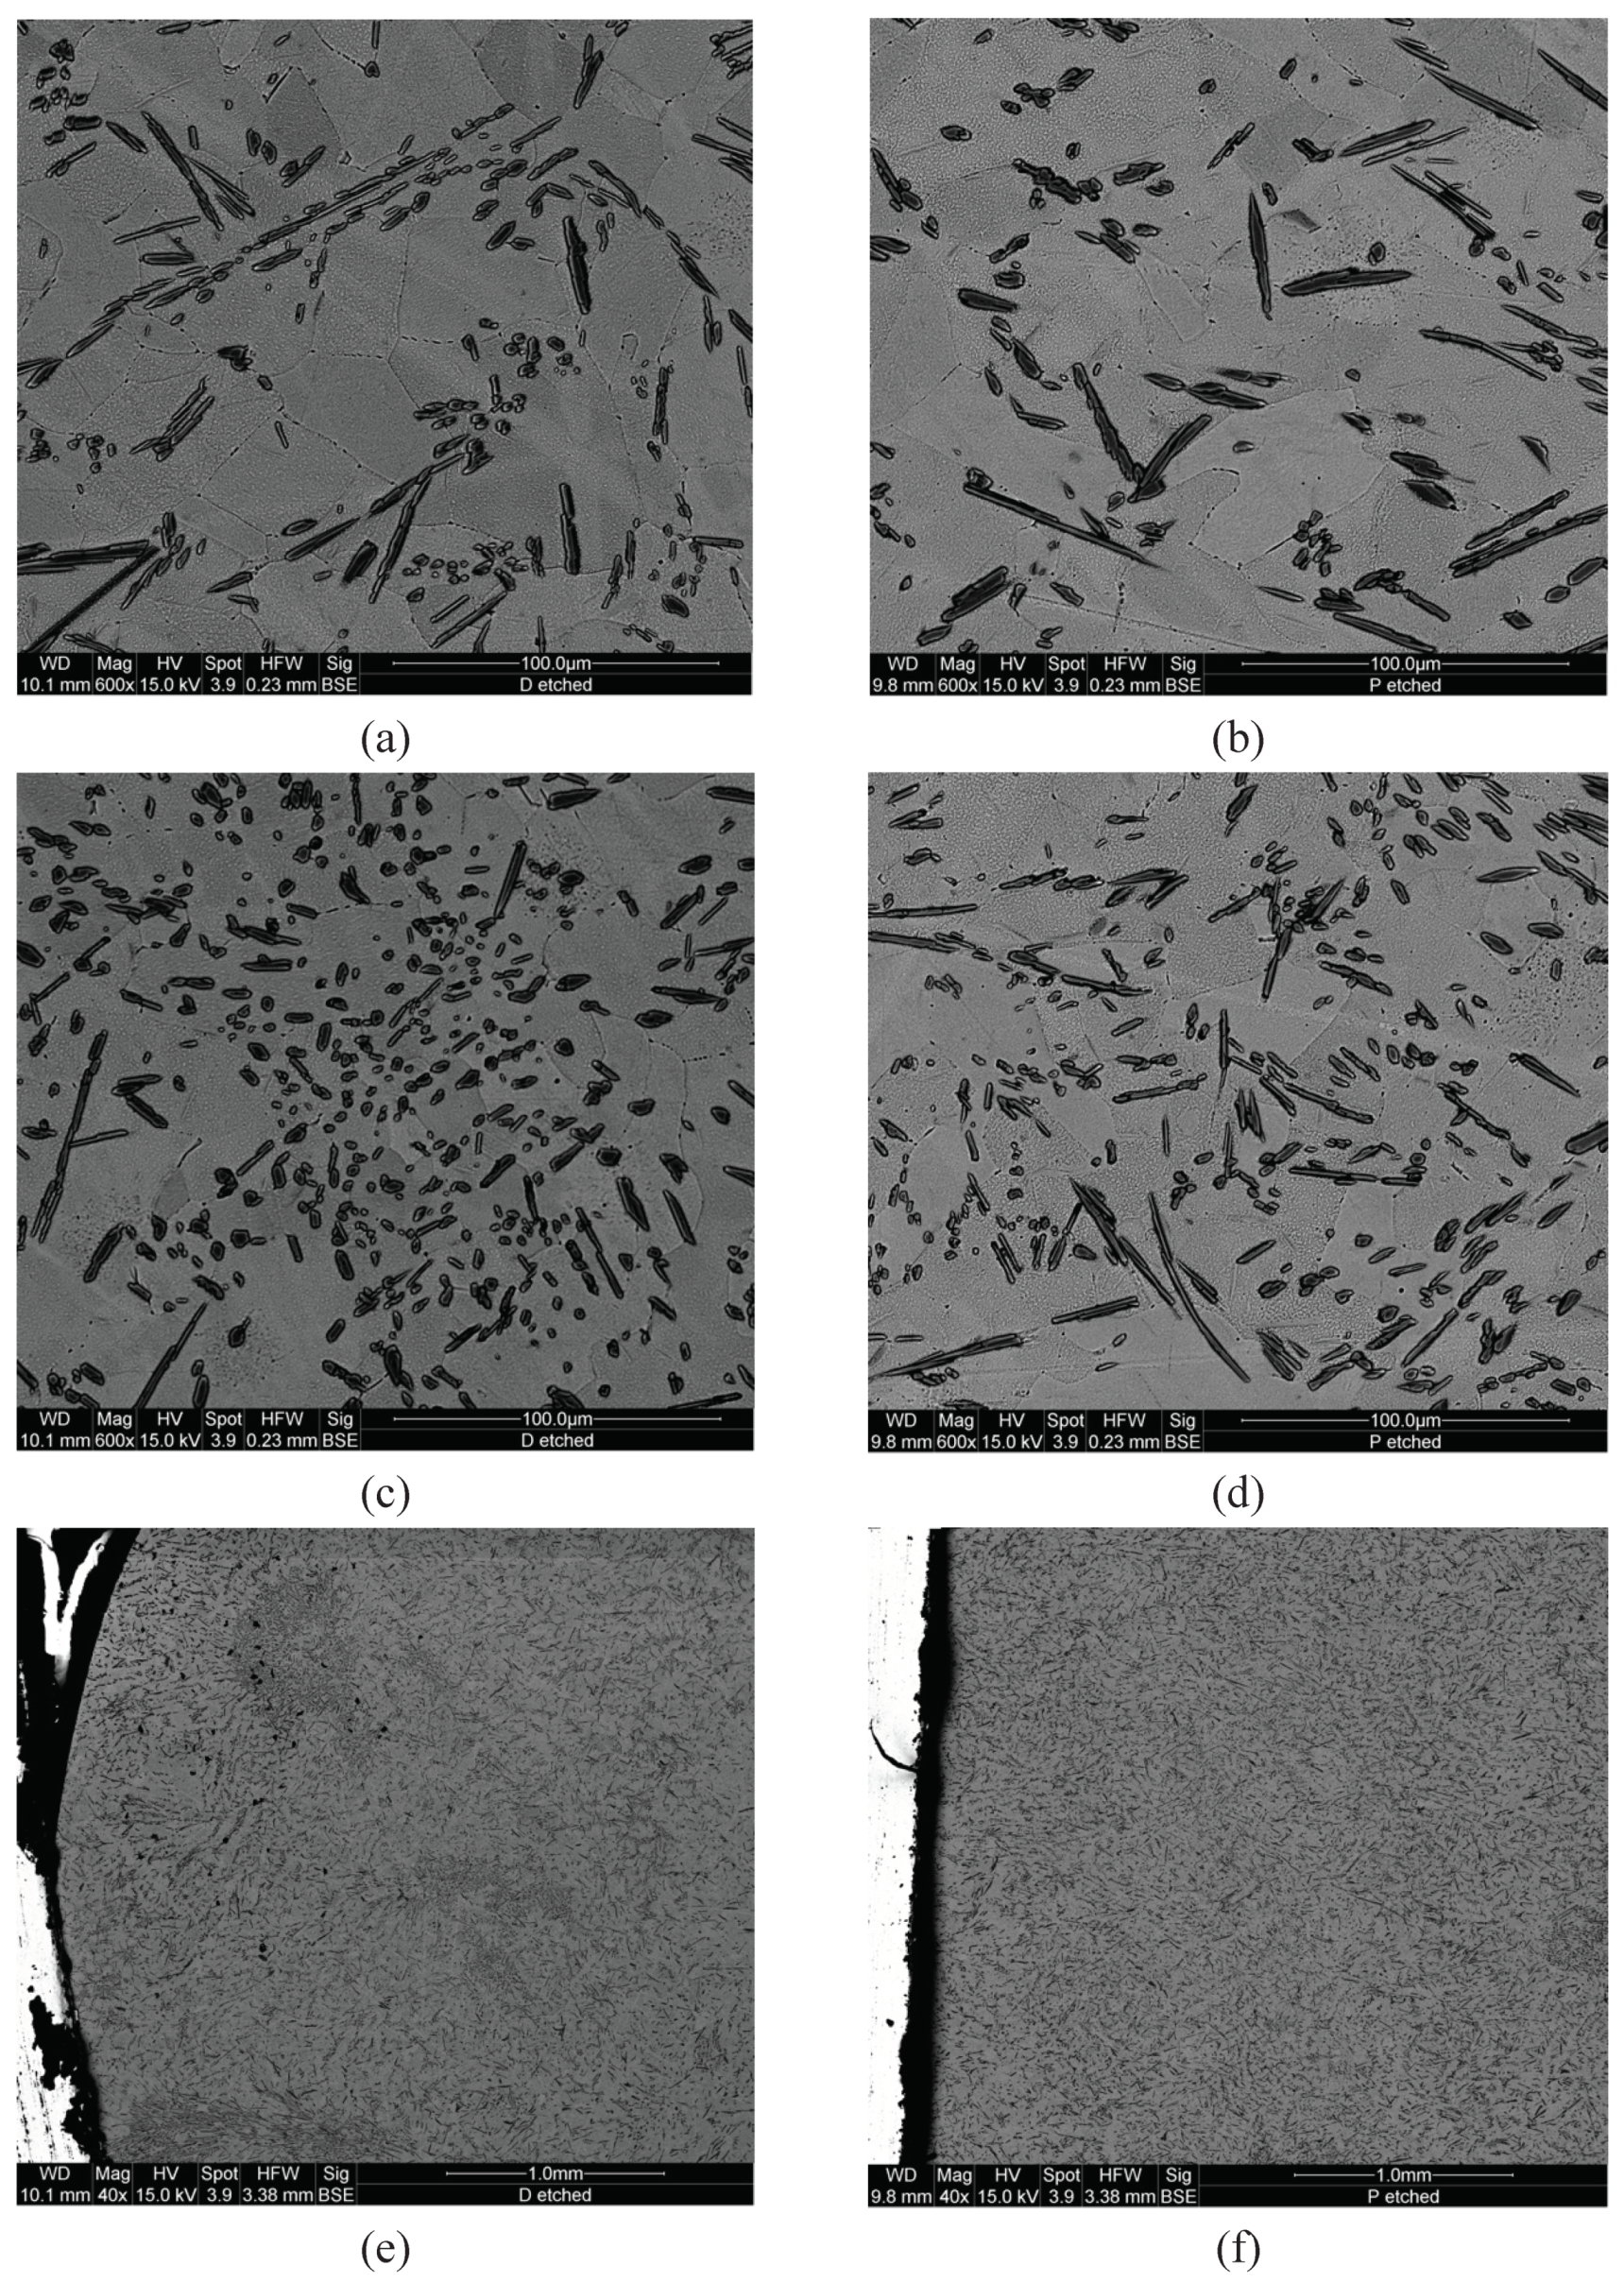
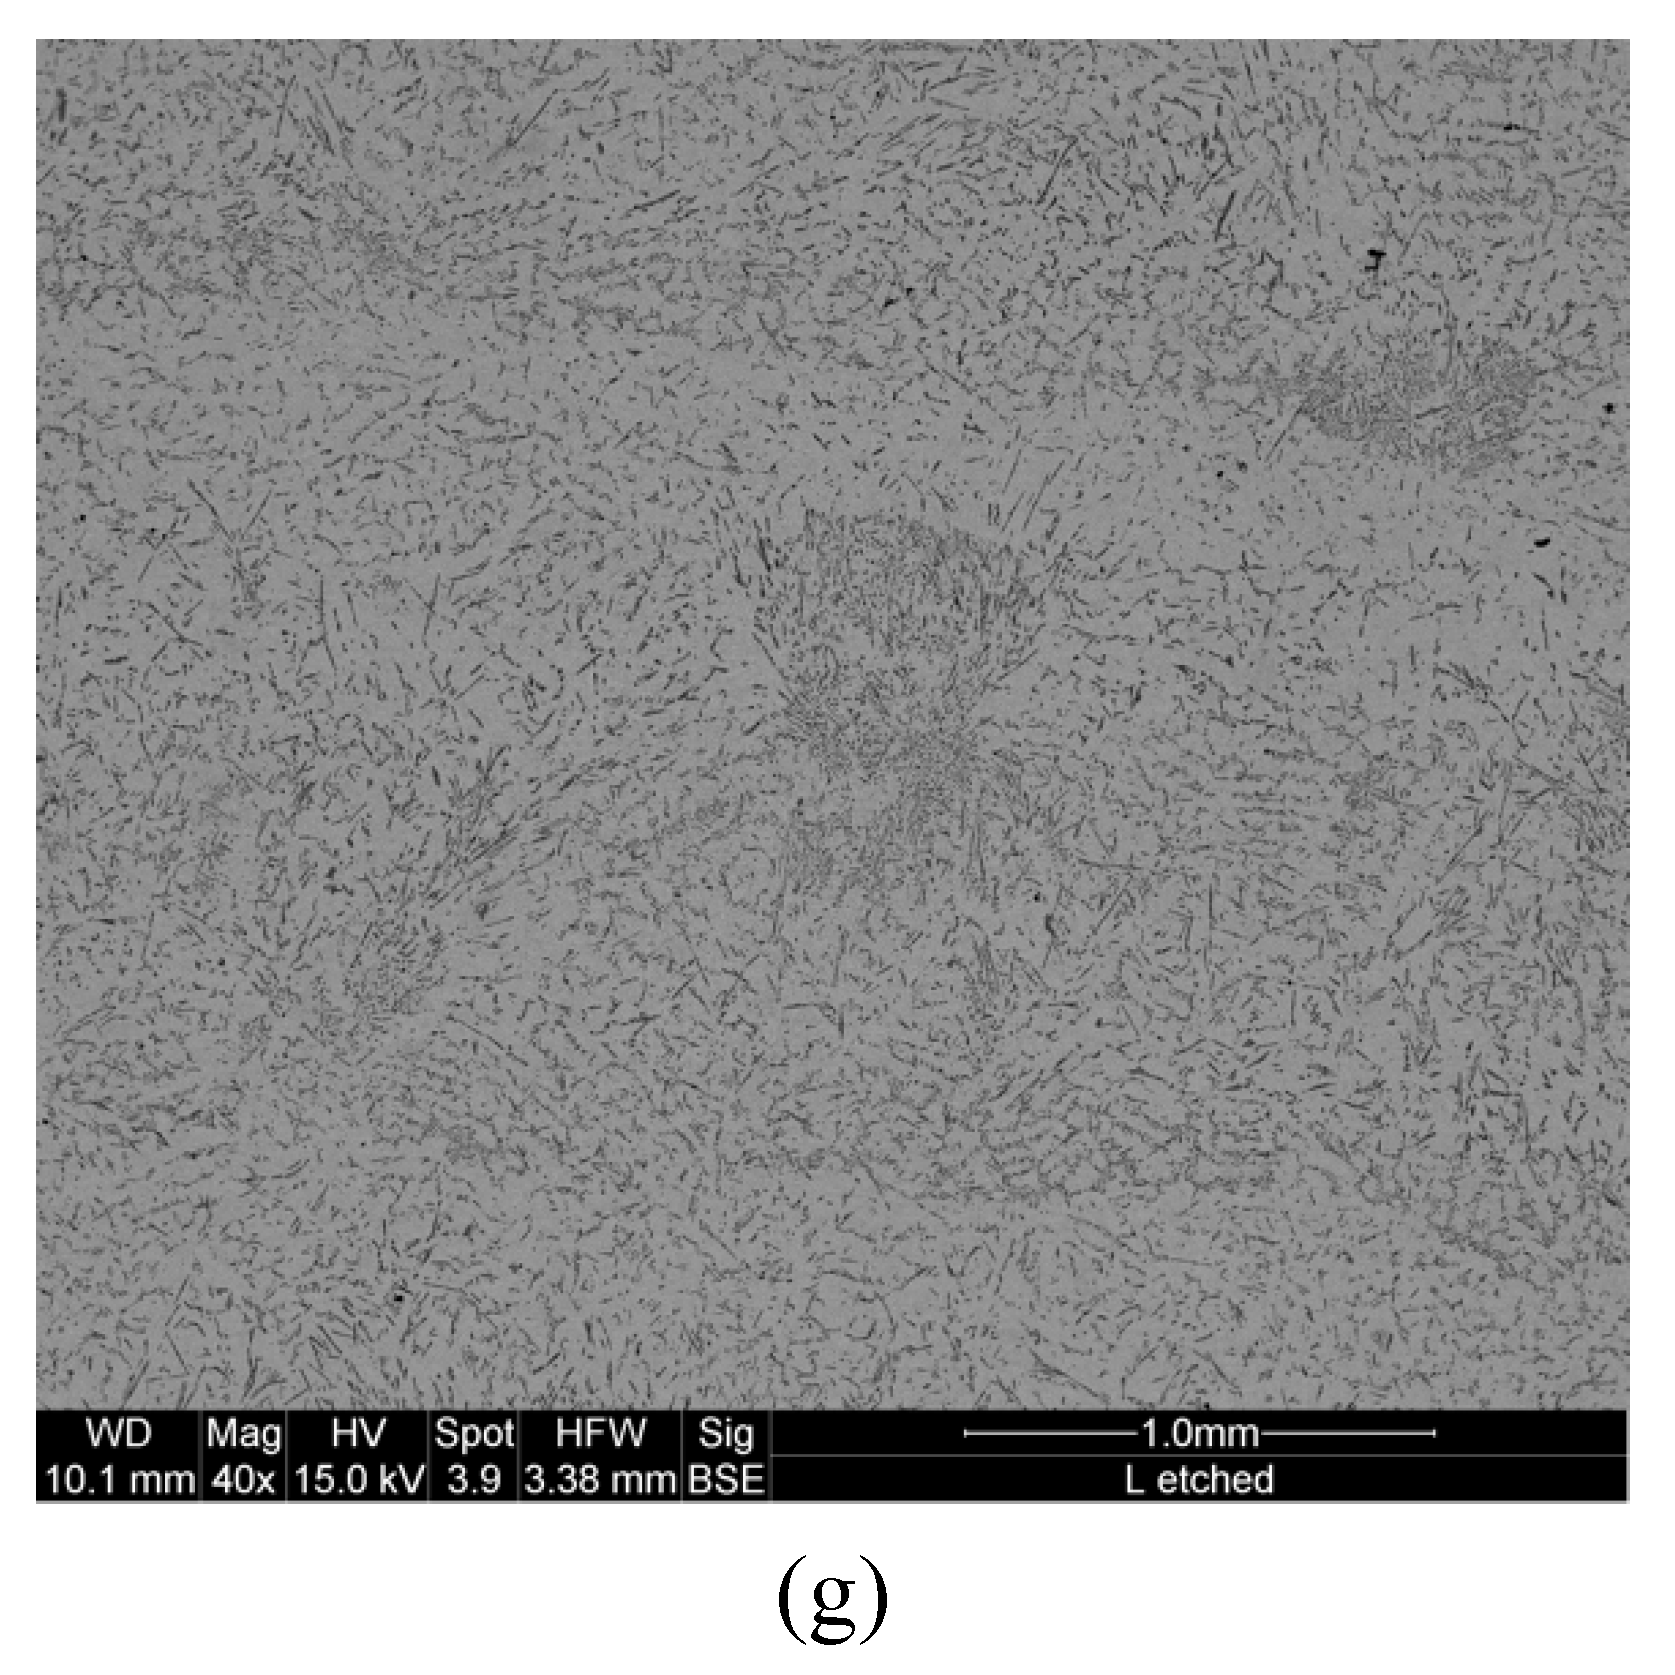
Figure 5 comprises (a) an image of peripheral surface of a fractured fatigue specimen and (b) an electron microscopy image along the fracture that shows extensive cracks in TiB. Since the TiB particles showed significant fracture, samples with 0º, 45º and 90º AM build orientations were polished and etched and observed under electron microscope to find how these particles are distributed in the Ti matrix. Samples in all three AM orientations showed similar distribution of TiB and the SEM images obtained from 45º and 90º AM build orientations are given in
Figure 6.
3. Analysis
The isothermal fatigue plots in
Figure 2 show that Ti-TiB MMC manufactured by PTA-SFFF exhibit fatigue anisotropy with the highest strength in 90º, moderate in 45º, and the lowest in 0º AM build orientations. Similar fatigue anisotropic results were observed in [
17,
18] in which the directional fatigue strengths of AM Ti-6Al-4V at room temperature were studied. Even though the fatigue plots in
Figure 2 show fatigue anisotropy, specimens of all three AM build orientations exhibited similar fatigue fractures as shown in
Figure 3 and
Figure 4 for 45º and 90º AM build specimens. Similar images for the 0º AM build specimen can be found in [
19].
Further, the 45º and 90º AM build specimens exhibited more significant cleavage on the fractured surfaces compared to the 0º AM build specimen. Other fracture features such as dense striations in the alpha matrix (
Figure 4b,f) and broken TiB particles were observed in all three AM build direction specimens. These dominant fracture features are given in
Figure 4 for 45º and 90º AM build specimens and can be found in [
19] for 0º AM build specimens. Moreover, TiB particles in all the tested specimens generally showed no striation marks when they were observed under SEM. However, it can be seen from
Figure 4d that the higher magnification BSE image shows slight signs of striations in a TiB particle that is heavily surrounded by frill like features. This observation suggests that when the TiB particle blocks the moving pores, there is also a discernible degree of plastic deformation during fatigue.
When considering the impact of TiB particles on the fatigue fracture of the tested AM alpha Ti alloy containing TiB particles, it is evident from
Figure 5b that the TiB particles undergo significant fracture in comparison to the alpha Ti matrix. Further, the SEM images in
Figure 6 reveal several characteristics of TiB particles: (i) there is a slight preference for the TiB particles to sit near the grain boundaries of the alpha Ti grains (
Figure 6a,b) (ii) there is a preference for them to be in and around alpha Ti grains with a particular texture (
Figure 6a–d) (iii) clustering in the alpha Ti matrix (
Figure 6e–g). These microscopic observations, along with those presented in
Figure 3 and
Figure 5b showing major surface crack propagations and significant fractures in TiB particles, respectively, suggest that the distribution of TiB particles is a factor in determining the isothermal fatigue life of AM Ti-TiB MMC. For instance, when a surface crack initiates at a site with cluster of TiB particles it will propagate easily as they exhibit significant fracture compared to the alpha Ti matrix. Moreover, it can be seen from
Figure 6g that, compared to the TiB particle distributions observed in materials built with 45º and 90º AM build orientations, as shown in
Figure 6e and f respectively, the particle distribution in the 0º AM build material exhibits a distinct and layered pattern of TiB particles. From this observation of TiB particles in the alpha Ti matrix along with their significant fracture during fatigue, this study suggests that the distribution of TiB particles during PTA SFFF contributed to the observed fatigue anisotropy as well as for the lowest fatigue along 0º AM build compared to 45º and 90º.
In addition to the experimental fatigue and microscopy investigation presented in the present work, fatigue life calculations were carried out to evaluate the predictability of the modified Paris’ equation presented in [
19] by the authors of this manuscript. In this regard, directional isothermal fatigue of AM Ti-TiB MMC were calculated using Paris’ (Equation (1)) and modified Paris’ equations (Equation (2)).
In the above equations,
and
denote the calculated number of cycles to failure using Equations (1) and (2) respectively,
denotes the stress intensity modification factor,
and
are material constants (that can found from the literatures),
and
refers the initial and final lengths of the surface crack,
is applied stress, and
refers the number of major surface cracks propagated. As described in [
19], the values of
for the best prediction by Equations (1) and (2), denoted respectively by
and
, can be found through least square error minimization and their closed form expressions are respectively given by Equations (3) and (4).
where
for
number of experiments.
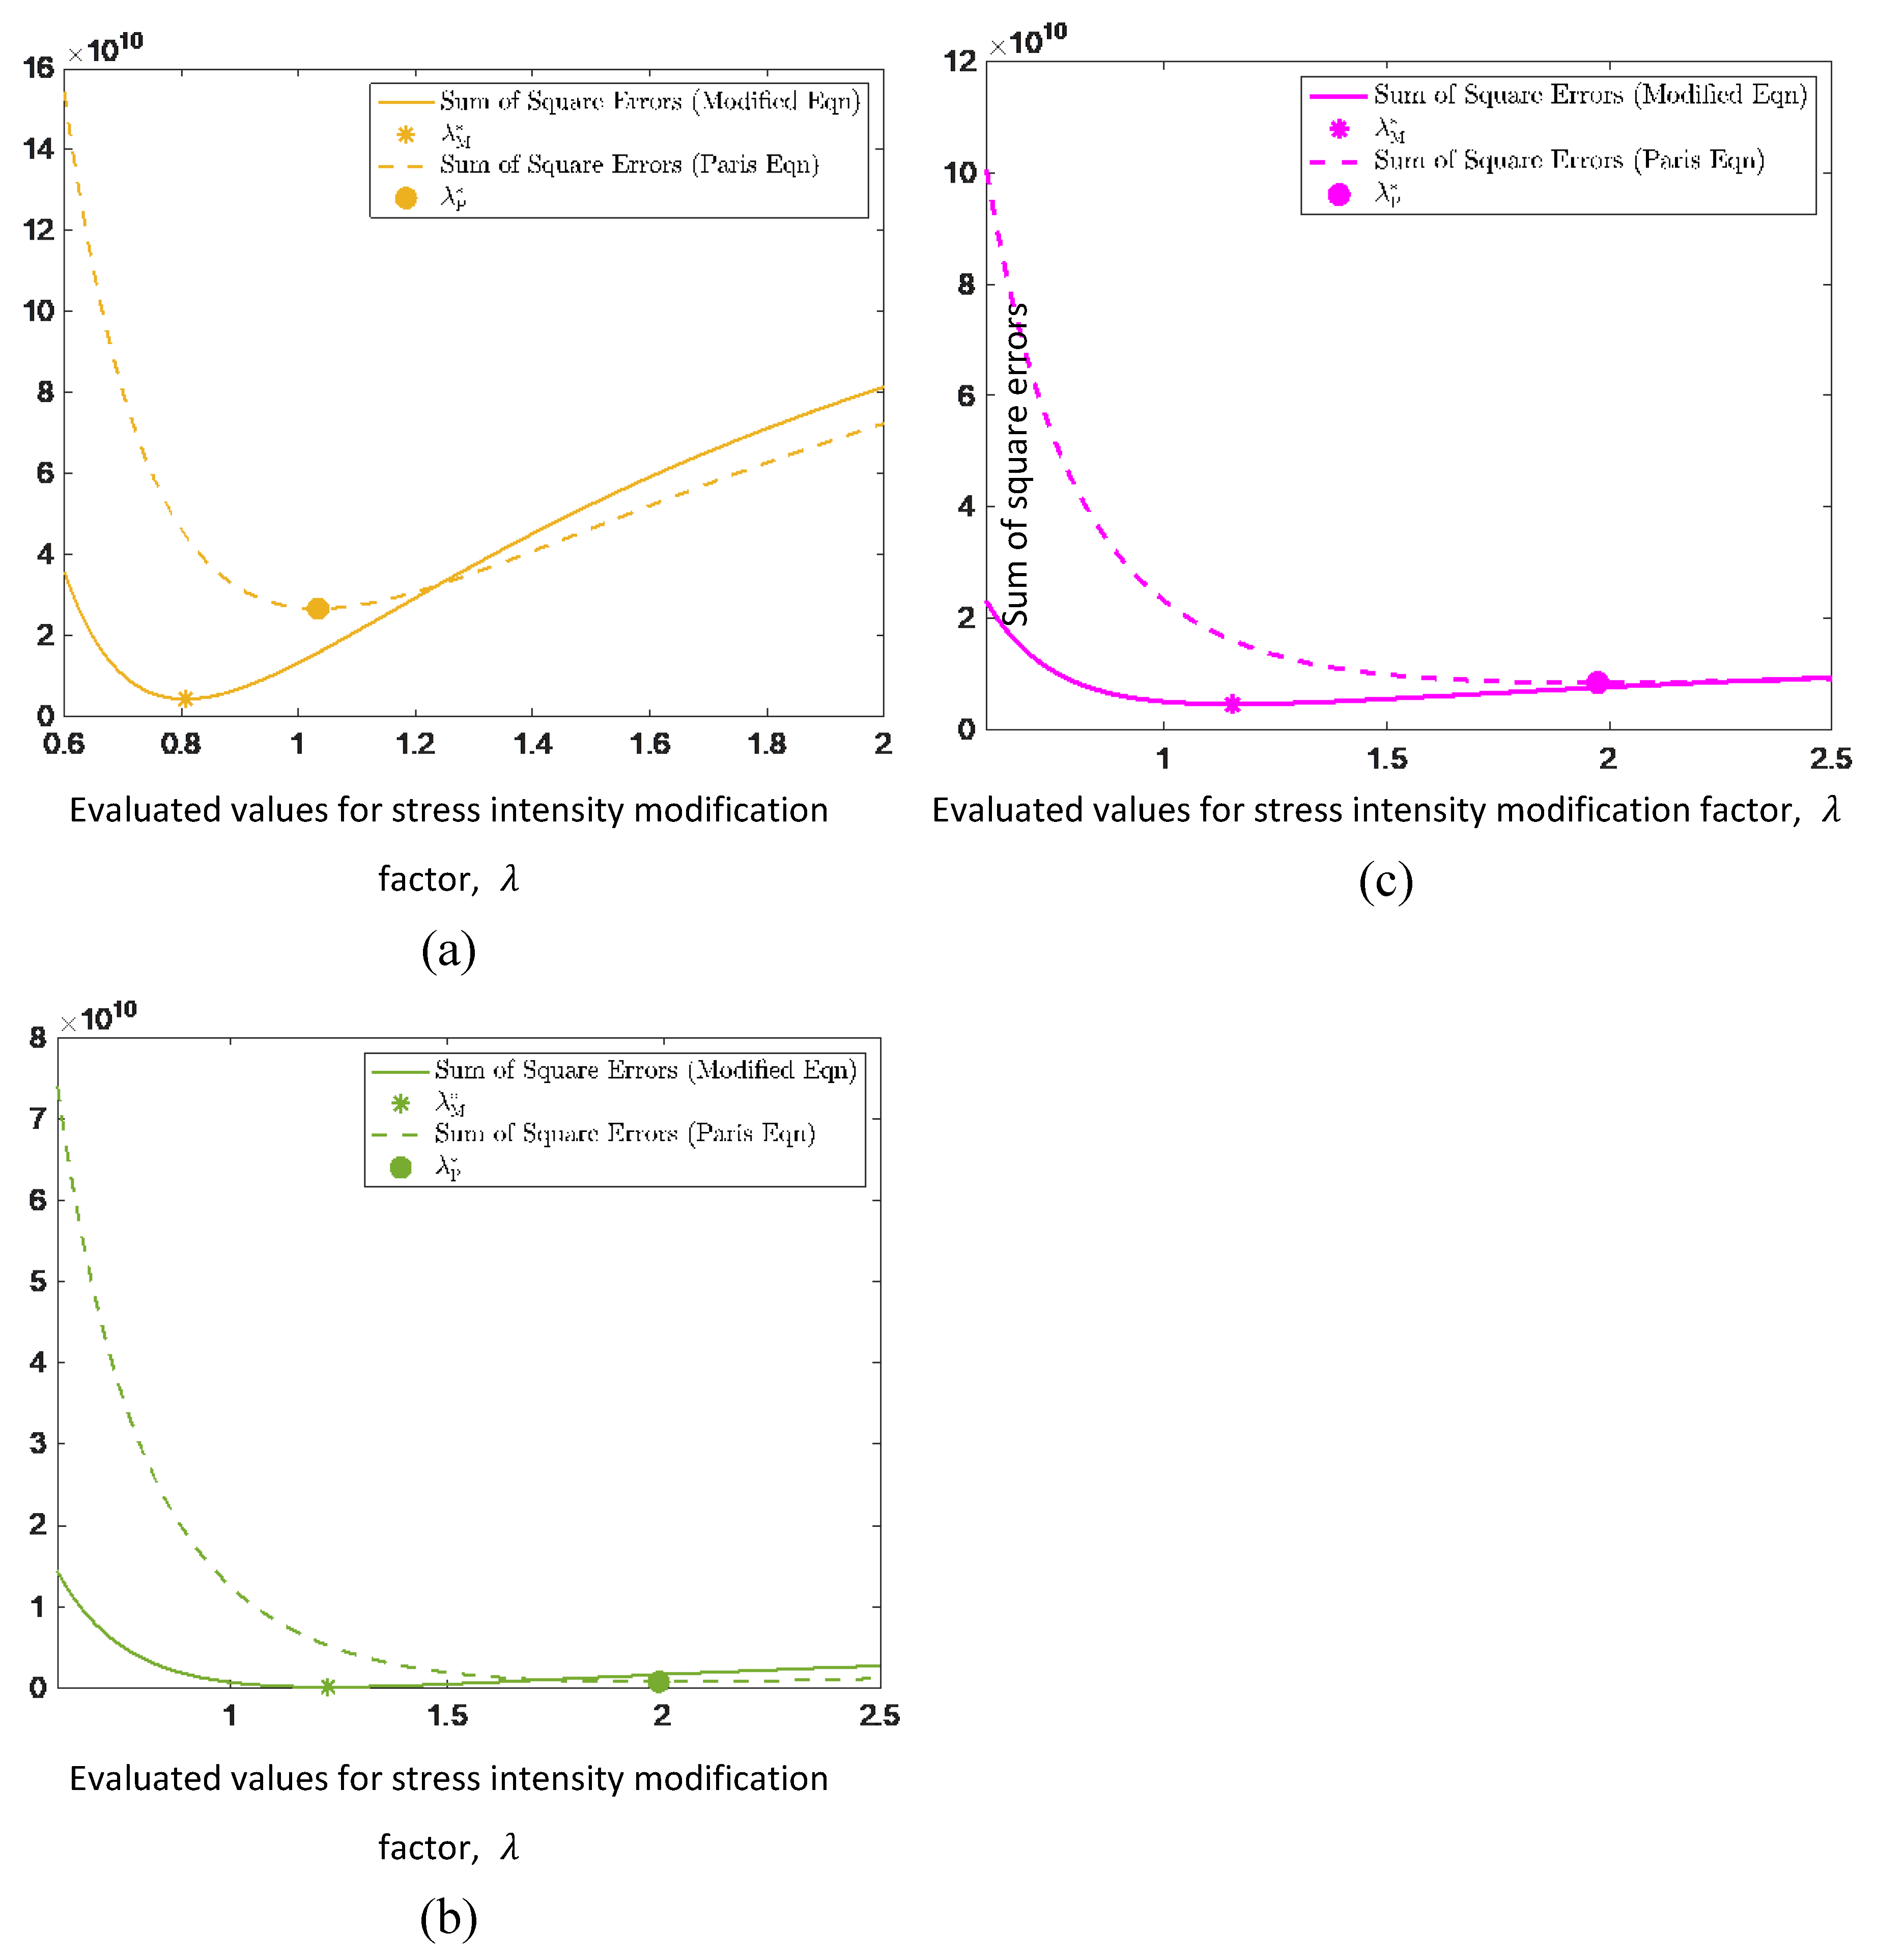
The evaluation of
and
in 0º, 45º and 90º AM build orientations, using Equations (1) and (2) are illustrated in
Figure 7 and their values are tabulated in
Table 1.
It can be noted from
Table 1 that, the evaluated values for
and
for 45º and 90º AM build directions are almost the same and higher than that for 0º. Since the stress intensity modification factor,
depends on the initial crack characteristics, the similar
and
values suggest that both 0º and 45º AM build specimens had similar crack initiation characteristics.
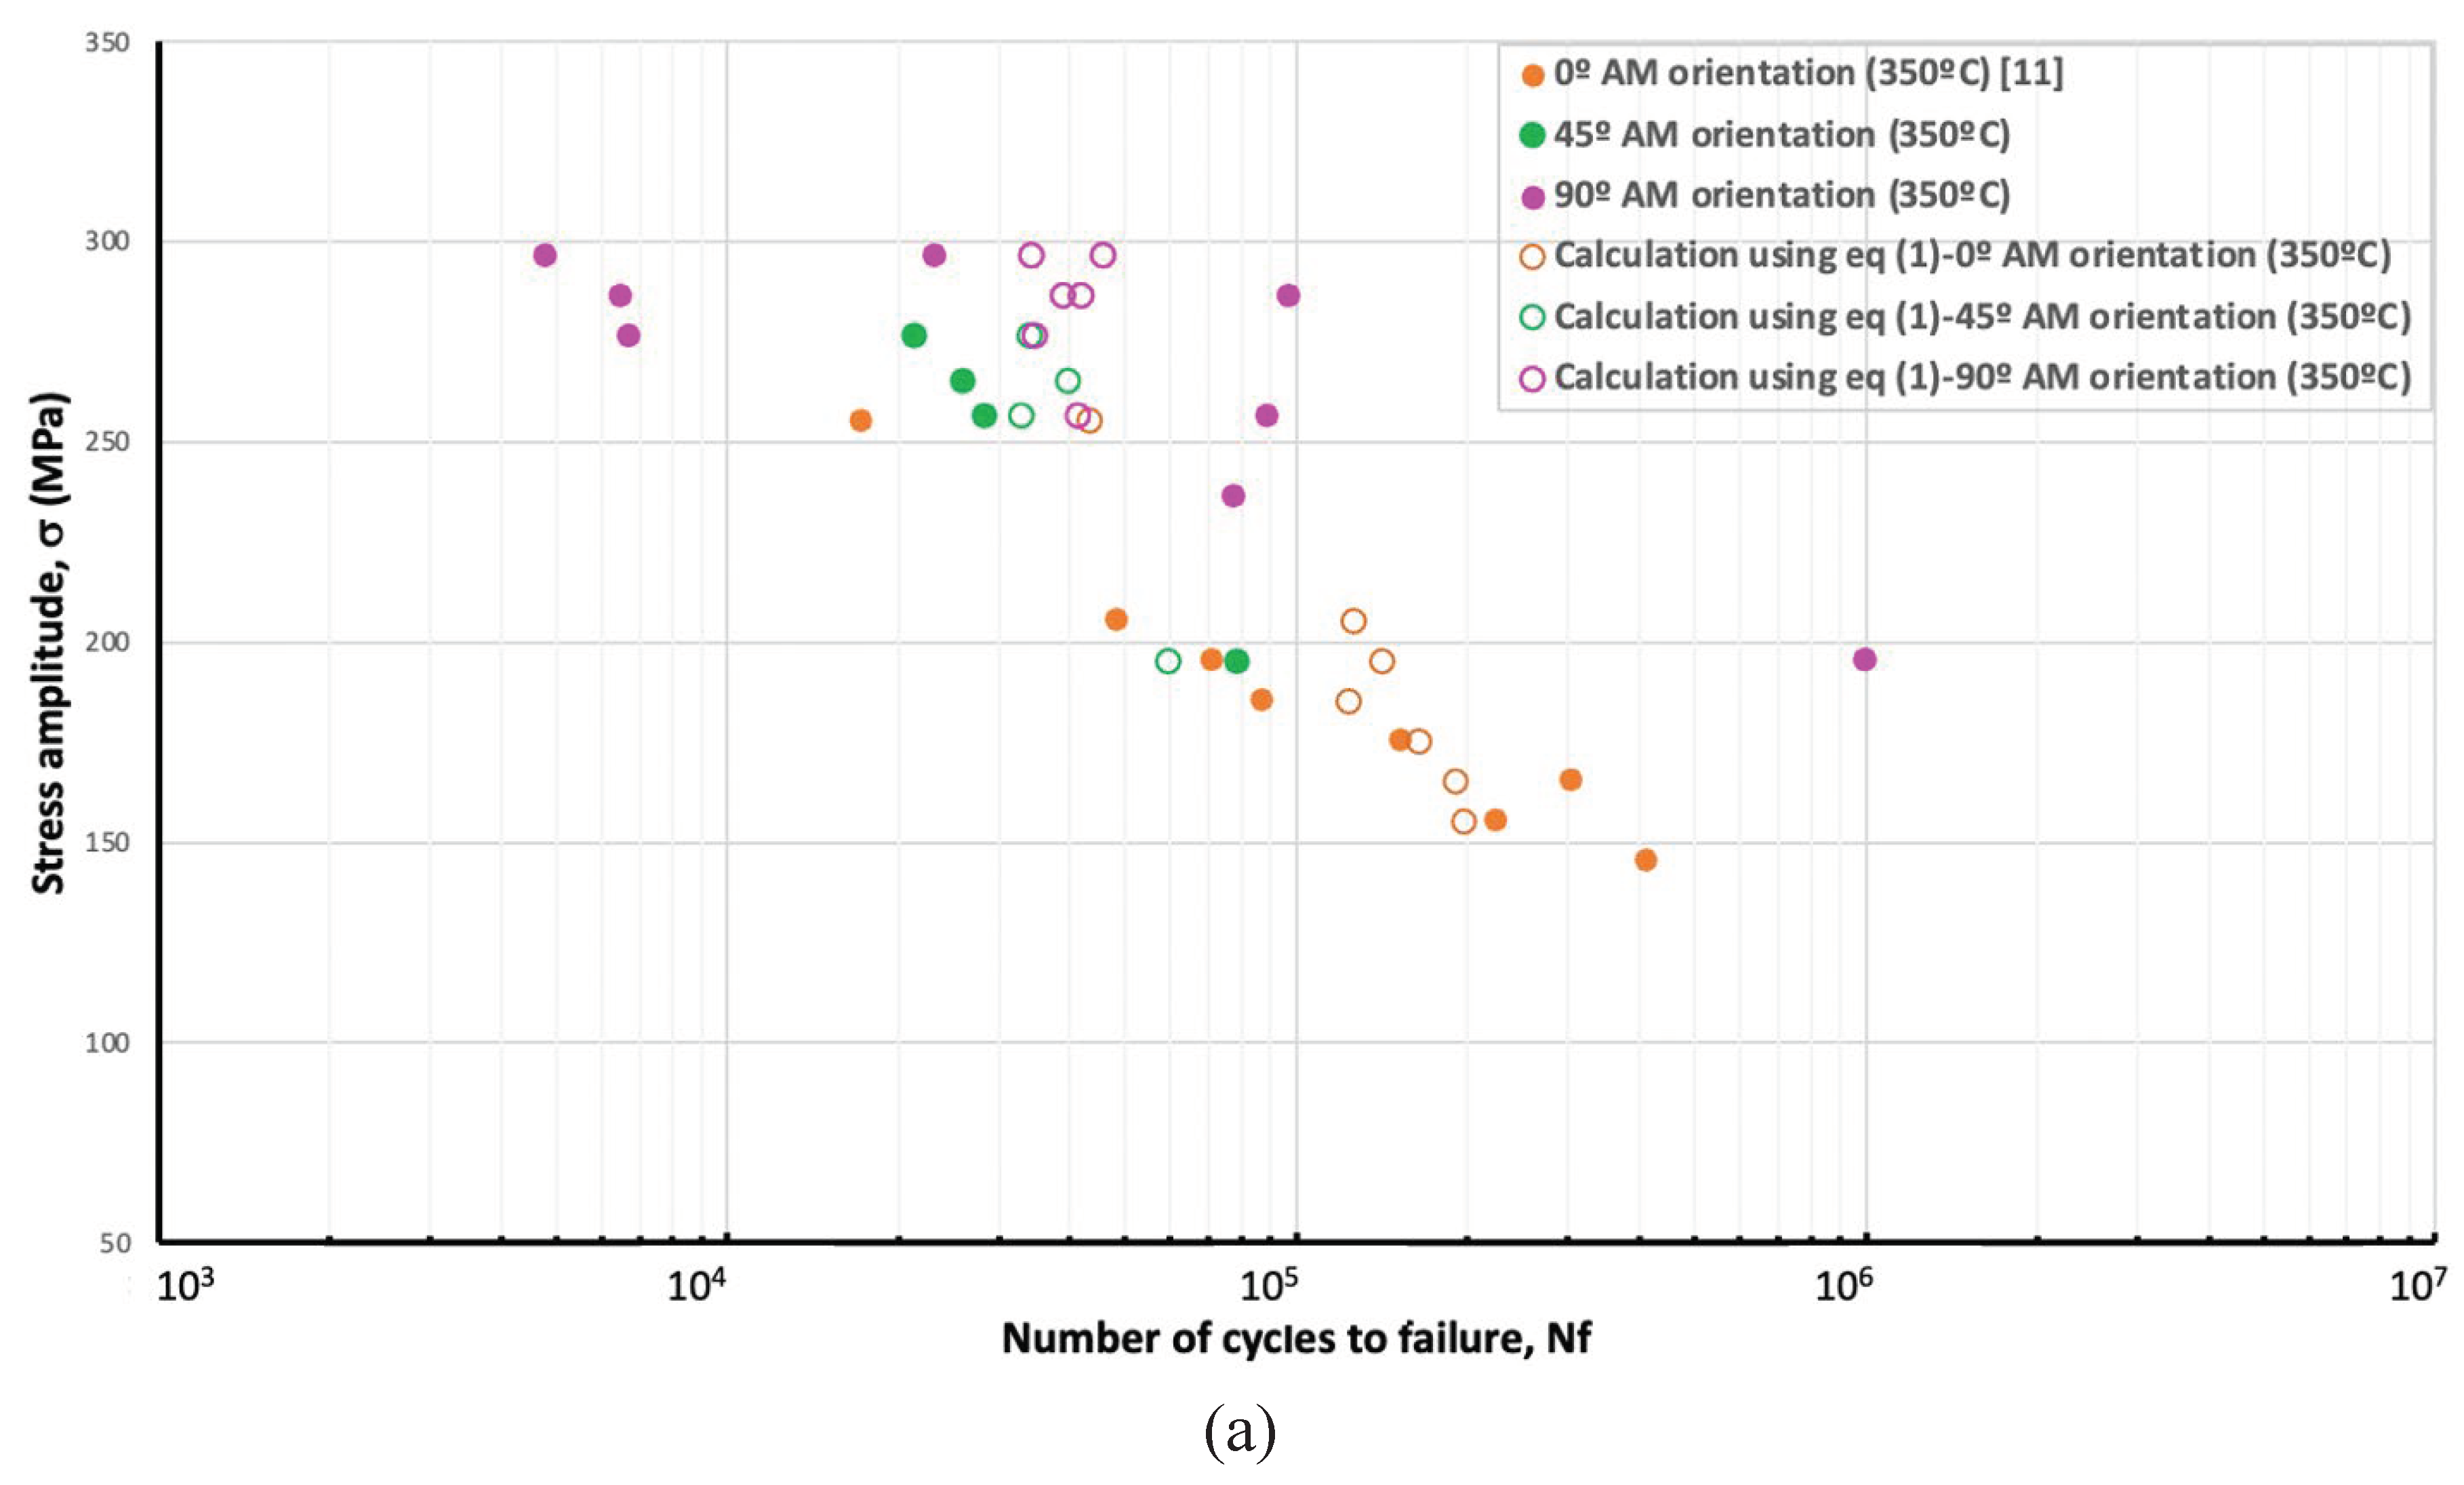
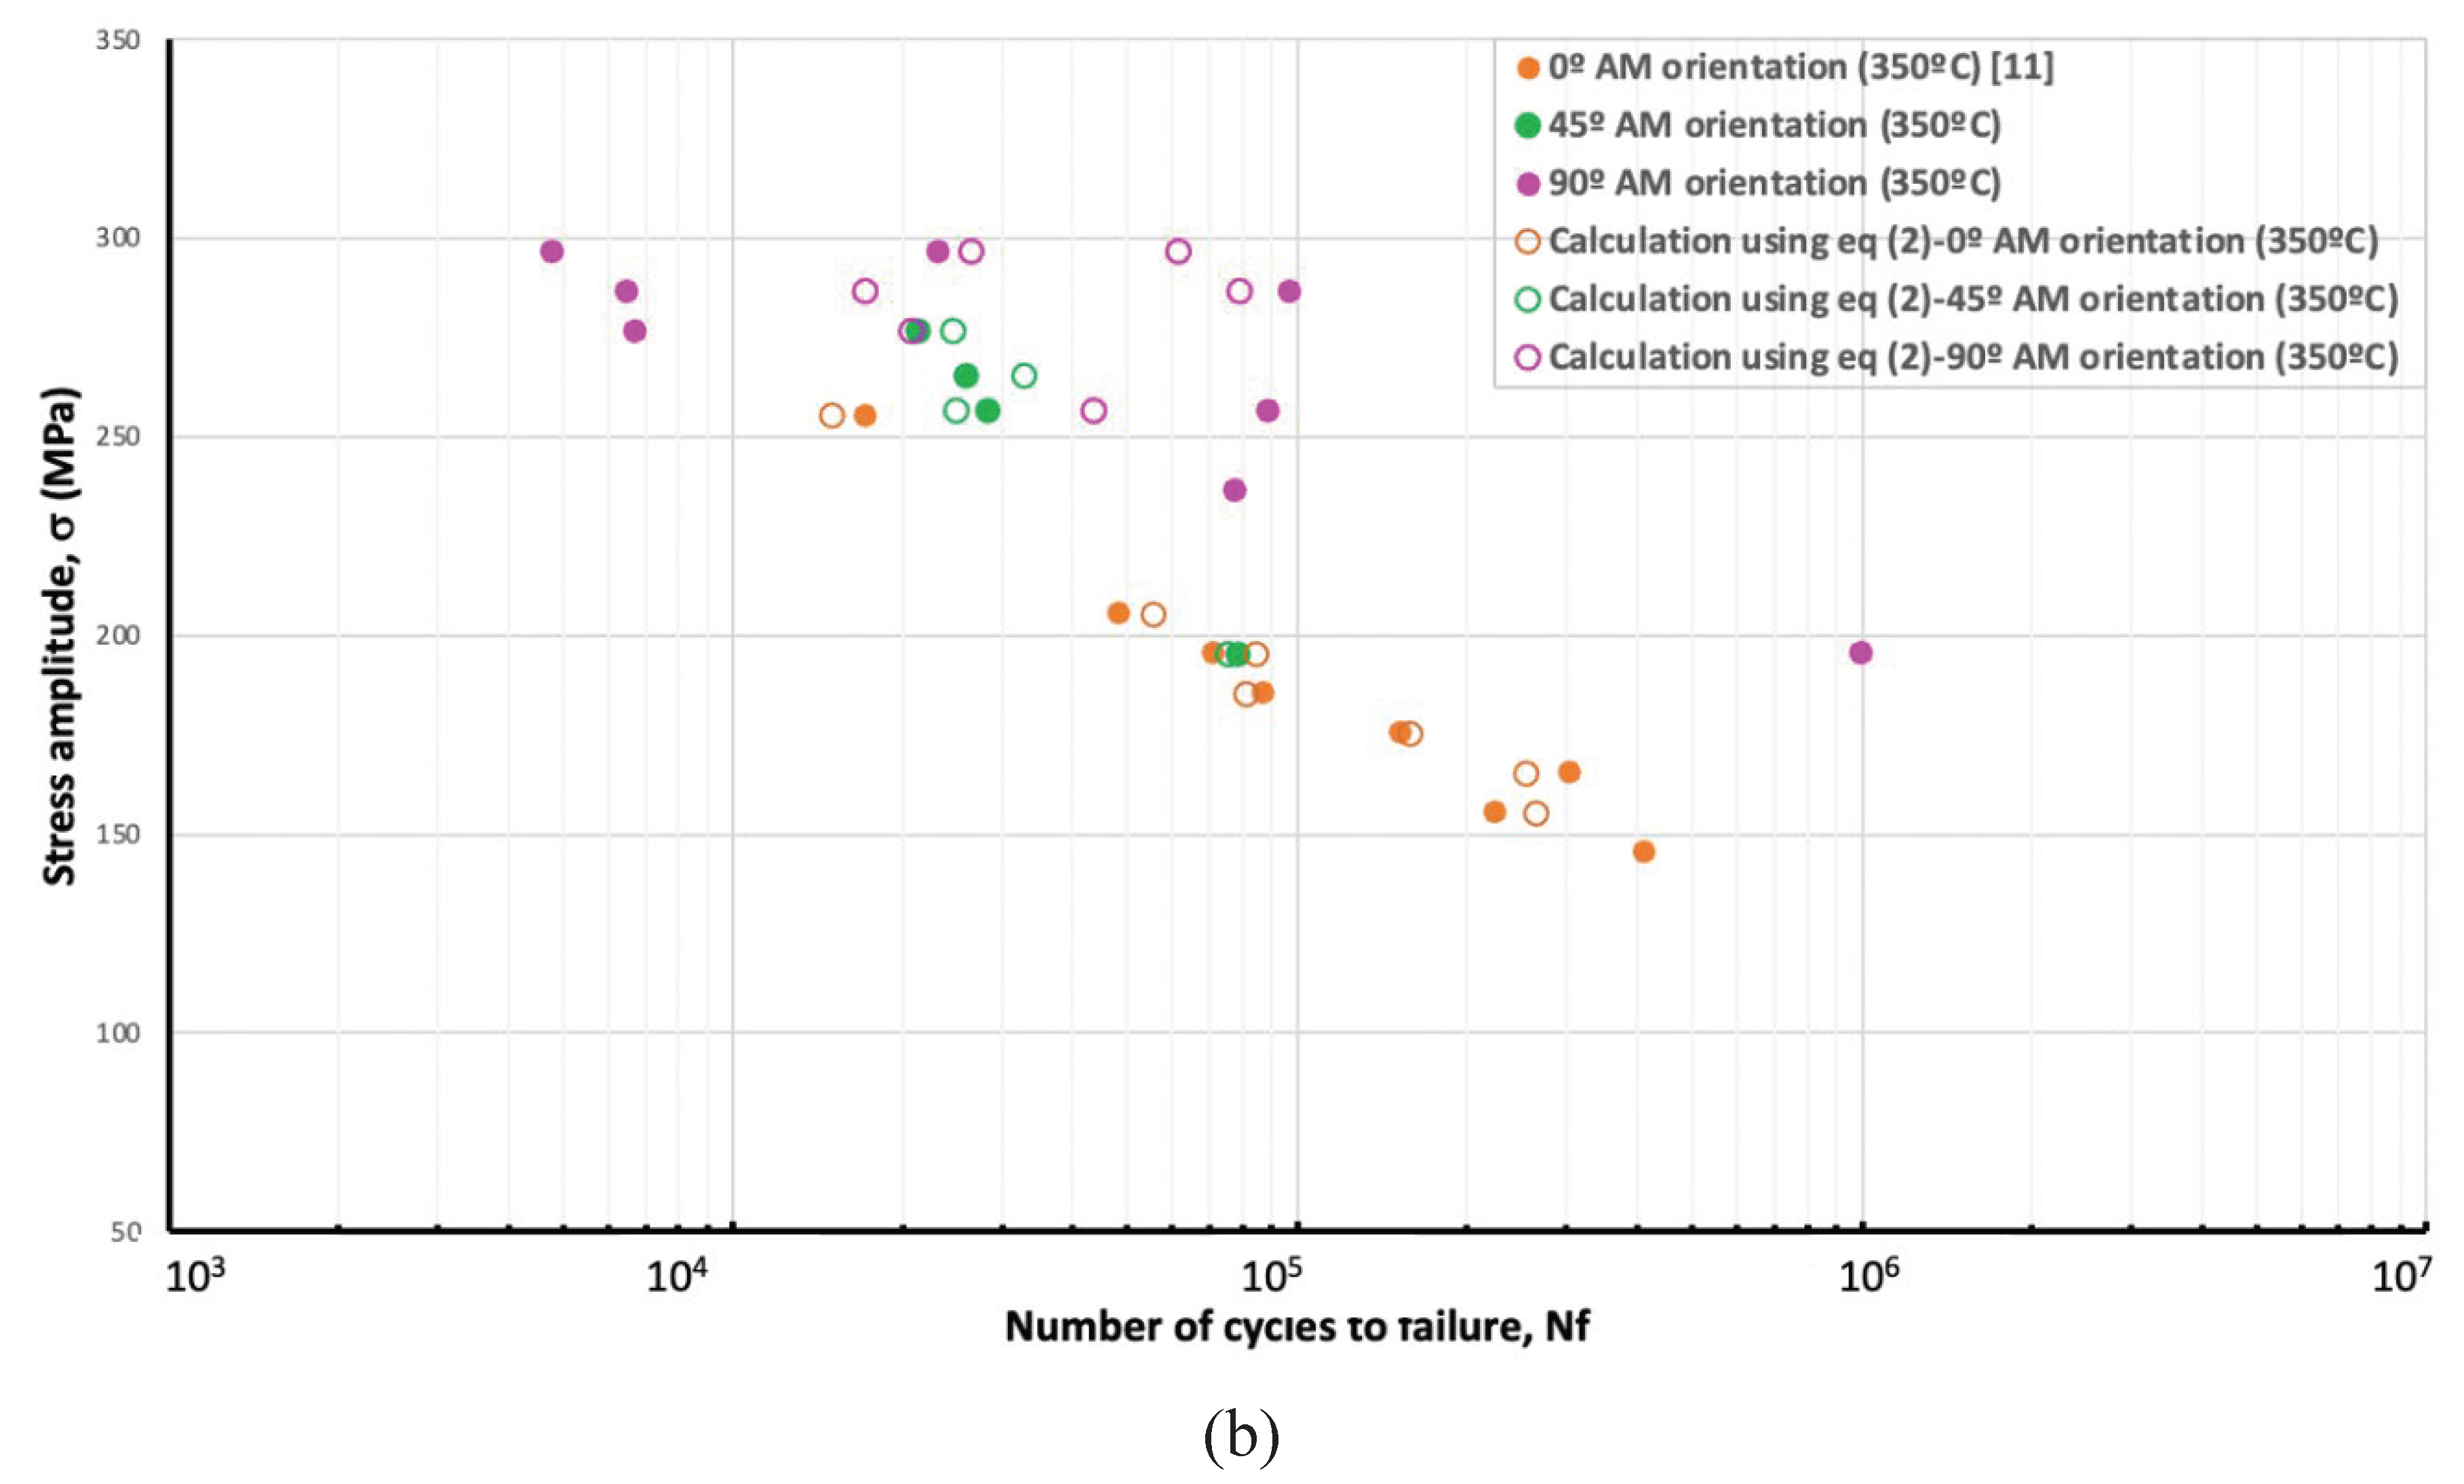
Moreover, using the values listed
Table 1 for the modifications factors for 0º, 45º and 90º AM build orientations, and by taking the values for
=
, and
=
, fatigue calculations were performed using Equations (1) and (2) and they are illustrated as S-N plots in
Figure 8 along with experimental data from the current work as well as from the work reported in [
19]. Furthermore, according to the description for
given in [
19], the initial surface crack length,
and the value of
are inversely proportional. Hence, the lower values for
and
in
Table 1 suggest larger surface crack initiations and lower fatigue values. This is evidenced by the smaller
and
values (
Table 1) and lower fatigue strength (
Figure 2) observed in 0º AM build directions compared to that in the 45º and 90º orientations. Further, the quality of these fatigue life calculations by Equations (1) and (2) were evaluated in terms of
and tabulated in
Table 2. It can be noted from
Table 2 that the
evaluated in relation to Equation (2) are superior to the ones for Equation (1). This finding suggests that the modified Paris’ equation in Equation (2) make accurate fatigue life prediction than by Equation (1).
4. Conclusions
This study finds that the Ti-TiB MMC manufactured by plasma transferred arc solid free-form fabrication (PTA-SFFF) shows fatigue anisotropy. Among the three AM orientations considered in the present study, 90º AM build orientations exhibited better fatigue strength compared to those with 0º and 45º orientations.
Electron microscopy images obtained from the fractured specimen surfaces reveal that the final fracture in all three AM build directions occurred due to several large surface crack propagations. Also, these images show considerable cracks in TiB than Ti matrix. Further, the microscopy images obtained from the polished and etched specimen show frequent TiB clusters in in all three AM build directions. However, 0º specimen exhibited significantly different variation of TiB distribution, possibly between each AM build layers. These images also reveal that the TiB particles are preferably distributed along the matrix grain boundaries.
The fatigue calculations performed in the present work finds that the modified Paris’ equation, that incorporates the contribution from the number of large surface crack propagations, accurately predict the fatigue life of Ti-TiB MMC manufactured via PTA-SFFF in all AM build directions. This finding suggests that this modified Paris’ equation can be used for any AM material that exhibits significant number of surface crack propagations. Moreover, the lowest value calculated for the stress intensity modification factor for 0º AM build orientation supports the lowest experimental fatigue recordings and the significant TiB clusters in microscopy images. Furthermore, almost same values of stress intensity modification factor calculated for 45º, and 90º AM build directions. This finding suggests similar crack initiation characteristics in these AM build directions.
With regard to the crack initiation sites, no specific metallurgical factors identified in this work. Hence, an advanced image analysis that can reveal atomic level characteristics is required to investigate crack initiation. Furthermore, to investigate the crack propagation behaviour under isothermal fatigue of Ti-TiB MMC, more experiments are required.
