1. Introduction
The earliest research on material fatigue dates back to the industrial revolution in the mid-nineteenth century and Wöhler was the first to conduct systematic studies on fatigue [
1]. The first work on fatigue of concrete dates back to the end of the nineteenth century [
2]. At the beginning of the twentieth century, real concerns about structural fatigue emerged in civil engineering, mainly related to metallic structures. This concern in particular first began to be triggered by the occurrence of catastrophic failures in some structures, the explanations of which remained unsolved by classical mechanics. Fatigue in concrete is a progressive process of formation and growth of microcracks, which results in a change in the mechanical properties of the matrix, a decrease in stiffness and an increase in the total deformation, which eventually leads to the failure of the concrete. Despite the fact that concrete is primarily used in statically loaded structures, it is becoming increasingly prevalent in dynamically loaded structures. The gravitational and acceleration forces of automobiles and trucks on roadways and bridges, engine vibrations exerting forces on foundations, forces caused by wind gusts, or periodic impact forces from ocean waves impose numerous repetitive loads on concrete structures. These cyclic loads can lead to fatigue damage, even though all loads are far below the static strength of the material. In the case of concrete bridges, wind turbines and offshore structures, the highest numbers of load cycles occur, where 100 million load cycles and more can occur during the planned technical service life. Consequently, a thorough understanding of the fatigue behaviour of concrete in the long-term service life is required.
Fatigue is of surging concern in civil engineering, especially for concrete structures with enhanced mechanical properties such as high performance concrete (HPC). HPC is envisaged as a high-strength concrete consisting of ordinary Portland cement, water, super-plasticizer and aggregates, featuring a water-cement ratio of less or equal to 0.4. A dense microstructure with a high packing density is a basic prerequisite for the production of high-performance concrete. Due to the reduced self-weight, the HPC structures are more susceptible to vibrations. This aspect entails that variable loads of a cyclic nature such as live loads, wind, earthquakes, etc. are of increasing relevance [
3].
In the present study, three materials are considered individually for experimental investigations of fatigue loading on HPC at the mesoscale, namely, high-performance concrete with basalt (HPC-B), high-performance concrete with gravel (HPC-G), and high-strength coarse mortar (CM). Fatigue loading can be categorized into low-cycle and high-cycle loading. When structures are subjected to an earthquake or seismic load, they experience few cycles, and the structural materials typically undergo much higher stresses and strains than those typically encountered during standard cyclic loading. To observe the behaviour of concrete under these high strains, a displacement-controlled low-cycle fatigue test is employed in the current study. Conversely, high-cyclic loading is categorised by the introduction of a large number of low-stress load cycles and often originates from automobile traffic on bridges and roadways, railroad traffic on bridges and concrete ties, or aircraft on airport pavements. In order to study such behaviour on HPC structures, a force-controlled high cycle fatigue tests are performed. Wöhler testing or S-N concept is a well-known and frequently applied technique to study the high cycle fatigue. The fatigue expressions based on the well-known S-N concept have been developed and reported in the literature [
4]. Furthermore, prior to cyclic tests, the static response of the tests is first used to calibrate the main material parameters, such as ultimate load, fracture toughness and fracture energy. In addition, the experimental determination of the fatigue behaviour of concrete in the range of 10
8 cycles is very time consuming. For example, testing a single concrete specimen at a typical test frequency of 10 Hz takes about four months, and several experimental attempts are required to obtain a statistically reliable data set. Due to the very long testing times, the fatigue data of concrete compositions in the current work are therefore limited to 2 × 10
6 load cycles.
In recent years, increased efforts have been directed towards demonstrating the influence of different types of aggregates on the fracture behaviour of high-performance concrete. The work of Loeffler et al. [
5] has been instrumental in identifying how different durations of loading affect the initiation of damage within HPC, shedding light on the sensitivity of these materials to varied stress durations. Simultaneously, research by Ukpata et al. [
6] have explored how aggregates affect HPC’s durability, while Guo et al. [
7] investigated fracture mechanics under cyclic loads using the phase-field method. Efforts by Yehia et al. [
8] to analyse the impact of aggregate composition and concrete strength have led to improvements in HPC’s performance. Güçlüer [
9] focused on how aggregate texture affects HPC’s fatigue resistance. Additionally, Mechtcherine et al. [
10] delved into HPC’s robustness under cyclic stress, Oneschkow et al. [
11] examining compressive fatigue behaviour, broadening our understanding of HPC’s resilience. Giaccio et al. [
12] investigated the role of aggregates on fracture behaviour of HPC and their findings indicate that the fracture energy G
f of the concrete increases with increasing aggregate size and strength of the concrete, with shifts in peak load depending on aggregate type and size. The fracture behaviour of Portland cement concrete as a function of compressive strength and water-cement ratio (w/c) is generally acknowledged, however, Wu et al. [
13] observed that other parameters such as size, shape, surface texture and volumetric fraction of the aggregate also contribute to the fracture properties of hardened concrete. Malhotra [
14] pointed out the need to use a standard method for determining tensile strength (f
t) in concrete. It is indicated in the ACI report in 1986 [
15] that direct and indirect tensile tests can be carried out to determine the f
t of normal concrete. However, owing to the complications of performing a stable and representative direct tensile test on a plain concrete specimen, it was recommended that no standard test should be performed, i.e., the Uniaxial Tensile Test (UTT) may be the simplest approach for estimating the f
t of concrete material. Wittmann et al. proposed a Three-Point Bending Test (TPBT) interpretation in terms of fracture mechanics combined with a method for f
t-extraction (by inverse analysis) [
16]. To determine the fracture parameters, TPBT were carried out on notched beams of HPC by Einsfeld et al. [
17]. The results obtained with the work of fracture method indicate that the fracture energy increases with increasing compressive strength of the concrete, while the fracture energy determined with the size effect method tends to decrease slightly with increasing compressive strength. However, due to the fact that the TPBT specimen cannot be drilled out of an existing structure, it is inherently challenging to use this test to evaluate structural integrity. These disadvantages and the large amount of elastic energy stored in the beam led to the formation of Subcommittee B within RILEM (International Union of Laboratories and Experts in Construction Materials, Systems, and Structures - TC 89-FMT) with the main objective of proposing an alternative test method to the TPBT [
18]. As a result, a simple “compact” shaped specimen or wedge split test (WST) was recommended as an alternative test method.
In this study, based on the wedge split test (WST), a special form of compact tensile test according to the American Society for Testing and Materials (ASTM), shown in Figure 3, the methodology of this test is to split a compact specimen with a notch and a predefined crack into two parts and monitor the load and crack opening displacement (COD) so that no additional sensor is required to record the displacement. Such a method is indirect and results in a global P-w (Load-COD) curve from which a suitable analysis of the P-w relationship can be established. The inherent simplicity, stability and compact dimensions of a modified disc-shaped compact tensile specimen (MDCT) make MDCT a practical test method. Furthermore, the MDCT specimen can be conveniently prepared under laboratory conditions or extracted directly from an existing structure for further examination. Further details on MDCT are discussed in section 2.2. In addition, the emphasis of static and cyclic loading on the fracture mechanism and residual strength of high-performance concrete containing different aggregates is presented. The understanding of how concrete compositions with different aggregates behave under cyclic loading, which often occurs during repetitive loads from automobiles (high cycles) and earthquakes (low cycles) on slender HPC structures, is critical for integrating these aggregates into structural design of HPC. Furthermore, the crack opening displacement (COD) and deformations of the MDCT specimen during the test are examined by means of 3D digital image correlation equipment ARAMIS from GOM (Gesellschaft für Optische Messtechnik/ Society for Optical Measurement Technology). The changes in the mesostructure and the damages inflicted by static and cyclic loading such as a crack pattern, failure mechanism are examined using computed tomography (CT) technology. This work presents an original view on the behaviour of high strength concrete compositions with different aggregates subjected to these extreme loads and contributes to a more comprehensive understanding of the appropriate applications and limitations of high strength concrete compositions with different aggregates used in structural applications.
2. Experimental Investigation
This section describes the materials, the casting of the test specimens, the test setup and the experimental approach. In order to investigate the effects of aggregate constituents on the fracture mechanical properties of HPC, three HPC compositions with different aggregate constituents and maximum aggregate size have been analysed. Static tensile, high cycle and low cycle fatigue, and residual strength tests are performed to investigate the influence of the morphological properties of the aggregate on the fracture mechanical and fatigue behaviour of all the three aforementioned material compositions.
2.1. Materials
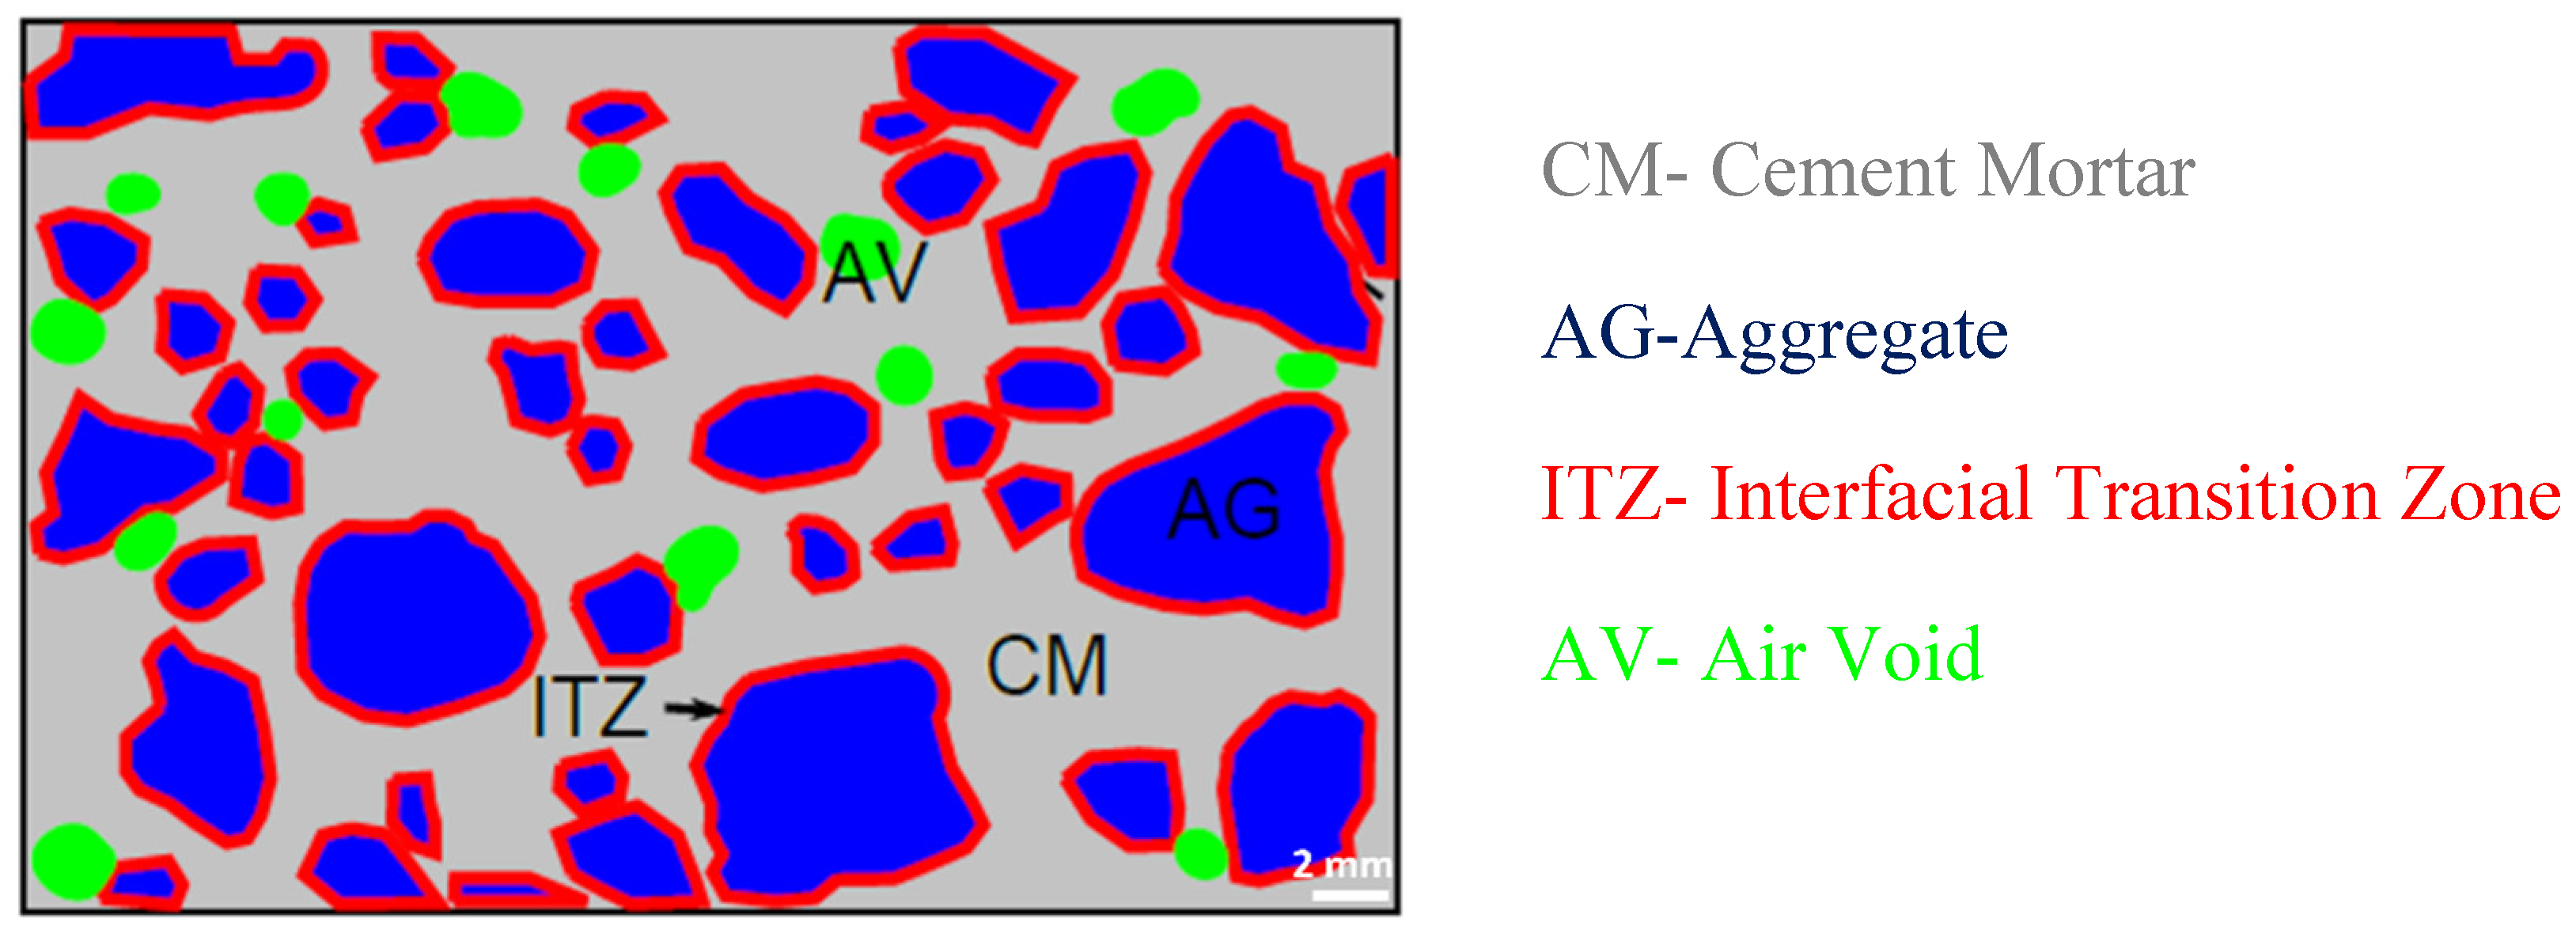
Here, HPC is intended as a high-strength concrete consisting of ordinary Portland cement, water, superplasticizer and aggregates and having a water-cement ratio of 0.35. The proposed MDCT specimens are subsequently cast, based on the specifications of ASTM standards. The three materials are considered individually for experimental investigations at the mesoscale, namely, high-performance concrete with basalt (HPC-B), high-performance concrete with gravel (HPC-G), and high-strength coarse mortar (CM). The basis is a high-strength concrete composition, from which a high-strength concrete equivalent mortar composition is developed in accordance with the concept of excess paste theory. The purpose of the study is to experimentally analyse the fatigue crack growth in HPC while focusing on the mesoscale. The mesoscale is delineated as the scale in which the concrete is considered to be comprised of aggregates above a size threshold of 2 mm to be suitably specified, pores (air voids) above the same size threshold, cement mortar, and interfacial transition zone (ITZ) mortar (i.e., the region of the material at the interface between aggregates and cement mortar). The schematic representation of the mesostructural composition of HPC is illustrated in the
Figure 1.
The designated HPC consists of ordinary Portland cement CEM I 52.5 R, aggregates with a maximum size of 8 mm and water-cement ratio of 0.35. A polycarboxylates-based superplasticizer and stabilizer are used to achieve the desired workability. For experimental investigations on the mesoscale, three materials are considered individually, namely HPC-B, HPC-G and CM.
The two distinct aggregates (basalt and gravel) are chosen to evaluate the influence of the aggregates on the mechanical properties of high performance concrete. The crushed basalt aggregates are irregular with rough surfaces, while the gravel is naturally rounded and features a smooth surfaces. A concrete equivalent mortar (CM) with the same paste thickness as the reference concrete (HPC-B) is developed to determine the mechanical properties of the bulk material using the excess paste theory. The procedure consists in replacing the coarse aggregate fraction (2mm to 8mm) by a quantity of sand with an equivalent surface area [
19]. As a result, the total surface area of the aggregate to be enclosed with paste will be the same for the mortar as for the coarse aggregates. In addition, the study of CM will provide intermediate results that will contribute to the ultimate goal of understanding the behaviour of concrete. Each individual proportion is mixed in a volume of 60 dm
3 and poured immediately into the moulds. The mix proportions are based on reference composition from [
11] and the corresponding constituents for 1 m
3 volume are shown in
Table 1.
These detailed compositions serve as the foundation for the subsequent experiments and analyses to understand the behaviour of the materials under various conditions.
2.2. Casting of Test Specimens
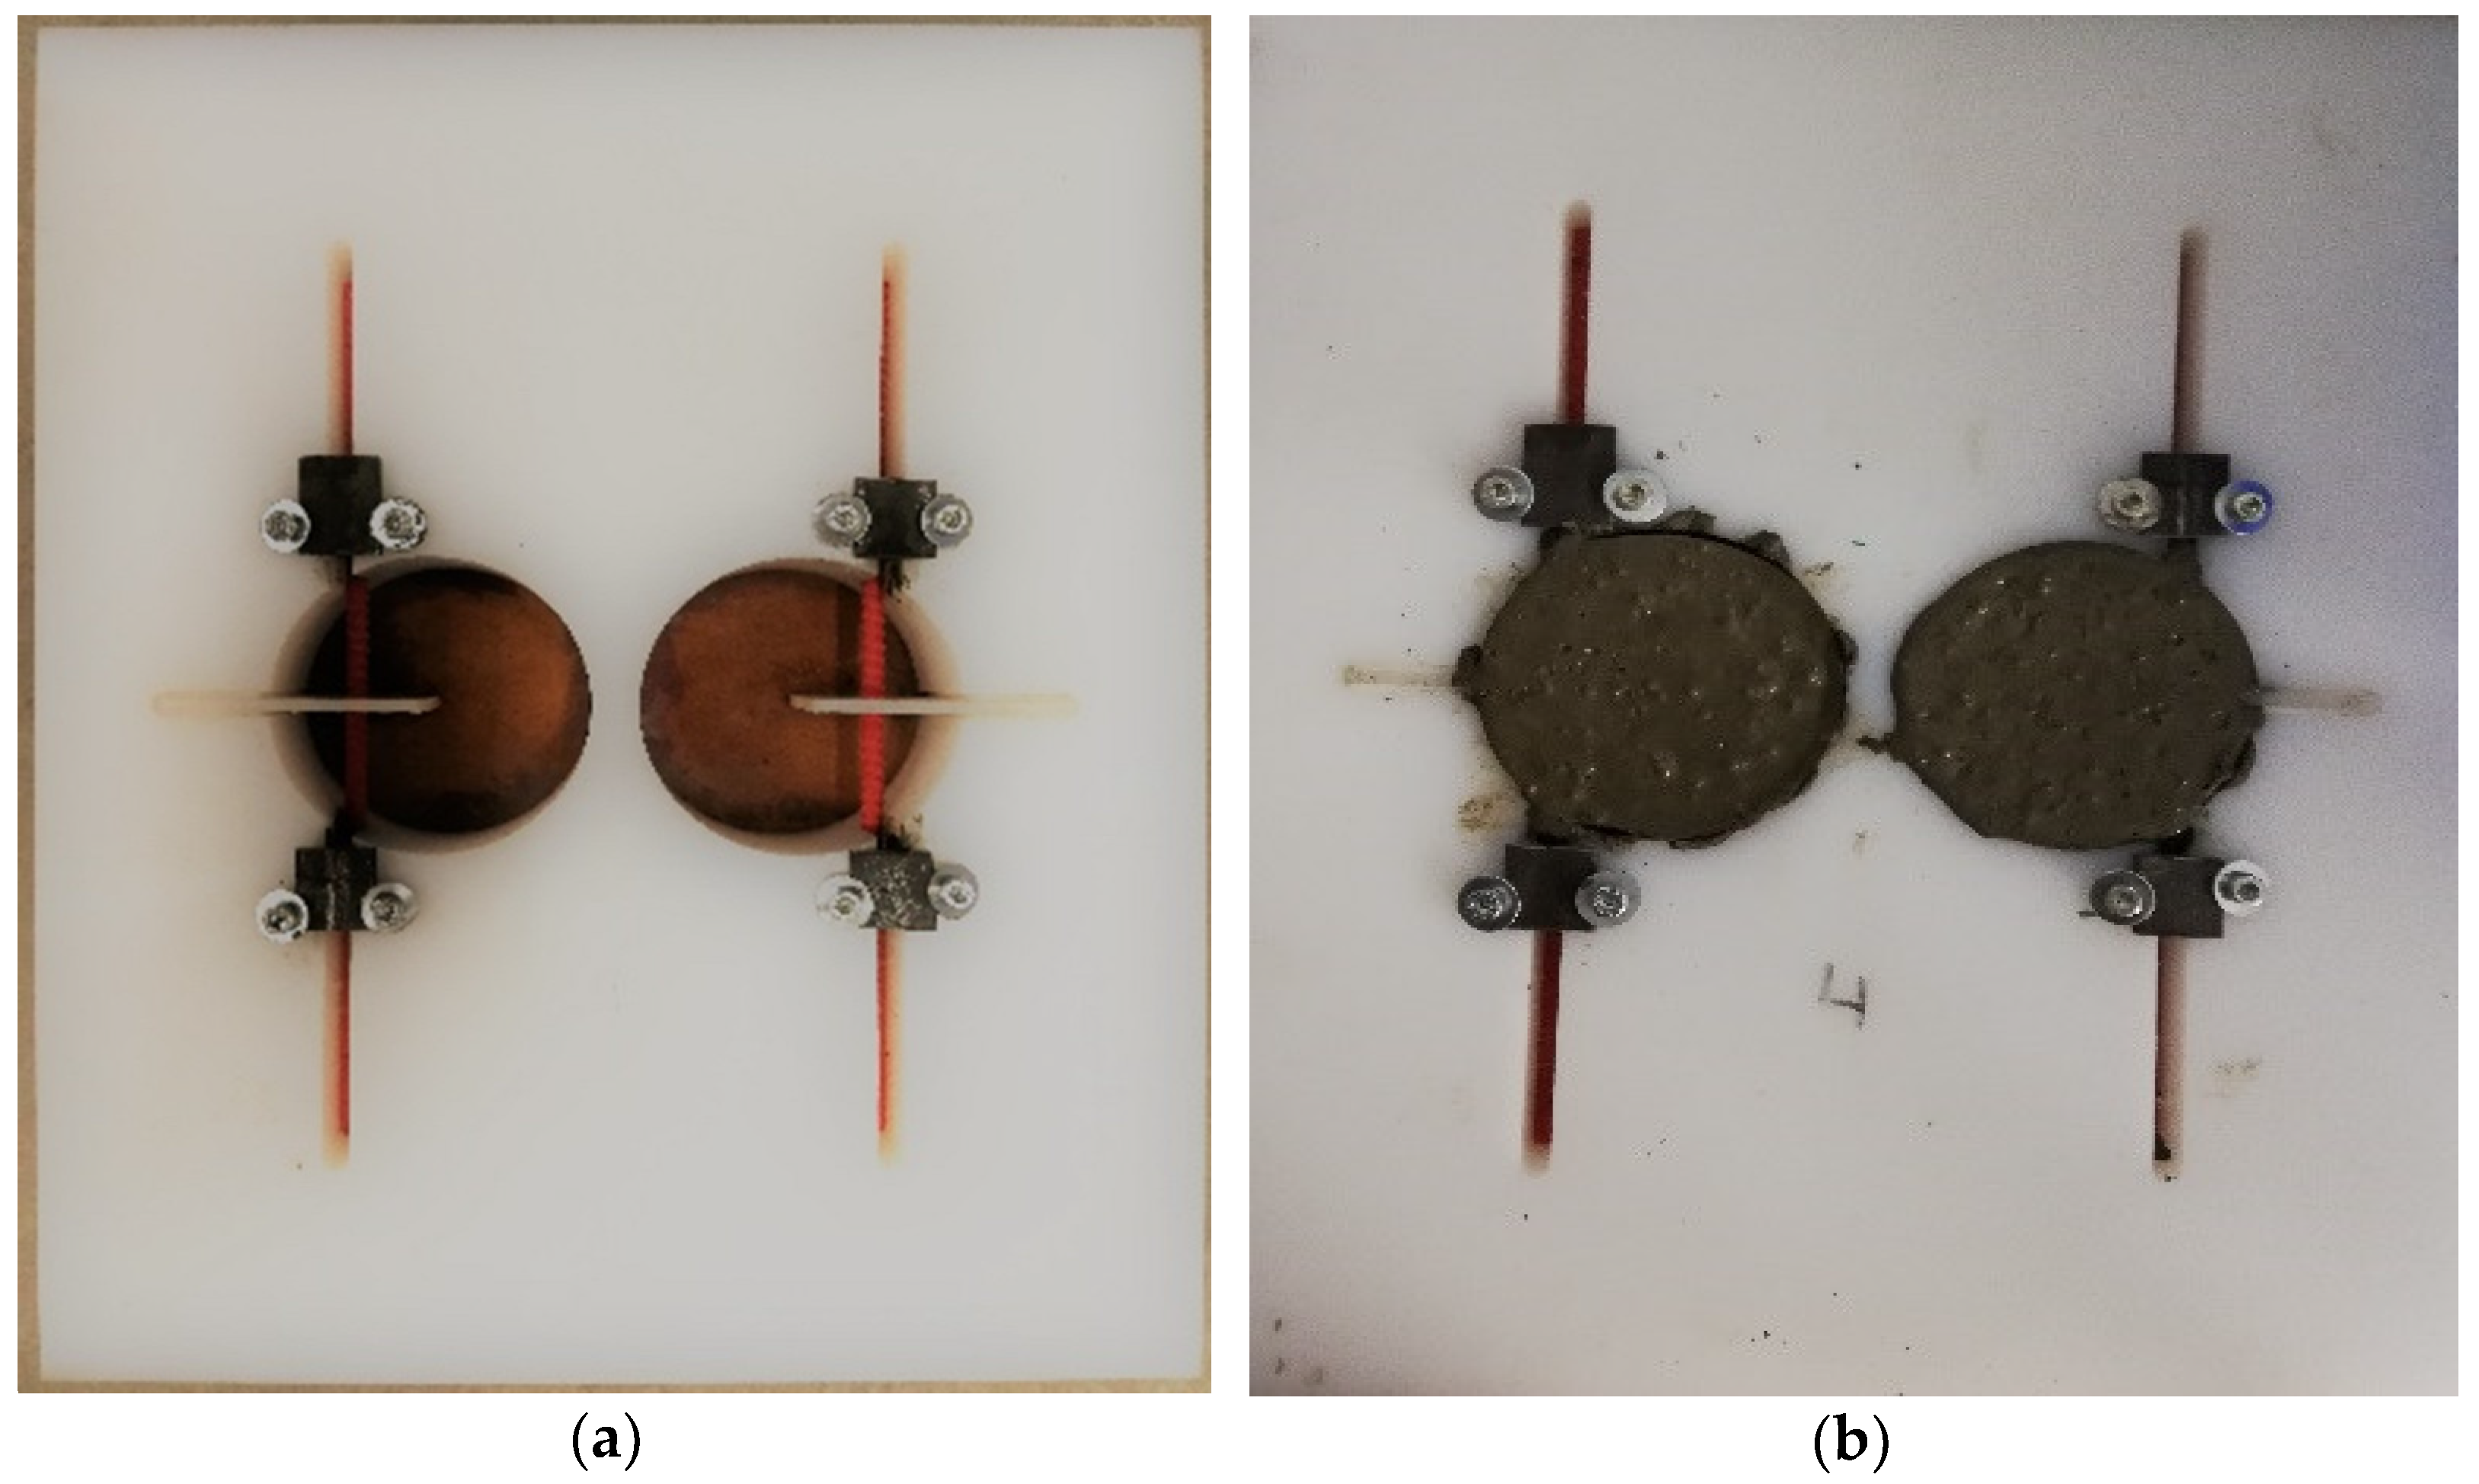
In order to obtain the proposed MDCT specimens, the polyethylene boards PE 1000 are perforated with an internal diameter of 100 mm using a Computer Numerical Control (CNC) drilling machine. Subsequently, the PE boards are further drilled to accommodate pulling glass fibre reinforced polymer (GFRP) threaded pulling bars with a diameter of 8 mm and a notch of 2 mm thickness. GFRP threaded bars are incorporated to evade artefacts in the CT image stacks and to reduce the bending moment at the loading point. The ratio of the notch length to the specimen width (a/W) is 0.3 for all the specimens. Thereafter, the disk-shaped concrete specimens are prepared in the laboratory by pouring the concrete mixes into the prefabricated moulds as shown in the
Figure 2a and are further compacted on a vibratory table as displayed in
Figure 2b. In this way, premature failures such as the breakage of concrete and stress concentration around the pulling load holes are avoided by applying the pulling force by means of threaded bars, which are fabricated in conjunction with the concrete. All the samples are demoulded after 24 hours, cured in water for 28 days and stored in climate chamber at constant ambient conditions (20 °C, 65% RH).
2.3. Test Setup
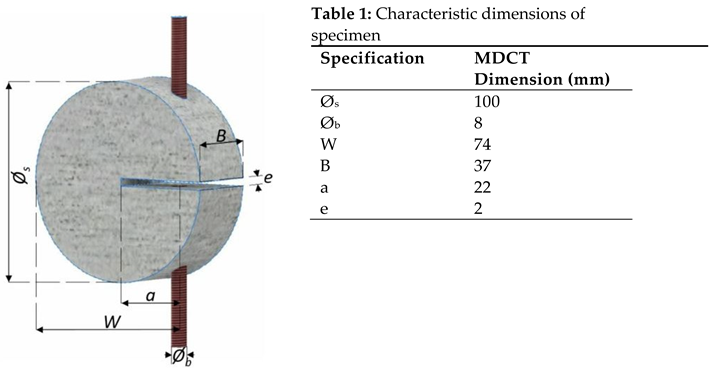
The specifications and dimensions of newly proposed MDCT specimen are based on ASTM standards [
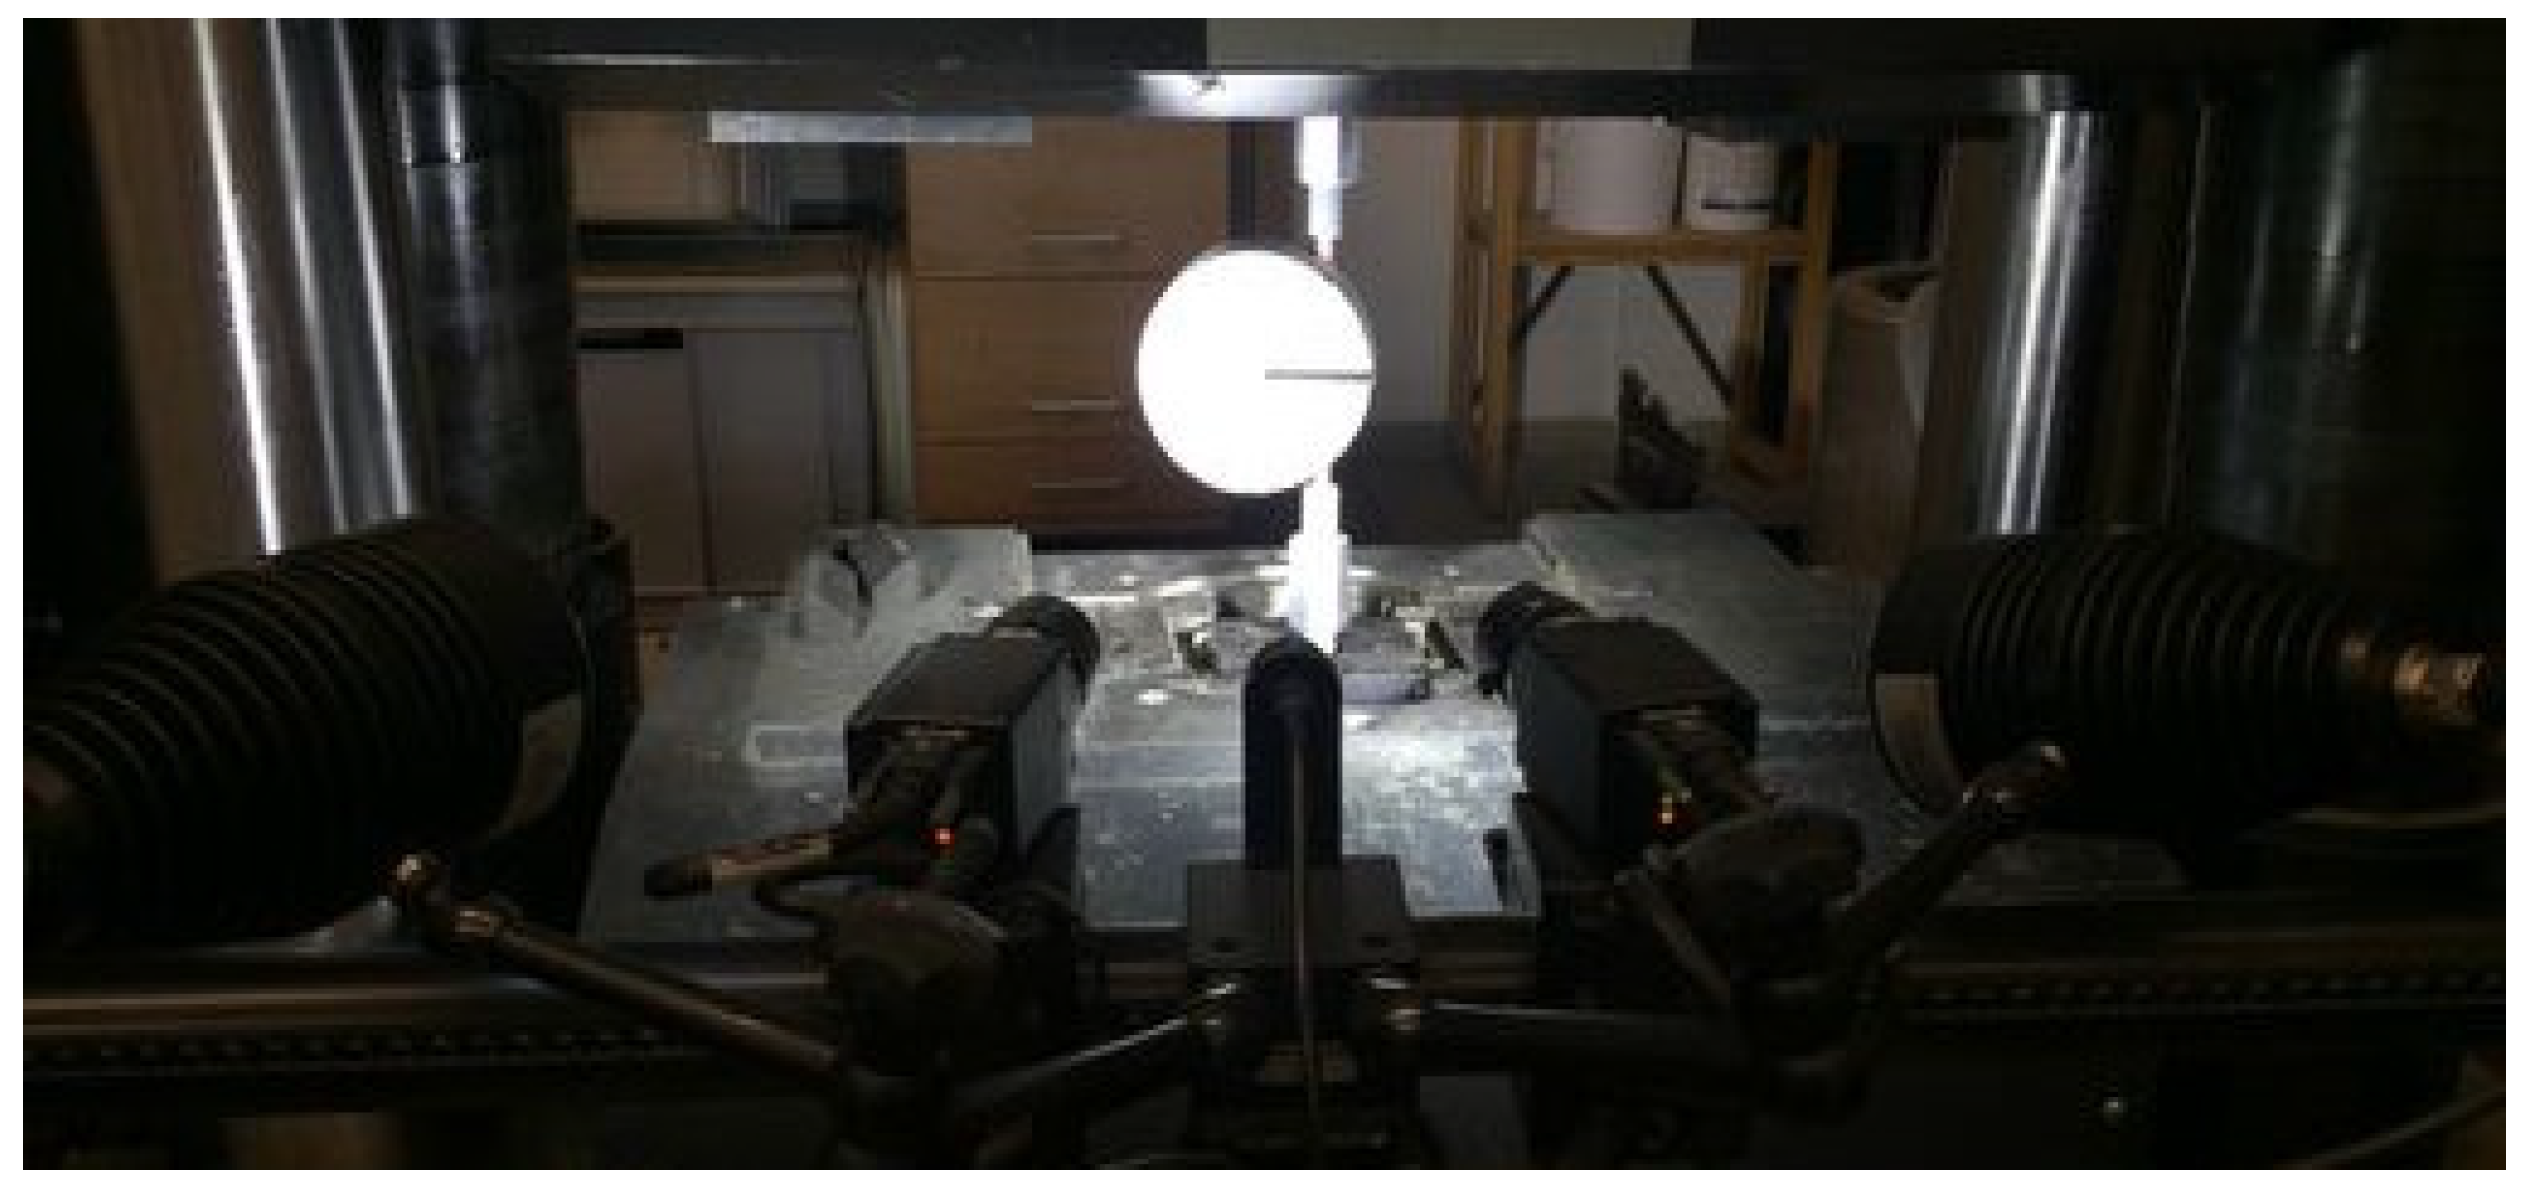
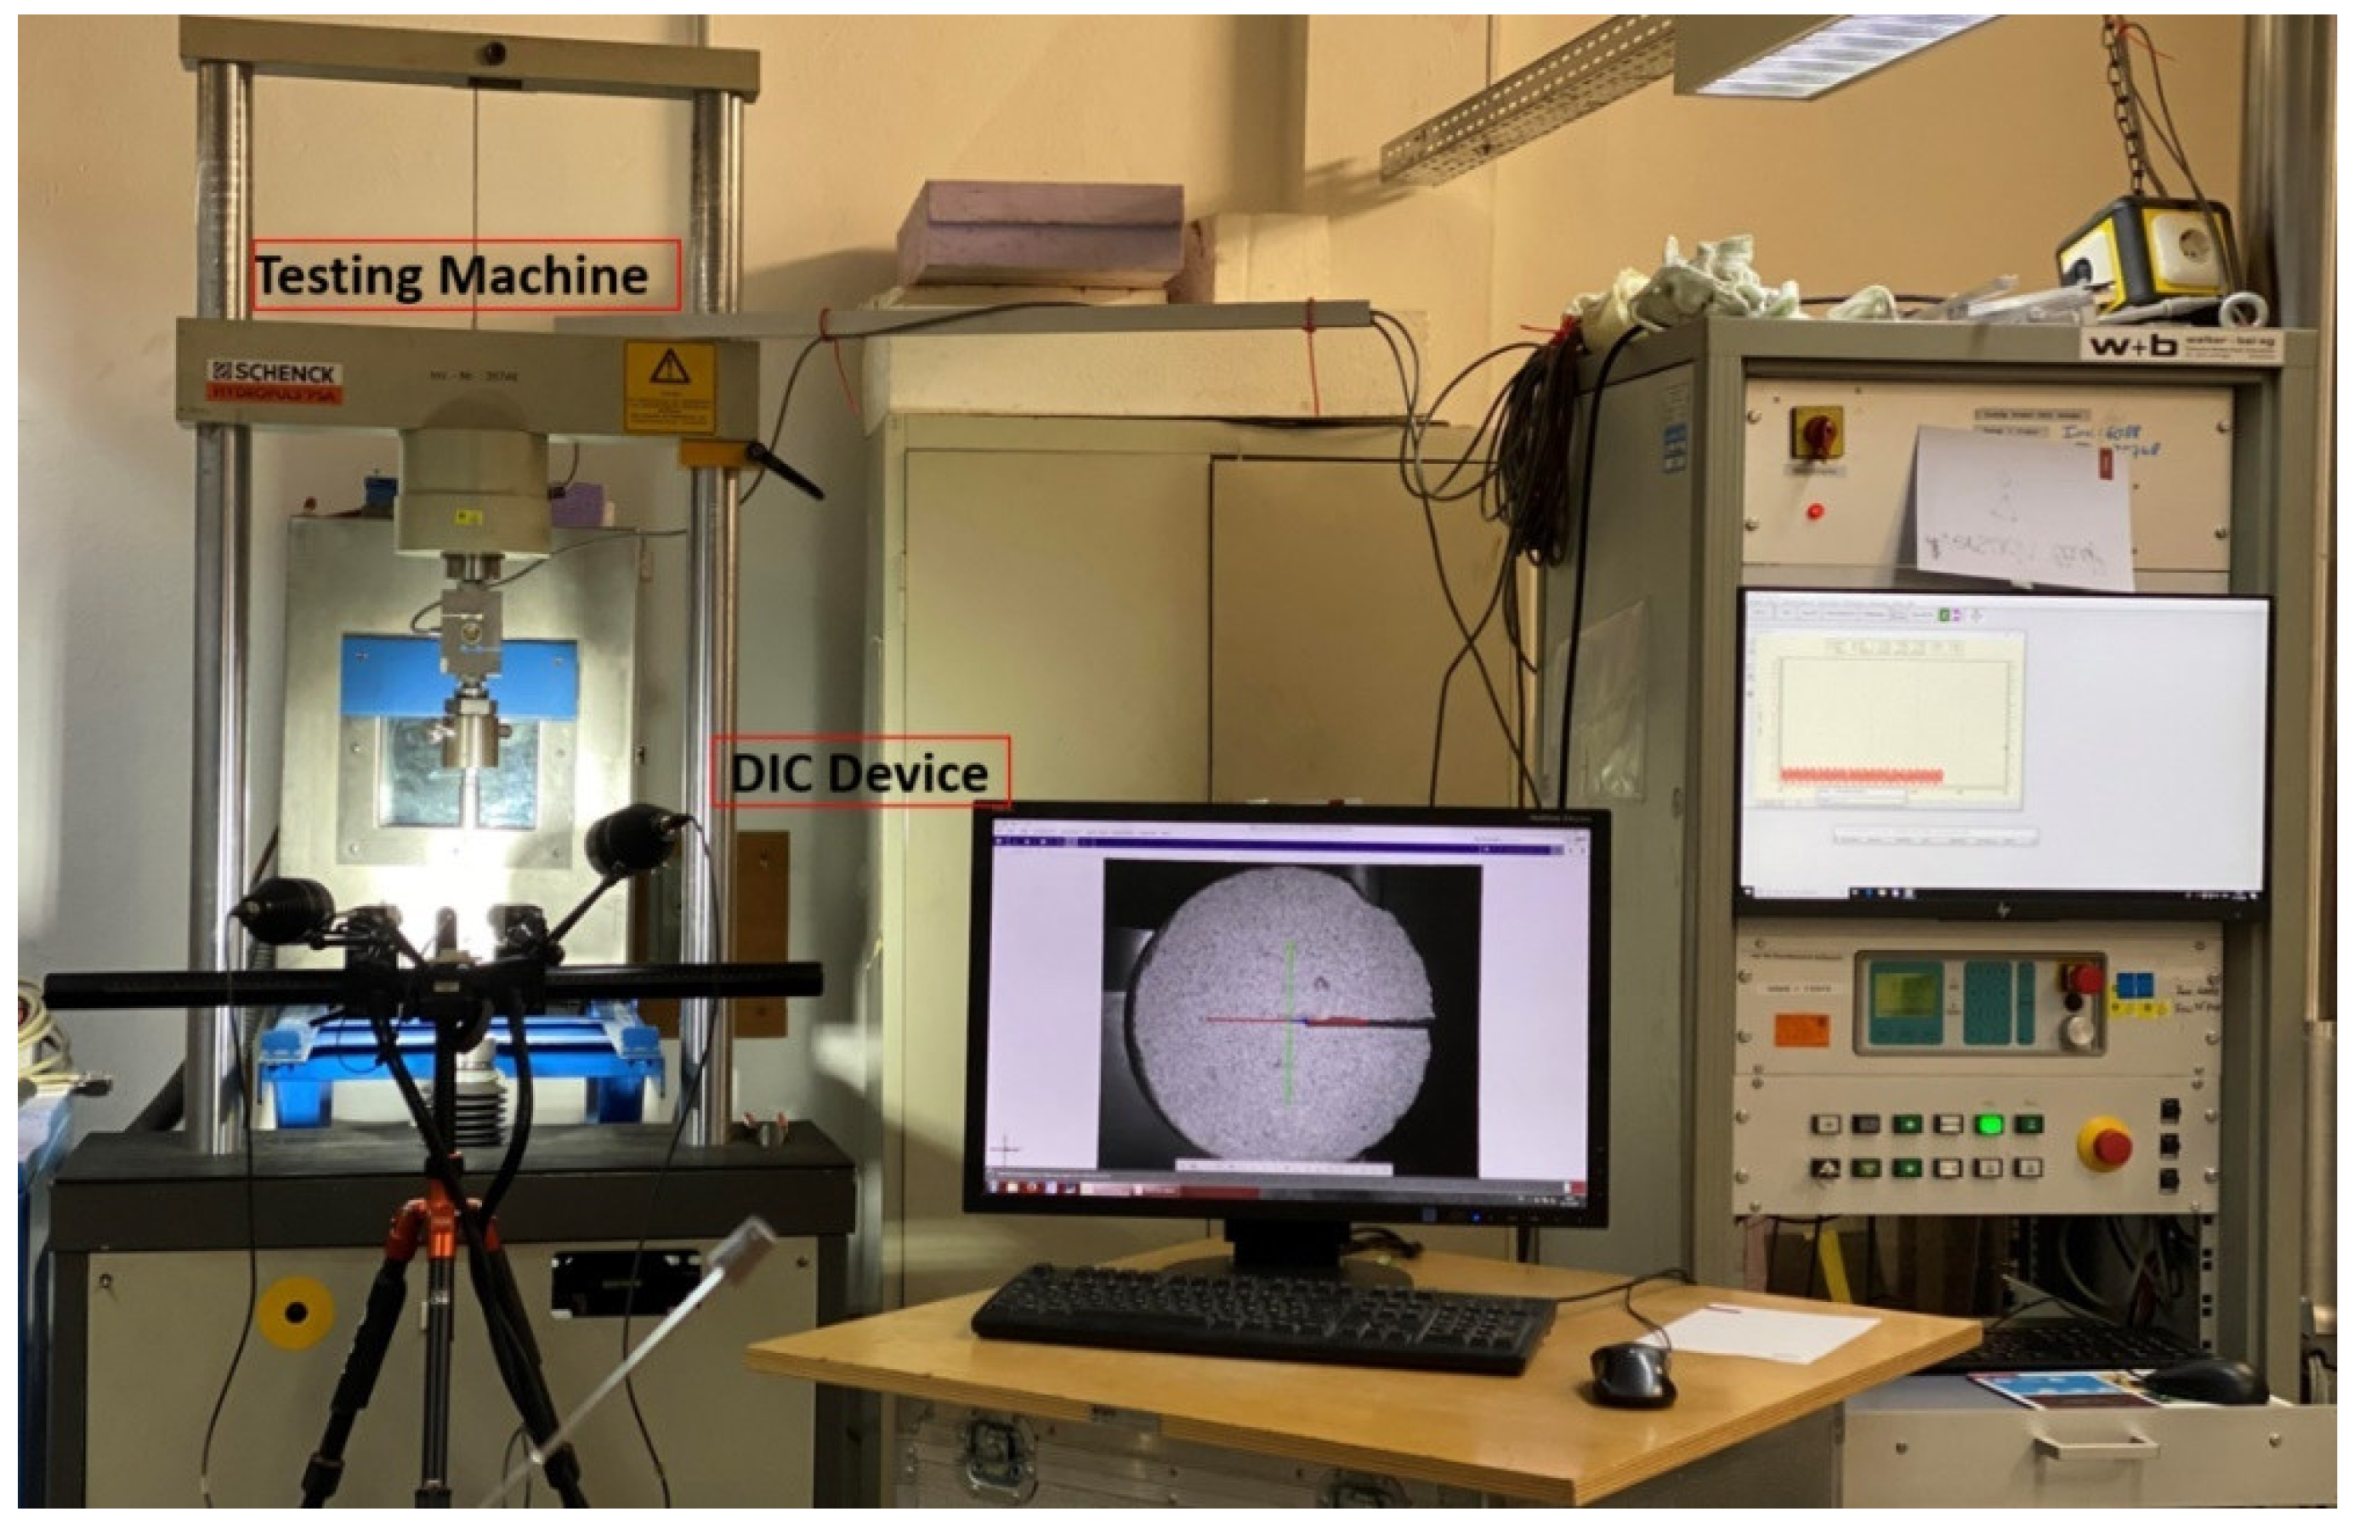
20] and are summarised in Figure 3 and Table 2 respectively. In this study, the digital image correlation (DIC) tool ARAMIS from GOM is used to analyse the crack opening displacements (COD) and deformations of the specimens under the external load in both static and cyclic tensile tests. The crack opening displacement is measured over a length of 20 mm across the notch at the axis of the GFRP threaded rods, which functions as the load axis. Prior to the ARAMIS measurement, the surface of the sample is coated white and partially splattered with a black spray in a random pattern, which is necessary for the system to detect so-called facets. In this way, the facets can be detected and tracked based on the individual grey value levels, allowing the complex behaviour of the test specimens to be evaluated analytically. The free ends of the GFRP threaded rods are then clamped into the electromechanical testing machine at a distance of approximately 80 mm from the axis of the initial notch. Two 2448 x 2050 pixel cameras are directly coupled and used in conjunction with ARAMIS software to record displacements and strains at a working distance of 320 mm during subsequent loading steps; the test setup is shown in
Figure 4 and
Figure 6 for static and cyclic tests, respectively. This comprehensive setup and utilization of ARAMIS enable precise measurements and observations of specimen behaviour under various loading conditions, contributing to a thorough analysis of the materials and their response to tensile testing.
Figure 4.
Experimental setup of MDCT specimen.
Figure 4.
Experimental setup of MDCT specimen.
2.4. Experimental Approach
2.4.1. Static Tensile Tests
The static compact tensile tests are carried out under displacement control of the electro-mechanical testing machine at a rate of 0.001 mm/min. The static tests are performed for a minimum of specimens with different material compositions such as HPC-B, HPC-G, CM and basalt. The digital image correlation (DIC) tool ARAMIS from GOM is implemented to analyse the crack opening displacements (COD) and deformations of the specimens under the external load of the static tensile tests. The free ends of the GFRP threaded bars are subsequently clamped into the electro-mechanical testing machine at a distance of approximately 80 mm apart from the axis of the initial notch. Two cameras are directly affiliated and used in conjunction with the ARAMIS software to record the displacements and strains at a working distance of 320 mm during the subsequent loading steps and the test setup is shown in
Figure 4.
The static tests are performed for no less than six specimens with different material compositions such as HPC-B, HPC-G, CM and basalt. The cylindrically shaped basalt samples are core-drilled using a drilling rig with an inner diameter of 100 mm from the boulders that are manually handpicked from the Oelberg crushing plant. The cylindrical cores are further sliced to a thickness of 37 mm and the notch is mechanised as per prescribed notch depth specified Table 2. In addition, 8 mm holes are drilled into the specimens at a distance of W= 74 mm and 8 mm diameter GFRP threaded rods are embedded into the specimens by means of adhesives. This meticulous process ensures that the basalt MDCT samples are prepared in accordance with the stringent guidelines outlined by ASTM.
2.4.2. Cyclic Tests
Within the scope of the present study, three materials are considered individually for experimental investigations of fatigue loading of HPC at the mesoscale, namely HPC-B, HPC-G, and CM, and the fatigue loading is divided into low-cycle and high-cycle loading.
2.4.2.1. Low Cycle Tests
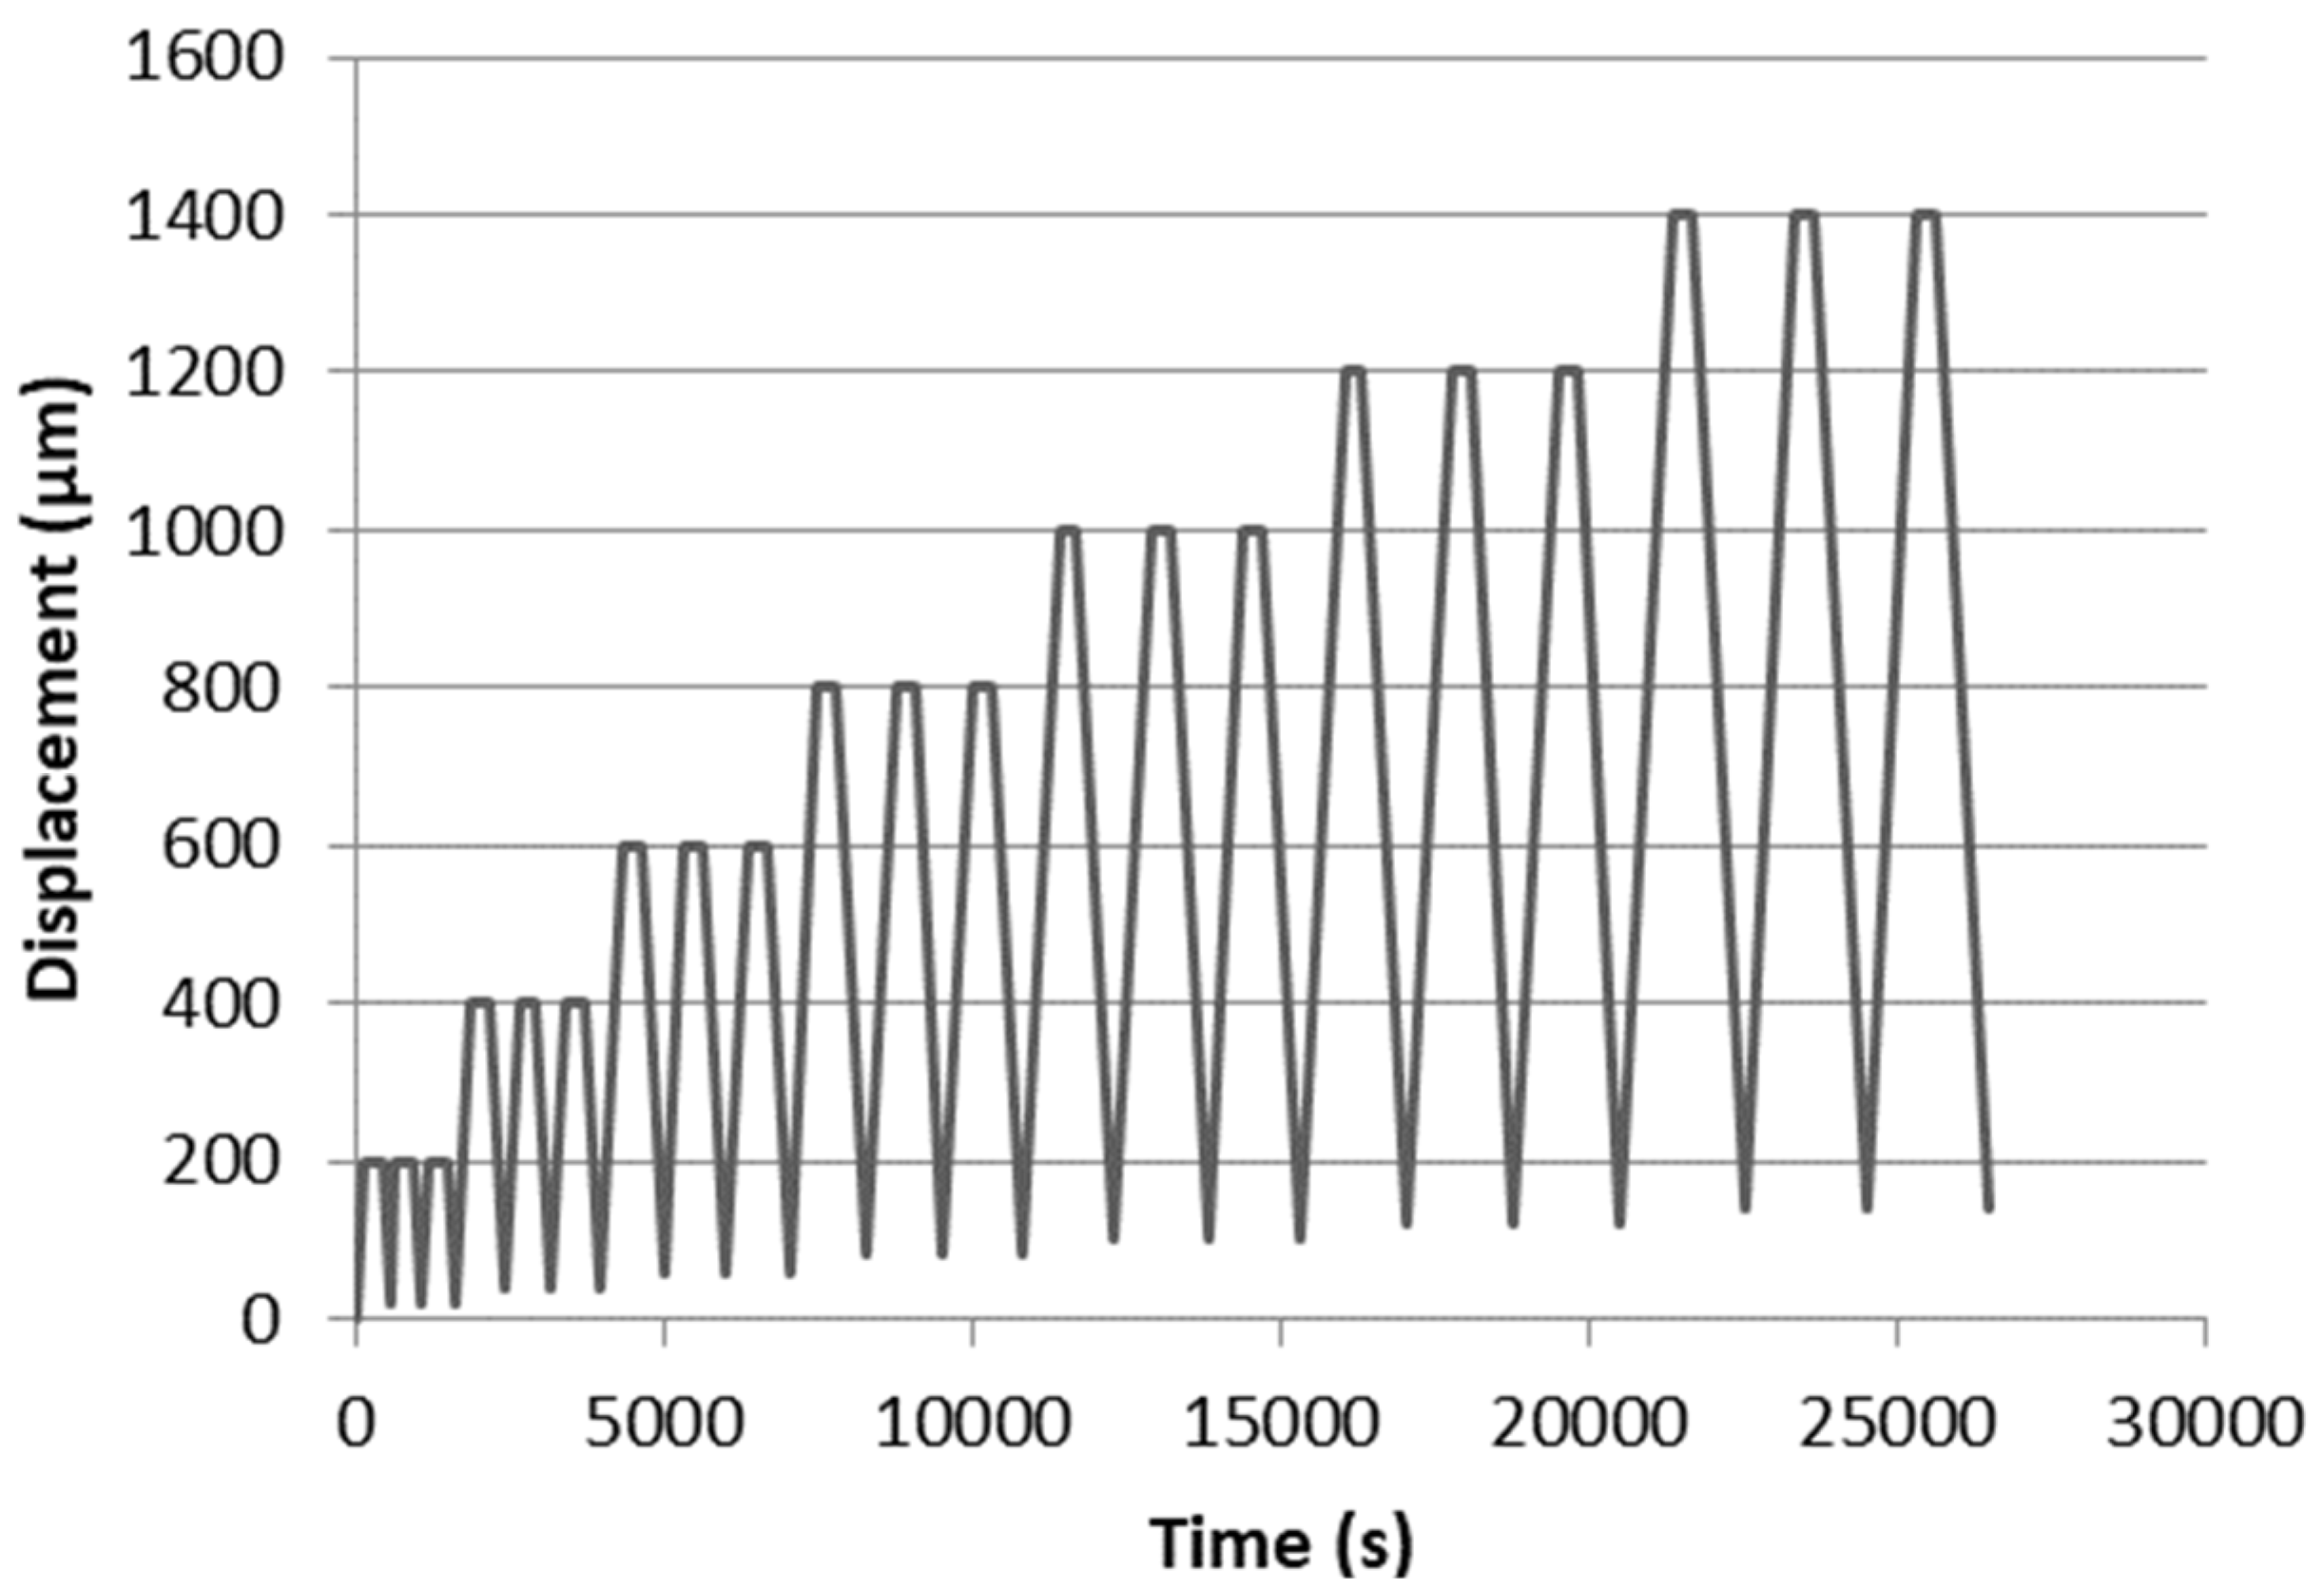
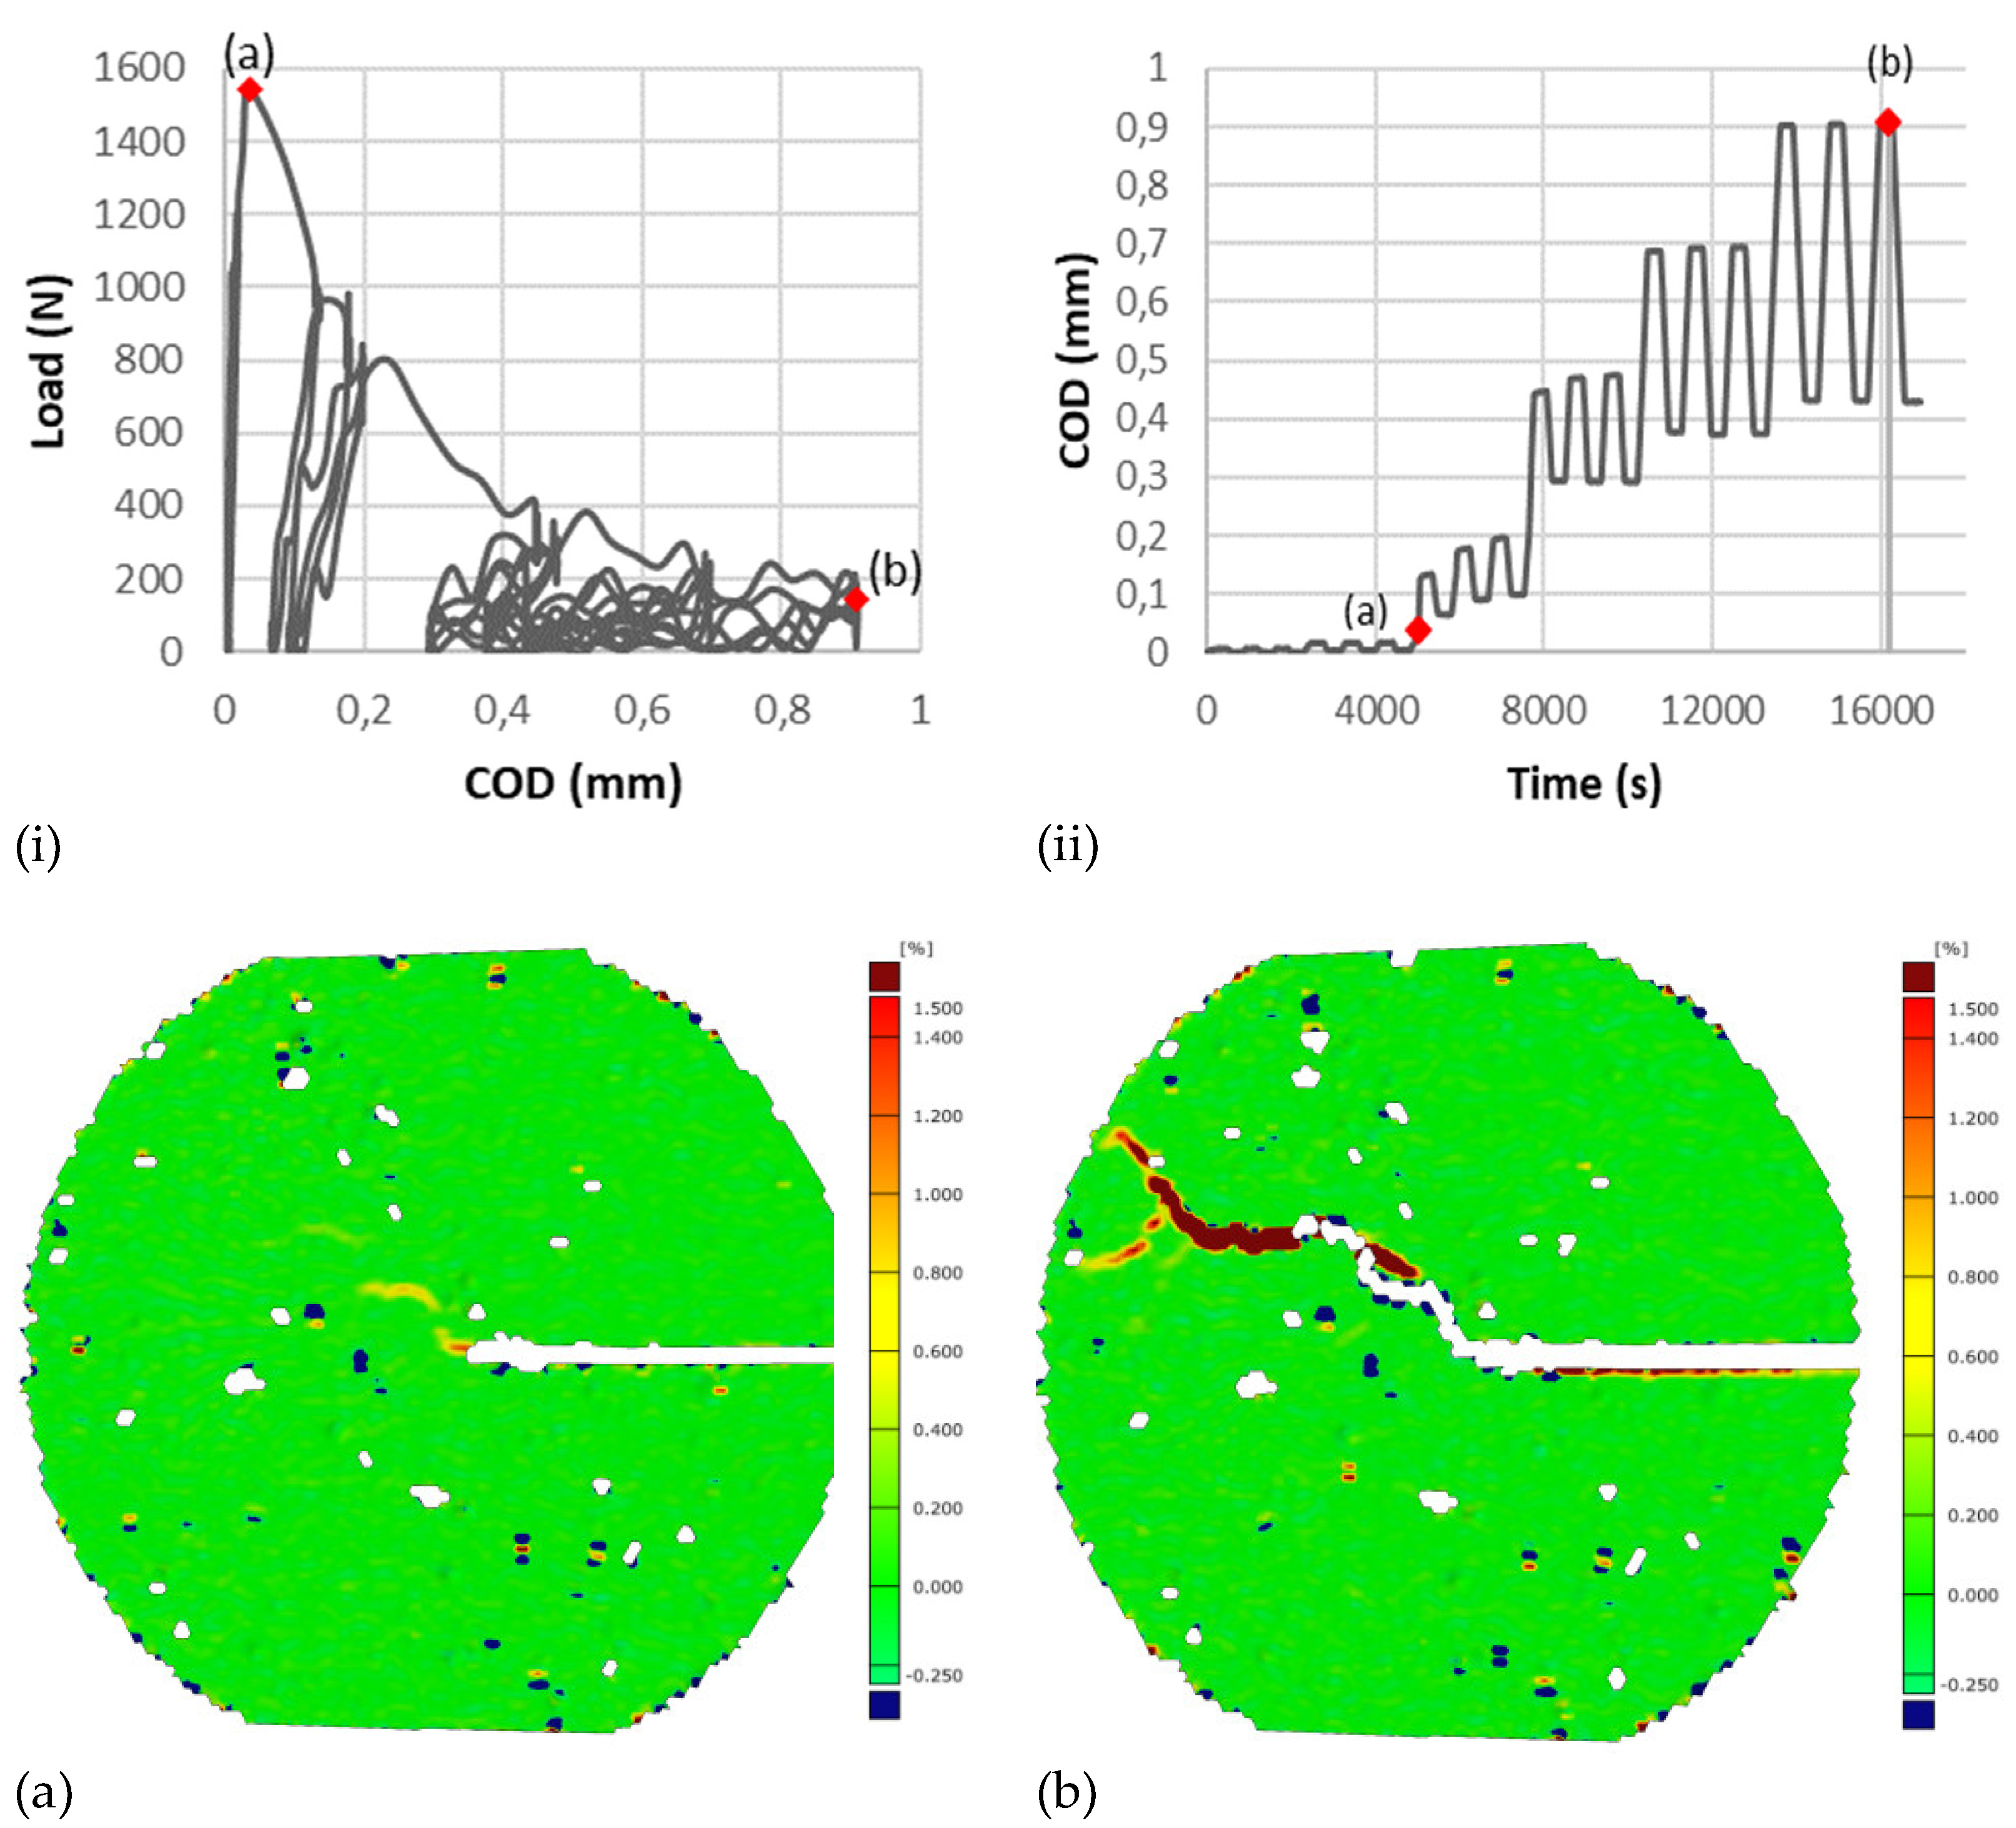
The low-cycle fatigue tests are performed in a quasi-static monotonic manner under displacement control of the electromechanical testing machine. The test specimens are loaded under displacement control up to the complete failure point and the testing is performed in such a way that the crack propagation is localised in the ligament area of MDCT specimen. The methodology involves the assignment of a displacement-controlled load at a rate of 0.1 mm/min in 12 stages and a retention time of 300 seconds for each stage as shown in
Figure 5, wherein the specimen failed during the twenty-first load cycle.
Analogous to static tests, the entire course of deformations and displacements of the specimens during the low cycle fatigue tests are measured with a digital 3D image correlation device ARAMIS from GOM. In a manner resembling static tensile tests, the free ends of the GFRP threaded rods for the low-cycle fatigue tests are clamped into the servo-hydraulic and electromechanical testing machine, respectively, at a distance of about 80 mm from the axis of the initial notch. The load is recorded over an external cable connected to the device. Thereby, after post-processing of the digital images acquired during the test, the load, the time and the crack opening displacement are obtained.
2.4.2.1. High Cycle Tests
The high cycle fatigue tests are carried out on MDCT specimens under sinusoidal loading of the servo-hydraulic testing machine between a predefined minimum and maximum load level. In the fatigue tests, no less than six specimens with different material compositions such as HPC-B, HPC-G and CM are investigated. The ultimate tensile load of MDCT specimens is determined prior to the execution of the fatigue tests, wherein five specimens from each batch with the same dimensions and material properties as in the fatigue tests are considered. The experimental setup for high cycle fatigue tests is as shown in the
Figure 6.
Figure 6.
Experimental setup for high-cycle fatigue tests.
Figure 6.
Experimental setup for high-cycle fatigue tests.
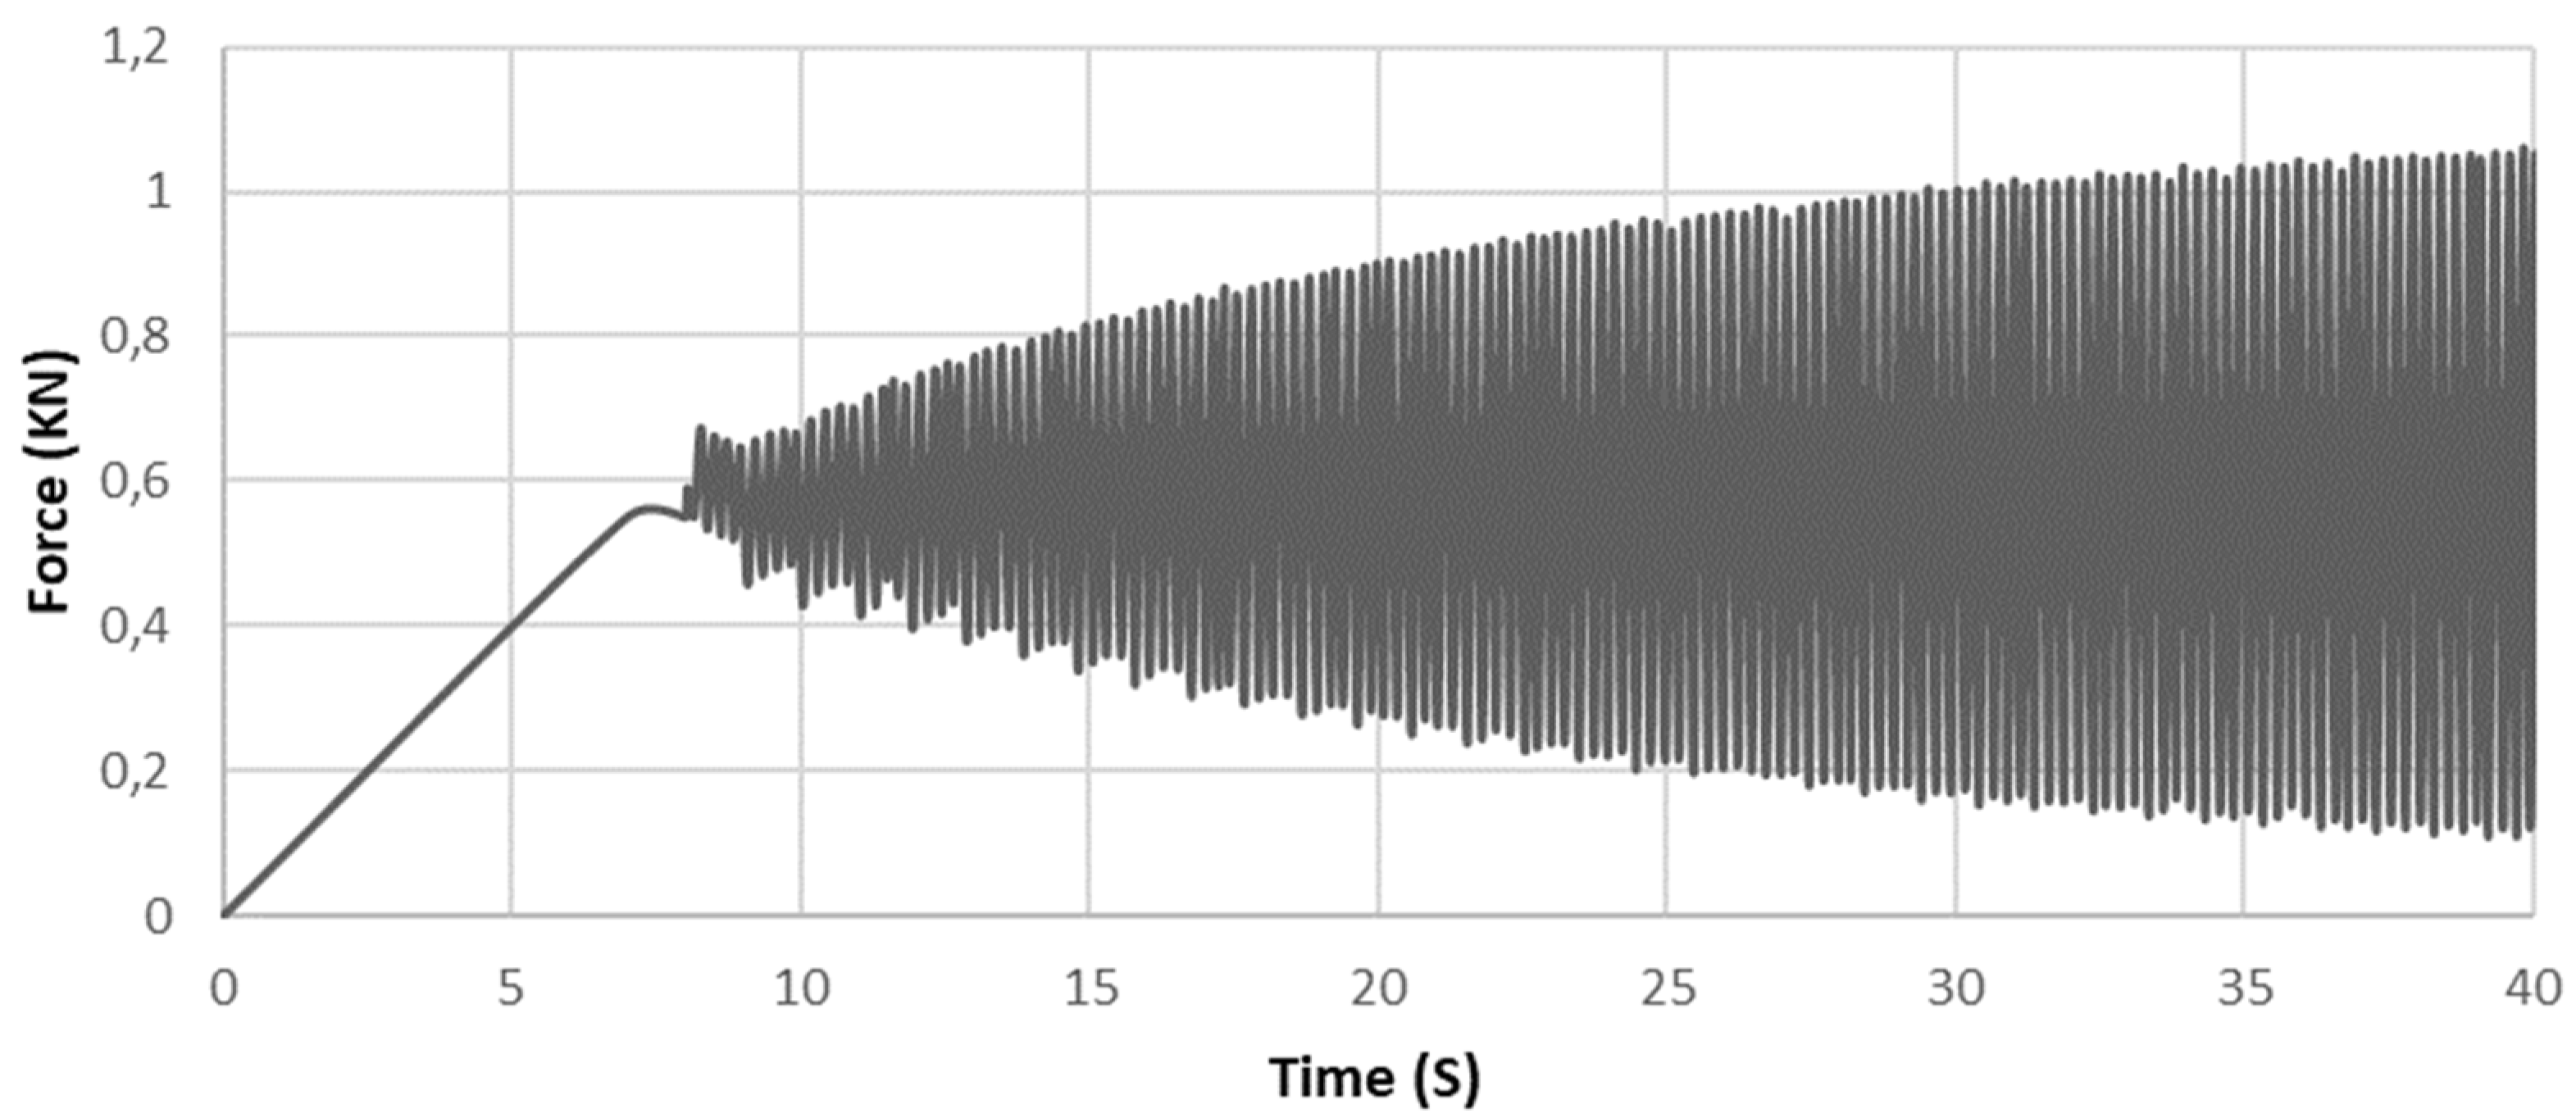
The MDCT specimens are tested under sinusoidal loading of the servo-hydraulic testing machine between a predefined lower and upper load level. A force controlled loading is employed for all the specimens in the fatigue test. At the very commencement of the test, the axial force is increased monotonically up to the mean load level and subsequently switched to a sinusoidal fatigue loading as shown in
Figure 7, achieving the final load amplitude after 80 seconds and 320 load cycles. In the fatigue tests, no less than six specimens with different material compositions such as HPC-B, HPC-G and CM are investigated. The static tensile strength of MDCT specimens is determined prior to the execution of the fatigue tests, wherein five specimens from each batch with the same dimensions and material properties as in the fatigue tests are considered. The static tests are carried out under displacement control of the electro-mechanical testing machine at a rate of 0.001 mm/min. The average value of the ultimate static tensile load is utilised to determine the load level for each composition during the fatigue tests.
The main parameters of cyclic tensile tests are as follows:
Load level: The maximum load level is varied from 50 to 90 percent of the characteristic tensile load as determined by the static tests described above and the minimum load level Rmin = 0.05 is maintained.
Number of cycles: Initially four specimens are subjected to cyclic tests with up to 100 cycles, a further set of four specimens are tested with up to 10000 cycles. A third set of four samples is then tested with varying load cycles from 1000000 to 2000000 cycles.
Test frequency: Each sample is tested at a frequency of 4 Hz
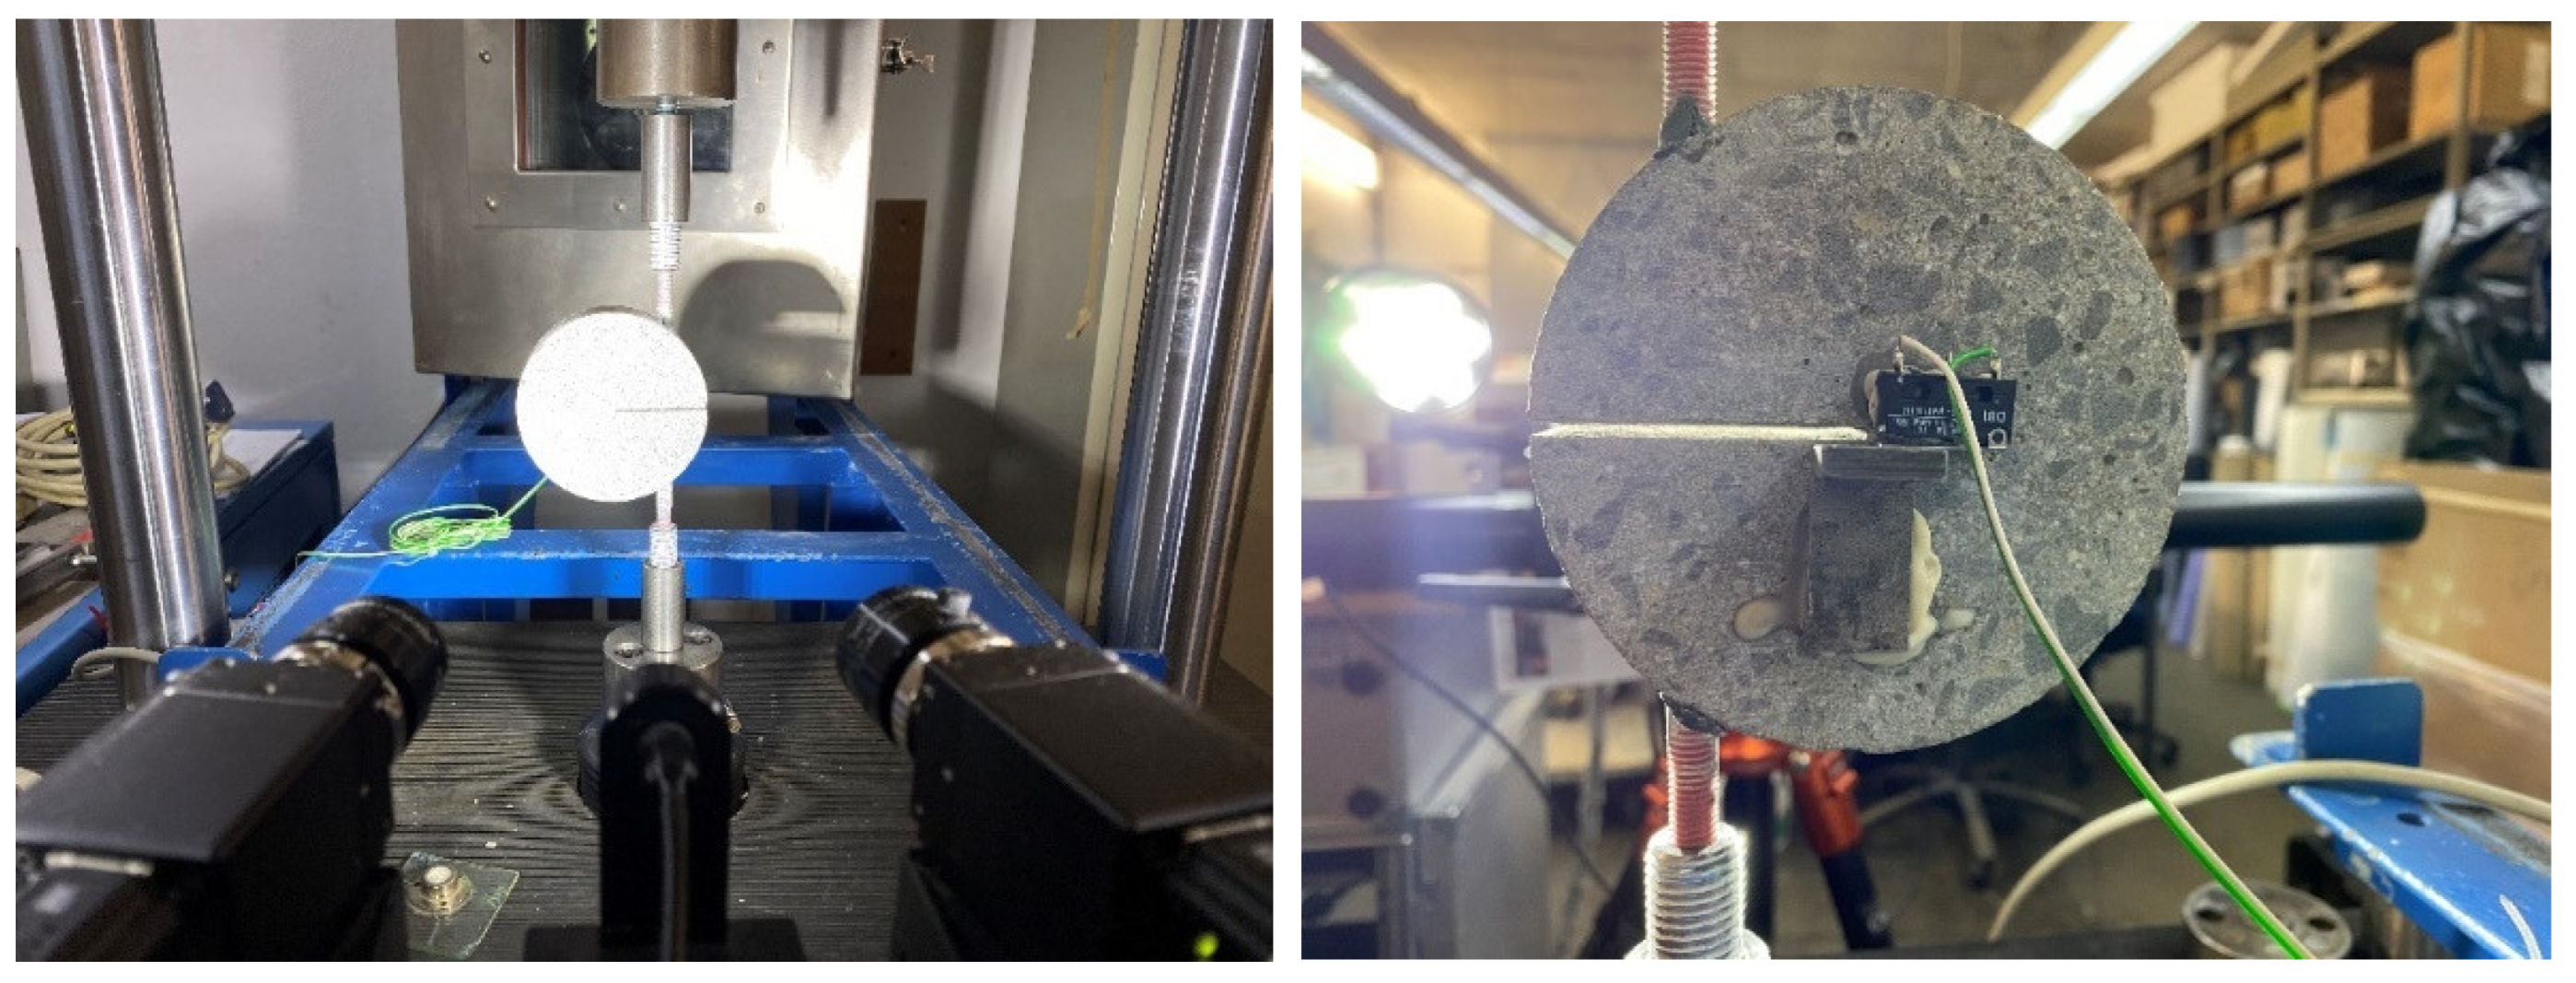
Additionally, the digital image correlation (DIC) tool ARAMIS from GOM is implemented to analyse the crack opening displacements (COD) and deformations of the specimens under the external load of the cyclic tensile tests. Prior to the ARAMIS measurement, the surface of the sample is coated white and partially splattered with a black spray in a random pattern, which is necessary to ensure that the system detects so-called facets. Consequently, the facets can be recognized and tracked via the individual grey value levels, allowing the complex behaviour of test specimens to be evaluated analytically. The free ends of the GFRP threaded bars are subsequently clamped into the servo-hydraulic testing machine at a distance of approximately 80 mm apart from the axis of the initial notch. Two cameras with 2448 x 2050 pixels are directly affiliated and used in conjunction with the ARAMIS software to record the displacements and strains at a working distance of 320 mm during the subsequent loading steps and the test setup is shown in Figure 8 (left). The strain and COD for high cycle fatigue tests are recorded utilizing a so called “ring buffer” with a buffer size of 150 images and at a fixed frame rate of 15 Hz, whereby the deformations and COD are measured at a regular intervals of 2500 seconds preceding complete failure of the specimen. This procedure facilitates the reconstruction of the sinusoidal course of the COD- N curve in combination with a measuring frequency of 4 Hz of the testing machine.
Besides, the external triggering mechanism has been implemented in fatigue tests; facilitating the triggering of a signal to the DIC tool should the cracks be evident in the specimen as shown in
Figure 8 (right). This novel technique enables digital image acquisition and thus to comprehensively resolve the smallest displacements in an extensive way.
2.4.3. Residual Strength Test
The specimens withstanding the maximum prescribed number of load cycles (1 million in the current study) are reloaded under quasi-static conditions to investigate the effect of cyclic loading on the mechanical performance and residual strength of the different concrete compositions, namely, high-performance concrete with basalt (HPC-B), high-performance concrete with gravel (HPC-G), and high-strength coarse mortar (CM). The residual tensile tests are performed under displacement control of the electromechanical testing machine at a rate of 0.001 mm/min. The entire history of deformations and displacements of the specimens during the tests are measured using a digital 3D image correlation device ARAMIS from GOM.
3. Experimental Results and Discussions
3.1. Mechanical Properties
The compressive strength is determined in accordance with EN 12390-3 [
21] and the modulus of elasticity in accordance with EN 12390-13 [
22] for cylinders with a diameter of 150 mm and a height of 300 mm. The tensile strength is determined in a direct tensile test on plain cylinders with a diameter of 80 mm and a height of 240 mm. In addition, the basalt boulders are collected from the Oelberg basalt crushing plant; the boulders are core- drilled to extract specimens with a diameter of 80 mm and a height of 160 mm for compressive strength tests as well as for the determination of the Young’s modulus of elasticity. Furthermore, indirect split tensile tests according to EN 12390-6 [
23] are carried out to determine the tensile strength of basalt boulder. Six specimens are tested in each case to ensure results’ reliability and consistency, as summarized in
Table 3.
It is evident from
Table 3 that the HPC-B demonstrates more than 20% and 16% higher compressive strength compared to HPC-G and CM, respectively. The modulus of elasticity and tensile strength for HPC-B are found to be in the range of at least 15% and 12% higher than those for HPC-G and CM, respectively. Despite retaining the water-cement ratio of 0.35 for all concrete compositions, the superior mechanical properties of HPC-B are attributed to the presence of crushed basalt aggregates and improved ITZ. On the other hand, considering the theory of excess paste [
19], the increased strength of the HPC-B composition is due to the effects of the high-strength basalt aggregates. Besides, the reduced strength of HPC-G relative to CM indicates that the nature of the aggregate and its associated morphology play a vital role in governing the mechanical performance of such high performance concrete compositions.
3.2. Static Tensile Tests
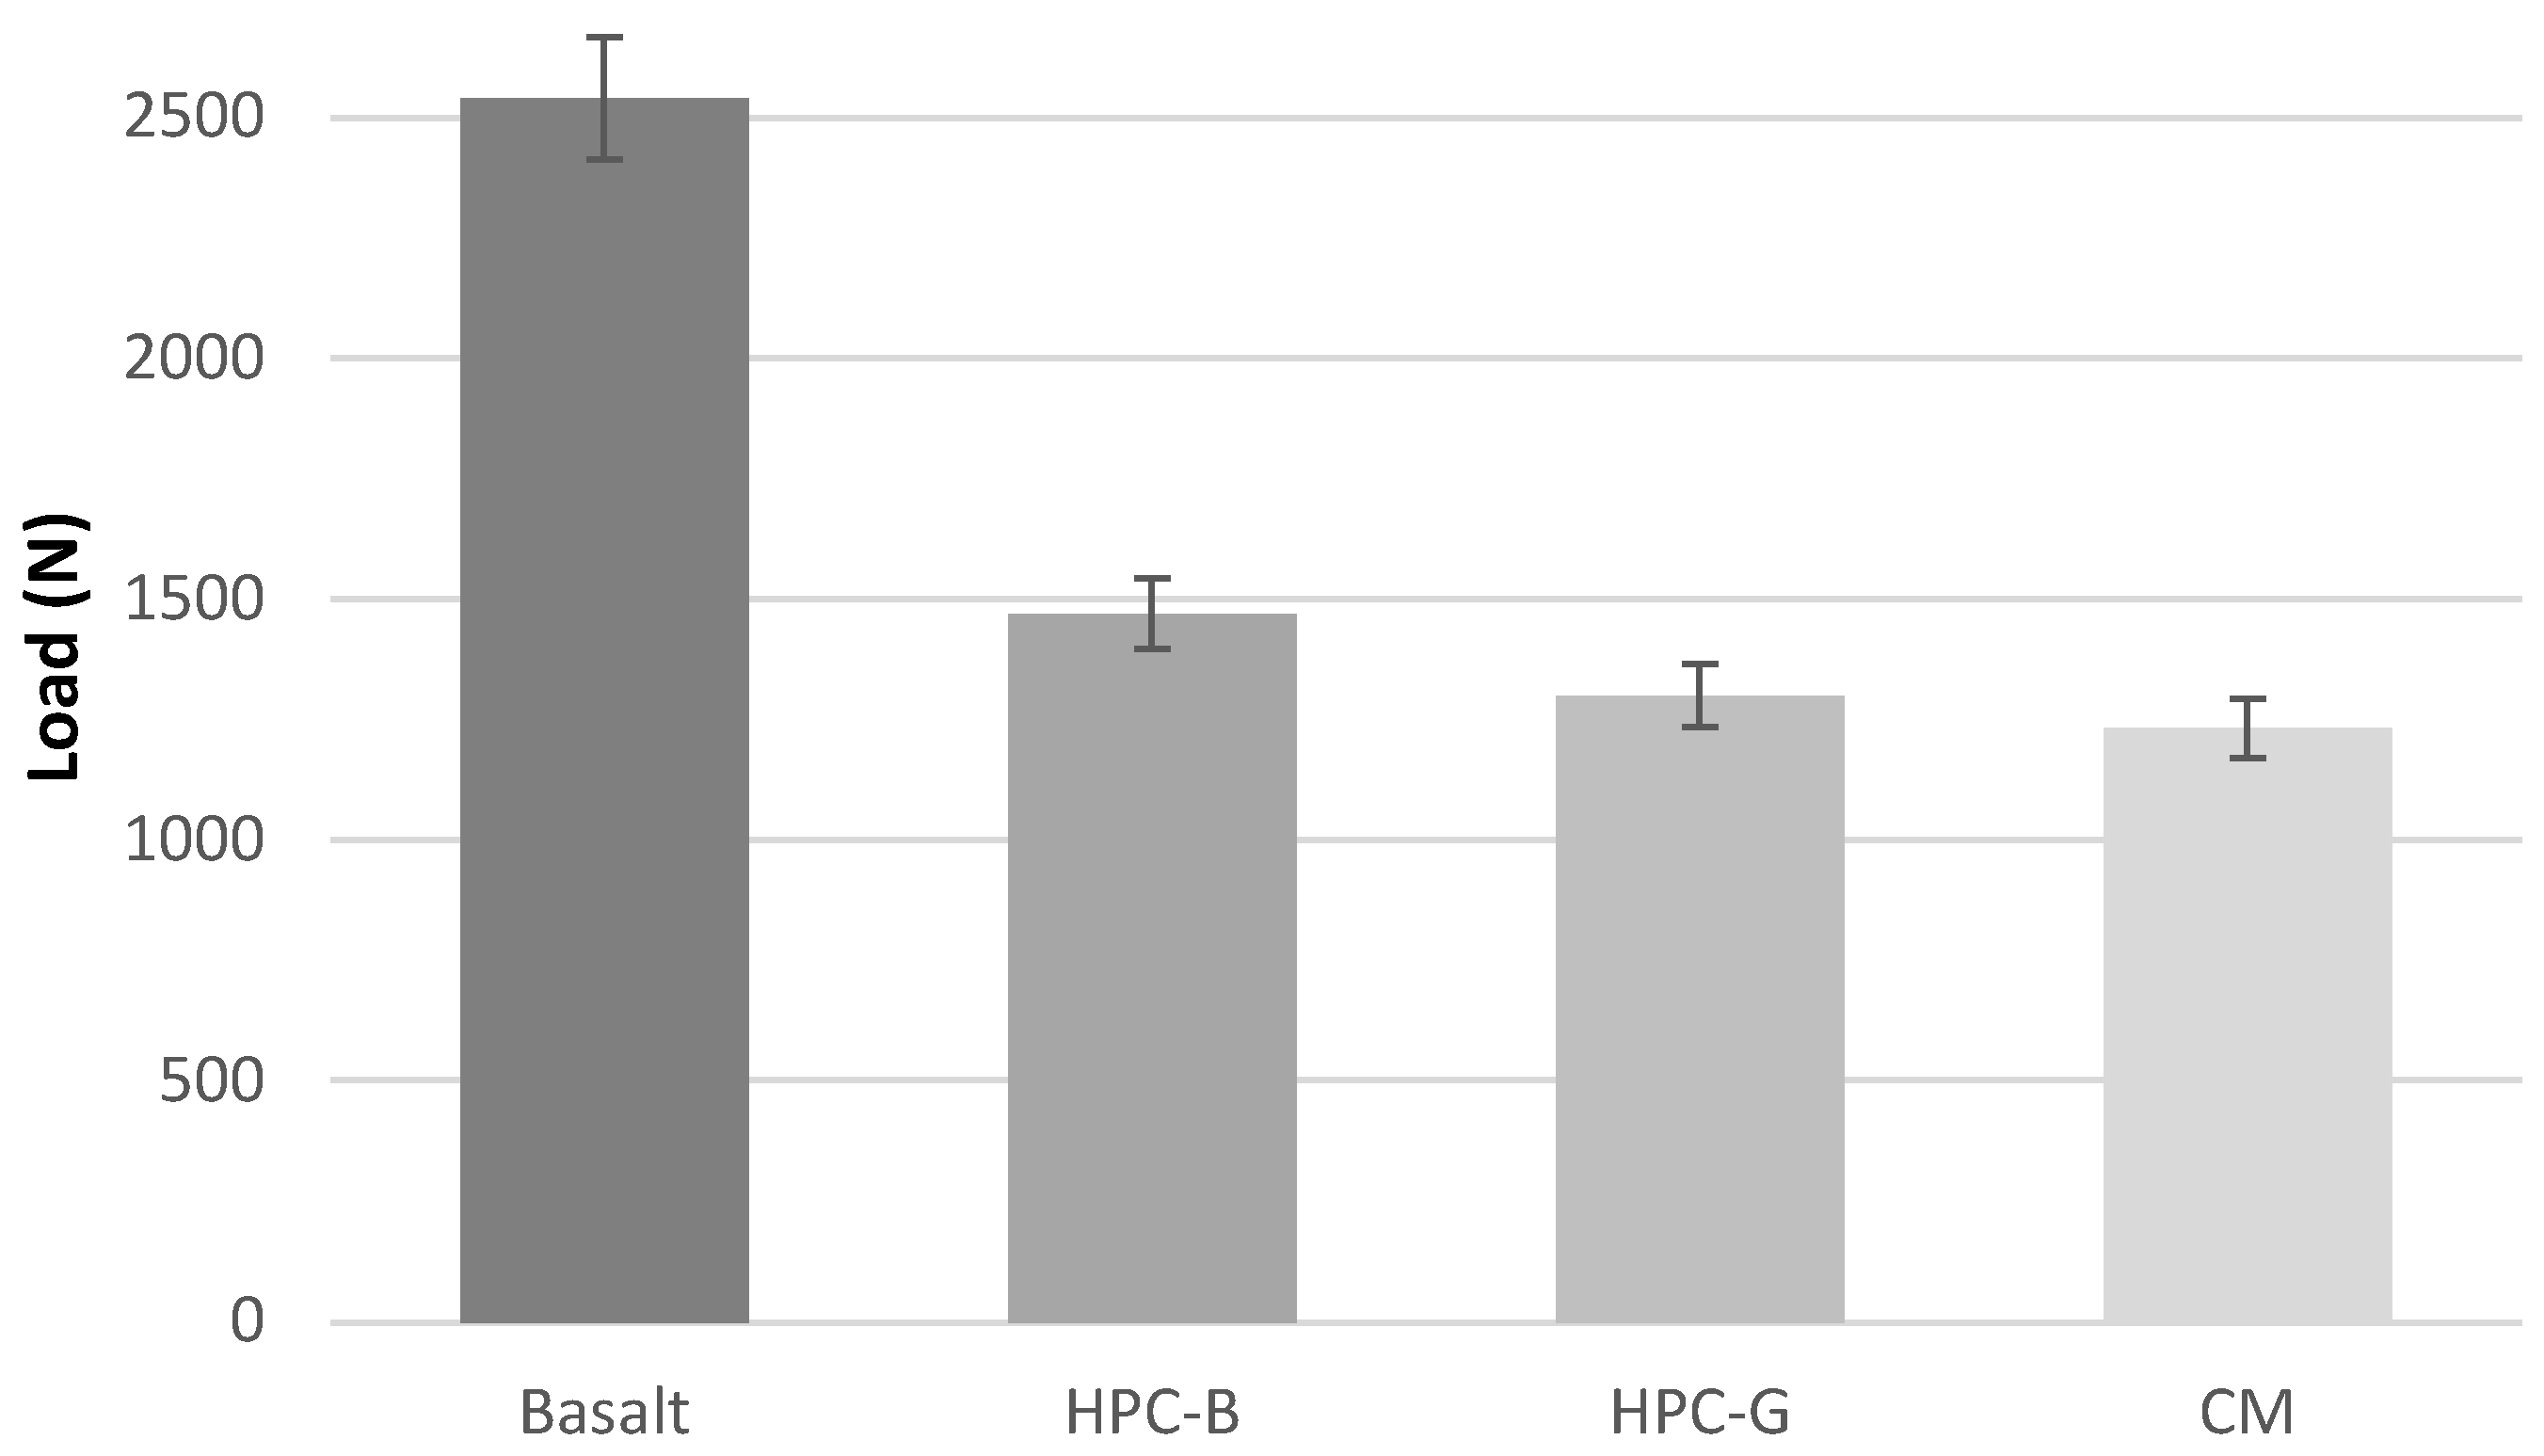
It is revealed from the static tensile tests on different material compositions that the basalt specimen is the dominant material composition with an average ultimate load of about 2540N. The material composition of HPC-B, HPC-G and CM demonstrated an average ultimate load of about 1470N, 1300N and 1230N, respectively. For each of these material compositions, six specimens are evaluated to determine their average load-carrying capacities, with the results presented in
Figure 9.
3.3. Evaluation of Fracture Properties
In order to assess the fracture properties of MDCT specimens, the very first approach is to determine the relative notch length ratio (α) based on geometrical parameters such as the initial notch length (a) and width (W) of the specimen. The relative notch length ratio (α) is calculated using Equation (1) [
24].
With the relative notch length ratio being determined, the fracture toughness (K
Q) is obtained with Equation (2) [
24], where, P
Q denotes the peak load, B the thickness and f(a/W) the geometric correction factor represented in Equation (3) [
24].
In the majority of concrete specimens, including MDCT geometry, linear elastic fracture mechanics (LEFM) does not produce size-independent fracture properties and thus nonlinear elastic fracture mechanics (NLFM) was developed to extract several size-independent fracture parameters [
25,
26]. The total energy consumed to produce a unit area of fracture surface during the fracture process is defined as work of fracture (W
f) [
27,
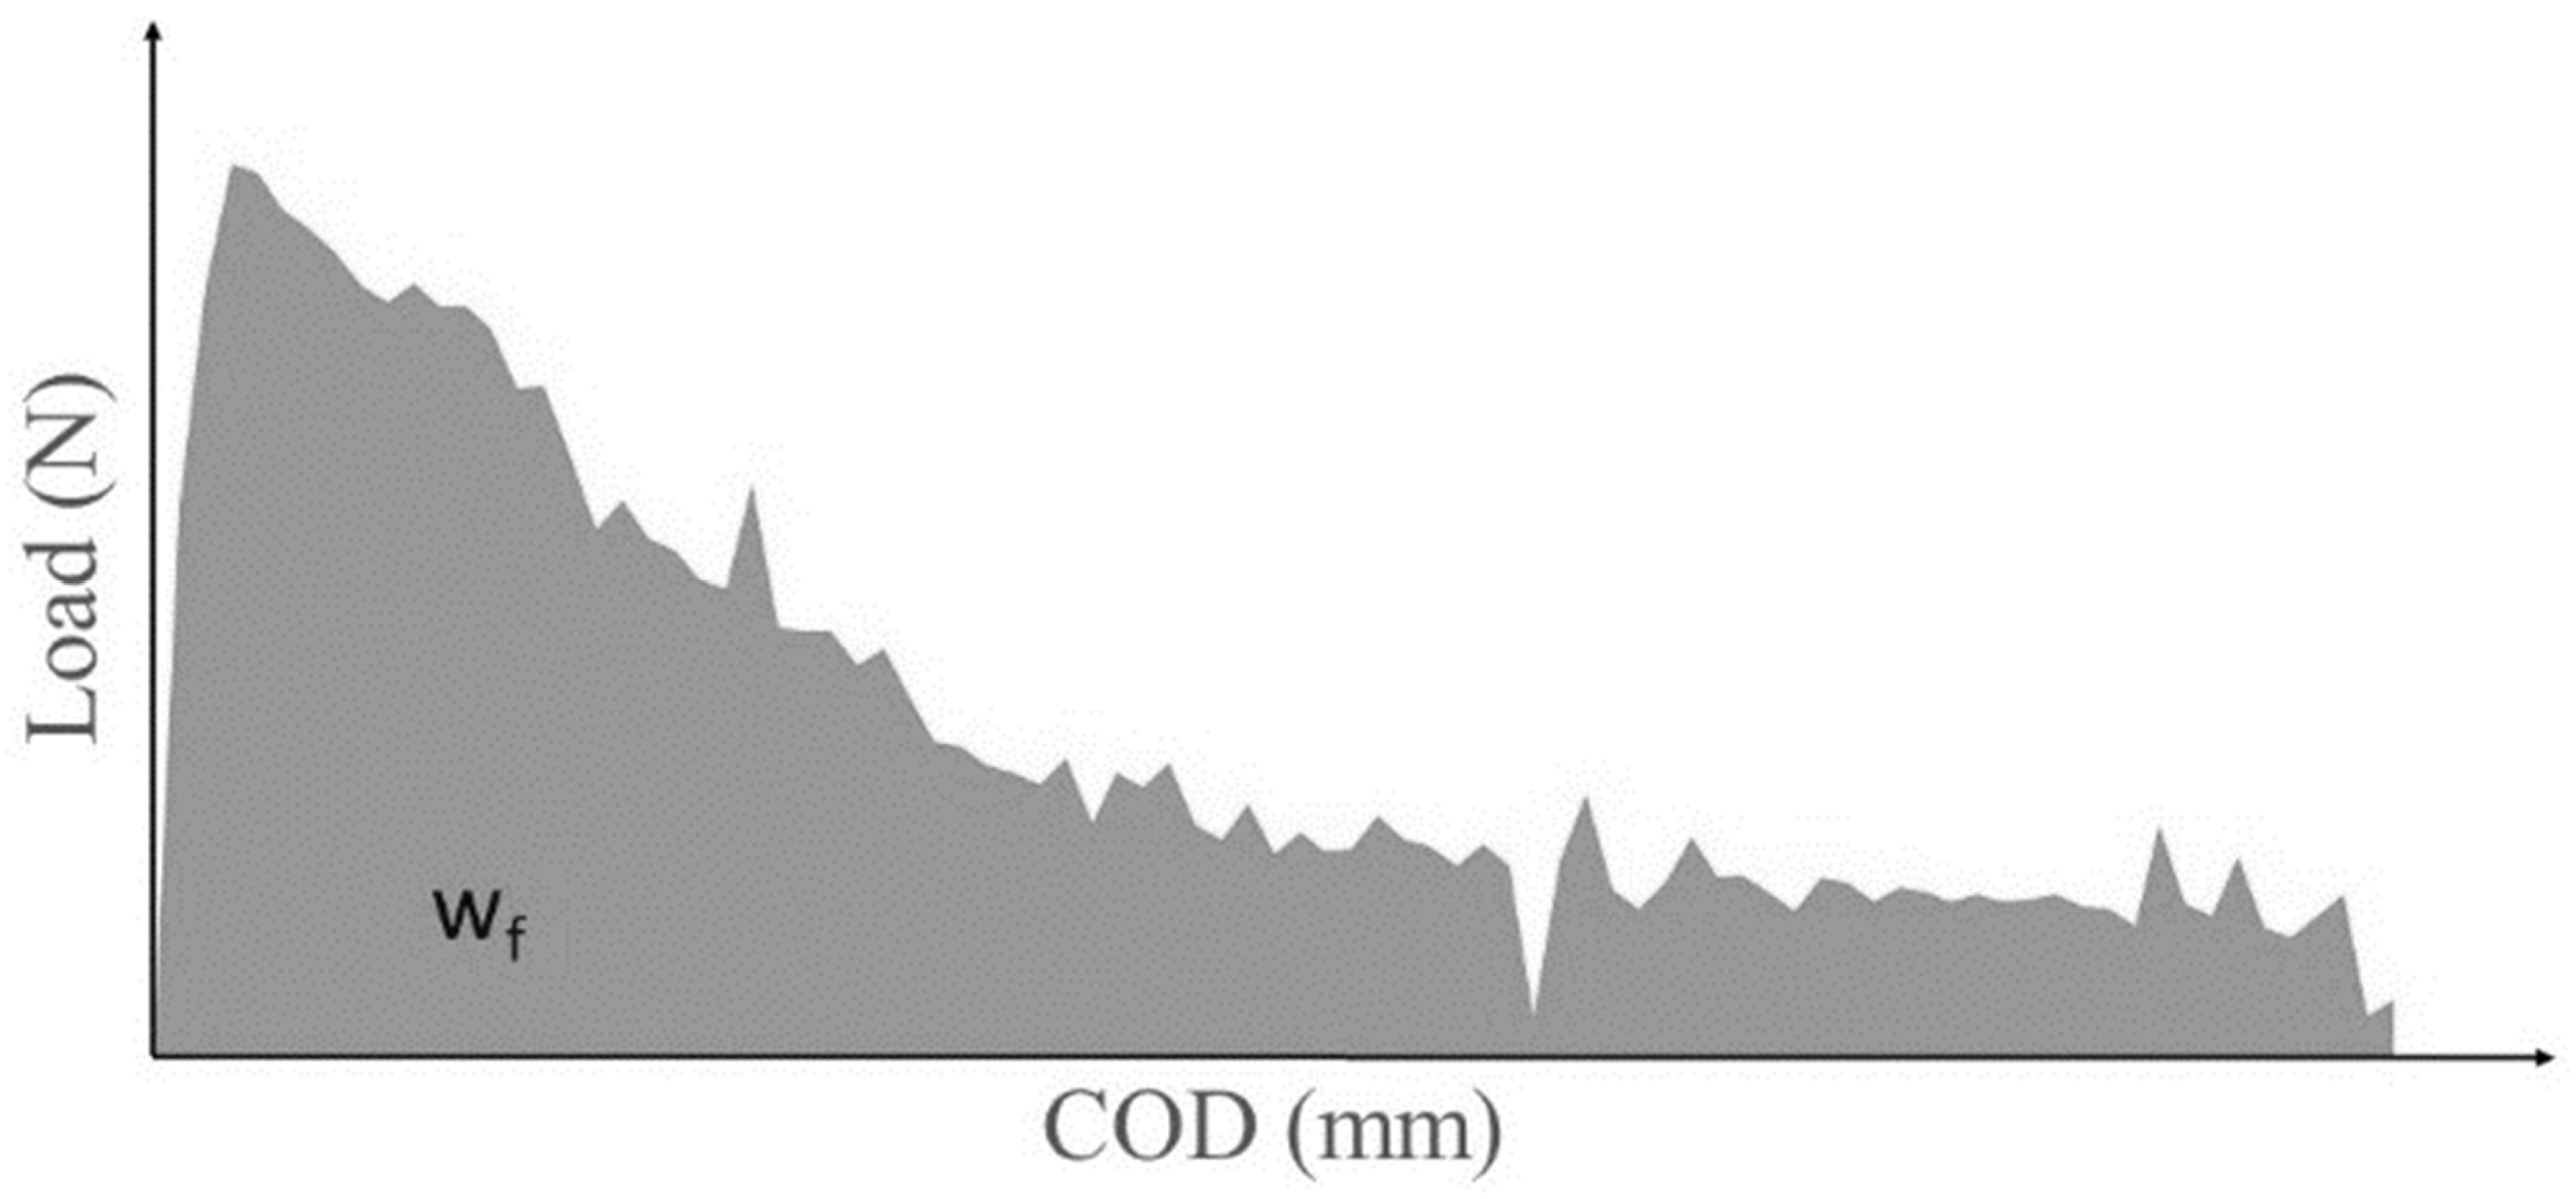
28] and can be obtained from the area under the load-COD curve as shown in
Figure 10. Accordingly, the total fracture energy (G
f) is determined based on the area under the load-COD curve normalised to the uncracked ligament area (A
lig) and is expressed in the Equation (4). Fracture parameters are determined following the ASTM guidelines [
20].
Table 4 summarizes the calculated fracture properties of concrete according to the work-of-fracture method applied to MDCT specimens.
The static tensile tests are carried out under displacement control of the electro-mechanical testing machine at a rate of 0.01 mm/min as discussed in section 2.4.1. The specimens are subjected to a static tensile test up to failure, and the average aforementioned fracture mechanical parameters are examined on each specimen as shown in the
Table 4. During the investigation, despite HPC-B and HPC-G exhibiting a certain amount of notch sensitivity, it is noticed that notch sensitivity is most prominent in concrete mortar (CM), implying that cracks propagating through such constituents are least arrested due to the absence of larger aggregates. Specifically, an increase in coarser and larger aggregates results in less pronounced notch sensitivity and is further verified by the calculated stress intensity factor discussed in
Table 4.
3.4. Cyclic Tests
3.4.1. Low Cycle Tests
Various specimens of HPC are tested in the Low Cycle Fatigue Test and one representative curve is presented to provide an overview of the recordings. Due to the displacement-induced propagation of microcracks, the stresses in the specimen continue to increase and consequently lead to an increase in strain. With the further increase in displacement, the microcracks develop into macrocracks and eventually lead to fracture of the specimen, similar to the phenomenon described in high cycle fatigue tests. Furthermore, it is evident from the
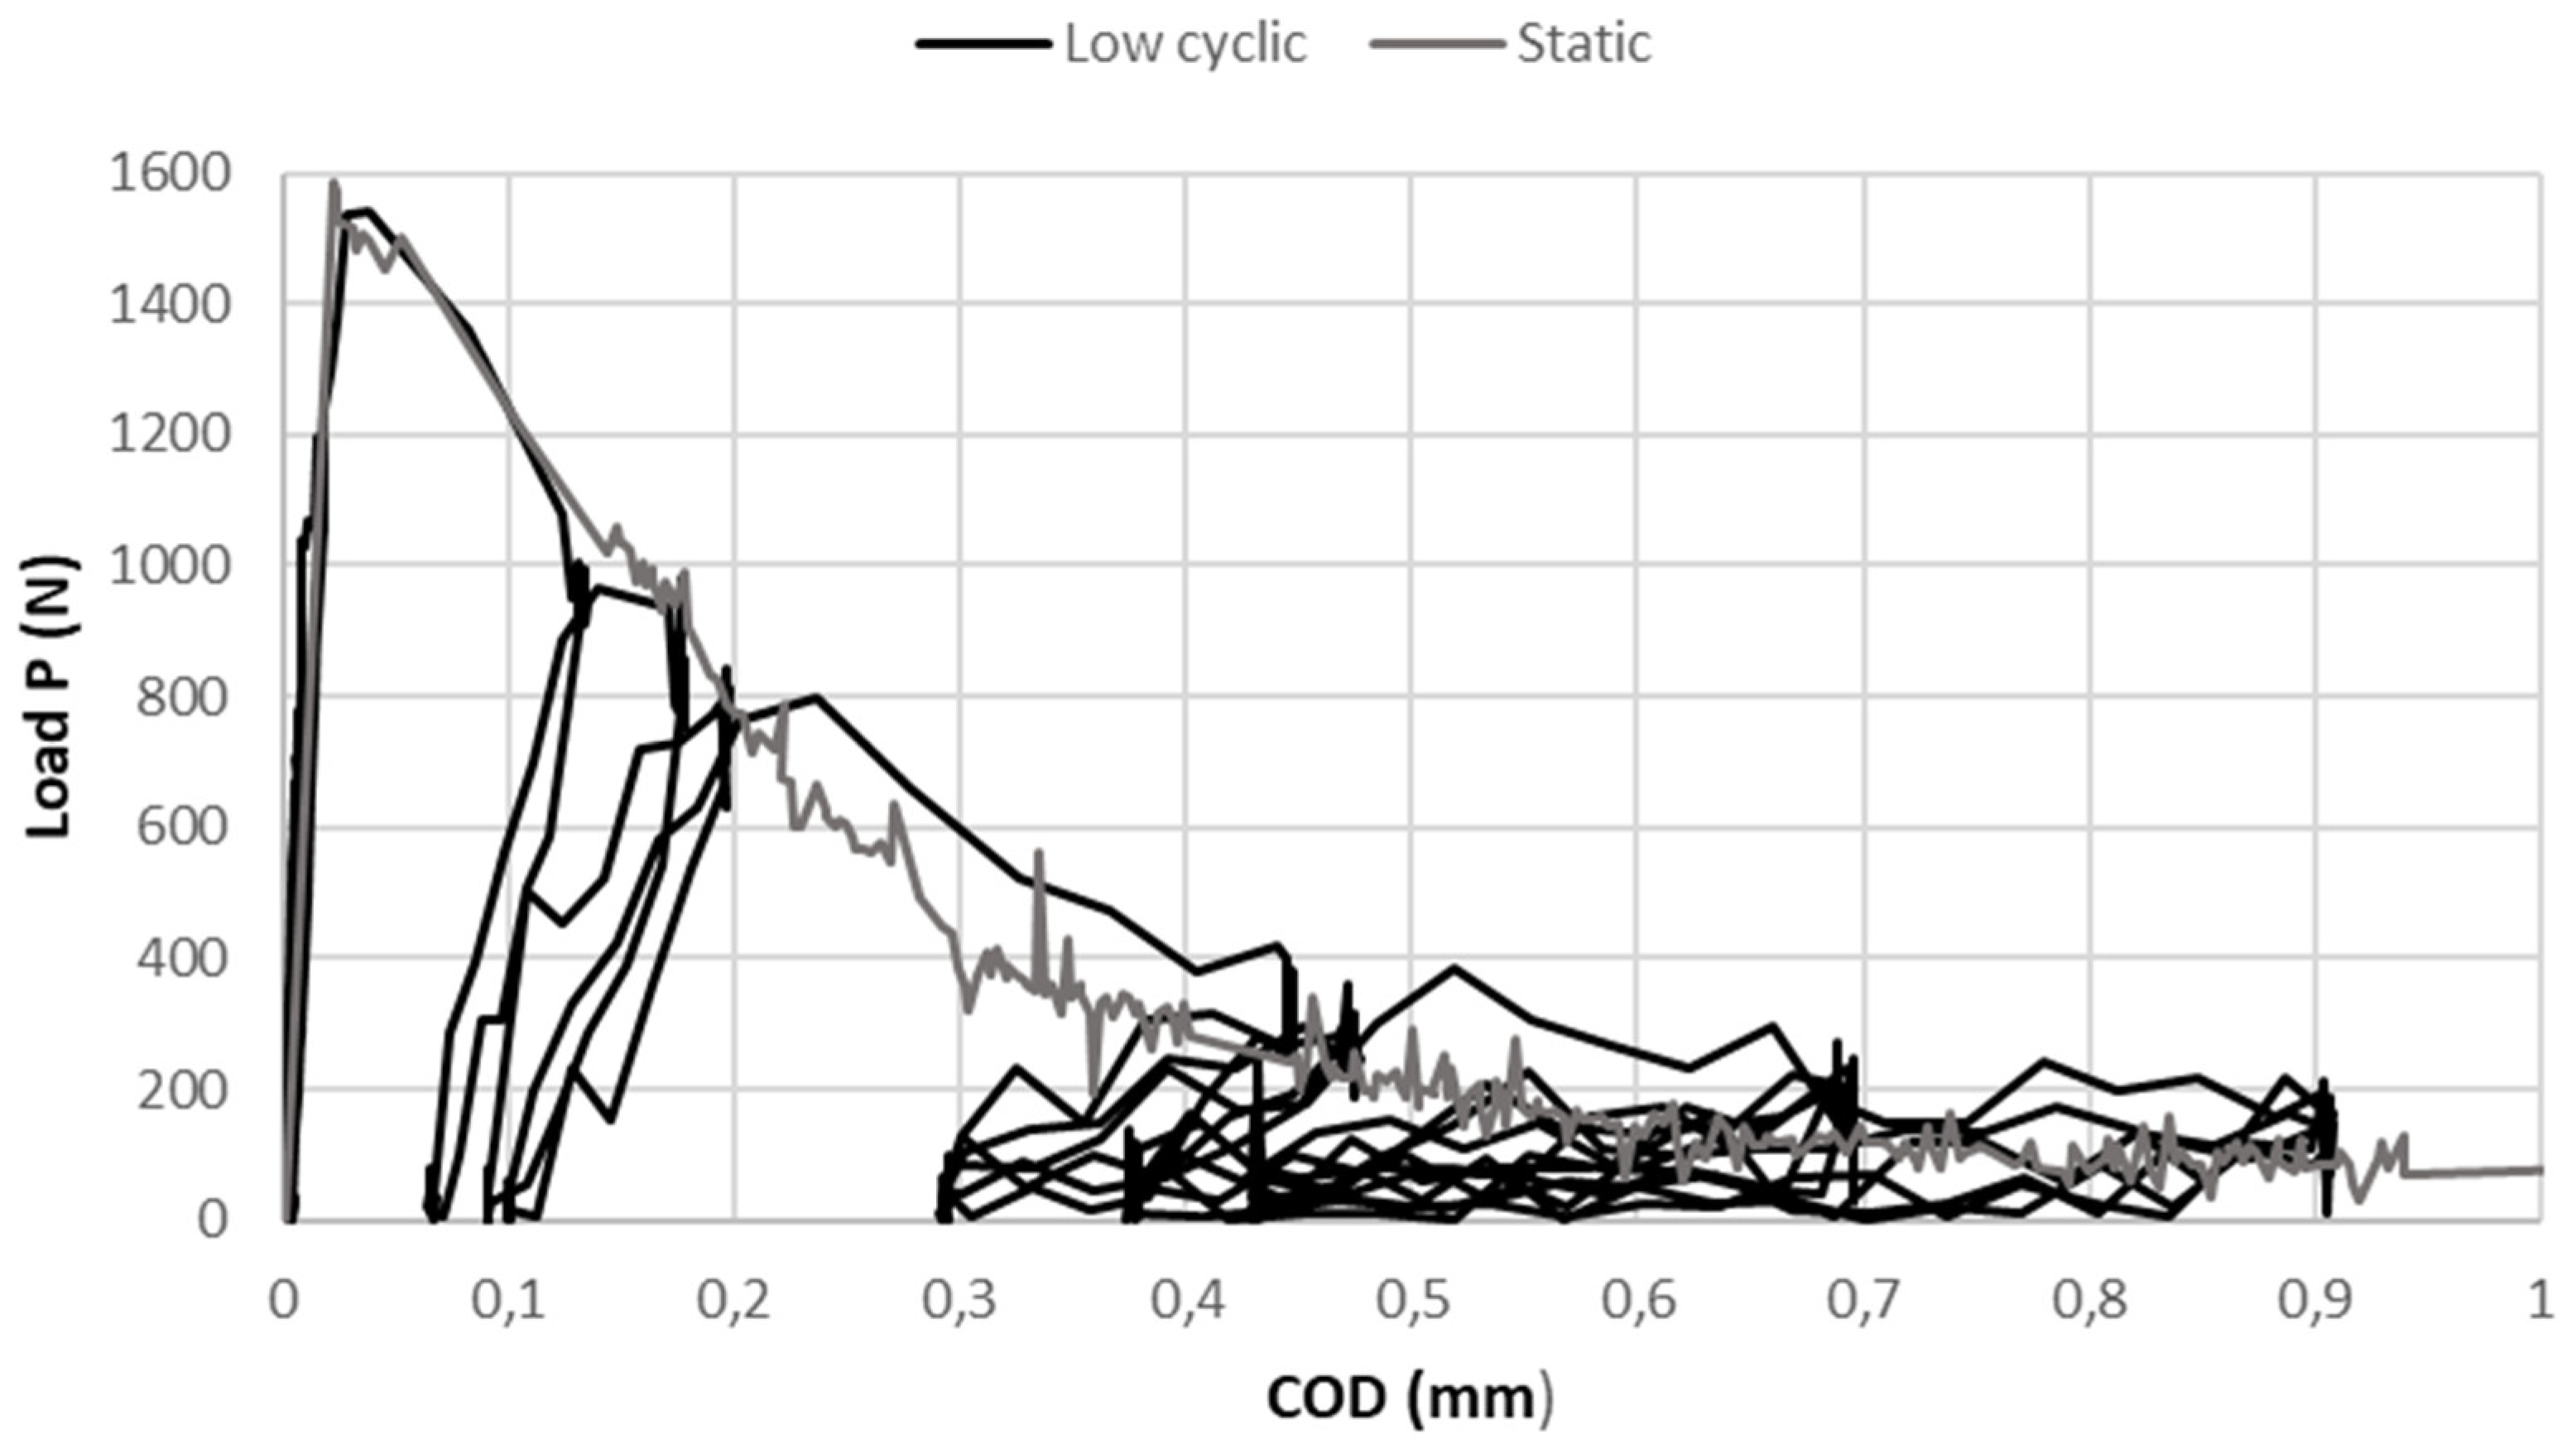
Figure 11 that the testing carried out under displacement control at a low rate and by implementing the above mentioned methodology, the fracture of the specimen occurs in a stable manner. The comparison of Load-COD curve for experimentally determined static and low-cycle fatigue tests is depicted in
Figure 12. In addition, it is noticeable in
Figure 12 that the force-displacement curves of the static and the envelope force-displacement curves of the cyclic tests appear to superimpose substantially. This indicates an extremely brittle behaviour of the investigated high-strength concrete, although very little energy is dissipated during cyclic loading. Besides, the fracture of the specimen is essentially mediated by the mechanical interaction of the aggregate-mortar matrix, and the crack-opening mode corresponds to pure mode I.
3.4.2. High Cycle Tests
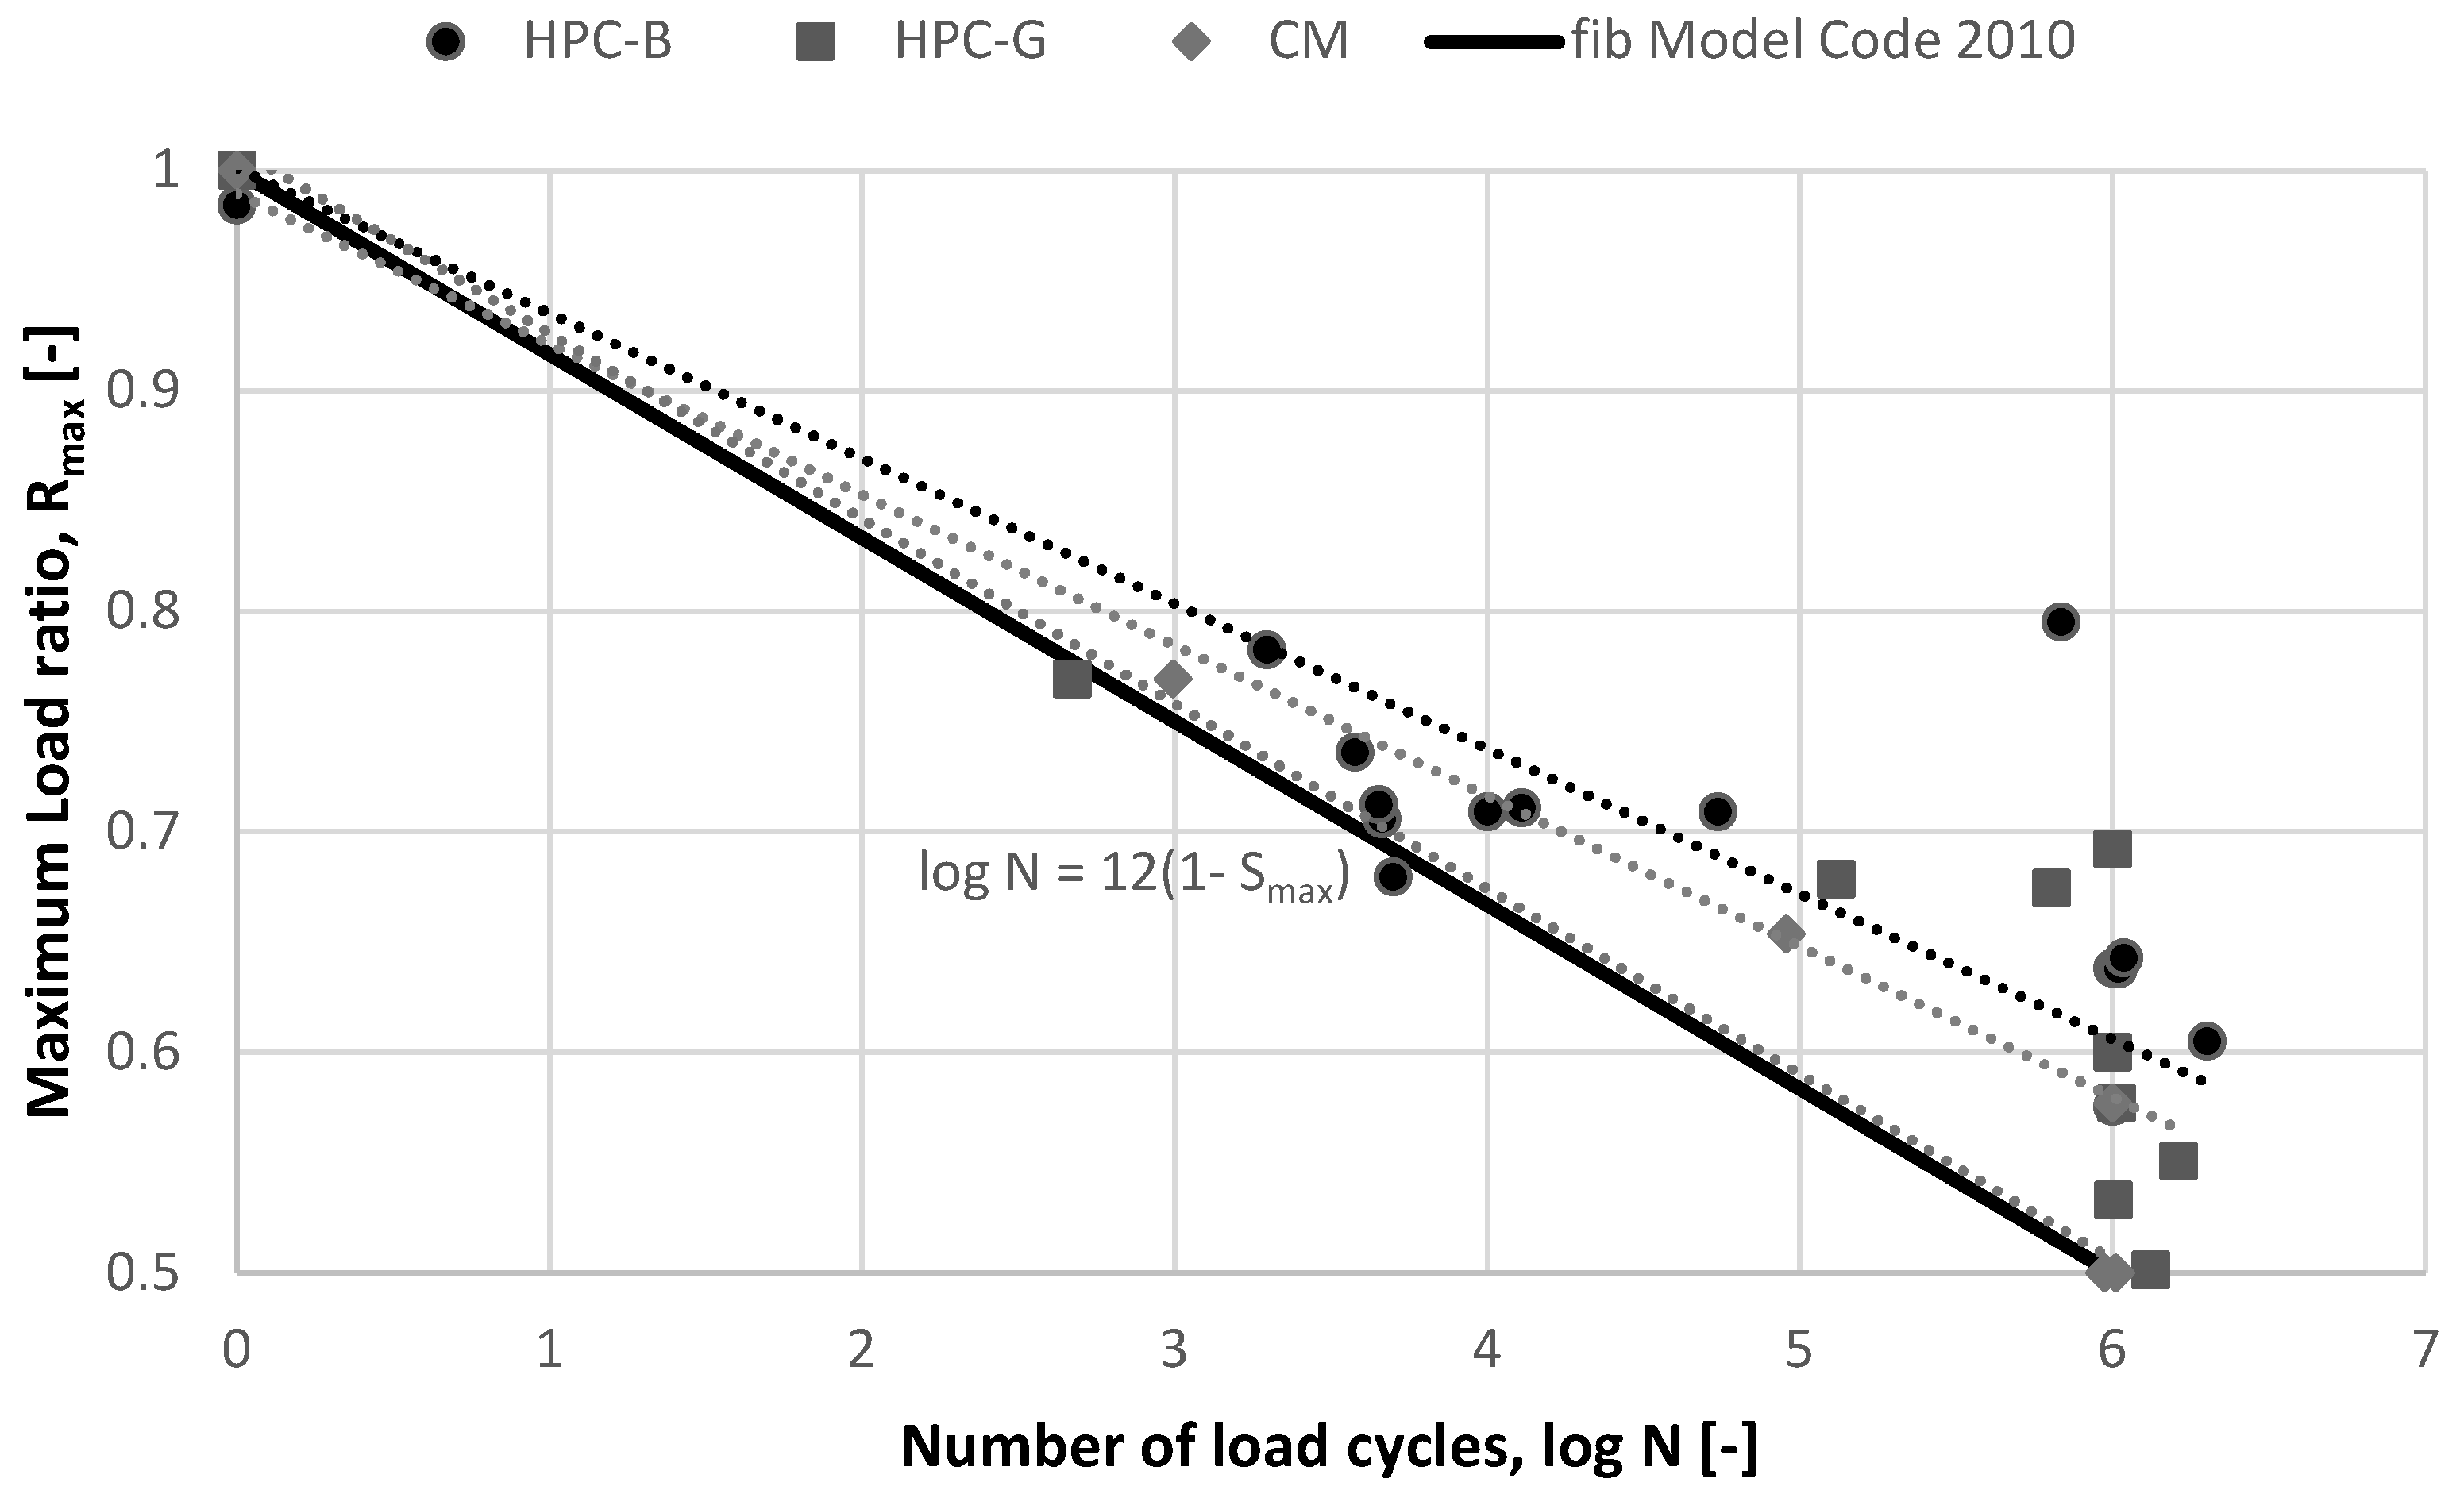
At least nine specimens of each composition are subjected to fatigue loading at variable load levels and the R-N curve is determined. The R-N curve is based on S-N curve/ Wöhler curve and represents a line graph obtained by linear regression with the vertical axis indicating the maximum load ratio and the horizontal axis presenting the logarithm of the load cycles, and it is used for fatigue life assessment according to the maximum load ratio.
Figure 13 shows test cases in terms of the number of load cycles and the maximum load ratios in the R-N curves. The maximum load ratios are specified based on the average ultimate load (
Table 4) obtained from static tests of the corresponding MDCT sample.
Figure 13 demonstrates the experimental results in comparison with the R-N curve from fib Model Code 2010 in terms of the number of load cycles and the maximum load ratio. It is evident from
Figure 13 that an increase in the load level results in a decreasing fatigue resistance of the concrete. In other words, the experimental results corroborate that the lower the maximum tensile load applied, the higher the number of cycles N that the material can withstand. The experiments carried out on different concrete compositions reveal that HPC-B is characterized by higher load levels in comparison with HPC-G and CM.
Furthermore, it is worth noting that the R-N curves have been determined on notched specimens and that these deviates only slightly from the R-N curve from the fib model code 2010 for unnotched specimens. The notches therefore do not lead to an increased reduction of the tolerable amplitude with increasing number of load cycles in the examined case.
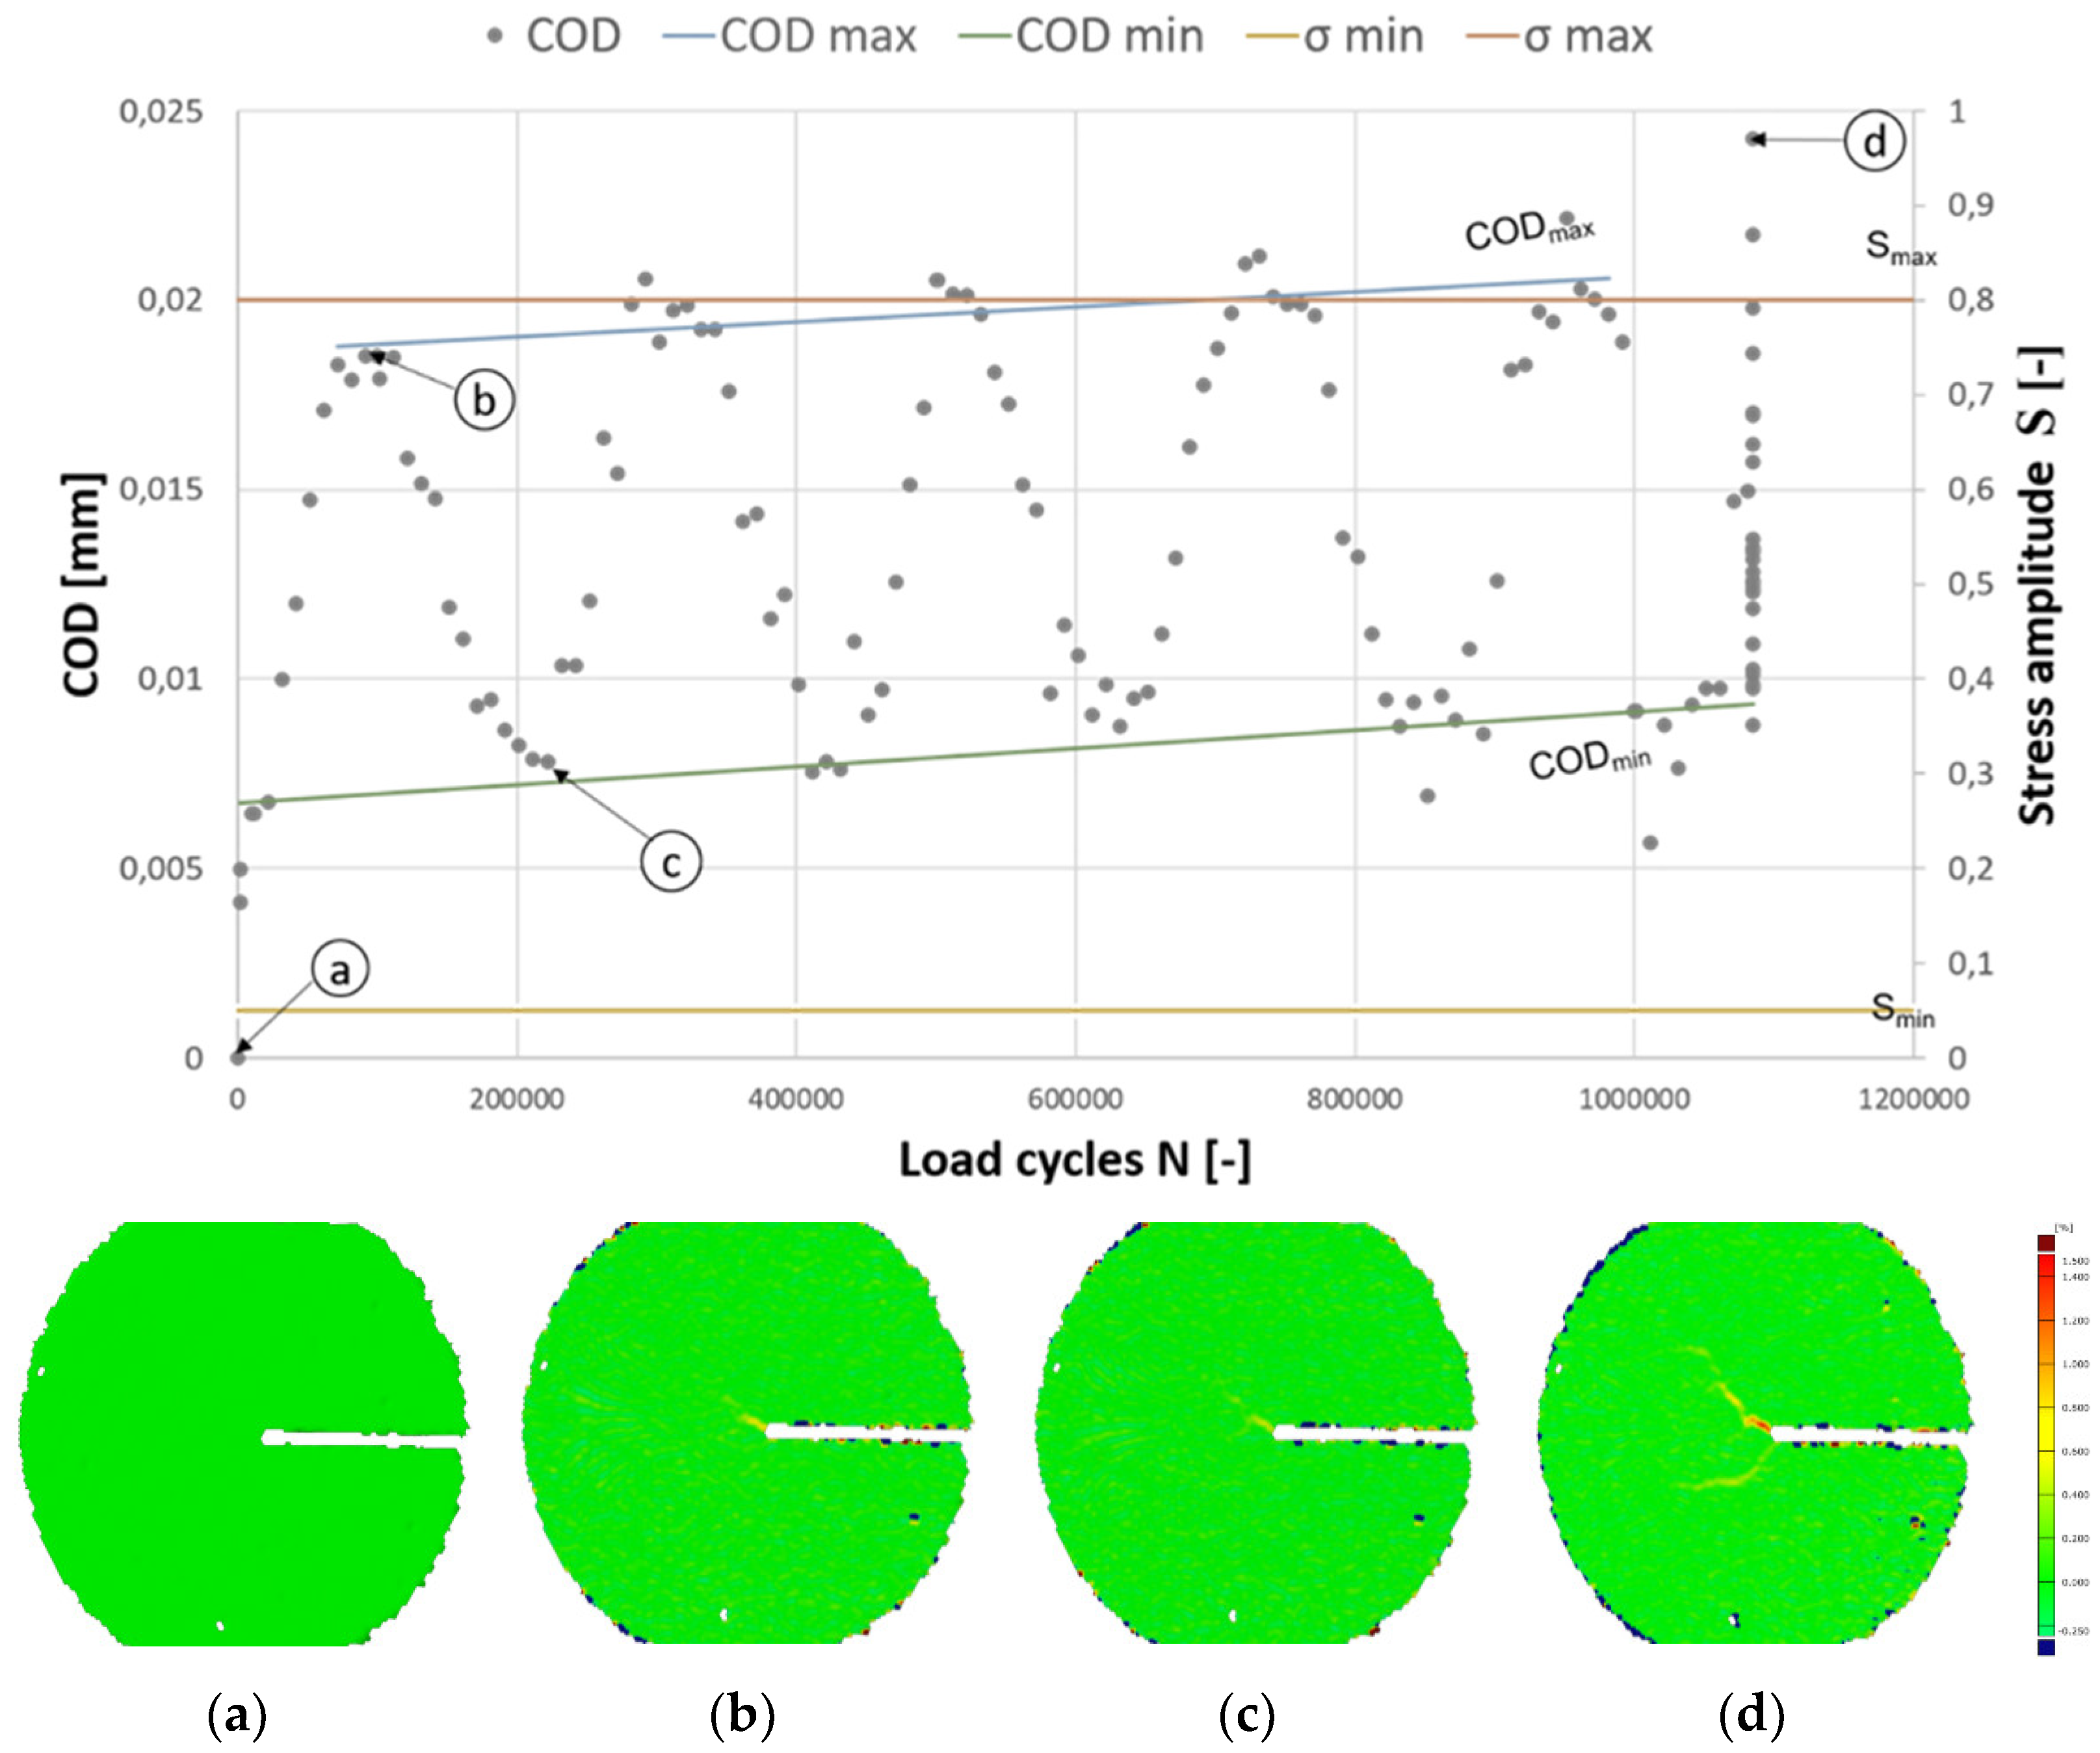
The evolution of the crack (a-d) with respect to a series of tensile loading cycles is demonstrated in
Figure 14, wherein
Figure 14a represents the initial non-deformed phase of the specimen. A cyclic tensile load that corresponds to 80% of the peak load obtained from static tests is applied at a frequency of 4 Hz to the specimen illustrated in
Figure 7.
Upon initiating fatigue loading, the specimen remained unchanged through 91,670 load cycles. At the commencement of the 91,671st cycle, early signs of plastic deformation are noted, indicated by a micro-crack opening displacement of 18.5 μm. This early deformation phase is depicted in
Figure 14b, correlating with the DIC recording at 100,000 load cycles. As the cyclic loading continued to increase, the specimen exhibited no notable additional deformation, maintaining a crack opening displacement of 20.5 μm as illustrated in
Figure 14c. This pattern demonstrates the characteristics of fatigue loading, wherein the surfaces resistant to a microcrack remain in contact, despite the progressive increase in cyclic loading on the specimen, reaching up to 1 million cycles. The mechanism of crack opening and closing continued to remain consistent up to 1.08 million load cycles, and with the further increase in load, crack bridging at the notch tip is observed at 1084297 load cycles (
Figure 14d). With the further increase in cyclic tensile load, a non-steady increase of microcracking phenomena associated with increasing load cycles is noticed in HPC. The microcrack eventually leads to a macrocrack and subsequently to the fracture of the specimen, which is accompanied by a decrease in stresses and an increase in strain. However, as soon as a microcrack evolved into a macrocrack, the novel technique of implementing an external triggering mechanism in the current study facilitated the triggering of the signal to the DIC system, allowing the acquisition of images at a rate of 15 Hz, thereby signifying the brittle failure of the specimen.
It is widely acknowledged that microcracks develop in the mortar matrix of concrete when subjected to cyclic loading. However, in the current investigation, the concrete mortar exhibited a compressive strength of over 97 MPa, which raises the pertinent question of whether the microcracks indeed originate in the matrix and how it affects the material integrity. In order to investigate this phenomenon, the concrete equivalent mortar has been considered to study the effects of fatigue loading on the mortar.
Furthermore, although HPC-B and HPC-G exhibited certain degree of notch sensitivity, it is observed during the investigation that notch sensitivity is most pronounced for concrete mortar (CM), suggesting that cracks propagating through such constituent materials are least arrested due to the absence of larger aggregates. In other words, an increase in coarser and larger aggregates results in less pronounced notch sensitivity and is further verified based on calculated stress intensity factor, which is discussed in
Table 4.
3.5. Post-Fatigue Analysis of Residual Fracture Toughness
There are only a few investigations documented in the literature on the residual strength of concrete under cyclic tensile loading [
30,
31,
32,
33,
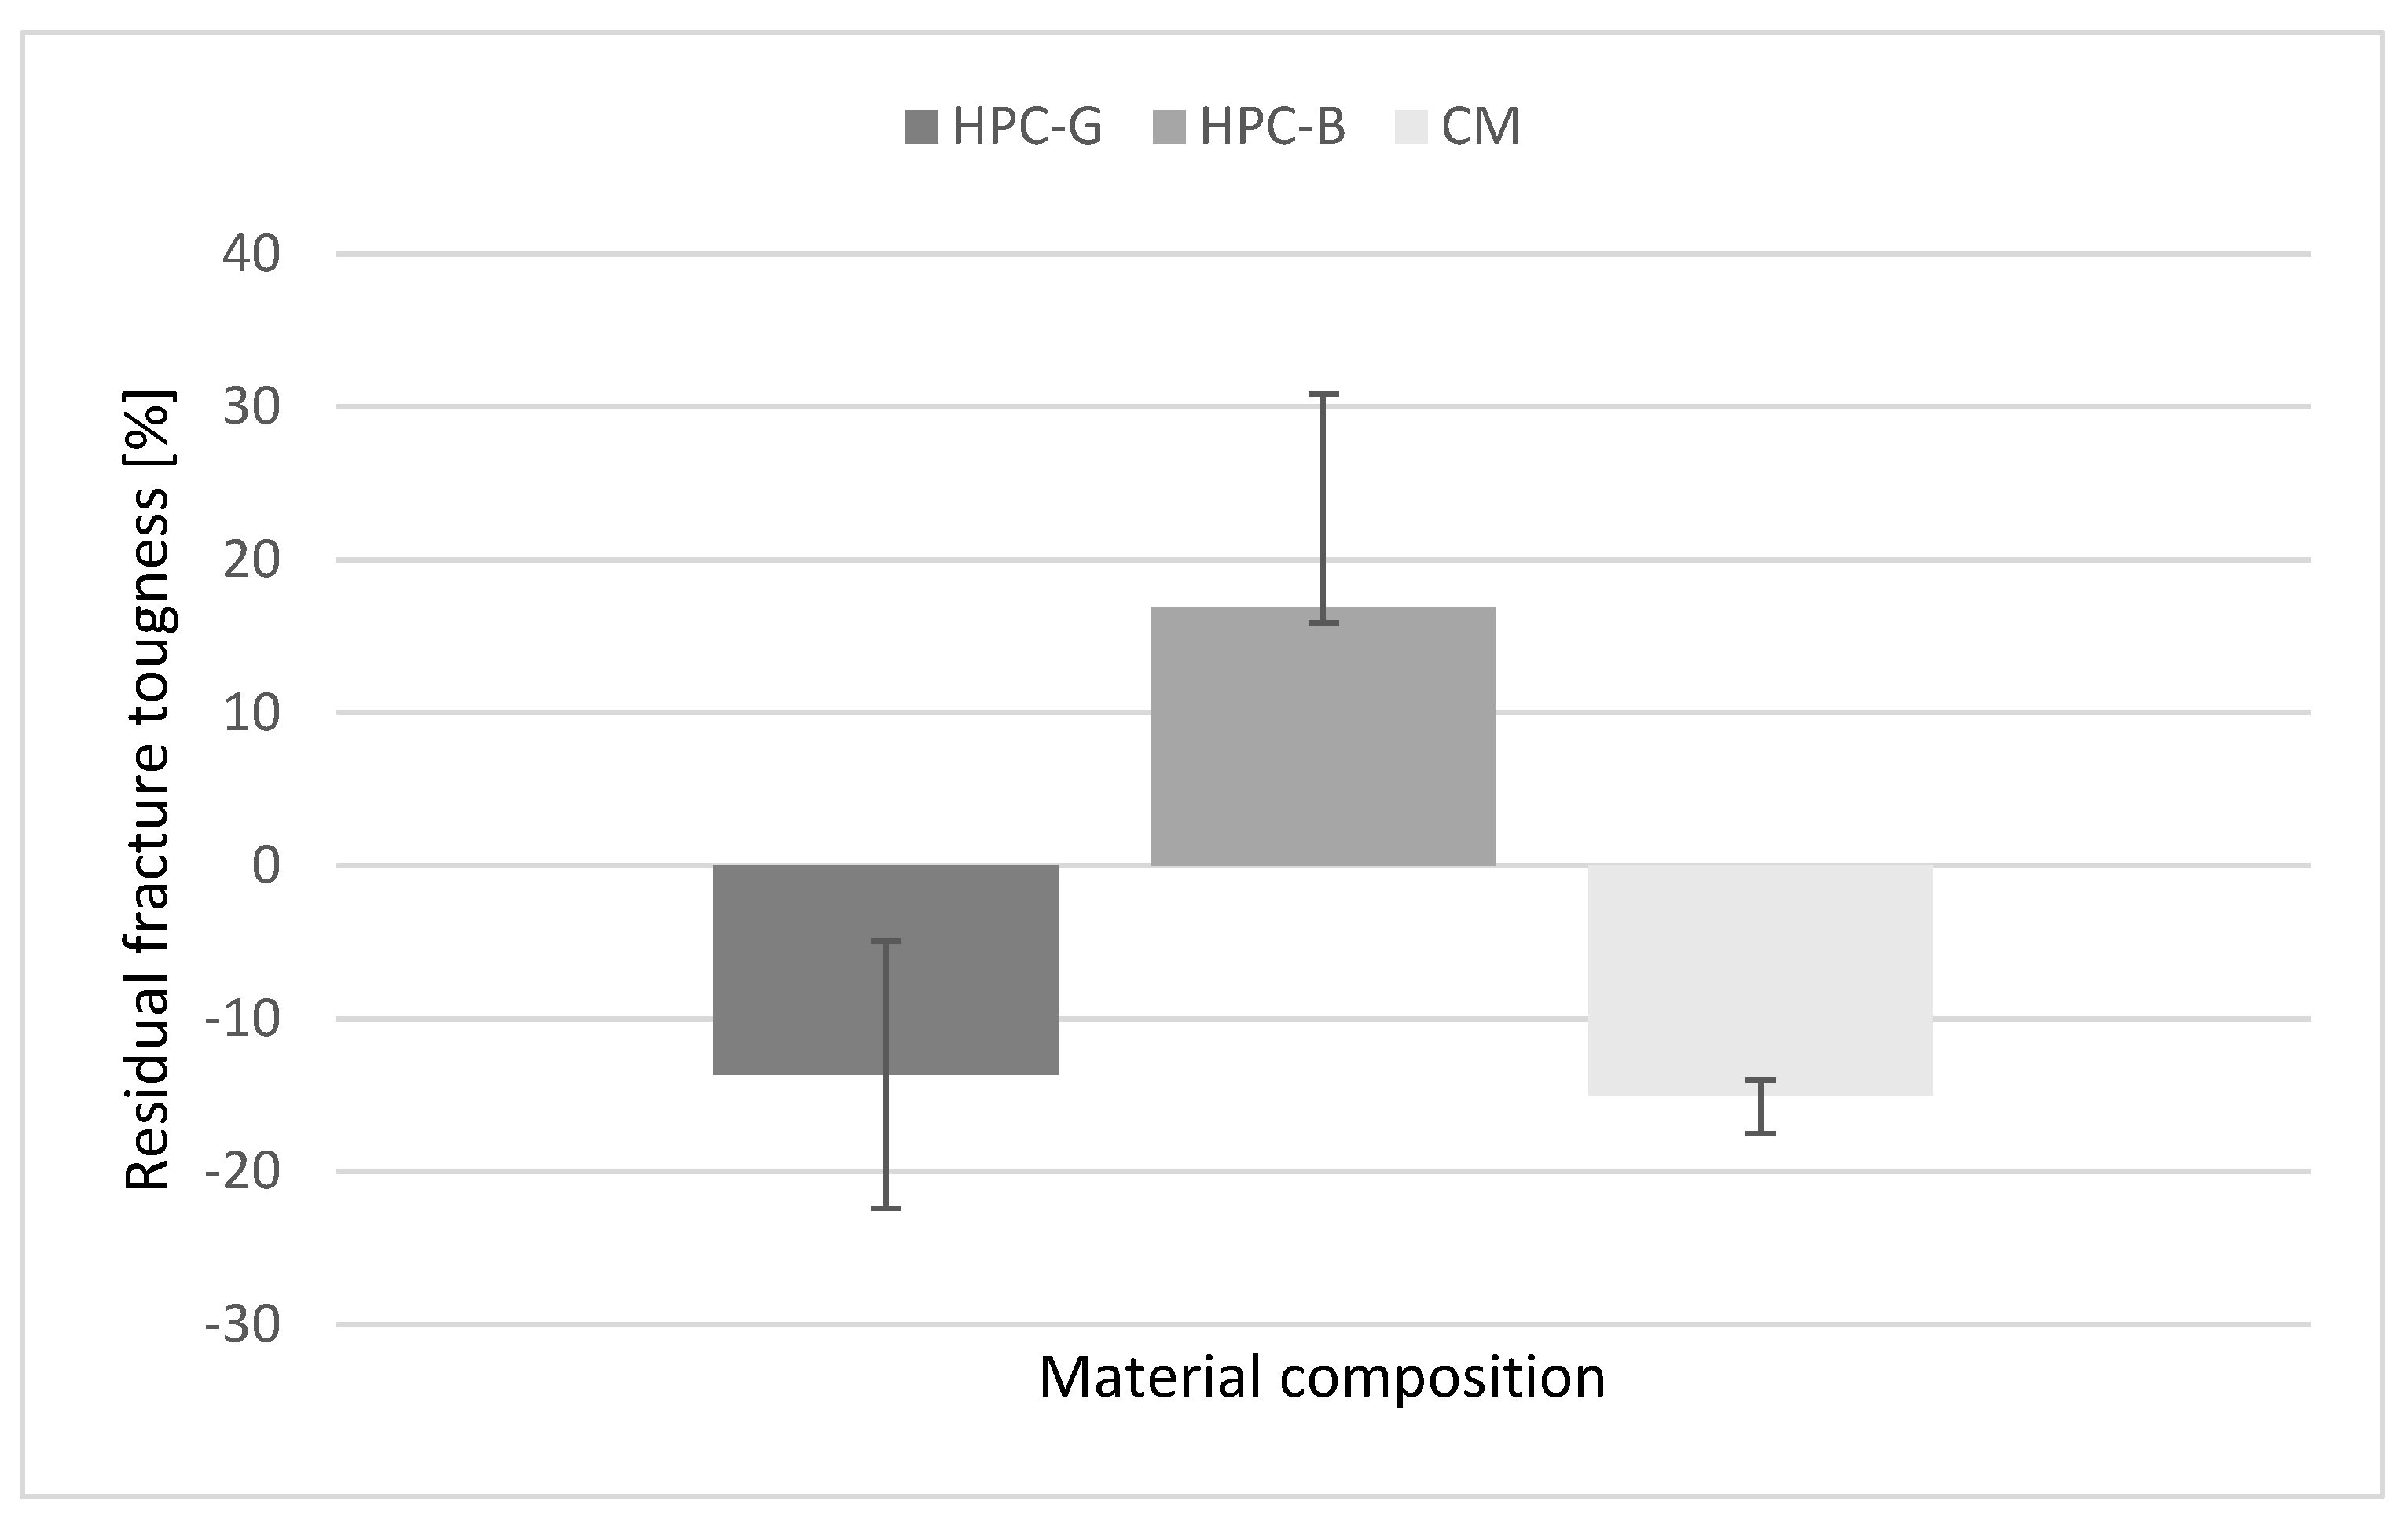
34] and no studies on the analysis of the residual fracture toughness. Although the residual strength of concrete under cyclic compressive stress has been recognized in the past, it is not identified and described with sufficient accuracy under cyclic tensile stress. The specimens that survived the maximum prescribed number of load cycles (1 million in the current study) are reloaded under quasi-static conditions to investigate the effect of cyclic loading on the fracture mechanical performance and the residual fracture toughness of the different concrete compositions. In the current investigation conducted to investigate the residual fracture toughness and fracture energy of HPC-B, a clear tendency can be observed despite considerable scatter. The experimental investigations reveal that only HPC-B possesses a residual fracture toughness and preceding cyclic load lead to an improvement in post-fatigue fracture toughness, while HPC-G and CM demonstrate complete lack of such a behaviour.
The residual tensile tests are carried out under displacement control of the electro-mechanical testing machine at a rate of 0.001 mm/min. With the introduction of loading, the concrete enters the elastic phase and the specimen remains undistorted. However, as the load increases, small cracks gradually appear in the concrete, yet the initiation of microcracks cannot be observed with the naked eye. As the load continues to increase, the cracks in the concrete continue to extend further when the stress intensity factor at the crack tip reaches the initial concrete fracture toughness and the macrocracks appear to fall under human sight. Following, the formation of initial crack in concrete, the crack propagates into a stable phase and once the load reaches its peak, the initiation of crack is observed in the direction of the prefabricated notch.
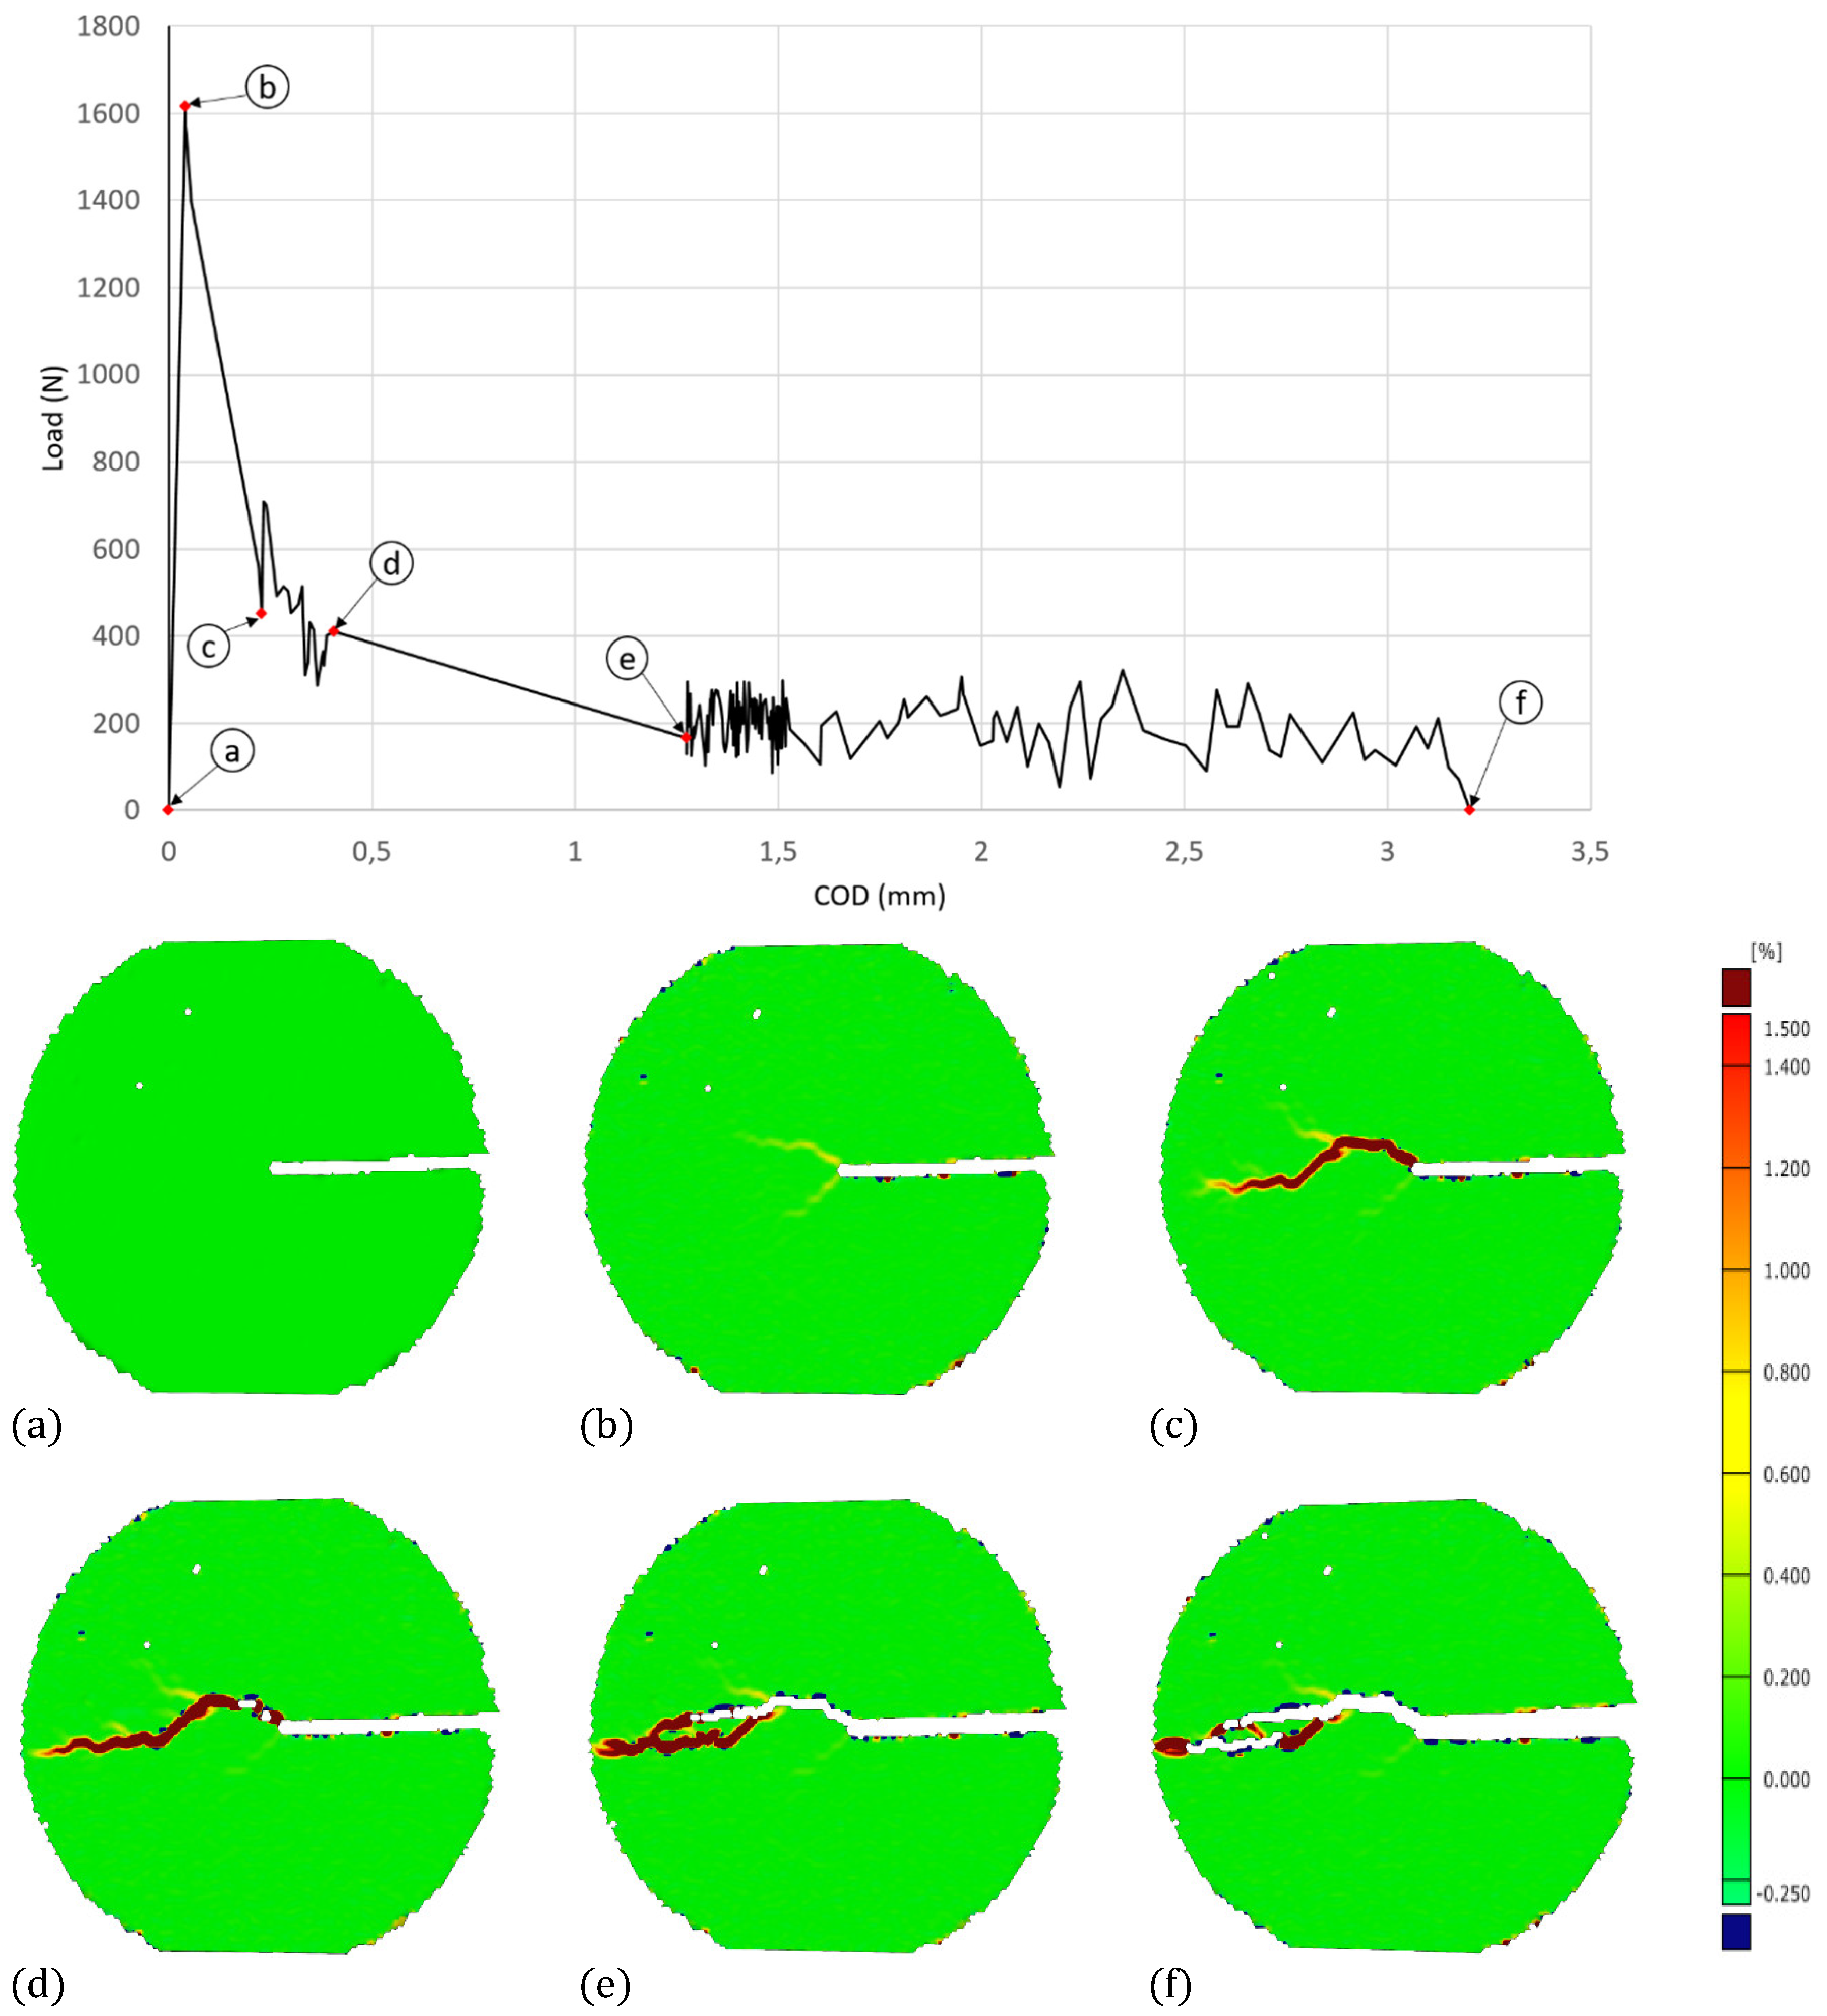
The entire course of deformations and displacements of the specimens during the tests are measured with a digital 3D image correlation device ARAMIS from GOM. The time duration needed to obtain the curve of the softening mechanism shown in Figure 15 amounted to a total of about 67.074 hours. In the process, the load (P) – crack opening displacement (COD) curves are obtained after post-processing the digital images taken during the test. The precise determination of such a load-COD (P-COD) is decisive for evaluating the work-of-fracture required to split the specimen into two halves.
Figure 15.
a-f Evolution of crack path recorded with DIC tool during post-fatigue static tensile test.
Figure 15.
a-f Evolution of crack path recorded with DIC tool during post-fatigue static tensile test.
The evolution of the crack (a-e) with respect to the static tensile load is demonstrated in Figure 15, wherein Figure 15a represents the initial non-deformed phase of the specimen. From the load-COD curve, it can be noticed that the initial part, the curve is almost linear and the strain at the notch tip increases with increasing load. Following a linear phase of the P-COD curve, the deviation from the linear curve is observed and the local tensile strain increases to about 1 %, which suggests the initiation of crack formation at the tip of the notch. With the further increase in tensile load, the curve demonstrates an increase in tensile strain until the peak load of 1616 N with a COD of 40 μm is reached, so that the strain at which the load reaches its maximum value is considered to be the initial crack load and the corresponding recording is illustrated in Figure 15b. After the maximum peak load, a brittle failure of the specimen is observed, with the load reducing dramatically with crack opening displacement being 0.228 mm as depicted in Figure 15c. This is due to the sudden drop in stress as a result of progressive deformation. In addition, the abrupt increase in tensile load from 451 N to 700 N (Figure 15c) is attributed to the presence of a stronger basalt aggregate intervening the crack growth path, indicating a phenomenon of crack branching as well as a progressive increase in resistance imposed by the aggregate interfering with the crack path. The gradual decrease in load from 411 N with a COD of 0.406 mm to 166N with a COD of 1.273 is observed and is ascribable to crack bridging as depicted in Figure 15e. Due to the highly brittle properties of cement paste and interlocking of aggregates, the behaviour after the Figure 15e exhibits an unstable, abrupt upward and downward motion, as depicted in the Figure 15f. In addition, it is apparent from the Figure 15, the P-COD curves from ARAMIS measurements effectively characterize the different stages (a-f) of crack propagation and crack-opening mode corresponds to pure mode I.
Furthermore, it is evident from the experimental studies that each P-COD curve of HPC-B, HPC-G and CM demonstrates the same pattern, which consists of three distinct portions: the linear-elastic phase before crack initiation; the elastic-plastic phase of stable crack propagation before unstable failure; the unstable expansion phase after peak load. In order to investigate the effect of cyclic loads on the strength and stiffness of various material composition of HPC-B, HPC-G and CM, a series of residual tensile tests are subsequently performed following principle as discussed previously.
Examining the overall behaviour of HPC-B, despite the application of over 1 million load cycles at a load level below R
max = 0.75, the fatigue loading does not appear to affect the post-fatigue load bearing capacity, and the softening curve tends to follow the shape expected for a strictly static loading. For the majority of specimens, the maximum load of the post-fatigue peak is at least 9 percent higher than for the solely statically loaded specimens as depicted in the
Table 5. However, the same trend is not observed in the composition of HPC-G and CM. In addition, in the case of HPC-G and CM, when the load level exceeds 60% of the static load, the specimen is expected to fail in the range of 10000 to 700000 load cycles, and the ultimate strength obtained upon post-fatigue is lower than the ultimate strength obtained during static testing.
Figure 16.
Average increase/decrease in post-fatigue residual fracture toughness.
Figure 16.
Average increase/decrease in post-fatigue residual fracture toughness.
The underlying explanation for the post-fatigue behaviour of HPC-B is complex considering that the concrete is composed of several materials with different physical and mechanical properties and the corresponding matrix-aggregate bond. The authors hypothesize that the reason for the increased residual fracture toughness of HPC-B after fatigue testing is that the cyclic loads reduce the pore structure in the concrete at the nanoscale to improve material compaction, along with improved interaction between the basalt aggregates and the matrix. In addition, the possibility of redistribution of stresses and consolidation after plastic deformation cannot be ruled out. The authors recommend further testing to clarify the post-fatigue behaviour of HPC-B.
3.6. Computed Tomography
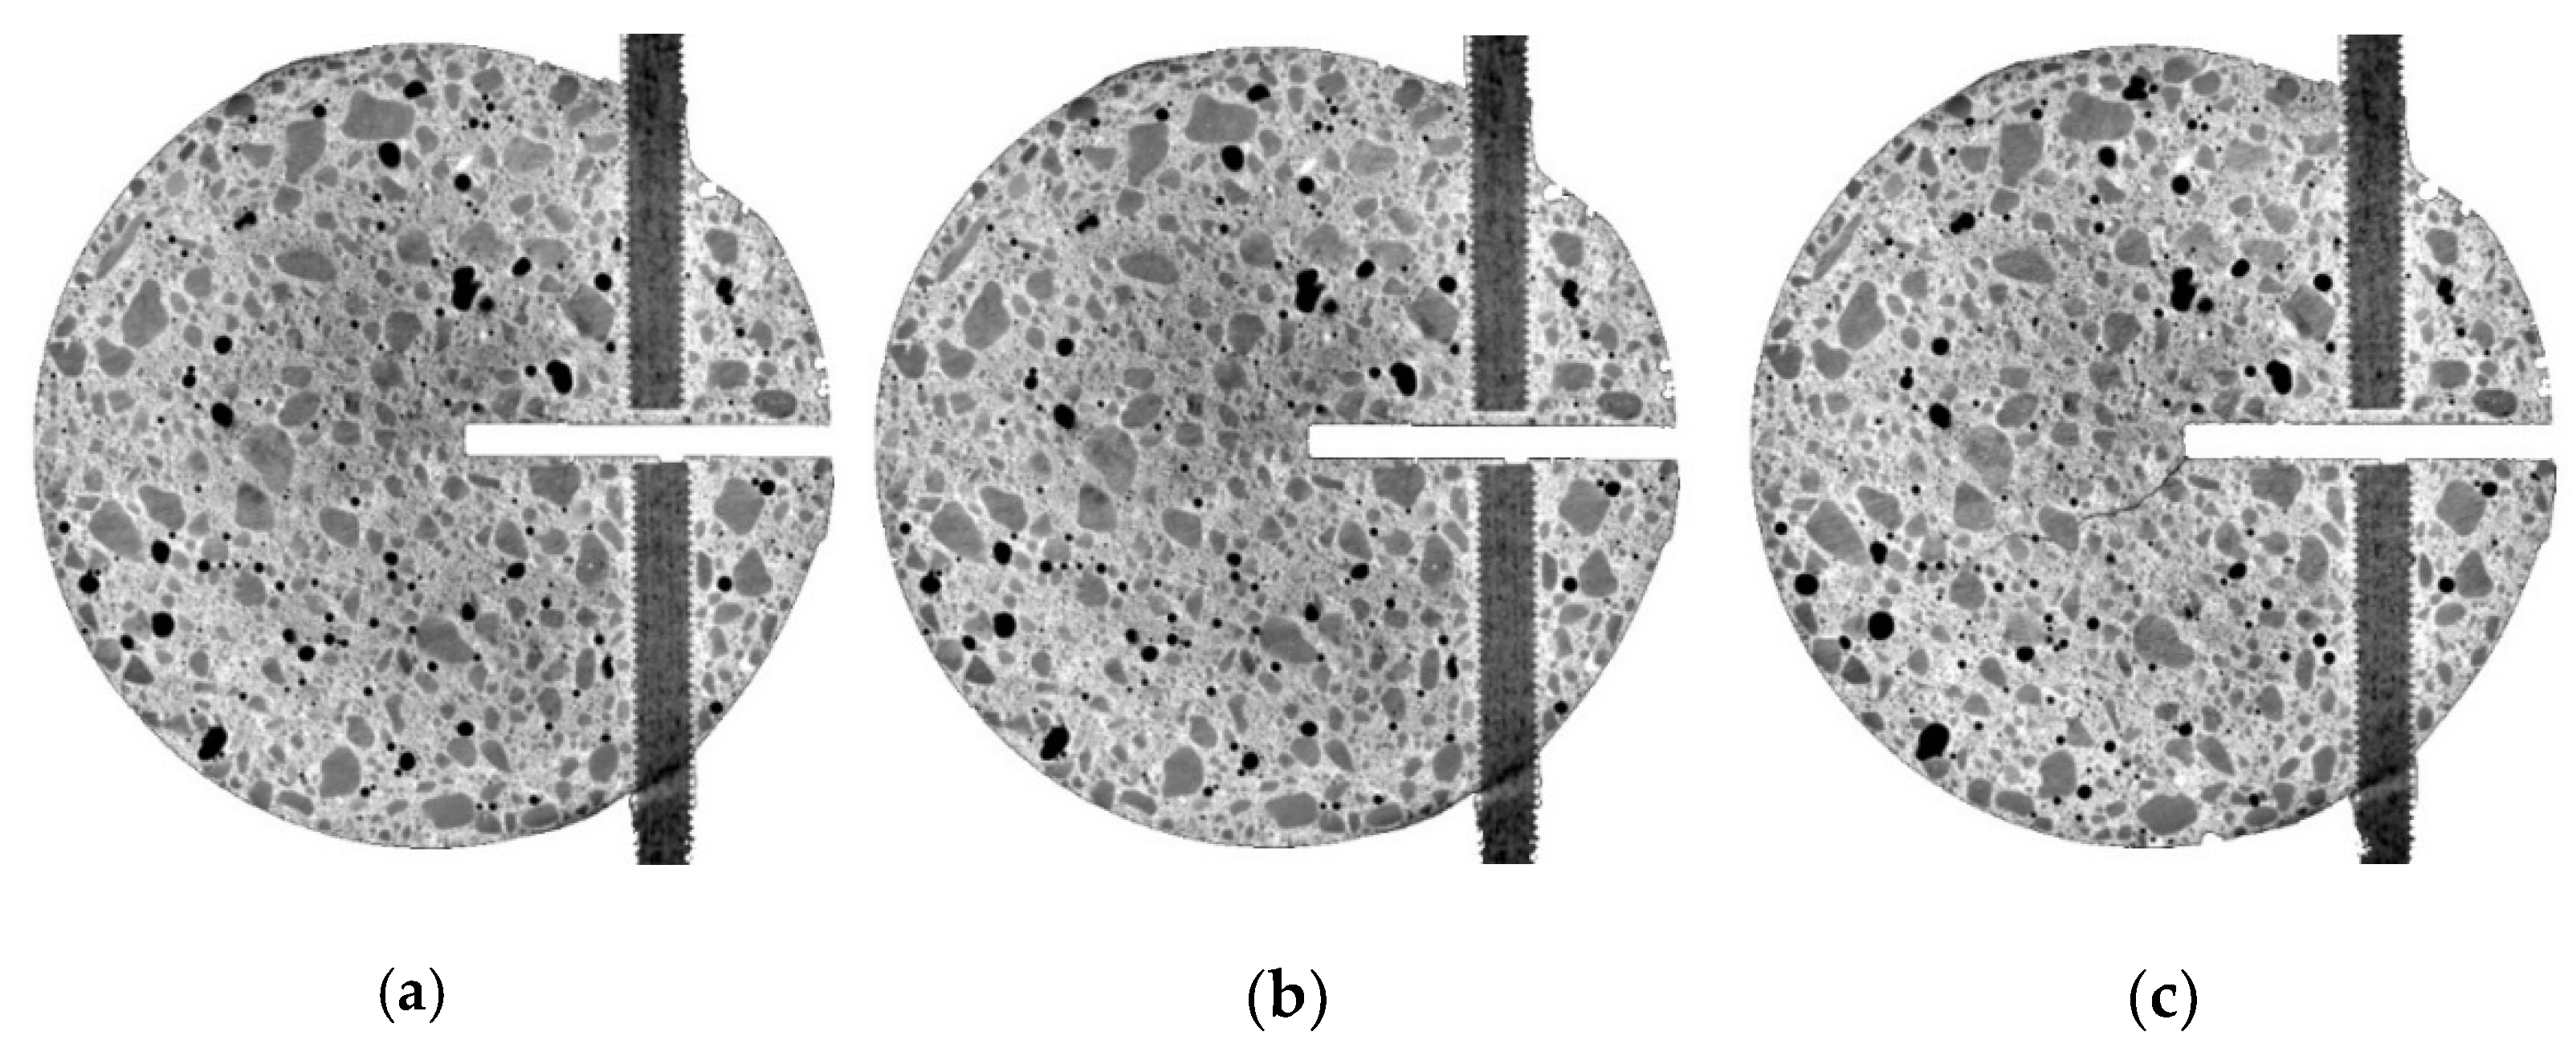
After completion of the MDCT tests under both static and cyclic loads, all samples are scanned in order to visualise the internal 3D mesostructure of the concrete. By means of CT scanning technology, an image is generated to meticulously examine the aggregate locations, their orientations in each specimen and the internal microcracks, so that the resistance mechanisms, i.e., the mechanisms utilised by the specimen to withstand the tensile load are observed.
The MDCT specimens are subjected to scans using Phoenix VTOMEXS 240 computed tomography system from GE Sensing & Inspection Technologies GmbH. The intensity-controlled X-ray source transmits a conical beam through the specimens, which is received by an array of detectors that measure the loss of X-ray intensity as a function of the density of the mesostructural components of HPC along its path to facilitate reconstruction, 1000 x-ray images with a resolution of 1000 × 1000 pixels are generated. The test specimens are subjected to CT scans with a voltage, current and image acquisition time of 140 kV, 290 µA and 500 ms respectively. The reconstruction software “phoenix datosx” reproduces the volume as an image stack with a voxel edge length between 10 and 40 µm using automatic scan optimization for correction of drift effects and beam hardening correction.
The post-processing tool allocates a grey value to each voxel, from 0 (corresponding to the least dense voxel, i.e., the voids and cracks) to 255 (the densest voxel, i.e., the aggregate). The outcome of the scanning process is a file containing the Cartesian X, Y and Z coordinates of the voxel’s centre of gravity and an integer from 0 to 255 relative to the density of the voxel. In this grayscale framework, a value of 0 corresponds to ‘black’, indicating the least density, and a value of 255 corresponds to ‘white’, indicating maximum density. This differentiation aids in accurately distinguishing between various features in the visual data. The greyscale difference between aggregate particles and the surrounding material is sufficient enough to identify the particles with the threshold value method.
The CT image stack is segmented with a grayscale threshold using MATLAB. Voxels with a grey level above this threshold are assigned a value of 1 and the background material a value of 0. The watershed algorithm divides connected particles in the binarized image and the regions are subsequently analysed with the MATLAB function “regionprops3” to calculate the surface and the volume of individual particle. The segmentation of the computed tomography scans enable to generate a real geometry representation. The segmentation of cementitious composites is not trivial because of the limited contrast between cementitious matrix and aggregates following their very similar composition and density. Furthermore, fine aggregate particles with a diameter less than 0.125 mm can be substituted by highly X-ray absorptive barite powder to enhance the contrast between the cementitious matrix and the aggregates, allowing a semi-automatic segmentation. The four concrete phases can be directly used to describe the mesomodel: air, basalt aggregate, cement mortar and the interface transition zone [
35].
Figure 17 elucidates the reconstructed image of an HPC-B sample through various stages of the MDCT tests.
Figure 17(a) displays the specimen prior to high-cycle fatigue testing, showing no visible cracks.
Figure 17 (b) shows the specimen after undergoing one million load cycles at a load ratio of 0.70, with no evident cracking as confirmed by CT scans.
Figure 17 (c) illustrates the specimen following a residual static loading test, revealing the crack path traversing through the matrix material and around the aggregate particles. This underscores the robustness of the HPC-B material under cyclic loading conditions. The crack path and the course of the crack through the matrix material and along the periphery of aggregate particles can be readily observed in
Figure 17(c). This particular observation underscores the morphological influence of aggregates on the fracture mechanics of the concrete. The post-test CT scans provide concrete evidence that the interaction between aggregate interlocking and crack bridging plays a critical role in energy dissipation during the fracture process. This detailed analysis not only highlights the superior performance of HPC-B under cyclic loading but also emphasizes the crucial role of aggregate morphology in defining the material’s fracture behavior and energy absorption capabilities.
4. Conclusions
Within the scope of a research project of the special priority program SPP 2020, this study conducted a comprehensive investigation into the mechanical, fracture, fatigue and post-fatigue behaviour of distinct concrete compositions. The primary focus of this investigation encompassed High-Performance Concrete with Basalt Aggregates (HPC-B), High-Performance Concrete with Gravel Aggregates (HPC-G), and Concrete Mortar (CM). The methodology employed in this research involved a rigorous series of testing protocols, including static tensile tests, cyclic loading tests (both low and high cycle fatigue), and post-fatigue analysis facilitated by advanced imaging techniques such as Digital Image Correlation (DIC) and Computed Tomography (CT).
The experimental investigations conducted on selected concrete compositions that include HPC-B, HPC-G, and CM demonstrate that the HPC-B exhibits more than 20% and 16% higher compressive strength compared to HPC-G and CM, respectively. The elastic modulus and tensile strength of HPC-B are in the range of at least 15% and 12% higher than those of HPC-G and CM, respectively. Despite maintaining the water-cement ratio of 0.35 for all concrete compositions, the superior mechanical properties of HPC-B are attributed to the presence of crushed basalt aggregates and improved ITZ. On the other hand, considering the excess cement paste theory as a result of substituting the coarse aggregate (2 mm to 8 mm) with an equivalent surface area amount of sand for all three concrete compositions, the increased strength of the HPC-B composition is due to the effects of the high strength basalt aggregates. Therefore, it is evident that the type of coarse aggregate, mortar-aggregate interface, ratio of coarse aggregate to fine aggregate, and matrix composition have a significant impact on the fatigue behaviour of concrete.
In addition to demonstrating higher fracture energy of approximately 13% and 14.5% than HPC-G and CM, respectively, HPC-B also indicates higher resistance to crack initiation due to the enhanced interaction between the basalt aggregates and the matrix avoiding the potential formation of zones of weaker bond to the mortar. The high cycle fatigue tests are conducted with a frequency of 4 Hz at a minimum load ratio of Rmin = 0.05 and a maximum load ratio is varied up to Rmax =1. The specimens withstanding the maximum prescribed number of load cycles (1 million in the current study) are reloaded under quasi-static conditions to investigate the effect of cyclic loading on the mechanical performance and residual strength of the different concrete compositions, namely, high-performance concrete with basalt (HPC-B), high-performance concrete with gravel (HPC-G), and high-strength coarse mortar (CM). The experimental findings indicate that the high performance concrete with basalt aggregates exhibited the optimum cracking resistance and that the cracking sensitivity in this case can be reduced by using rougher aggregates with higher strength and larger diameter. Moreover, reduced interlocking of aggregate and matrix is observed. This is due to the largely orbicular nature of the natural gravel and sand particles in HPC-G and CM, respectively, indicating that the shape and texture of the aggregate has a significant influence on the fracture mechanical behaviour of the concrete.
In the course of the investigation, it is observed that HPC-B and HPC-G possess some notch sensitivity, but the notch sensitivity is most pronounced in concrete mortar (CM), which means that cracks propagating through these constituents are least arrested due to the absence of larger aggregates. Most notably, an increase in rougher and larger aggregates results in less pronounced notch sensitivity, which is corroborated and confirmed with the stress intensity factor. It is also worth emphasizing that cyclic loading does not normally cause failure of a concrete specimen; however, it does have an adverse effect on its mechanical parameters and alters its behaviour under extreme loading episodes.
From the perspective of the overall behaviour of HPC-B, despite the application of over 1 million load cycles at a load level below R
max = 0.75, the fatigue loading does not appear to have any effect on the post-fatigue load carrying capacity of HPC-B. Moreover, in the case of the HPC-B specimens, the maximum bearing capacity of the post-fatigue peak is at least 9 percent higher than that of solely statically loaded specimens. However, the same trend is not observed in the composition of HPC-G and CM with an average decrease in post-fatigue residual strength of about 13 and 21.5 percent, respectively. The underlying explanation for the post-fatigue behaviour of HPC-B is complex, as the concrete is composed of several materials with different physical and mechanical properties, and their corresponding matrix-aggregate bond. The authors hypothesize that the reason for the increased residual strength of the HPC-B after the fatigue test is that the cyclic loads reduce the pore structure in the concrete at the nano-level to improve material compaction [
29], as well as an improved interaction between the basalt aggregate and the matrix. In addition, the possibility of redistribution of stresses and strain hardening subsequent to plastic deformation cannot be discarded. The authors recommend further tests to elucidate the post-fatigue behaviour of HPC-B.
The extensive testing and meticulous evaluation of HPC-B, HPC-G, and CM, coupled with the establishment of correlations between various mechanical parameters, offer profound insights into the multifaceted factors governing the mechanical, fracture, fatigue and post-fatigue performance of high-performance concrete compositions. In summary, this study represents a substantial contribution to the understanding of the mechanical, fracture, fatigue and post-fatigue behaviour of high-performance concrete compositions subjected to diverse loading conditions. The pronounced disparities observed among HPC-B, HPC-G, and CM underscore the critical influence of aggregate type, morphology and properties, opening up new frontiers in the development of durable and HPC compositions. These findings not only provide valuable insights for the scientific community but also offer practical implications for the construction industry, ultimately contributing to the advancement of concrete technology and the creation of more resilient structures capable of withstanding the demands of the modern era.
5. Future Work
The results of the MDCT tests are numerically simulated by implementing phase field modelling approach to verify the accuracy of the experimentally obtained measurements in HPC [
36].
Furthermore, based on the findings of the experimental results, a rheological-statistical material model will be developed to provide a comprehensive physically explicit description of the behaviour of high-performance concrete, in particular the fracture behaviour and the heterogeneous concrete structure at the mesolevel.
Acknowledgments
The authors acknowledge support by the German Research Foundation (DFG) through the priority program SPP 2020 “Cyclic deterioration of High-Performance Concrete in an experimental-virtual lab”.
Conflicts of Interest
The funders had no role in the design of the study; in the collection, analyses, or interpretation of data; in the writing of the manuscript; or in the decision to publish the results.
References
- De Joly. Strength and elasticity of Portland Cement (La resístanse et l’étasticité desciments Portland) (in French). Annales dês Ponts et Chaussee, Memoires. 1898;16(7): 216–226.
- Considere, M. Influence of rebar on the properties of mortars and concretes (Influence dês armatures métalliques sur lés propriétés dês mortiers et bétons) (in French). Compte Redu de L’Academic des Sciences. 1899;127:992–995.
- Hsu, T.C.C. Fatigue of plain concrete. ACI Journal. 1981;78:292–305.
- Karr, U; Schuller, R; F, Michael; D, Andreas; S, Alfred & M, Herwig. (2017). Very high cycle fatigue testing of concrete using ultrasonic cycling. Materials Testing. 59. 438-444. [CrossRef]
- Loeffler, C. , Sun, Q., Heard, W., Martin, B., Williams, B., & Nie, X. (2020). The effect of loading duration on damage initiation in high-strength concrete. Mechanics of Materials, 140, 103216. [CrossRef]
- 6. Ukpata, J. O., Ewa, D. E., Success, N. G., Alaneme, G. U., Otu, O. N., & Olaiya, B. C. (2024). Effects of aggregate sizes on the performance of laterized concrete. Scientific Reports, 14(1). [CrossRef]
- 7. Guo, J., Lin, W., Qin, X., Xu, Y., & Dong, K. (2022). Mesoscopic study on fracture behavior of fully graded concrete under uniaxial tension by using the phase-field method. Engineering Fracture Mechanics, 272, 108678. [CrossRef]
- Yehia, S., Abdelfatah, A., & Mansour, D. (2020). Effect of aggregate type and specimen configuration on concrete compressive strength. Crystals, 10(7), 625. [CrossRef]
- Güçlüer, K. (2020). Investigation of the effects of aggregate textural properties on compressive strength (CS) and ultrasonic pulse velocity (UPV) of concrete. Journal of Building Engineering, 27, 100949. [CrossRef]
- Mechtcherine, V., & Müller, H. S. (2021). Fracture behaviour of high-performance concrete. Finite Elements in Civil Engineering Applications, 35–43. [CrossRef]
- Scheiden, T., & Oneschkow, N. (2019). Influence of two coarse aggregates on the damage mechanism in high-strength concrete under pure compressive fatigue loading.
- Giaccio, G., Rocco, C., & Zerbino, R. (1993). The Fracture Energy (G F) of high-strength concretes. Materials and Structures, 26(7), 381–386. [CrossRef]
- Wu, K.-R., Chen, B., Yao, W., & Zhang, D. (2001). Effect of coarse aggregate type on mechanical properties of high-performance concrete. Cement and Concrete Research, 31(10), 1421–1425. [CrossRef]
- Malhotra, V. M. (1971). Concrete Rings for Determining Tensile Strength of Concrete and Effect of Specimen Size on Tensile Strength of Concrete.
- Cracking of concrete members in direct tension” (1986) ACI Journal Proceedings, 83(1).
- Wittmann, F. H., Roelfstra, P. E., Mihashi, H., Huang, Y.-Y., Zhang, X.-H., & Nomura, N. (1987). Influence of age of loading, water-cement ratio and rate of loading on fracture energy of concrete. Materials and Structures, 20(2), 103–110. [CrossRef]
- Einsfeld, R. A., and Velasco, M. S. L. (2006). Fracture parameters for high-performance concrete. Cement and Concrete Research, 36(3), 576–583.
- Shah, S.P. and Carpinteri, A. (1991) Fracture Mechanics Test Methods for Concrete: Report of technical committee 89-fmt, Fracture Mechanics of concrete: Test methods. London: Taylor and Francis.
- Leusmann, T.; Basutkar, G.; Lunardelli, M.: Characterizing the 3D mesostructure of high performance concrete with the help of computed tomography. Gabrijel, I.; Grosse, C.; Skazlic, M. (Eds.): International Conference on Sustainable Materials, Systems and Structures (SMSS 2019) - Novel Methods for Characterization of Materials and Structures, Rovinj, Croatia, 20-22 March 2019, p.176-184. 22 March.
- ASTM D7313-13, (2013). Standard Test Method for Determining Fracture Energy of Asphalt-Aggregate Mixtures Using the Disk-Shaped Compact Tension Geometry, ASTM International.
- EN 12390-3, (2019) Testing hardened concrete - Part 3: Compressive strength of test specimens.
- EN 12390-13, (2013) Testing hardened concrete - Part 13: Determination of secant modulus of elasticity in compression.
- EN 12390-6, (2009) Testing hardened concrete - Part 6: Tensile splitting strength of test specimens.
- Tada, H., Paris, P.C. and Irwin, G.R. (2000) The stress analysis of Cracks Handbook, third edition.
- Bažant, Z. P., & Oh, B. H. (1983). Crack band theory for fracture of concrete. Matériaux Et Constructions, 16(3), 155-177. [CrossRef]
- Jenq, Y., & Shah, S. P. (1985). Two Parameter Fracture Model for Concrete. Journal of Engineering Mechanics, 111(10), 1227-1241. [CrossRef]
- Sakai, M., Ichikawa, H. Work-of-fracture of brittle materials with microcracking and crack bridging. Int J Fract 55, 65–79 (1992). [CrossRef]
- Cifuentes, H., Lozano, M., Holušová, T., Medi-na, F., Seitl, S., & Fernández-Canteli, A. (2017). Modified Disk-Shaped Compact Tension Test for Measuring Concrete Fracture Properties. International Journal of Concrete Structures and Materials, 11(2), 215-228. [CrossRef]
- fib (2013) “FIB model code for Concrete Structures 2010”.
- Li, D., Huang, P., Qin, G., Zheng, X., & Guo, X. (2017). Fatigue crack propagation behavior of RC beams strengthened with CFRP under high temperature and high humidity environment. International Journal of Polymer Science, 2017, 1-11. [CrossRef]
- Meng, X. & Song, Y. (2007). Residual tensile strength of plain concrete under tensile fatigue loading. Journal of Wuhan University of Technology-Mater. Sci. Ed., 22(3), 564-568. [CrossRef]
- González, D. C., Vicente, M. A., & Ahmad, S. (2015). Effect of cyclic loading on the residual tensile strength of steel fiber–reinforced high-strength concrete. Journal of Materials in Civil Engineering, 27(9).
- Kessler-Kramer, C., Mechtcherine, V., & Mueller, H. S. (2003). Failure of normal and high strength concrete under monotonic and cyclic tensile loading. Brittle Matrix Composites 7, 277-286. [CrossRef]
- Rybczynski, S., Schaan, G., Dosta, M., Ritter, M., & Schmidt-Döhl, F. (2021). Discrete element modeling and electron microscopy investigation of fatigue-induced microstructural changes in ultra-high-performance concrete. Materials, 14(21), 6337. [CrossRef]
- Carrara, P., Kruse, R., Bentz, D., Lunardelli, M., Leusmann, T., Varady, P. A., De Lorenzis, L.: Improved mesoscale segmentation of concrete from 3D X-ray images using contrast enhancers, In: Cement and Concrete Composites, Volume 93, October 2018, Pages 30-42. [CrossRef]
- Carrara, P., Ambati, M., Alessi, R., & De Lorenzis, L. (2018, November 06). A novel framework to model the fatigue behavior of brittle materials based on a variational phase-field approach. Manuscript submitted for publication.
Figure 1.
Schematic representation of the idealised mesostructure of HPC.
Figure 1.
Schematic representation of the idealised mesostructure of HPC.
Figure 2.
Prefabricated formwork before (a) and after (b) casting.
Figure 2.
Prefabricated formwork before (a) and after (b) casting.
Figure 5.
Displacement-controlled low -cycle fatigue test.
Figure 5.
Displacement-controlled low -cycle fatigue test.
Figure 7.
Load-controlled cyclic sinusoidal tensile loading for high-cycle fatigue tests.
Figure 7.
Load-controlled cyclic sinusoidal tensile loading for high-cycle fatigue tests.
Figure 8.
Specimen setup (left) and external trigger (right) for high-cycle fatigue tests.
Figure 8.
Specimen setup (left) and external trigger (right) for high-cycle fatigue tests.
Figure 9.
Material composition and their associated average load capacities under static tensile load.
Figure 9.
Material composition and their associated average load capacities under static tensile load.
Figure 10.
P-COD curve for MDCT test illustrating the measured work-of-fracture (Wf).
Figure 10.
P-COD curve for MDCT test illustrating the measured work-of-fracture (Wf).
Figure 11.
Sequential crack progression under low-cycle fatigue testing. (a) Initial crack appearance at the centre of the specimen, capturing the onset of fracture. (b) Subsequent crack propagation leading to the complete splitting of the sample, illustrating the full extent of specimen failure.
Figure 11.
Sequential crack progression under low-cycle fatigue testing. (a) Initial crack appearance at the centre of the specimen, capturing the onset of fracture. (b) Subsequent crack propagation leading to the complete splitting of the sample, illustrating the full extent of specimen failure.
Figure 12.
Comparison of Load-COD curve for experimentally determined static and low-cycle fatigue tests.
Figure 12.
Comparison of Load-COD curve for experimentally determined static and low-cycle fatigue tests.
Figure 13.
Comparison of experimental results with fib Model Code 2010 [
29] in terms of number of load cycles and the maximum load ratio.
Figure 13.
Comparison of experimental results with fib Model Code 2010 [
29] in terms of number of load cycles and the maximum load ratio.
Figure 14.
a-d Evolution of crack path recorded with DIC tool during high-cyclic tensile tests.
Figure 14.
a-d Evolution of crack path recorded with DIC tool during high-cyclic tensile tests.
Figure 17.
Reconstructed CT image for one of the specimens pre-cyclic (a), post-cyclic (b) and post-static residual tests (c).
Figure 17.
Reconstructed CT image for one of the specimens pre-cyclic (a), post-cyclic (b) and post-static residual tests (c).
Table 1.
Constituents of HPC-B, HPC-G and CM.
Table 1.
Constituents of HPC-B, HPC-G and CM.
| Component |
Density (kg/dm3) |
HPC-B (kg/m3) |
HPC-G (kg/m3) |
CM
(kg/m3) |
| Cement c |
3.09 |
500 |
500 |
659 |
| Water w |
1.00 |
176 |
176 |
232 |
| Superplasticizer sp |
1.05 |
4.50 |
4.50 |
5.93 |
| Stabilizer st |
1.10 |
2.85 |
2.85 |
3.76 |
| Quartz sand 0-0.5 mm |
2.70 |
75 |
75 |
116 |
| Sand 0-2 mm |
2.64 |
850 |
850 |
1320 |
| Basalt 2-5 mm |
3.06 |
350 |
- |
- |
| Basalt 5-8 mm |
3.06 |
570 |
- |
- |
| Gravel 2-5 mm |
2.64 |
- |
302 |
- |
| Gravel 5-8 mm |
2.64 |
- |
492 |
- |
| Sum |
- |
2503 |
2385 |
2305 |
| w/c ratio |
- |
0.35 |
0.35 |
0.35 |
Table 3.
Mechanical properties and standard deviation of Basalt boulder, HPC-B, HPC-G and CM.
Table 3.
Mechanical properties and standard deviation of Basalt boulder, HPC-B, HPC-G and CM.
| Material |
HPC-B |
HPC-G |
CM |
Basalt boulder |
| Density [kg/dm³] |
2.52 |
2.41 |
2.26 |
3.06 |
| Compressive strength [N/mm²] |
116.8 +/- 3.2 |
92.6+/- 2.2 |
95.2+/- 1.1 |
312.8+-4.4 |
| Tensile strength [N/mm²] |
5.7+/- 0.8 |
4.3+/- 0.2 |
4.97+/- 0.7 |
19.201) +/- 3.7 |
| Young’s modulus [N/mm²] |
50336+/- 1762 |
35064+/- 1560 |
39514+/- 890 |
92681+/- 7647 |
|
1) split tensile strength according to EN 12390-6 |
Table 4.
Experimental results of various material composition from MDCT tests.
Table 4.
Experimental results of various material composition from MDCT tests.
Material
Composition |
Ultimate Load
PQ (N) |
Work of fracture
Wf (N-mm) |
Stress intensity factor
KQ (MPa-m1/2) |
Fracture Energy
Gf (N/m) |
| HPC-B |
1470+/- 223 |
319+/- 33 |
1,00+/-0.17 |
165+/-17 |
| HPC- G |
1300+-133 |
252+/-53 |
0.75+/-0.07 |
143+/-18 |
| CM |
1230+-170 |
248+/-17 |
0.68+/-0.11 |
141+/-17 |
| Basalt |
2540 ± 131 |
819+/-225 |
1.40+/-0.07 |
425+/-117 |
Table 5.
Results of post-fatigue residual tensile tests.
Table 5.
Results of post-fatigue residual tensile tests.
| Material Composition |
Maximum Load ratio[-] |
Number of load cycles
[-] |
Change in post-fatigue residual
KQ [%] |
Average post-fatigue residual
KQ [%] |
| HPC-B |
0.80 |
1084292 |
- |
+16.92 ± 9.88 |
| 0.75 |
1001407 |
+33.49 |
| 0.75 |
1040321 |
+9.03 |
| 0.70 |
2006284 |
+9.75 |
| 0.50 |
1626702 |
+15.42 |
| HPC-G |
0.70 |
1004180 |
-3.61 |
-13.65 ± 6.68 |
| 0.70 |
1000180 |
-15.79 |
| 0.65 |
1035314 |
-5.38 |
| 0.60 |
1001215 |
-21.79 |
| 0.50 |
1030497 |
-21.69 |
| CM |
0.65 |
90290 |
- |
|
| 0.60 |
997976 |
- |
-12.85 ± - |
| 0.50 |
1020711 |
-15.35 |
| 0.50 |
1025237 |
-10.35 |
|
|
Disclaimer/Publisher’s Note: The statements, opinions and data contained in all publications are solely those of the individual author(s) and contributor(s) and not of MDPI and/or the editor(s). MDPI and/or the editor(s) disclaim responsibility for any injury to people or property resulting from any ideas, methods, instructions or products referred to in the content. |
© 2024 by the authors. Licensee MDPI, Basel, Switzerland. This article is an open access article distributed under the terms and conditions of the Creative Commons Attribution (CC BY) license (http://creativecommons.org/licenses/by/4.0/).
