1. Introduction
Inconel 718 is a precipitation strengthened nickel-base superalloy with high strength, excellent creep, and corrosion resistance [
1,
2]. The alloy is an ideal choice in a wide range of service temperatures, especially in energy and in aviation sectors due to its stable mechanical properties as high as 650 °C [
3,
4]. The as-produced Inconel 718 generally consists of austenite (fcc) matrix and some primary segregated phases, mainly Laves, and carbides. Prior to application, the segregated phases, specially Laves need to be dissolved as they have determinantal effects on the mechanical properties. An optimum microstructure and mechanical strength of the alloy can be obtained by performing two steps of post-fabrication heat treatments, which are solid solution heat treatment (ST) and aging (also known as precipitation hardening) [
5,
6,
7,
8]. After the successive heat treatments, the main desired phases to precipitate in the austenite matrix of the alloy are fcc L1
2 ordered Ni
3(Al,Ti) γ′ and the bct D022 ordered Ni
3Nb γ″. The latter (γ″) is regarded as the main strengthening phase with the ratio of 4:1 compared to the former (γ′). The other phase precipitated under certain temperature range in Inconel 718 is the δ phase, which is stable unlike the metastable γ′′ phase. The δ phase has an orthorhombic (D0a) crystal structure with a similar stoichiometry of Ni
3Nb as that of γ′′ and it is often regarded as another strengthening phase in Inconel 718 [
4,
9].
Further strengthening of Inconel 718 can be achieved by combining heat treatment with work hardening, through cold rolling. The cold rolling primarily induces dislocation networks and vacancies in the material, which are known to enhance the material properties such as tensile strength, creep resistance and hardness at the expense of ductility. These properties, however, are affected by the distribution and morphology of the hardening phases, which are γ′, γ′′ and δ. It is thus, important to understand how cold rolling affects precipitation of these phases. Cold rolling results in plastic deformation, leading to changes in the morphology of grains and the grain boundary regions. The mechanism of deformation is responsible for the generation of dislocations, elongation of grains and the changes that occurred in the internal structure within the grains. In addition, most of the grains tended to be reoriented with respect to the directions of the applied stresses during rolling. These changes normally expected to affect the nucleation, distribution and morphology of the precipitation hardening in Inconel 718.
Most researchers [
10,
11,
12] studied the effects of δ phase precipitation in a cold rolled Inconel 718 on microstructure and mechanical strength. According to these reports, the nucleation sites and precipitation of δ phase can be enhanced, followed by depletion of Nb that greatly reduces the number and size of γ′′ precipitates because of global recrystallization and transformation of γ′′ to δ phase. The increment in nucleation sites for δ phase is believed to be due to the growth in the fraction of grain boundaries [
12]. Moreover, cold rolling process significantly reduces the content of γ′′ with increasing percentage of thickness reduction in the temperature range of solution and ageing treatments that promotes precipitation of δ phase. The effects of δ phase on the material properties are however controversial since some reports show affirmative [
12] while others considered detrimental [
11]. On the positive side, δ phase can improve mechanical properties since it pins grain boundaries and limit grain size by contributing to the grain homogenization [
12]. On the contrary, δ phase is brittle and can adversely affect the plasticity of IN718 as well as its strength [
11,
13,
14]. Besides, the presence of δ phase complicates understanding of the effects of the main hardening phases under the deformation process. In view of these, it worths investigating the effects of cold rolling on the microstructure and mechanical properties in the absence of δ phase.
This work deals with the effects of cold rolling on the microstructural features, crystallographic orientation, and mechanical properties of Inconel 718. To understand the influence of deformation in an unambiguous approach, the temperature range for the heat treatment schemes were chosen in such a way to avoid the precipitation of δ phase. The investigations in this work were partly based on the master’s thesis project of the second co-author [
15].
2. Experimental Methods
2.1. The Material
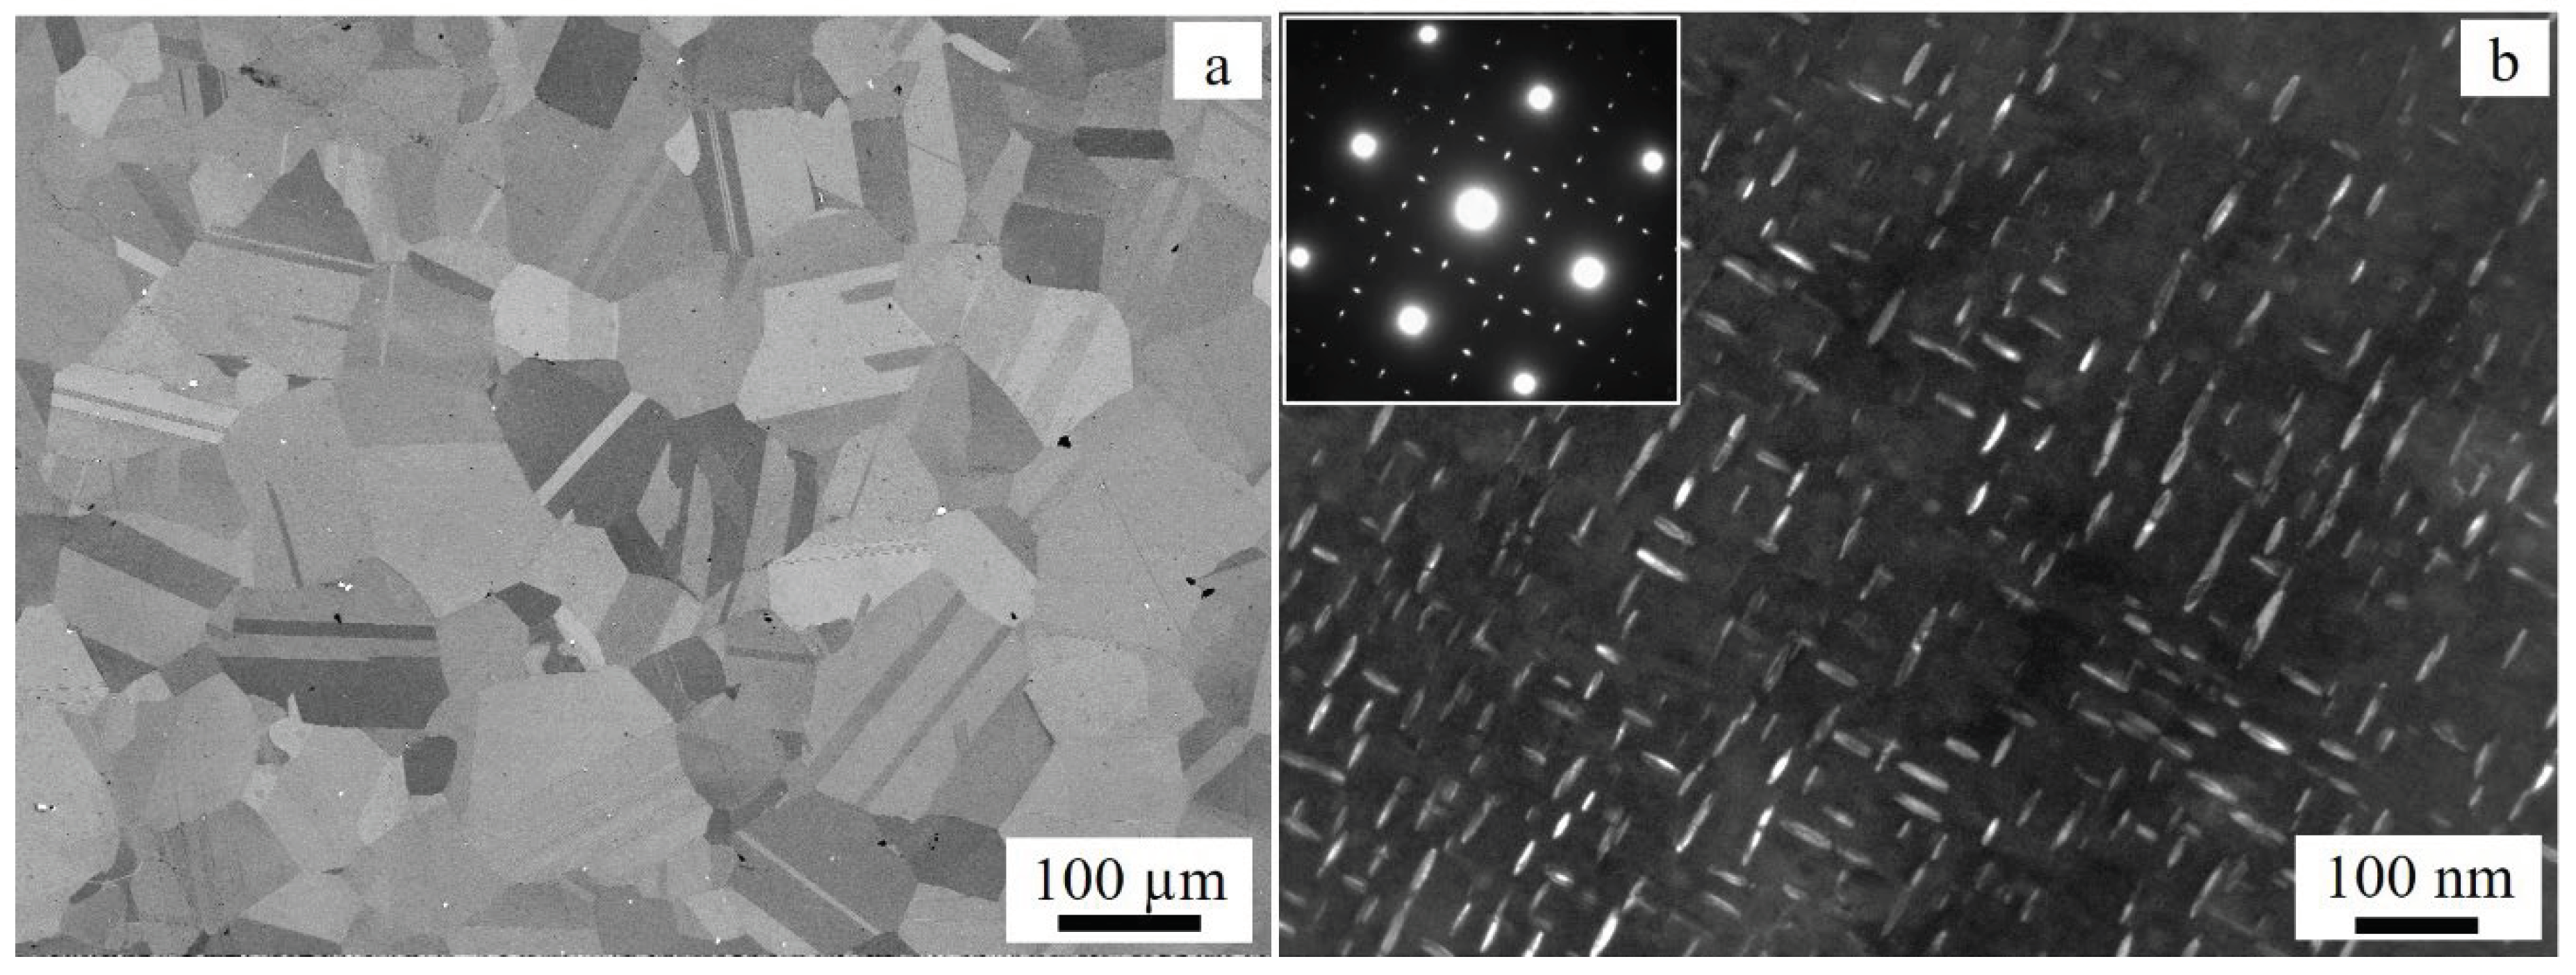
The initial material was Inconel 718 components of 7/8″ bolts and nuts supplied by Scandinavian Fittings and Flanges (SFF), located in Sandnes, Norway. The composition of Inconel 718 alloy includes, 17.86 Cr, 5.02 Nb, 2.99 Mo, 0.96 Ti, 0.51 Al, 0.05 Cu, 0.07 Mn, 0.014 C, 0.06 Si, 0.008 P, 0.0025 B, 0.0005 S and with Ni compromises the balance in wt.%. The material was produced by VIM+VAR (vacuum induction melting + vacuum arc remelting) method. After production, the specimens were solution annealed at 1030°C for 1.5h (water quenched) and then precipitation hardened at 780°C for 6.3h (air cooled). Finally, the threads of the bolts and nuts were formed by cold rolling. Here after the corresponding specimens will be called original condition (OC). The microstructure of the initial material is shown in
Figure 1. The OC specimen consists of equiaxed grains, numerous annealing twins, and some segregated phases along the grain boundaries and within the grains (
Figure 1a). EDS analysis shows that the particles are rich in Nb and Ti, indicating a carbide type phase. Furthermore, TEM image (
Figure 1b) reveals hardening precipitates, mainly γ″ phase with an average length of 51 nm.
2.2. Heat Treatment and Cold Rolling
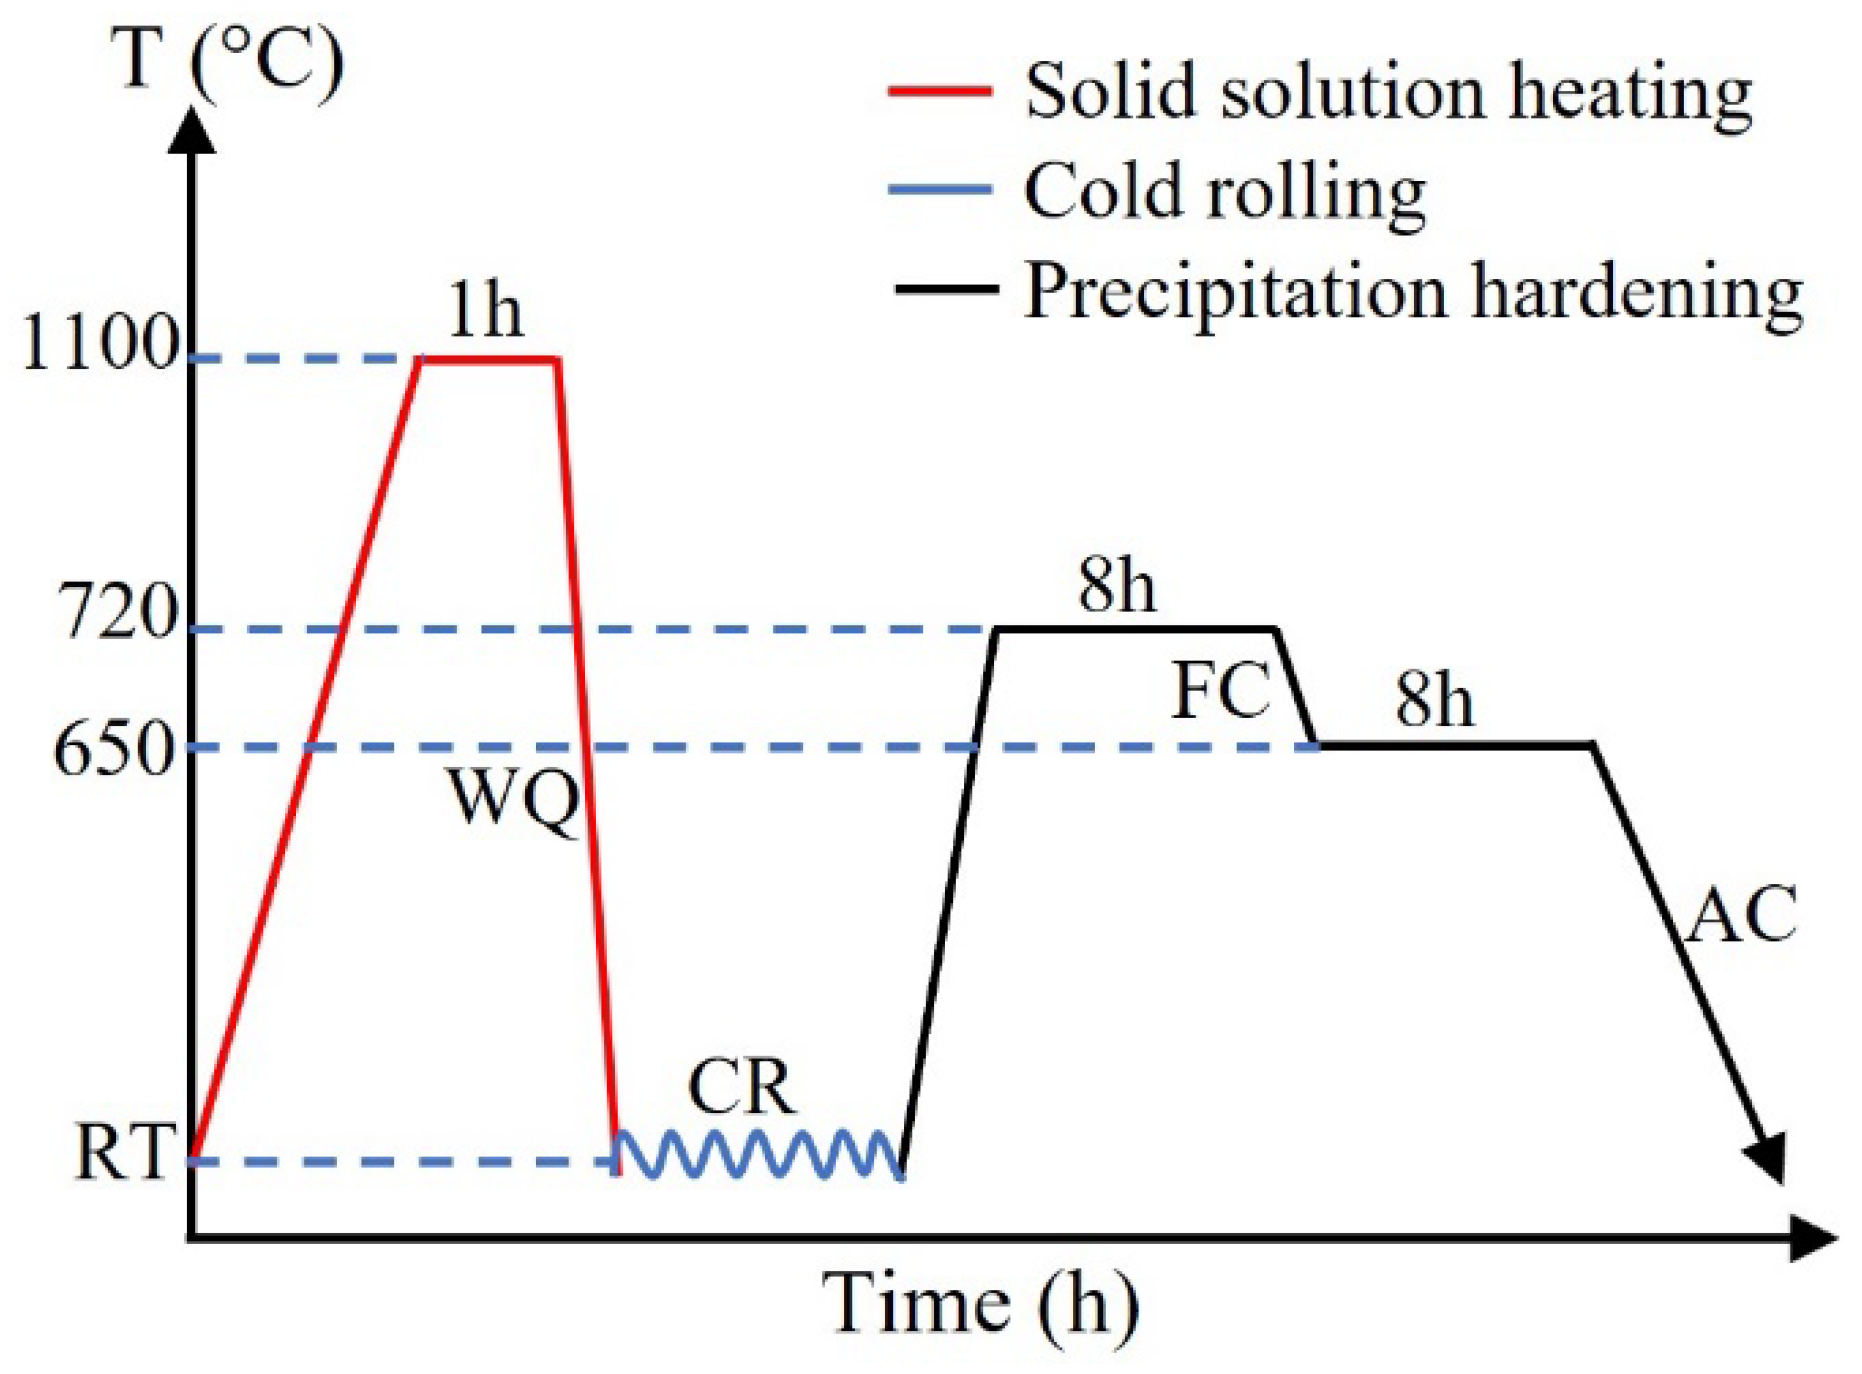
The specimens for the tests were obtained by machining the bolts (OC) to a rectangular shape with the dimension in the range of length (134-145 mm), width (9.5-14.3 mm) and thickness (4.7-5.7 mm). For the experimental investigations, the machined OC specimens were subjected to heat treatment to attain a homogeneous state. This was achieved by performing a solid solution heat treatment (ST) at 1100 °C for 1h followed by water quenching. The heat treatments were performed in a Nabertherm furnace equipped with a K-type thermocouple. For the ST operations, the specimens were introduced after stabilizing the furnace to the target temperatures to avoid undesirable phase transformations at lower temperatures. The hardening phases and other segregated phases were believed to be entirely or partially dissolved and the material nearly attain in a strain-free condition. In addition, there might be some grain coarsening and the material became softer than the starting material (OC). The specimen at this stage is referred as homogenised condition or D0. The ST (D0) specimens were then cold rolled, and precipitation hardened to analyse the effects of deformation on the mechanical properties.
Figure 2.
schematic profile of heat treatment regime and cold rolling – where T ≡ temperature, WQ ≡ water quenching, AC ≡ air cooling, FC ≡ furnace cooling and CR ≡ cold rolling.
Figure 2.
schematic profile of heat treatment regime and cold rolling – where T ≡ temperature, WQ ≡ water quenching, AC ≡ air cooling, FC ≡ furnace cooling and CR ≡ cold rolling.
The homogenised specimens (D0) were then divided into three sets depending on the level of deformation to be performed. These were undeformed (0%), 20% and 50% cold rolled. Each set was again divided into two – one set was subjected to two stages of aging and the other set was tested without aging. The aged specimens were suffixed by a letter ‘A’ to indicate aging. Cold rolling was done by a Schmitz cold rolling mill. After several passes, the thickness was reduced to 4.15-4.62 mm and 2.59-2.81 mm for 20% and 50%, respectively.
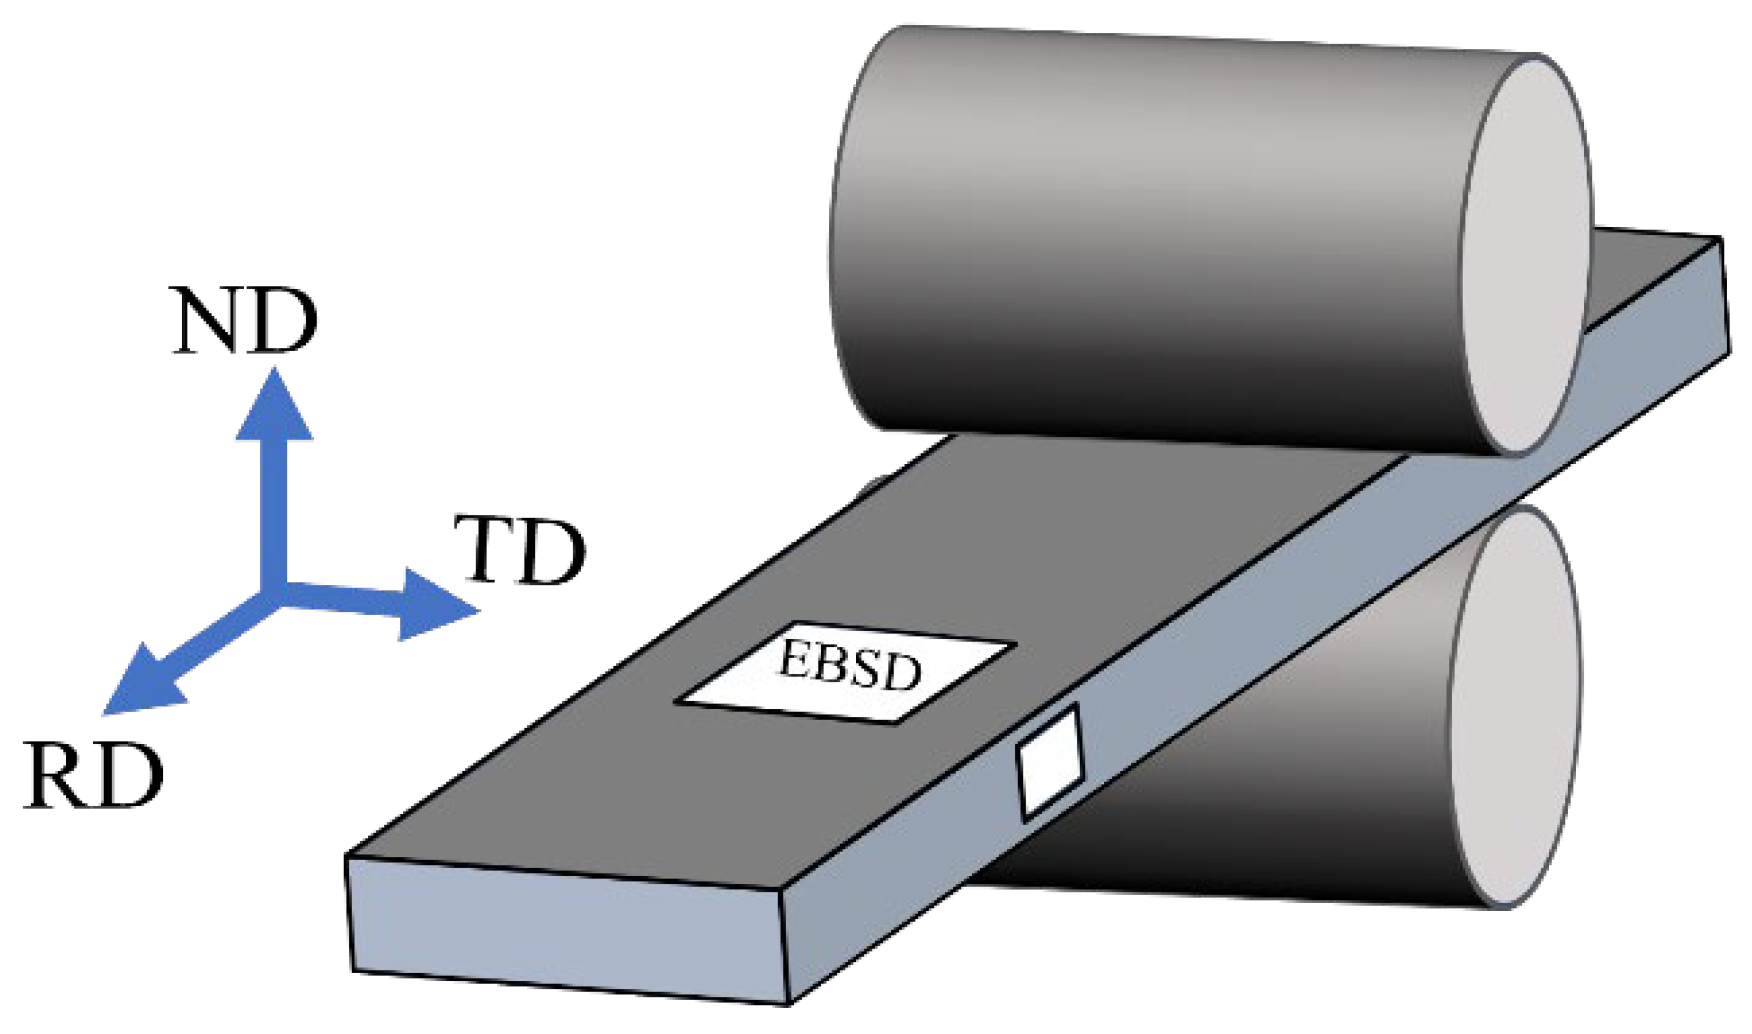
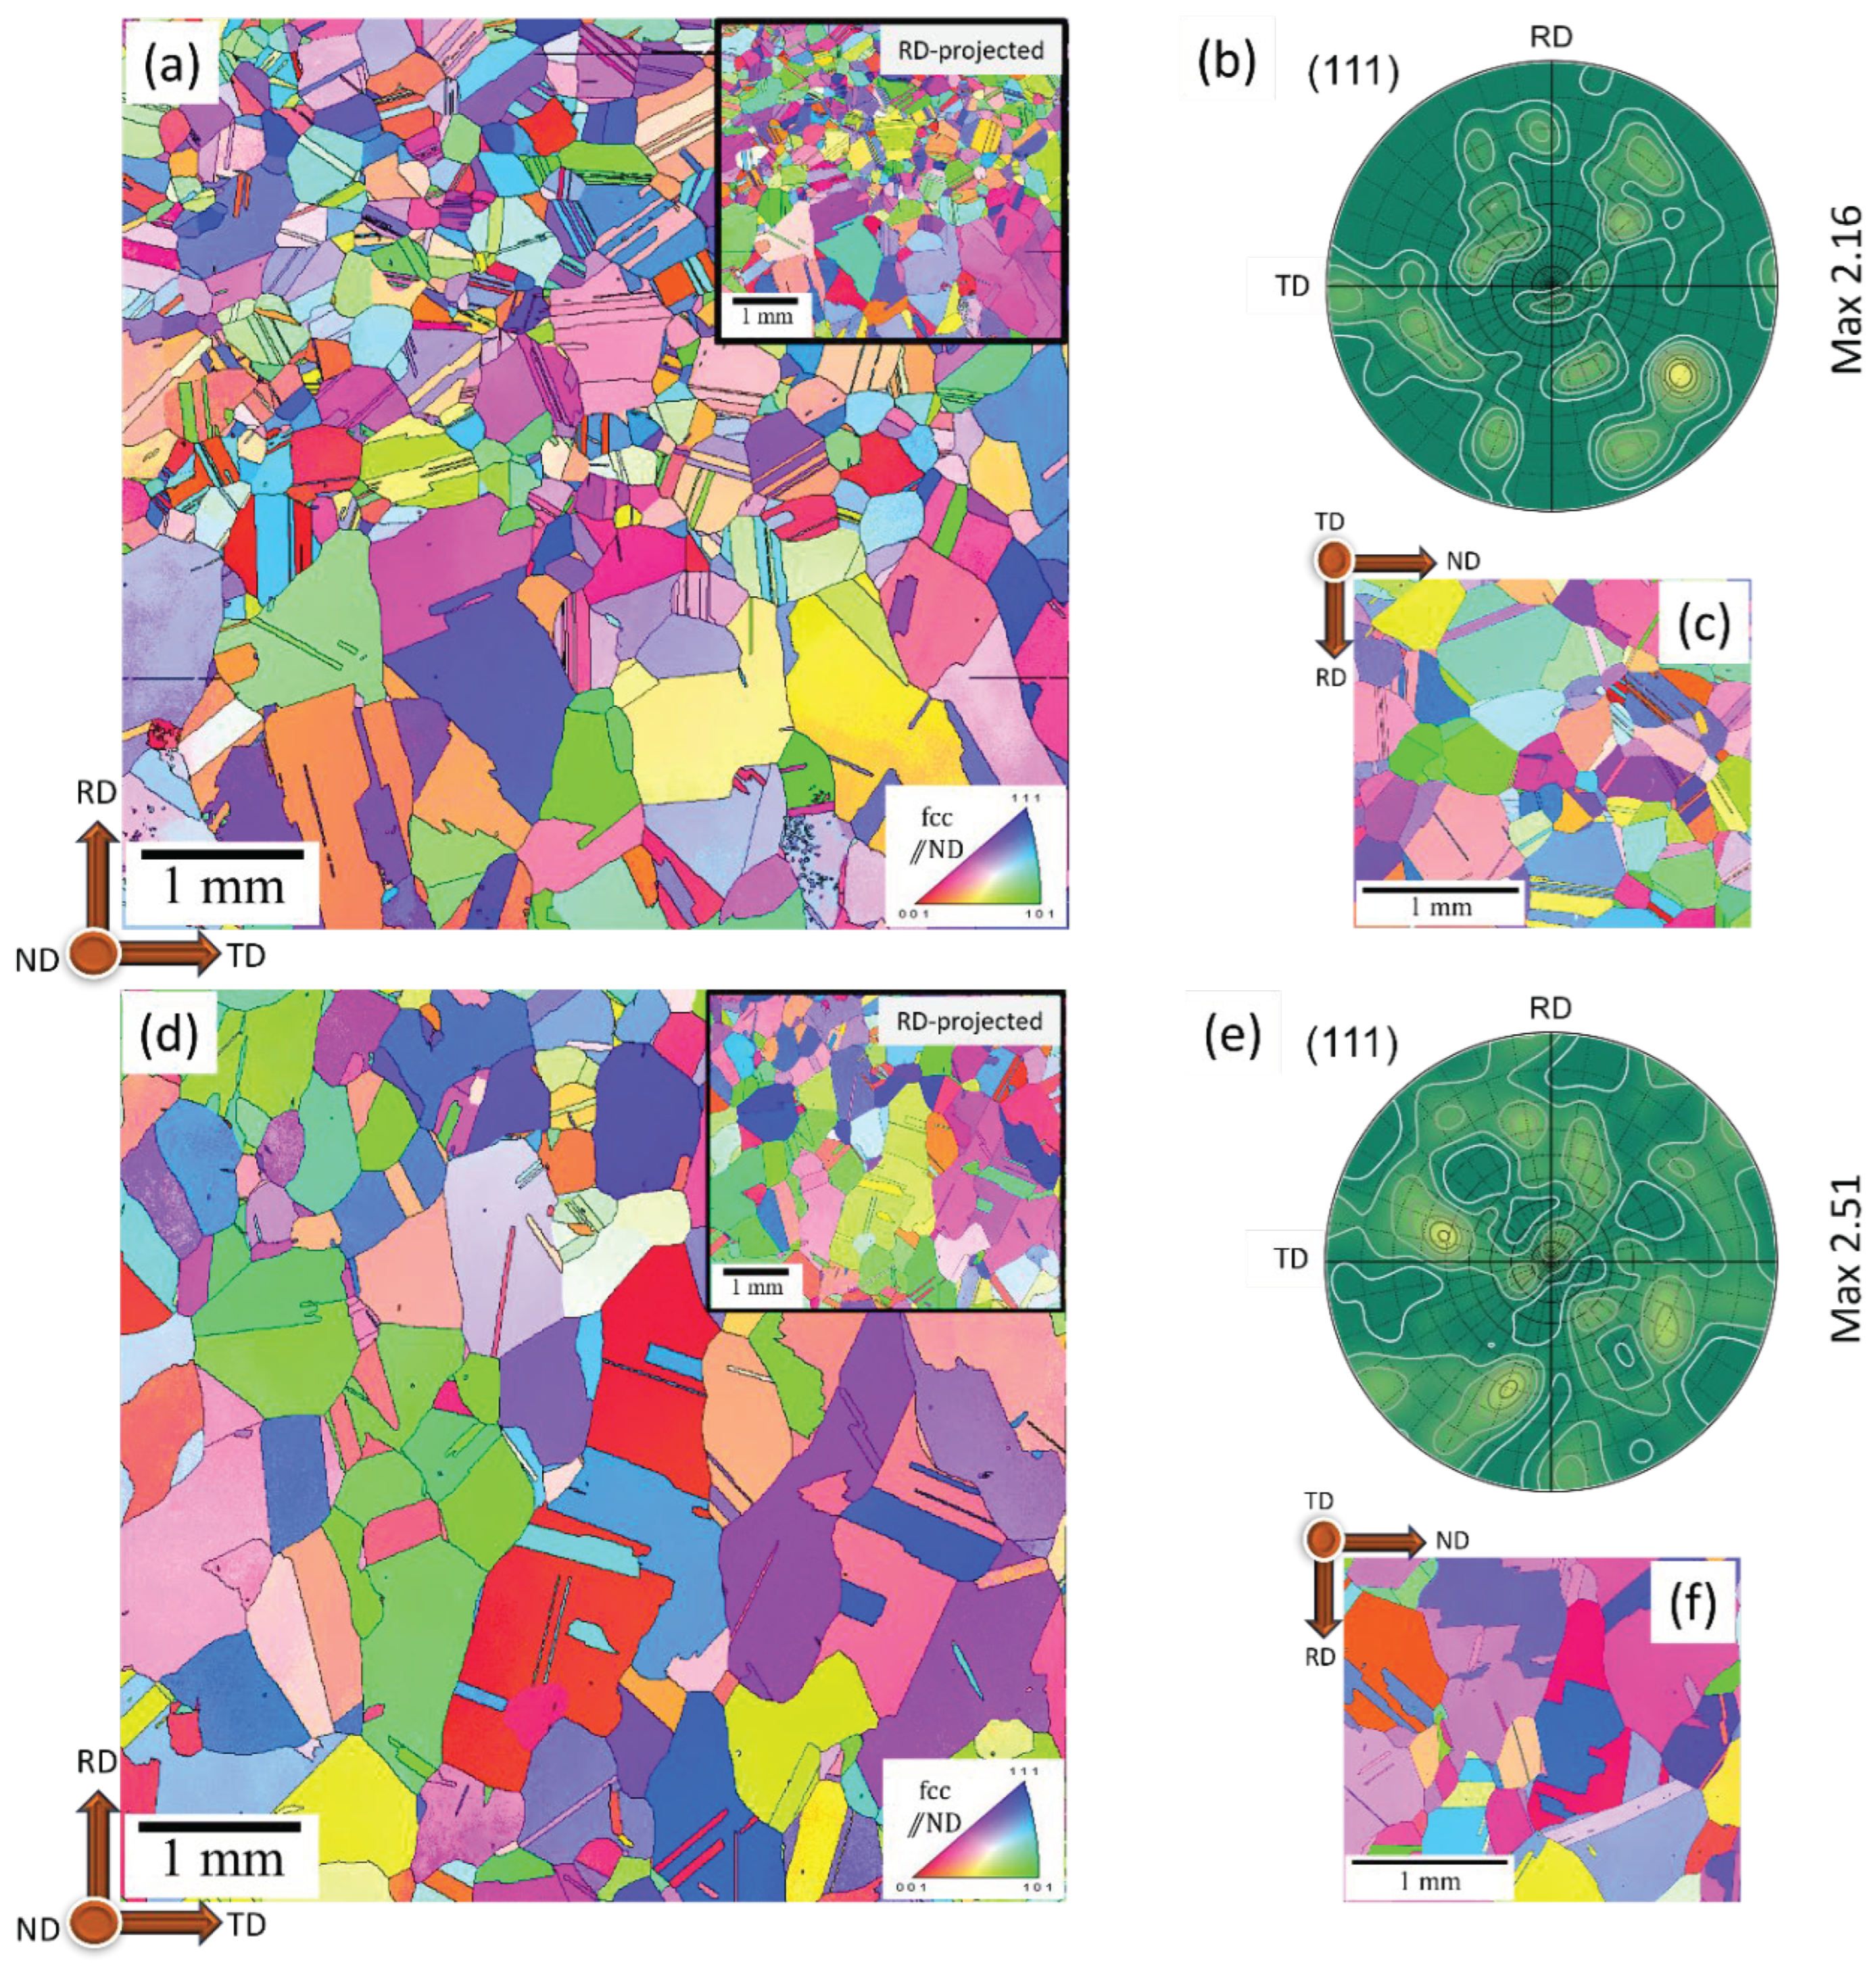
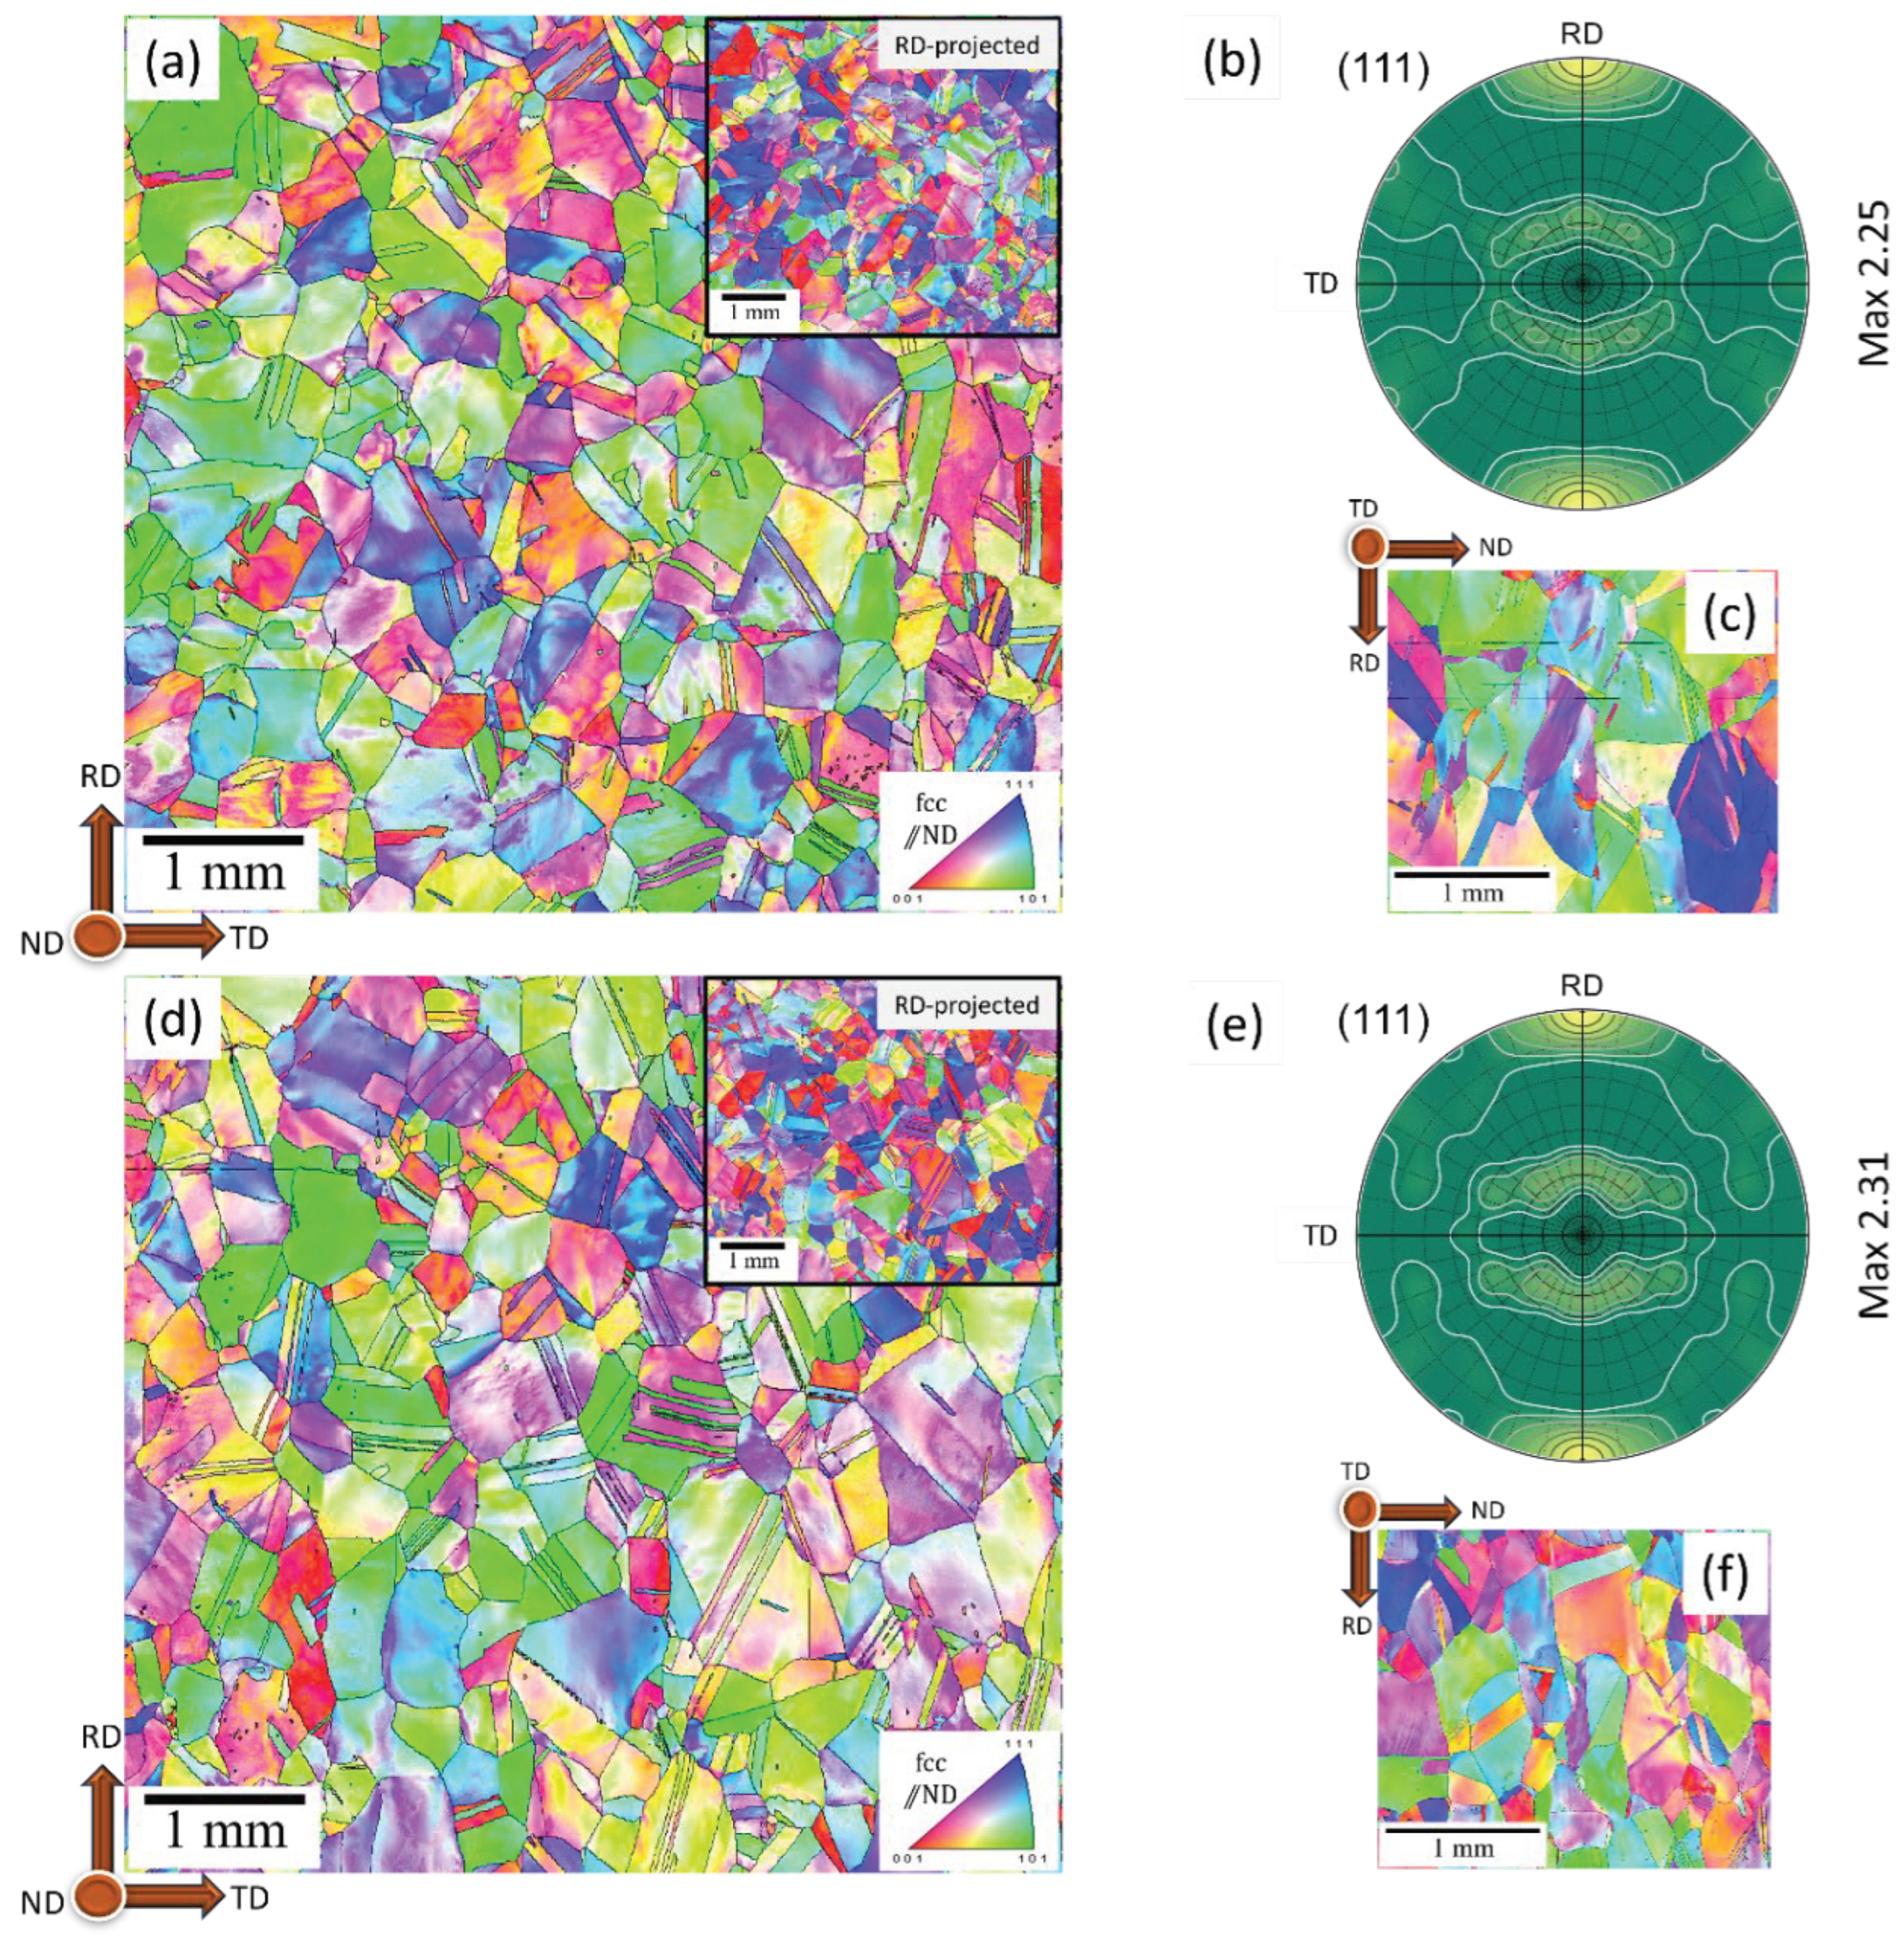
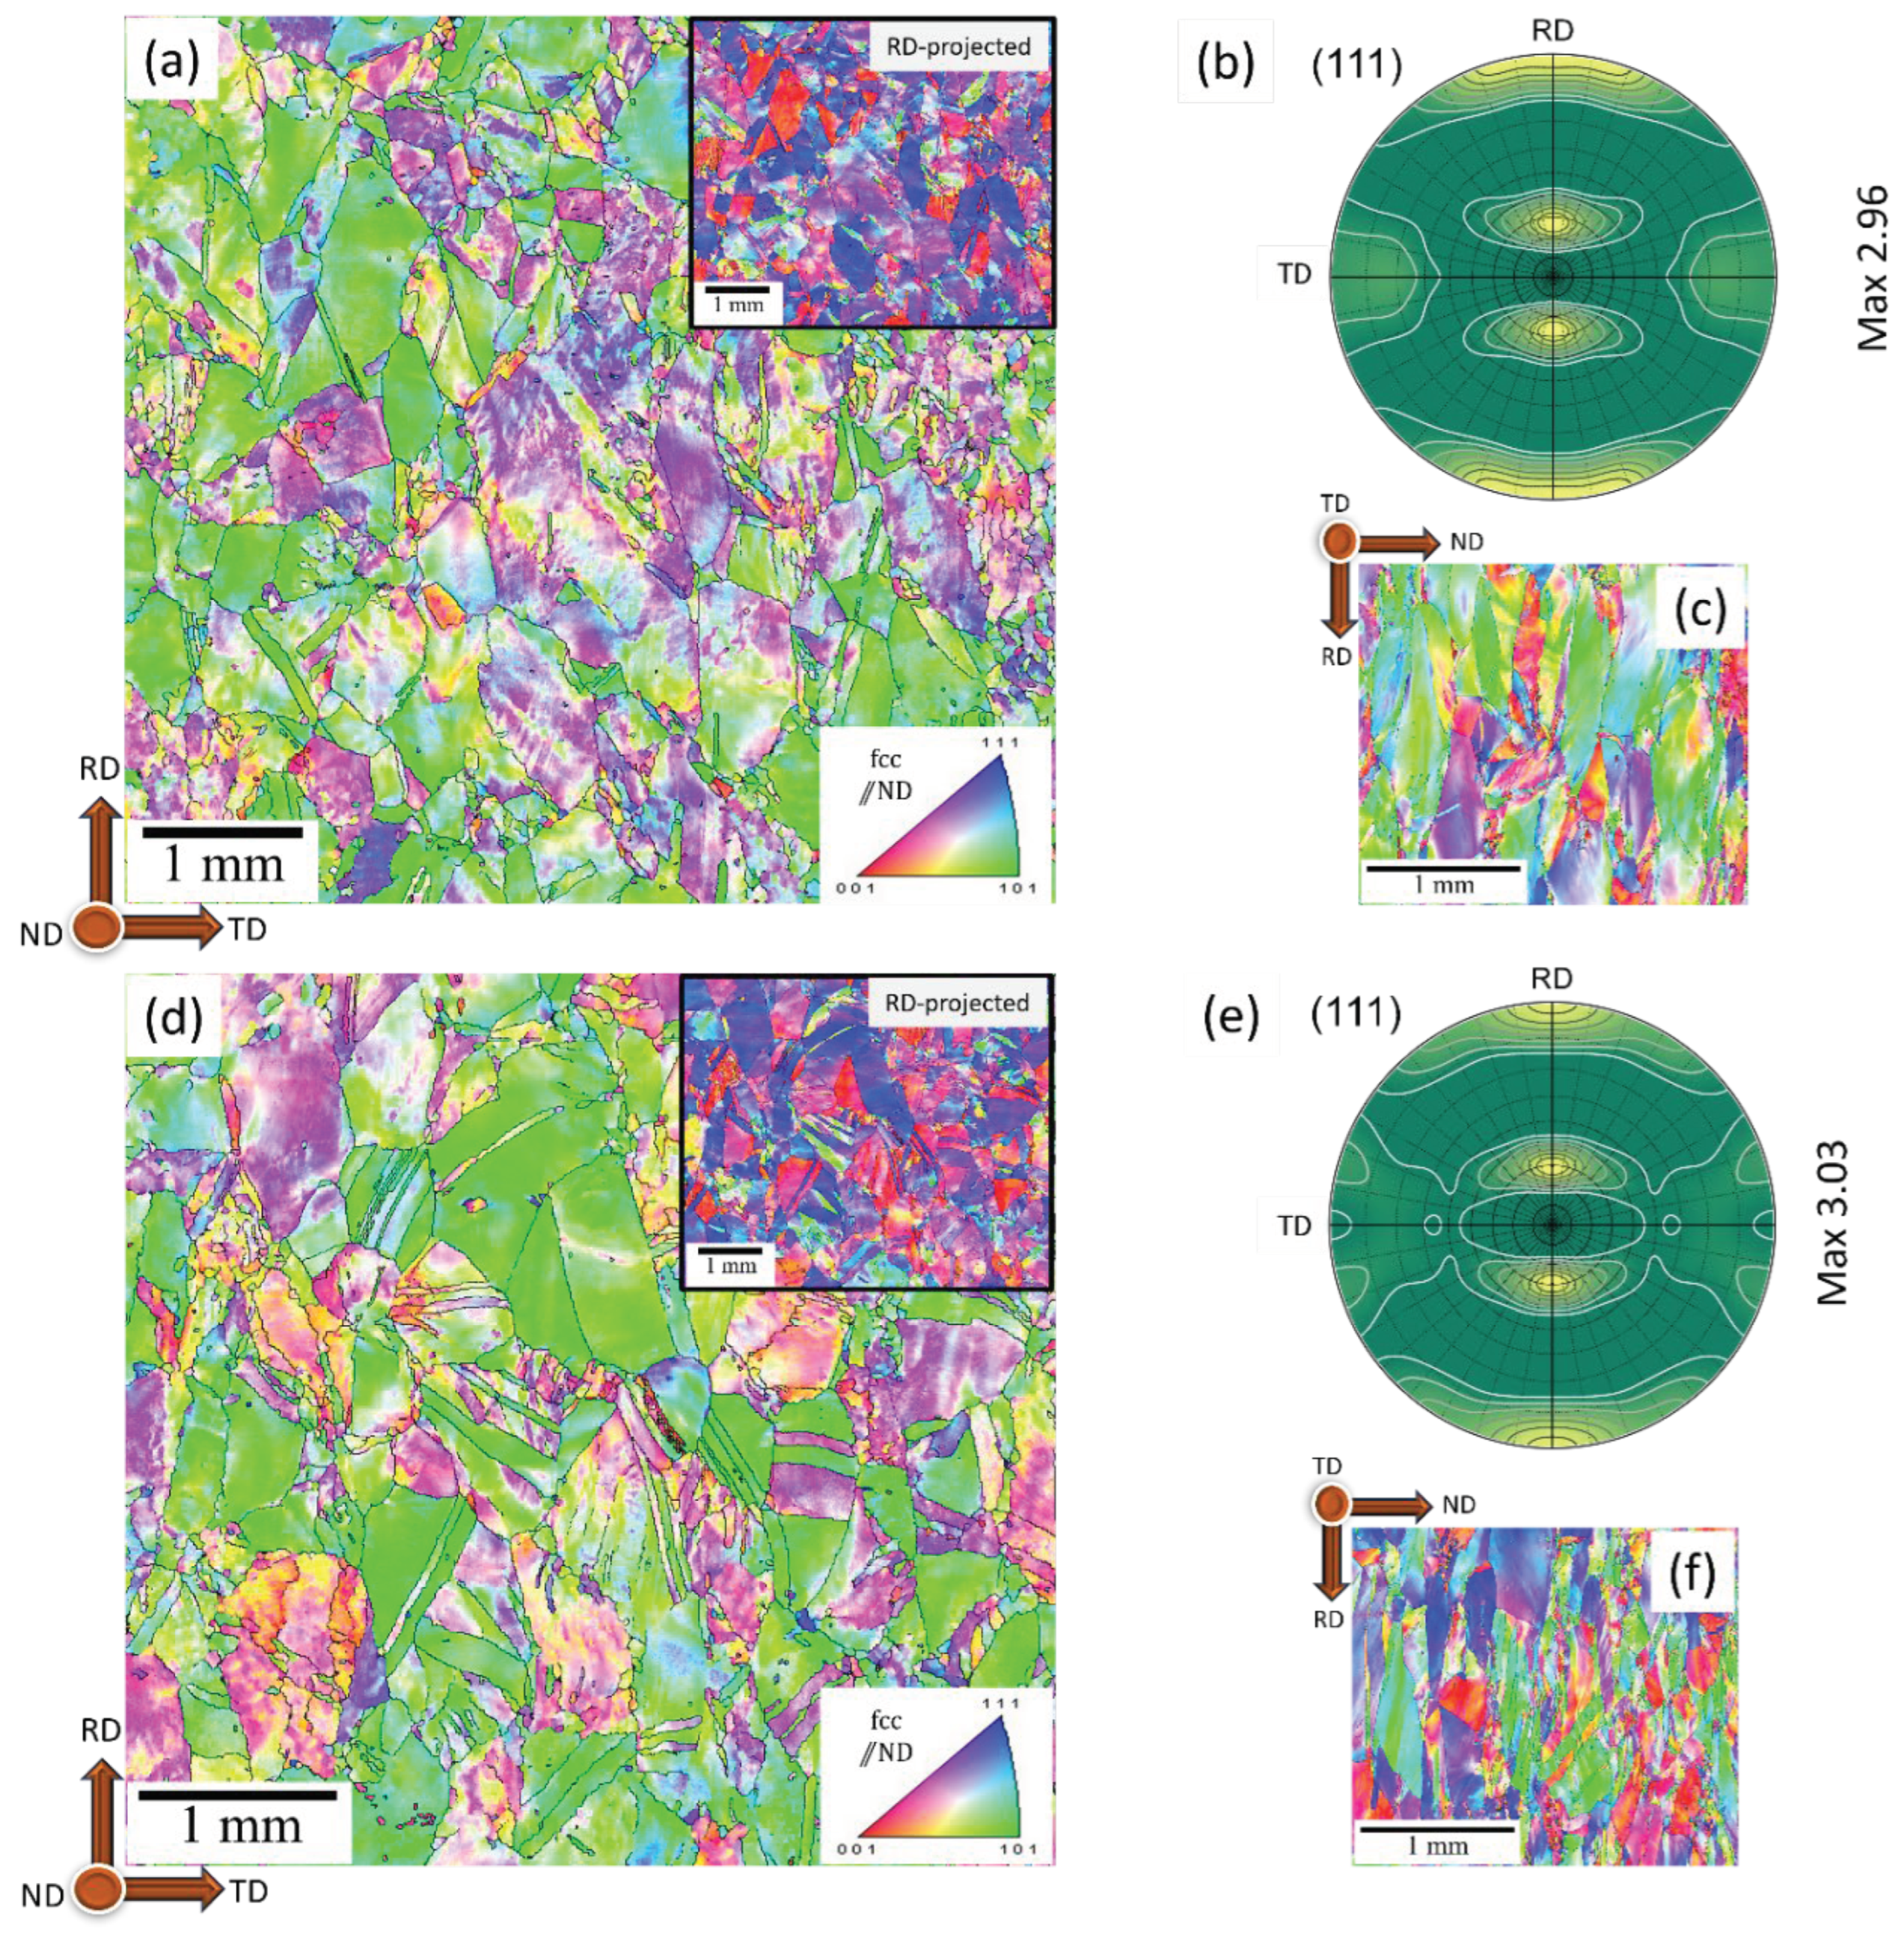
Figure 3 shows the schematic of the specimens’ coordinates, i.e., normal (loading), transverse, and rolling directions denoted as ND, RD, and TD, respectively. The rolling direction was parallel to the longer axis of the specimens. To provide a clear view of the microstructure in three dimensions, EBSD maps on each sample were performed from the rolling plane (RD-TD) and from the plane normal to the transverse direction (ND-RD). Large and small area acquisitions were carried out to study the grains’ preferred orientation and grain boundaries. The diffraction data were subjected to grain dilation clean-up by TSL-OIM program to diminish the noise effect and acquire the orientation maps. EBSD data were further processed with the ATEX software (Analysis Tools for Electron and X-ray diffraction; Beausir and Fundenberger, 2017 [
16]) to determine the texture evolution with respect to the deformation levels through the pole figures, and orientation distribution functions (ODFs). The harmonic series method was used for texture calculations. Presuming the orthonormal symmetry of rolled fcc material, the domain of Euler space was decreased to 0°<φ
1, Φ, φ
2 < 90°.
Figure 3.
Schematic representation of rolling plate and the corresponding workshop axes.
Figure 3.
Schematic representation of rolling plate and the corresponding workshop axes.
The precipitation hardening treatment of each specimen was performed with two successive steps of heat treatments adopted for conventionally fabricated Inconel 718. The furnace was pre-heated to the aging temperature before introducing the ST specimens. The aging treatment was done, first at 720 °C for 8 h, and then the furnace was cooled down to 650 °C held the specimens for another 8 h. At the end of the soaking period, the specimens were removed from the furnace and cooled in the air. The specimens’ descriptions are given in
Table 1. Likewise, the schematics showing the heat treatment regimens and rolling is shown in Figure 2.
2.3. Characterization of Microstructure, Texture, and Phases
The microstructure, composition, and fracture surfaces of the specimens were analysed with Scanning Electron Microscopy (SEM), Gemini SUPRA 35VP (Carl Zeiss, Jena, Germany) equipped with EDAX Energy Dispersive X-ray Spectroscopy (EDS). The crystallographic orientation was studied using Electron Back Scattered Diffraction (EBSD) equipped on SEM using a TSL-OIM orientation imaging microscope system for analysis. Specimen preparation for the microstructure analysis consisted of mechanical grinding, fine polishing, and ultra-polishing with OP-S colloidal silica. EBSD mapping was performed at 20 kV, a working distance of 25 mm, a tilt angle of 70°, a scan step of 0.5-2 μm and a magnification of 100/200.
Phases and lattice defects were further investigated with Transmission Electron Microscopy (TEM), JEOL- 2100 (LaB6 filament) (JEOL, Tokyo, Japan), operating at 200 kV. For TEM analysis, thin foils from the ND-TR surface were prepared, first by thinning down mechanically to a thickness of about 100 μm, and then 3-mm disks were punched from the thin foils. Finally, the disks were electropolished using a dual jet polishing system Struers TENUPOL-5 (Struers, Ballerup, Denmark) operated at 15 V and −30 °C in an electrolyte solution of 80% methanol and 10% perchloric acid.
2.4. Hardness Test
Vickers hardness tests were conducted on the RD-ND plane (parallel to the rolling direction) as shown in the illustration in
Figure 3 under a load of 5 kg and a dwell time of 10 s. The hardness was measured with an Innovatest automatic hardness tester that allows many indentations to be done in a controlled and accurate manner. The interval between adjacent indentations were set at least to 3 times the average length of the diagonal following the standard specifications stated in ISO 6507-01 [
17]. To avoid edge effects, the indentations were performed at more than 2.5 times the average length of the diagonal from the edges. For accuracy of the measurements, more than 70 imprints were conducted on each test specimens.
2.5. Tensile Test
The specimens for the tensile tests were obtained by machining the bolts (OC) to a rectangular shape with the dimension in the range of length (134-145 mm), width (9.5-14.3 mm) and thickness (4.7-5.7 mm). The uniaxial tensile tests were carried out parallel to the rolling direction at room temperature using Instron 5985 universal testing machine in accordance with test method A1 in ISO standard NS-EN ISO 6892-1:2019 [
18] with a strain rate of 0.00025 s−1.
Elongation was measured using an external clip-on extensometer. Mazak CNC was used for machining the specimens. The geometry of the tested specimens is shown in
Figure 4. Three tensile specimens were prepared for the 20% and 50% deformed cases. Due to shortage of material, only one specimen was available for the undeformed (D0A) case.
4. Discussions
4.1. Effect of Cold Rolling on Hardening Precipitates
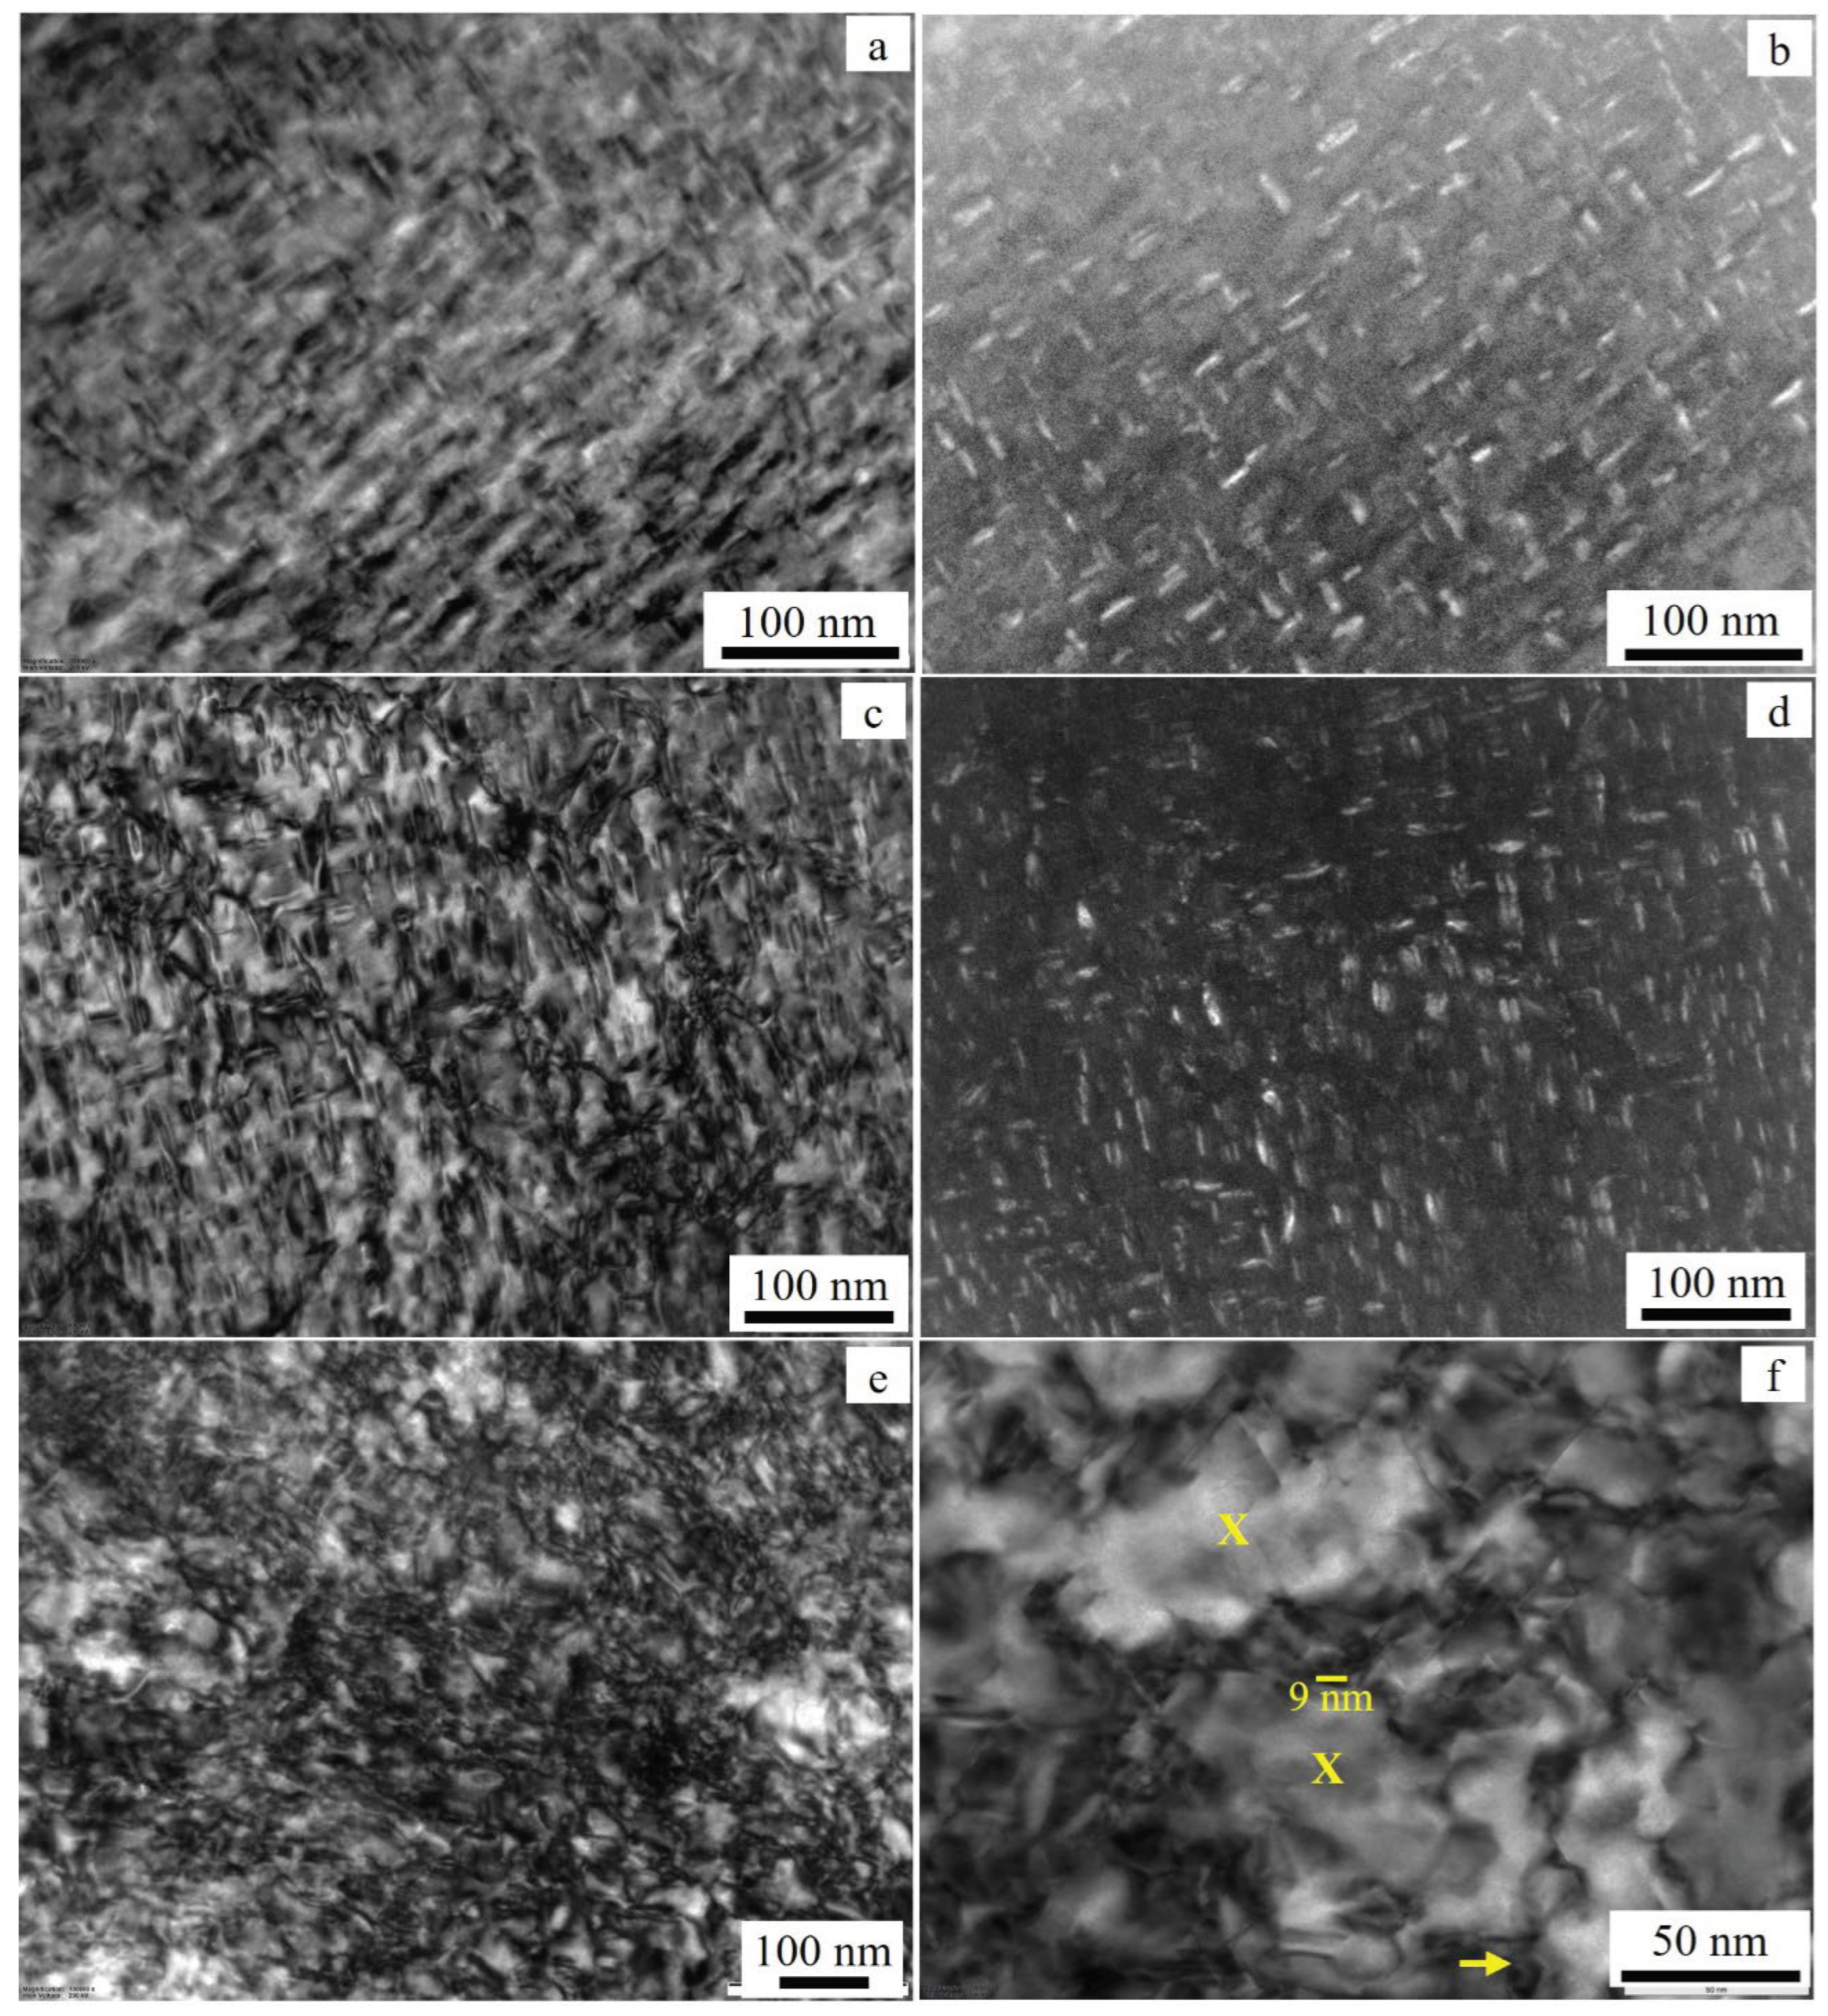
As shown above, cold rolling changes the nucleation, morphology, and distribution of the hardening precipitates compared to the unrolled condition. The nucleation sites of the γ″ and γ′ were mainly in the strained region than in the strain-free regions (
Figure 7f). The strained regions contain high density of dislocations that trapped atoms. Nb as the main constituent of the γ″ and γ′ phases are the heaviest element in the alloy 718, whose motion could be halted by dislocations. The start of nucleation of γ″ precipitates at the dislocation-rich regions in the deformed specimens, in particular in D50A is thus not a surprise. This agrees with the findings of Mei and co-works [
11] who found nucleation of γ″ phase near the pre-existing dislocations based on the Differential Scanning Calorimetry (DSC) measurement. The size of the precipitates in the 50% deformed specimens were however smaller compared to the precipitates formed in the undeformed specimen (8.2±1.6 nm vs. 9.5±2.1) and D20A (8.2±1.6 nm vs. 12.6±3.2). The growth or coarsening can be achieved only if more Nb atoms are coming to the nucleation sites, but the presence of high density of dislocations in the neighbourhood formed barriers to prevent further incoming of Nb atoms. The fact that γ″ precipitates appeared needle/rod-like in morphology implies shortage of Nb atoms for growth to an ellipsoid shape. From the results, it seems that cold rolling to a moderate level (about 20%) facilitates nucleation and coarsening of γ″ than at higher deformation level. As deformation increased to 50%, the size as well as quantity of γ″ precipitates diminished.
4.2. Effects of Cold Rolling on Hardness and Tensile Properties
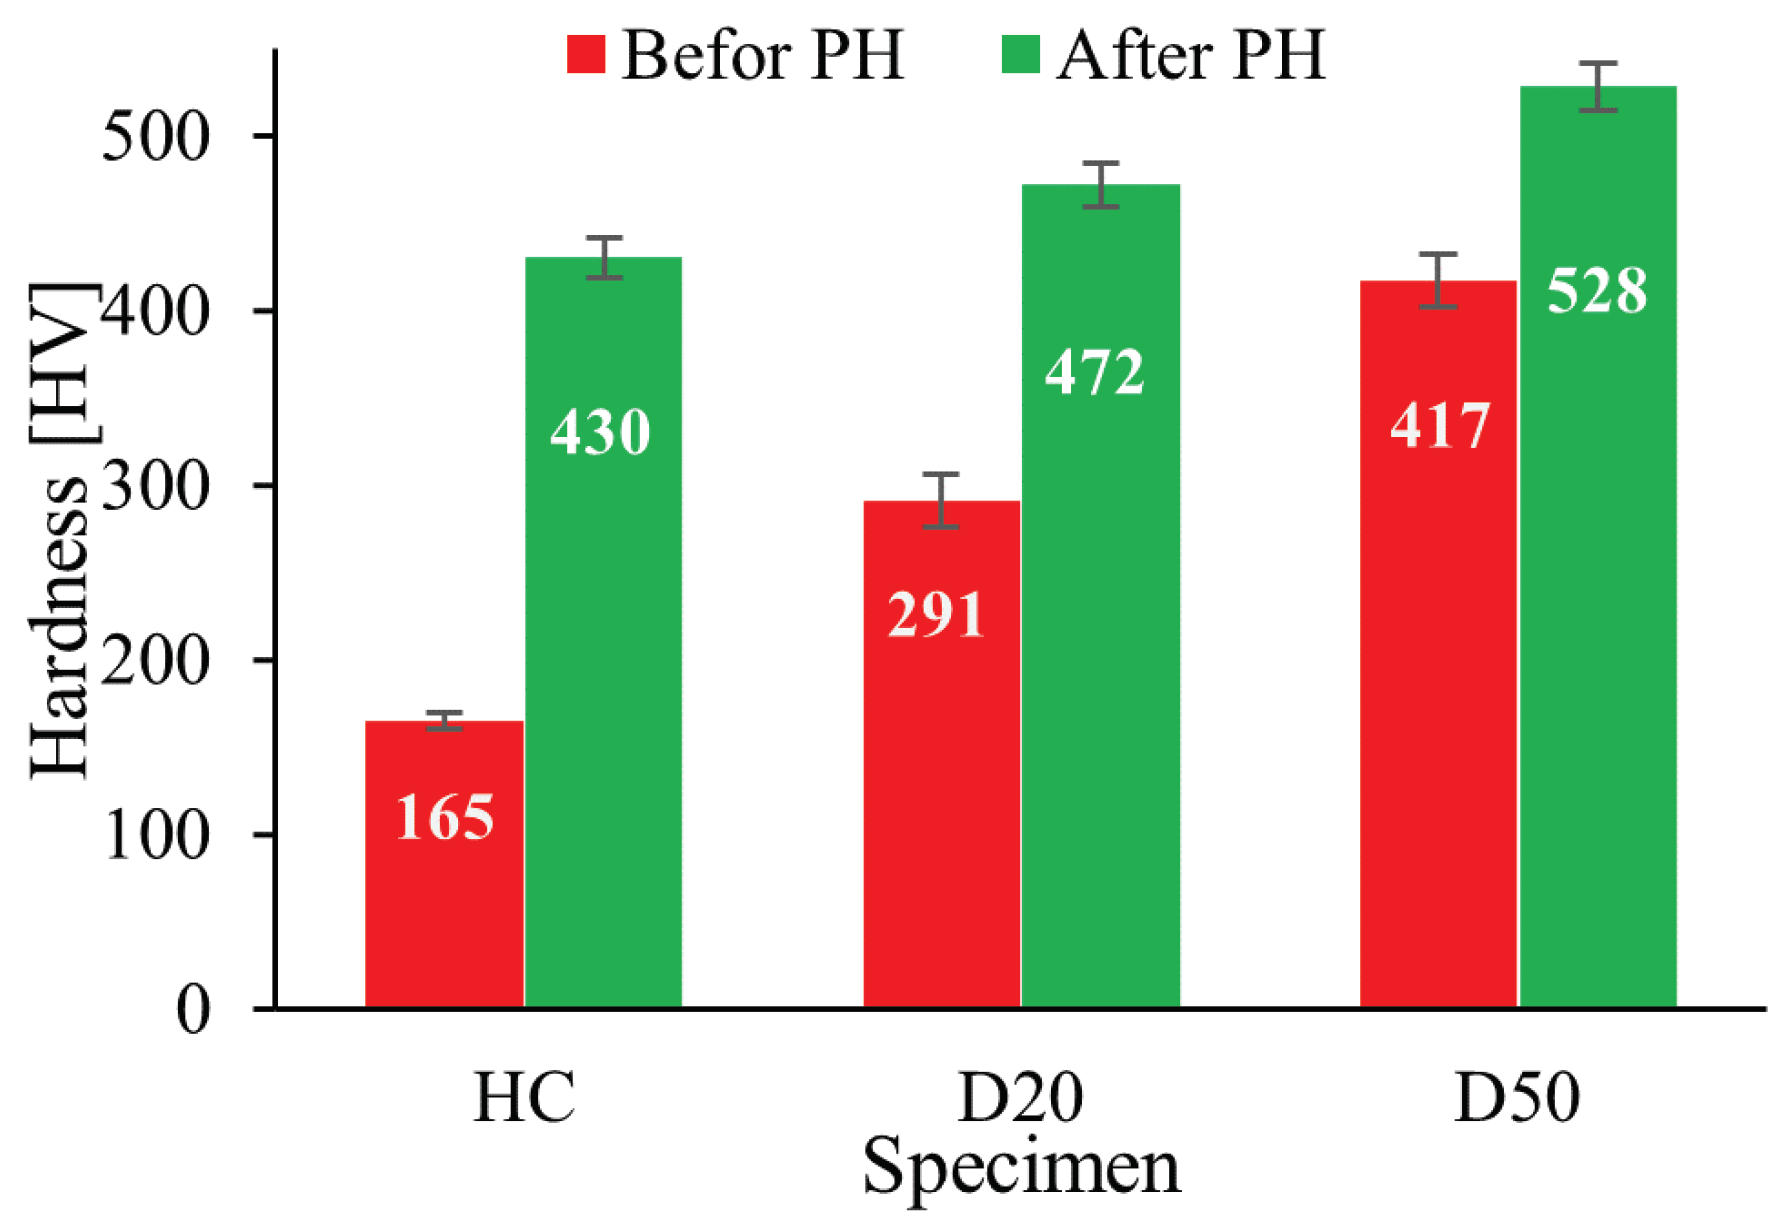
The cold rolling process significantly changes mechanical strength but reduces ductility of IN718 which can be explained in terms of microstructure and precipitation hardening phases. As shown above, the hardness of the 20% (D20A) and 50% (D50A) rolled/deformed and aged specimens increased by about 42 HV (10%) and 98 HV (23%), respectively, compared to D0A (undeformed, but aged). In order to identify explicitly the factors that affect hardness, the approach of Mei and co-workers [
11] is revisited here. The main factors affecting hardness can be distinguished using the empirical formula given in equation (1) [
11].
The subscripts S, WH and PH in the formulation stand for solid solution heat treatment, work hardening and precipitation hardening, respectively. From
Figure 9, the hardness value of the specimen after solid solution (D0) is 165 HV. After substituting the measured values in equation (1) for the three cases can be estimated as shown in equation 2-4. Note that the effects of recovery during aging was neglected.
Clearly, hardness increases with increasing percentage of deformation. The hardness of the specimen deformed by 50% enhanced by two folds compared to the specimen deformed by 20%. However, the contribution of precipitation hardening to the hardness is decreasing with increasing percentage of deformation. Relative to the 20% deformed specimen, the hardness of the 50% was decreased by about 63% (70 HV). Similar observation was reported by Mei, et. al. [
11]. They have noted an increment in HV
WH while reduction in HV
PH by increasing the level of rolling from 0% to 70%. Overall, D50A attain the highest hardness compared to D20A and D0A. For the moderate deformation (in this case 20%), the contribution of precipitation hardening is larger than due to the work hardening. This may signal lower density of dislocations occurred compared to the 50% deformed specimen. That is why (work hardening) was the main contributor to the highest hardness obtained in D50A.
The empirical formula applied for hardness can be used to show the effects of rolling on tensile properties, too. Since tensile tests were not done for ST specimens (D0), the first term on the right side of equation (1) can be deleted and write for the UTS by substituting the numerical values given in
Figure 10.
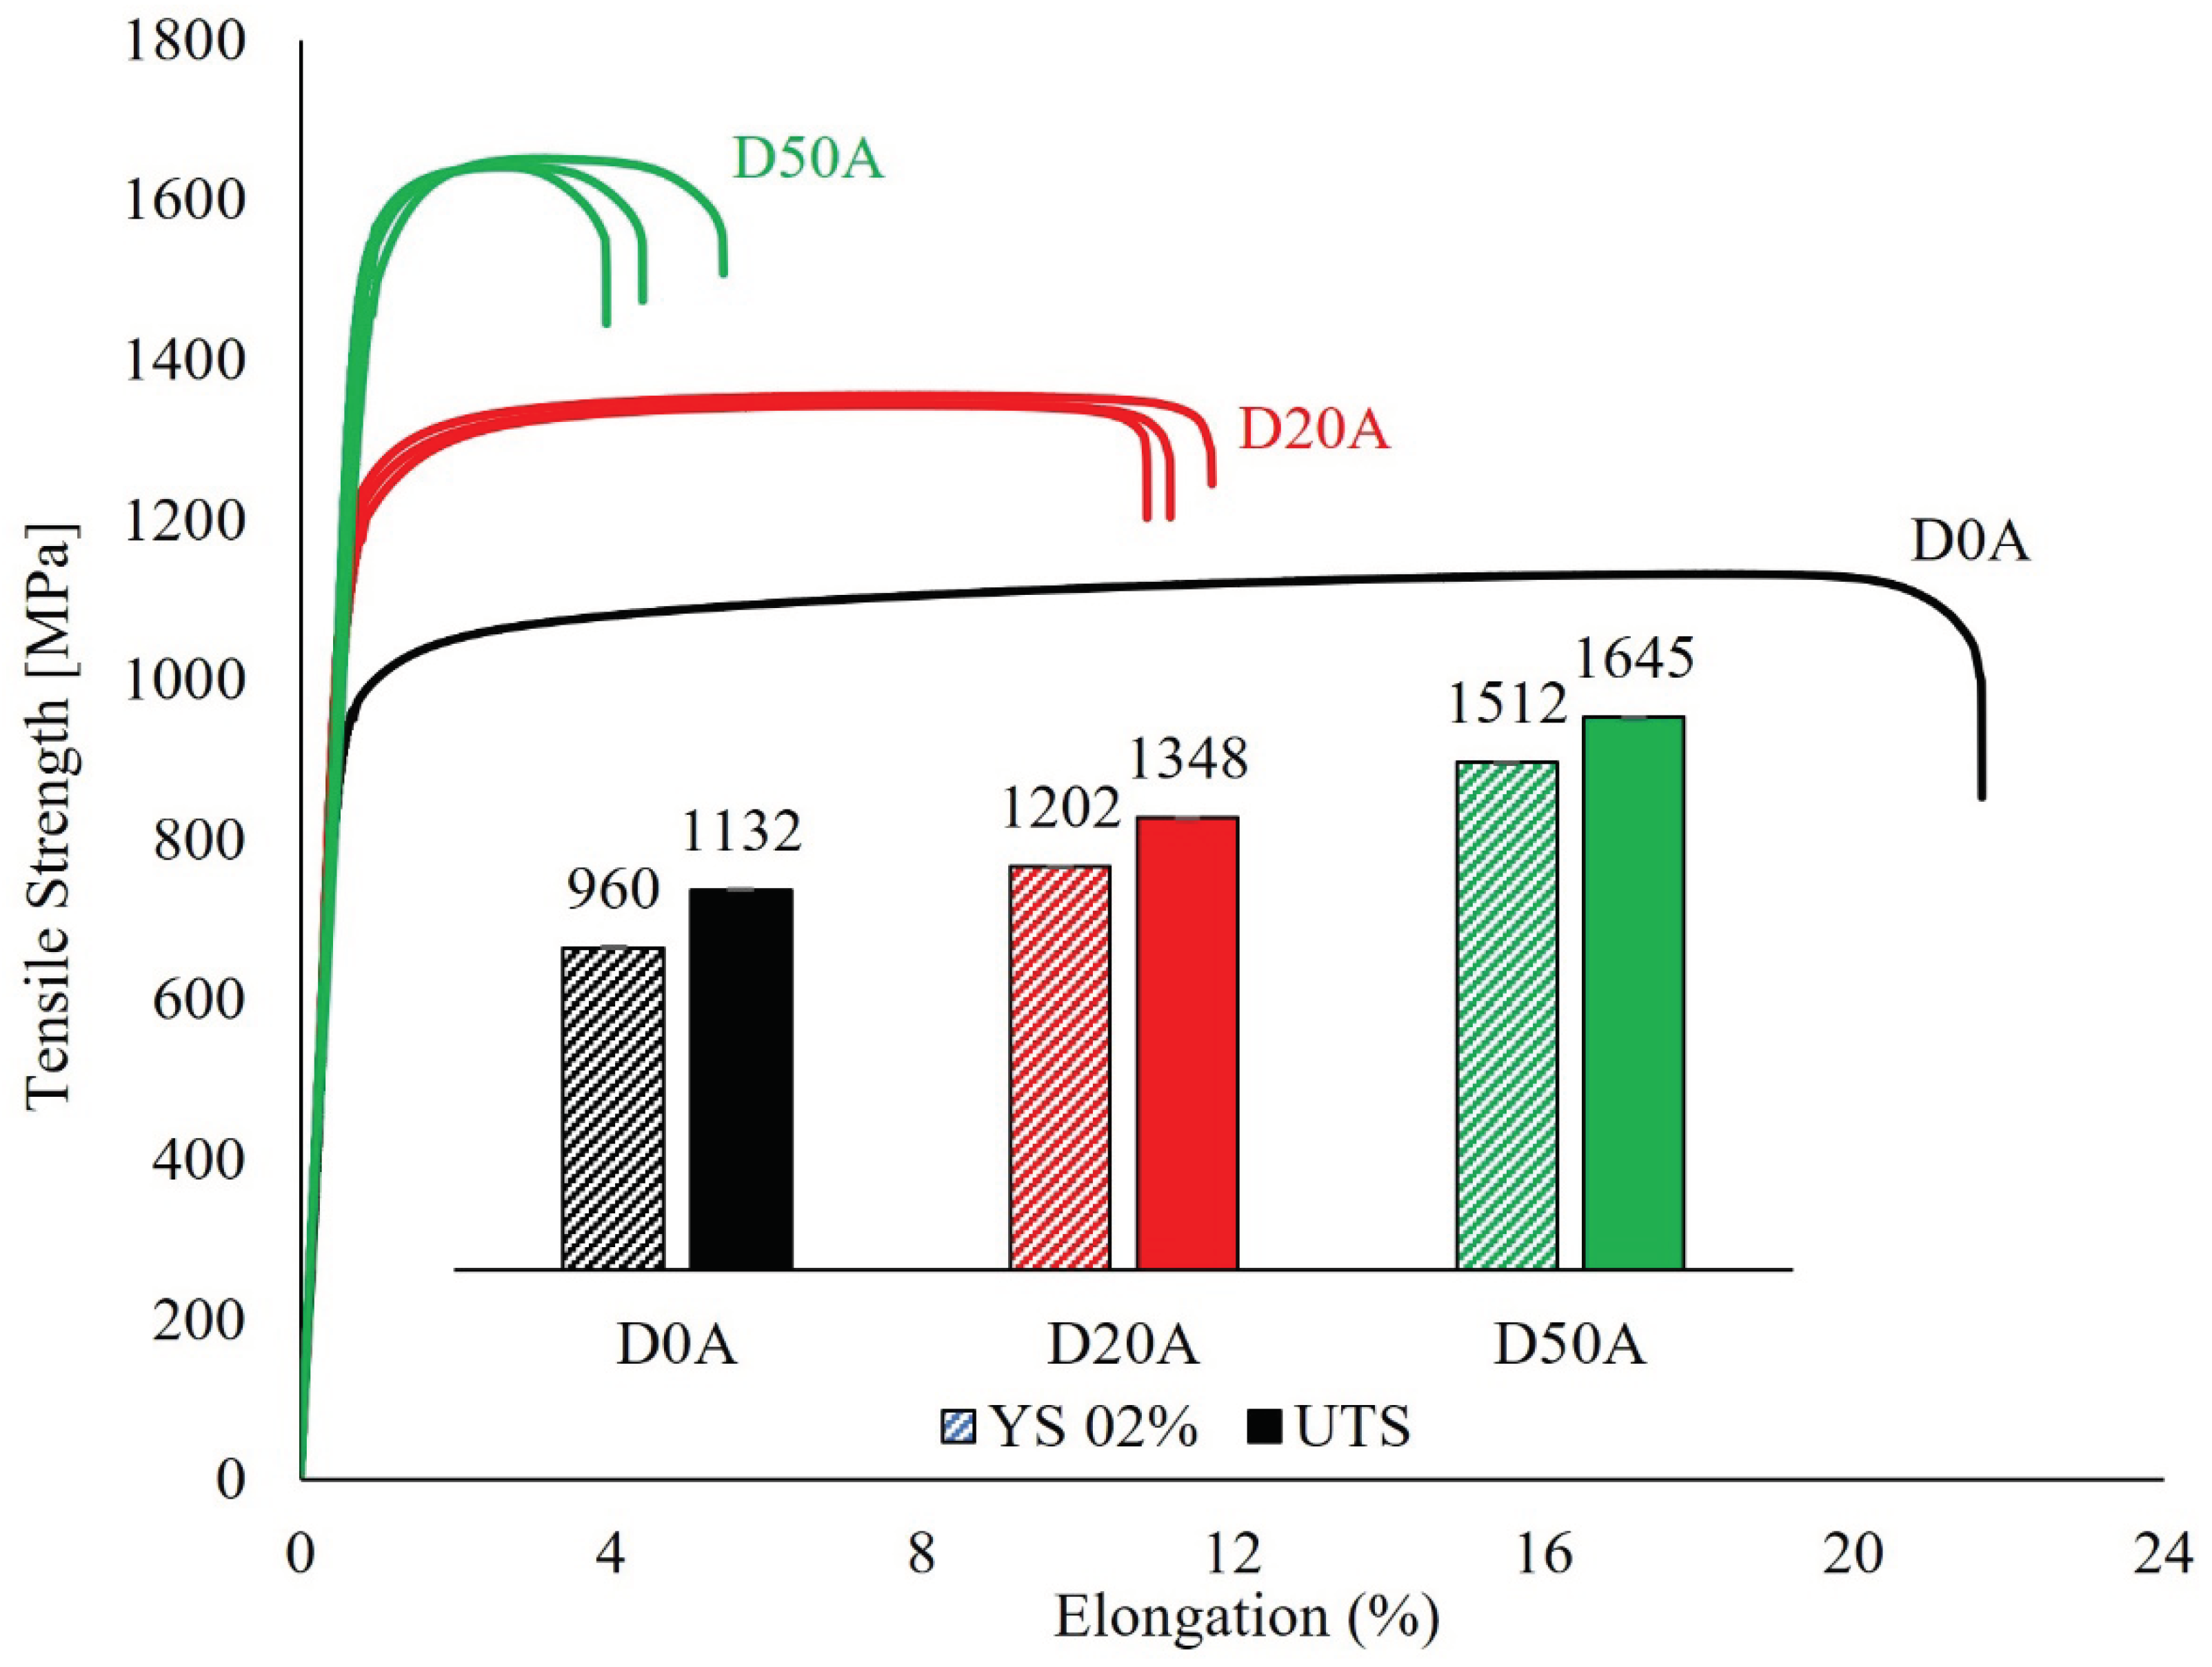
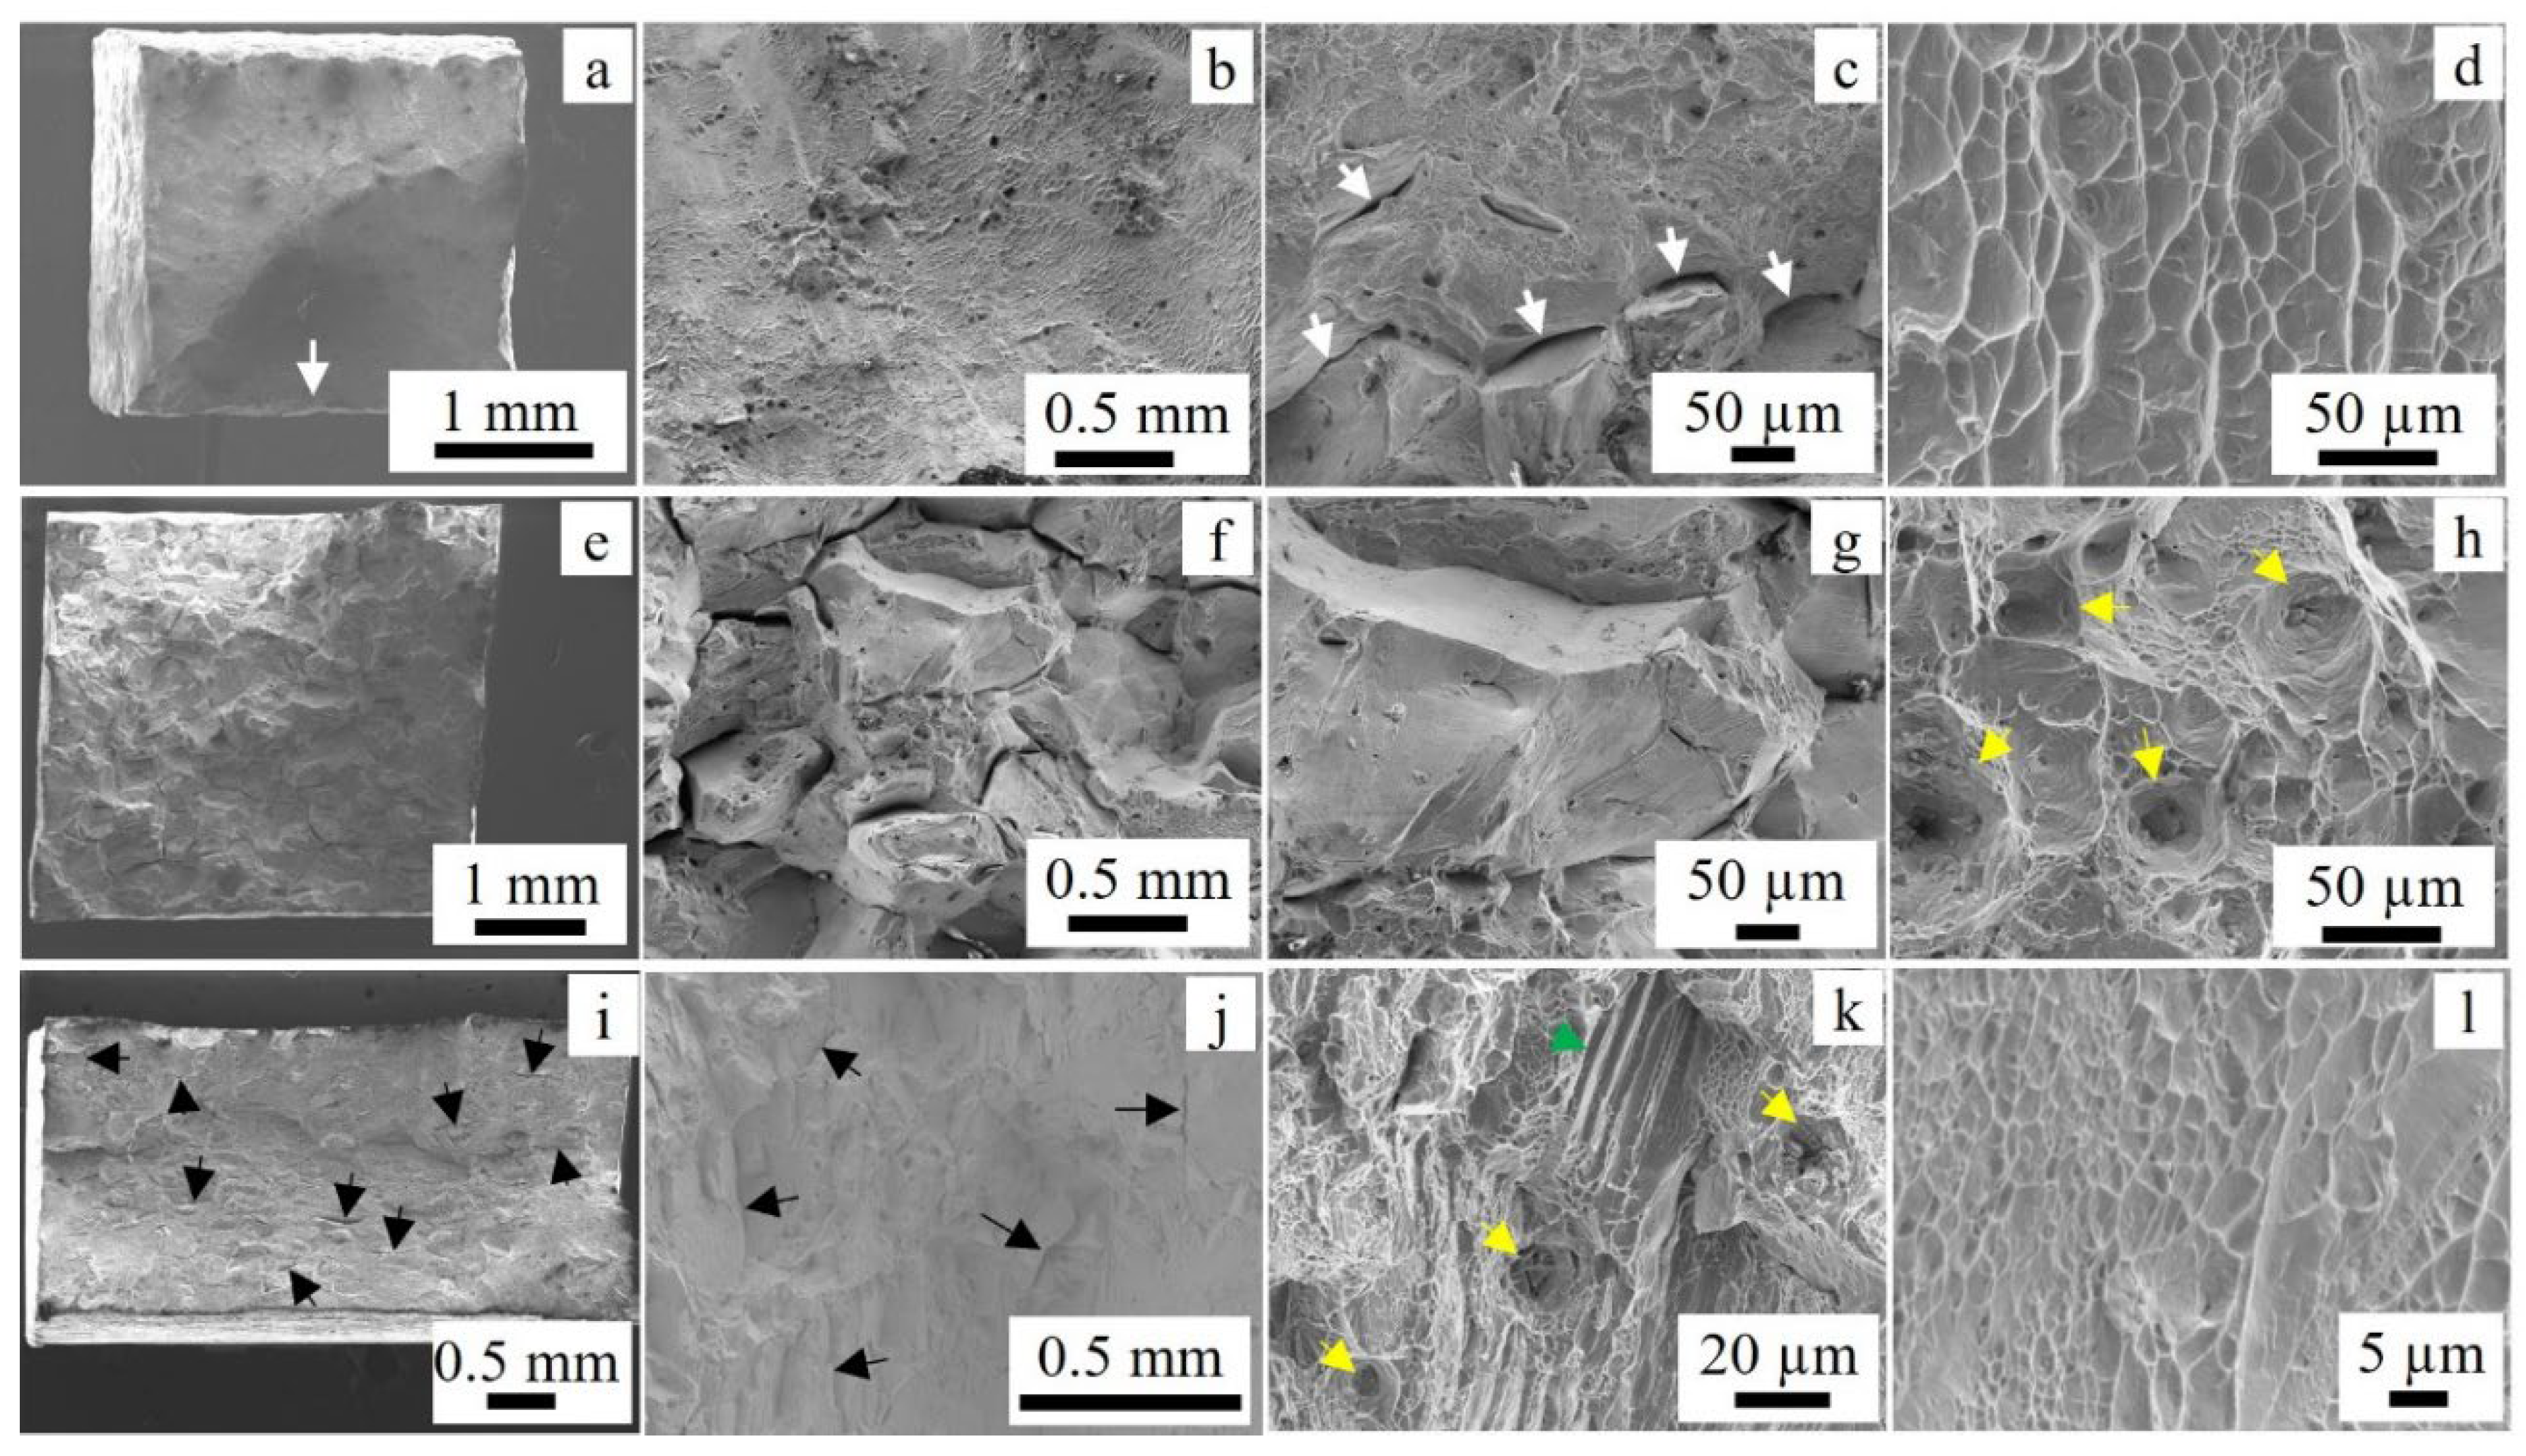
The equations (5-7) demonstrate that tensile strength increases with increasing level of deformation. After deformation by 20% (D20A), the UTS increased by 216 MPa (19%) while the UTS of the 50% deformed specimen (D50A) was increased by 513 MPa (45%), compared to that of the undeformed specimen (D0A). Similar trend has demonstrated in yield strength as well. Deformation enhanced yield strength by 242 MPa (25%) for 20% reduction and by 552 MPa (58%) for 50% reduction. The increment in yield strength is more pronounced than UTS, relatively for both deformations. Nanotwins might contribute to the enhanced elastic property of the specimens. Likewise, qualitatively, the concentration level of nanotwins in D50A is higher than in D20A.
The tensile properties obtained from the current work is in most cases better than what have been reported in the literature under the conditions that evolved δ phase (heat treatments, rolling). The maximum UTS, 0.2% YS and elongation measured in this work under 50% deformed condition are 1645 MPa, 1512 MPa, and 3.8 %, respectively. Similarly, the UTS, 0.2% YS and elongation for the 20% deformed specimen are 1348 MPa, 1202 MPa, and 11 %, respectively.
The proportionality of the tensile properties with deformation can be associated with the degree of changes in microstructure. The mechanism of deformation during cold rolling can be understood using TEM analysis.
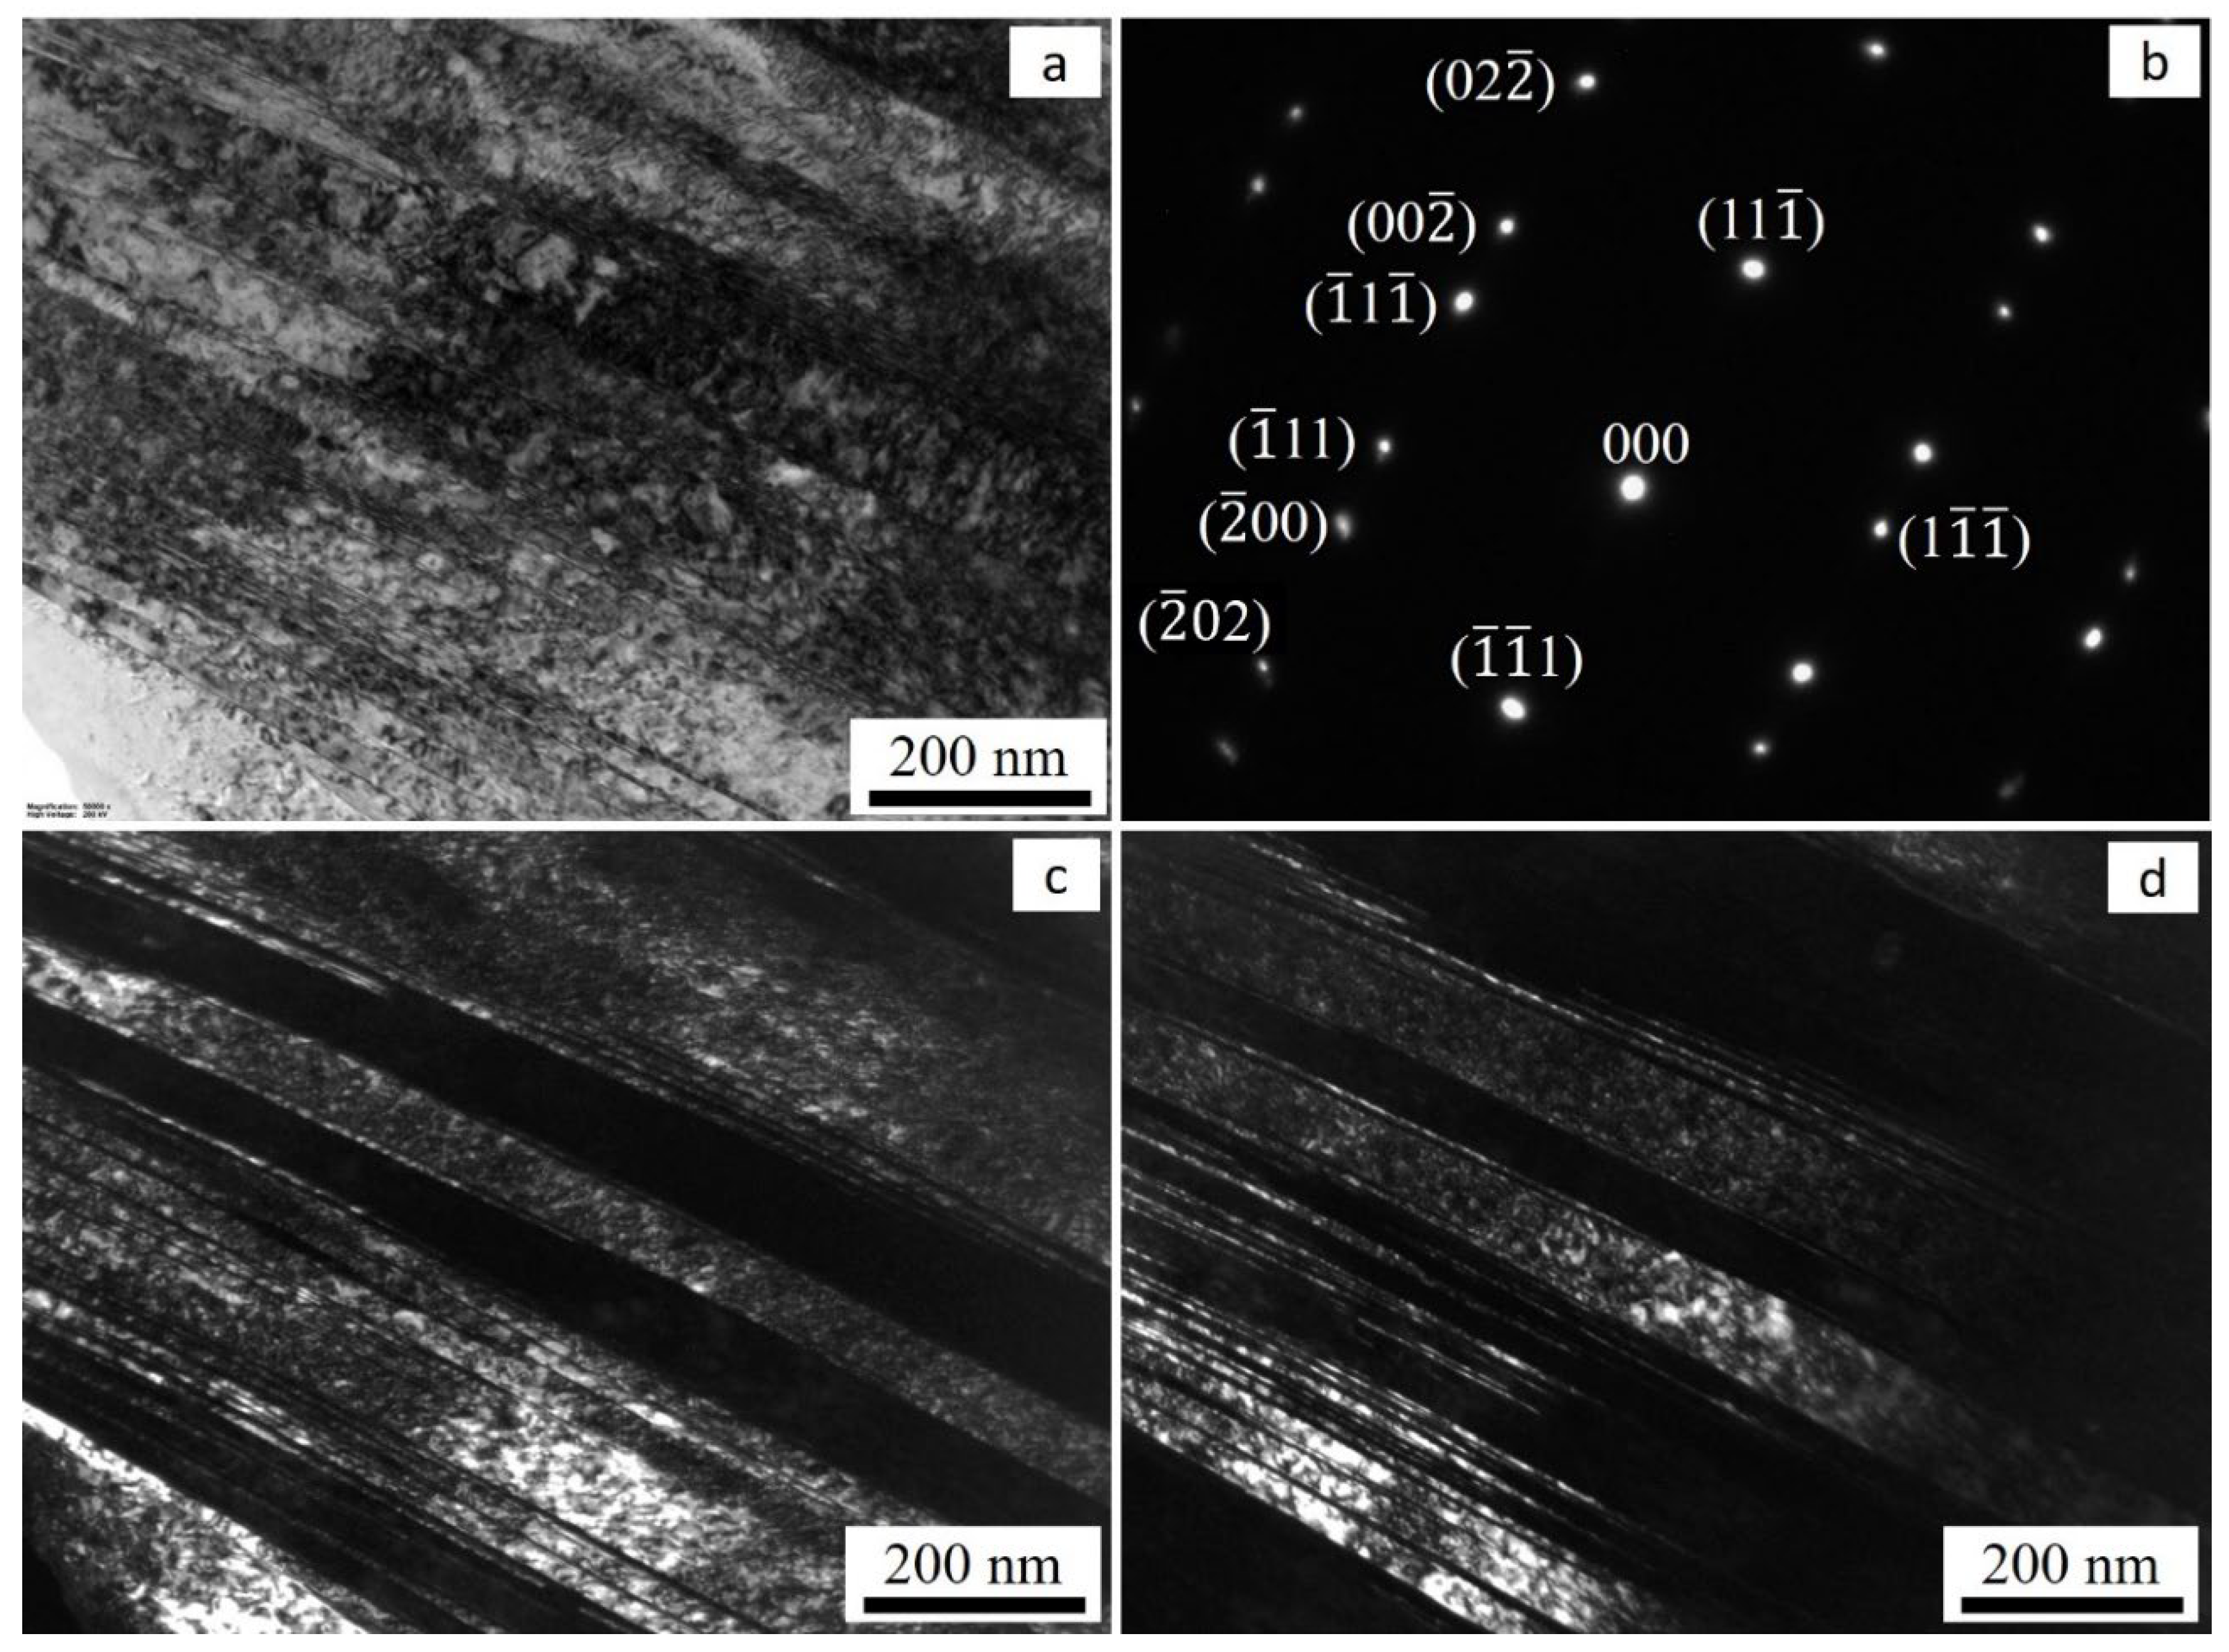
Figure 17 shows the TEM images of the specimens prepared from the RD-ND surface. The BF (a), DF (c, d) and the indexed diffraction pattern (b) reveal presence of high density of twin lamellas that ranges from a few nano meters to several micrometres. As shown in the images, the twins are stacked together in localized bands with the twin planes perpendicular to ND-RD while parallel with <110> orientation. Such nano/microtwins are known for being strong and impenetrable barriers for the dislocation slips as indicated in literature [
24]. Since the small spacing between the twin lamellae clearly reduces the mean free path for dislocation slip, the twins enhanced strongly the high strain-hardening rates during cold rolling [
25] in addition to dislocations and other lattice defects.
4.3. Effects of Cold Rolling on Texture
Crystallographic textures are known to influence most of the mechanical, physical, and chemical properties of alloys. Depending on the value of stacking fault energy (γ
SFE) of the FCC materials, two common categories of rolling textures, entitled alloy-type and pure-metal-type, can be emerged. The former is known for low γ
SFE materials and promotes strong B along with weakened G, while the latter is typically appeared in medium-to-high γ
SFE and includes the identical intensities of Cu, S, and B orientations [
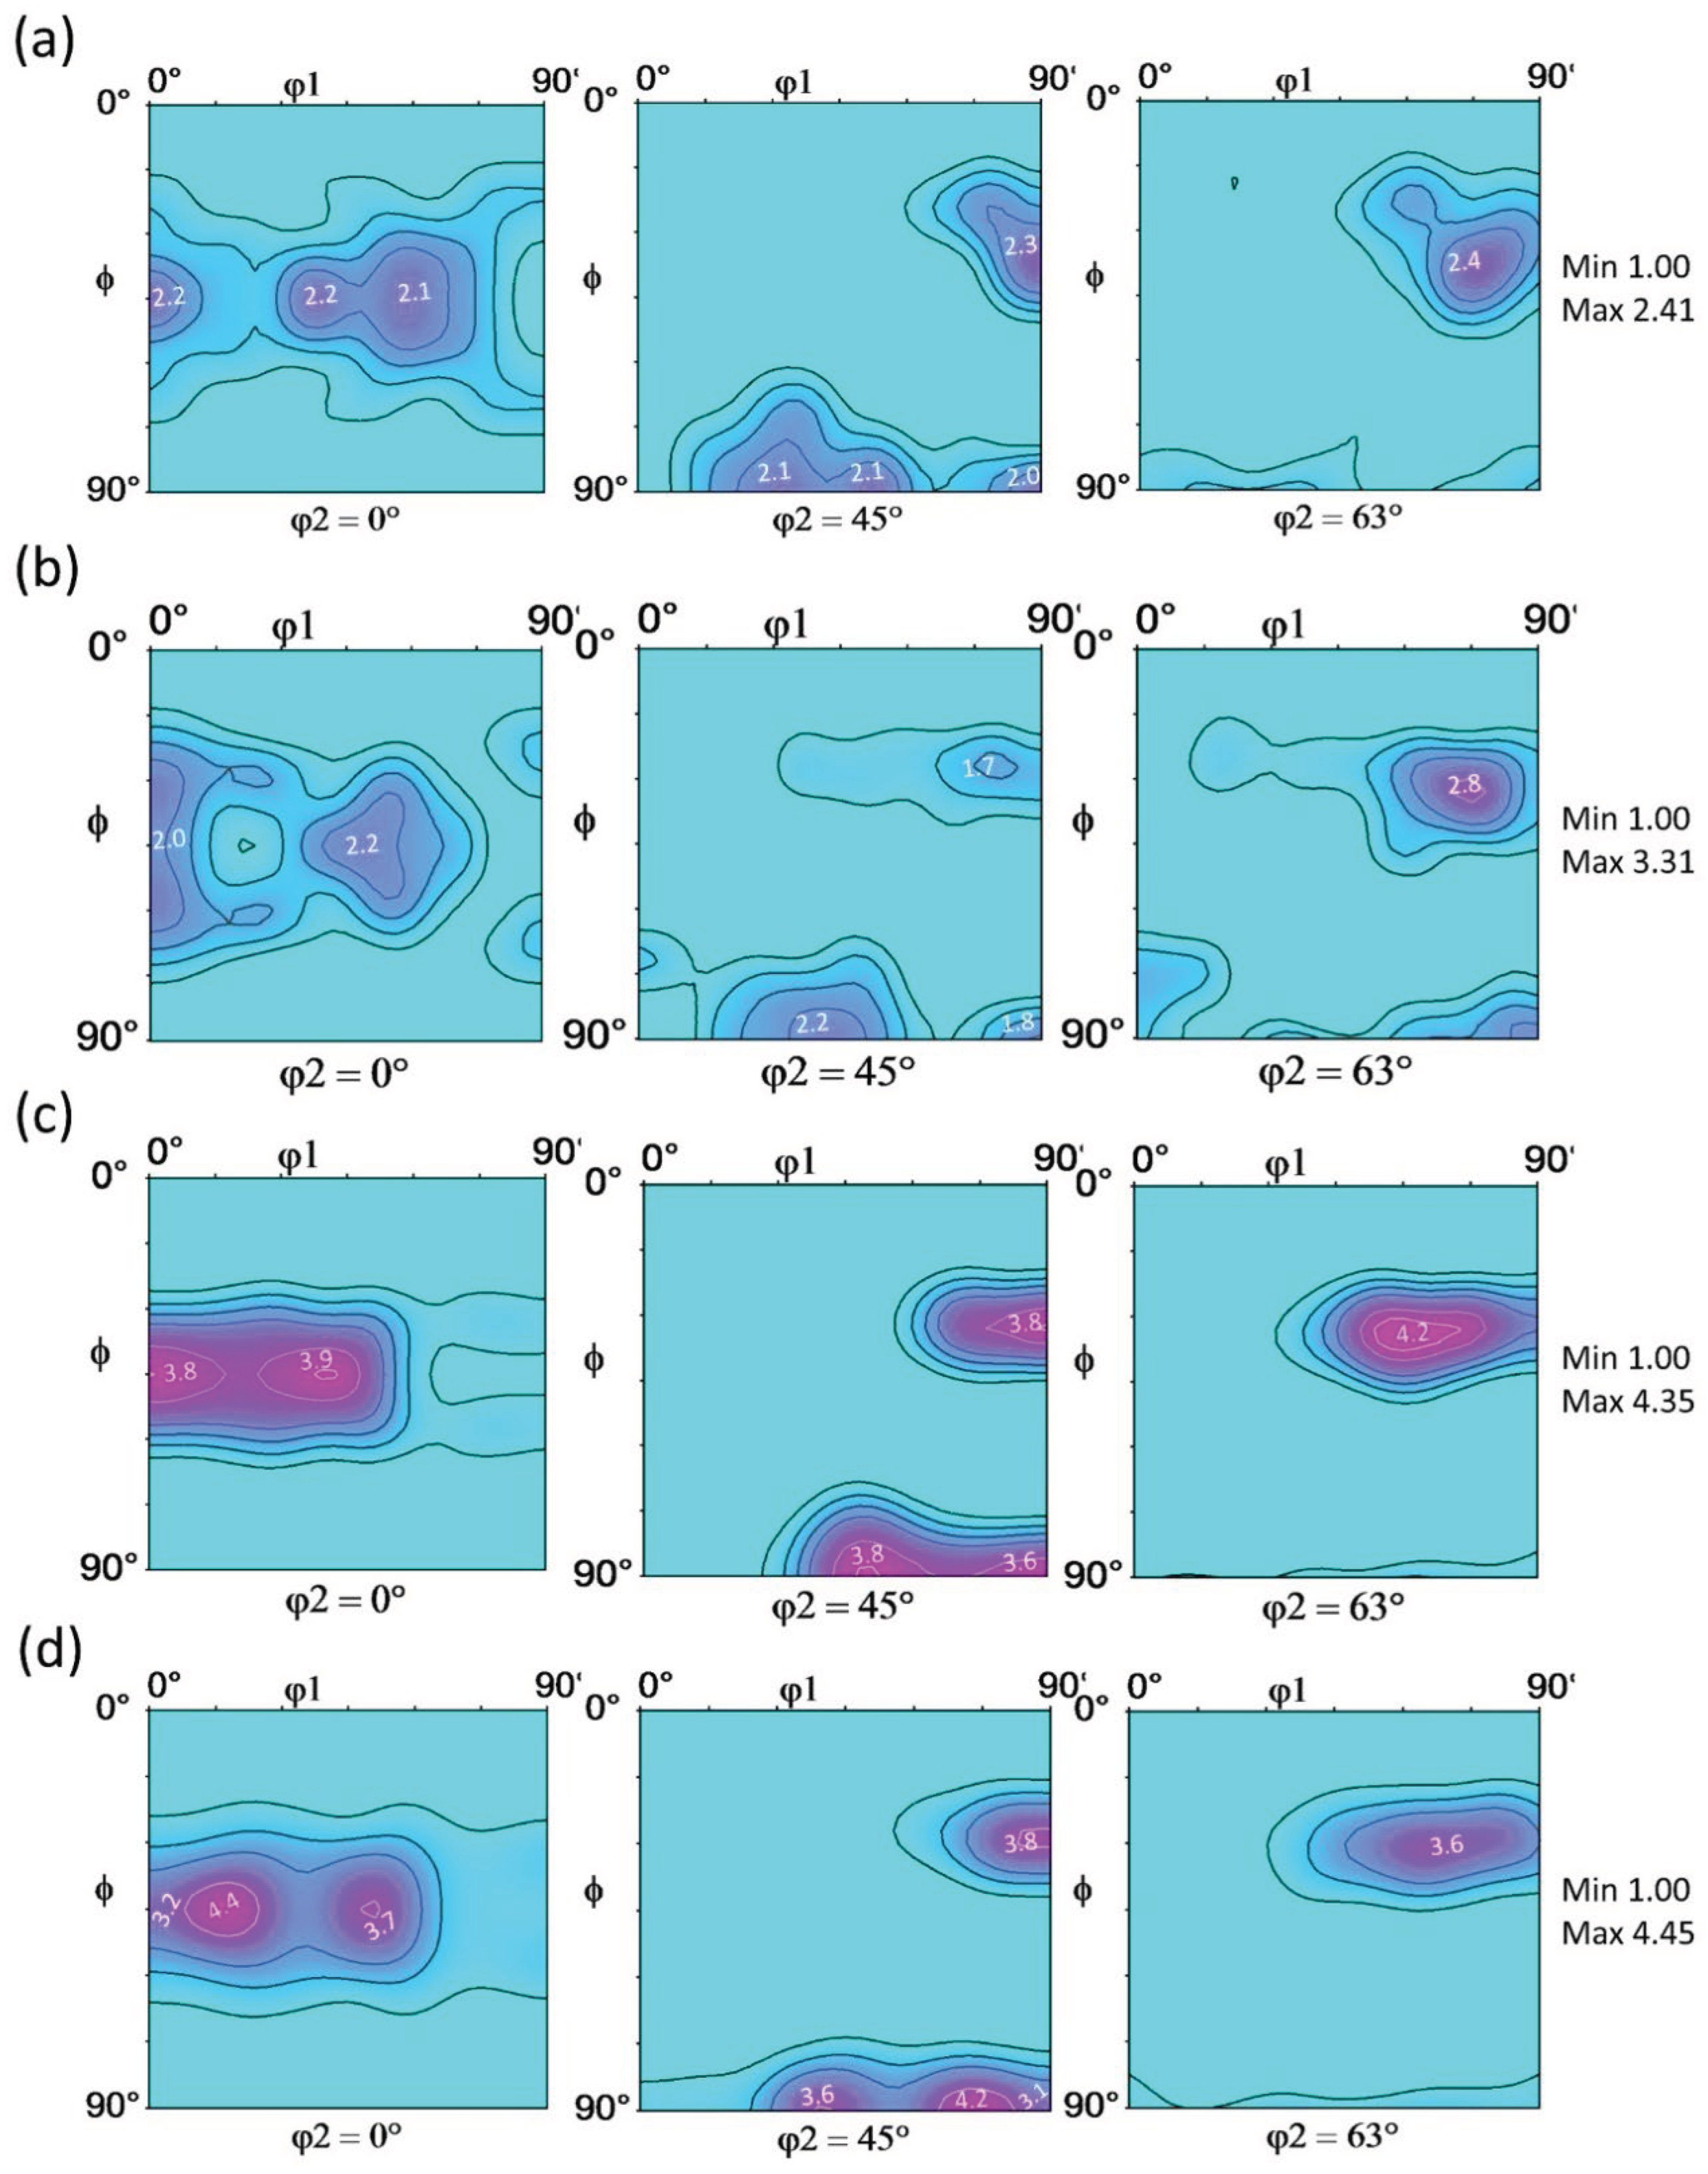
26]. Thus, the formation of Cu, S, and B developed on β-fibre and their enhanced intensities under the higher deformation in this work can be correlated to Ni which is known for its high γ
SFE. The cross-slip of screw dislocation is behind the development of dominant pure-metal texture. Nonetheless, any decay in the value of γ
SFE as a function of solute elements can produce alloy-type texture predominantly induced by mechanical twining, that may subsequently reflect on the intensity of B, and production of G. Assuming the binary system contribution of each element and Ni, and the least influence of Fe, the decrement of γ
SFE can be roughly estimated based on the composition of Inconel 718 alloy:
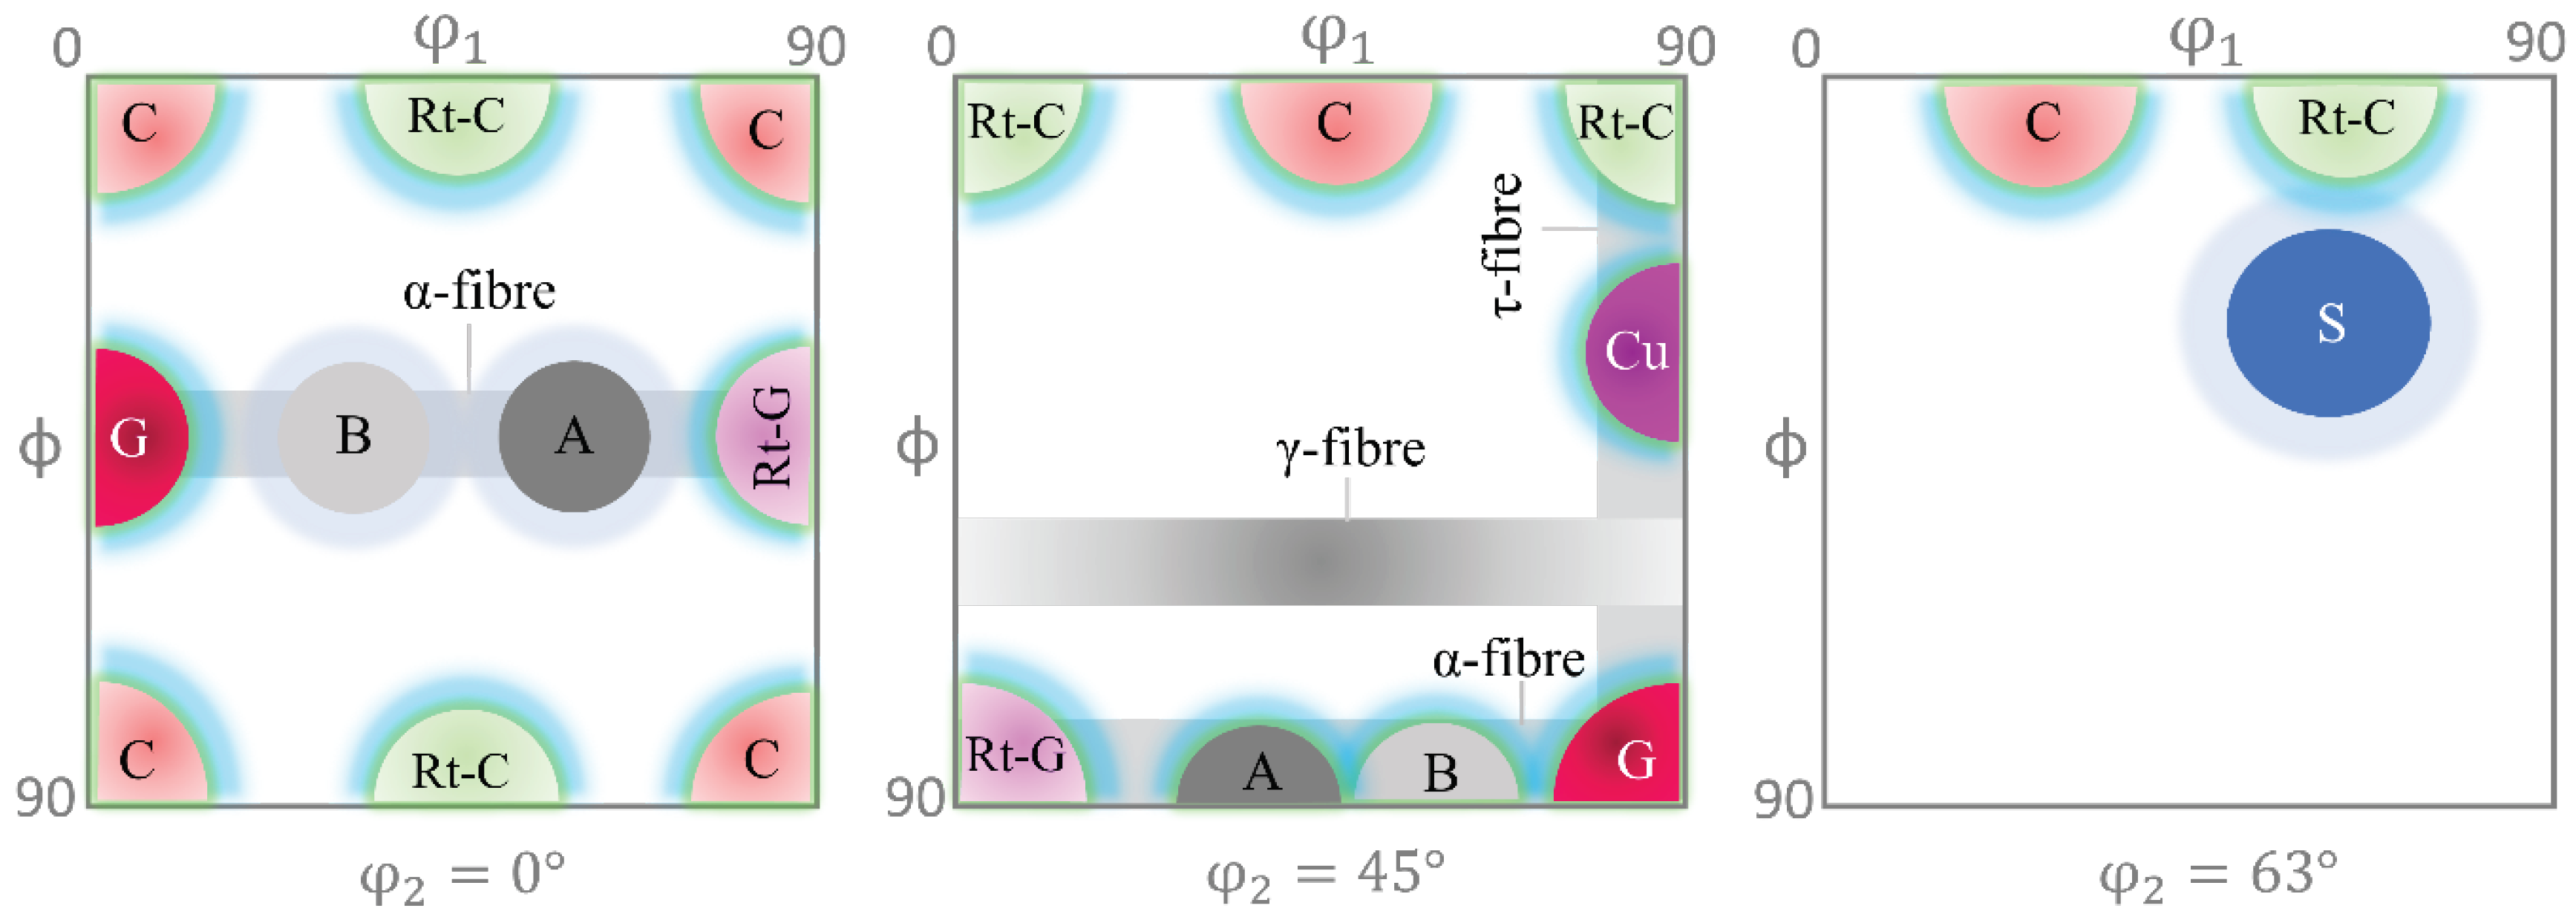
Due to the high concentration of Cr, and the simultaneous presence of Mo, Co, Ti, and Al, a considerable reduction of γSFE is not unexpected. The γSFE of the alloy falls to the medium level of 67.5 mJm-2 after an estimated ∆γSFE of 42.27%. This could make the solid solution strengthened Inconel 718 alloy highly susceptible to the deformation under the twining mechanism and production of alloy-type texture. As a result, an α-fibre predominantly stretched between {110}<001> and {110}<112> was formed.
Figure 1.
Microstructure of the initial material (a) SEM image and (b) TEM dark field image, showing γ″ phase precipitates. The insert in (b) is a diffraction pattern in zone axis.
Figure 1.
Microstructure of the initial material (a) SEM image and (b) TEM dark field image, showing γ″ phase precipitates. The insert in (b) is a diffraction pattern in zone axis.
Figure 4.
Schematic of tensile specimen.
Figure 4.
Schematic of tensile specimen.
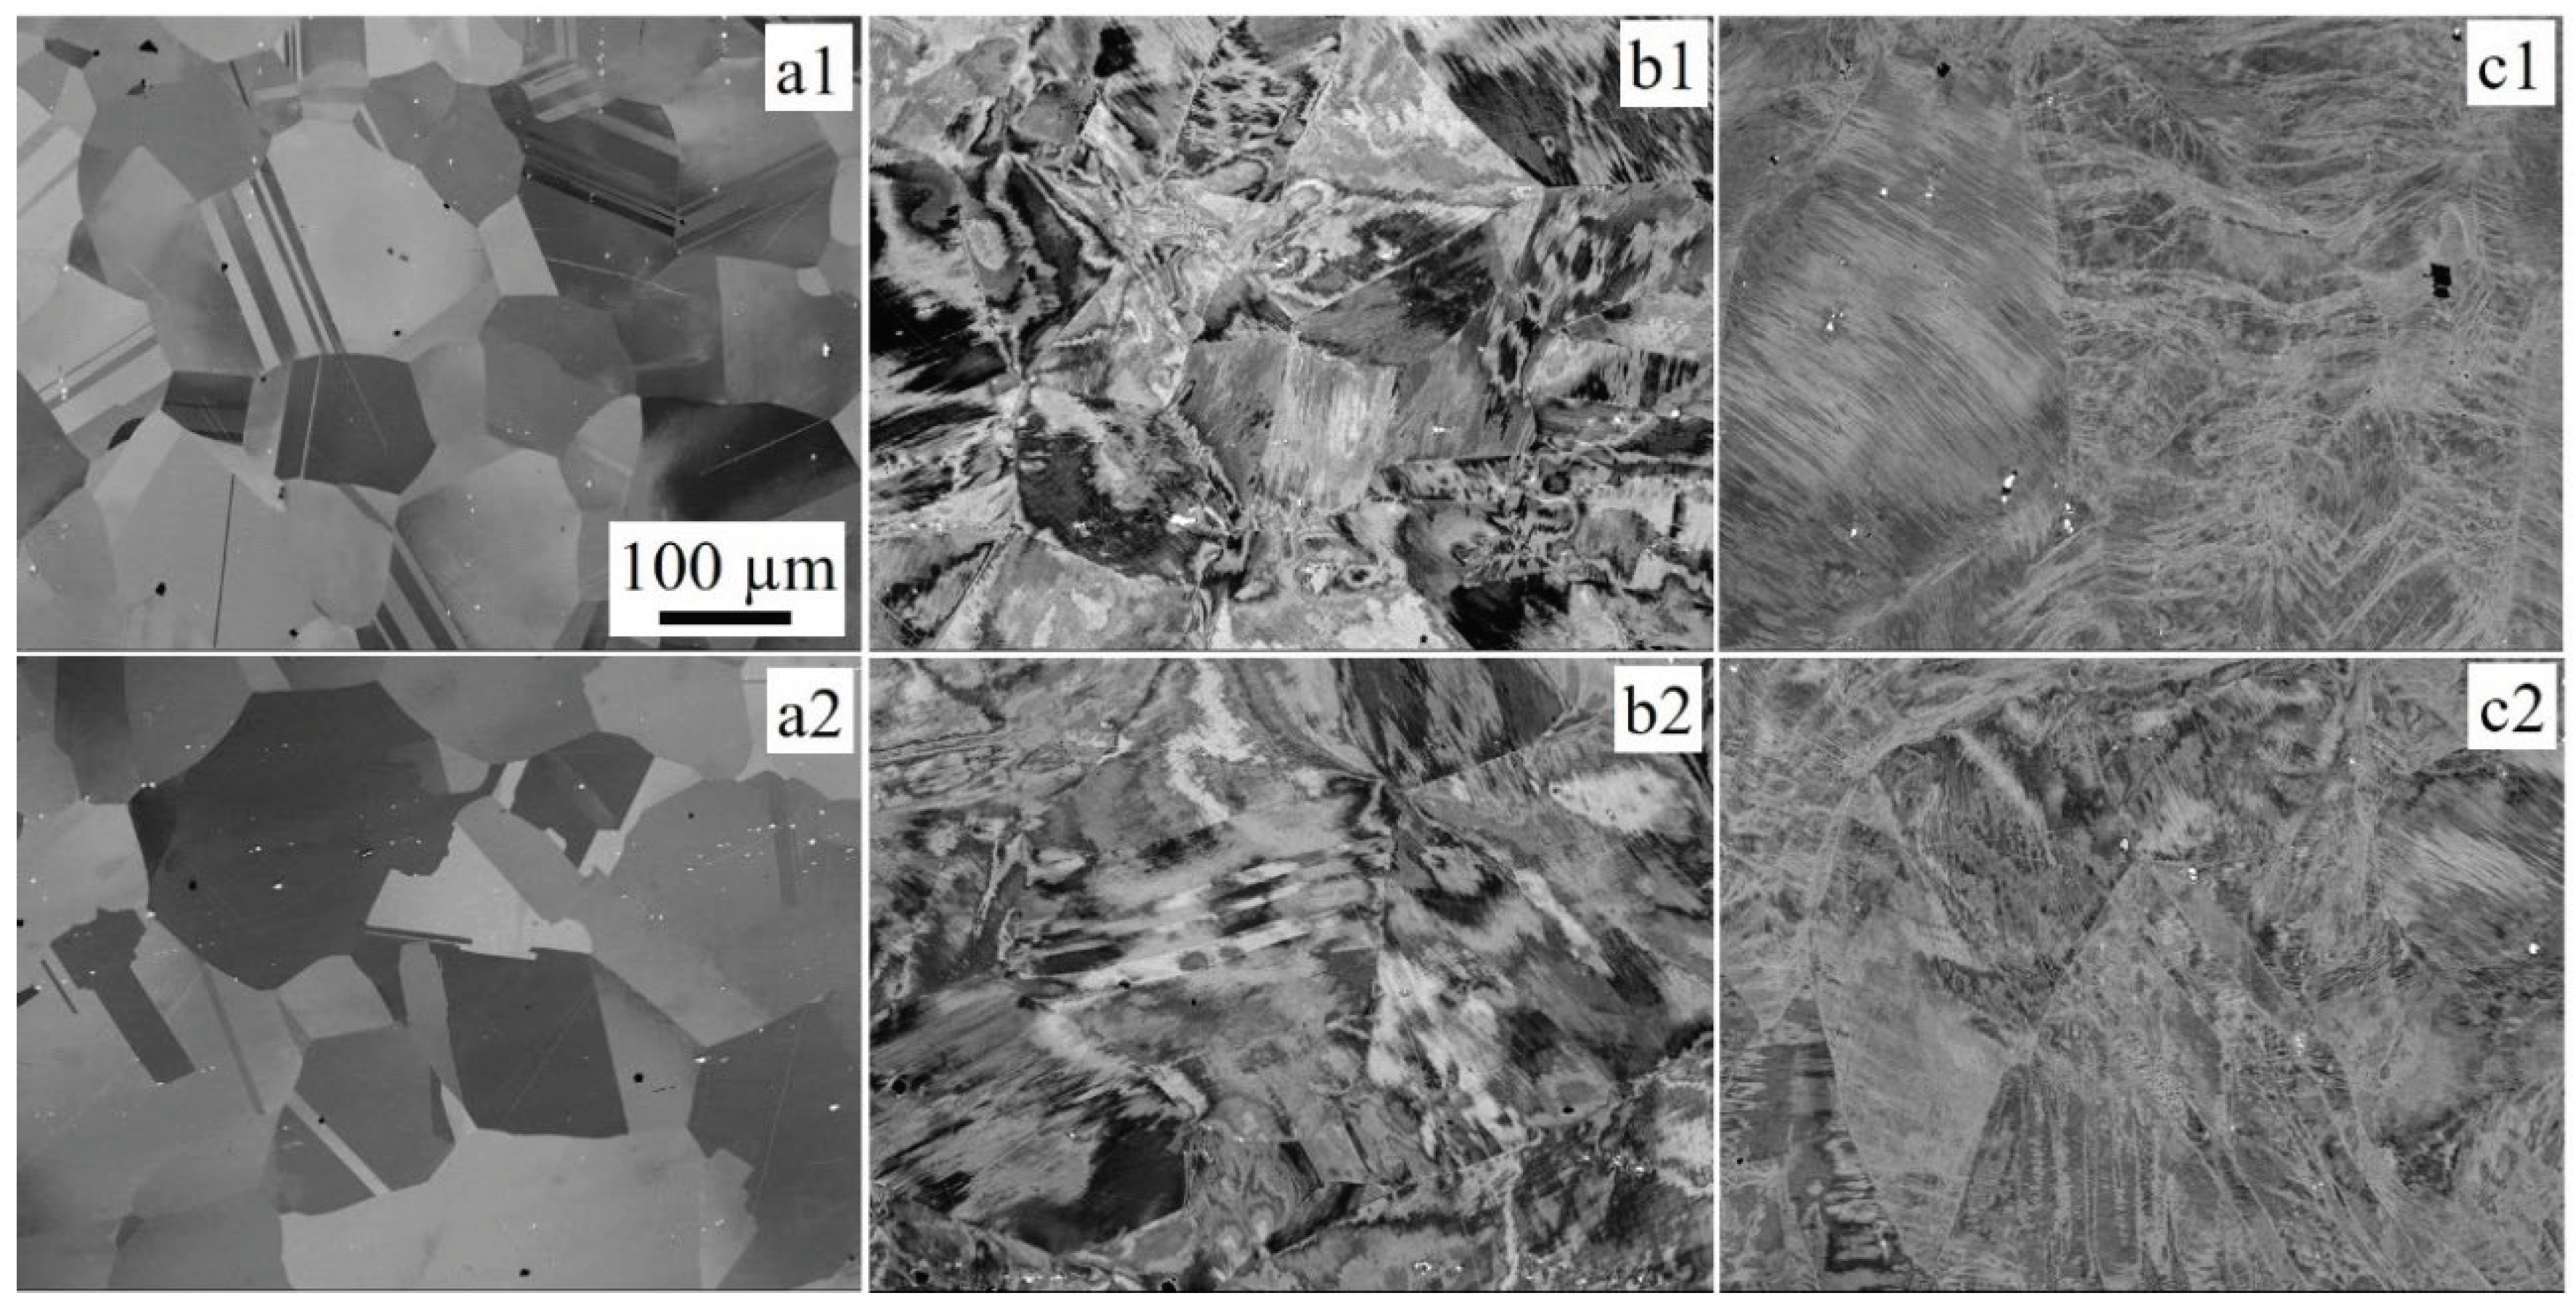
Figure 5.
SEM-backscattered images. Undeformed (a1) before aging (D0), (a2) after aging (D0A), 20% deformed (b1) before aging (D20) (b2) after aging (D20A), and 50% deformed (c1) before aging (D50), and (c2) after aging (D50A). The images are all recorded at the same magnification (100x) and the scale bar shown in (a1) applies for the rest of the images too.
Figure 6.
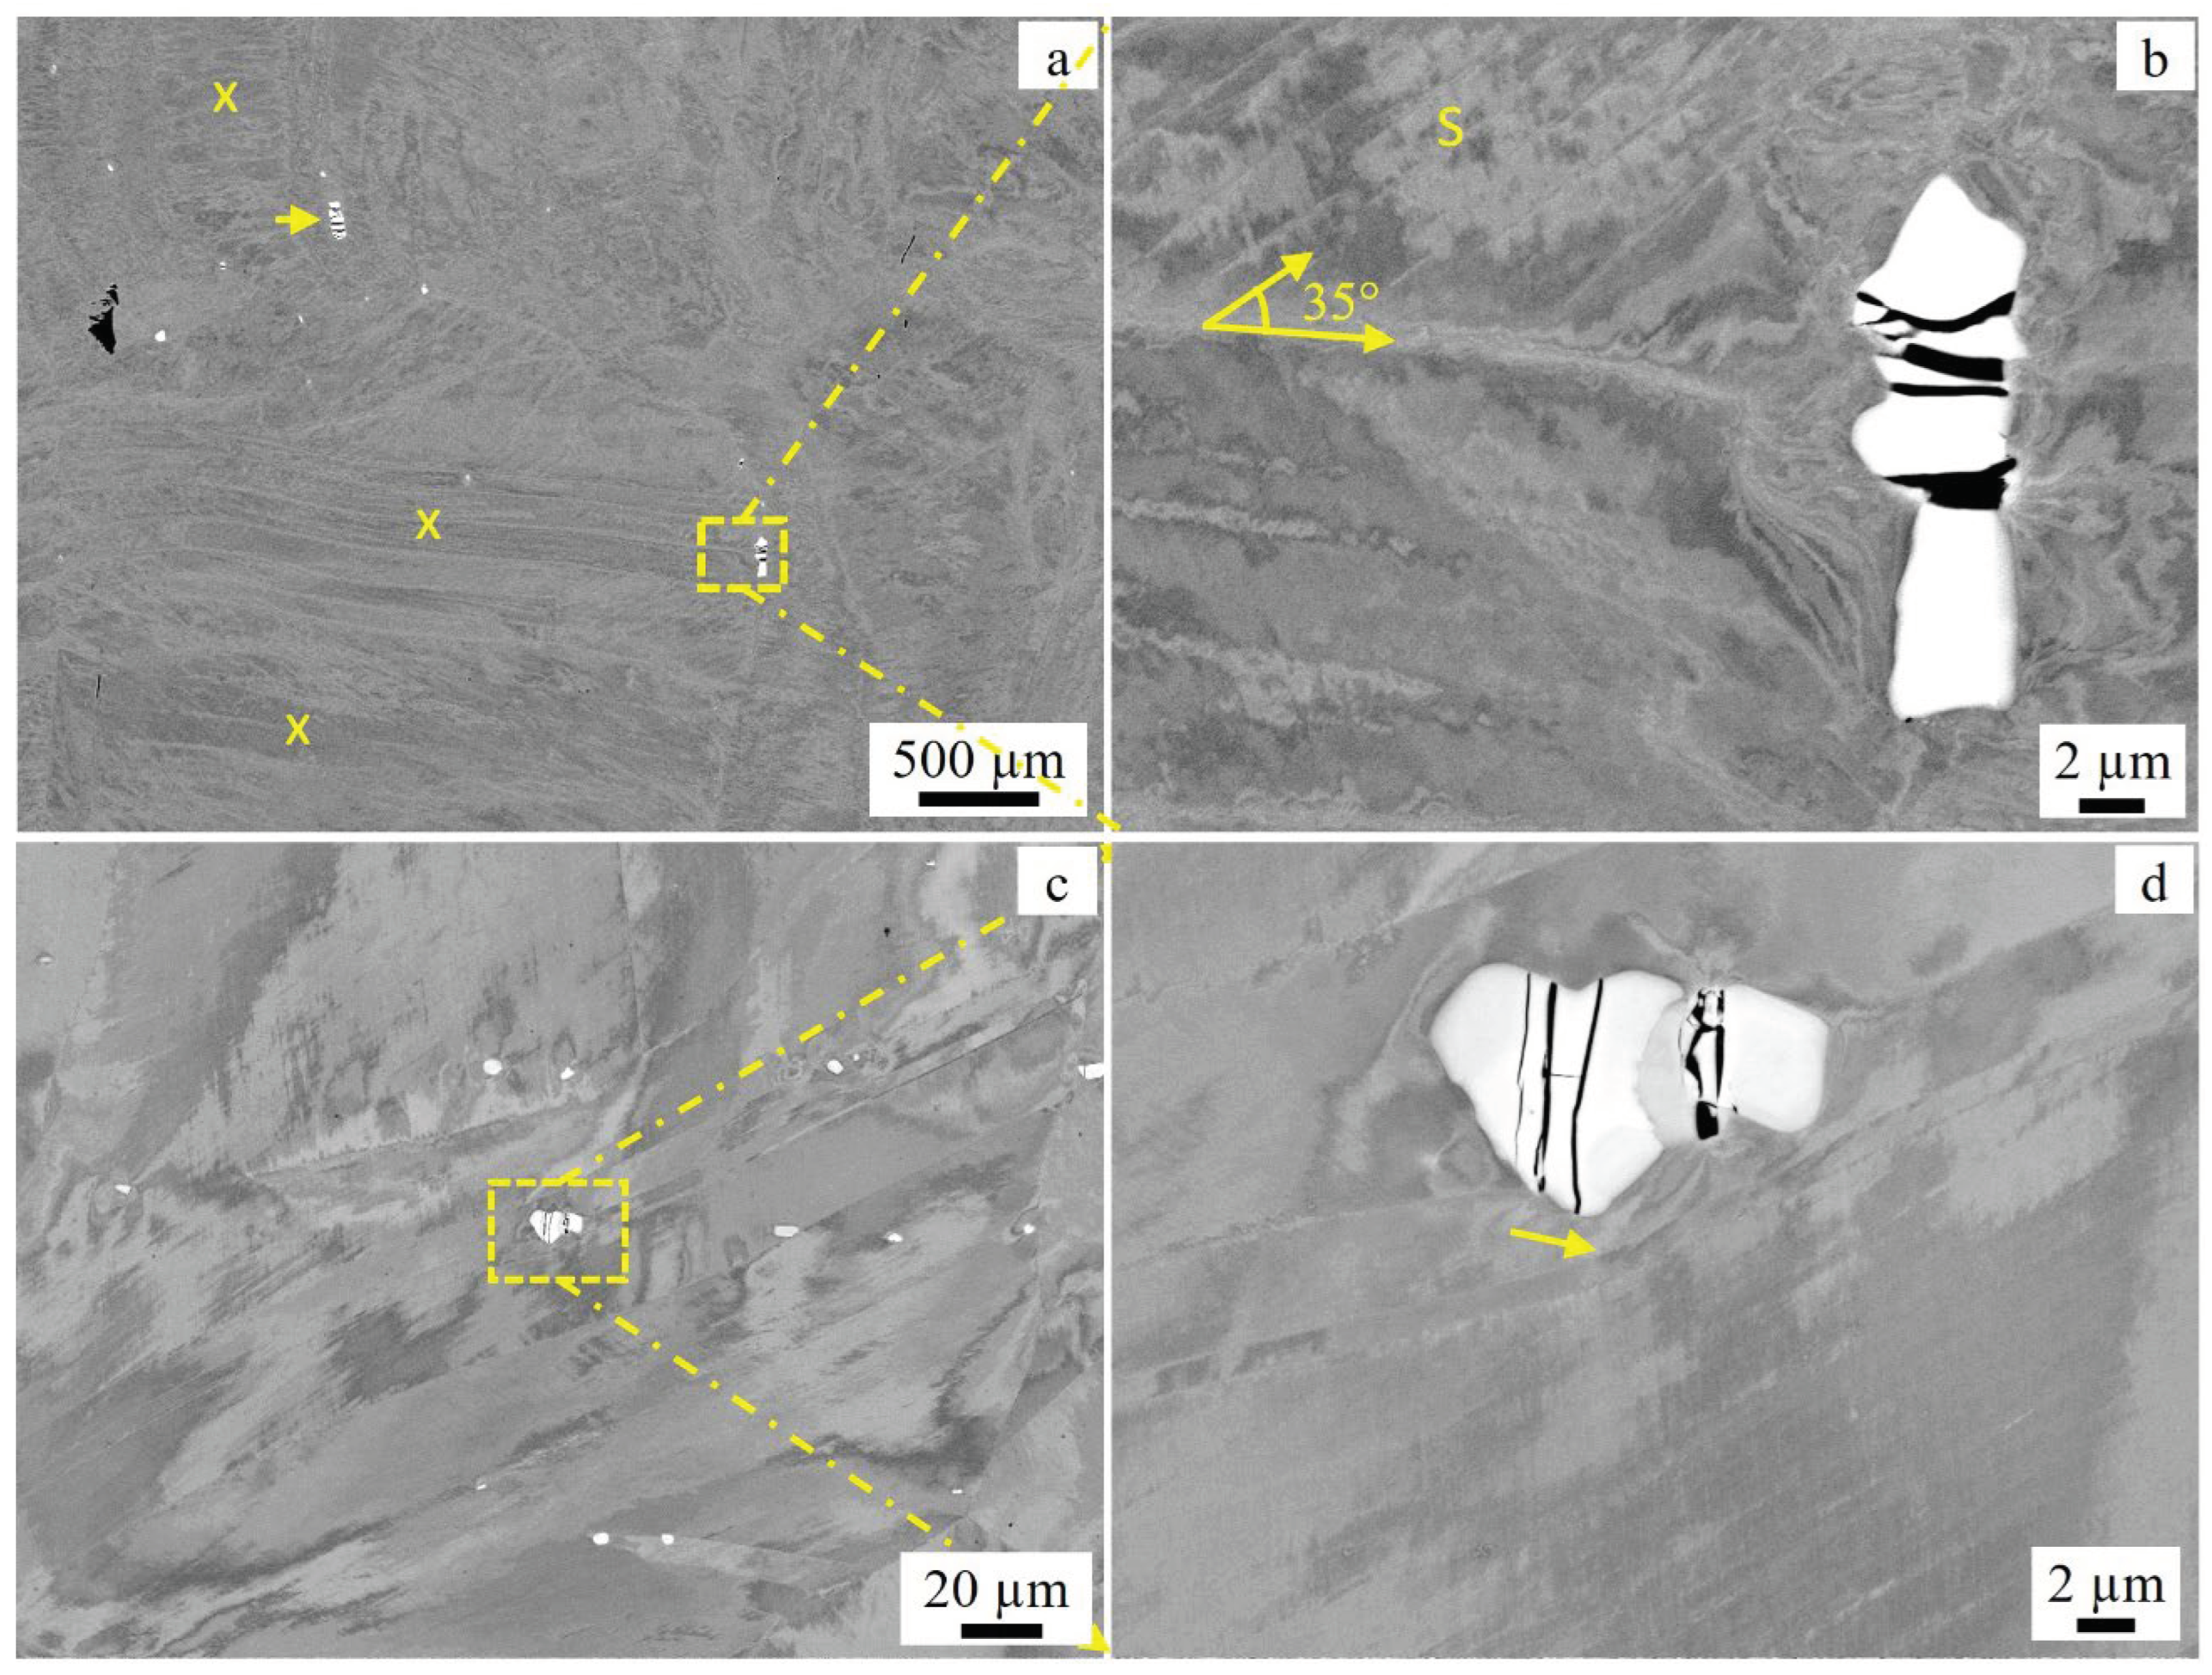
SEM-backscattered images of 50% deformed and aged (D50A) (a) low magnification and (b) high magnification. (c & d) are similar images of D20A. The ‘X’ marks in (a) indicate regions with elongated stripes appearing parallel to the direction of rolling while ‘S’ show some of the shear bands that are oriented by about 35° relative to the rolling direction. The approximate location of the image in (b) and (d) are shown by dashed boxes in (a) and (c).
Figure 7.
TEM image of γ″ recorded with the matrix oriented in [100] zone axis of D0A (a) BF, (b) DF; D20A (c) BF, (d) DF and D50A (e, f) BF. The ‘X’ marks in the magnified image of (f) show local strain-free areas. An example of a precipitate is shown by an arrow in (f).
Figure 7.
TEM image of γ″ recorded with the matrix oriented in [100] zone axis of D0A (a) BF, (b) DF; D20A (c) BF, (d) DF and D50A (e, f) BF. The ‘X’ marks in the magnified image of (f) show local strain-free areas. An example of a precipitate is shown by an arrow in (f).
Figure 8.
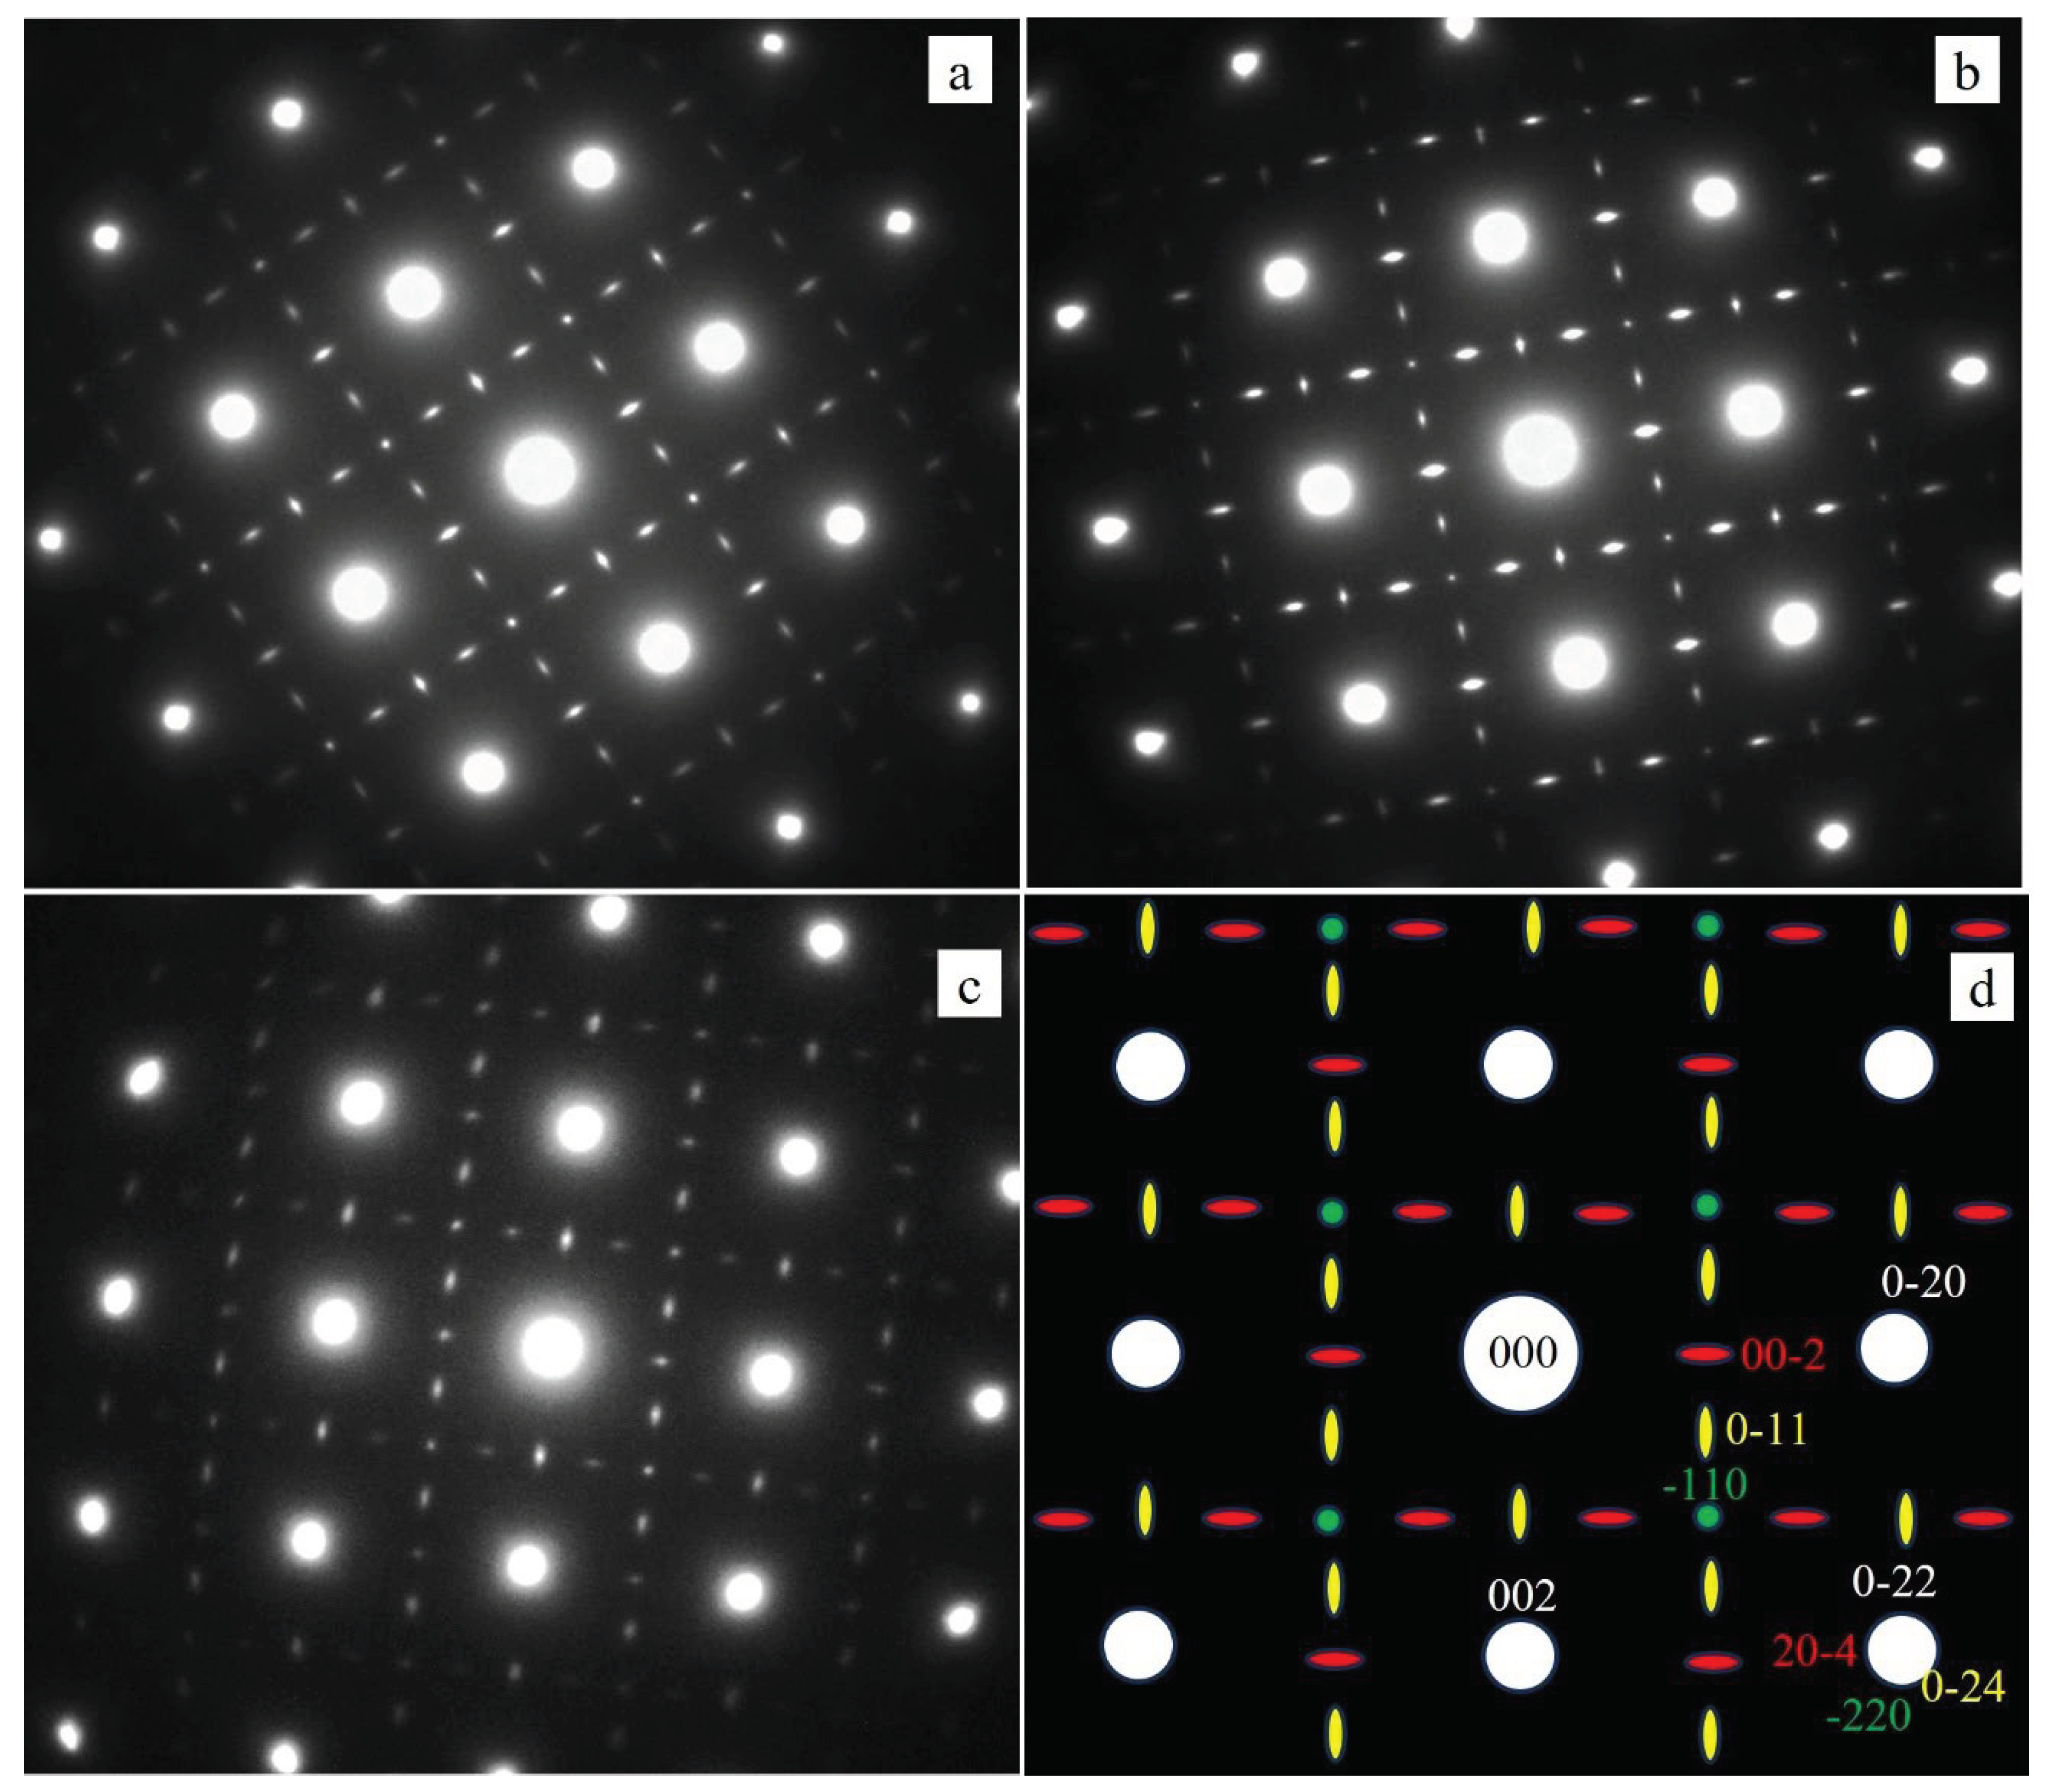
SADP of matrix in [100] for D0A (
a), D20A (
b) and D50A (
c) corresponding to the images shown in
Figure 7 (
a,
b), (
c,
d) and (
e,
f), respectively. (
d) is the simulated SADP for the matrix [100] showing the three variants of γ″ phase in [001] (green), [010] (yellow) and [100] (green). The white spots are reflections from the matrix.
Figure 9.
Hardness measurement – D0 is a 0% deformed, D20 and D50 are specimens deformed by cold rolling 20% and 50%, respectively. Red bars are before aging, whereas green bars are presenting hardness values after aging. PH stands for precipitation hardening.
Figure 9.
Hardness measurement – D0 is a 0% deformed, D20 and D50 are specimens deformed by cold rolling 20% and 50%, respectively. Red bars are before aging, whereas green bars are presenting hardness values after aging. PH stands for precipitation hardening.
Figure 10.
Tensile properties of the aged specimens are shown in line and bar charts. The labels at the top of the patterned bars and solid bars are the average values of yield strength and UTS, respectively.
Figure 10.
Tensile properties of the aged specimens are shown in line and bar charts. The labels at the top of the patterned bars and solid bars are the average values of yield strength and UTS, respectively.
Figure 11.
(a, d) RD-TD IPFs, (b, e)111 pole figures, and (c, f) ND-RD IPFs, corresponding to D0 and D0A, respectively.
Figure 11.
(a, d) RD-TD IPFs, (b, e)111 pole figures, and (c, f) ND-RD IPFs, corresponding to D0 and D0A, respectively.
Figure 12.
(a, d) RD-TD IPFs, (b, e)111 pole figures, and (c, f) ND-RD IPFs, corresponding to the specimens D20 and D20A, respectively.
Figure 12.
(a, d) RD-TD IPFs, (b, e)111 pole figures, and (c, f) ND-RD IPFs, corresponding to the specimens D20 and D20A, respectively.
Figure 13.
(a, d) RD-TD IPFs, (b, e) 111 pole figures, and (c, f) ND-RD IPFs, corresponding to the specimens D50 and D50A, respectively.
Figure 13.
(a, d) RD-TD IPFs, (b, e) 111 pole figures, and (c, f) ND-RD IPFs, corresponding to the specimens D50 and D50A, respectively.
Figure 14.
Schematic display of the typical texture components in rolled fcc materials.
Figure 14.
Schematic display of the typical texture components in rolled fcc materials.
Figure 15.
ODF sections of ϕ2 =0°, 45°, and 63° calculated for; (a)D20, (b)D20A, (c)D50, and (d)D50A.
Figure 15.
ODF sections of ϕ2 =0°, 45°, and 63° calculated for; (a)D20, (b)D20A, (c)D50, and (d)D50A.
Figure 16.
Tensile fracture morphology (a-d) D0A, (e-h) D20A, and (i-l) D50A. The white arrows in (c) are pointing to microcracks near the edge; the black arrows (i, j) are pointing to some of the transgranular cracks in D50A; in (h) are indicating to some of the micropores. Shallow dimples are seen in certain locations of D50 (l). The black arrows are pointing to microcracks, yellow to microvoids, white to an itergranular and green to shear type cracks.
Figure 17.
TEM images of cold rolled and aged by 50% (D250A) on the RD-TD surface. (a) Bright field (BF) image, (b) SADP in <110> zone axis (c) dark field (DF) image of the first set of twins (00-2), and (d) DF image of second set of twins using (-11-1) reflection.
Figure 17.
TEM images of cold rolled and aged by 50% (D250A) on the RD-TD surface. (a) Bright field (BF) image, (b) SADP in <110> zone axis (c) dark field (DF) image of the first set of twins (00-2), and (d) DF image of second set of twins using (-11-1) reflection.
Table 1.
Descriptions of specimens.
Table 1.
Descriptions of specimens.
Sample
ID |
ST |
Def.
(%) |
PH |
| |
1100°C
/1h |
|
720°C
/8h |
650°C
/8h |
| D0 |
Yes |
0 |
no |
no |
| D0A |
Yes |
0 |
Yes |
Yes |
| D20 |
Yes |
20 |
no |
no |
| D20A |
Yes |
20 |
Yes |
Yes |
| D50 |
Yes |
50 |
no |
no |
| D50A |
Yes |
50 |
Yes |
Yes |
| OC |
|
|
|
|
Table 2.
Type and crystallography details of the characterized texture components.
Table 2.
Type and crystallography details of the characterized texture components.
| Type |
Miller indices |
Euler angles |
Fibre |
| ϕ1 φ ϕ2
|
|---|
| Brass (B) |
{110}<112> |
55 90 45 |
α/β |
| Copper (Cu) |
{112}<111> |
90 35 45 |
β |
| S |
{123}<634> |
59 37 63 |
β |
| Goss |
{110}<001> |
90 90 45 |
α |
| A |
{110}<111> |
35 90 45 |
α |
| G/B |
{110}<114> |
20 45 0 |
α |
