Submitted:
06 March 2024
Posted:
07 March 2024
You are already at the latest version
Abstract
Keywords:
1. Introduction
2. Materials and Methods
2.1. Study Area
2.2. Data Sources
2.3. Methods
2.3.1. CASA Model
2.3.2. Theil–Sen Median Trend Analysis
2.3.3. Scenario Analysis
3. Results
3.1. Validation of the CASA Model
3.2. Changes of NPP
3.2.1. Spatial Distribution of NPP
3.2.2. Evolution Trends of NPP
3.3. LUCC and Scenario Analysis
3.3.1. LUCC in the YRD Region
3.3.2. Scenario Analysis: LUCC Only
3.4. Climate Change and Scenario Analysis
3.4.1. Climate Change in the YRD Region
3.4.2. Scenario Analysis: Climate Change Only
4. Discussion
4.1. Spatiotemporal Evolution of NPP
4.2. Impact of LUCC on NPP
4.3. Impact of Climate Change on NPP
4.4. Policy Implications
5. Conclusions
Supplementary Materials
Author Contributions
Funding
Data Availability Statement
Acknowledgments
Conflicts of Interest
References
- IPCC Working Group I. Climate Change 2013: The Physical Science Basis. Contribution of Working Group I to the Fifth Assessment Report of the Intergovernmental Panel on Climate Change; Cambridge University Press: Cambridge, UK, 2013; Volume AR5. [Google Scholar]
- Pan, Y.; Birdsey, R.A.; Fang, J.; Houghton, R.; Kauppi, P.E.; Kurz, W.A.; Phillips, O.L.; Shvidenko, A.; Lewis, S.L.; Canadell, J.G.; et al. A Large and Persistent Carbon Sink in the World’s Forests. Science 2011, 333, 988–993. [Google Scholar] [CrossRef] [PubMed]
- Ni, J. Carbon Storage in Terrestrial Ecosystems of China: Estimates at Different Spatial Resolutions and Their Responses to Climate Change. Clim. Change 2001, 49, 339–358. [Google Scholar] [CrossRef]
- Christopher, B.; Field Michael, J.; Behrenfeld James, T.; Randerson, F.P. Primary Production of the Biosphere: Integrating Terrestrial and Oceanic Components. Science 1998, 281, 237. [Google Scholar]
- Zhao, M.; Running, S.W. Drought-Induced Reduction in Global Terrestrial Net Primary Production from 2000 through 2009. Science 2010, 329, 940–943. [Google Scholar] [CrossRef] [PubMed]
- Chen, Z.; Chen, J.; Xu, G.; Sha, Z.; Yin, J.; Li, Z. Estimation and Climate Impact Analysis of Terrestrial Vegetation Net Primary Productivity in China from 2001 to 2020. Land 2023, 12. [Google Scholar] [CrossRef]
- Potter, C.; Klooster, S.; Myneni, R.; Genovese, V.; Tan, P.N.; Kumar, V. Continental-Scale Comparisons of Terrestrial Carbon Sinks Estimated from Satellite Data and Ecosystem Modeling 1982–1998. Glob. Planet. Change 2003, 39, 201–213. [Google Scholar] [CrossRef]
- Haberl, H.; Erb, K.H.; Krausmann, F.; Gaube, V.; Bondeau, A.; Plutzar, C.; Gingrich, S.; Lucht, W.; Fischer-Kowalski, M. Quantifying and Mapping the Human Appropriation of Net Primary Production in Earth’s Terrestrial Ecosystems. Proc. Natl. Acad. Sci. U.S.A. 2007, 104, 12942–12947. [Google Scholar] [CrossRef]
- Cao, M.; Woodward, F.I. Net Primary and Ecosystem Production and Carbon Stocks of Terrestrial Ecosystems and Their Responses to Climate Change. Glob. Chang. Biol. 1998, 4, 185–198. [Google Scholar] [CrossRef]
- Potter, C.; Klooster, S.; Genovese, V. Net Primary Production of Terrestrial Ecosystems from 2000 to 2009. Clim. Change 2012, 115, 365–378. [Google Scholar] [CrossRef]
- Song, C.; Dannenberg, M.P.; Hwang, T. Optical Remote Sensing of Terrestrial Ecosystem Primary Productivity. Prog. Phys. Geogr. 2013, 37, 834–854. [Google Scholar] [CrossRef]
- Fang, J.; Yu, G.; Liu, L.; Hu, S.; Chapin III, F.S. Climate Change, Human Impacts, and Carbon Sequestration in China. Proc. Natl. Acad. Sci. U.S.A. 2018, 115, 4015–4020. [Google Scholar] [CrossRef] [PubMed]
- Ni, J.; Zhang, X.S.; Scurlock, J.M.O. Synthesis and Analysis of Biomass and Net Primary Productivity in Chinese Forests. Ann. For. Sci. 2001, 58, 351–384. [Google Scholar] [CrossRef]
- Guan, X.; Shen, H.; Gan, W.; Yang, G.; Wang, L.; Li, X.; Zhang, L. A 33-Year NPP Monitoring Study in Southwest China by the Fusion of Multi-Source Remote Sensing and Station Data. Remote Sens. 2017, 9, 1082. [Google Scholar] [CrossRef]
- Goward, S.N. Global Primary Production: A Remote Sensing Approach. J. Biogeogr. 1995, 22, 815–835. [Google Scholar]
- Yuan, W.; Liu, S.; Zhou, G.; Tieszen, L.L.; Baldocchi, D.; Bernhofer, C.; Gholz, H.; Goldstein, A.H.; Goulden, M.L.; et al. Deriving a Light Use Efficiency Model from Eddy Covariance Flux Data for Predicting Daily Gross Primary Production across Biomes. Agric. For. Meteorol. 2007, 143, 189–207. [Google Scholar] [CrossRef]
- Potter, C.S.; Randerson, J.T.; Field, C.B.; Matson, P.A.; Vitousek, P.M.; Mooney, H.A.; Klooster, S.A. Terrestrial Ecosystem Production: A Process Model Based on Global Satellite and Surface Data. Global Biogeochem. Cycles 1993, 7, 811–841. [Google Scholar] [CrossRef]
- Zhang, Y.; Hu, Q.; Zou, F. Spatio-Temporal Changes of Vegetation Net Primary Productivity and Its Driving Factors on the Qinghai-Tibetan Plateau from 2001 to 2017. Remote Sens. 2021, 13, 1566. [Google Scholar] [CrossRef]
- Pei, Y.; Huang, J.; Wang, L.; Chi, H.; Zhao, Y. An Improved Phenology-Based CASA Model for Estimating Net Primary Production of Forest in Central China Based on Landsat Images. Int. J. Remote Sens. 2018, 39, 7664–7692. [Google Scholar] [CrossRef]
- Cai, B.F.; Yu, R. Advance and Evaluation in the Long Time Series Vegetation Trends Research Based on Remote Sensing. Natl. Remote Sens. Bull. 2009, 13, 1170–1186. [Google Scholar] [CrossRef]
- Milich, L.; Weiss, E. GAC NDVI Interannual Coefficient of Variation (CoV) Images: Ground Truth Sampling of the Sahel along North-South Transects. Int. J. Remote Sens. 2000, 21, 235–260. [Google Scholar] [CrossRef]
- Fang, J.Y.; Tang, Y.H.; Son, Y. Why Are East Asian Ecosystems Important for Carbon Cycle Research. Sci. China Life Sci. 2010, 53, 753–756. [Google Scholar] [CrossRef] [PubMed]
- Wang, J.F.; Li, X.H.; Christakos, G.; Liao, Y.L.; Zhang, T.; Gu, X.; Zheng, X.Y. Geographical Detectors-Based Health Risk Assessment and Its Application in the Neural Tube Defects Study of the Heshun Region, China. Int. J. Geogr. Inf. Sci. 2010, 24, 107–127. [Google Scholar] [CrossRef]
- Zhu, W.; Chen, Y.; Xu, D.; Li, J. Advances in Terrestrial Net Primary Productivity (NPP) Estimation Models. Chinese J. Ecol. 2005, 24, 296–300. [Google Scholar]
- Richardson, A.D.; Black, T.A.; Ciais, P.; Delbart, N.; Friedl, M.A.; Gobron, N.; Hollinger, D.Y.; Kutsch, W.L.; Longdoz, B.; Luyssaert, S.; et al. Influence of Spring and Autumn Phenological Transitions on Forest Ecosystem Productivity. Philos. Trans. R. Soc. B Biol. Sci. 2010, 365, 3227–3246. [Google Scholar] [CrossRef] [PubMed]
- Foley, J.A.; DeFries, R.; Asner, G.P.; Barford, C.; Bonan, G.; Carpenter, S.R.; Chapin, F.S.; Coe, M.T.; Daily, G.C.; Gibbs, H.K.; et al. Global Consequences of Land Use. Science 2005, 309, 570–574. [Google Scholar] [CrossRef]
- Imhoff, M.L.; Bounoua, L.; DeFries, R.; Lawrence, W.T.; Stutzer, D.; Tucker, C.J.; Ricketts, T. The Consequences of Urban Land Transformation on Net Primary Productivity in the United States. Remote Sens. Environ. 2004, 89, 434–443. [Google Scholar] [CrossRef]
- Tian, H.; Lu, C.; Chen, G.; Xu, X.; Liu, M.; Ren, W.; Tao, B.; Sun, G.; Pan, S.; Liu, J. Climate and Land Use Controls over Terrestrial Water Use Efficiency in Monsoon Asia. Ecohydrology 2011, 4, 322–340. [Google Scholar] [CrossRef]
- Thompson, J.R.; Foster, D.R.; Scheller, R.; Kittredge, D. The Influence of Land Use and Climate Change on Forest Biomass and Composition in Massachusetts, USA. Ecol. Appl. 2011, 21, 2425–2444. [Google Scholar] [CrossRef]
- Mu, B.; Zhao, X.; Zhao, J.; Liu, N.; Si, L.; Wang, Q.; Sun, N.; Sun, M.; Guo, Y.; Zhao, S. Quantitatively Assessing the Impact of Driving Factors on Vegetation Cover Change in China’s 32 Major Cities. Remote Sens. 2022, 14, 839. [Google Scholar] [CrossRef]
- Zhu, Z.; Myneni, R.B.; Huang, M.; Zeng, Z.; Canadell, J.G.; Ciais, P.; Sitch, S.; Friedlingstein, P.; Arneth, A.; Cao, C.; et al. Greening of the Earth and Its Drivers. Nat. Clim. Chang. 2016, 6, 791–795. [Google Scholar] [CrossRef]
- Zhang, Y.; Song, C.; Zhang, K.; Cheng, X.; Band, L.E.; Zhang, Q. Effects of Land Use/Land Cover and Climate Changes on Terrestrial Net Primary Productivity in the Yangtze River Basin, China, from 2001 to 2010. J. Geophys. Res. Biogeosci. 2014, 119, 1092–1109. [Google Scholar] [CrossRef]
- Fu, Q.; Li, B.; Hou, Y.; Bi, X.; Zhang, X. Effects of Land Use and Climate Change on Ecosystem Services in Central Asia’s Arid Regions: A Case Study in Altay Prefecture, China. Sci. Total Environ. 2017, 607–608, 633–646. [Google Scholar] [CrossRef]
- Yu, G.R.; Zhu, X.J.; Fu, Y.L.; He, H.L.; Wang, Q.F.; Wen, X.F.; Li, X.R.; Zhang, L.M.; Zhang, L.; Su, W.; et al. Spatial Patterns and Climate Drivers of Carbon Fluxes in Terrestrial Ecosystems of China. Glob. Chang. Biol. 2013, 19, 798–810. [Google Scholar] [CrossRef]
- Wu, S.; Zhou, S.; Chen, D.; Wei, Z.; Dai, L.; Li, X. Determining the Contributions of Urbanisation and Climate Change to NPP Variations over the Last Decade in the Yangtze River Delta, China. Sci. Total Environ. 2014, 472, 397–406. [Google Scholar] [CrossRef] [PubMed]
- Zhu, W.Q.; Pan, Y.Z.; Zhang, J.S. Remote Sensing Estimation of Terrestrial Vegetation Net Primary Productivity in China. Acta Phytoecologica Sinica 2007, 31, 413–424, [In Chinese]. [Google Scholar] [CrossRef]
- Zhu, W.; Pan, Y.; He, H.; Yu, D.; Hu, H. Comprehensive Analysis of the Impact of Climatic Changes on Chinese Terrestrial Net Primary Productivity. Chin. Sci. Bull. 2007, 52, 2535–2541. [Google Scholar] [CrossRef]
- Zhu, W.Q.; Pan, Y.Z.; He, H.; Yu, D.Y.; Hu, H.B. Simulation of Maximum Light Use Efficiency for Typical Vegetation in China. Chinese Science Bulletin 2006, 51, 457–463. [Google Scholar] [CrossRef]
- Cao, D.; Yu, F.; Zhu, W.Q.; Xie, G.X.; Song, C.Y. Economic Loss Evaluation of Grassland Ecosystem Destruction under the Support of Remote Sensing Technology. Acta Scientiae Circumstantiae 2011, 31, 1799–1807, [In Chinese]. [Google Scholar] [CrossRef]
- Khan, N.; Shahid, S.; Ismail, T.; Ahmed, K.; Nawaz, N. Trends in Heat Wave Related Indices in Pakistan. Stoch. Environ. Res. Risk Assess. 2019, 33, 287–302. [Google Scholar] [CrossRef]
- Ahmed, K.; Shahid, S.; Nawaz, N. Impacts of Climate Variability and Change on Seasonal Drought Characteristics of Pakistan. Atmos. Res. 2018, 214, 364–374. [Google Scholar] [CrossRef]
- Ali, R.; Kuriqi, A.; Abubaker, S.; Kisi, O. Long-Term Trends and Seasonality Detection of the Observed Flow in Yangtze River Using Mann-Kendall and Sen’s Innovative Trend Method. Water 2019, 11, 1855. [Google Scholar] [CrossRef]
- Mann, H.B. Nonparametric Tests Against Trend. Econometrica 1945, 13, 245–259. [Google Scholar] [CrossRef]
- Kendall, M.G. Rank Correlation Methods; Griffin: London, UK, 1975. [Google Scholar]
- Ba, W.; Qiu, H.; Cao, Y.; Gong, A. Spatiotemporal Characteristics Prediction and Driving Factors Analysis of NPP in Shanxi Province Covering the Period 2001–2020. Sustainability 2023, 15, 12070. [Google Scholar] [CrossRef]
- Hu, J.Q. Urbanization Impact on Vegetation NPP Temporal and Spatial Evolution Characteristics and Its Driving Mechanism in the Core Cities Cluster of the Yangtze River Delta. M.Sc. Thesis, East China Normal University, Shanghai, China, 2019.
- Li, D.; Tian, L.; Li, M.; Li, T.; Ren, F.; Tian, C.; Yang, C. Spatiotemporal Variation of Net Primary Productivity and Its Response to Climate Change and Human Activities in the Yangtze River Delta, China. Appl. Sci. 2022, 12, 10546. [Google Scholar] [CrossRef]
- Yu, J.F. Estimation of Vegetation Net Primary Productivity in Zhejiang Province Based on the CASA Model. M.Sc. Thesis, Zhejiang A&F University, Lin'an, China, 2012; pp. 27–28, [In Chinese]. [Google Scholar]
- Wang, L.; Jing, Y.S.; Li, K. Spatio-Temporal Characteristics of Vegetation NPP and Its Influence by Climatic Factors in Jiangsu Province. Ecology and Environmental Sciences 2010, 19, 2529–2533, [In Chinese]. [Google Scholar] [CrossRef]
- Wang, S.; Wei, G.; Gao, M.; Fan, Y. Investigating the Mechanism of Urbanization on the Net Primary Productivity of Vegetation in the Yangtze River Economic Belt: A Comprehensive Analysis from Global and Local Effects. Front. Ecol. Evol. 2023, 11, 1231487. [Google Scholar] [CrossRef]
- Yan, J.; Li, G.; Qi, G.; Qiao, H.; Nie, Z.; Huang, C.; Kang, Y.; Sun, D.; Zhang, M.; Kang, X.; et al. Landscape Ecological Risk Assessment of Farming-Pastoral Ecotone in China Based on Terrain Gradients. Hum. Ecol. Risk Assess. 2021, 27, 2124–2141. [Google Scholar] [CrossRef]
- Zhang, X.; Ning, J. Patterns, Trends, and Causes of Vegetation Change in the Three Rivers Headwaters Region. Land 2023, 12, 1127. [Google Scholar] [CrossRef]
- Yin, C.; Chen, X.; Luo, M.; Meng, F.; Sa, C.; Bao, S.; Yuan, Z.; Zhang, X.; Bao, Y. Quantifying the Contribution of Driving Factors on Distribution and Change of Net Primary Productivity of Vegetation in the Mongolian Plateau. Remote Sens. 2023, 15, 1986. [Google Scholar] [CrossRef]
- Li, D.; Tian, L.; Li, M.; Li, T.; Ren, F.; Tian, C.; Yang, C. Spatiotemporal Variation of Net Primary Productivity and Its Response to Climate Change and Human Activities in the Yangtze River Delta, China. Appl. Sci. 2022, 12, 10546. [Google Scholar] [CrossRef]
- Yin, L.; Dai, E.; Zheng, D.; Wang, Y.; Ma, L.; Tong, M. What Drives the Vegetation Dynamics in the Hengduan Mountain Region, Southwest China: Climate Change or Human Activity? Ecol. Indic. 2020, 112, 106013. [Google Scholar] [CrossRef]
- Shen, S.; Yue, P.; Fan, C. Quantitative Assessment of Land Use Dynamic Variation Using Remote Sensing Data and Landscape Pattern in the Yangtze River Delta, China. Sustain. Comput. Informatics Syst. 2019, 23, 111–119. [Google Scholar] [CrossRef]
- Li, Z.; Luan, W.; Zhang, Z.; Su, M. Relationship between Urban Construction Land Expansion and Population/Economic Growth in Liaoning Province, China. Land Use Policy 2020, 99, 105022. [Google Scholar] [CrossRef]
- Hu, J.; Shao, C.; Zhang, Z. The Impact of Sustainable Regional Development Policy on Carbon Emissions: Evidence from Yangtze River Delta of China. Energies 2022, 15, 49492. [Google Scholar] [CrossRef]
- Yang, H.; Zhong, X.; Deng, S.; Xu, H. Assessment of the Impact of LUCC on NPP and Its Influencing Factors in the Yangtze River Basin, China. Catena 2021, 206, 105542. [Google Scholar] [CrossRef]
- Yang, H.; Hu, D.; Xu, H.; Zhong, X. Assessing the Spatiotemporal Variation of NPP and Its Response to Driving Factors in Anhui Province, China. Environ. Sci. Pollut. Res. 2020, 27, 14915–14932. [Google Scholar] [CrossRef] [PubMed]
- Zhang, Y.; Song, C.; Zhang, K.; Cheng, X.; Zhang, Q. Spatial-Temporal Variability of Terrestrial Vegetation Productivity in the Yangtze River Basin during 2000-2009. J. Plant Ecol. 2014, 7, 10–23. [Google Scholar] [CrossRef]
- Hao, X.; Wang, X.; Ma, J.; Chen, Y.; Luo, S. Spatiotemporal Characteristic Prediction and Driving Factor Analysis of Vegetation Net Primary Productivity in Central China Covering the Period of 2001–2019. Land 2023, 12, 2121. [Google Scholar] [CrossRef]
- Yu, C.; Liu, D. Response in Productivity of Natural Vegetation to Drought in Northeast China Based on MODIS. Acta Ecologica Sinica 2019, 39, 3978–3990, [In Chinese]. [Google Scholar] [CrossRef]
- Yang, K.; Liu, H.; Ning, J.; Zhen, Q.; Zheng, J. Rainwater Infiltration and Nutrient Recharge System Significantly Enhance the Growth of Degraded Artificial Forest in Semi-Arid Areas with Shallowly Buried Soft Bedrock. For. Ecol. Manag. 2023, 539, 121016. [Google Scholar] [CrossRef]
- Dong, G.; Zhao, F.; Chen, J.; Zhang, Y.; Qu, L.; Jiang, S.; Ochirbat, B.; Chen, J.; Xin, X.; Shao, C. Non-Climatic Component Provoked Substantial Spatiotemporal Changes of Carbon and Water Use Efficiency on the Mongolian Plateau. Environ. Res. Lett. 2020, 15, 096012. [Google Scholar] [CrossRef]
- Ma, S.; Wang, L.J.; Jiang, J.; Chu, L.; Zhang, J.C. Threshold Effect of Ecosystem Services in Response to Climate Change and Vegetation Coverage Change in the Qinghai-Tibet Plateau Ecological Shelter. J. Clean. Prod. 2021, 318, 128592. [Google Scholar] [CrossRef]
- Das, R.; Chaturvedi, R.K.; Roy, A.; Karmakar, S.; Ghosh, S. Warming Inhibits Increases in Vegetation Net Primary Productivity despite Greening in India. Sci. Rep. 2023, 13, 48614. [Google Scholar] [CrossRef] [PubMed]
- Wu, X.; Guo, W.; Liu, H.; Li, X.; Peng, C.; Allen, C.D.; Zhang, C.; Wang, P.; Pei, T.; Ma, Y.; et al. Exposures to Temperature beyond Threshold Disproportionately Reduce Vegetation Growth in the Northern Hemisphere. Natl. Sci. Rev. 2019, 6, 786–795. [Google Scholar] [CrossRef]
- Chu, H.; Venevsky, S.; Wu, C.; Wang, M. NDVI-Based Vegetation Dynamics and Its Response to Climate Changes at Amur-Heilongjiang River Basin from 1982 to 2015. Sci. Total Environ. 2019, 650, 2051–2062. [Google Scholar] [CrossRef]
- Ge, W.; Deng, L.; Wang, F.; Han, J. Quantifying the Contributions of Human Activities and Climate Change to Vegetation Net Primary Productivity Dynamics in China from 2001 to 2016. Sci. Total Environ. 2021, 773, 145648. [Google Scholar] [CrossRef]


| Data name | Data type | Data source |
|---|---|---|
| NDVI | 1km×1km raster data | Resource and Environment Science and Data Center (http://www.resdc.cn/Default.aspx) |
| LUCC | 30m×30m raster data | Resource and Environment Science and Data Center(http://www.resdc.cn/Default.aspx) |
| Total monthly precipitation | Site data | China Meteorological Data Network(http://data.cma.cn/) |
| Average monthly temperature | Site data | China Meteorological Data Network(http://data.cma.cn/) |
| Total monthly sunshine hours |
Site data | China Meteorological Data Network(http://data.cma.cn/) |
| Code | Land type | |
|---|---|---|
| 1 | Cultivated land | 0.95 |
| 2 | Forest | 1.105 |
| 3 | Grassland | 0.788 |
| 4 | Water area | 0 |
| 5 | Built-up area | 0 |
| 6 | Unused land | 0 |
| Group | Scenario | LUCC | NDVI | Precipitation | Temperature | Solar radiation |
|---|---|---|---|---|---|---|
| LUCC | L1 | ▲ | △ | △ | △ | △ |
| Climate change | L2 | △ | △ | ▲ | △ | △ |
| L3 | △ | △ | △ | ▲ | △ | |
| L4 | △ | △ | △ | △ | ▲ |
| Validation reference | Measured area | Time (year) |
NPP (gC/(m2·a)) | NPP of this study (gC/(m2·a)) |
|---|---|---|---|---|
| CASA model [46] | Core city clusters in the YRD | 2000-2016 | 419.33 | 510.10 |
| Based on MOD17A3 [47] | YRD | 2000-2019 | 550.17 | 538.69 |
| CASA model [48] | Zhejiang Province | 2006 | 625.68 | 583.69 |
| Based on MOD17A3 [49] | Jiangsu Province | 2000-2006 | 506.6 | 525.58 |
| Time (year) | 2000 | 2005 | 2010 | 2015 | 2018 |
|---|---|---|---|---|---|
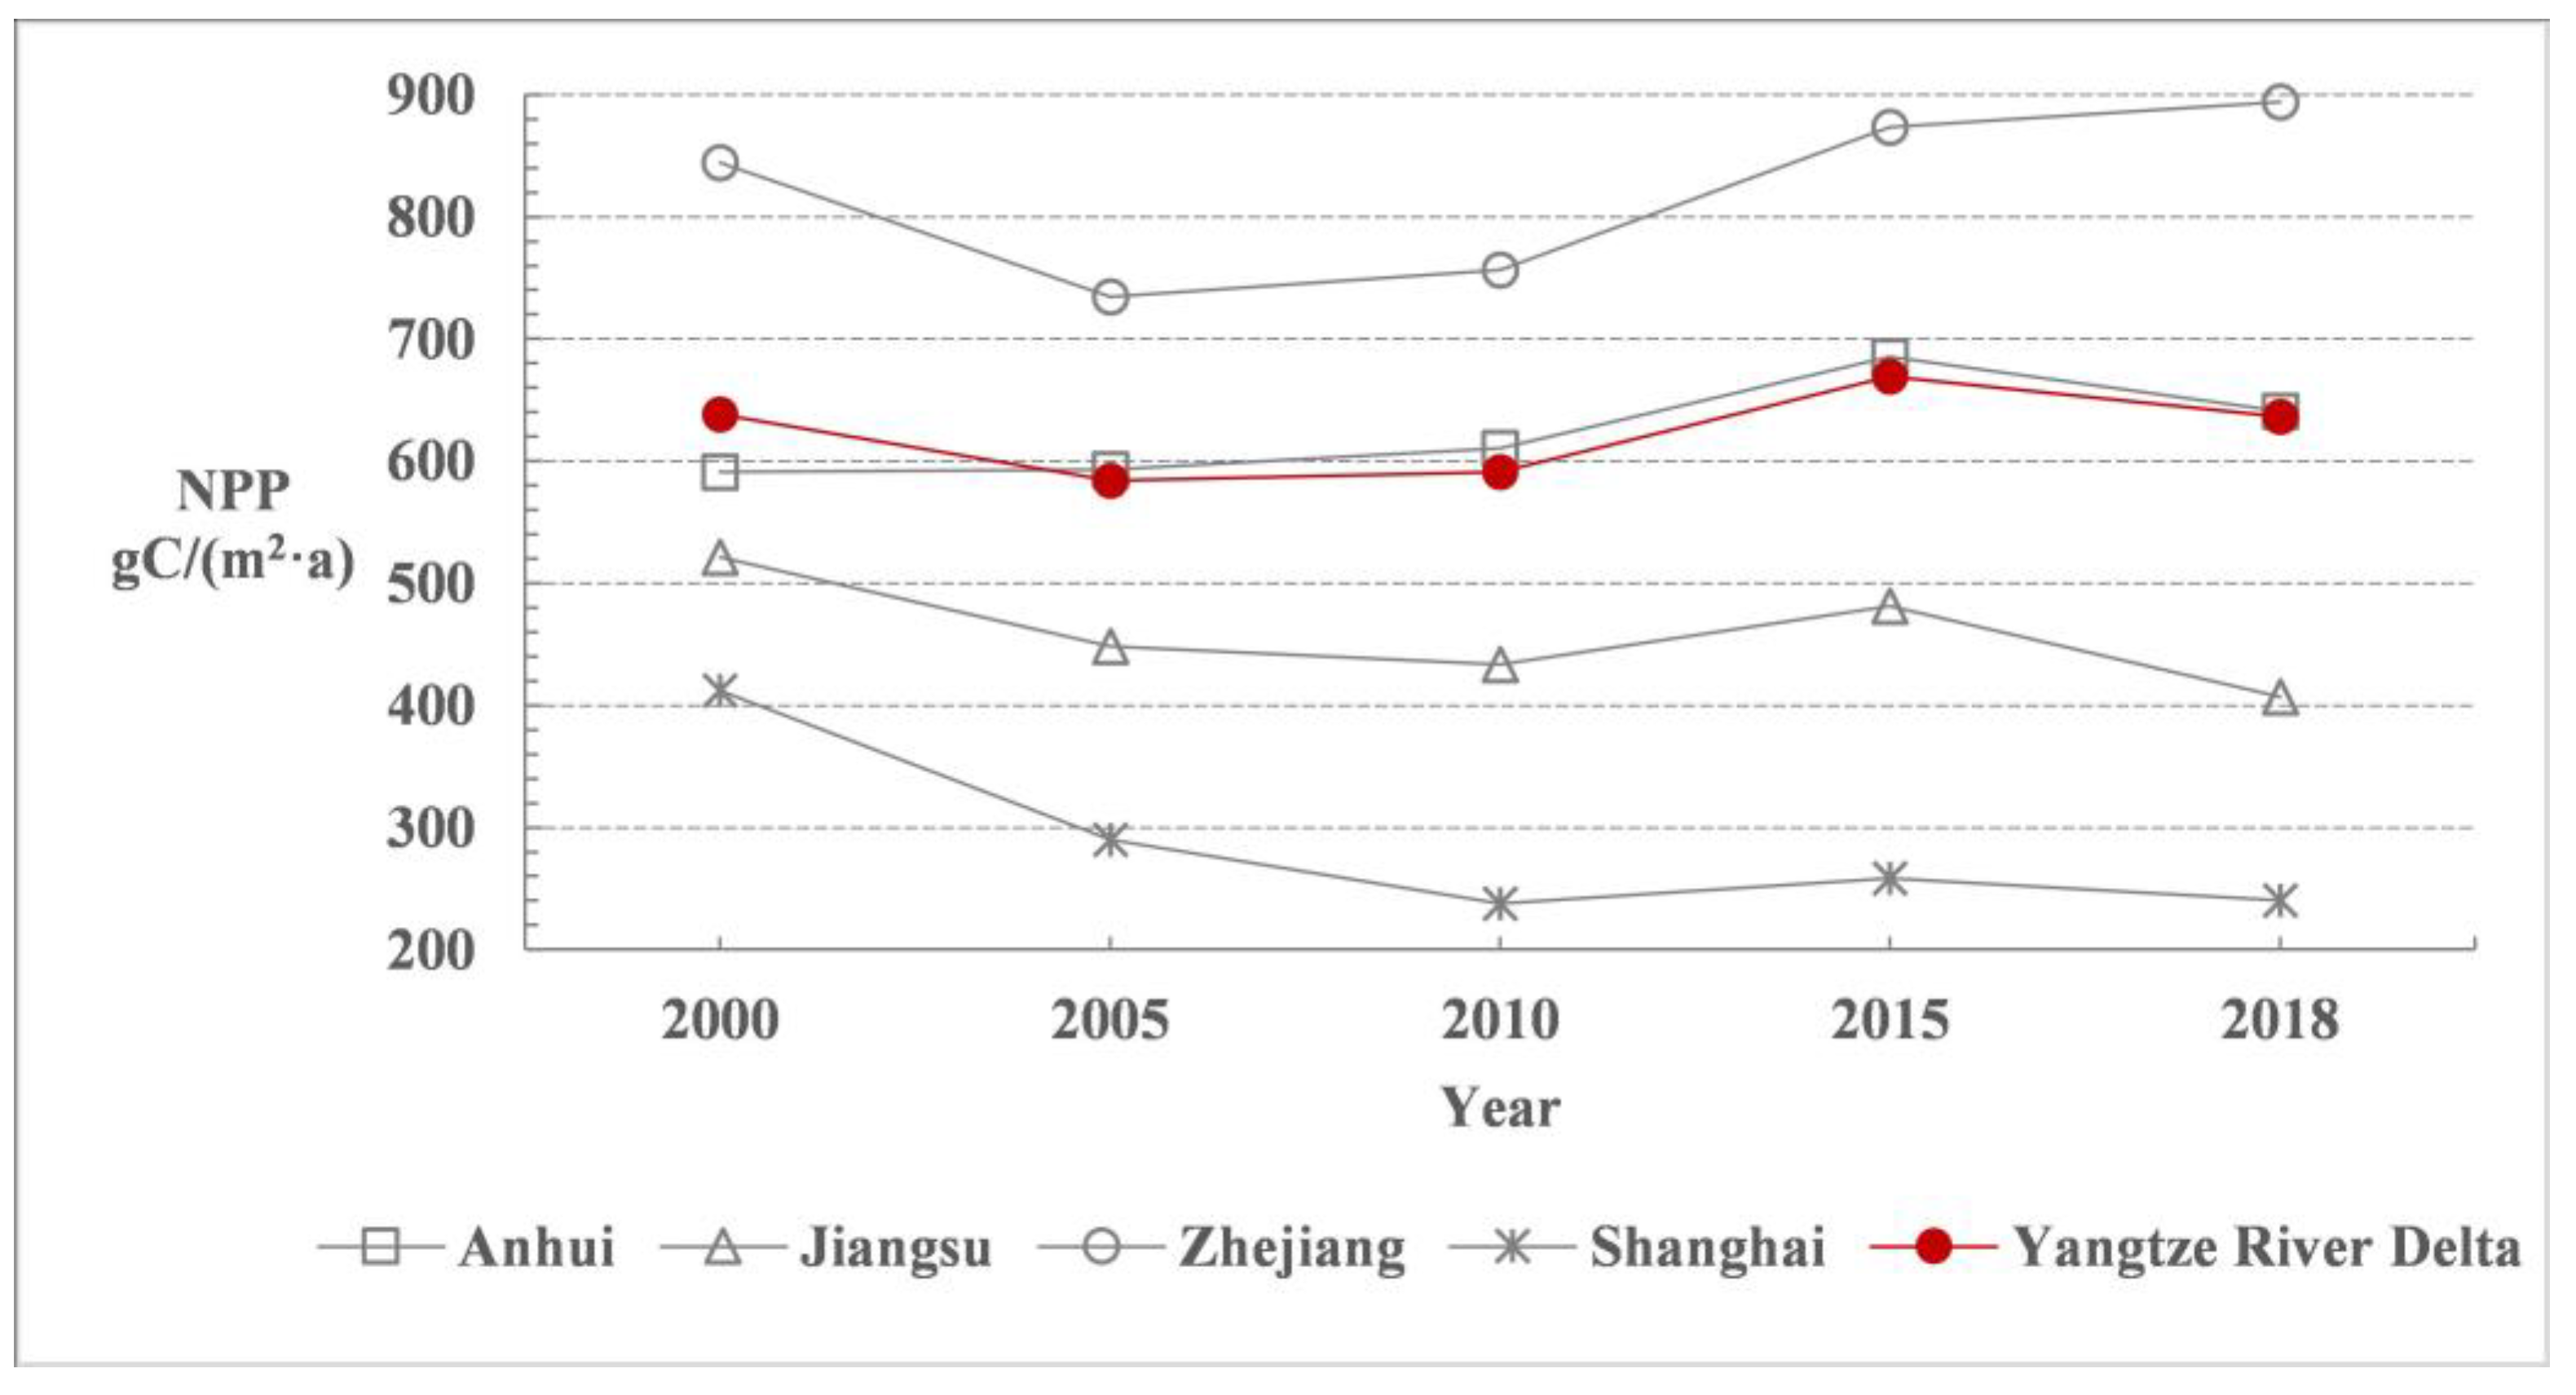
| NPP of MOD17A3 | 533.24 | 510.37 | 532.24 | 582.39 | 587.51 |
| NPP of this study | 638.54 | 583.69 | 591.29 | 669.18 | 636.39 |
| 2000-2018 | Cultivated land | Forest | Grassland | Water area | Built-up area | Unused land | Original area |
|---|---|---|---|---|---|---|---|
| Cultivated land | 129535 | 13622 | 1860 | 6312 | 31307 | 75 | 182711 |
| Forest | 13544 | 79769 | 3895 | 1124 | 2369 | 56 | 100757 |
| Grassland | 1894 | 4001 | 4911 | 703 | 389 | 8 | 11906 |
| Water area | 5209 | 931 | 565 | 16233 | 1852 | 188 | 24978 |
| Built-up area | 16928 | 861 | 185 | 1697 | 11718 | 7 | 31396 |
| Unused land | 14 | 39 | 1 | 3 | 6 | 5 | 68 |
| Area after transformation | 167124 | 99223 | 11417 | 26072 | 47641 | 339 | - |
Disclaimer/Publisher’s Note: The statements, opinions and data contained in all publications are solely those of the individual author(s) and contributor(s) and not of MDPI and/or the editor(s). MDPI and/or the editor(s) disclaim responsibility for any injury to people or property resulting from any ideas, methods, instructions or products referred to in the content. |
© 2024 by the authors. Licensee MDPI, Basel, Switzerland. This article is an open access article distributed under the terms and conditions of the Creative Commons Attribution (CC BY) license (http://creativecommons.org/licenses/by/4.0/).


